Article

Optimization of Friction Stir Processing Parameters of Recycled AA 6063 for Enhanced Surface Microhardness and Tribological Properties

SIG: Machine Design and Tribology, Centre for Advanced Mechanical and Green Technology, Faculty of Engineering and Technology, Multimedia University, Jalan Ayer Keroh Lama, Melaka 75450, Malaysia
*
Author to whom correspondence should be addressed.
Submission received: 27 December 2021 / Revised: 3 February 2022 / Accepted: 4 February 2022 / Published: 10 February 2022
(This article belongs to the Special Issue Surface Modification of Metallic Materials for Wear and Fatigue)

Abstract

:
This work aims to optimize the friction stir processing parameters of recycled aluminum alloy 6063 for enhanced mechanical and tribological properties. The selected friction stir processing parameters that were used to produce friction stir processed recycled aluminum alloy 6063 are tool rotational speeds and feed rates ranging from 1200 rpm to 2000 rpm and 25 mm/min to 45 mm/min, respectively. The surface microhardness of the friction stir processed samples were measured and the friction and wear tests were conducted using a pin-on-disc tribo-tester under starved lubrication conditions. The results show that the optimum friction stir process parameters for recycled aluminum alloy 6063 are 1200 rpm and 30 mm/min. Friction stir processed recycled aluminum alloy 6063 produced by these parameters led to enhancement of microhardness and the wear resistance by 25% and 37%, and reduction of friction coefficient and grain size by about 33% and 96%, respectively.

1. Introduction

Aluminum alloy is an important engineering material due to its good mechanical properties and recyclability [1]. It has been recycled since it was first commercially produced and its quality is not impaired after recycling [2]. The 6XXX aluminum alloy (an aluminum alloy with major alloying of magnesium and silicon) is heat treatable, has good corrosion resistance, good extrudability and hence, it has been widely used in furniture, automotive, structural components, and many more [3,4,5,6]. In some applications, material property enhancement is required and this can be done by refining the grain size of the material [7]. In recent times, there is an energy-efficient and environmentally-friendly technique that can enhance the material properties by refining the grain size of the material, and this method is known as friction stir processing (FSP) [8,9,10]. FSP is a surface engineering technique that was developed from friction stir welding (FSW) and invented by The Welding Institute (TWI) in the year 1991 [11,12]. FSP modifies material properties by using a special-designed friction stir tool to generate friction heat under optimum processing parameters [13,14]. An aluminum alloy that is processed by FSP can be used for ship cradle and journal bearing. FSP parameters are very important as they may affect the outcomes of this process. According to previous studies, the most significant parameters that had been studied are the rotational speed and the feed rate as they control the heat generation that results in plasticized and material flow during the process [11].
Aluminum alloy 6063 (AA 6063) is good in weldability and has been widely used in both FSW and FSP. It was noted that producing FSPed materials with the desired performance requires suitable processing parameters for sufficient heat generation. With regard to FSPed AA 6063, the processing parameters such as rotational speed and feed rate have been emphasized in previous FSP works. The rotational speed that was used for FSPed AA 6063 varied among others and it ranges from 315 rpm to 3500 rpm while the feed rate ranges from 40 mm/min to 1000 mm/min [6,7,15,16,17,18]. Karthikeyan L. et al. [6] used regression analysis to predict the FSP results and the predicted results showed a good correlation with the experimental results that a rotational speed of 1200 rpm to 1400 rpm with a feed rate of 40.2 mm/min produced FSPed samples with enhancement. Excessive heat input caused by higher rotational speed will lead to a reduction in material strength. Besides, reduction in strength and hardness of multi-pass of FSPed AA 6063 has also been reported by Al-Fadhalah K.J. et al. [7] due to precipitate dissolution and the limited re-precipitation caused by the thermal cycle of FSP. Besides, Zhao H.L. et al. and Mahmoud T.S. et al. [17,18] also reported that increasing rotational speed increased process temperature, leading to grain coarsening in FSPed AA 6063. In the FSP of non-aluminum alloy materials, the reduction in strength and hardness were also reported and these may be due to excessive heat input leading to grain growth [19,20,21].
On the other hand, the rotational speed and feed rate used in the fabrication of AA 6063 surface metal matrix composites (SMMCs) range from 1120 rpm to 1600 rpm and 30 mm/min to 63 mm/min [22,23,24,25], respectively. Surface composites produced by FSP also require suitable heat input to ensure a good distribution of reinforced particles. Sandeep R. et al. [23] who worked on FSPed AA 6063/SiC reported that insufficient heat generated at 900 rpm of rotational speed resulted in poor material flow and the reinforced particles were not distributed uniformly. He also reported that a rotational speed of 1120 rpm produced better particles distribution than 900 rpm and 1400 rpm. In addition, Srivastava M. et al. [24] who worked on FSPed AA 6063 also mentioned the significant impact of rotational speed and feed rate on the heat generation and the distribution of reinforced particles in his work. He reported that higher rotational speed and lower feed rate ensured a more uniform distribution of reinforced particles. He concluded that feed rate of 40 mm/min and rotational speed of 1400 rpm produced sufficient heat for the reinforcement while feed rate of 30 mm/min generated excessive heat that would result in annealing of the base matrix which lowered the microhardness. Besides, a feed rate of 50 mm/min had also produced insufficient heat during the process.
There are different combinations of rotational speeds and feed rates that have been used in FSPed AA 6063 studies. Besides, most works emphasized the mechanical properties instead of the tribological properties of FSPed samples. Hence, this work is to optimize FSP parameters for simultaneously maximized surface hardness and minimized friction and wear performance of recycled AA 6063.

2. Materials and Methods

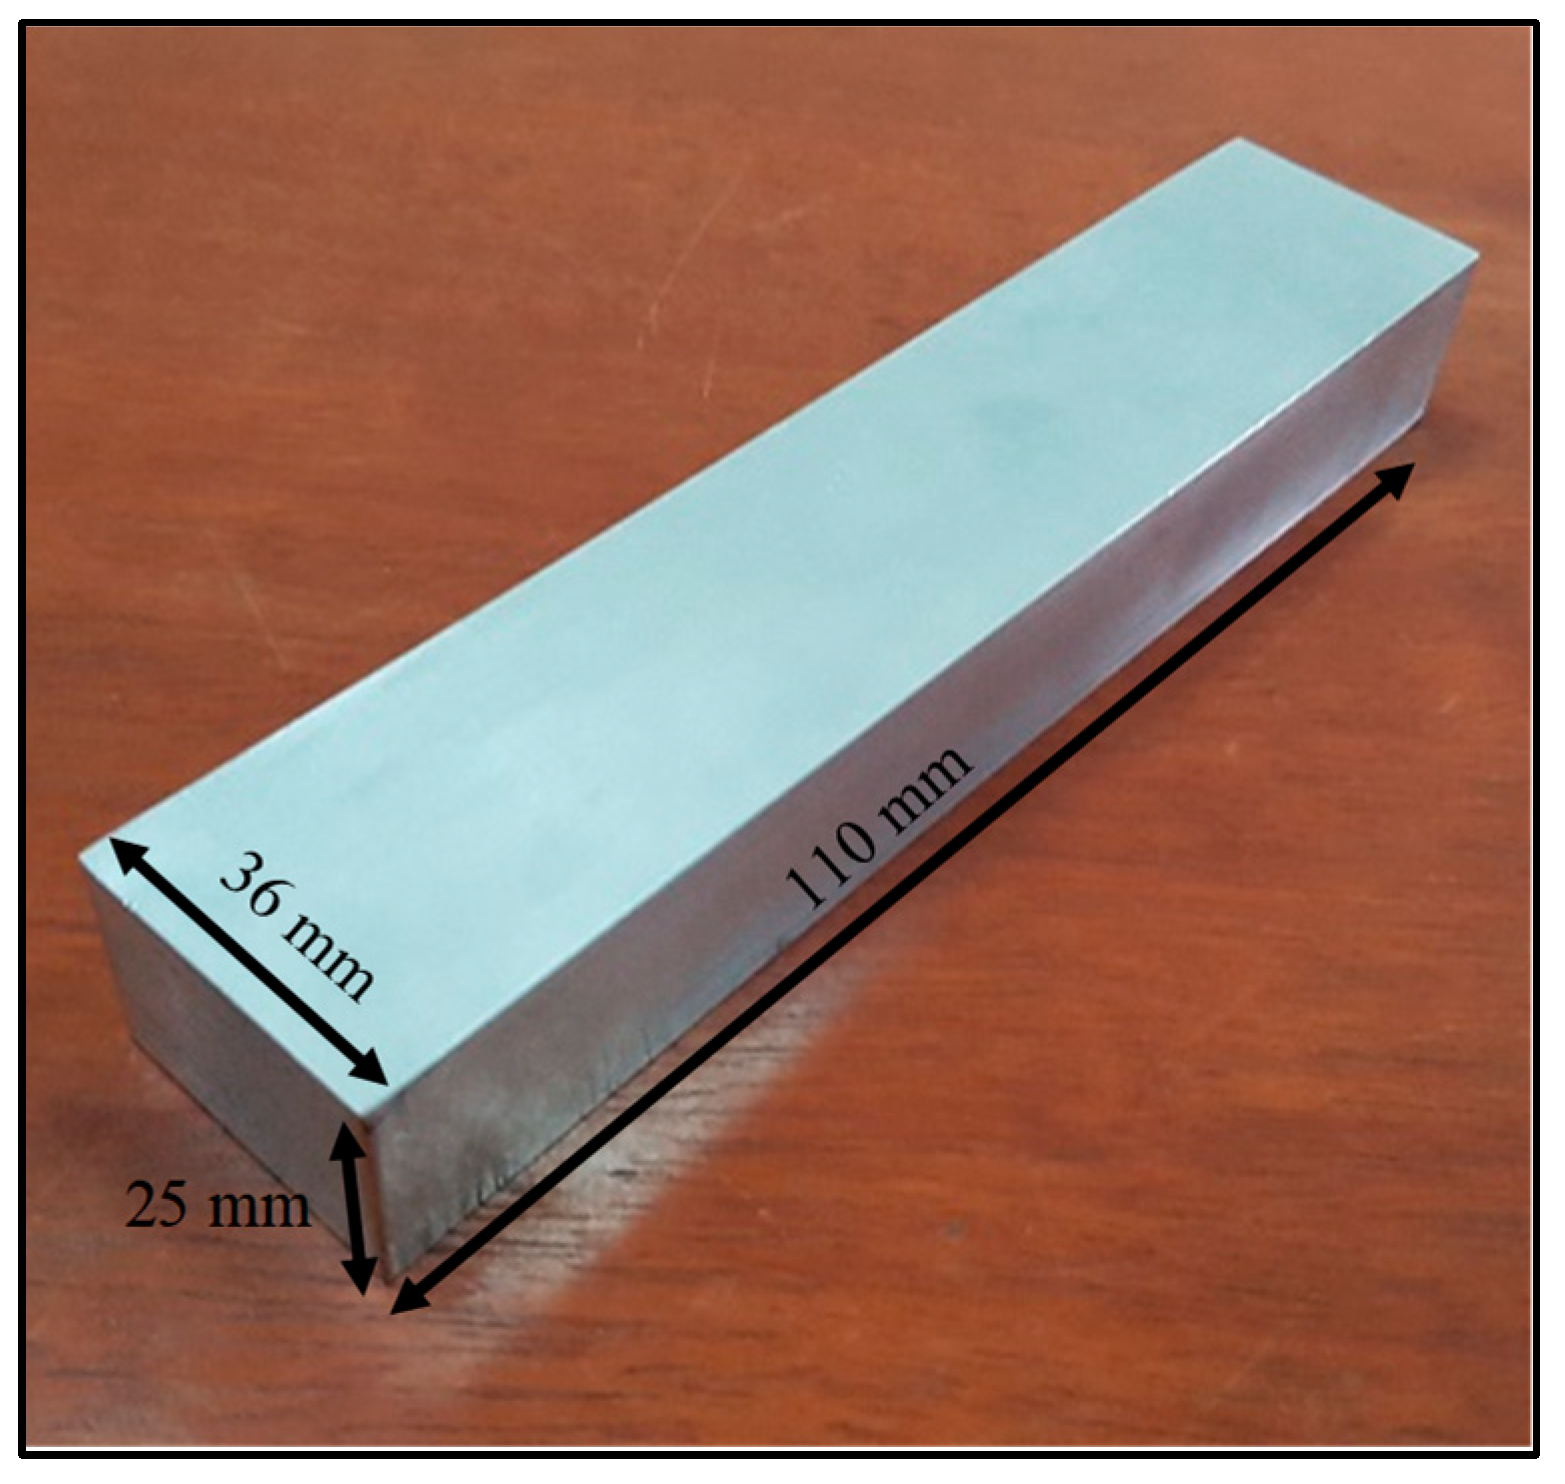
2.1. Substrate Material

Recycled AA 6063 was selected as a substrate material in this study and its chemical composition is shown in Table 1. Figure 1 shows the aluminum billets with a diameter of 127 mm and length of 350 mm that were cut into rectangular bars with dimensions of 110 × 36 × 25 mm3 (L × W × H) using a manual milling machine. A silicon carbide paper of 1000 grit size was used to remove the oxide layer on the surface of recycled AA 6063 rectangular bars prior to friction stir processing.

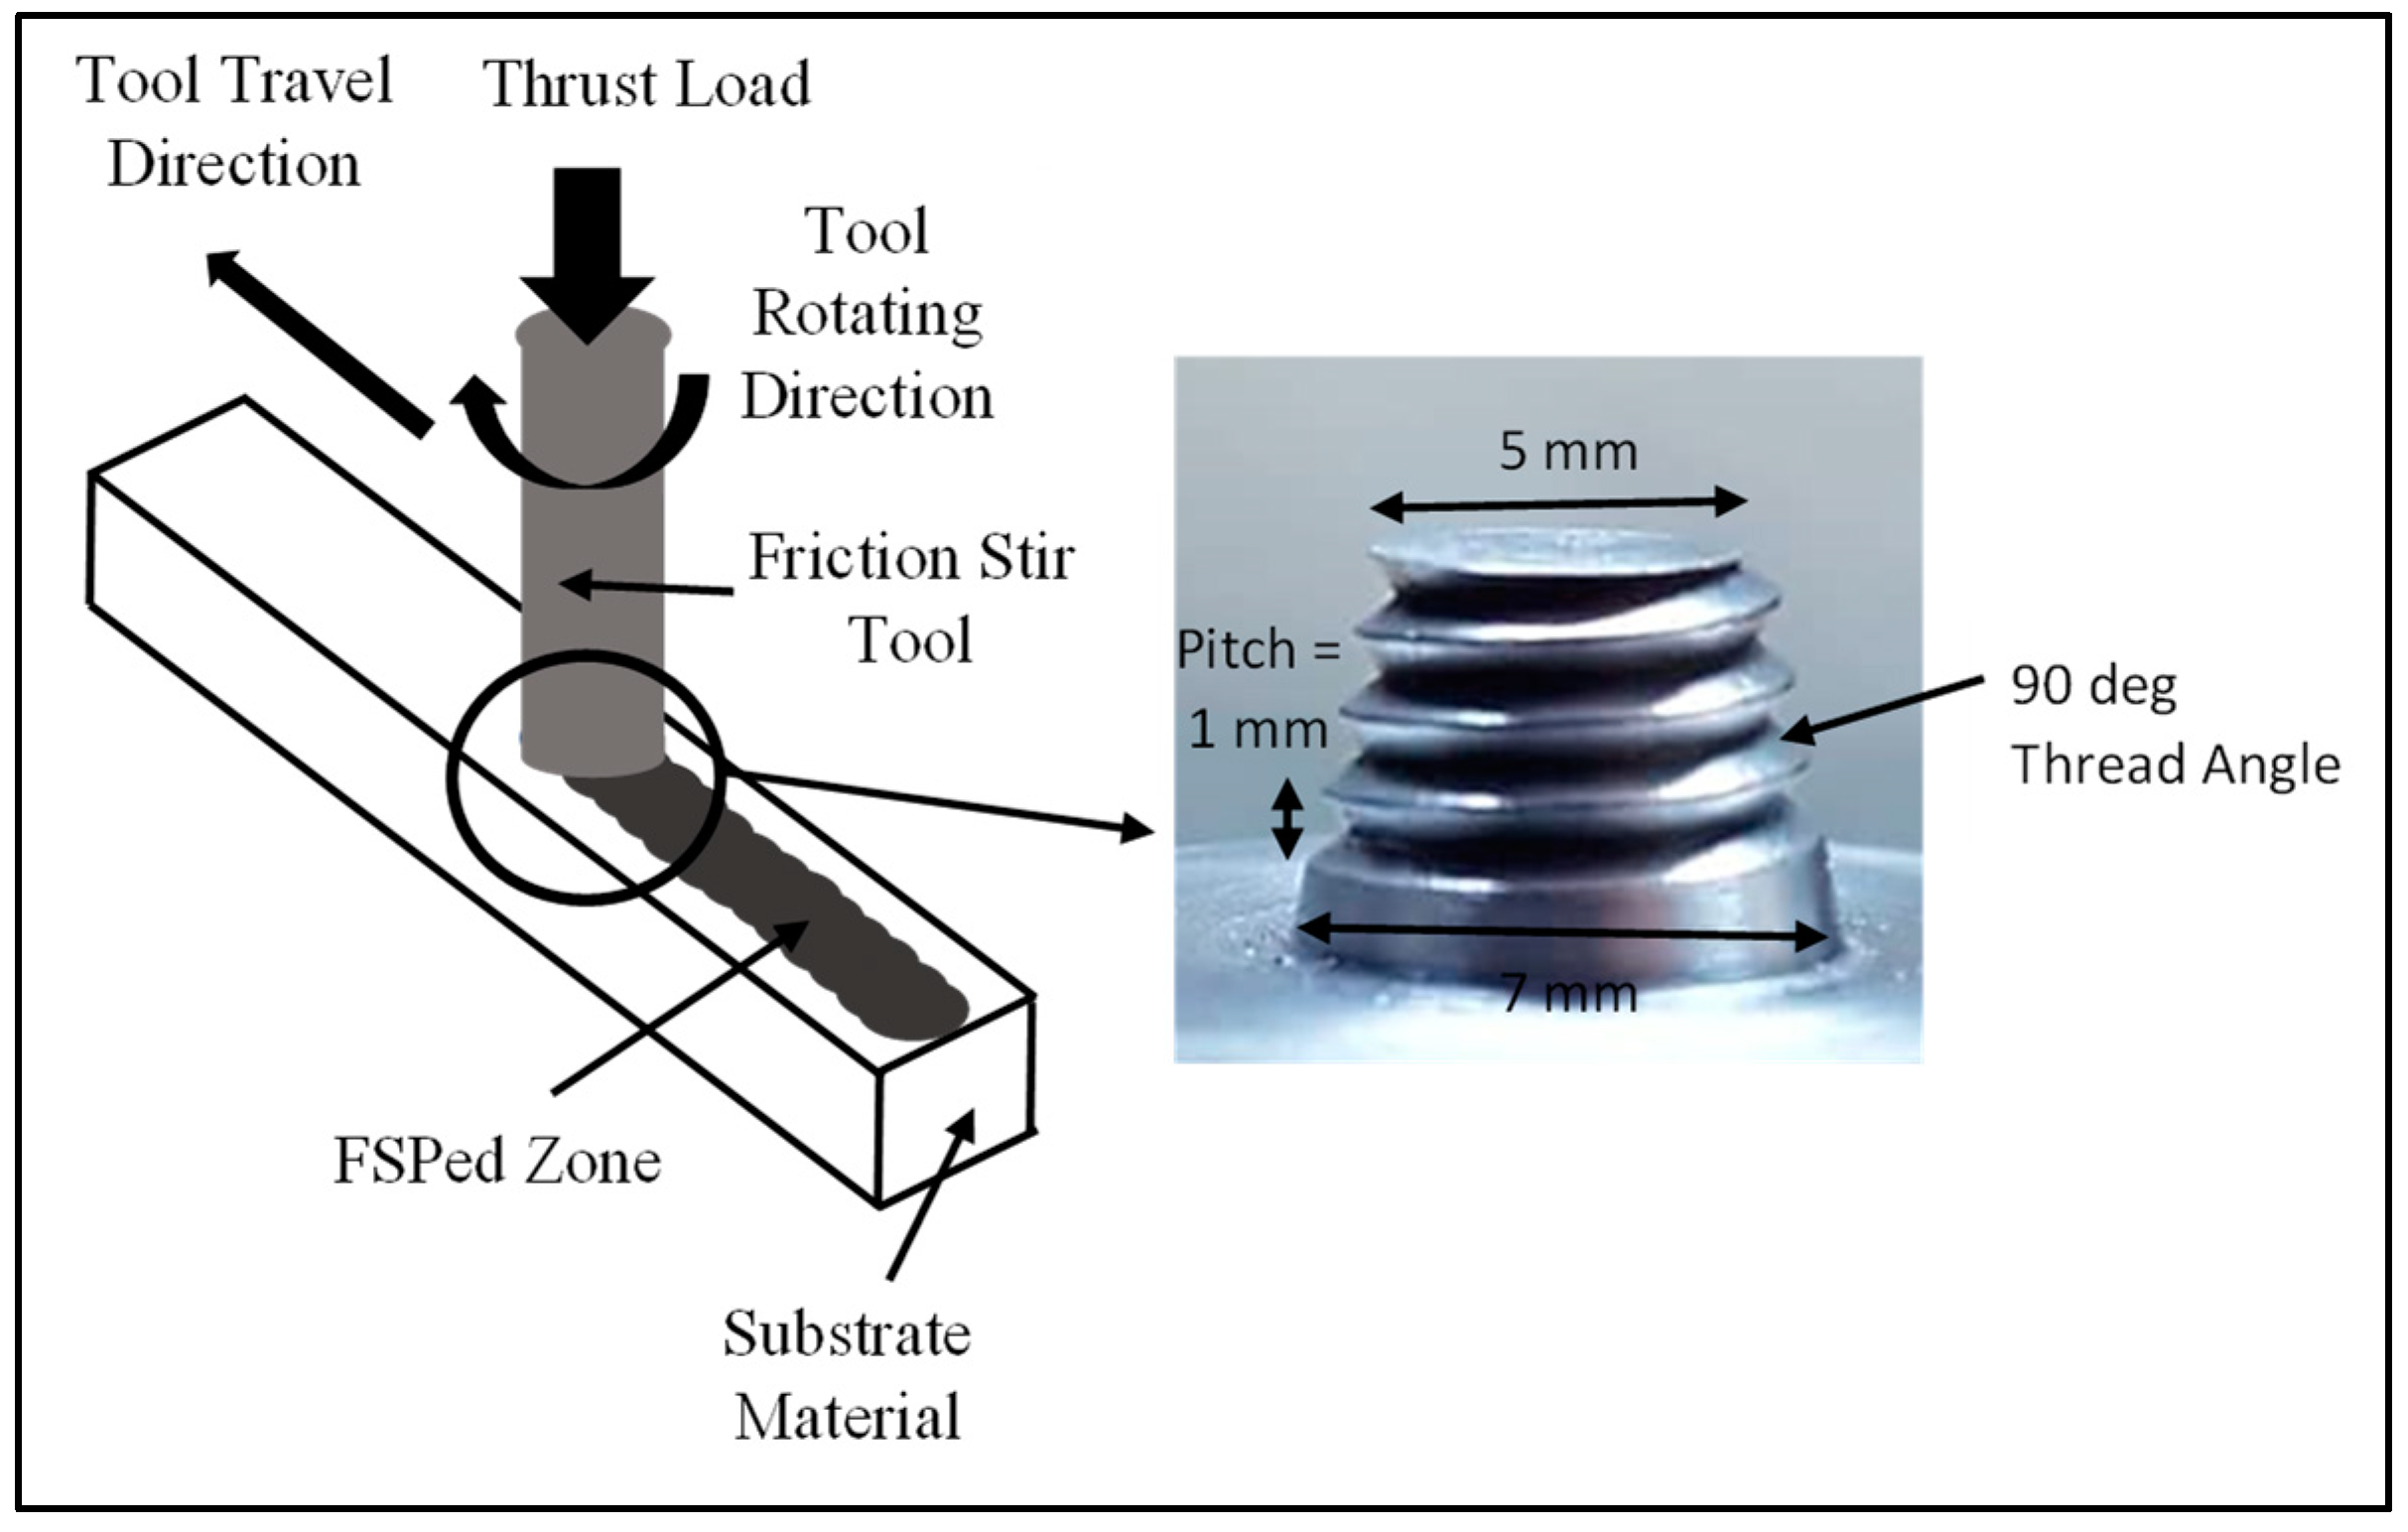
2.2. Friction Stir Processing (FSP)

FSP was conducted using CNC Milling Machine, Mazak with different rotational speeds and feed rates ranging from 1200 rpm to 2000 rpm and 25 mm/min to 45 mm/min, respectively. The FSP ploughing depth is 0.5 mm. Table 2 shows the list of samples produced using different sets of processing parameters. The schematic diagrams of the FSP and FSP tool are also shown in Figure 2. Based on the authors’ previous work [26], a taper threaded friction stir tool is selected and made by ASP 23 high-speed steel with 60 HRC hardness, shoulder diameter of 18 mm, a tapered pin with a major diameter of 7 mm, and a minor diameter of 5 mm and a pin length of 5 mm was used.

2.3. Surface Roughness Measurement

The FSPed surface roughness was measured using surface profilometer, MarSurf M400 C (Mahr, Göttingen, Germany). The roughness values and the roughness profile were recorded.

2.4. Microstructure Analysis

The processed workpieces were cut into microstructure samples with the dimension of 36 × 20 × 15 mm3 (W × L × H). Figure 3a shows the schematic of the sample cut from the processed workpiece and Figure 3b shows the CAD drawing of this sample. After grinding and polishing with 400, 600, 800, 1000, and 2000 grit sizes of water-proof silicon carbide paper and 6 microns, 3 microns, and 1 micron of diamond pastes mixed with colloidal silica, the samples were etched using Keller’s Reagent. The microstructure of the FSPed recycled AA 6063 samples was inspected using the metallurgical microscope (Meiji, Saitama, Japan). The changes in the microstructure of both base metal (BM) and selected FSPed samples were observed and the grain sizes of these samples were also measured.

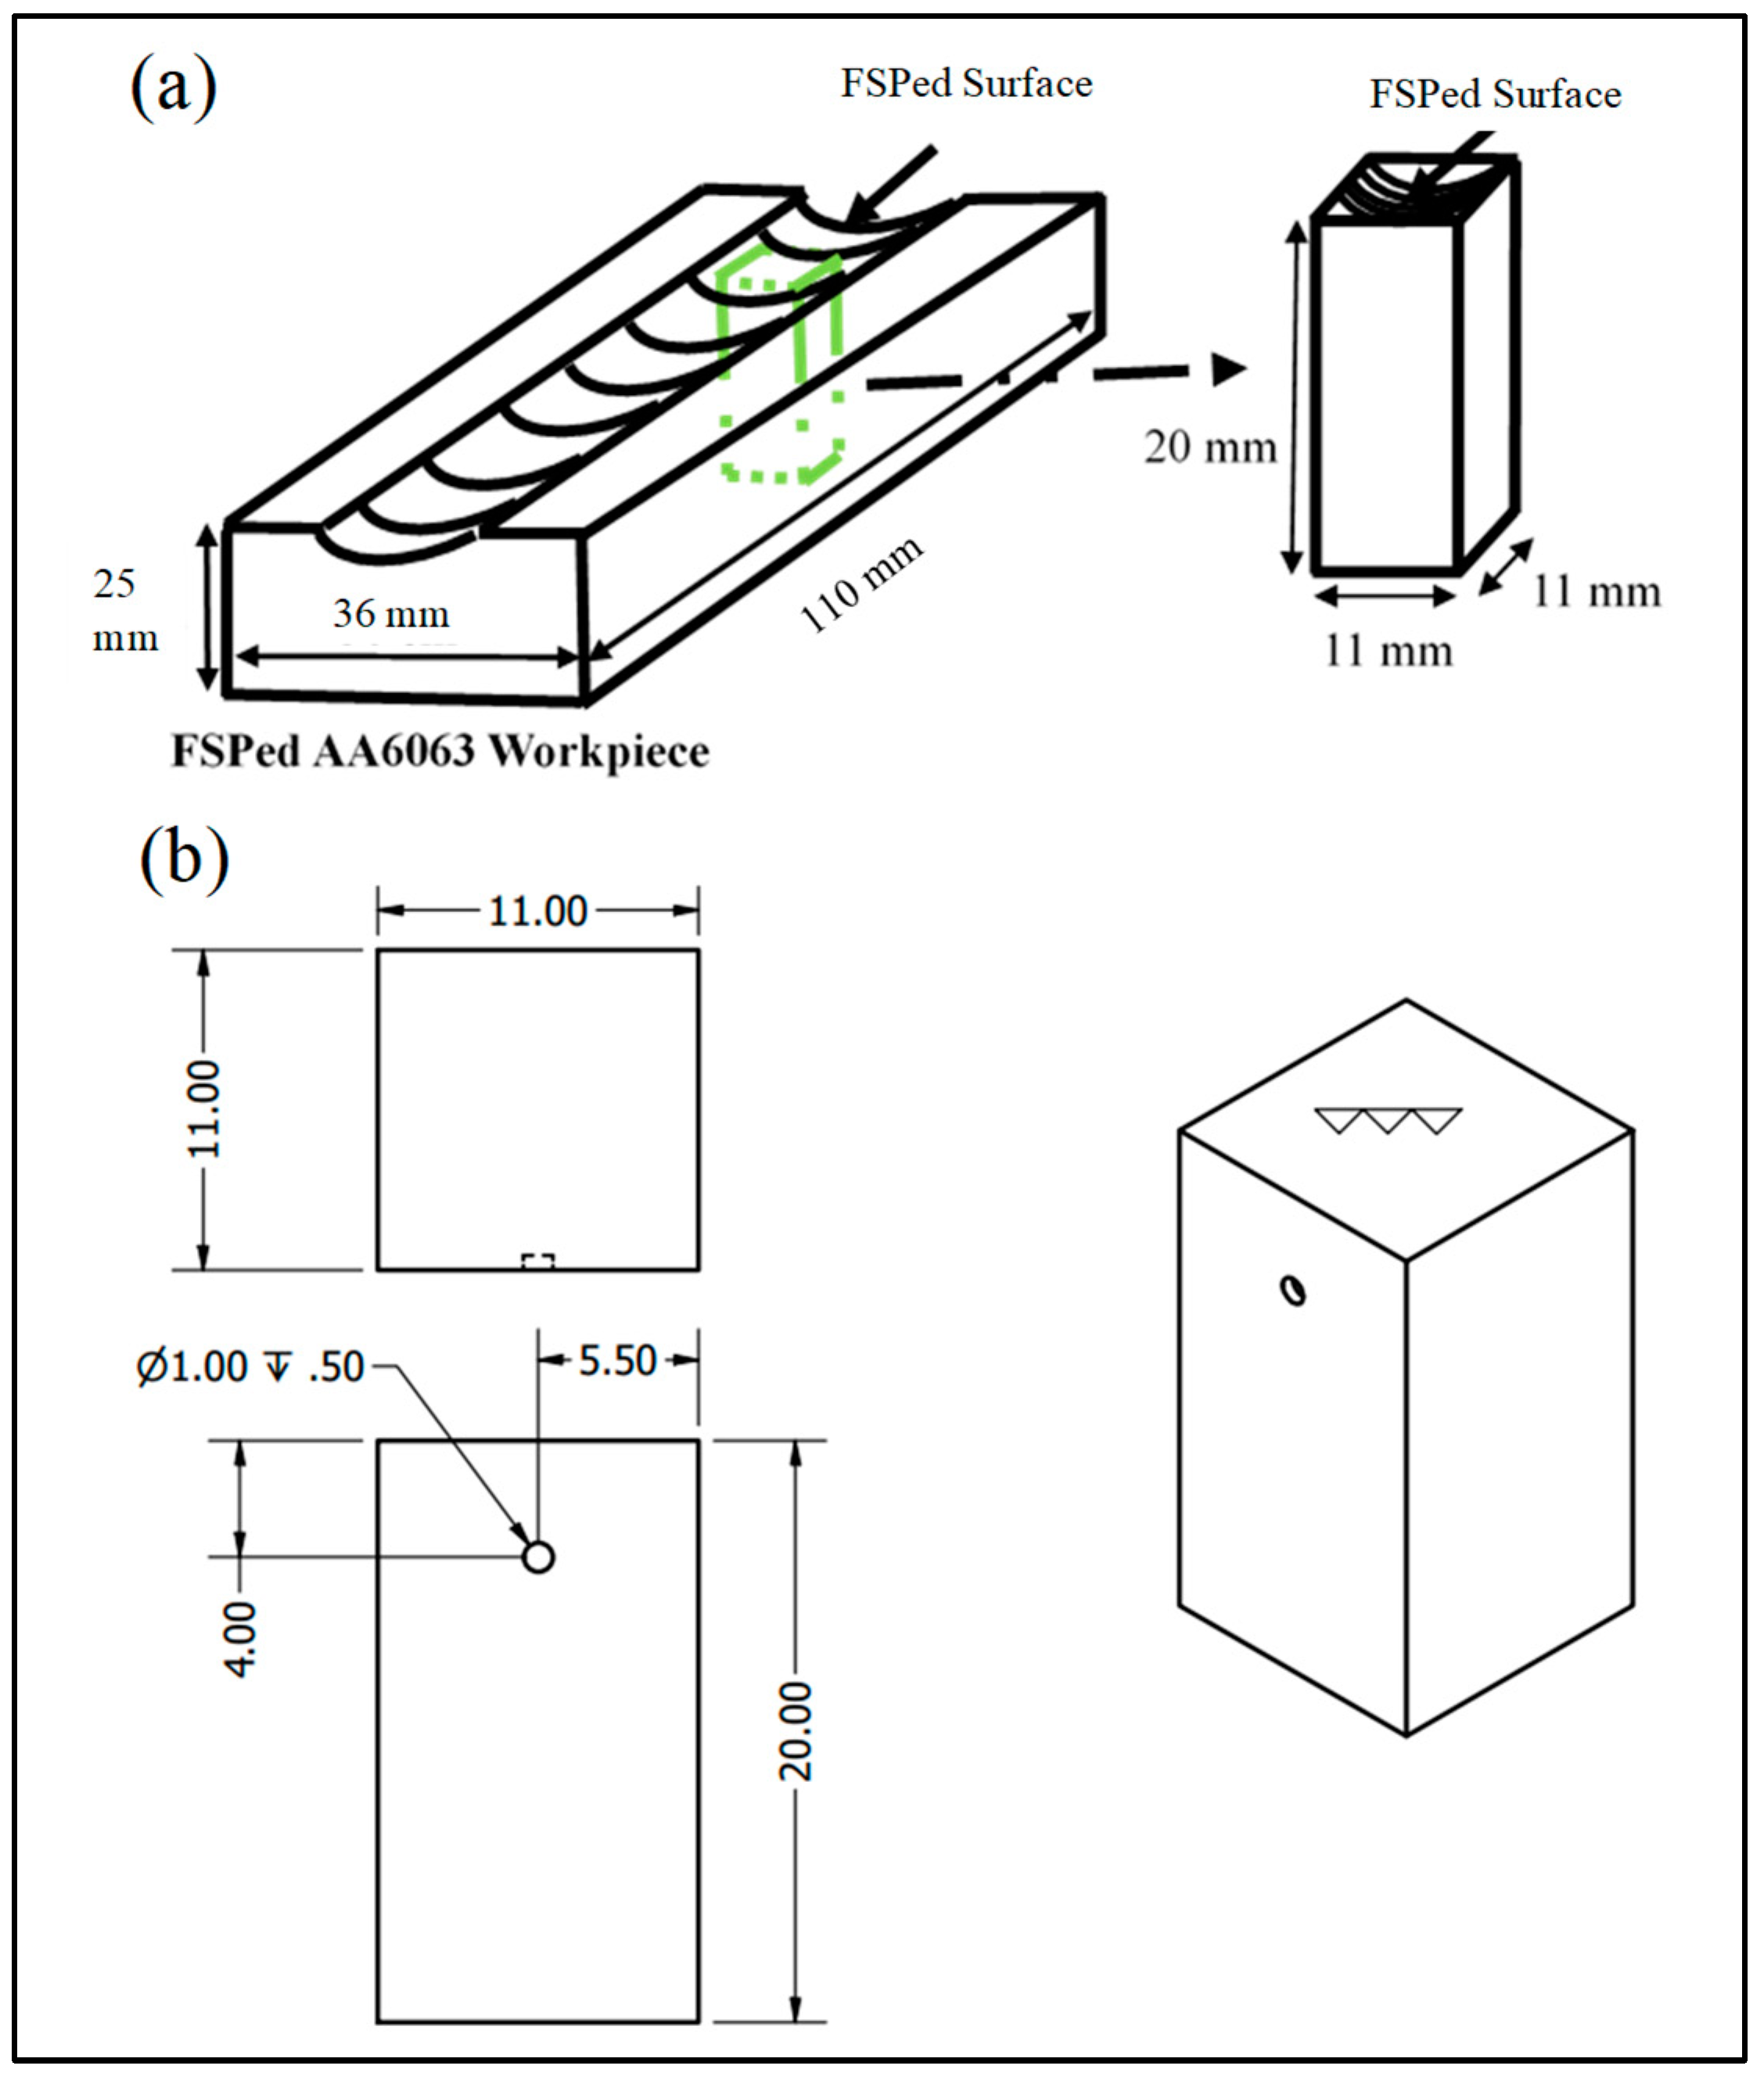
2.5. Microhardness Measurement

Microhardness measurement was conducted using Wilson 430 SVD Vickers Hardness Tester (Buehler, Lake Bluff, IL, USA). The load was set to 9.81 N with a dwell time of 10 s. Prior to the measurement, the indenter was cleaned with an alcohol prep pad and the samples were ground and polished with 400, 600, 800, 1000, and 2000 grit sizes of water-proof silicon carbide paper and 6 microns, 3 microns, and 1 micron of diamond paste mixed with colloidal silica, until mirror finish was obtained.

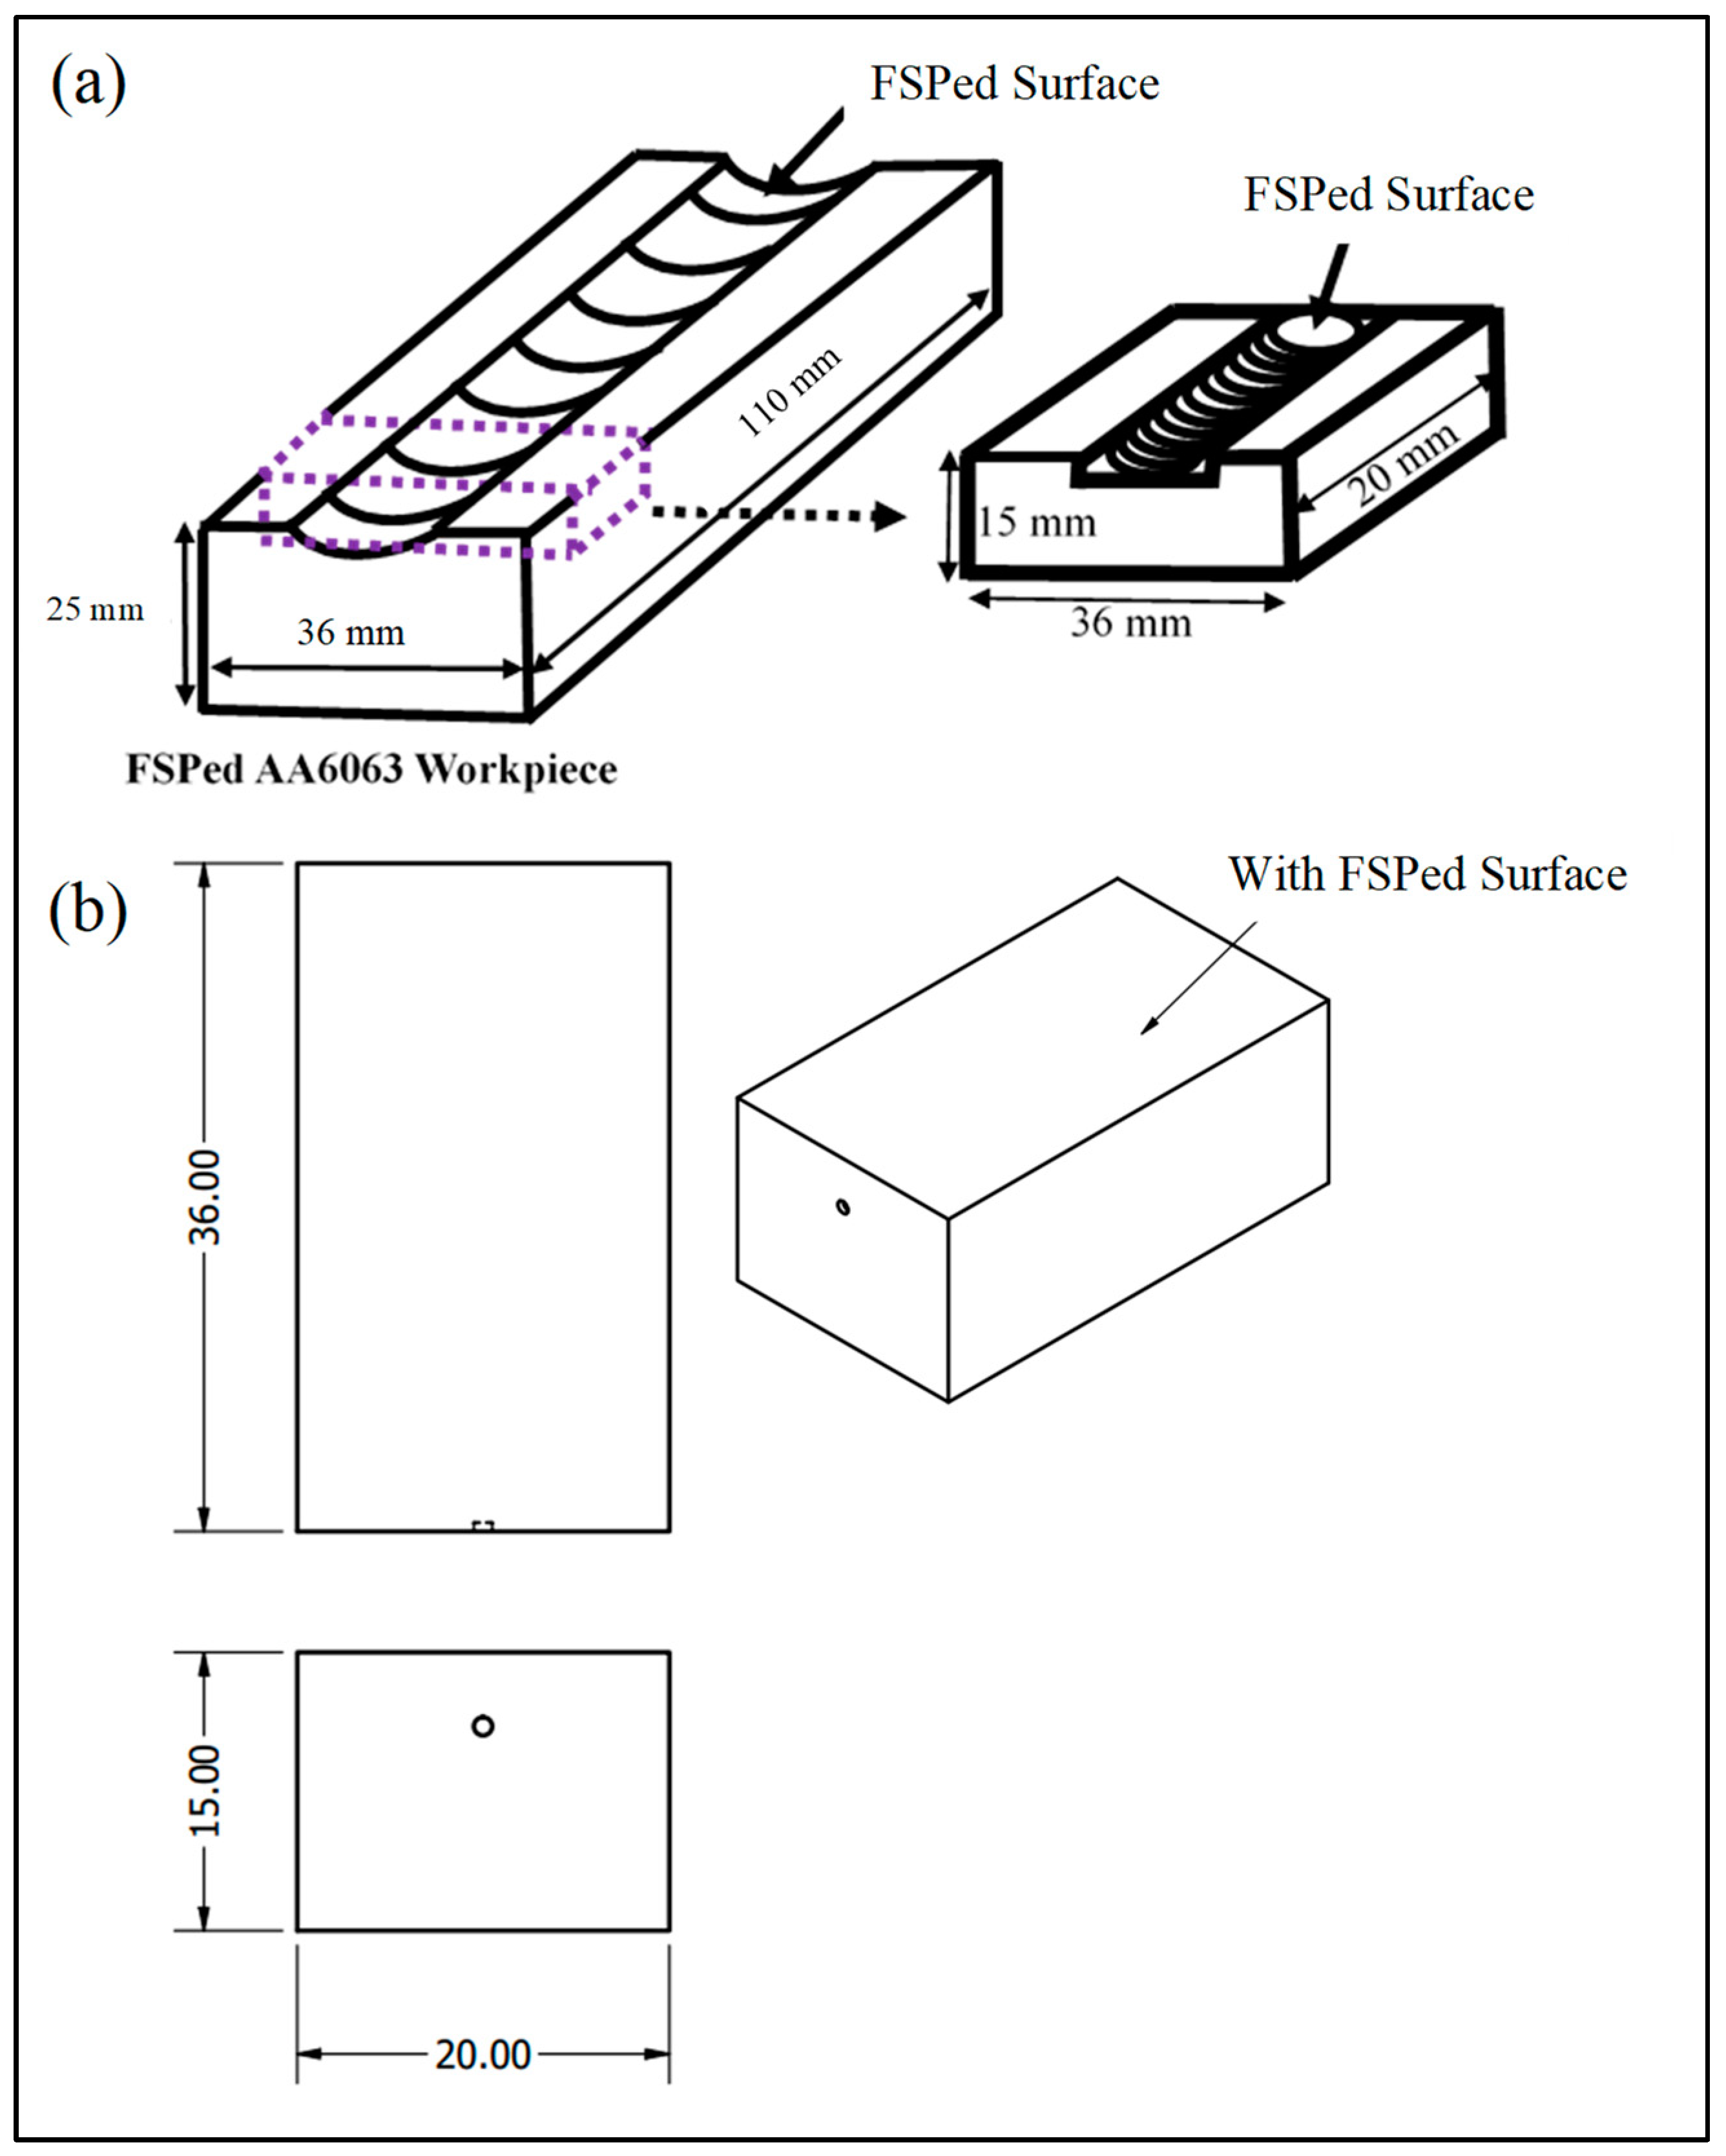
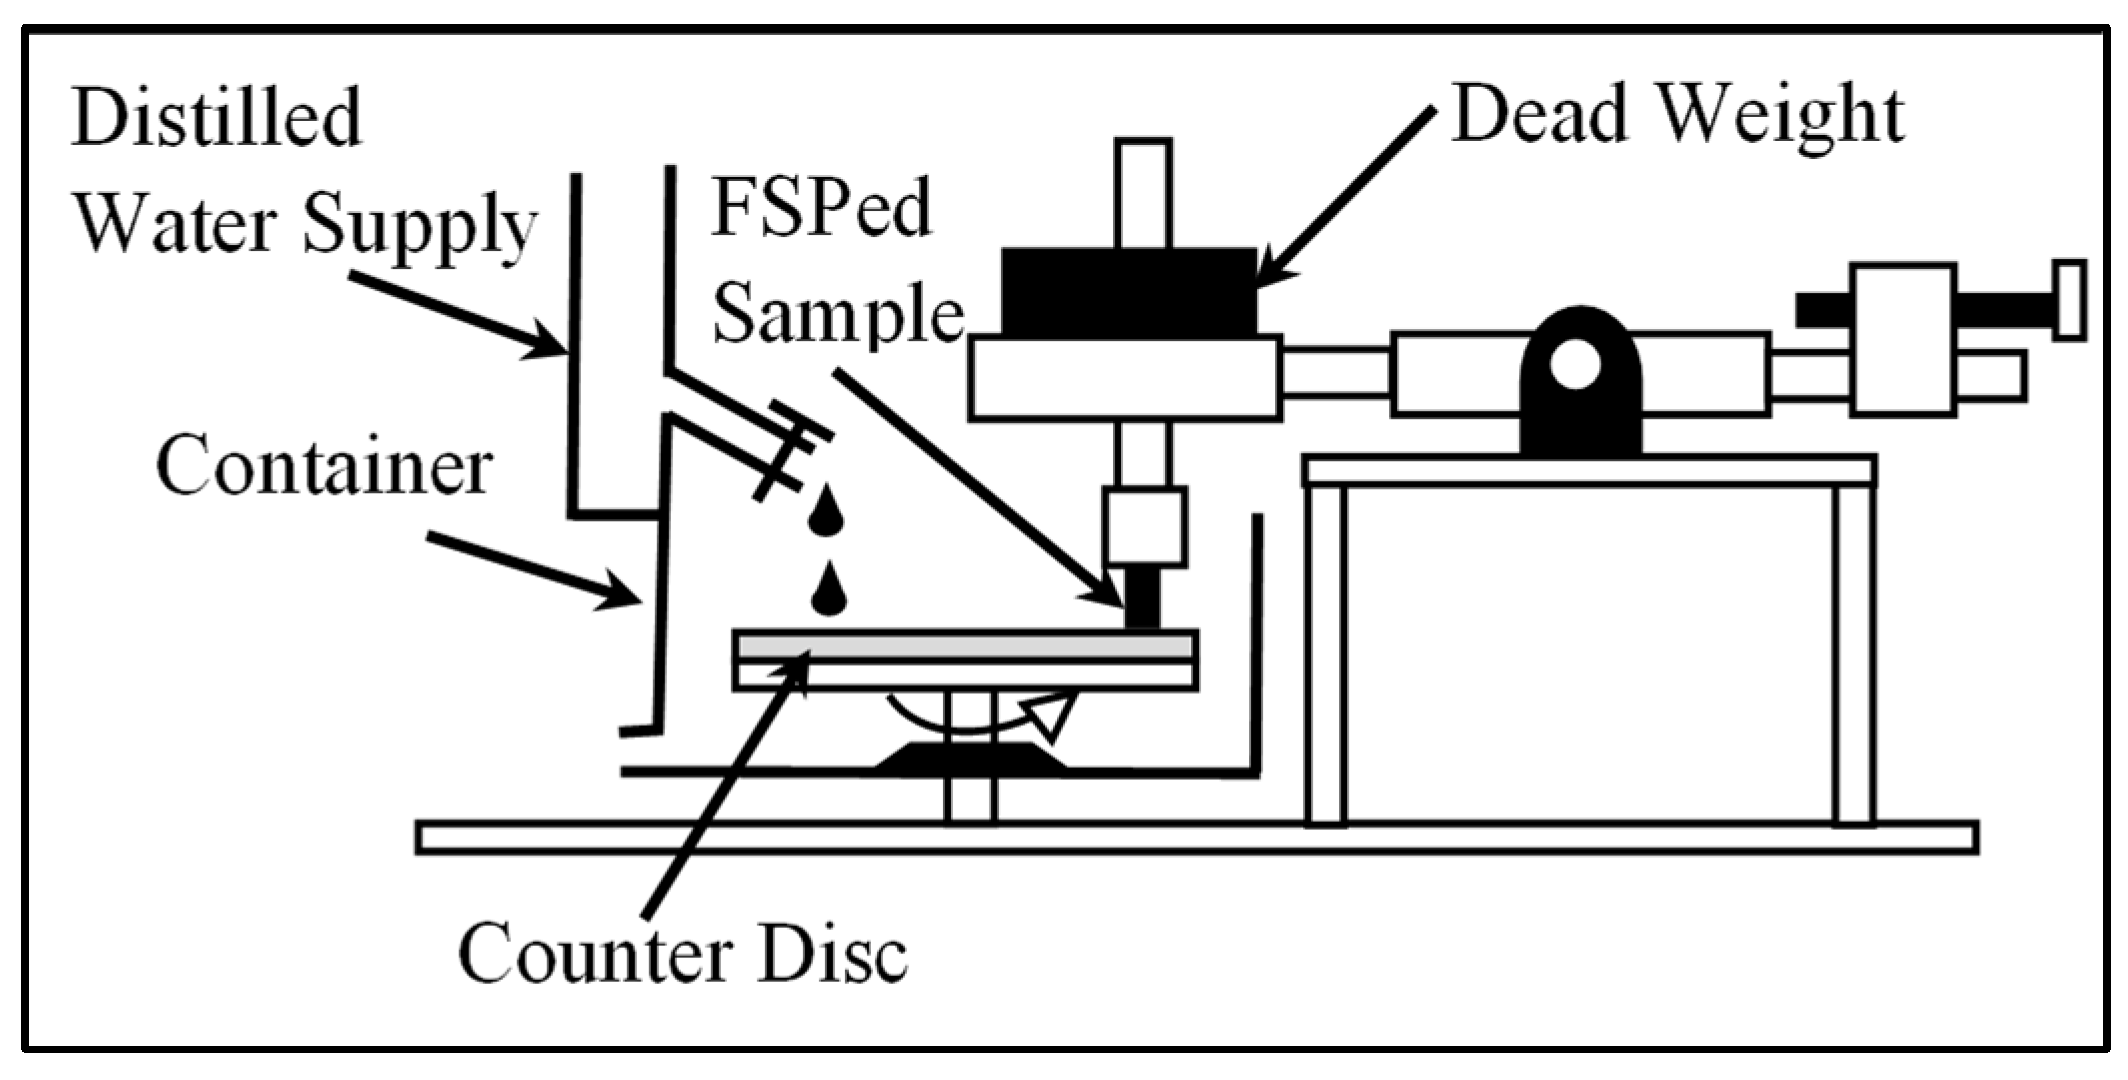
2.6. Friction and Wear Test

The tribo-test samples with a size of 11 × 11 × 20 mm3 (W × L × H) were cut from the FSPed workpiece as shown in Figure 4a. The CAD drawings for the tribo-pin and pin-on-disc tribo-tester are also presented in Figure 4b and Figure 5. Friction and wear characterization was performed by using a pin-on-disc tribo-tester and S275JR steel was used as the counter disc. The sliding test was conducted under starved lubrication conditions and the lubrication used was distilled water. The sliding test was conducted at a speed of 2.88 m/s, with a sliding distance of 1500 m and under a normal contact pressure of 0.24 MPa. The weight loss of the test samples was measured with an electronics balance. All the wear rate and their friction coefficient were computed and tabulated.

3. Results and Discussion

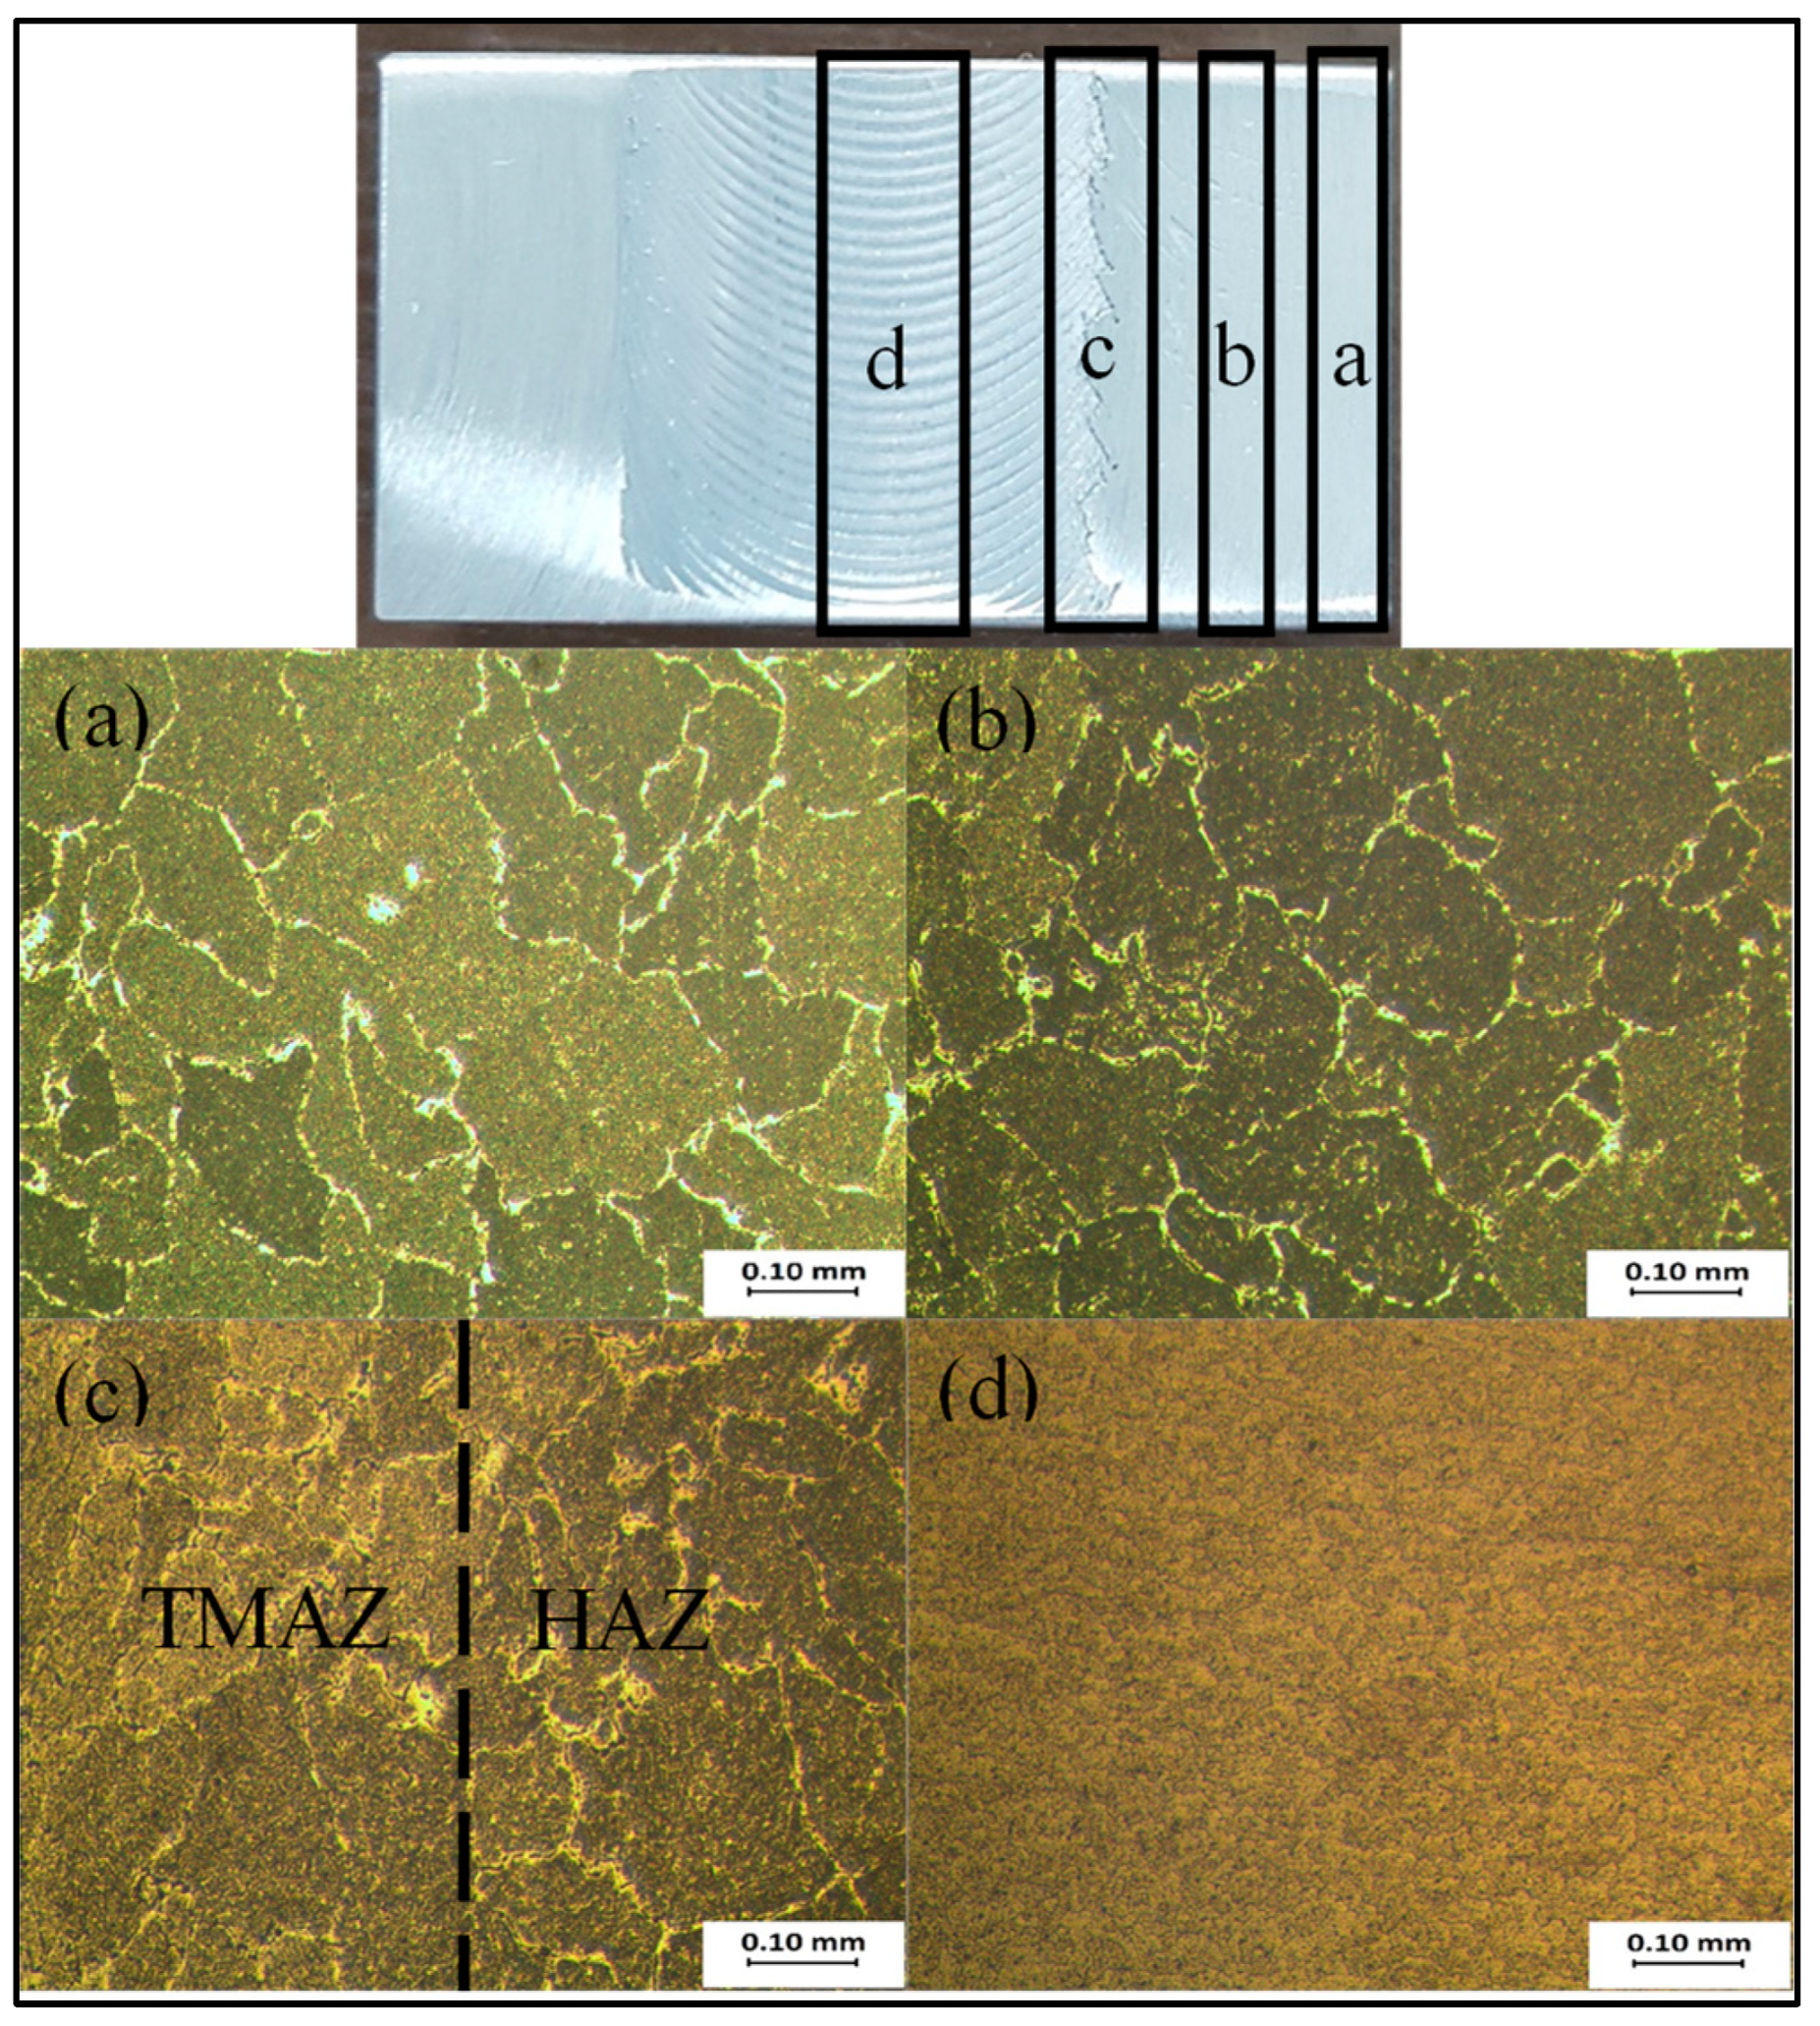
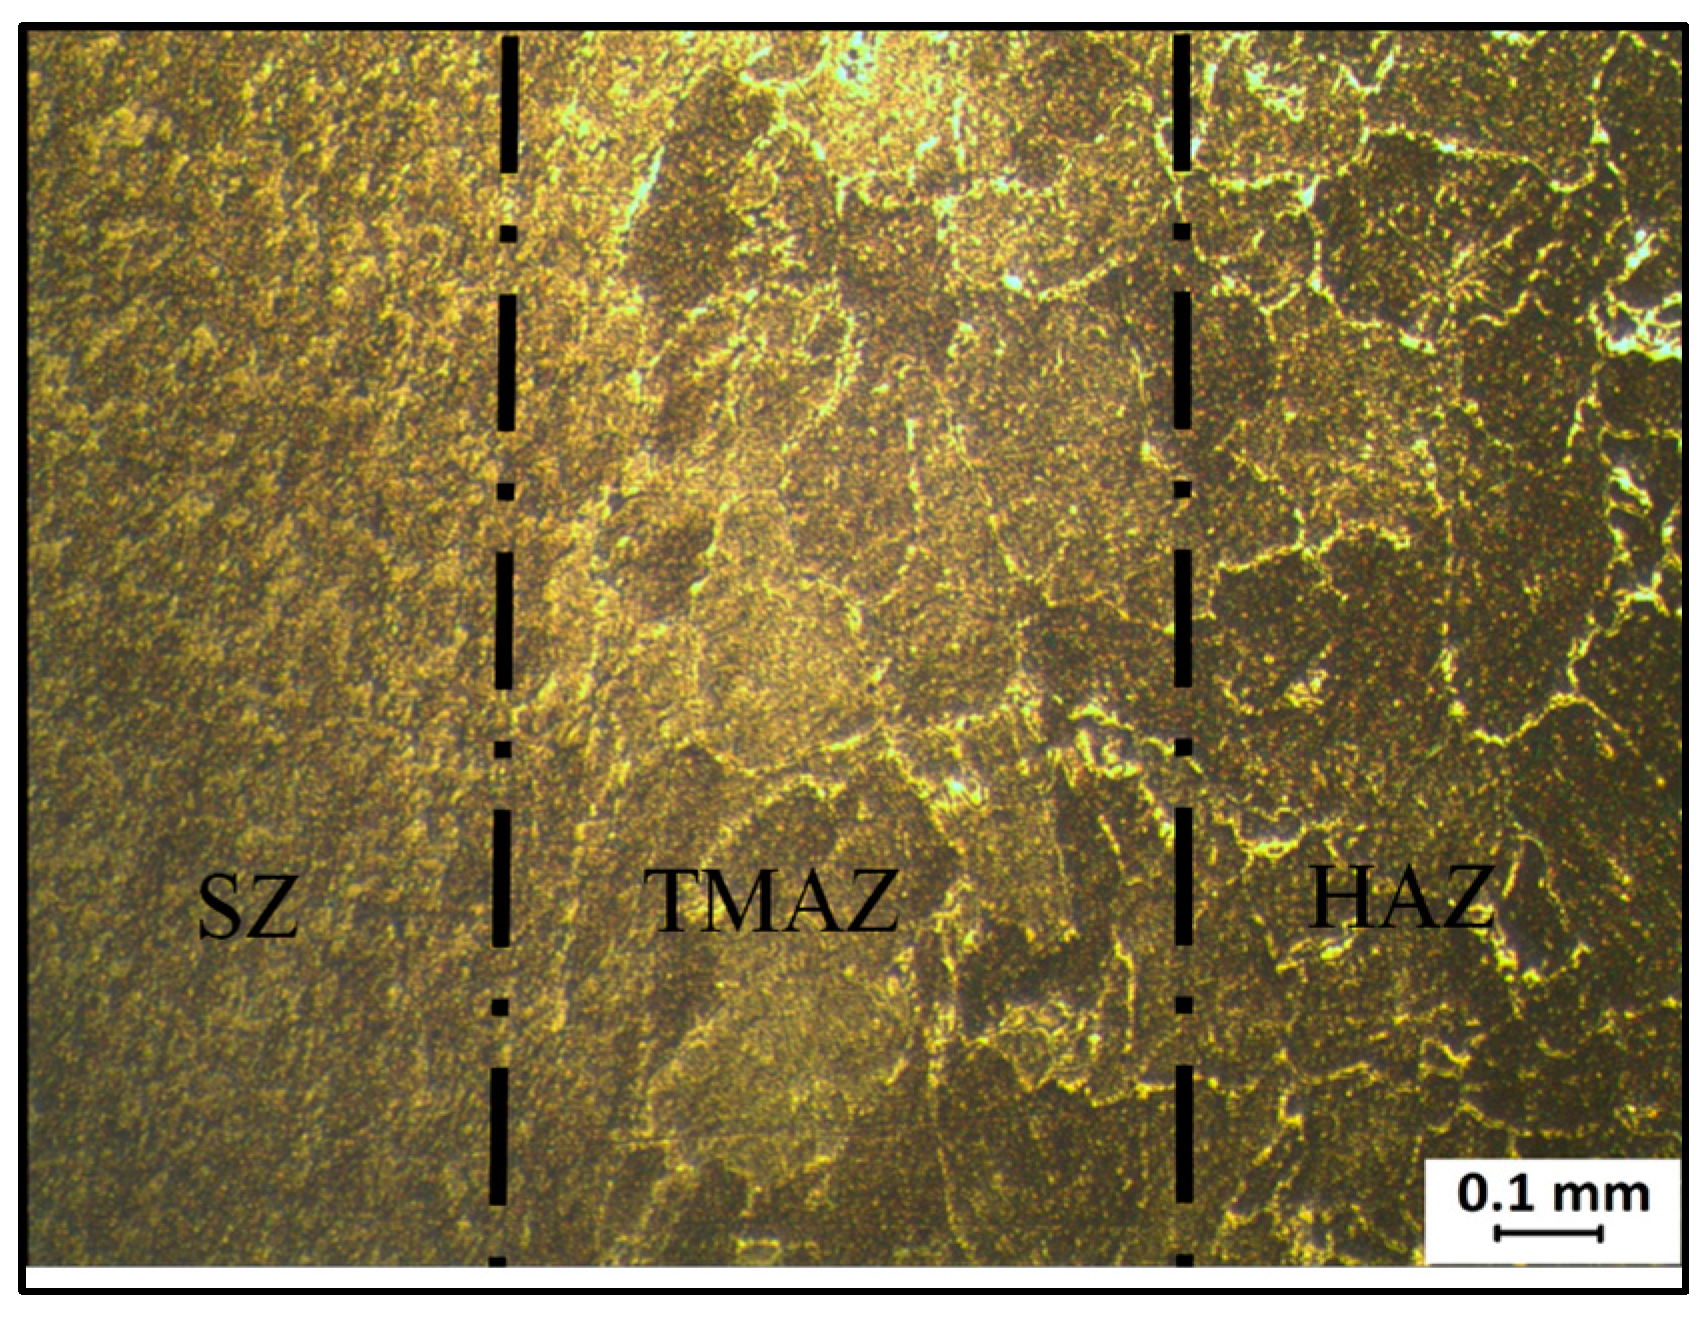
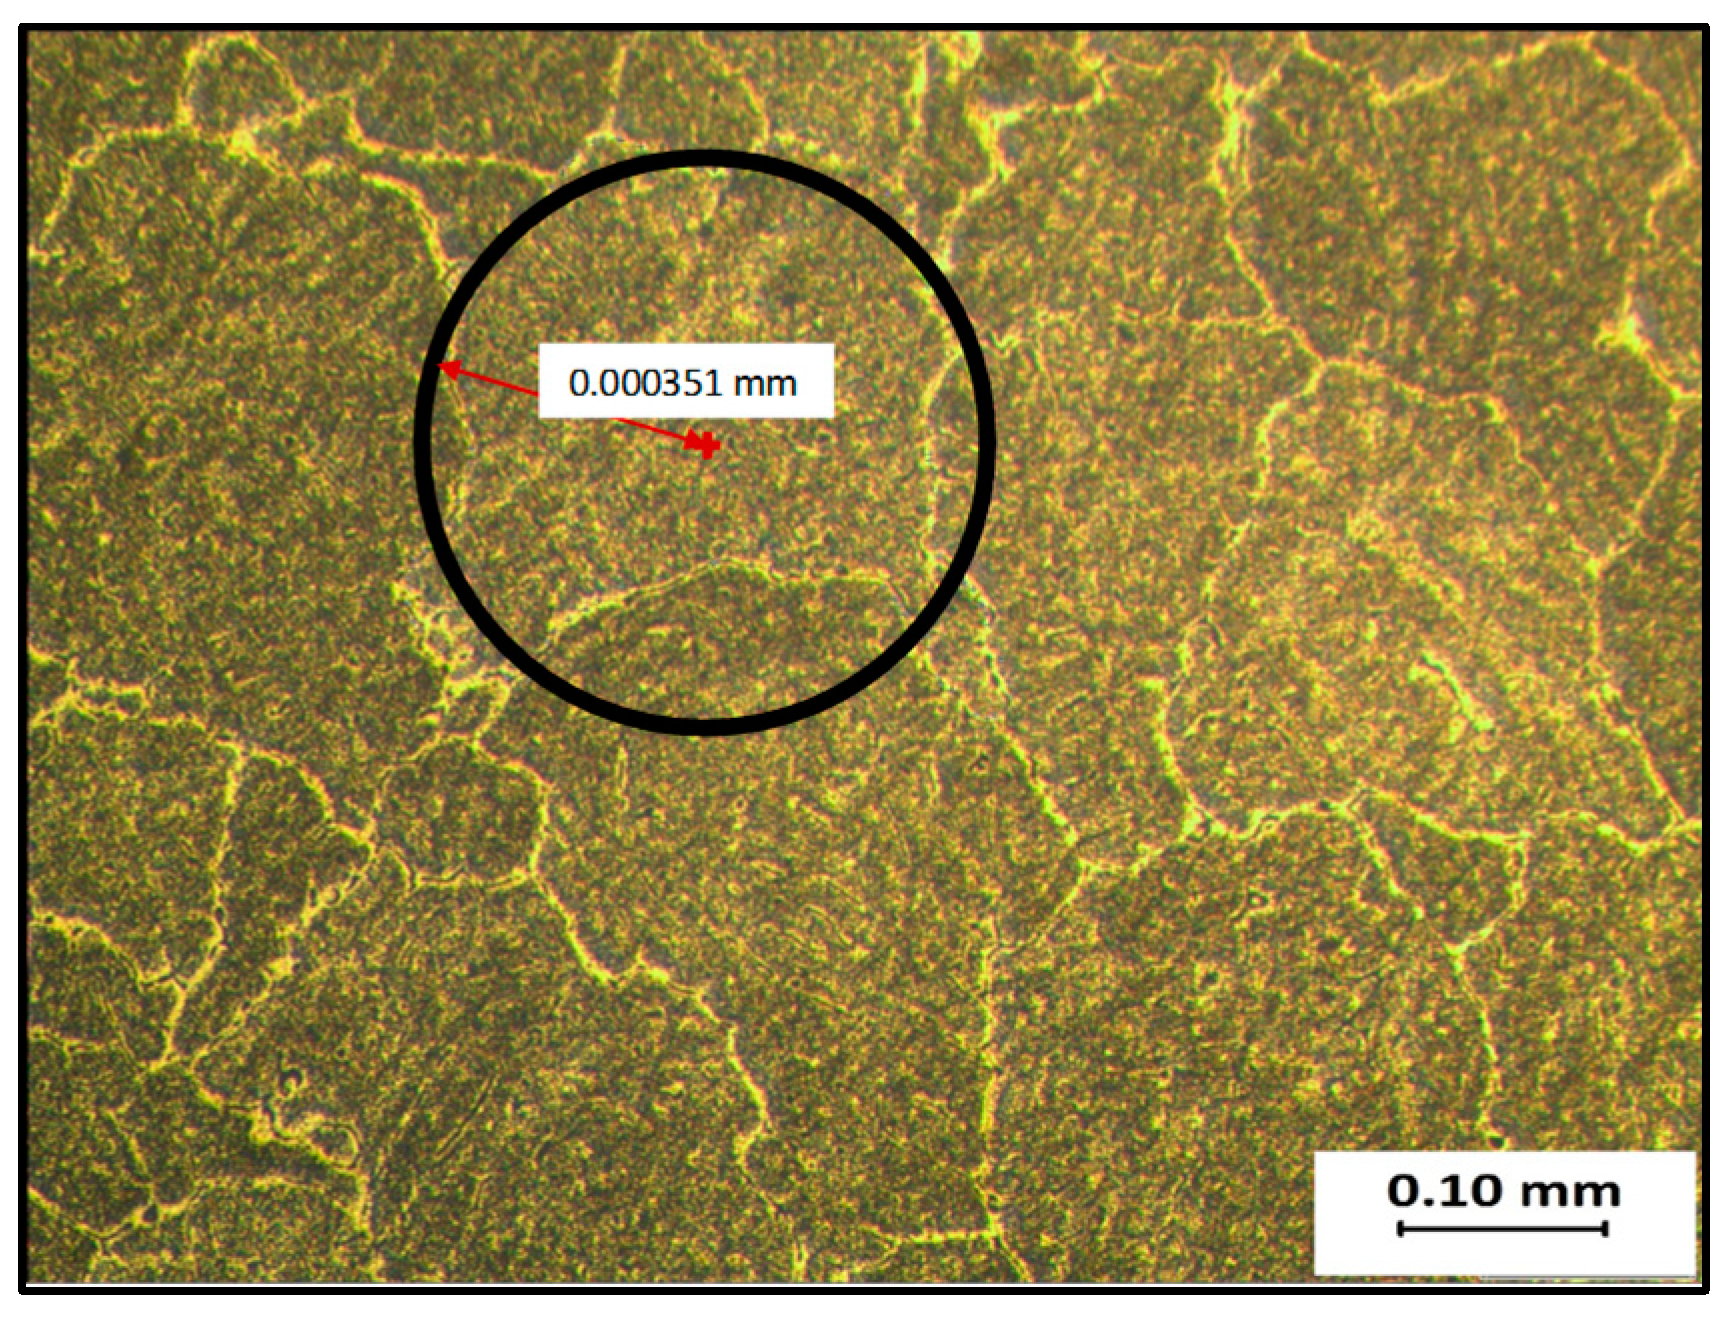
3.1. Microstructure Analysis

Figure 6 demonstrates the microstructure of the FSPed sample produced at 1200 rpm and 30 mm/min (Sample 2) and it shows different zones of microstructures that were observed using the metallurgical microscope under 10× magnification. Figure 6a shows the outermost part of the sample that is not stirred by the FSP tool having a big grain size similar to the BM. Closer to the processing zone, the grain size started to diminish and this zone is known as the heat-affected zone (HAZ) as shown in Figure 6b. This zone is very similar to the base metal and the only difference is that the grain size is smaller. This resulted from the heat generated during the process. Next, close to the middle of the sample, a zone with grains that are formed by the shearing of FSP tool direction can be observed and this zone is known as the thermo-mechanical affected zone (TMAZ) as shown in Figure 6c. At the middle of the sample is the stir zone of the FSPed sample as shown in Figure 6d. At this zone, the fine grain can be observed, and this grain refinement was due to the plastic deformation and dynamic recrystallization during the process. A. Amirafshar et al. [5] who worked on FSPed ST14 stainless steel claimed that similar grain refinement was due to severe plastic deformation and dynamic recrystallization during FSP. Besides, P. Cavahere et al. [27] also reported the plastic deformation and dynamic recrystallization that resulted in grain refinement of FSPed AA 7075. Furthermore, refinement in microstructure was also reported in K. Surekha. Et al. [20] work and the occurrence of grain refinement are also attributed to dynamic recrystallization. N. Yasavol et al. [28] also reported that the stir zone was formed due to the plastic deformation and the thermo-mechanical affected zone was formed due to the shear direction of the FSP tool. The overall images of the intersection of stir zone, thermo-mechanical affected zone, and heat-affected zone under a 5× magnification are presented in Figure 7. These three zones can be easily distinguished in the images by observing the difference in grain size.
The grain size of some of the FSPed samples was also measured and presented in Table 3. The outermost part of the sample (BM) that is not stirred by the FSP tool has the largest grain size and the grain size is similar to the unprocessed recycled AA 6063. Closer to the stir zone, the grain size was reduced, and the smallest grain size was observed at the stir zone. Figure 8 demonstrates grain size measurement using the metallurgical microscope software, VIS Pro, China. The maximum reduction in grain size is about 96% and the smallest average grain size was reduced to 4.6 μm. Besides, it also shows that the BM part of each sample is also similar, and their grain sizes all exceeded 100 μm. In addition, the microstructure also shows that the grain size becomes smaller when getting closer to the stir zone, consistent with the grain size measurement as shown in Table 3. The grain size of the heat-affected zone is about 80 μm to 90 μm while that in the thermo-mechanical affected zone is about 40 μm to 50 μm. The smallest grain size was found in Sample 2, which was produced at a rotational speed of 1200 rpm and a feed rate of 30 mm/min. As mentioned above, a reduction in grain size is due to the plastic deformation and dynamic recrystallization caused by friction heat generation [14]. Hence, the difference in grain size reduction is also due to the different amounts of plastic deformation and frictional heat generated by different processing parameters. The friction heat generation generated at 1200 rpm and 30 mm/min is the most sufficient for the grain refinement of the grain structure whereby the plastic deformation and dynamic recrystallization occurred and successfully refined to the smallest grain size without noticing any grain growth. However, the excessive friction heat generated by other processing parameters such as 1400 rpm and 40mm/min, 1400 rpm and 45 mm/min, and 1800 rpm and 30 mm/min has resulted in grain growth of the material during dynamic recrystallization [19,20,21].

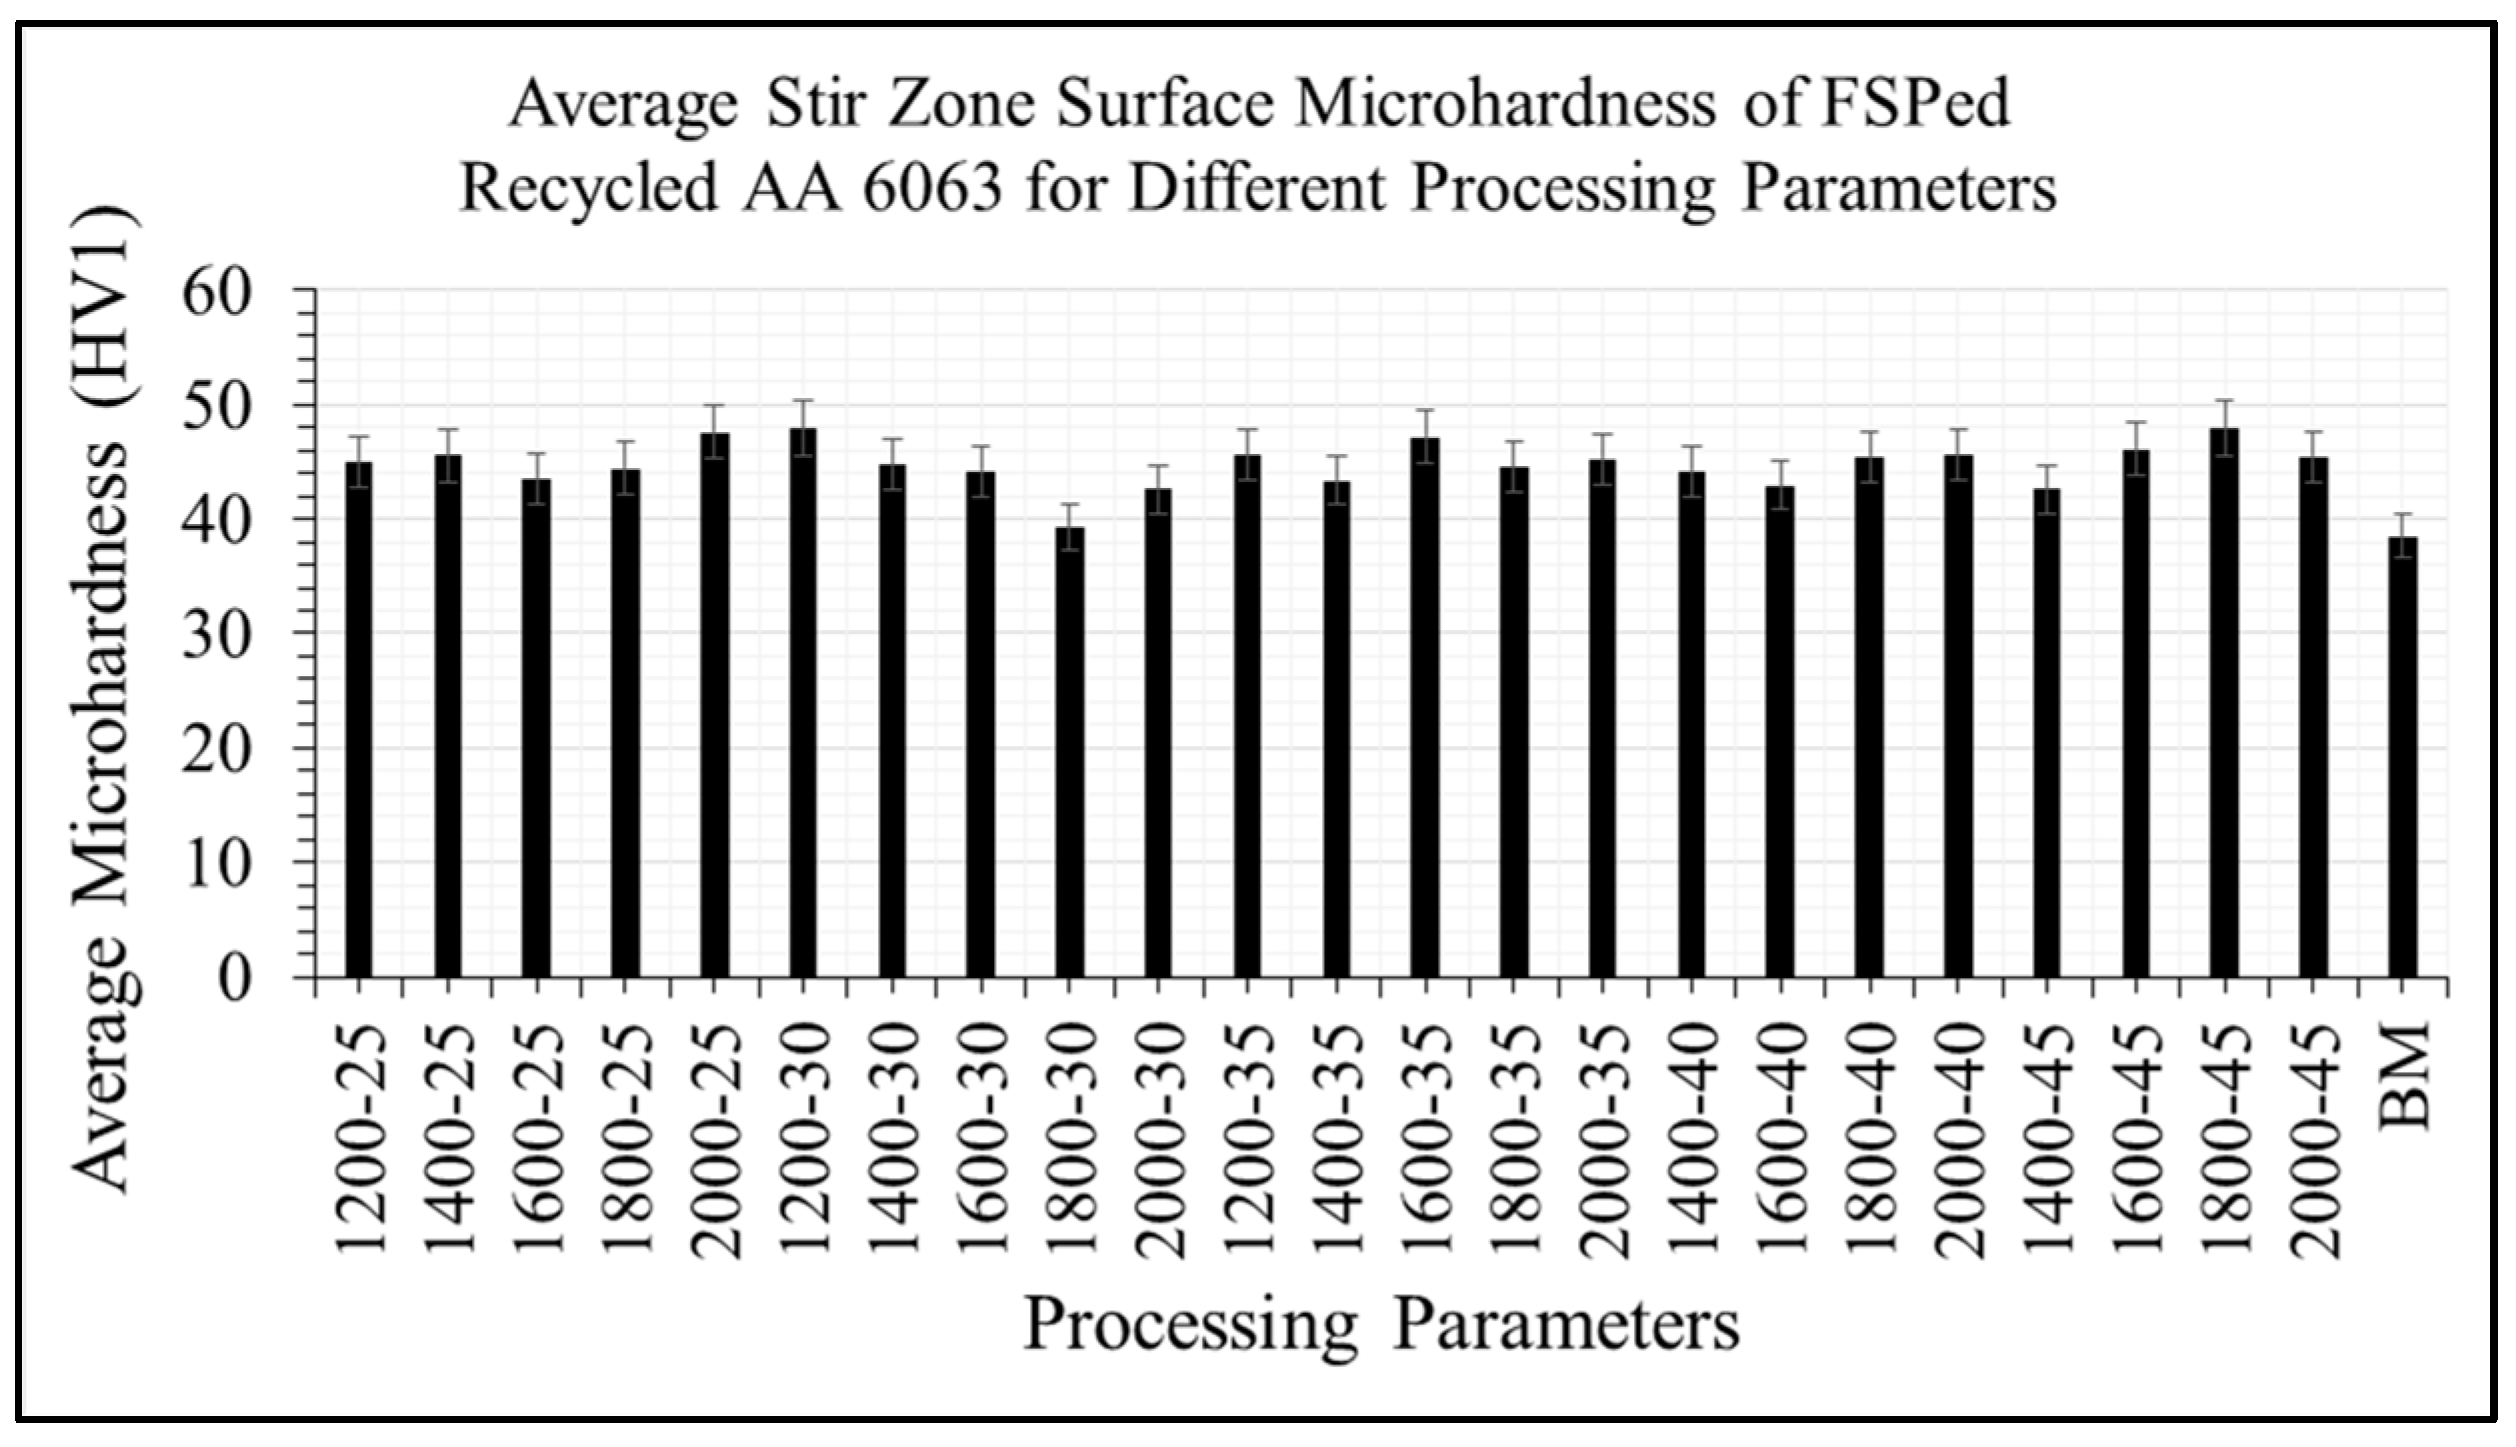
3.2. Microhardness Measurement

Figure 9 shows the average microhardness of all the FSPed samples and BM at the stir zone. The surface microhardness of recycled aluminum alloy BM is 38.5 HV1 and all the FSPed samples experienced an enhancement in surface hardness. Besides, the sample produced at 1200 rpm and 30 mm/min (Sample 2) has the highest hardness, 48 HV1 while the sample produced at 1800 rpm and 30 mm/min (Sample 15) has the lowest enhancement in the hardness of 39.34 HV1. FSP has successfully enhanced the material surface hardness up to 25%. According to M.K. Mishra et al. [29] who studied friction stir processed 2507 super duplex stainless steel, enhancement in microhardness of FSPed material is due to the occurrence of grain refinement. S. Chainarong et al. and R.A. Behnagh et al. [30,31] also made the same observation of grain refinement induced enhancement in the hardness of FSPed aluminum alloy. The grain size measurement in Table 3 shows that the stir zones experience a significant reduction in grain size. Besides, Sample 2, which was produced at 1200 rpm and 30 mm/min, has the highest hardness among all the samples and it also has the smallest grain size. Besides, Sample 7, 8, and 15 show a consistent trend that larger grain size led to lower surface hardness. Hence, this work echoes past findings that grain refinement is the cause of enhanced microhardness.

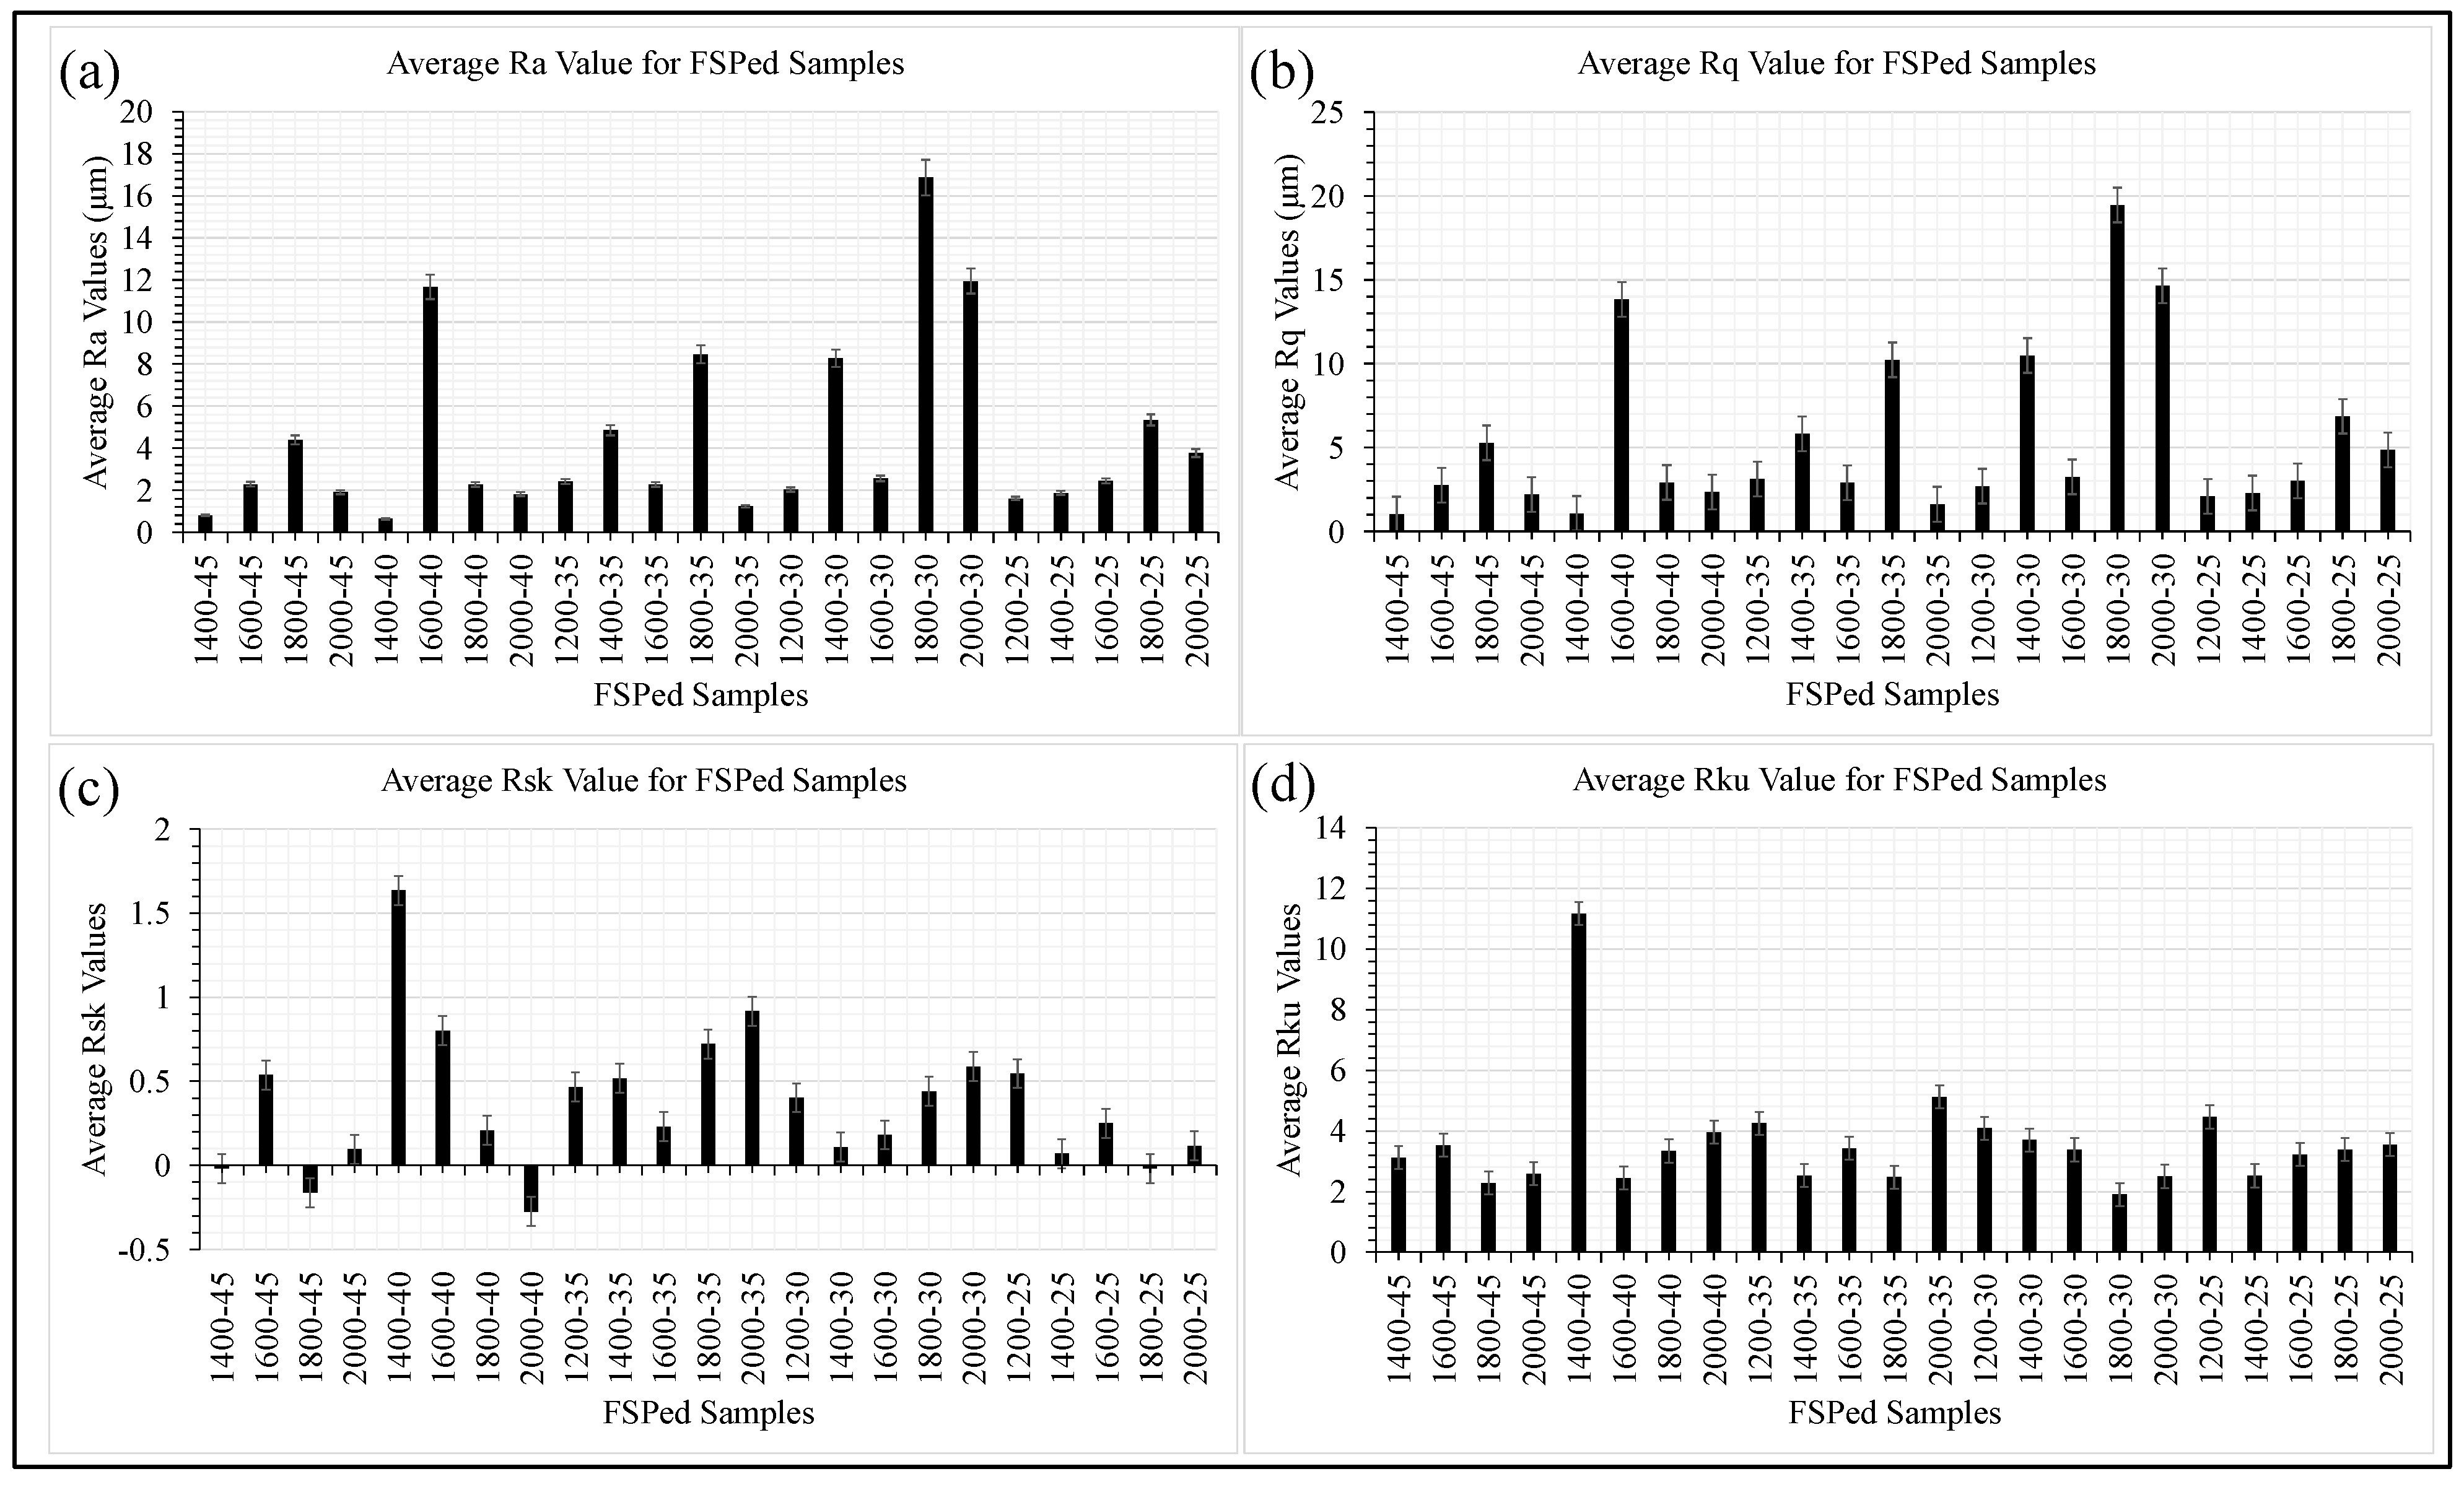
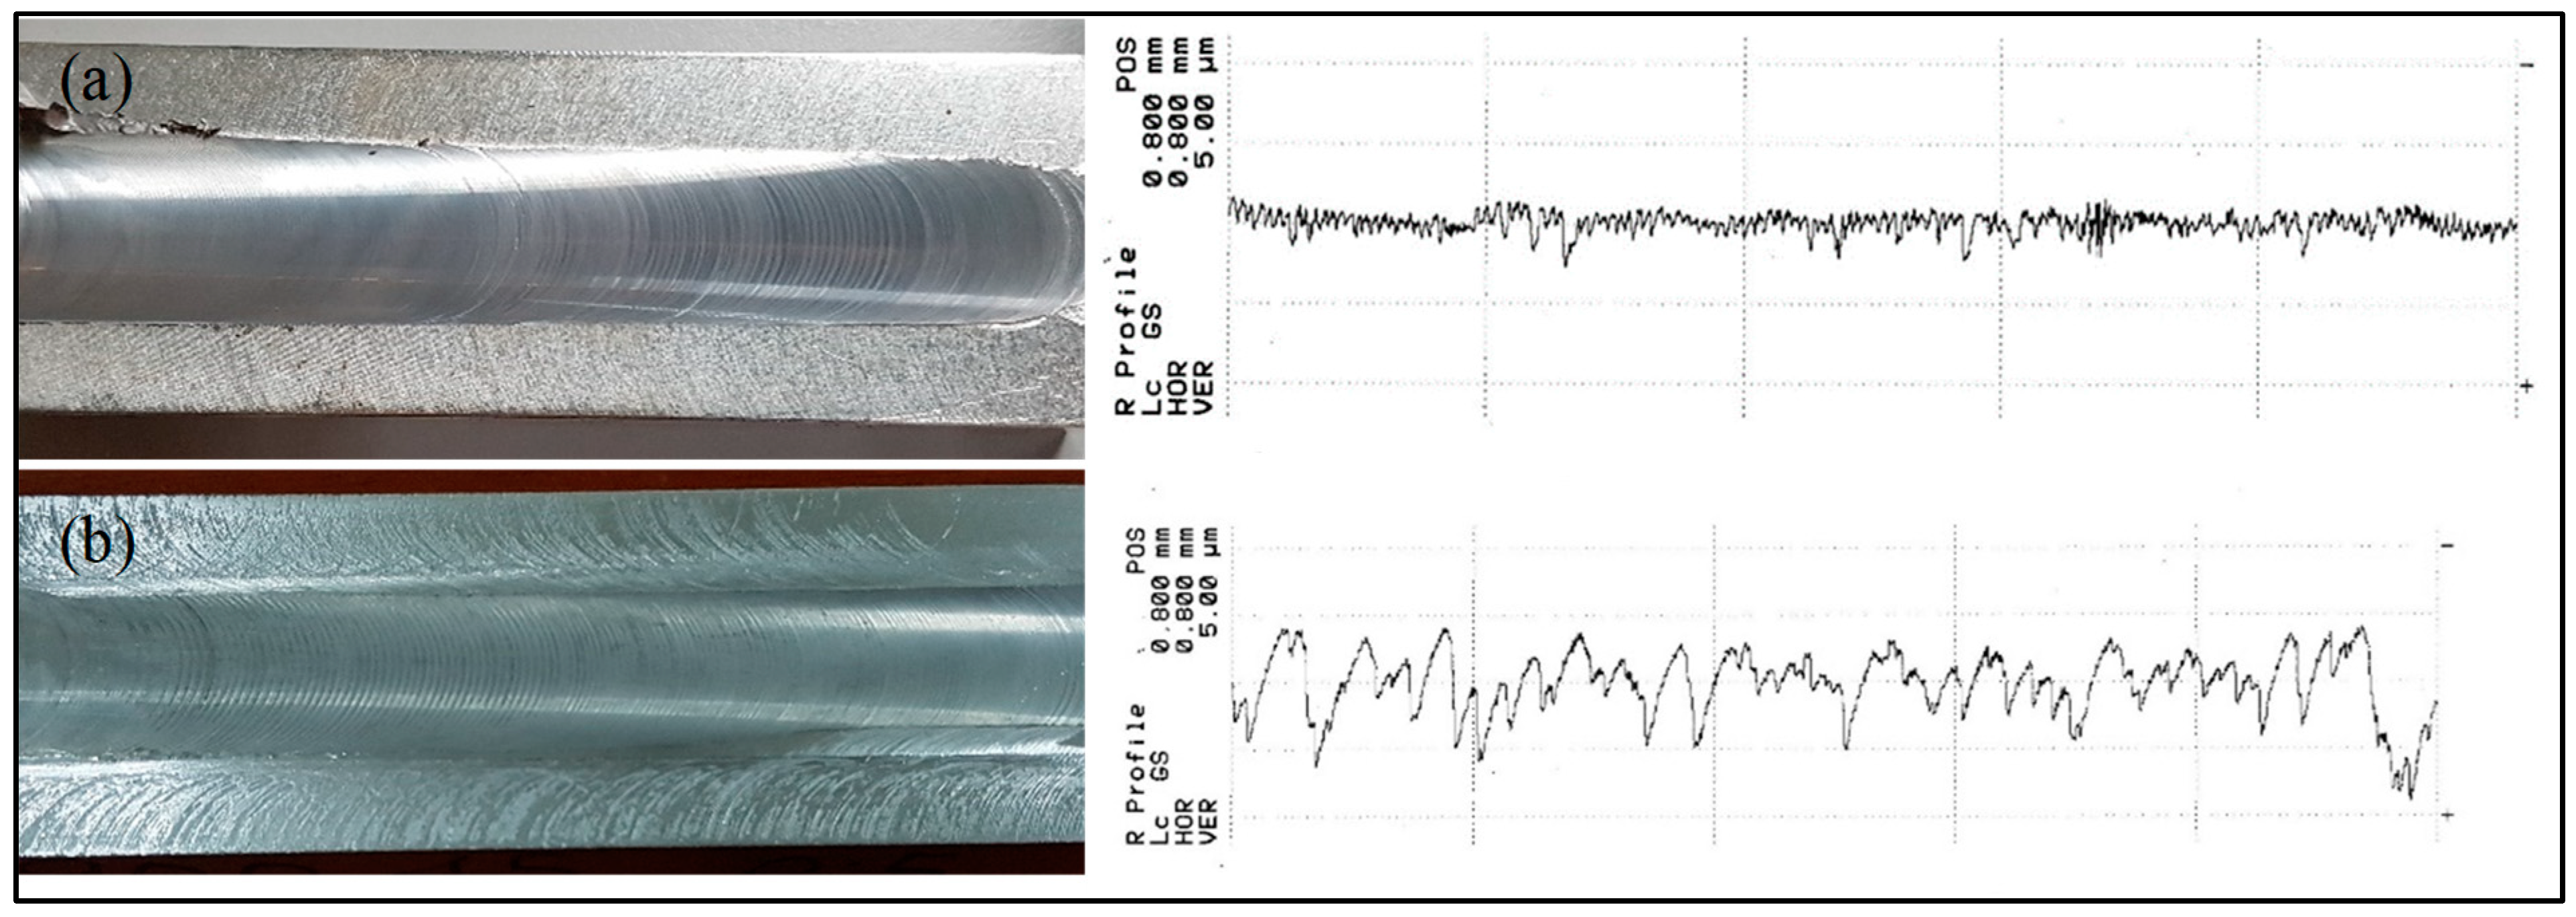
3.3. Surface Roughness Measurement

The surface roughness of all the samples listed in Table 2 was measured and presented in Figure 10. The effects of FSP feed rates on the surface roughness have been observed. The arithmetic roughness average of the surface, Ra, and the root mean square of the surface roughness, Rq, for rotational speed of 1200 rpm increased when the feed rate increased. On the other hand, for the speed of 1400 rpm, 1800 rpm, and 2000 rpm, the highest surface roughness values occurred at the feed rate of 30 mm/min and the lowest values occurred at 40 mm/min. However, the highest roughness value for 1600 rpm occurred at 40 mm/min and the lowest at 45 mm/min. The effect of rotational speed on the surface roughness was examined. At the constant feed rate of 25 mm/min, 30 mm/min, 35 mm/min, and 45 mm/min, the highest roughness values occurred at the rotational speed of 1800 rpm. Meanwhile, at a feed rate of 40 mm/min, the highest roughness value occurred at 1600 rpm. Figure 10a,b clearly points out that the FSPed surface with the highest roughness value was found on the sample produced at 1800 rpm and 30 mm/min (Sample 15) with an average Ra value of 16.87 μm and Rq values of 19.4665 μm. On the other hand, the surface with the smallest roughness values was produced at 1400 rpm and 40 mm/min (Sample 7) with an average Ra of 0.6428 μm and average Rq value of 1.0696 μm.
Figure 11 shows samples of the FSPed surface and their corresponding roughness profiles. Figure 11b shows the obvious onion ring that resulted in higher Ra and Rq values of the FSPed surface and this can be justified by the roughness profile shown in Figure 11b. On the other hand, the roughness profile of the sample produced at 1400 rpm and 40 mm/min as shown in Figure 11a has smaller Ra and Rq values and this can also be observed from its roughness profile as shown in Figure 11a.
To further characterize the FSPed surface roughness, the skewness, Rsk, and kurtosis, Rku, values were also referred to. Based on the measurements, most of the Rsk values for the samples produced using different processing parameters listed in Table 2 range from −0.3 to 0.8. and their corresponding Rku values range from 2 to 5. The only sample with an Rsk value less than 0 (i.e., −0.16) and Rku value less than 3 (i.e., 2.25) is the sample produced at 1800 rpm with 45 mm/min (Sample 18). However, its Ra and Rq are slightly larger at 4 μm and 5 μm, respectively. Hence, this FSPed surface can be considered as a smooth surface. None of the other samples exhibited an Rsk value that is less than zero and an Rku value less than 3, simultaneously. Hence, all the other FSPed surfaces are considered rough surfaces.

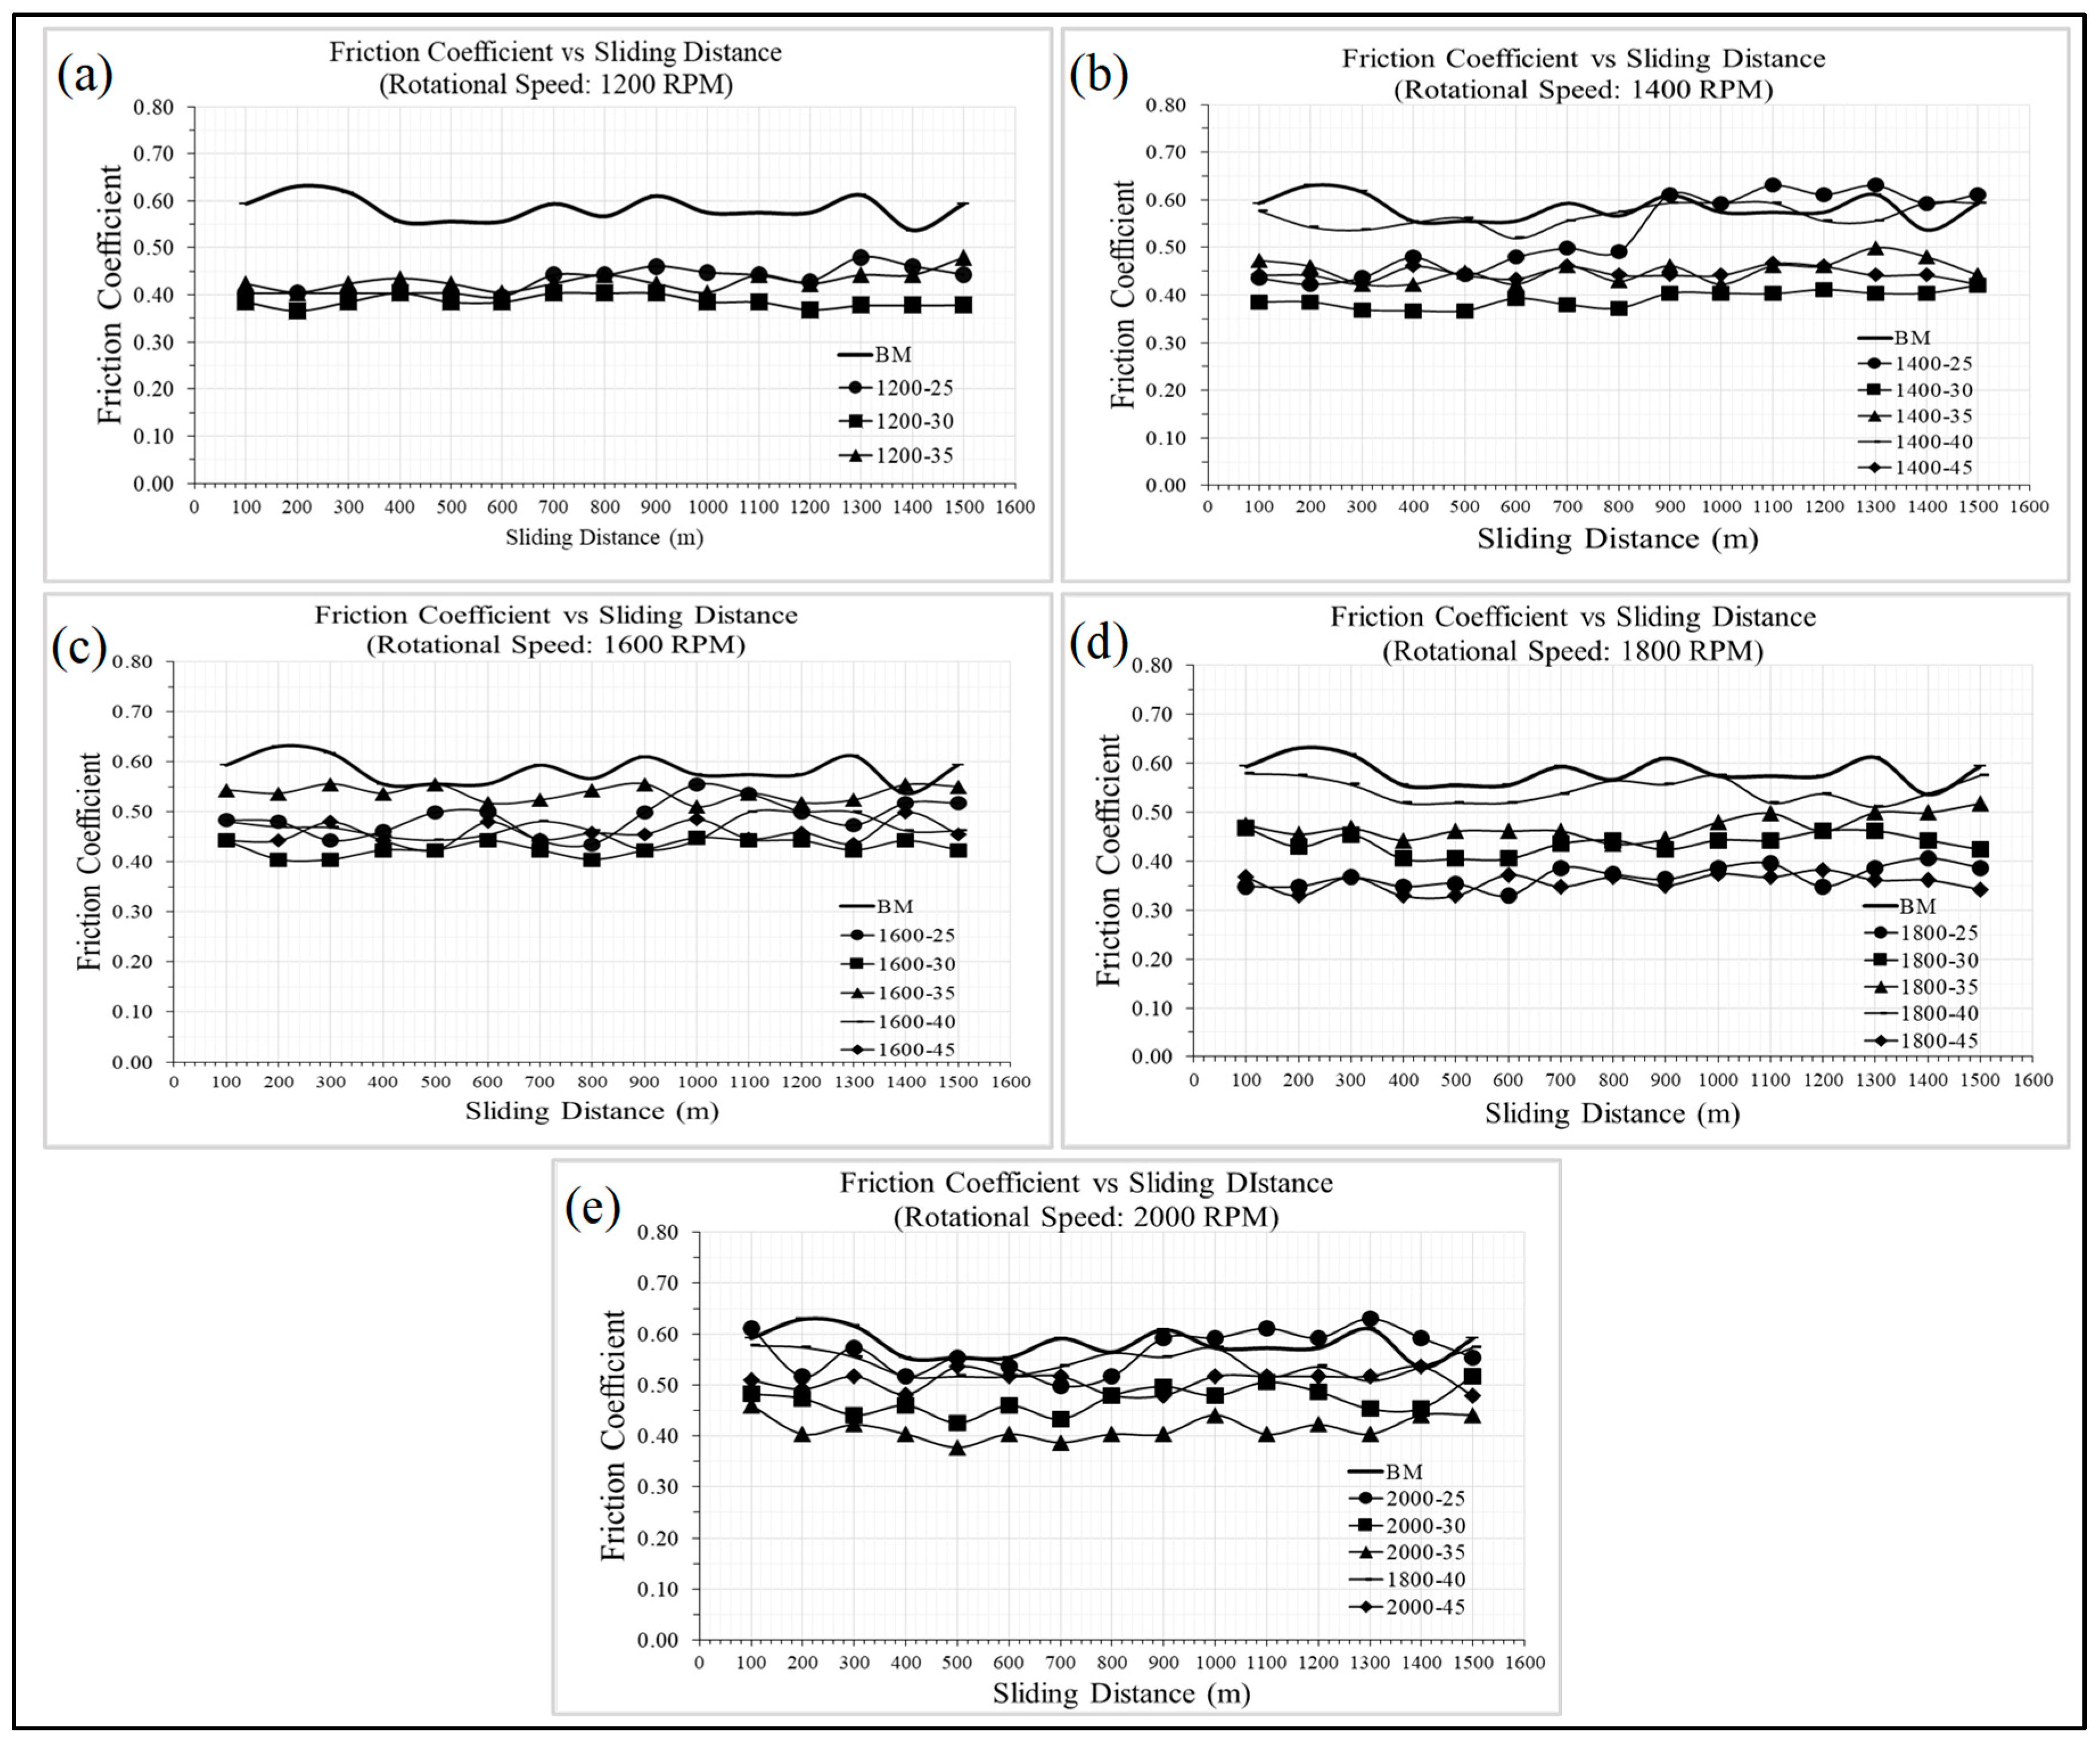
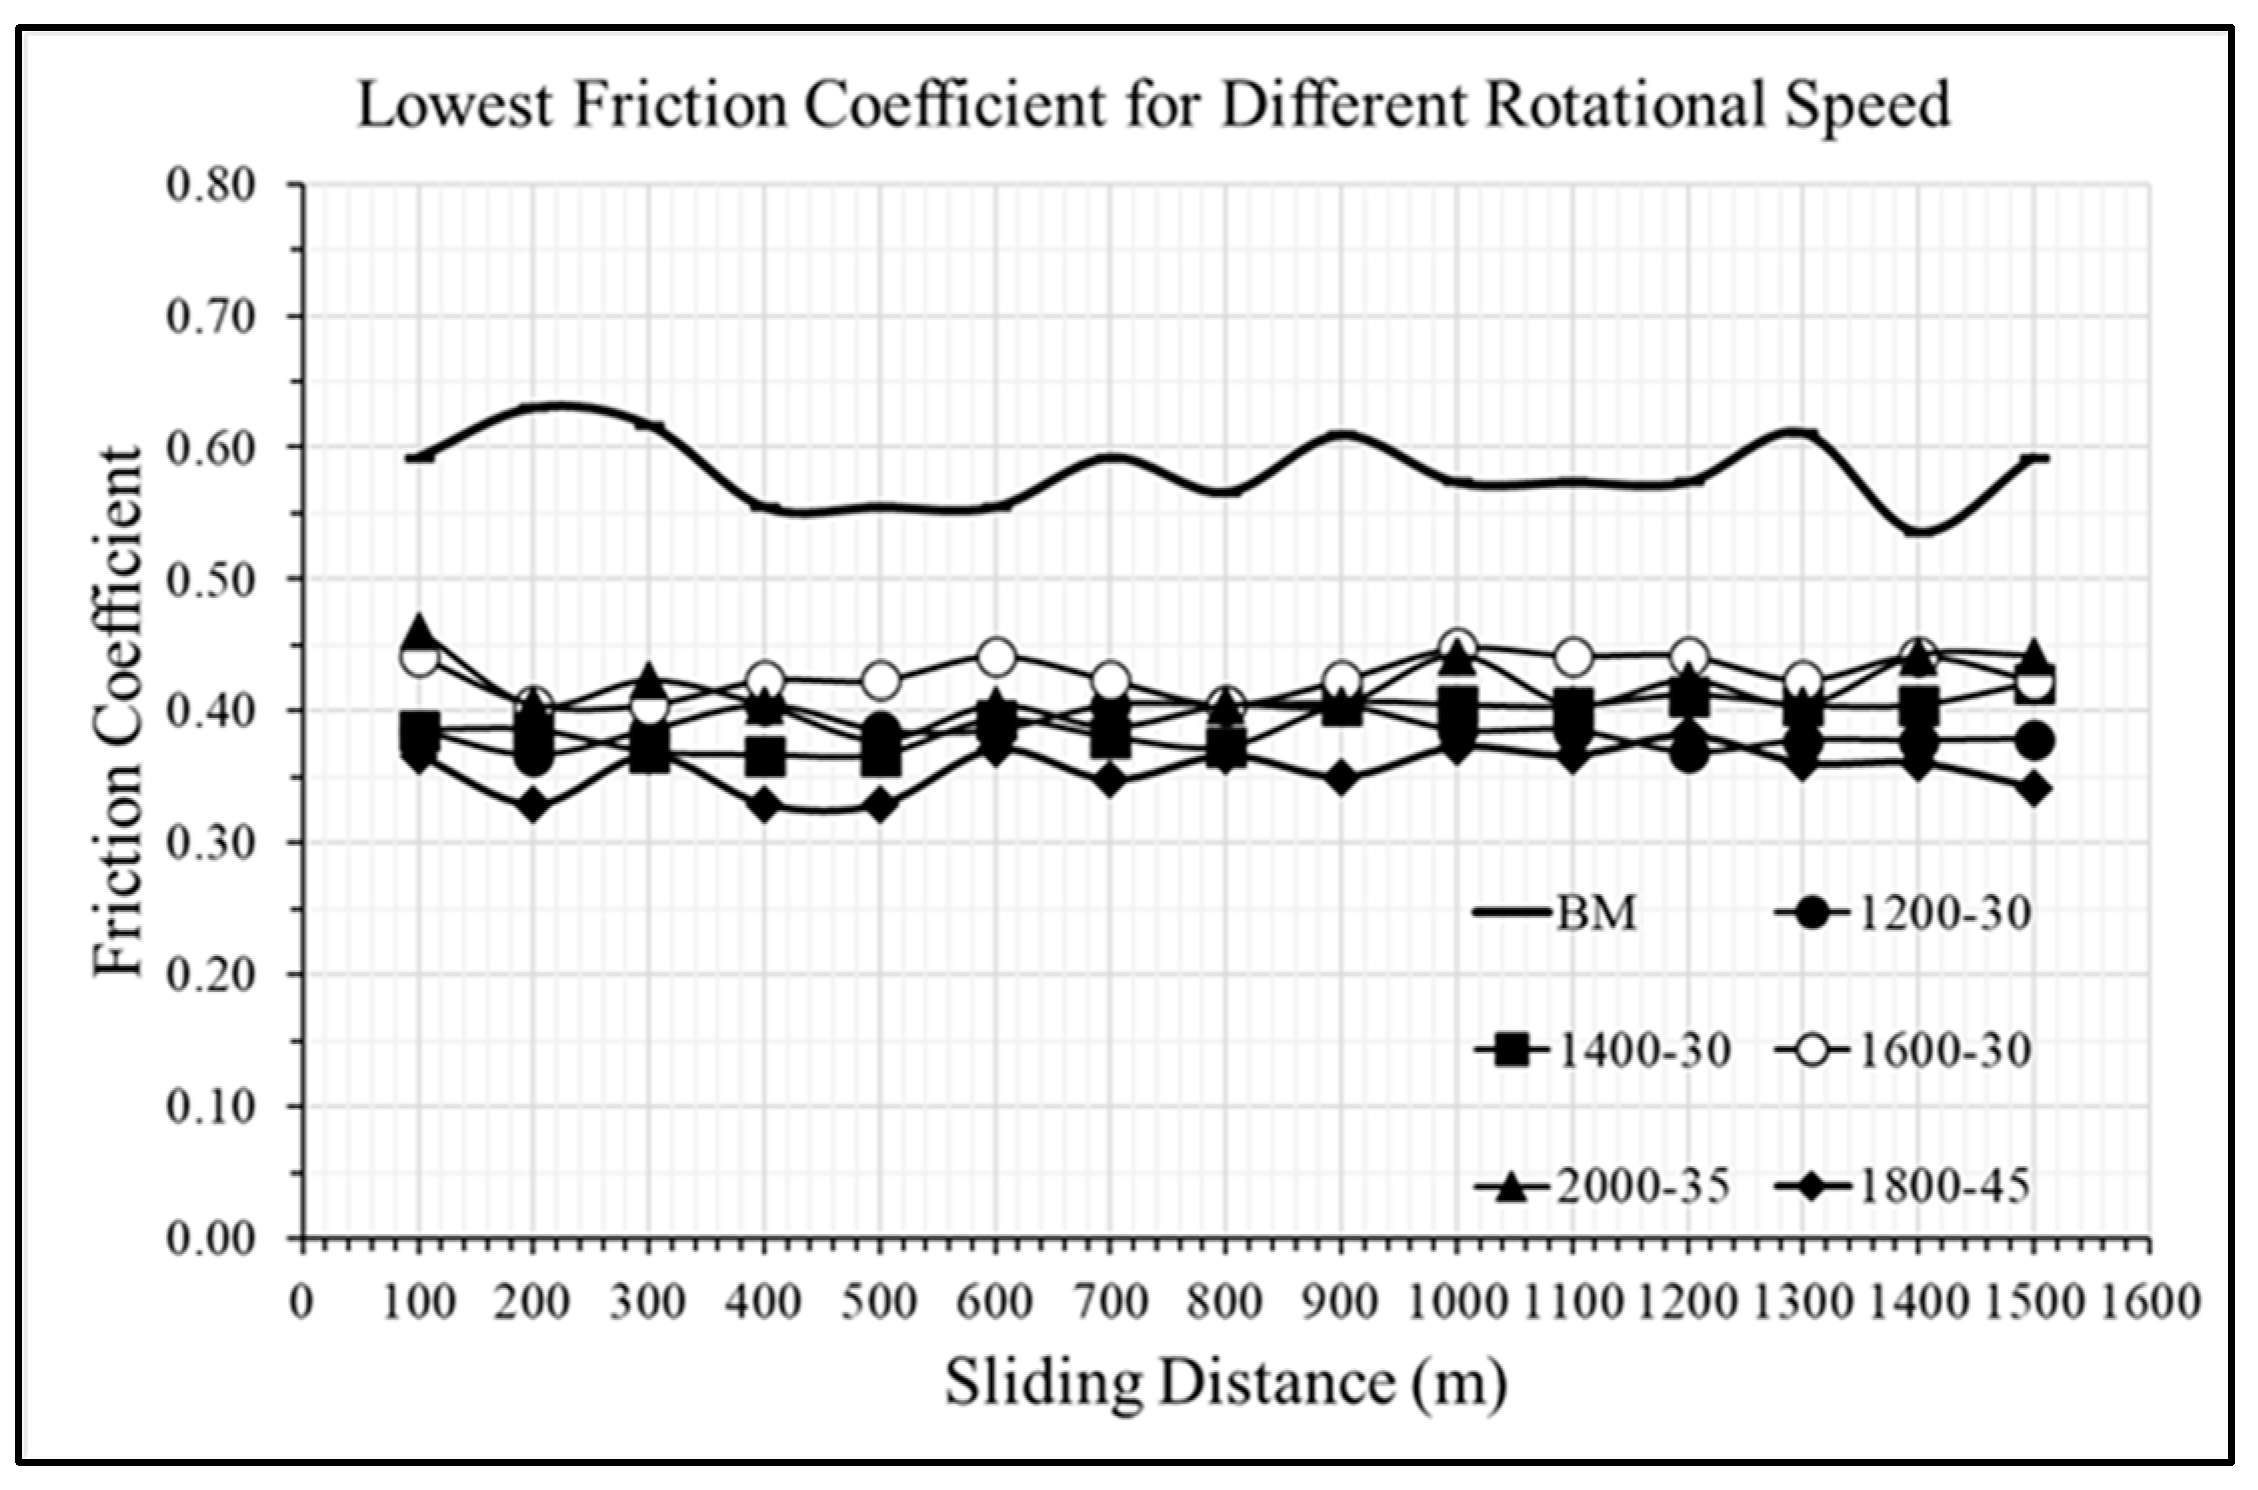
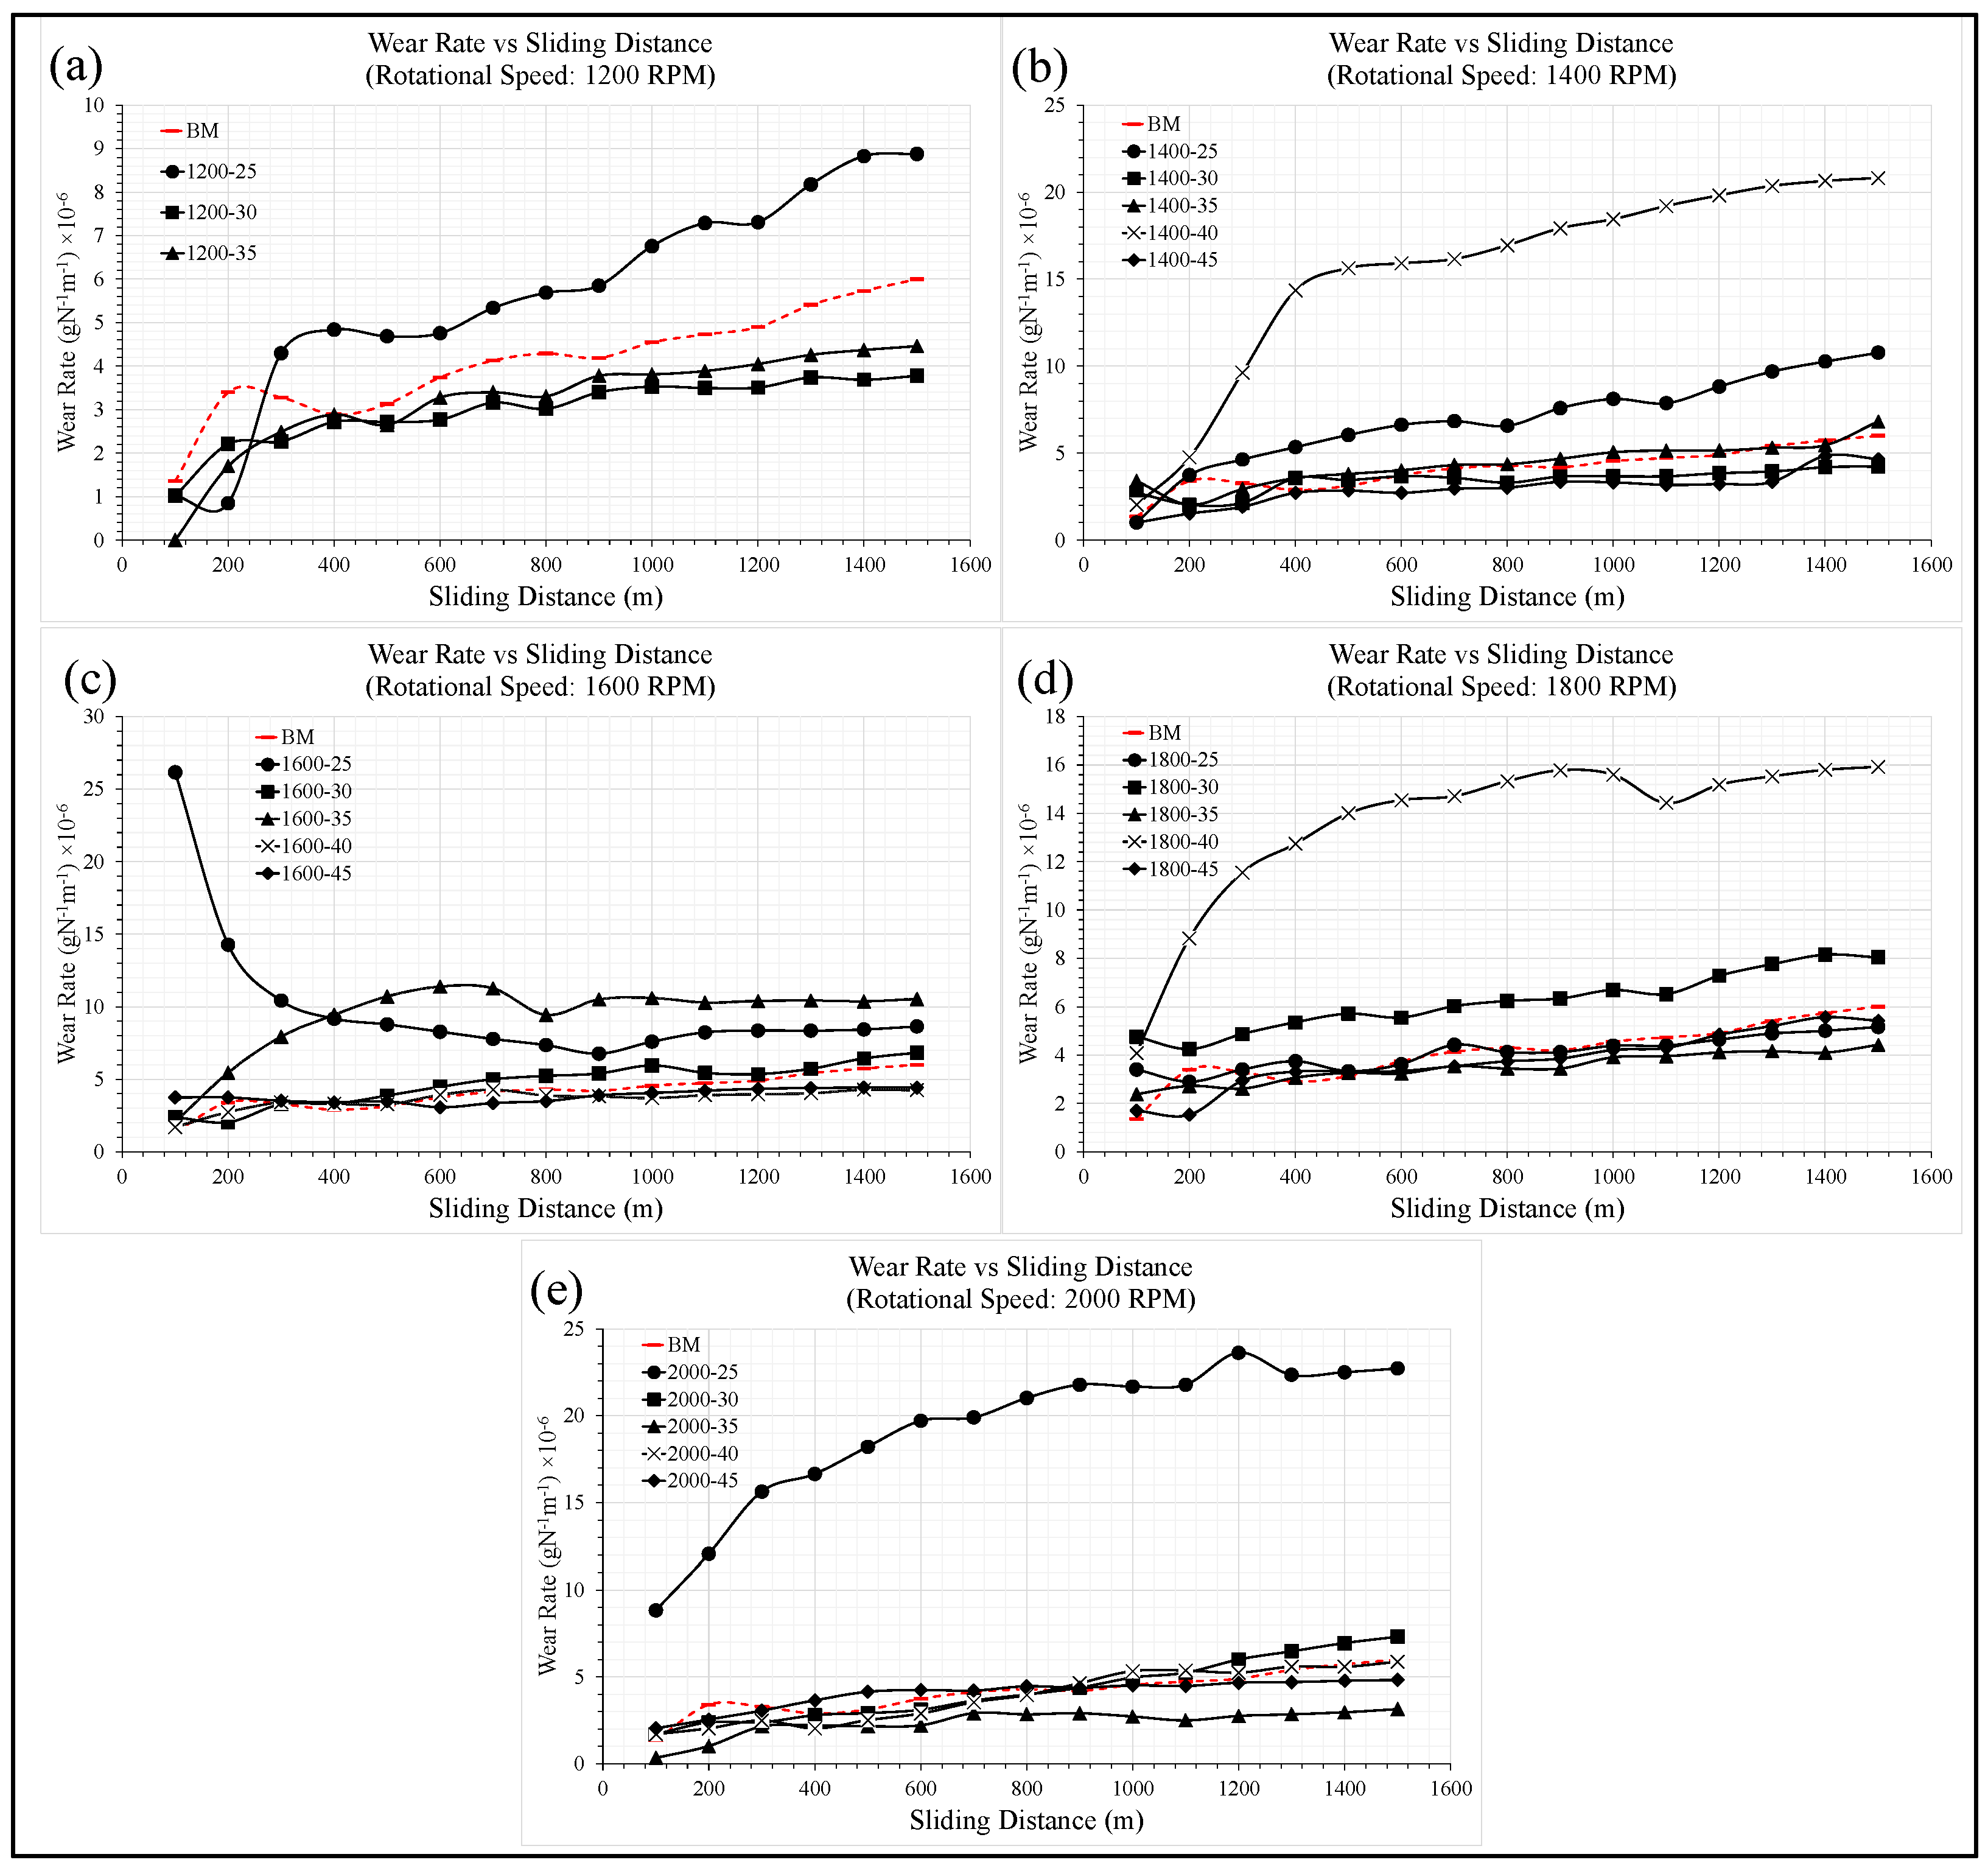
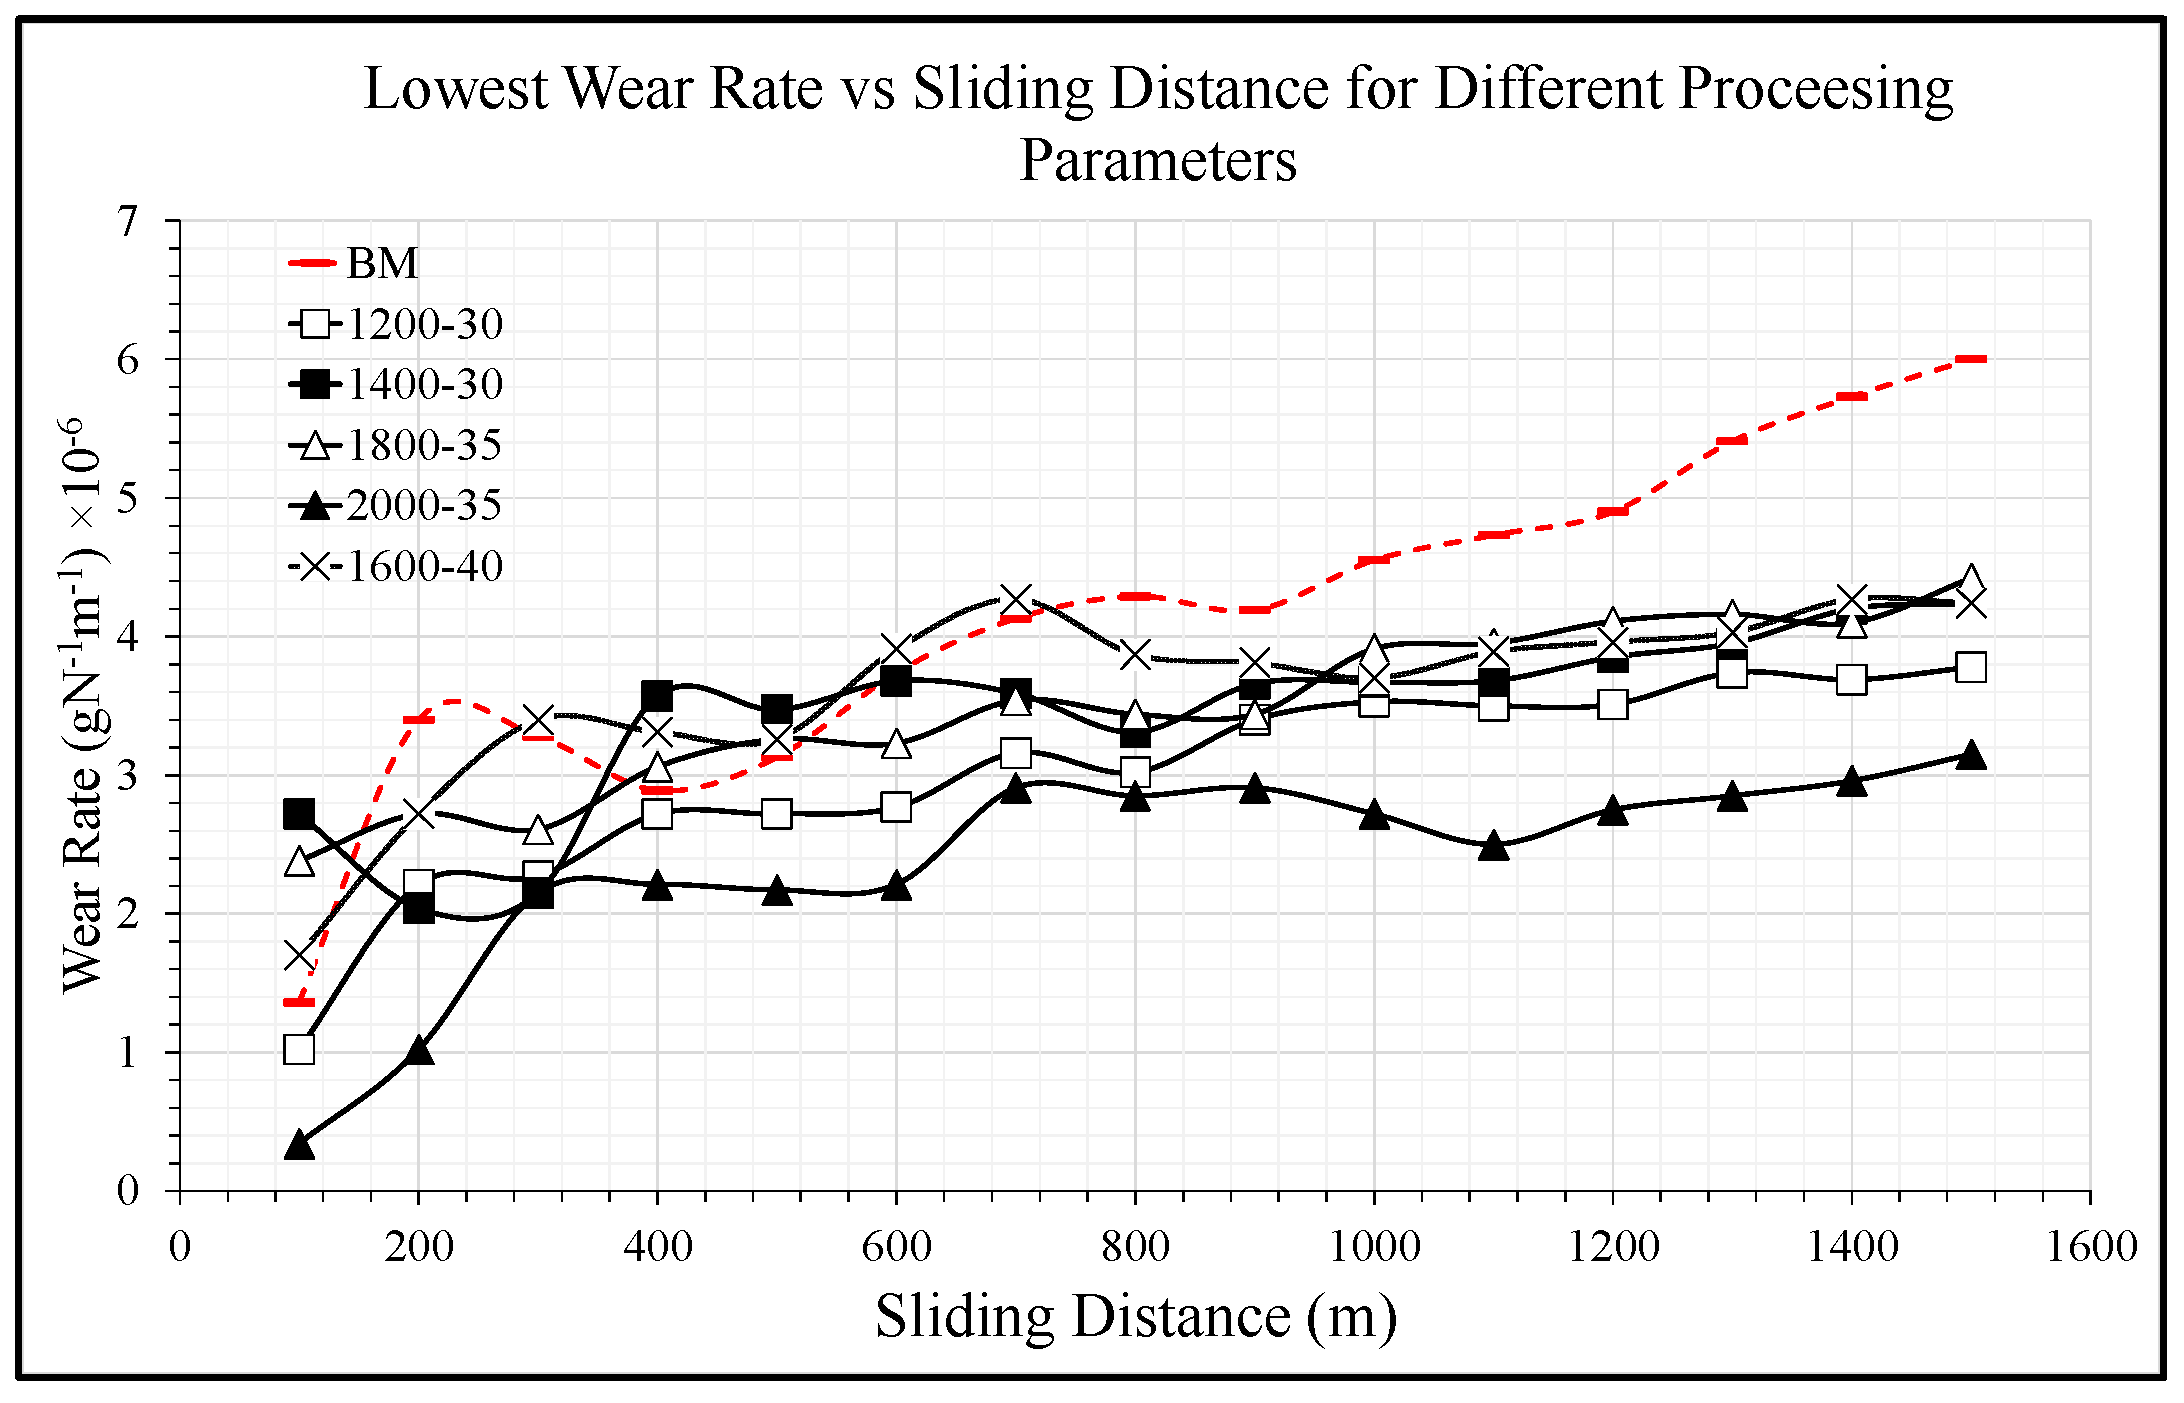
3.4. Tribological Performance

The wear rate and friction coefficient of all the FSPed samples were measured. Figure 12 shows the results of the friction coefficient of FSPed samples compared with raw recycled AA 6063. The results show that all the FSPed samples have lower friction than raw recycled AA 6063. Figure 12a–c show that the smallest friction was achieved at a feed rate of 30 mm/min, and their values are 0.387 (Sample 2), 0.392 (Sample 5), and 0.427 (Sample 10) for samples produced at rotational speeds of 1200 rpm, 1400 rpm, and 1600 rpm, respectively. Minimizing friction seems to require a higher feed rate at higher rotational speed, as samples produced at 1800 rpm and 45 mm/min (Sample 18), and 2000 rpm and 35 mm/min (Sample 21) were the ones yielding the lowest coefficients of friction of 0.356 and 0.415. The friction coefficients of samples with the smallest friction at different rotational speeds were plotted as shown in Figure 13. As discussed in Section 3.3, Sample 18 has a smooth surface and this coincides with the smallest friction coefficient among all the FSPed samples. Besides, this sample has the highest surface hardness among all the samples produced at 1800 rpm.
The second-lowest friction coefficient was achieved by FSPing at 1200 rpm with 30 mm/min (Sample 2). Other low friction samples that follow are those FSPed at 1400 rpm and 30 mm/min sample (Sample 5), 2000 rpm and 35 mm/min sample (Sample 21), and 1600 rpm and 30 mm/min (Sample 10). It is worth noting that Sample 2 also has the highest hardness among all the samples. The findings in this work align well with previous work. According to Y. Zhou et al. and B. Ivkovic et al. [32,33], a smooth surface resulted in a lower friction coefficient. D. Stamenkovic et al. [34] also reported that higher hardness led to a smaller friction coefficient. Hence, it can be concluded that the low friction coefficient of the workpiece surface is strongly correlated to both low surface roughness and high surface hardness.
Figure 14 and Figure 15 show the wear rate of all the FSPed samples in comparison with the wear rate of raw recycled AA 6063. Figure 14 shows that the lowest wear rate samples at each rotational speed are produced at 1200 rpm and 30 mm/min (Sample 2), 1400 rpm and 30 mm/min (Sample 5), 1600 rpm, and 40 mm/min (Sample 12), 1800 rpm and 35 mm/min (Sample 16) and 2000 rpm and 35 mm/min (Sample 21). Among these samples, Sample 21 has the smallest wear rate of 3.15 × 10⁻⁶ gN−1m−1, followed by Sample 2 of 3.78 × 10⁻⁶ gN−1m−1, Sample 5 and Sample 12 of 4.24 × 10⁻⁶ gN−1m−1, and Sample 16 of 4.42 × 10⁻⁶ gN−1m−1. Besides, all these samples have smaller wear rates than the raw recycled AA 6063 of 6 × 10⁻⁶ gN−1m−1. Sample 21, Sample 2, and Sample 5 have small wear rates as they also have smaller friction coefficients than many other samples. Besides, they also have high and moderately high hardness. Hence, the enhancement in wear resistance has resulted from the enhancement in microhardness and reduction in friction of the sample [5,28]. However, it can be observed that some FSPed samples have higher wear rates than the base metal and this may be due to the existence of third body abrasive wear during the test. Both adhesive and abrasive wear can be observed on the worn surfaces of all the FSPed samples especially those samples with higher wear rates. Figure 16 and Figure 17 show the worn surfaces of the BM and all the FSPed samples.
Figure 16 and Figure 17 show that the samples with the smallest wear rates mostly have adhesive wear and plastic deformation, and little material loss can be observed from the worn surface from Figure 17b,e,l,p,u. Besides, the abrasive wear coinciding with higher wear rates can be observed in the form of fractures, voids, which indicate significant material loss during the sliding test. The larger the wear rate, the more abrasive wear can be observed from Figure 16 and Figure 17a,d,g,i–k,o,q,s,t. Besides, both adhesive and abrasive wear can also be observed on the samples with moderate wear rates as shown in Figure 17c,f,h,m,n,r,v,w.
The main purpose of this work is to optimize the FSP processing parameters of recycled AA 6063 that simultaneously maximize microhardness and minimize surface roughness for the lowest friction coefficients and wear rate. Based on the results discussed above, it is difficult to pinpoint the best processing parameters. Hence, Figure 18 was plotted to have a clearer presentation of the friction and wear performance of the FSPed samples. Figure 18 shows that the sample produced at 1800 rpm and 25 mm/min or 45 mm/min has the smallest friction but they do not have the smallest wear rate. On the other hand, the sample produced at 2000 rpm and 35 mm/min has the smallest wear rate but it does not have the lowest friction. Besides, all these samples also do not have the highest surface microhardness. Figure 18 shows that the sample produced at 1200 rpm and 30 mm/min has the second-lowest friction coefficient and wear rate. Besides, this sample also produced the highest microhardness. Hence, the experimental results above show that 1200 rpm and 30 mm/min are the best processing parameters for the fabrication of FSPed recycled AA 6063 as they produced the highest hardness than other processing parameters and it also has a small wear rate and friction coefficient. In addition, it also has considerably low Ra and Rq values in its surface roughness.

4. Conclusions

The aim of this study was to determine the optimized processing parameters for the fabrication of FSPed recycled AA 6063 based on its surface hardness and tribological performance. The following conclusions can be drawn from this study:
  • Defect-free FSPed recycled AA 6063 was successfully produced using a CNC milling machine with the groove FSP method.
  • According to the surface hardness data, Sample 2 (1200 rpm and 130 mm/min) produced the highest average hardness value of 48 HV which was enhanced by 25% over the base metal hardness, which is 38.5 HV.
  • Microstructure inspection and the grain size measurement show that Sample 2 has a homogeneous grain structure and the smallest grain size that was refined by about 96%. It also has the highest hardness among the FSPed samples.
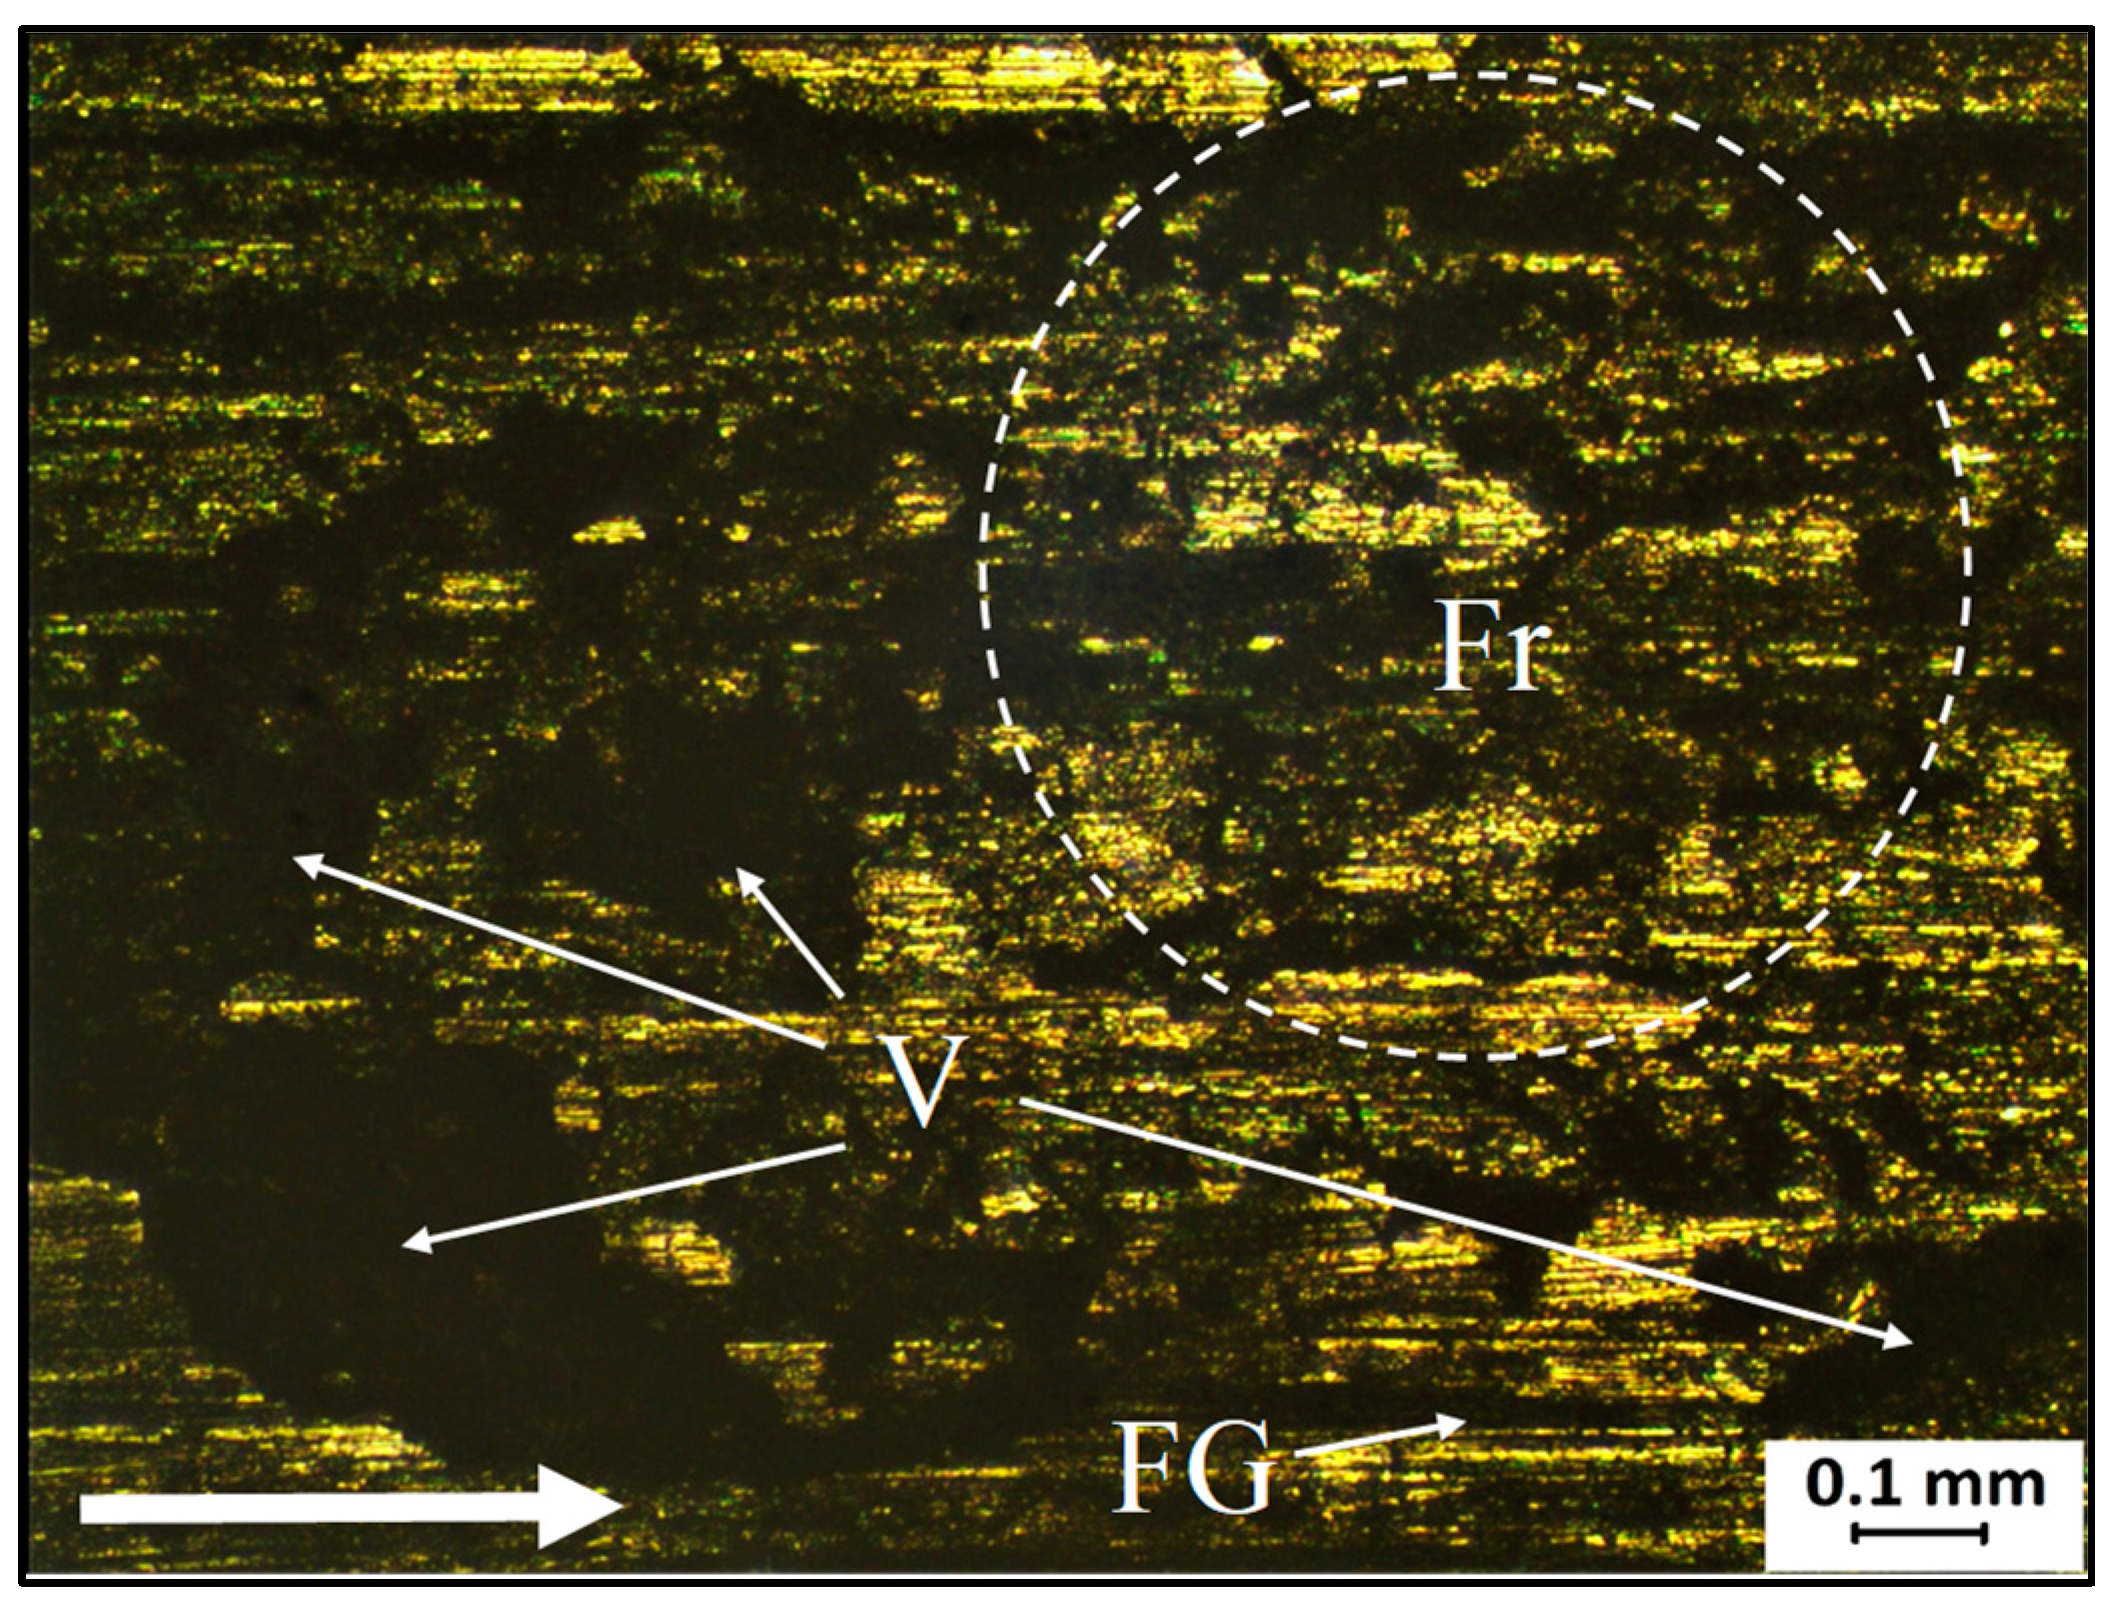
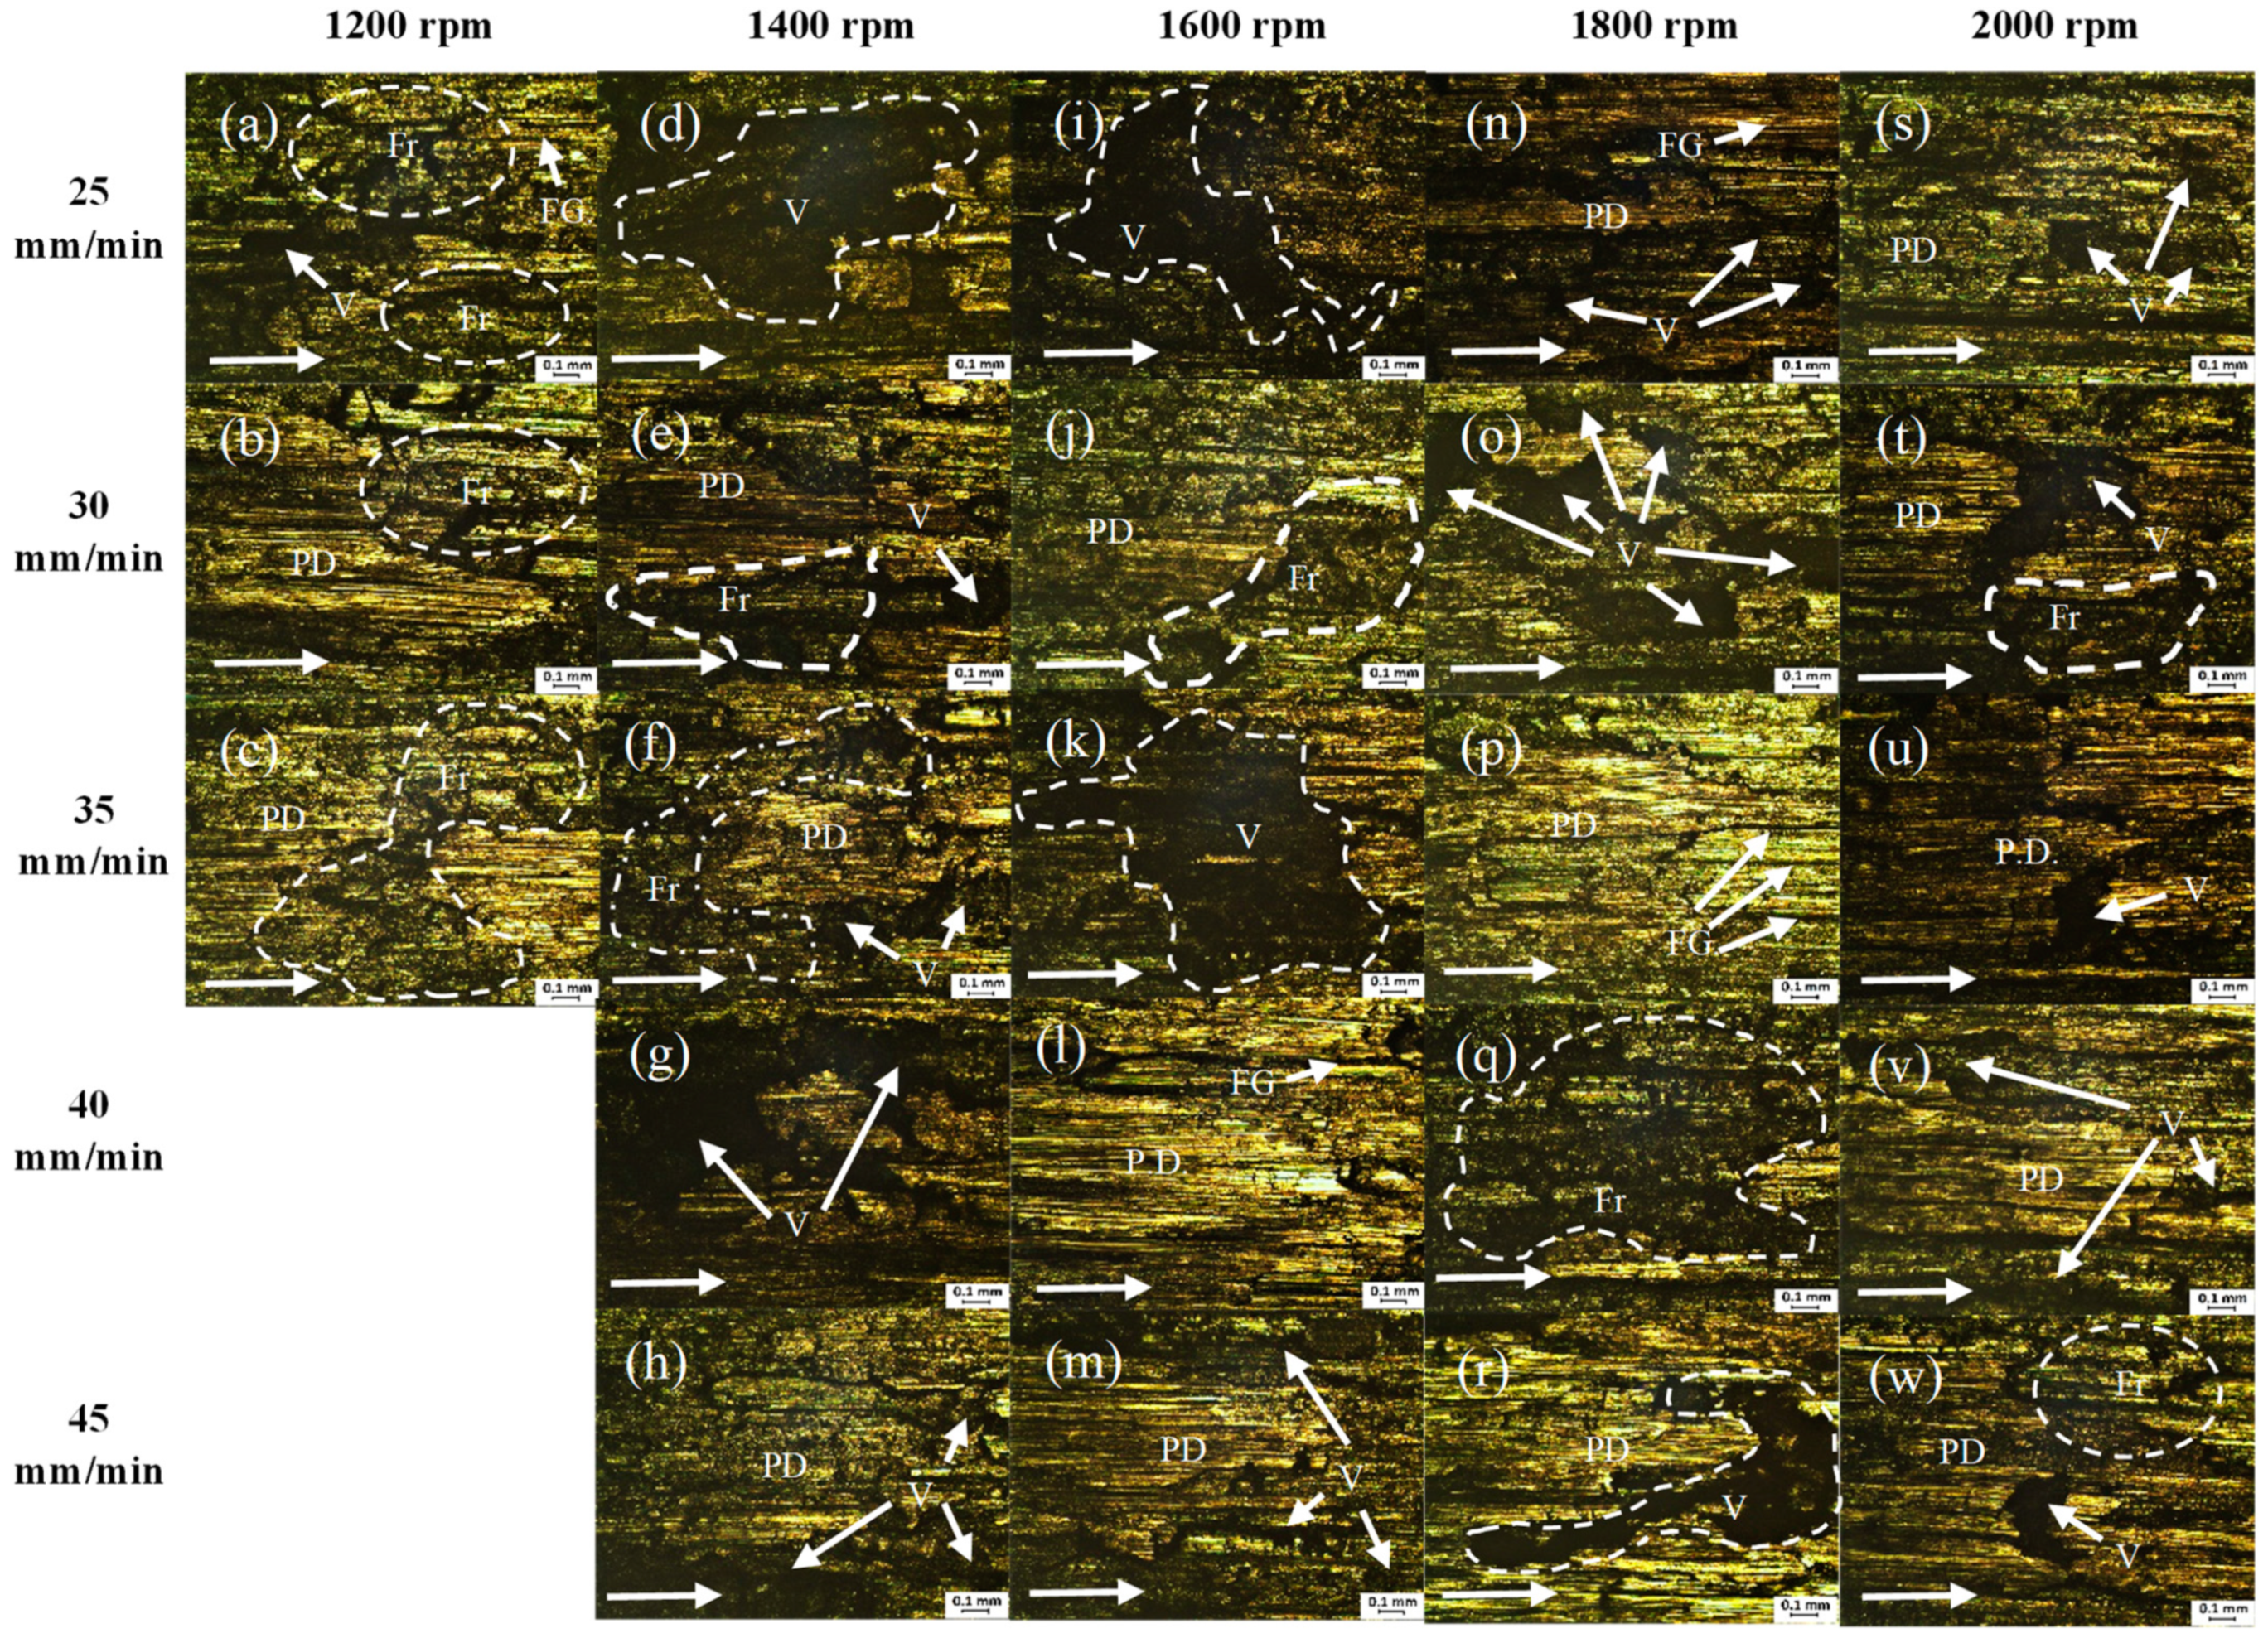
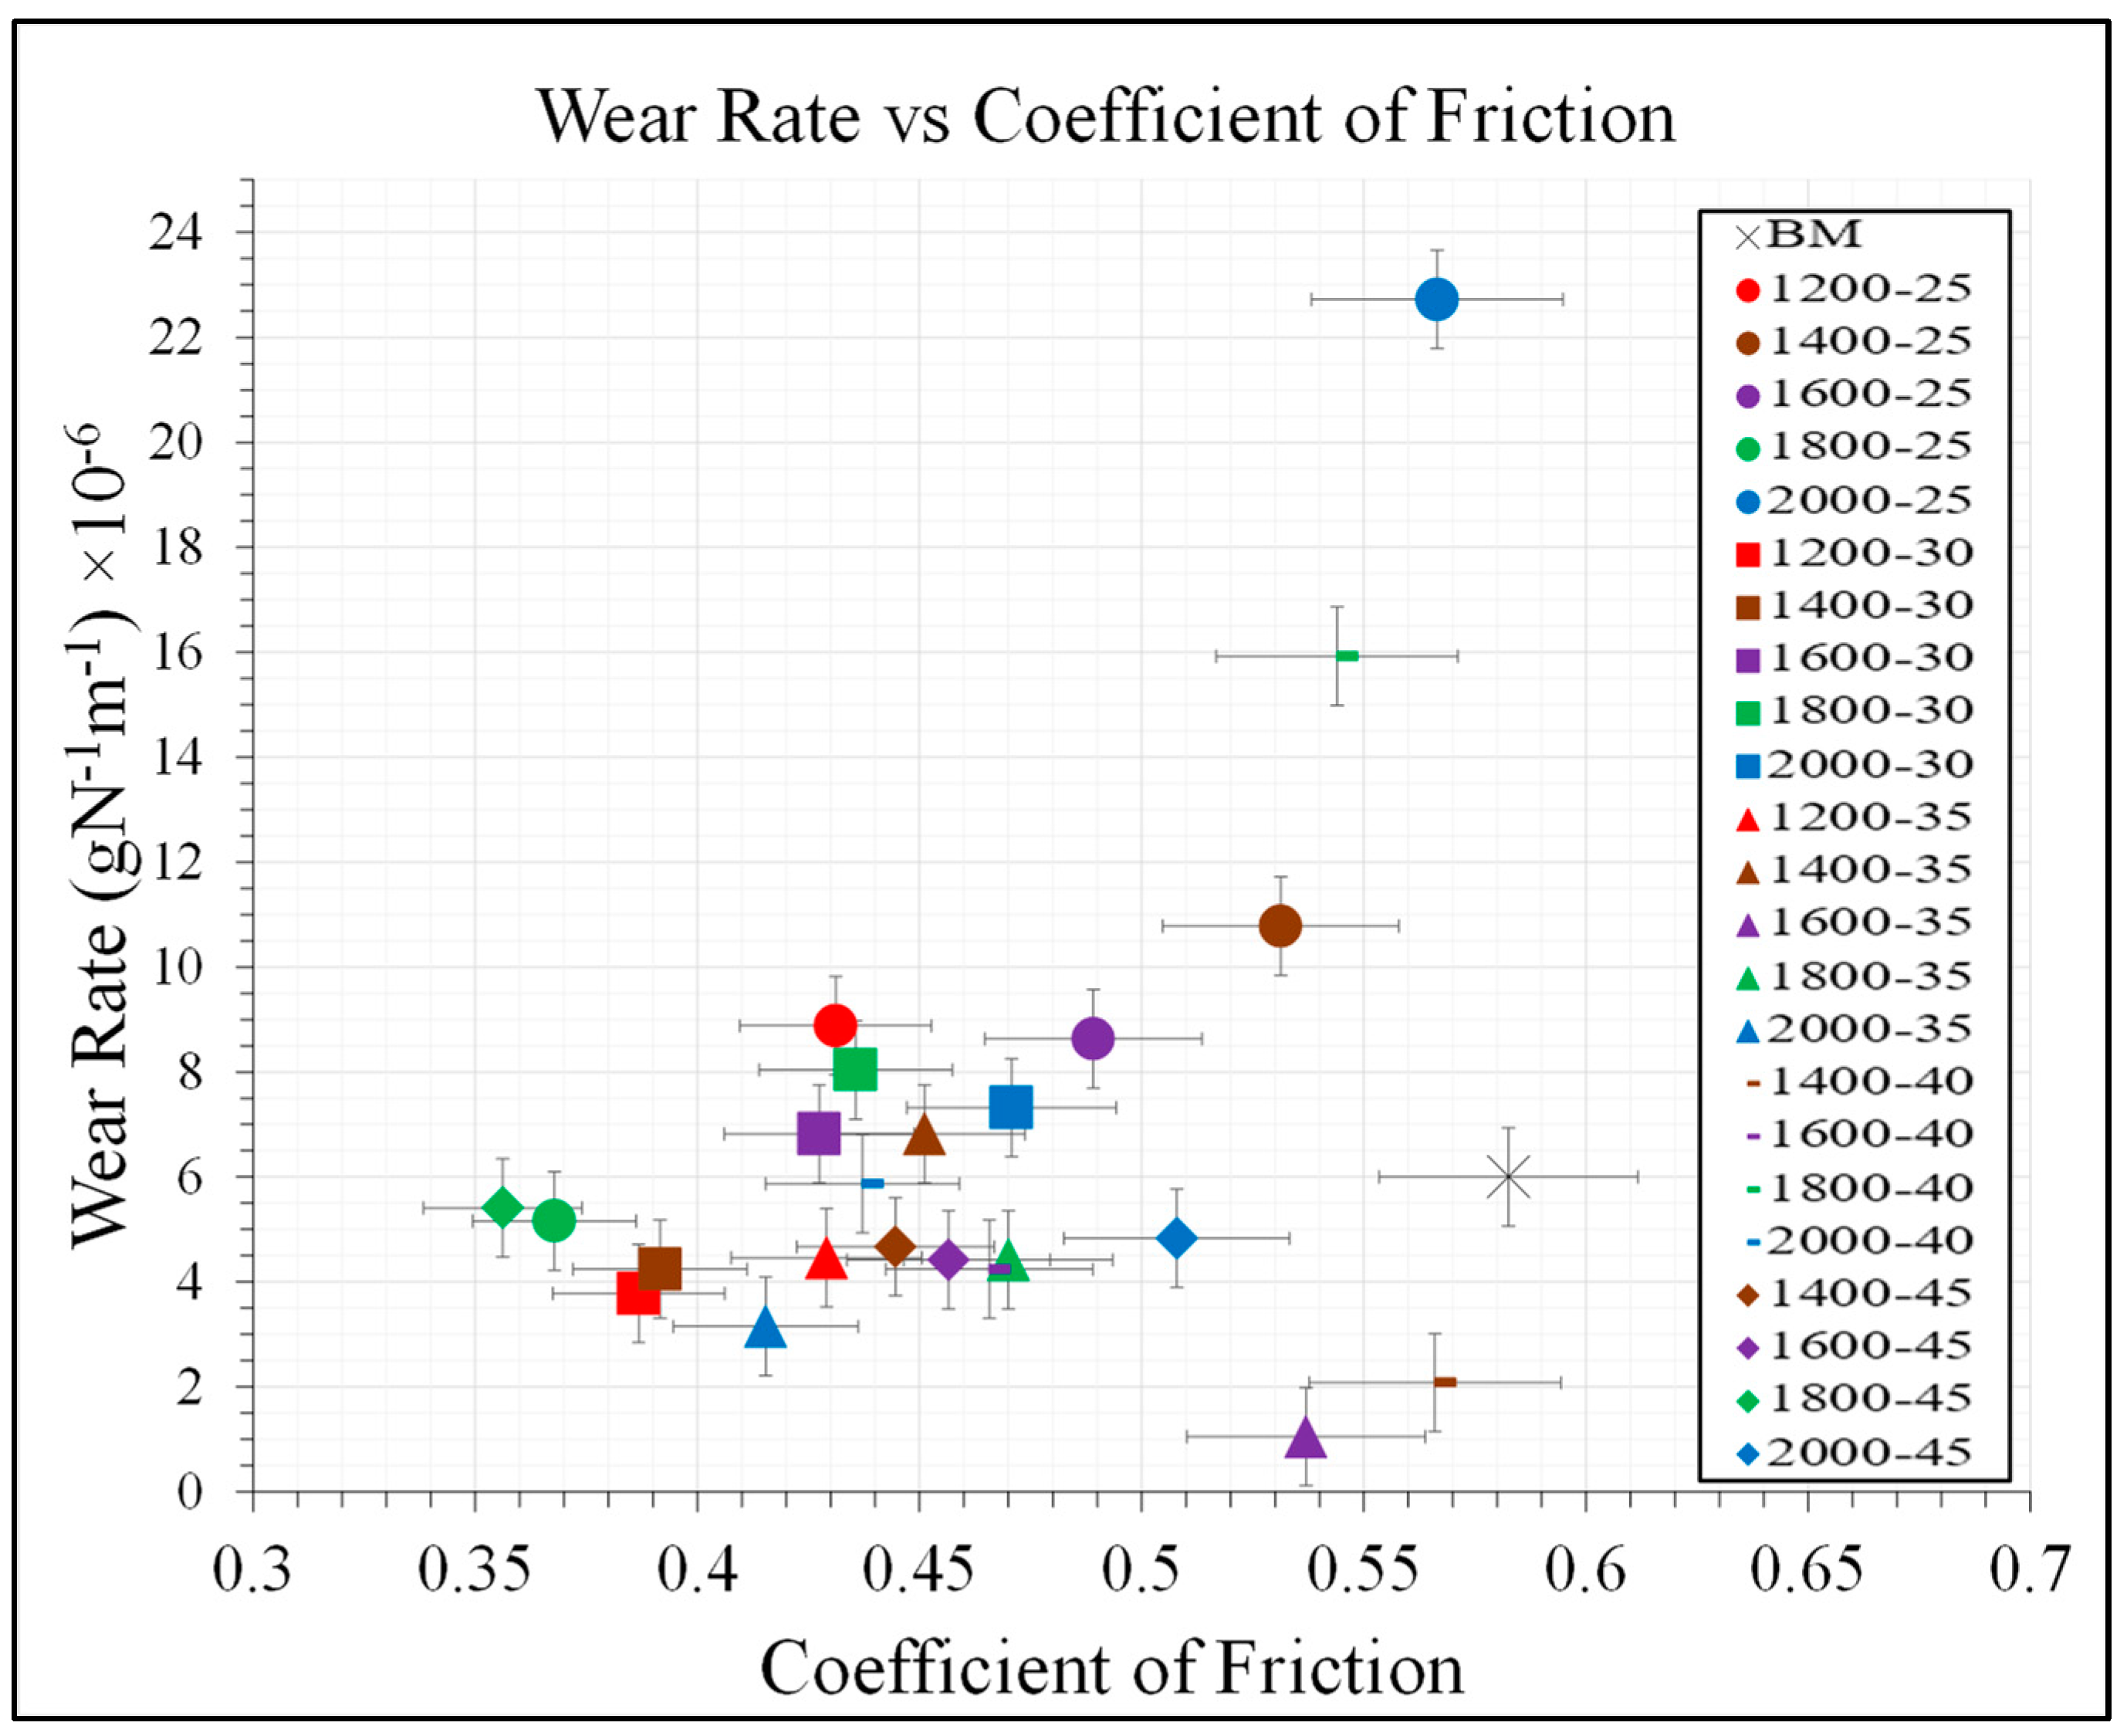
  • The friction and wear rate of Sample 2 is also considerably lower than other FSPed samples. Its wear resistance was enhanced by about 37% and its friction was reduced by 33%. Wear morphology shows that Sample 2 has mostly adhesive wear and only slight fractures
  • In all other samples, more fractures can be observed as the wear rate increases. Both adhesive wear and abrasive wear can be observed from the FSPed samples.
  • In a nutshell, the optimized processing parameters for FSPed recycled AA 6063 are a rotational speed of 1200 rpm and a feed rate of 30 mm/min.

Author Contributions

Conceptualization, K.W.L. and G.S.T.; Methodology, K.W.L. and G.S.T.; Formal analysis, K.W.L. and G.S.T.; Investigation, K.W.L., G.S.T. and C.K.K.; Resources, K.W.L.; Data curation, G.S.T.; Writing—original draft preparation, K.W.L. and G.S.T.; Writing—review and editing, K.W.L., C.K.K. and G.S.T.; Supervision, K.W.L.; Project administration, K.W.L.; Funding acquisition, K.W.L. and C.K.K. All authors have read and agreed to the published version of the manuscript.

Funding

This research was funded by Fundamental Research Grant Scheme, [FRGS/1/2019/TK03/MMU/02/6].

Institutional Review Board Statement

Not applicable.

Informed Consent Statement

Not applicable.

Data Availability Statement

Data available on request.

Acknowledgments

This work was supported by the Fundamental Research Grant Scheme (FRGS), Ministry of Higher Education, Malaysia. The authors gratefully acknowledge EL Aluminium Billet Sdn. Bhd. and Impressive Edge Sdn. Bhd. for the technical and partial financial support rendered. Special thanks to the Faculty of Engineering and Technology of Multimedia University for their support in allowing this research to be carried out.

Conflicts of Interest

The authors declare no conflict of interest.

References

  1. Ozer, G.; Burgucu, S.; Marsoglu, M. A Study on the Recycling of Aluminum Alloy 7075 Scrap. Mater. Test. 2012, 54, 175–178. [Google Scholar] [CrossRef]
  2. Wallace, G. Production of secondary auminium. In Fundamentals of Aluminium Metallurgy: Production, Processing and Applications, 1st ed.; Roger, L., Ed.; Woodhead Publishing Limited: Sawston, UK, 2010; pp. 70–82. [Google Scholar]
  3. Gholami, S.; Emadoddin, E.; Tajally, M.; Borhani, E. Friction stir processing of 7075 Al alloy and subsequent aging treatment. Trans. Nonferrous Met. Soc. China 2015, 25, 2847–2855. [Google Scholar] [CrossRef]
  4. Wessel, J.K. The Handbook of Advanced Materials: Enabling New Design; John Wiley & Sons, Inc.: Toronto, ON, Canada, 2004. [Google Scholar]
  5. Amirafshar, A.; Pouraliakbar, H. Effect of Tool Pin Design on the Microstructural Evolutions and Tribological Characteristics of Friction Stir Processed Structural Steel. Meas. J. Int. Meas. Confed. 2015, 68, 111–116. [Google Scholar] [CrossRef]
  6. Karthikeyan, L.; Senthil Kumar, V.S. Relationship between Process Parameters and Mechanical Properties of Friction Stir Processed AA6063-T6 Aluminum Alloy. Mater. Des. 2011, 32, 3085–3091. [Google Scholar] [CrossRef]
  7. Al-Fadhalah, K.J.; Almazrouee, A.I.; Aloraier, A.S. Microstructure and Mechanical Properties of Multi-Pass Friction Stir Processed Aluminum Alloy 6063. Mater. Des. 2014, 53, 550–560. [Google Scholar] [CrossRef]
  8. Wȩglowski, M.S.; Hamilton, C.B. An Experimental Investigation and Modelling of Friction Stir Processing. Eng. Trans. 2013, 61, 65–80. [Google Scholar]
  9. Smith, C.B.; Harington, J.; Kouch, T. Friction Stir Processing for Efficient Manufacturing; Friction Stir LInk, Inc.: Milwaukee, WI, USA, 2012; pp. 1–35. [Google Scholar]
  10. Lorenzo-Martin, C.; Ajayi, O.; Smith, C.; Krol, S. Energy Efficient Surface Hardening of 4140 Steel by Friction Stir Processing for Tribological Applications. In Proceedings of the ASME/STLE 2011 International Joint Tribology Conference. ASME/STLE 2011 Joint Tribology Conference, Los Angeles, CA, USA, 24–26 October 2011; pp. 63–65. [Google Scholar]
  11. Sharma, V.; Prakash, U.; Kumar, B.V. Surface Composites by Friction Stir Processing: A Review. J. Mater. Process. Technol. 2015, 224, 117–134. [Google Scholar] [CrossRef]
  12. Gibson, B.T.; Lammlein, D.H.; Prater, T.J.; Longhurst, W.R.; Allun, M.C.; Dharmaraj, K.J.; Cook, G.E.; Strauss, A.M. Friction Stir Welding: Process, Automation, and Control. J. Manuf. Process. 2014, 16, 56–73. [Google Scholar] [CrossRef]
  13. Teo, G.S.; Liew, K.W.; Kok, C.K. Enhancement of Microhardness and Tribological Properties of Recycled AA 6063 Using Energy-Efficient and Environment-Friendly Friction Stir Processing. In Proceedings of the IOP Conference Series: Earth and Environmental Science, Sapporo, Japan, 26–28 August 2021; IOP Publishing: Bristol, UK, 1874. [Google Scholar]
  14. Węglowski, M.S. Friction Stir Processing—State of the Art. Arch. Civ. Mech. Eng. 2018, 18, 114–129. [Google Scholar] [CrossRef]
  15. Kumar, S. Ultrasonic Assisted Friction Stir Processing of 6063 Aluminum Alloy. Arch. Civ. Mech. 2016, 16, 473–484. [Google Scholar] [CrossRef]
  16. Kumar, S.; Santhanam, V. Single Point Incremental Forming of Friction Stir Processed Al 6063-O Alloy. In Proceedings of the ASME 2015 International Mechanical Engineering Congress and Exposition. Volume 2A: Advanced Manufacturing, Houston, TX, USA, 13–19 November 2015; pp. 2–7. [Google Scholar]
  17. Zhao, H.; Pan, Q.; Qin, Q.; Wu, Y.; Su, X. Effect of the Processing Parameters of Friction Stir Processing on the Microstructure and Mechanical Properties of 6063 Aluminum Alloy. Mater. Sci. Eng. A 2019, 751, 70–79. [Google Scholar] [CrossRef]
  18. Mahmoud, T.S. Effect of Friction Stir Processing on Electrical Conductivity and Corrosion Resistance of AA6063-T6 Al Alloy. J. Mech. Eng. Sci. 2008, 222, 1117–1123. [Google Scholar] [CrossRef]
  19. Babu, J.; Anjaiah, M.; Mathew, A. Experimental Studies on Friction Stir Processing of AZ31 Magnesium Alloy. Mater. Todays 2018, 5, 4515–4522. [Google Scholar] [CrossRef]
  20. Surekha, K.; Murty, B.S.; Prasad Rao, K. Comparison of Corrosion Behaviour of Friction Stir Processed and Laser Melted AA 2219 Aluminium Alloy. Mater. Des. 2011, 32, 4502–4508. [Google Scholar] [CrossRef]
  21. Surekha, K.; Murty, B.S.; Prasad Rao, K. Effect of Processing Parameters on the Corrosion Behaviour of Friction Stir Processed AA 2219 Aluminum Alloy. Solid State Sci. 2009, 11, 907–917. [Google Scholar] [CrossRef]
  22. Shanmugasundaram, A.; Arul, S.; Sellamuthu, R. Investigating the Effect of WC on the Hardness and Wear Behavior of Surface Modified AA 6063. Mater. Todays 2018, 5, 6579–6587. [Google Scholar] [CrossRef]
  23. Rathee, S.; Maheshwari, S.; Siddiquee, A.N.; Srivastava, M. Analysis of Microstructural Changes in Enhancement of Surface Properties in Sheet Forming of Al alloys via Friction Stir Processing. Mater. Today Proc. 2017, 4, 452–458. [Google Scholar] [CrossRef]
  24. Srivastava, M.; Rathee, S.; Maheshwari, S.; Siddiquee, A.N. Optimization of Friction Stir Processing Parameters to Fabricate AA6063/SiC Surface Composites Using Taguchi Technique. Int. J. Mater. Prod. Technol. 2019, 58, 16–31. [Google Scholar] [CrossRef]
  25. Murali, S.; Chockalingam, A.; Suresh Kumar, S.; Remanan, M. Production, Characterization and Friction Stir Processing of AA6063-T6 / Al3Tip in-situ Composites. Int. J. Mech. Prod. 2018, 2018, 399–406. [Google Scholar]
  26. Liew, K.W.; Chung, Y.Z.; Teo, G.S.; Kok, C.K. Effect of Tool Pin Geometry on the Microhardness and Surface Roughness of Friction Stir Processed Recycled AA 6063. Metals 2021, 11, 1695. [Google Scholar] [CrossRef]
  27. Cavaliere, P.; Squillace, A. High Temperature Deformation of Friction Stir Processed 7075 Aluminium Alloy. Mater. Charact. 2005, 66, 136–142. [Google Scholar] [CrossRef]
  28. Yasavol, N.; Ramalho, A. Wear Properties of Friction Stir Processed AISI D2 Tool Steel. Tribol. Int. 2015, 97, 177–183. [Google Scholar] [CrossRef]
  29. Mishra, M.K.; Rao, A.G.; Balasundar, I.B.; Kashyap, P.; Prabhu, N. On the Microstructure Evolution in Friction Stir Processed 2507 Super Duplex Stainless Steel and Its Effect on Tensile Behaviour at Ambient and Elevated Temperatures. Mater. Sci. Eng. A 2018, 719, 82–92. [Google Scholar] [CrossRef]
  30. Chainarong, S.; Muangjunburee, P.; Suthummanon, S. Friction Stir Processing of SSM356 Aluminium Alloy. Procedia Eng. 2014, 97, 732–740. [Google Scholar] [CrossRef] [Green Version]
  31. Behnagh, R.A.; Shen, N.; Abdollahi, M.; Ding, H. Ultrafine-Grained Surface Layer Formation of Aluminum Alloy 5083 by Friction Stir Processing. Procedia CIRP 2016, 45, 243–246. [Google Scholar] [CrossRef] [Green Version]
  32. Zhou, Y.; Zhu, H.; Zhang, W.; Zuo, X.; Li, Y. Influence of Surface Roughness on the Friction Property of Textured Surface. Adv. Mech. Eng. 2015, 7, 1687814014568500. [Google Scholar] [CrossRef]
  33. Ivkovic, B.; Djukdjanovi, M.; Stamenkovic, D. The Influence of the Contact Surface Roughness on the Static Frictio Coefficient. Tribol. Ind. 2000, 22, 41–44. [Google Scholar]
  34. Stamenkovic, D.; Sundaresan, R. Effect of Hardness and Surface Roughness on Slip Resistance of Rubber Effect of Hardness and Surface Roughness on Slip Resistance of Rubber. J. Test. Eval. 2015, 43, 1574–1586. [Google Scholar]
Figure 1. Recycled AA 6063.
Metals 12 00310 g001
Figure 2. Schematic diagram of FSPed recycled AA 6063.
Metals 12 00310 g002
Figure 3. Microstructure and hardness test sample, (a) cut from FSPed workpiece, and (b) CAD drawing.
Metals 12 00310 g003
Figure 4. Tribo-test sample, (a) cut from FSPed workpiece, and (b) CAD drawing.
Metals 12 00310 g004
Figure 5. Pin-on-disc tribo-test schematic diagram [13].
Metals 12 00310 g005
Figure 6. Microstructure of FSPed Sample 2 (10×), (a) base metal, (b) heat-affected zone (HAZ), (c) intersection of the heat-affected zone (HAZ), and thermo-mechanical affected zone (TMAZ) and (d) stir zone.
Metals 12 00310 g006
Figure 7. Microstructure of stir zone (SZ), thermo-mechanical affected zone (TMAZ), and heat-affected zone (HAZ) boundary (5×) of FSPed Sample 2.
Metals 12 00310 g007
Figure 8. Grain size measurement (10×) for the base metal part of FSPed Sample 15.
Metals 12 00310 g008
Figure 9. Average stir zone surface microhardness of FSPed samples.
Metals 12 00310 g009
Figure 10. FSPed surface roughness, (a) average Ra, (b) Rq, (c) Rsk, and (d) Rku values.
Metals 12 00310 g010
Figure 11. FSPed surface and roughness profile of (a) sample 7 and (b) sample 18.
Metals 12 00310 g011
Figure 12. Sliding friction coefficient vs. sliding distance for FSPed samples produced at (a) 1200 rpm, (b) 1400 rpm, (c) 1600 rpm, (d) 1800 rpm and (e) 2000 rpm with different feed rate under starved lubrication conditions. (Normal contact pressure = 0.24 MPa, sliding speed = 2.88 m/s, total sliding distance = 1500 m).
Metals 12 00310 g012
Figure 13. Sliding friction coefficient vs. sliding distance for FSPed samples with lowest friction coefficient produced by different processing parameters under starved lubrication conditions. (Normal contact pressure = 0.24 MPa, sliding speed = 2.88 m/s, total sliding distance = 1500 m).
Metals 12 00310 g013
Figure 14. Wear rate vs. sliding distance for FSPed samples produced at (a) 1200 rpm, (b) 1400 rpm, (c) 1600 rpm, (d) 1800 rpm, and (e) 2000 rpm with different feed rate under starved lubrication conditions. (Normal contact pressure = 0.24 MPa, sliding speed = 2.88 m/s, total sliding distance = 1500 m).
Metals 12 00310 g014
Figure 15. Wear rate vs. sliding distance for FSPed samples with the smallest wear rate produced by different processing parameters under starved lubrication conditions. (Normal contact pressure = 0.24 MPa, sliding speed = 2.88 m/s, total sliding distance = 1500 m).
Metals 12 00310 g015
Figure 16. Wear morphology of recycled AA 6063 base metal after sliding distance test under starved lubrication conditions, normal contact pressure of 0.24 MPa, sliding speed of 2.88 m/s, and sliding distance of 1500 m. (PD: Plastic Deformation, Fr: Fracture, V: Void, and FG: Fine Groove; arrow at bottom left corner showing sliding direction).
Metals 12 00310 g016
Figure 17. (aw) Wear morphology of FSPed samples after sliding distance test under starved lubrication conditions, normal contact pressure of 0.24 MPa, sliding speed of 2.88 m/s, and sliding distance of 1500 m. (PD: Plastic Deformation, Fr: Fracture, V: Void, and FG: Fine Groove; arrows at bottom left corners showing sliding direction).
Metals 12 00310 g017
Figure 18. Friction coefficients vs. wear rates of FSPed samples after sliding tests under starved lubrication conditions, normal contact pressure of 0.24 MPa, sliding speed of 2.88 m/s, and sliding distance of 1500 m.
Metals 12 00310 g018
Table 1. Chemical composition of recycled AA 6063 (wt %).
ElementZnMgCuSiFeMnCrNiTiAl
wt %0.03310.5810.03380.430.3090.02520.03350.03330.0269Balance
Table 2. FSPed samples with different processing parameters.
Samples1234567891011121314151617181920212223
Rotational Speed
(×103 RPM)
1.21.21.21.41.41.41.41.41.61.61.61.61.61.81.81.81.81.82.02.02.02.02.0
Traverse Speed (mm/min)2530352530354045253035404525303540452530354045
Table 3. Average grain size of recycled AA 6063 base metal and FSPed samples.
ZonesAverage Radius (μm)
Base Metal1200-30
(Sample 2)
1400-40
(Sample 7)
1400-45
(Sample 8)
1800-30
(Sample 15)
BM134.6113.0109.3116.0125.8
HAZ-88.883.0184.591.4
TMAZ-45.158.5440.643.3
SZ-4.610.613.823.8
Publisher’s Note: MDPI stays neutral with regard to jurisdictional claims in published maps and institutional affiliations.

