Article

The Response Mechanism of Crystal Orientation to Grain Boundary Dislocation under Uniaxial Strain: A Phase-Field-Crystal Study

1
College of Science, North University of China, Taiyuan 030051, China
2
College of Materials Science and Engineering, North University of China, Taiyuan 030051, China
*
Author to whom correspondence should be addressed.
Submission received: 12 March 2022 / Revised: 17 April 2022 / Accepted: 18 April 2022 / Published: 21 April 2022

Abstract

:
An exploration of dislocation microstructure evolution with different misorientation angles was performed using phase field crystal method (PFC). The microcosmic evolution process of grain boundaries under external stress, as well as the corresponding energy curve and stress–strain curve, are analyzed. The relationship between the misorientation angle and the dislocations emission frequency is discussed. Three forms of dislocations reaction on the evolution process of 6° and 10° are analyzed in detail, which are respectively type I semi-annihilation, type II semi-annihilationand full-annihilation. Among them, the nature of type I semi-annihilation is a combination of dislocation and a single edge dislocation reaction with a single edge dislocation left. The essence of type II semi-annihilation is a pair of dislocation and the other pair of dislocation reaction leaving two edge dislocations. The essence of full-annihilation is that two pairs of dislocations or single edge dislocations with opposite Burger vectors react with each other and the distortion area disappears. When the misorientation angle is 10°, the dislocation reaction and the dislocation motion ability of the system are stronger than 6°. The peak of the energy curve is related to the number of dislocation proliferations in the evolution process. An emission frequency and average density of dislocations of 10° is greater than 6°. The causes of plastic deformation are revealed to a certain extent by stress–strain curves.

1. Introduction

A large number of studies show that the characteristics and distribution of the grain boundary structure can affect the mechanical properties of materials at the macro level. Grain boundaries in nanocrystalline samples serve as a source of dislocations [1,2]. The plastic deformation in polycrystalline materials is closely related to the dislocation behavior in the grain boundary structure [3]. Although the deformation behavior of grain boundaries (GBs) has been widely studied and recorded at the macro scale [4,5,6,7], there are still some limitations in the experimental research so far. For example, transmission electron microscope (TEM) [7,8] and X-ray diffraction (XRD) [8] studies on various atomic mechanisms in grain boundary motion are carried out by observing the interface morphology and cannot clearly obtain information on the structure and behavior of the interface at the atomic scale. Although high resolution transmission electron microscope (HRTEM) can observe the existence of grain boundary dislocations at the nanoscale [9], the experimental research is limited due to its strict requirements on the experimental environment. There is still much to be understood about the deformation behavior of GBs at the microscopic scale, and atomic simulations are beneficial in capturing the microscopic reactions of atoms during the grain boundary process. Consequently, it is essential to explore the mechanical behavior of grain boundaries under different conditions using computer simulations such as molecular dynamics (MD) simulations and the phase field crystal (PFC) method.
Spearot, et al. [10,11] investigated the tilt GBs in Cu and Al by MD simulations and found that grain boundaries can act as dislocation sources and can emit dislocations at relatively low stress. Wang [12] explored the interaction between asymmetrical tilt grain boundaries and dislocation pileup in Al through MD simulations, confirmed that grain boundaries contain grain boundary dislocations, and showed that the interaction of grain boundary dislocations (GBDs) can lead to the rearrangement of the atomic structure of the grain boundary in order to achieve a low energy state. Through MD simulations, Singh, et al. [13] investigated the plastic deformation of the Nb bi-crystals of symmetrically tilted GBs under uniaxial tensile loading and found that the larger grain boundary orientation angle, the higher dislocation density. The tensile behavior of tungsten bi-crystals was studied by Feng, et al. [14], and it was found that the dislocation density increased and decreased rapidly during stress drop but remained almost constant during stress rise, indicating that the bi-crystals release stress through dislocations’ motion, proliferation, and annihilation. In addition, it is also confirmed that dislocation proliferation is achieved by dislocation dissociation in low-angle grain boundaries. MD simulations can essentially reflect atomic behavior, but most studies are limited to the timescales of about 10 14 ~ 10 12 s of atomic vibration. The diffusion timescales required for the evolution of microscopic defects in materials is about 10 6 s. Another limitation of the geometry used is the influence of the free surface, such as image forces, on the dislocations emitted [15]. By comparison, the PFC model is more suitable for studying the atomic evolution process of micro defects because it is based on an atomic scale of 10 9 m and a diffusion time scale of 10 6   s. Although the PFC model only loses some microscopic details, it retains the basic image of the crystal and can explore a larger system size numerically. Compared with the phase field (PF) method, a PFC model provides many atomic properties of materials, and it requires fewer model parameters than the phase field method. Therefore, it is easier to determine the model parameters from the nano model.
Elder, et al. first proposed a PFC model with a “one-mode” free energy function [16,17].The physical phenomena on atomic length scale and diffusion timescale are simulated by introducing periodic atomic density state to minimize free energy. It can also selfconsistently combine the physics of atomic-scale elastoplasticity with the diffusive dynamics of phase transformations and microstructure formation. The PFC model can capture the motion of dislocations and crystal growth [18,19], and the simulated strain rate was consistent with the experimental. A “two-mode” PFC (2PFC) model with a free energy function [20] was proposed since “one-mode” PFC cannot describe the dislocation motion in a two-dimensional square lattice for now, describing the dislocation motion in a triangular lattice and square lattice and comparing with the diffraction patterns of different atomic planes in the experiment better. After that, 2PFC was used to simulate relationship between misorientation angle and dislocations distance, dislocations’ motion, grains’ growth, new-phase nucleation, and tensile deformation [21,22,23]. The results showed that the larger the misorientation angle was, the smaller the dislocation distance was, and grains with favorable misorientation would preferentially grow and occupy a dominant position. It can also be shown that the critical deformation of phase transformation with a misorientation angle of 4° is greater than that with a misorientation angle of 12°. In the study of dislocation motion and annihilation of a square phase with a misorientation angle of 40° under stress by using 2PFC, Kong, et al. [24], only a single form of dislocation annihilation was found.
In this work, we take a pure material with a face-centered cubic (FCC) structure as the research object and study the response law of grain boundaries under tensile deformation based on a 2PFC model and then compare them with the MD simulation results mentioned above. We focus on the GBDs during plastic deformation, with the aim of providing an atomistic understanding of the deformation mechanism for bi-crystal systems. The mechanism for plastic deformation at the GB is presented in detail: dislocation nucleation from the GBs, dislocation emission, dislocation into the grain, and reaction between dislocations.

2. Model and Methods

2.1. PFC Model

In this paper, the free energy function form is a “two-mode” PFC model to simulate the crystal structure of a square lattice, and the free energy is a dimensionless form as follows [20]:
F = ϵ ψ 2 2 + ψ 4 4 + ψ 2 2 + 1 2 R 1 + 2 + Q 1 2 2 ψ d r = f ψ d r
where r represents the position vector of the atom.
The first two terms of the integrand function form a double-well potential and ensure the existence of solid and liquid phases. The third term, including the gradient term, describes the deviation from the equilibrium curve due to the existence of lattice defects. ψ   is the periodic local atomic density, x   is the space coordinate, ϵ   is the temperature-related parameter, and ϵ ~ β T T m T . The density field of the liquid phase is constant, and the maximum position of the atomic density field is solid phase. R 1   is related to the relative stability of different crystal structures, and the dual-mode model is more stable when R 1 = 0 , because the action of the second nearest neighbor gradually tends to “one-mode” with the increase of R 1 . 2 is the Laplace operator, Q 1 , whose value is generally determined by the choice of crystal structure; it is the ratio of the module of the second-nearest neighbor reciprocal lattice vector (RLV) to the module of the nearest neighbor reciprocal lattice vector. In face-center-cubic (FCC) structures, Q 1 = 2 , which couples 10 and 11 RLVs in two dimensions.
Free energy density of liquid phase:
f l ψ 0 = ϵ 4 ψ 0 2 2 + ψ 0 4 4
Free energy density of square phase [20,25]:
f s = 2 ϵ + 3 ψ 0 2 A s 2 + 2 ϵ + 3 ψ 0 2 B s 2 + 24 ψ 0 A s 2 B s + 36 A s 2 B s 2 + 9 A s 4 + 9 B s 4 ϵ 2 ψ 0 2 + 2 ψ 0 2 + 1 4 ψ 0 4
ψ 0 is average atomic density; both A s and   B s are the density wave amplitude; q s = 1 .

2.2. Kinetic Equation

Since the atomic density field is a conserved value, the dimensionless time evolution equation can be expressed by the Cahn–Hilliard equation [23,25]:
ψ t = 2 δ F δ ψ = 2 ϵ ψ + 2 + 1 2 2 + 2 2 ψ + ψ 3
The semi-implicit Fourier spectral method is used here [20,26]. Therefore, Equation (4) can be expressed in Fourier space as
ψ k , t + 1 = ψ k , t k 2 Δ t ψ k , t 3 1 + k 2 Δ t 4 ϵ 12 k 2 + 13 k 4 6 k 6 + k 8
ψ k represents a Fourier transform; k represents a Fourier space vector; 2 = k 2 ;   k 2 = k 2 . The phase diagram can be derived by taking the derivative of the free energy for the density field of the square phase and liquid phase, respectively [20,27], and using the common tangent rule, as shown in Figure 1.

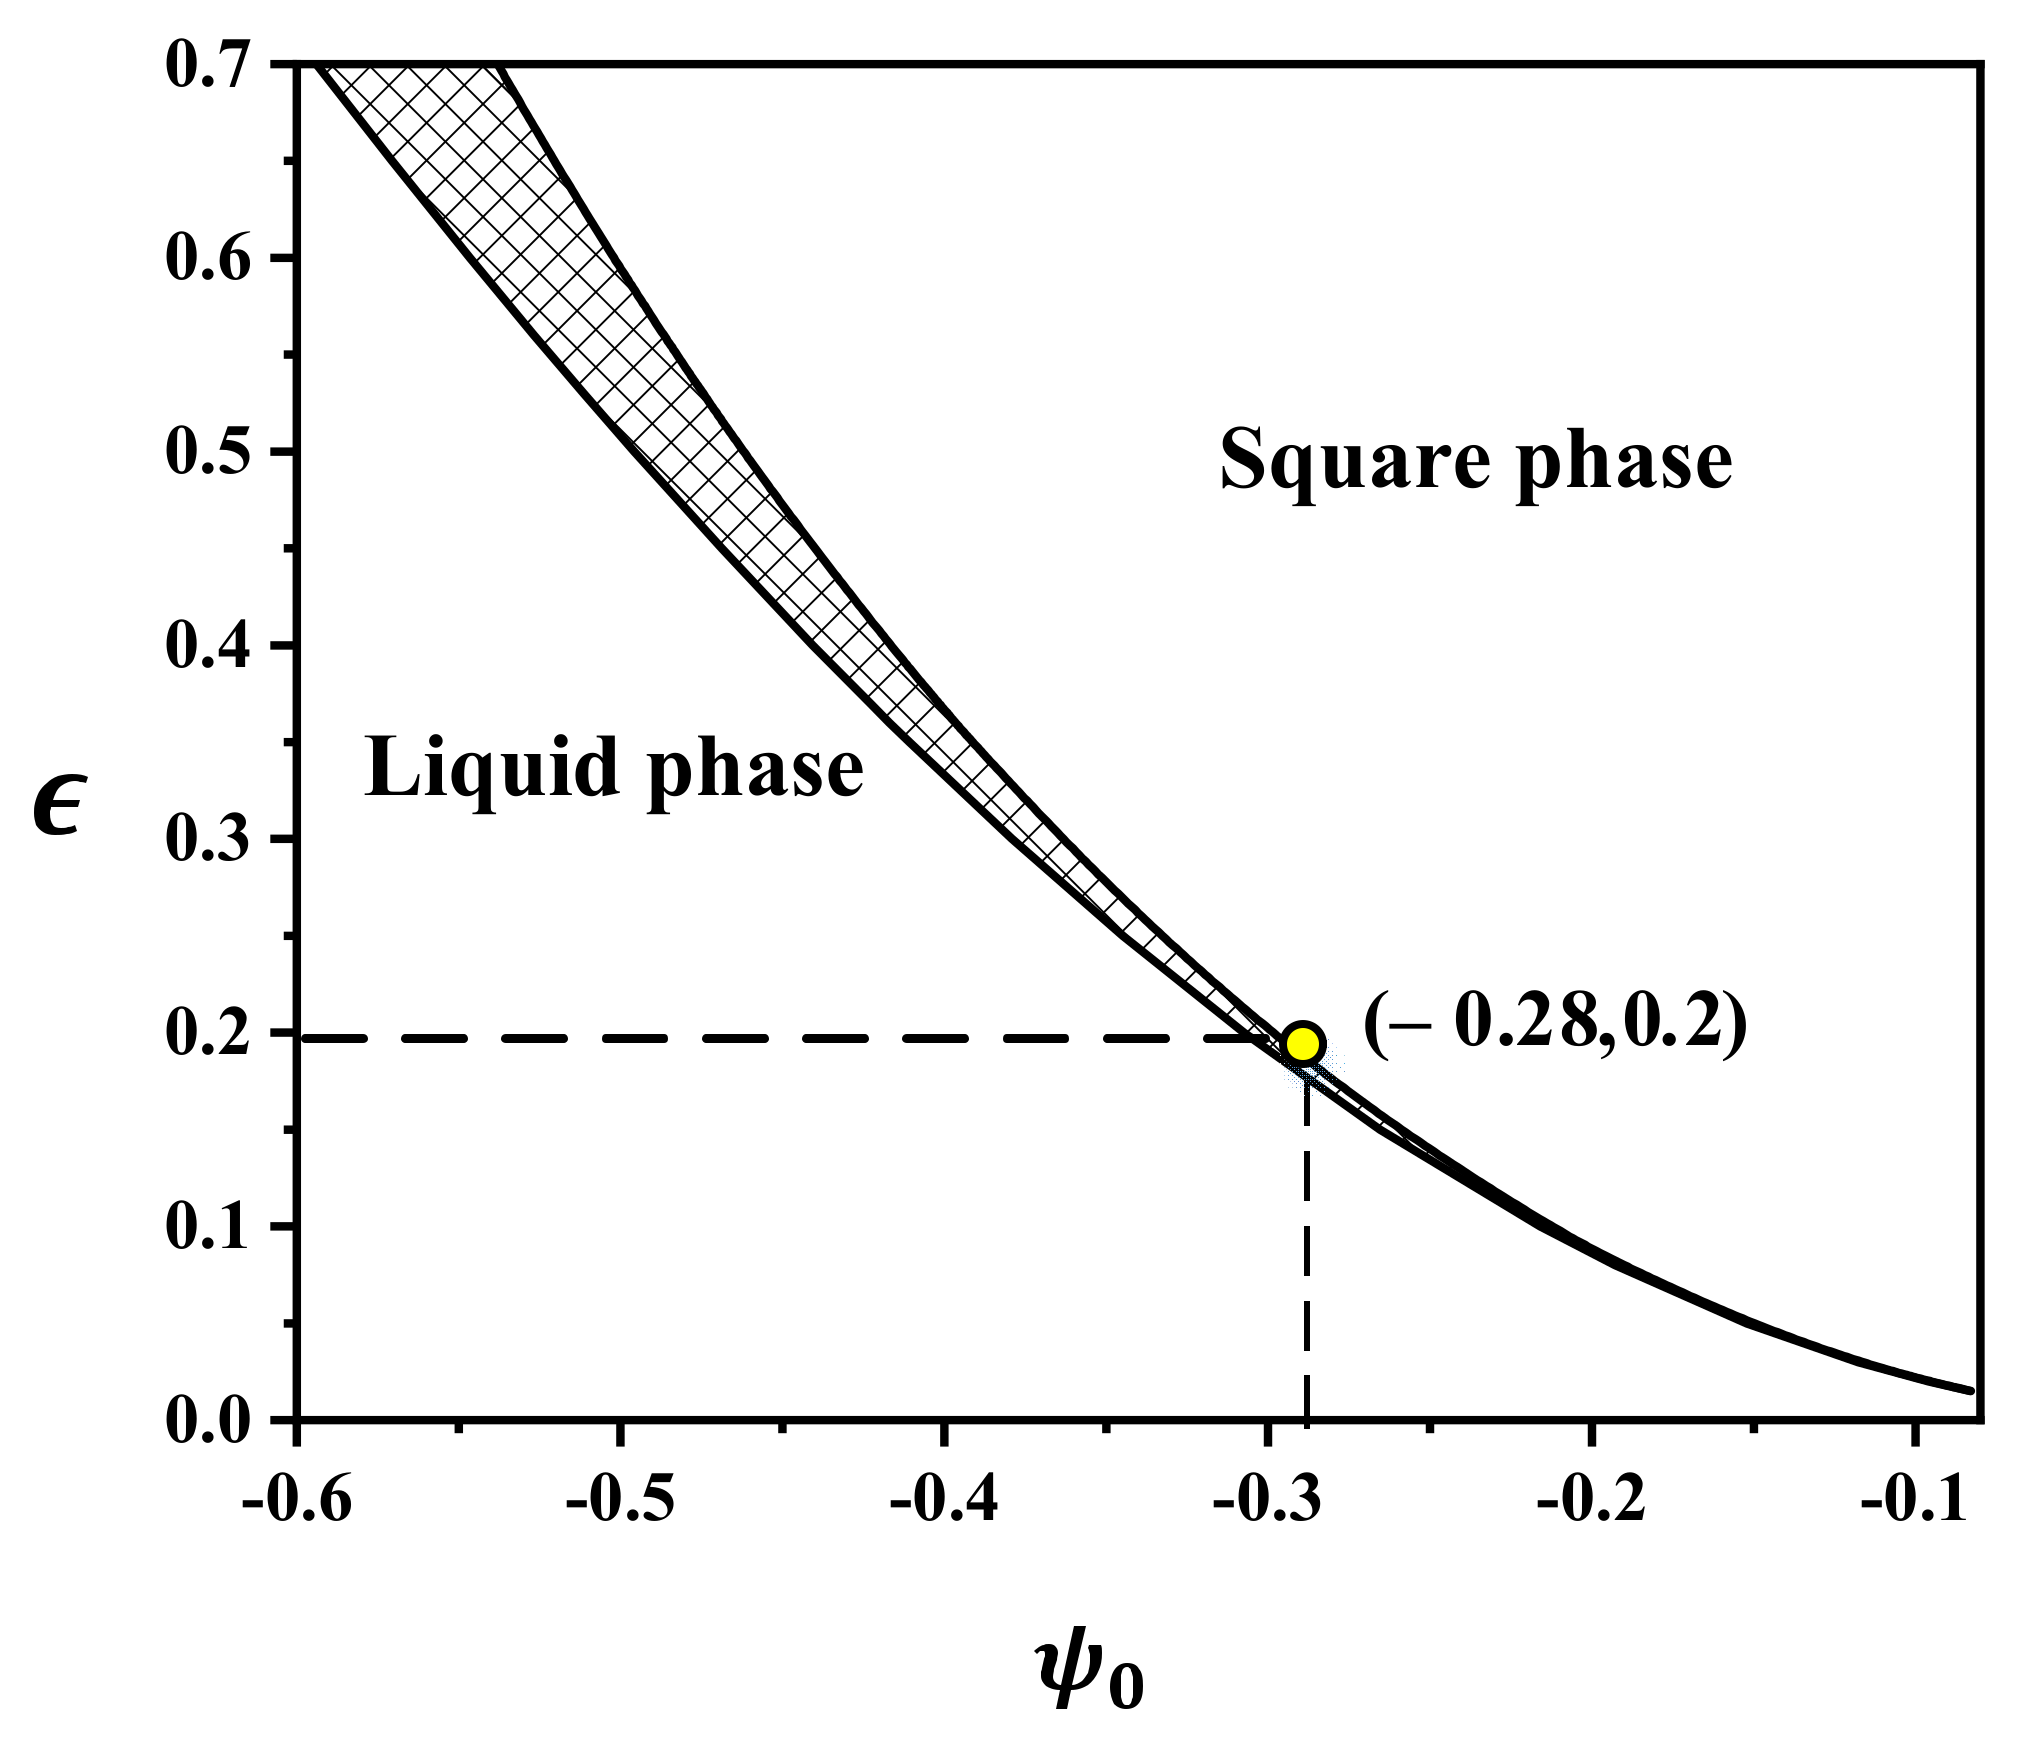
2.3. Parameters Setting of Simulation

The parameter settings are as follows: the simulation region of periodic boundary conditions in all directions is L x × L y = 256 Δ x × 256 Δ y . The actual proportion [28,29,30] is 15 × 15 nm 2 . The time-step and space-step are Δ t = 0.5 and Δ x = Δ y = π / 4 , respectively. The simulation region is divided into three rectangular areas: 0 < x < L x / 4 , L x < x < 3 L x / 4 , and 3 L x / 4 < x < L x We set the crystal orientation angle of the square lattice structure θ 1 in the regions 0 < x < L x / 4 and 3 L x / 4 < x < L x , then make the crystal orientation angle θ 2   in the other area. The misorientation angle θ = θ 1 θ 2 , which is the angle between two adjacent grains. Combined with Figure 1, the selection of the other simulation parameters is shown in Table 1.
From Refrences [17,31], we can learn that the relationship between the real temperature T and the dimensionless temperature ϵ , which is ϵ ~ T m T . The real temperature of melting point for Cu metal is T m = 1083   ° C . We know that T = 1063   ° C corresponding to dimensionless temperature ϵ = 0.8 . Consequently, when the dimensionless temperature ϵ = 0.2 , we have real temperature T = 1078   ° C of Cu by equation ϵ 1 ϵ 2 = T m T 1 T m T 2 .

2.4. Applied Stress Calculation Model

In the following sections, we apply compressive stress to the system in the x direction. The dimensionless strain rate along the x direction is ε ˙ = 6 × 10 6 ; we use the isometric numerical scheme in the deformation process [32,33]:
S = Δ x × Δ y = Δ x 0 1 + ε x × Δ y 0 1 ε y = Δ x 0 × Δ y 0
where ε = ε x = ε y = n ε ˙ Δ t ; Δ x 0 and Δ y 0 represent the grid sizes before deformation; Δ x and Δ y are the grid sizes after deformation. The grid sizes after n time-steps are shown as follows:
Δ x = Δ x 0 1 + n ε ˙ Δ t
Δ y = Δ y 0 1 + n ε ˙ Δ t

3. Results and Analysis of Simulation

3.1. The Initial Equilibrium Process of the Sample A

Figure 2a represents the grain solidification process at a misorientation angle of 6 ° and 10 ° . Figure 2c shows the corresponding free energy curve. The grain growth process (dislocation nucleation from the GBs) can be roughly divided into three stages: (i) rapid decline stage, the liquid phase gradually disappears, the grain grows rapidly, and the free energy decreases rapidly with the progress of solidification; (ii) slow decline stage, the internal stress increases gradually, the grain growth rate slows up, and the decline rate of the free energy curve with the ordering process of the system slows down; (iii) stable stage, grain boundaries are completely formed and the free energy curve remains unchanged. When the system is in complete equilibrium, 8 edge dislocations are formed at the grain boundary when the misorientation angle is 6 ° , and 12 edge dislocations are formed at the grain boundary with a misorientation angle of 10 ° . The dislocation distance decreases and the distance between dislocations conforms to D b / t a n θ [21]. The dislocation density increases with the increase of misorientation angle.

3.2. Motion Process of Dislocations in the Sample A

Equal-area tensile deformation is carried out when sample A reaches equilibrium. The dislocation evolution process and corresponding free energy curve of sample A are shown in Figure 3 and Figure 4. From Figure 3a to Figure 3b, the energy of the system gradually increases with the start of deformation corresponding to Figure 4 (F1–F2). From Figure 3b to Figure 3c, the number of dislocations changed from 8 to 24 at t* = 24,100, as shown in Figure 3b. This process can be consistent with the simulation results of Spearot, et al. [10,11] and Feng, et al. [14]: (i) grain boundaries act as dislocation sources to emit dislocations when the critical strain is reached; (ii) dislocation propagation in the system is caused by dislocation dissociation. At this time, the free energy of the system decreases sharply because the internal strain energy is fully released corresponding to Figure 4 (F2–F3). In Figure 3b,c, the edge dislocations a1 and a3 whose Burger vectors are perpendicular to each other. The compressive stress region of a1 is close to the tensile stress region of a3, which generates mutual attraction between a1 and a3 and promotes the formation of dislocation pairs; this process is shown in detail in Figure 5a. The dislocation pair A1 (formed by a1 and a3) reacts with a single edge dislocation, b2, in type I semi-annihilation, and the single edge dislocation a1 is left, as shown in Figure 5b and Figure 6. A portion of edge dislocations climb into the grain. Some edge dislocations form dislocation pairs, such as A1, A2, A3, B1, B2, and B3. These dislocation pairs will slip and react inside the grain. From Figure 3c,d, a type I semi-annihilation dislocation reaction occurs between A1 and b2, leaving a single edge dislocation a1. This is due to the annihilation reaction of edge dislocations a3 and b2 with opposite Burgers vectors in Figure 6. Dislocation pairs A3 and B3 have a type II semi-annihilation reaction, retaining edge dislocations a10 and b10. Dislocation pairs A2–B1 and A4–B5 have a “full annihilation” reaction. Dislocation annihilation will consume a lot of system energy and reduce the free energy curve.
By comparing Figure 3a,h, it is found that the dislocation density obviously decreases with the continuous enhancement of the deformation. Figure 3g,h, is the corresponding free energy curve to (F3–F5) of Figure 4. The dislocation pairs A4 and B5 are close to each other, resulting in the full-annihilation reaction in Figure 3g. Among them, the reason for the small protrusion in the free energy curve in Figure 4 (F3–F4) is that only the pair of edge dislocations a4 and b4 with opposite signs have an annihilation reaction in Figure 3f. The energy consumed at this time is less than the increased strain energy, so the free energy curve rises again. The stage of Figure 4 (F2–F5) is due to the interaction of boundary dislocations which lead to the rearrangement of the grain boundary atomic structure and the decrease of system energy. This is consistent with the research results of Wang [12]. The edge dislocations in Figure 3h climb with the strain continues to increase, the energy consumed is less than the absorbed strain energy, resulting in the re rise of the free energy curve corresponding to Figure 4 (F5–F6). The free energy curve of Figure 4 (F6–F7) drops because the system evolves from bi-crystal to single crystal.

3.3. Dynamic Evolution of Dislocations in the Sample B

The dislocation motion process and the corresponding free energy curve of sample B are shown in Figure 7 and Figure 8. At the initial stage of deformation, the change trend of the free energy curve of sample B is the same as that of the sample A, as shown in (F1–F2) of Figure 8.
In Figure 7b–f, edge dislocations’ multiplication (all dislocations dissociate), grain boundary emission dislocations, and the single edge dislocations of adjacent form dislocation pairs with the increase of deformation, such as edge dislocations c2 and c3, form A1. Between a dislocation pair and another dislocation pair occur Type II semi-annihilation, leaving two edge dislocations. For example, the dislocation pairs A1 and B1 react, leaving the edge dislocations d2 and c2. Figure 9 shows the atomic structure of the type II semi-annihilation reaction in the horizontal and vertical directions. (Here, the edge dislocation D2 slides for a period of time due to the strong stress change between dislocations A9 and B9). Dislocations have a full annihilation reaction to A5 and B5, and the distortion area disappears. With the increasing strain, new dislocation pairs are gradually formed. The multiplication, formation and annihilation of dislocations will consume a lot of energy, and the free energy curved corresponds to (F2–F5) in Figure 8. The Figure 8 (F3–F4) of “protrusion” is because the dislocation pairs and some edge dislocations in Figure 7f slip, and the energy consumed is less than the increasing strain energy of the system, resulting in the re-rise of the free energy curve.
If one multiplication–annihilation of dislocations is regarded as a cycle, Figure 7g–i is the second multiplication–annihilation cycle of the dislocation motion process. At this stage, both the number of edge dislocations and the dislocation density decrease. The annihilation of a single edge dislocation with opposite signs such as an annihilation reaction between the single edge dislocation f2 and the single edge dislocation e4, there is no formation of dislocation pairs in this stage, and the free energy curve first increases and then decreases corresponding to (F5–F7) in Figure 8. The Figure 7j–l is the third cycle of the dislocation motion process. The free energy curve at this stage corresponds to Figure 8 (F7–F9). There are two protrusions in Figure 8 (F8–F9), which are caused by the successive slip or annihilation of dislocation pairs. There are three peaks in Figure 8 but only once in Figure 4 due to the dissociation times of grain boundary dislocations.
The Figure 10a,b shows dislocations’ numbers in the whole area of 6 ° and 10 ° . Figure 10c shows dislocations’ density in the whole area of sample 6 ° and 10 ° . In the Figure 10, we found that the average number of dislocations is more and the dislocation density per unit area is greater at 10 ° . On the one hand, the edge dislocations formed at the grain boundary when the misorientation angle is 6 ° are less than 10 ° when the system is in initial equilibrium. On the other hand, there is only once of dislocations’ dissociation (multiplication) in the process of dislocations’ motion at 6 °   but there are three times of dislocations’ dissociation (multiplication) at 10 ° . Therefore, it can be considered that the average dislocation density increases when the misorientation angle increases during the evolution process. This result is consistent with the results of Singh, et al. [13] who studied Nb bi-crystals under uniaxial tensile loading.

4. Discussion

Figure 11 shows the stress–strain (SS) curve of sample system A and B during the deformation. In the curve of the figure, due to the local internal stress in the GB dislocations in the specimen, which cannot be fully released, the initial strain is not zero, which can be seen in Figure 2(a3). In the initial stage (Figure 11a—S1,S2) of the SS curve, it can be seen that the stress of the system increases linearly with the strain. This is due to the dislocation of the grain boundary climbing along the grain boundary, during which the deformation of the sample is elastic [34]. The stress increases slowly in the next stage of the SS curve (Figure 11a—S2,S3); this indicates that the dislocations emitted by the grain boundary dislocation source begin to move into the interior of grain through sliding, implying that significant plastic deformation occurs in this case. Next, as shown in Figure 11a(S3,S4), the strain softens as the stress decreases. One of the reasons for strain softening is the formation of a mature local deformation zone (grain) [35]. In the Figure 11a (S4,S5) stage of the SS curve, there is obvious hardening due to dislocation multiplication in the whole process. In the Figure 11a (S5,S6) section of the SS curve, the stress of the system increases again. The SS curve in Figure 11b is similar to that in Figure 11a before point (S6). The multiple hardening may occur because the stress–strain curves of 10 °   have multiple dislocation proliferation during evolution. At (S6,S7) of Figure 11b, a brief softening recovery process may occur.
Throughout observing the Figure 10c and Figure 11. We found that the dislocation density increases and decreases rapidly during the stress drop but remains almost constant during the stress rise, which may be due to the bi-crystal through the motion of dislocations and proliferation, and annihilation to release the stress is consistent with the conclusion of Reference [14].

5. Conclusions

In this paper, the motion law of grain boundary dislocations is studied by PFC simulation. The influence of misorientation angle on the grain boundary dislocation motion mechanism under external load is discussed. It is also compared with some dislocation conclusions of MD simulation mentioned in the background, which proves the feasibility of this method. The following conclusions can be made from this work:
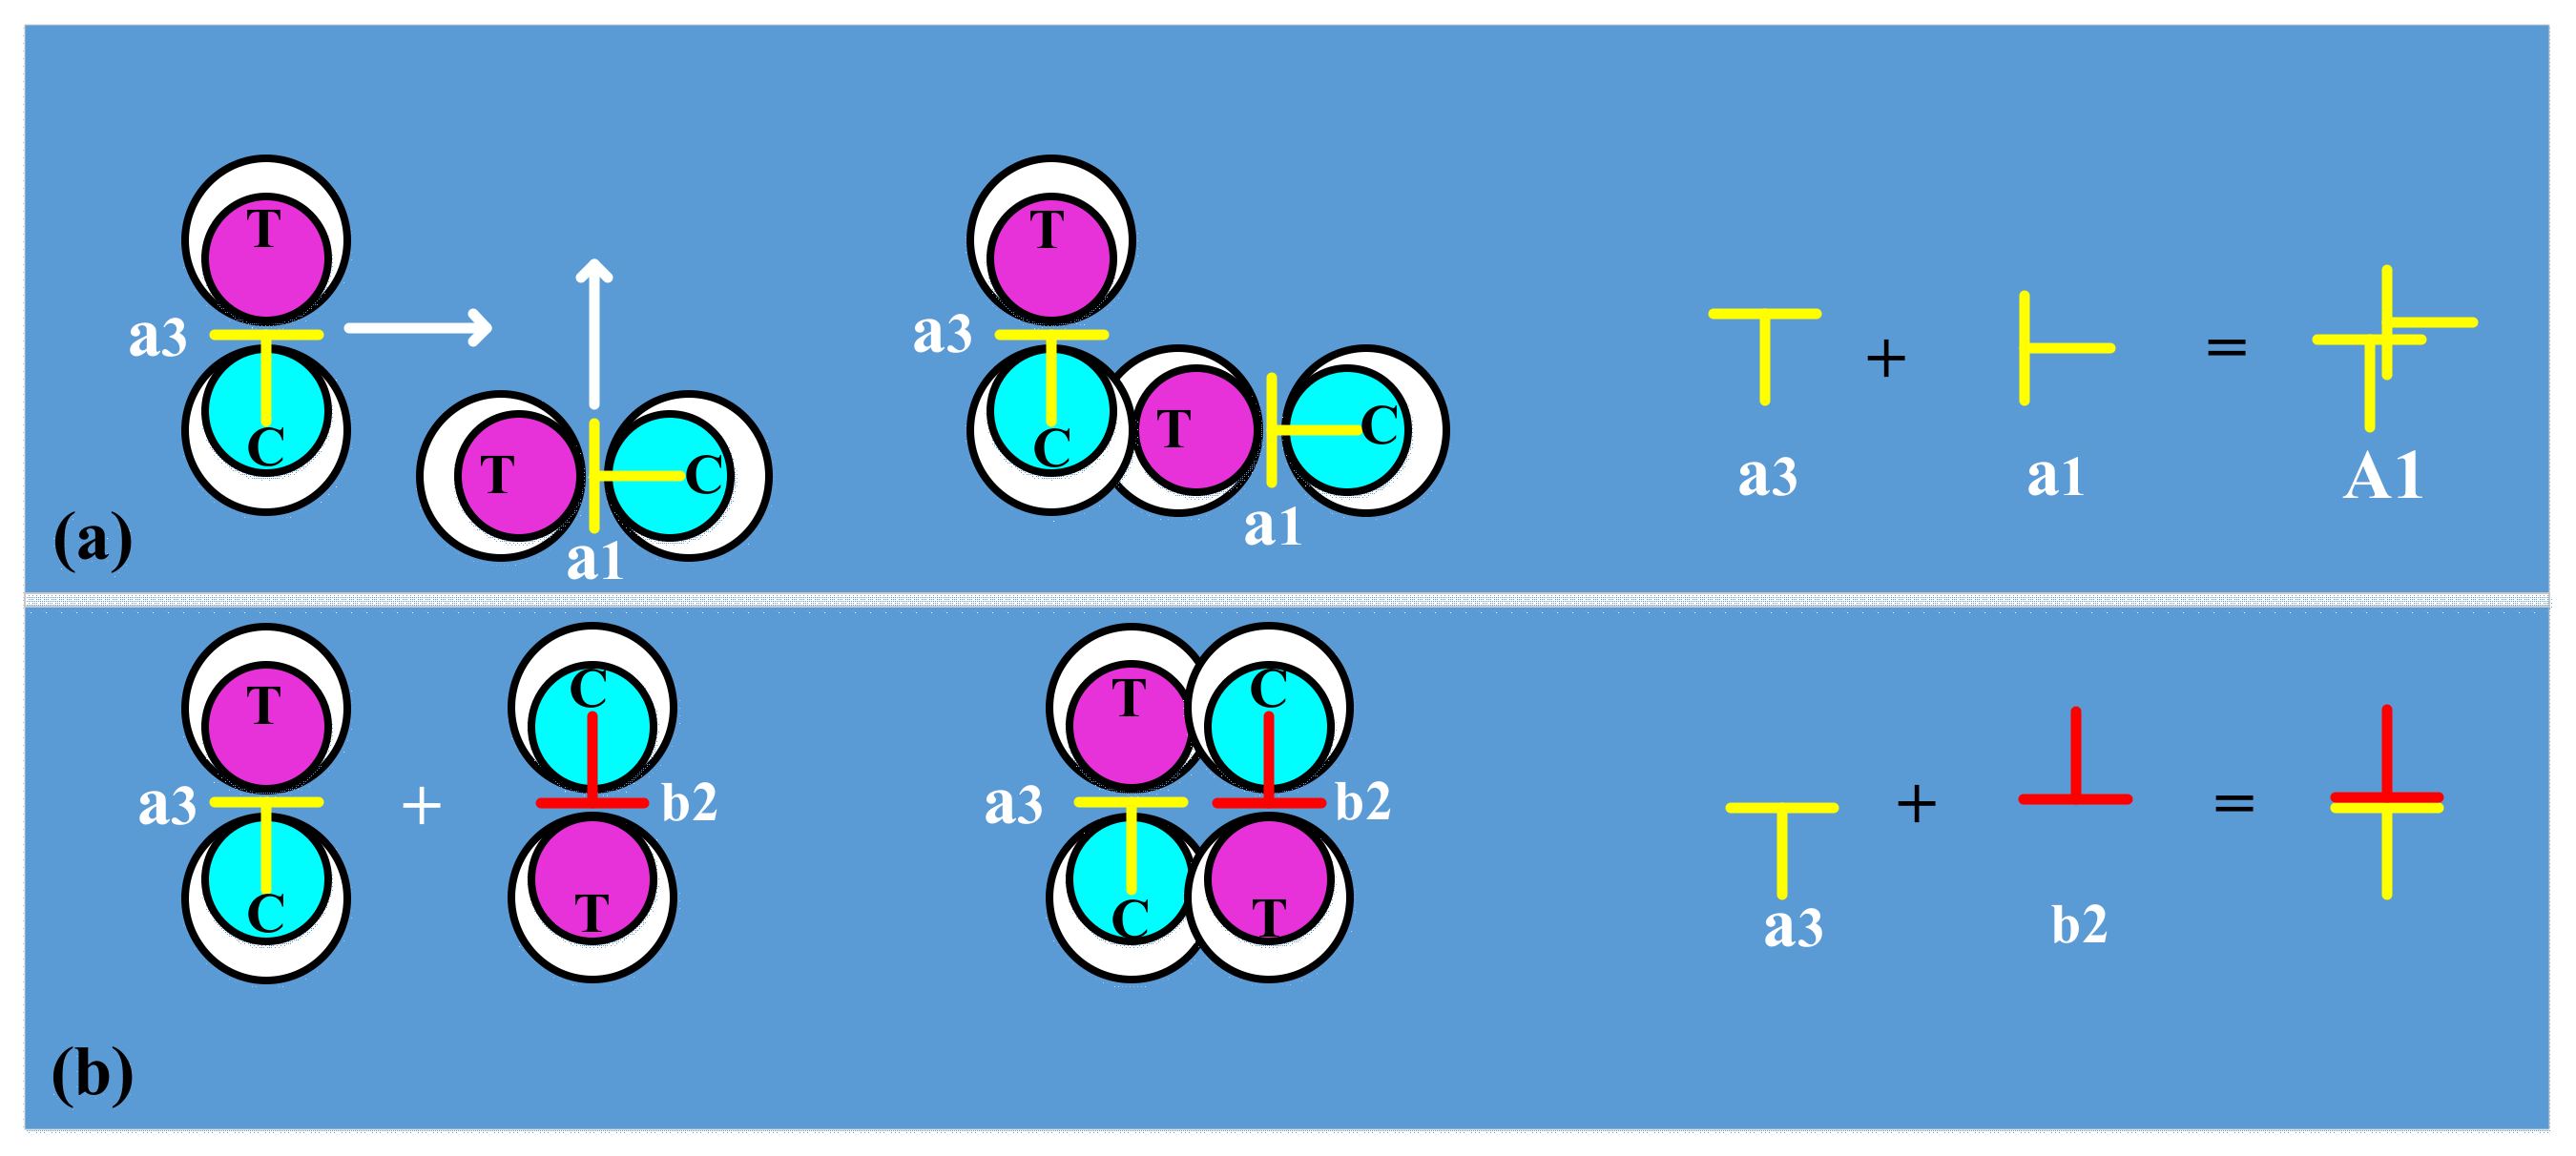
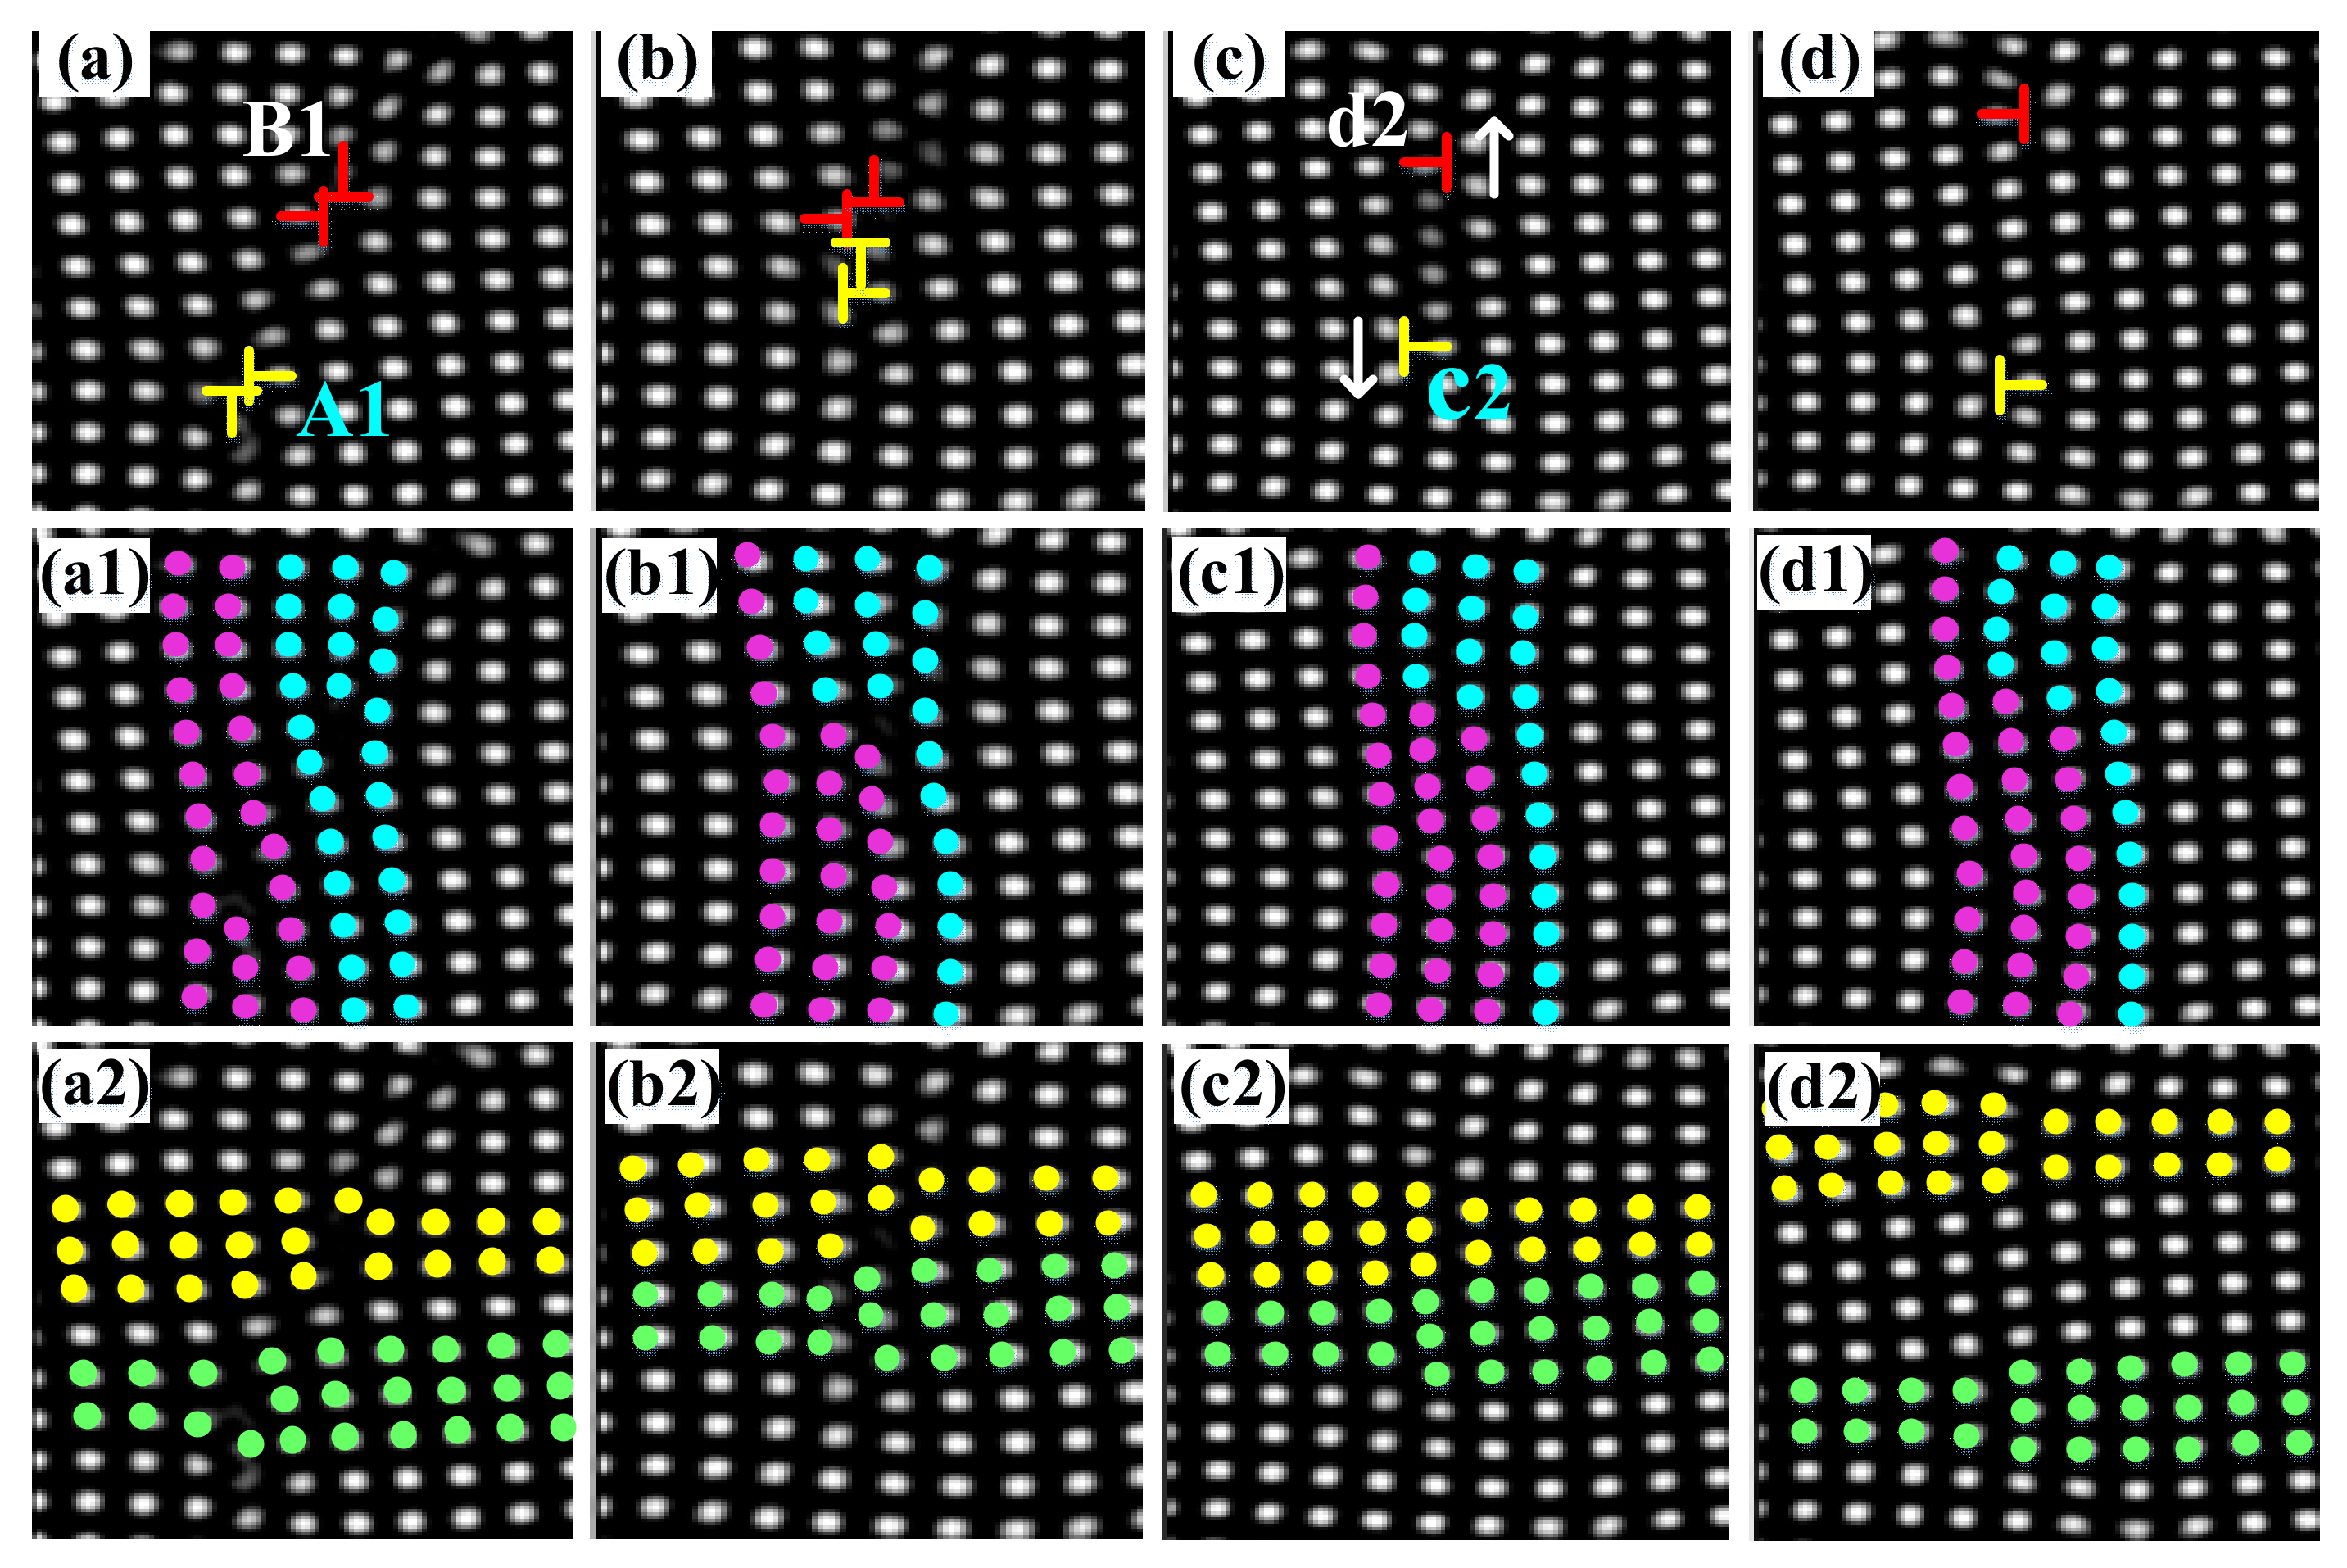
  • The size of the orientation angle affects the complexity of the dislocation reaction. There are three dislocation reaction forms in the evolution of grain boundary dislocations with misorientation angles of 6 ° and 10 ° . Dislocation reactions are more complex in systems with larger misorientation angles.
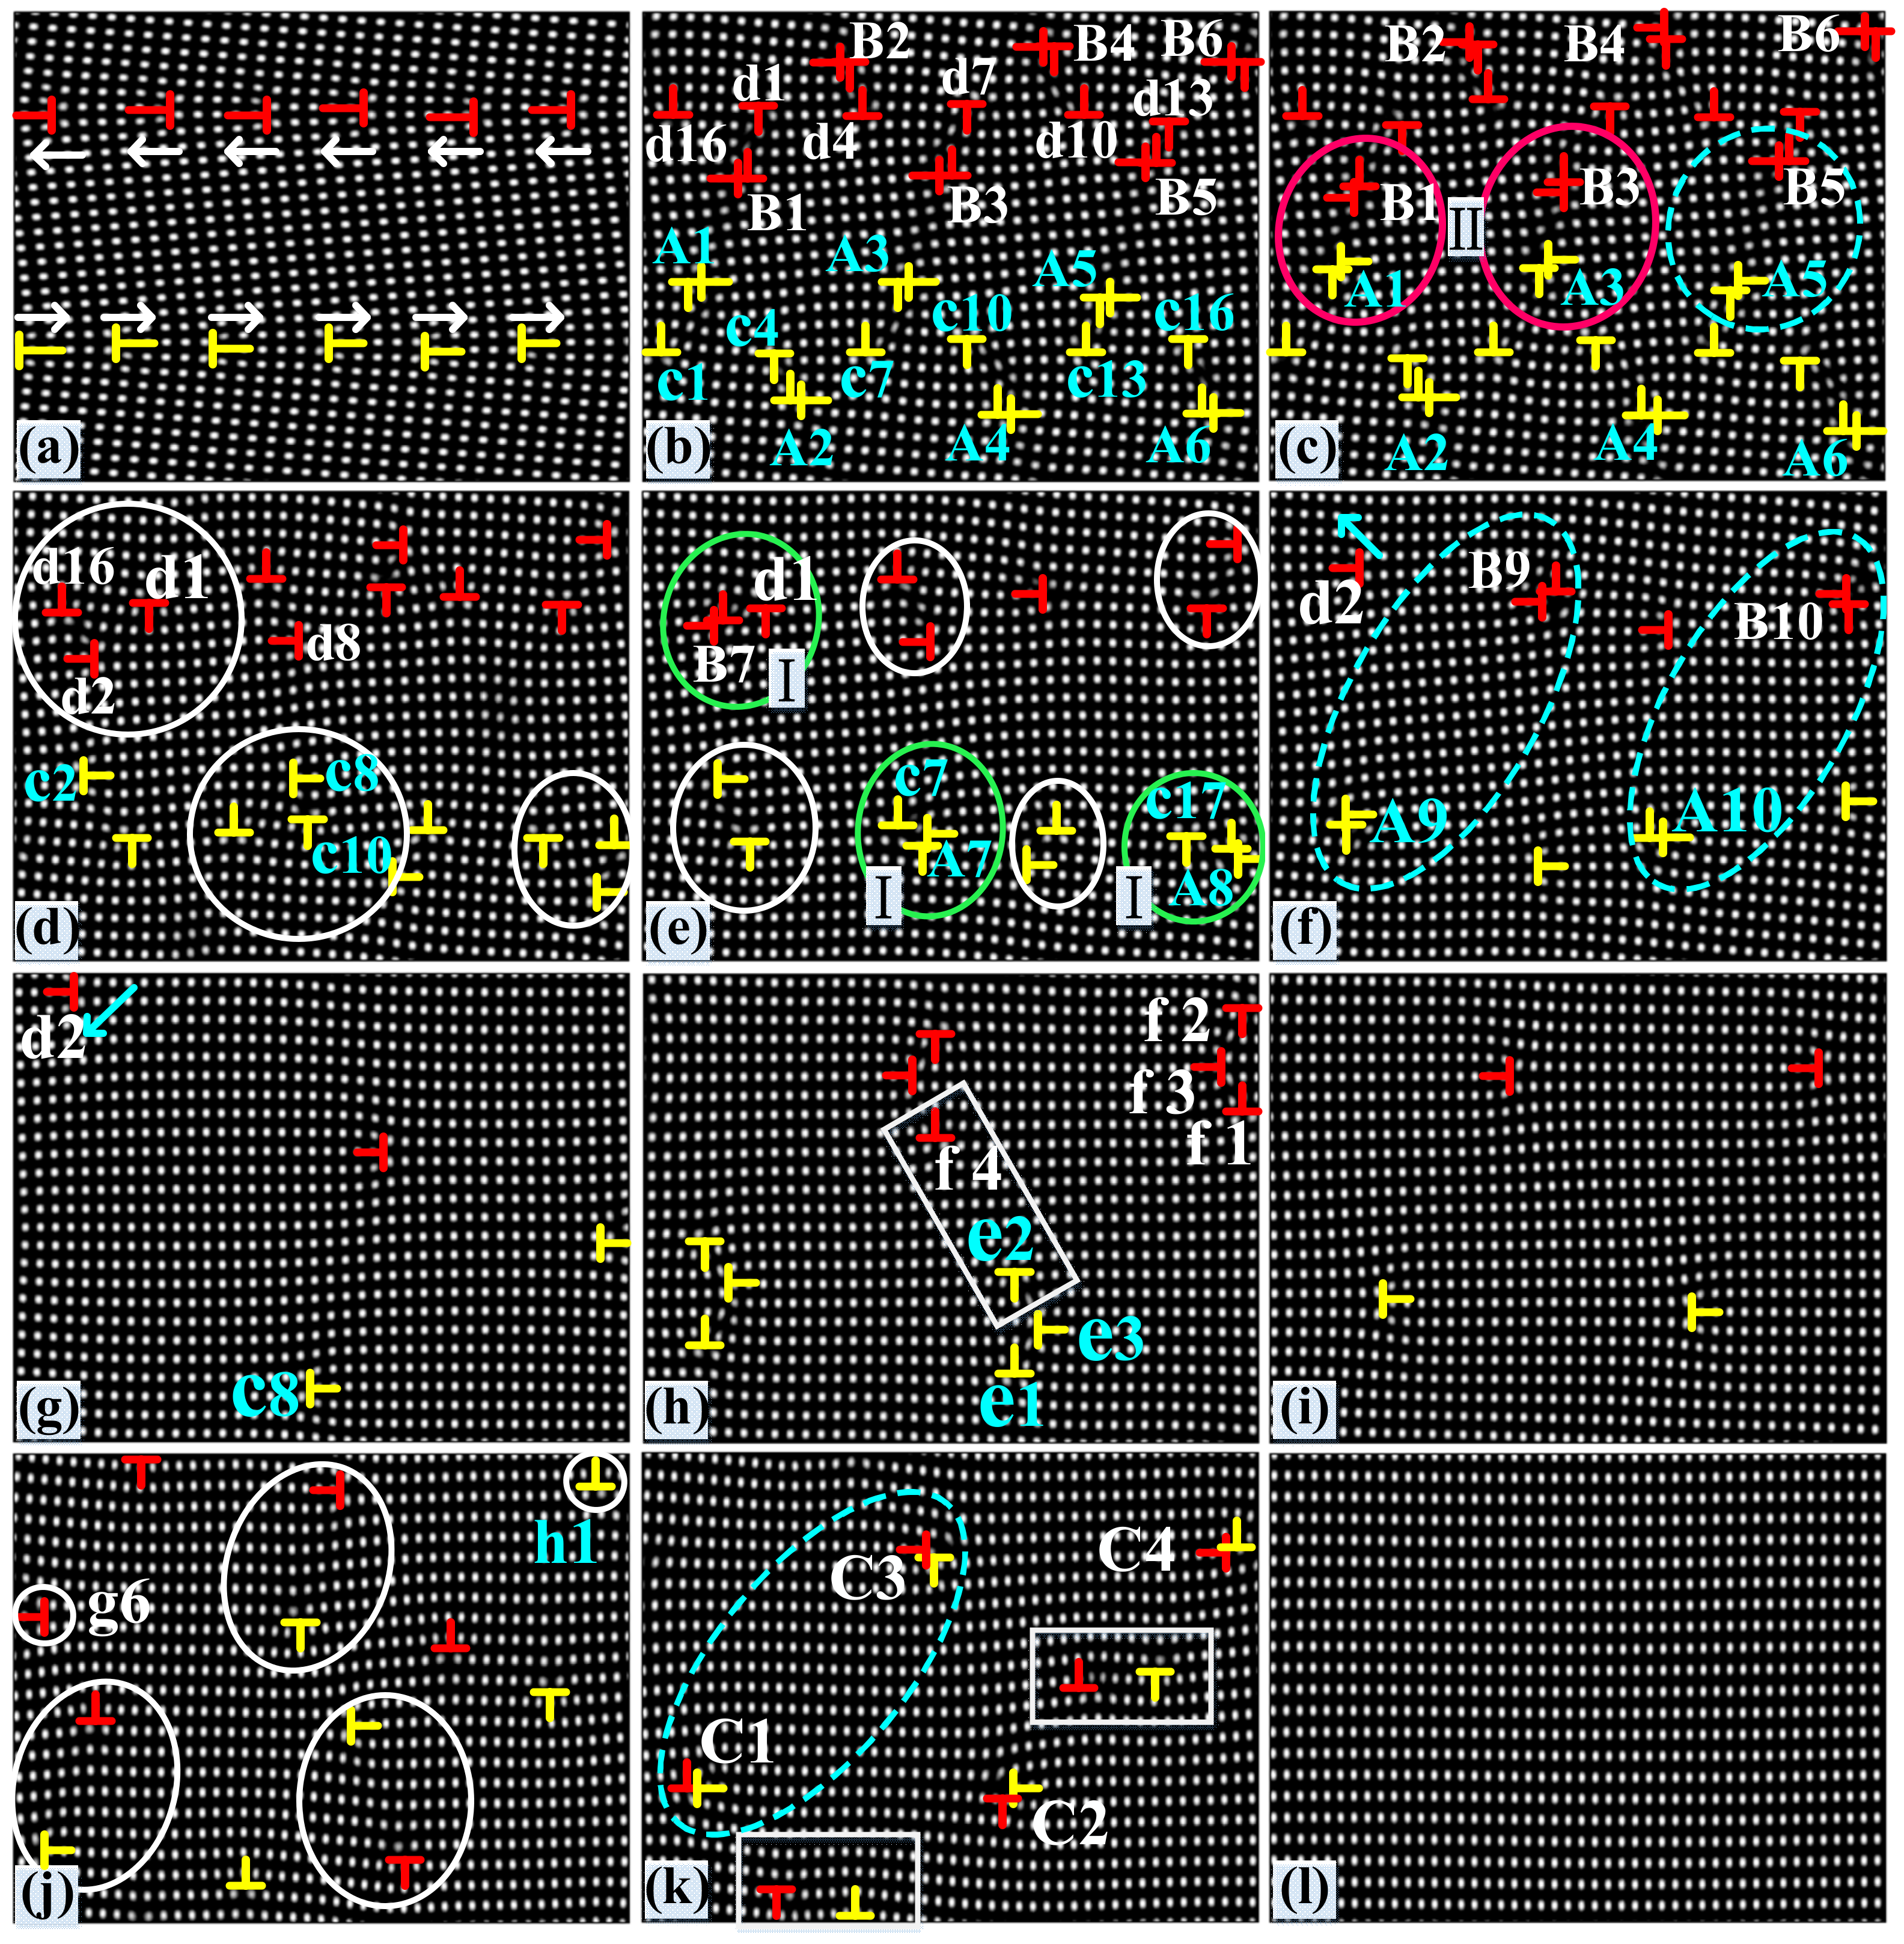
  • Grain boundaries can be activated as dislocation sources to emit dislocations. The misorientation angle has a significant effect on the frequency of dislocation emission.
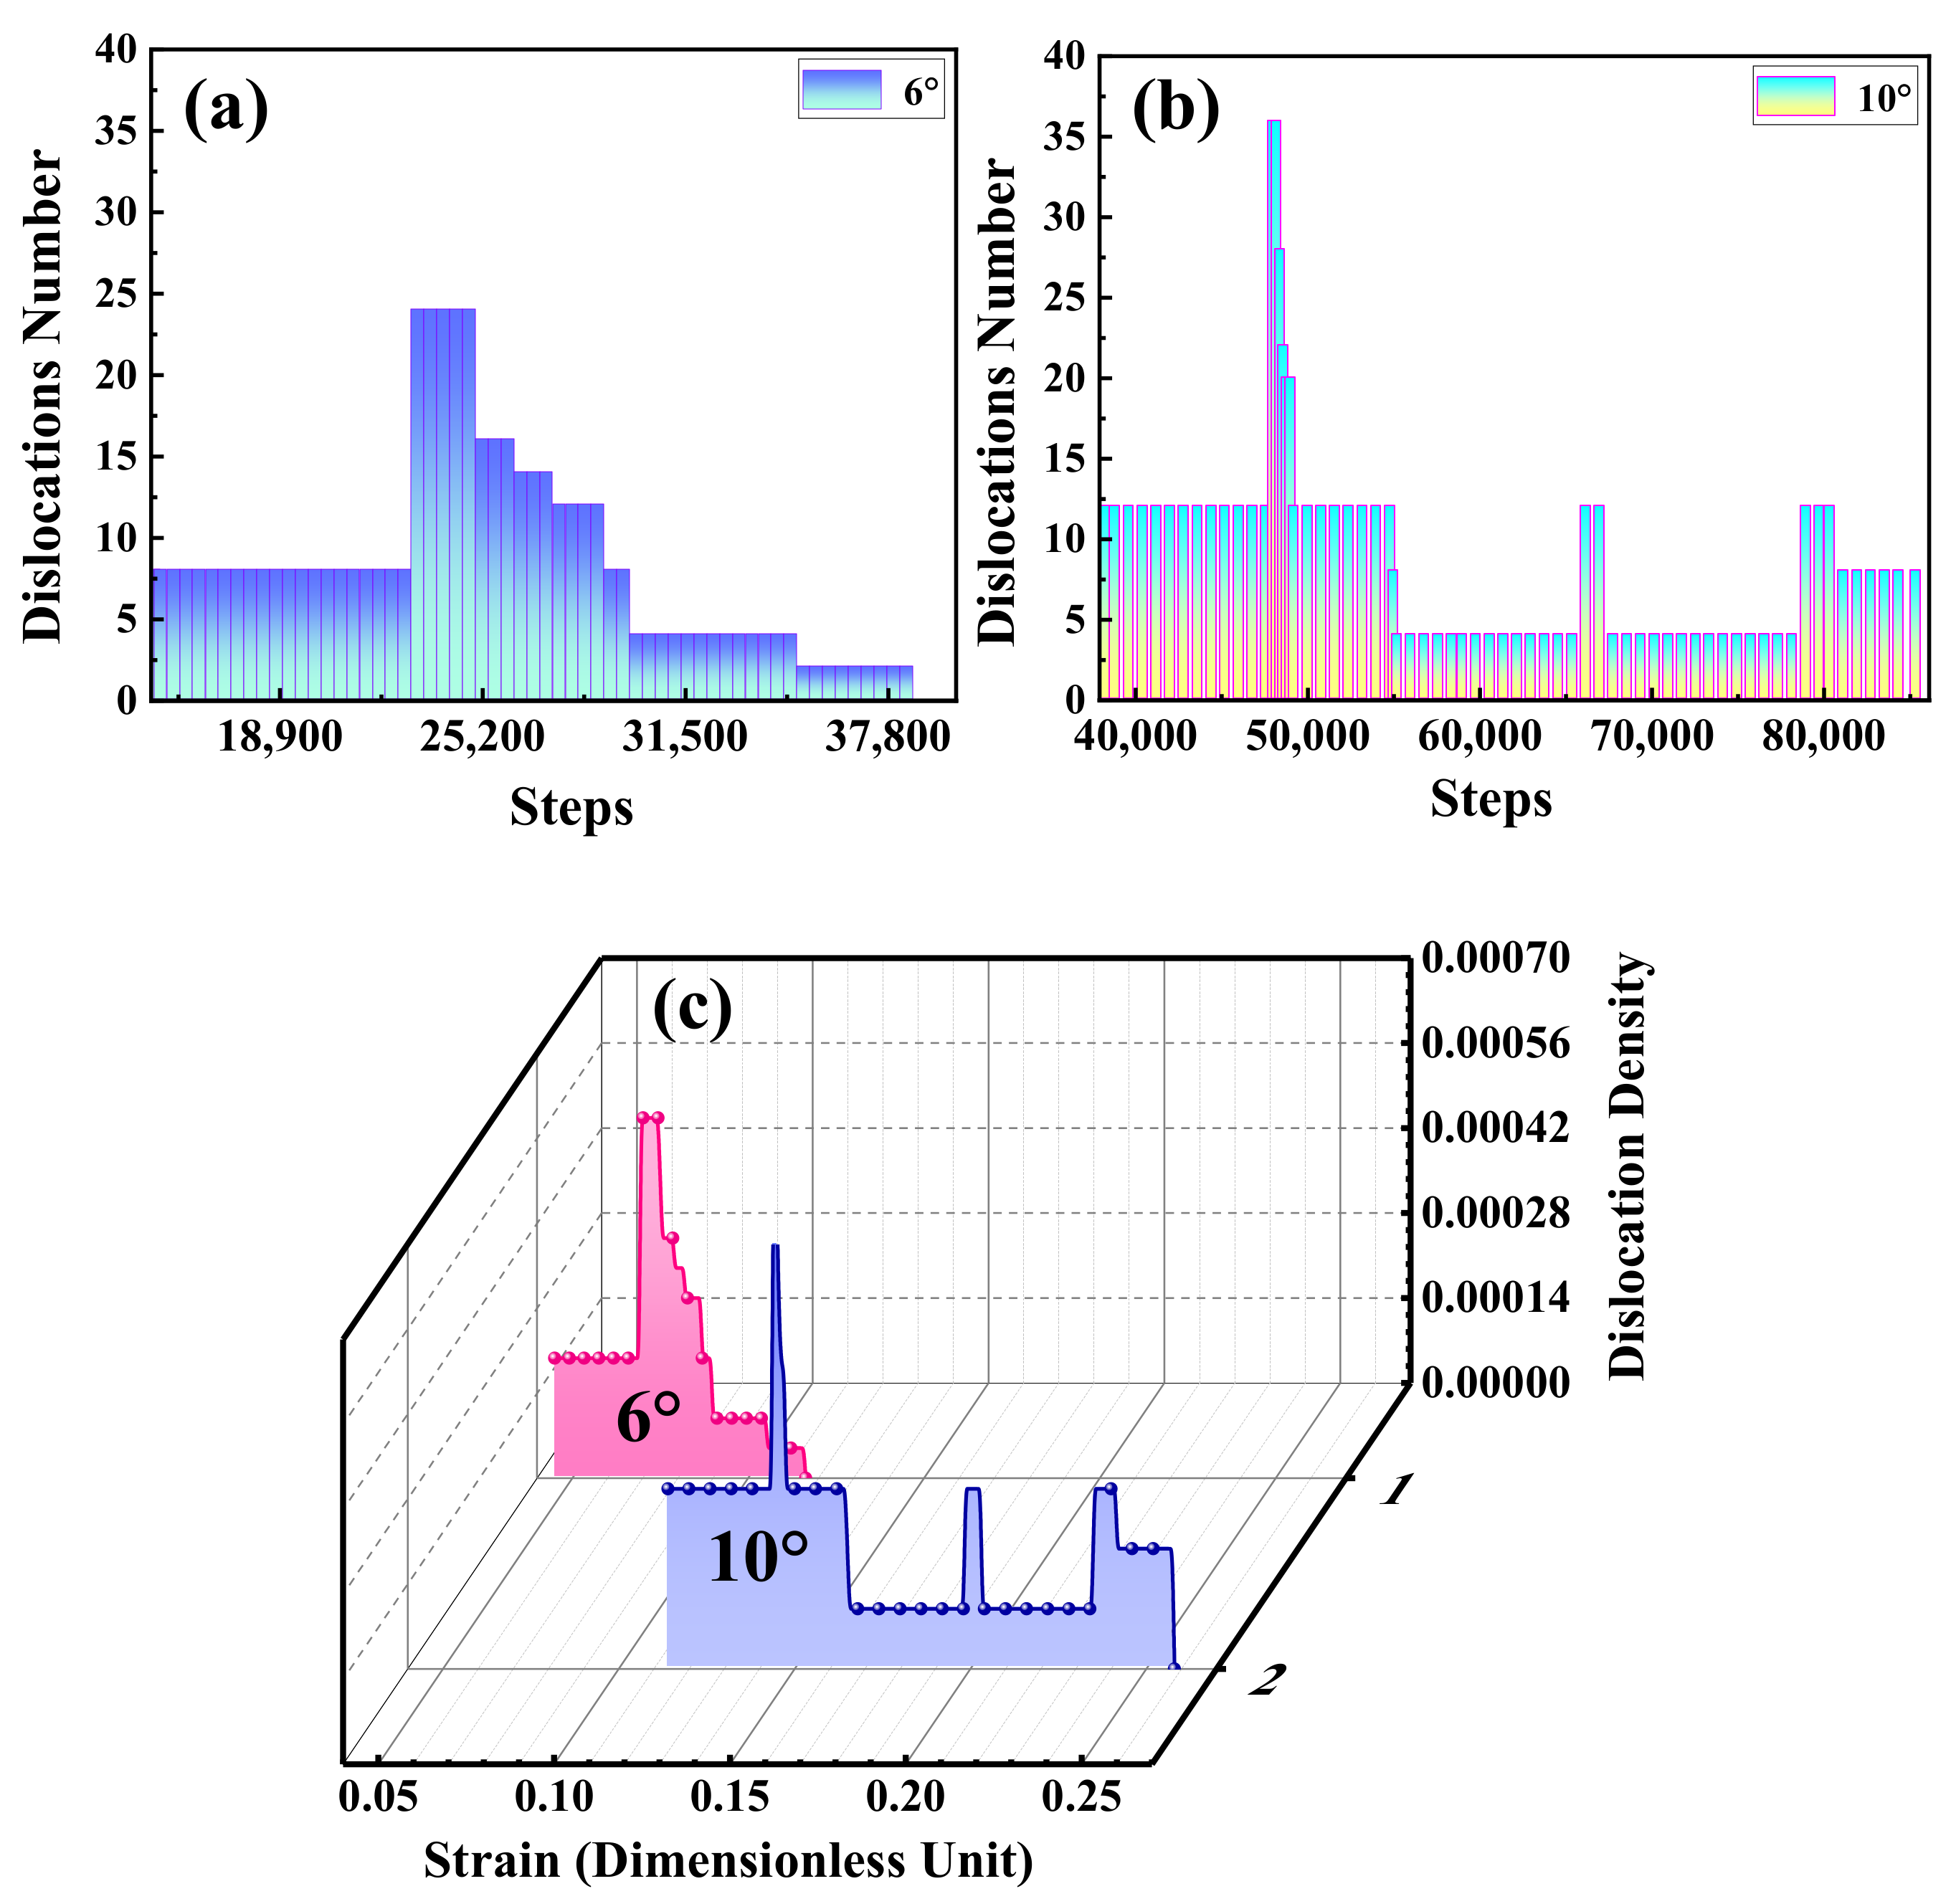
  • The frequency of dislocations’ emission is higher when the misorientation angle is larger than when it is small. It can also be said that when the misorientation angle is large, a new source of dislocation is activated. Therefore, it can be speculated in theory that when the grain size is small, the grain boundary misorientation angle can be appropriately increased, which can activate more dislocation sources and increase the toughness of nanomaterials. In addition, Increasing the misorientation increases the dislocation density.
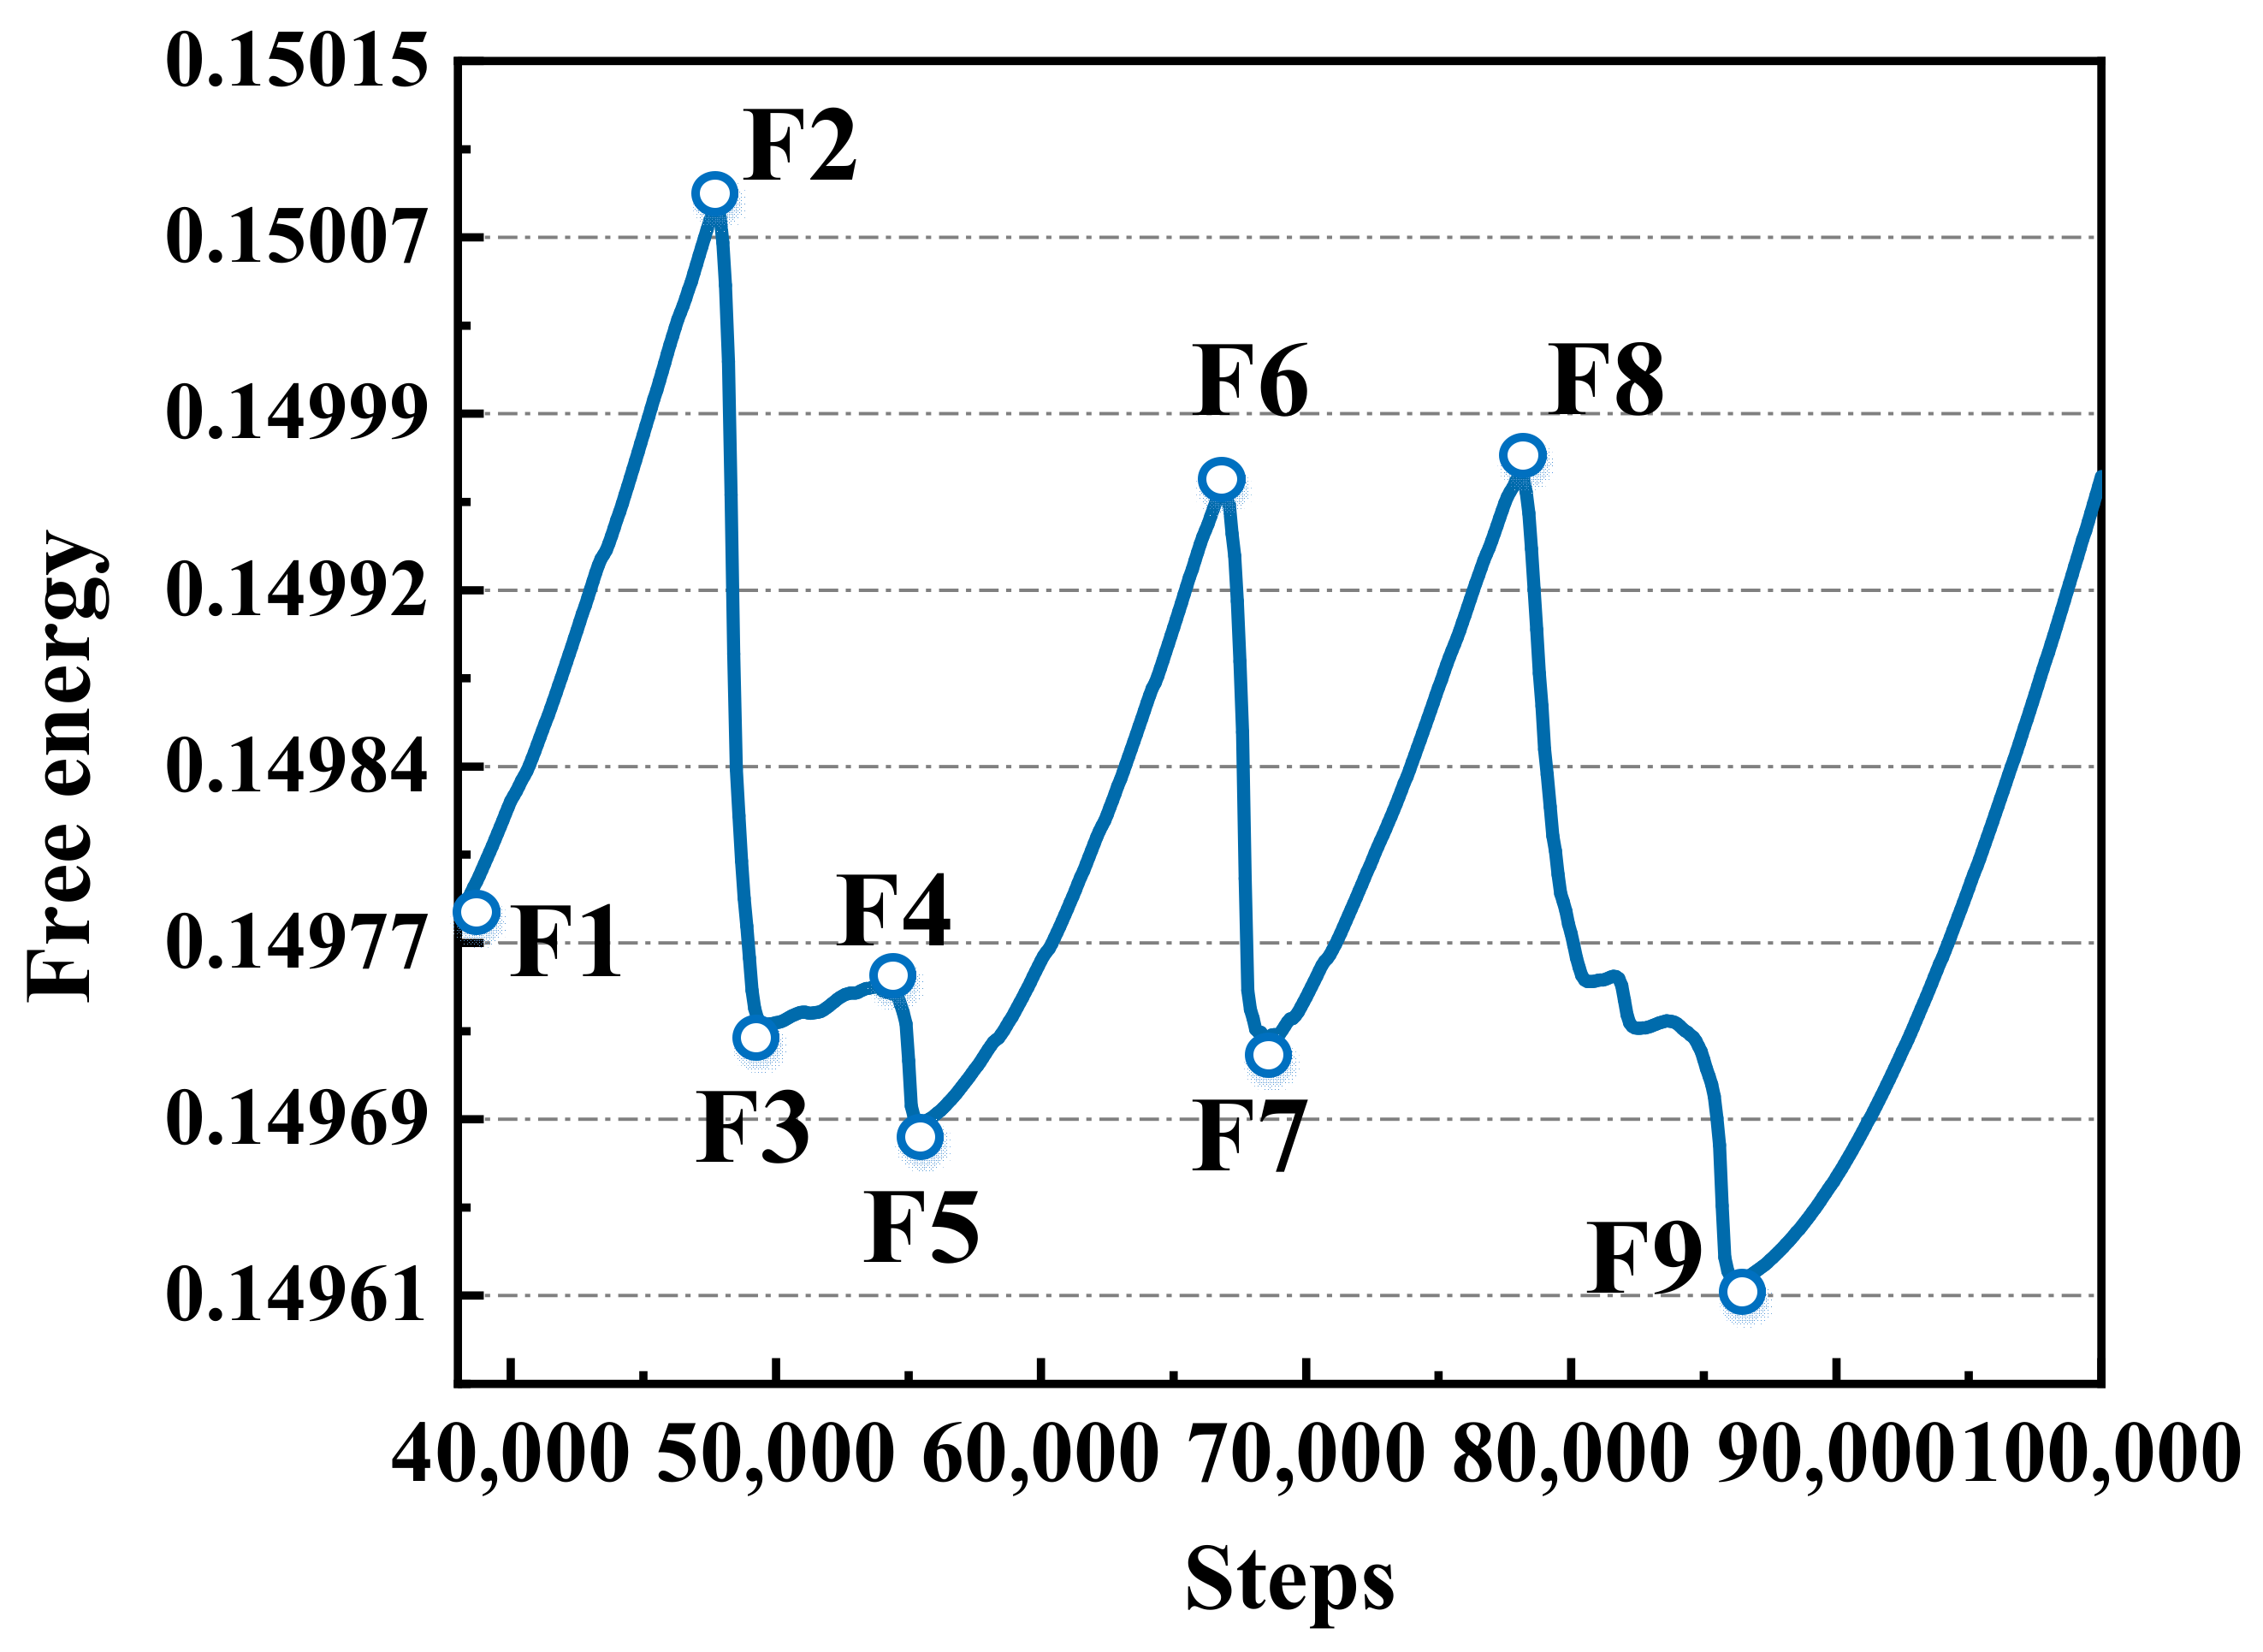
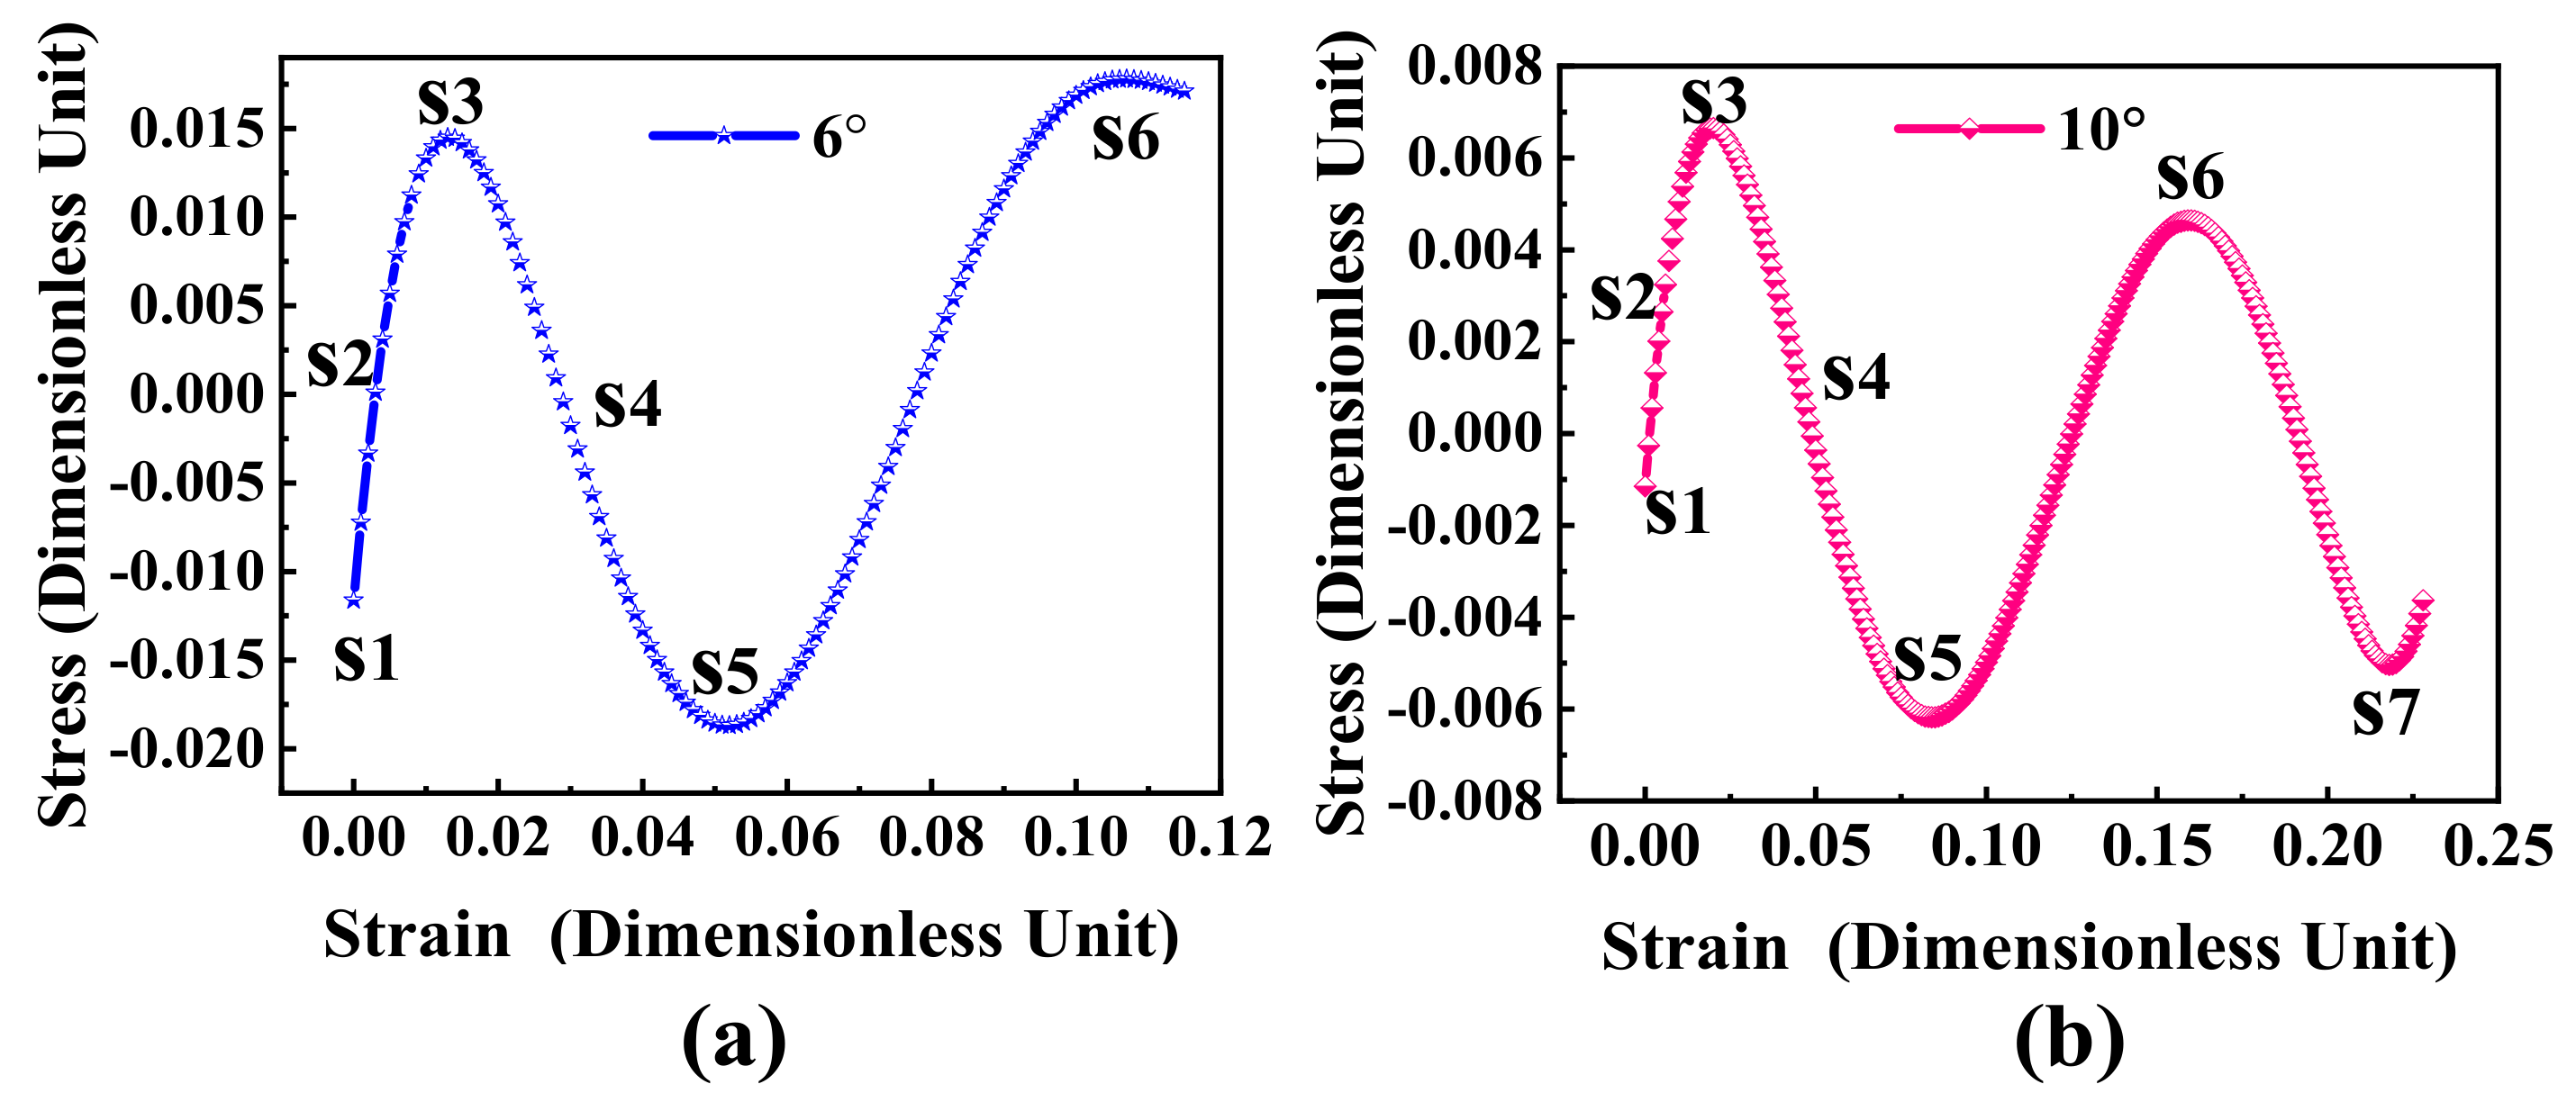
  • The bi-crystal releases stress through the motion, proliferation, and annihilation of dislocations. When the orientation angle increases, dislocation proliferation (dissociation) and annihilation become more frequent.

Author Contributions

X.W.: methodology, formal analysis, data curation, writing—review and editing; H.Z.: methodology, investigation, data curation, writing—review and editing; S.Y.: methodology, supervision; Y.Z. (Yongmei Zhang): supervision, formal analysis; X.T.: visualization; D.P.: validation; Y.Z. (Yuhong Zhao): supervision, software, project administration. All authors have read and agreed to the published version of the manuscript.

Funding

This work was supported by the National Natural Science Foundation of China (Nos. 52074246).

Institutional Review Board Statement

Not applicable.

Informed Consent Statement

Not applicable.

Data Availability Statement

The data presented in this study are available on request from the corresponding author.

Conflicts of Interest

The authors declare no conflict of interest.

References

  1. Shimokawa, T.; Kinari, T.; Shintaku, S. Interaction mechanism between edge dislocations and asymmetrical tilt grain boundaries investigated via quasicontinuum simulations. Phys. Rev. B 2007, 75, 144108. [Google Scholar] [CrossRef]
  2. Feng, H.; Pang, J.; Fang, Q.; Chen, C.; Wen, P. Enhanced ductility of nanomaterials through cooperative dislocation emission from cracks and grain boundaries. Int. J. Mech. Sci. 2020, 179, 105652. [Google Scholar] [CrossRef]
  3. Zhang, L.; Lu, C.; Tieu, K.; Pei, L.Q.; Zhao, X.; Cheng, K.Y. Molecular dynamics study on the grain boundary dislocation source in nanocrystalline copper under tensile loading. Mater. Res. Express. 2015, 2, 035009. [Google Scholar] [CrossRef] [Green Version]
  4. Lu, S.; Xiong, J.; Wei, D.; Ding, Y.; Zhang, B.; Wu, R.; Zhang, X. Effect of Dislocation Mechanism on Elastoplastic Behavior of Crystals with Heterogeneous Dislocation Distribution. Acta Mech. Solida Sin. 2020, 33, 487–495. [Google Scholar] [CrossRef]
  5. Sun, B.; Shen, T. Probing the Deformation Mechanisms of Nanocrystalline Silver by In-Situ Tension and Synchrotron X-ray Diffraction. Metals 2020, 10, 1635. [Google Scholar] [CrossRef]
  6. Zhang, X.; Andrä, H.; Harjo, S.; Gong, W.; Kawasaki, T.; Lutz, A.; Lahres, M. Quantifying internal strains, stresses, and dislocation density in additively manufactured AlSi10Mg during loading-unloading-reloading deformation. Mater. Des. 2021, 198, 109339. [Google Scholar] [CrossRef]
  7. Kumar, K.; Van Swygenhoven, H.; Suresh, S. Mechanical behavior of nanocrystalline metals and alloys. Acta Mater. 2003, 51, 5743–5774. [Google Scholar] [CrossRef]
  8. Wang, W.; Chen, Z.N.; Guo, E.Y.; Kang, H.J.; Liu, Y.; Zou, C.L.; Li, R.G.; Yin, G.M.; Wang, T.M. Influence of Cryorolling on the Precipitation of Cu–Ni–Si Alloys: An In Situ X-ray Diffraction Study. Acta Met. Sin. 2018, 31, 1089–1097. [Google Scholar] [CrossRef] [Green Version]
  9. Li, Q.; Song, J.; Liu, G.; Liu, Y.; Wang, J.; Zeng, X. Migration kinetics of twinning disconnections in nanotwinned Cu: An in situ HRTEM deformation study. Scr. Mater. 2021, 194, 113621. [Google Scholar] [CrossRef]
  10. Spearot, D.E.; Jacob, K.I.; McDowell, D.L. Nucleation of dislocations from [001] bicrystal interfaces in aluminum. Acta Mater. 2005, 53, 3579–3589. [Google Scholar] [CrossRef]
  11. Spearot, D.E.; Jacob, K.I.; McDowell, D.L. Dislocation nucleation from bicrystal interfaces with dissociated structure. Int. J. Plast. 2007, 23, 143–160. [Google Scholar] [CrossRef]
  12. Wang, J. Atomistic Simulations of Dislocation Pileup: Grain Boundaries Interaction. JOM 2015, 67, 1515–1525. [Google Scholar] [CrossRef]
  13. Singh, D.; Parashar, A. Effect of symmetric and asymmetric tilt grain boundaries on the tensile behaviour of bcc-Niobium. Comput. Mater. Sci. 2018, 143, 126–132. [Google Scholar] [CrossRef]
  14. Feng, Y.X.; Shang, J.X.; Qin, S.J. Tensile response of (1 1 0) twist grain boundaries in tungsten: A molecular dynamics study. Comput. Mater. Sci. 2019, 159, 265–272. [Google Scholar] [CrossRef]
  15. Kuhr, B.; Farkas, D.; Robertson, I.M.; Johnson, D.; Was, G. Stress Localization Resulting from Grain Boundary Dislocation Interactions in Relaxed and Defective Grain Boundaries. Met. Mater. Trans. A 2020, 51, 667–683. [Google Scholar] [CrossRef]
  16. Elder, K.R.; Katakowski, M.; Haataja, M.; Grant, M. Modeling Elasticity in Crystal Growth. Phys. Rev. Lett. 2002, 88, 245701. [Google Scholar] [CrossRef] [Green Version]
  17. Elder, K.R.; Grant, M. Modeling elastic and plastic deformations in nonequilibrium processing using phase field crystals. Phys. Rev. E 2004, 70, 051605. [Google Scholar] [CrossRef] [Green Version]
  18. Tang, S.; Backofen, R.; Wang, J.; Zhou, Y.; Voigt, A.; Yu, Y.M. Three-dimensional phase-field crystal modeling of fcc and bcc dendritic crystal growth. J. Cryst. Growth 2011, 334, 146–152. [Google Scholar] [CrossRef]
  19. Tang, S.; Wang, Z.; Guo, Y.; Wang, J.; Yu, Y.; Zhou, Y. Atomic scale modeling of vicinal surface growth from melts using the phase-field crystal method. J. Cryst. Growth 2013, 374, 11–17. [Google Scholar] [CrossRef]
  20. Wu, K.A.; Adland, A.; Karma, A. Phase-field-crystal model for fcc ordering. Phys. Rev. E 2010, 81, 061601. [Google Scholar] [CrossRef] [Green Version]
  21. Zhang, S.; Chen, Z.; Yang, T. Simulation of structure and deformation of asymmetrical tilt grain boundaries with small misorientation angles by two-mode phase field crystal method. Rare Metal Mater. Eng. 2014, 43, 610–614. [Google Scholar]
  22. Wu, L.; Pan, R.; Zhang, W.; Chen, Z.; Wang, H.; Zhang, J. Two-mode phase field crystal study of evolution of grain boundaries and dislocations in hexagonal to square phase transformation. Rare Metal Mater. Eng. 2020, 49, 4103–4111. [Google Scholar] [CrossRef]
  23. Yun, J.J.; Chen, Z.; Li, S.J. Multistage microstructural evolution caused by deformation in two-mode phase field crystals. Acta Phys. Sin. 2014, 63, 098106. [Google Scholar] [CrossRef]
  24. Kong, L.Y.; Lum, Y.J.; Deng, Q.Q.; Huang, L.L.; Luo, Z.R.; Gao, Y.J. Phase field crystal simulation of grain boundary annihilation with two-dimensional large orientation Angle. J. Guangxi Acad. Sci. 2017, 33, 8–13. [Google Scholar] [CrossRef]
  25. Hu, S.; Chen, Z.; Yu, G.G.; Xi, W.; Peng, Y.Y. Phase-field-crystal study on the reaction mechanisms of opposite sign edge dislocations appearing in the deformation processes of asymmetric tilt sub-grain boundary system. Comput. Mater. Sci. 2016, 124, 195–203. [Google Scholar] [CrossRef]
  26. Lu, Y.; Peng, Y.; Chen, Z. A binary phase field crystal study for liquid phase heteroepitaxial growth. Superlattices Microstruct. 2016, 97, 132–139. [Google Scholar] [CrossRef]
  27. Tian, X.L.; Zhao, Y.H.; Peng, D.W.; Guo, Q.W.; Guo, Z.; Hou, H. Phase-field crystal simulation of evolution of liquid pools in grain boundary pre-melting regions. Trans. Nonferrous Met. Soc. China 2021, 31, 1175–1188. [Google Scholar] [CrossRef]
  28. Guo, H.; Zhao, Y.; Sun, Y.; Tian, J.; Hou, H.; Qi, K.; Tian, X. Phase field crystal study of grain boundary structure and annihilation mechanism in low-angle grain boundary. Superlattices Microstruct. 2019, 129, 163–175. [Google Scholar] [CrossRef]
  29. Qi, K.W.; Zhao, Y.H.; Guo, H.J.; Tian, X.L.; Hou, H. Phase field crystal simulation of the effect of temperature on low-angle symmetric tilt grain boundary dislocation motion. Acta Phys. Sin. 2019, 68, 170504. [Google Scholar] [CrossRef]
  30. Gao, Y.J.; Deng, Q.Q.; Liu, Z.Y.; Huang, Z.J.; Li, Y.X.; Luo, Z.R. Modes of grain growth and mechanism of dislocation reaction under applied biaxial strain: Atomistic and continuum modeling. J. Mater. Sci. Technol. 2020, 49, 236–250. [Google Scholar] [CrossRef]
  31. Gao, Y.J.; Huang, L.L.; Deng, Q.Q.; Zhou, W.Q.; Luo, Z.R.; Lin, K. Phase field crystal simulation of dislocation configuration evolution in dynamic recovery in two dimensions. Acta Mater. 2016, 117, 238–251. [Google Scholar] [CrossRef]
  32. Hirouchi, T.; Takaki, T.; Tomita, Y. Development of numerical scheme for phase field crystal deformation simulation. Comput. Mater. Sci. 2009, 44, 1192–1197. [Google Scholar] [CrossRef]
  33. Kong, L.Y.; Gao, Y.J.; Deng, Q.Q.; Luo, Z.-R.; Lu, Y.J. A Study of Strain-Driven Nucleation and Extension of Deformed Grain: Phase Field Crystal and Continuum Modeling. Materials 2018, 11, 1805. [Google Scholar] [CrossRef] [PubMed] [Green Version]
  34. Zhong, C.; Zhang, H.; Cao, Q.; Wang, X.; Zhang, D.; Ramamurty, U.; Jiang, J. On the critical thickness for non-localized to localized plastic flow transition in metallic glasses: A molecular dynamics study. Scr. Mater. 2016, 114, 93–97. [Google Scholar] [CrossRef]
  35. Sundararajan, G.; Tirupataiah, Y. The localization of plastic flow under dynamic indentation conditions: I. Experimental results. Acta Mater. 2006, 54, 565–575. [Google Scholar] [CrossRef]
Figure 1. Two-dimensional phase diagram of two-mode approximate calculation; the area of the middle grid is a two-phases coexistence region.
Metals 12 00712 g001
Figure 2. (ac) are simulation diagrams and free energy curves of the grain solidification growth process with θ = 6 ° and θ = 10 ° , respectively. t * = 100 , t * = 200 , t * = 1000 .
Metals 12 00712 g002
Figure 3. The evolution of dislocations in sample A. The white arrow indicates the migration direction. Type I semi-annihilation occurs in the green solid line area. The full annihilation of dislocation pairs occurs in the blue dotted line area. New dislocation pairs are about to form in the white solid line area. The (ai) corresponding time steps are t* = 15,000; t* = 24,100; t* = 24,700; t* = 25,100; t* = 25,800; t* = 27,100; t* = 28,800; t* = 29,900; and t* = 39,000.
Metals 12 00712 g003
Figure 4. Free energy curved of dislocations evolution of the sample A. F1–F7 represent energy value points.
Metals 12 00712 g004
Figure 5. (a,b) respectively represent the stress distribution diagram of new dislocation pairs formed by edge dislocations a1 and a3 perpendicular to each other in Figure 3b, and the annihilation of edge dislocations a3 (A1 formed by a1 and a3) and b2 with opposite Burger vectors from Figure 3b,c. C and T are the compressed and stretched regions, respectively. The white arrow indicates the slip direction of the edge dislocation. The above (below) extra half plane of atoms is subjected to compressive (tensile) strain.
Metals 12 00712 g005
Figure 6. Schematic diagram of the type I semi-annihilation of A1 and b2 in Figure 3c. (ad) corresponding time steps are t* = 24,700; t* = 24,800; t* = 24,900; and t* = 25,000. (a1d1) is a schematic diagram of the atomic structure in the x direction. (a2d2) is the atomic structure in the y direction.
Metals 12 00712 g006
Figure 7. The evolution of the dislocations in sample B. The (al) corresponding time steps are t* = 38,000; t* = 48,100; t* = 48,200; t* = 48,700; t* = 49,000; t* = 49,600; t* = 55,300; t* = 67,200; t* = 68,000; t* = 79,600; t* = 81,200; and t* = 86,000. The pink solid circle area is a type II semi- annihilation dislocation reaction; the full-annihilation of the dislocation pairs occurs in the blue dotted line area. Type I semi-annihilation occurs in the green solid line area, and new dislocation pairs will form within the white solid coil. Inside the white box is the annihilation of single edge dislocation.
Metals 12 00712 g007
Figure 8. Free energy curve of the dislocation evolution in sample B. F1–F9 represent energy value points.
Metals 12 00712 g008
Figure 9. Type II semi-annihilation of dislocations on A1 and B1 in Figure 7c. The (ad) corresponding time steps are t* = 48,200; t* = 48,300; t* = 48,400; and t* = 48,700. (a1d1) is the atomic structure in the x direction; (a2d2) is a schematic diagram of the atomic structure in the y direction.
Metals 12 00712 g009
Figure 10. (a,b) are, respectively, the number of dislocations at 6 ° and 10 ° . (c) Stain and dislocation density at 6 ° and 10 ° .
Metals 12 00712 g010
Figure 11. (a,b) are, respectively, the stress–strain curves at 6 ° and 10 ° from the PFC simulation. S1–S7 represent different stress value points.
Metals 12 00712 g011
Table 1. Parameters for sample preparation.
SampleTemperatureInitialDensityStrain RateCrystal Orientation AngleMisorientation Angle
ϵ ψ 0 ε ˙ θ 1 θ 2 θ
A 0.2 0.2 8 6 × 10 6 3 ° 3 ° 6 °
B 5 ° 5 ° 10 °
The symbol means the parameter is the same as the previous line.
Publisher’s Note: MDPI stays neutral with regard to jurisdictional claims in published maps and institutional affiliations.

