
Effect of Vertical High Magnetic Field on the Morphology of Solid-Liquid Interface during the Directional Solidification of Zn-2wt.%Bi Immiscible Alloy

 ,
, 
Abstract
:1. Introduction
2. Experiments
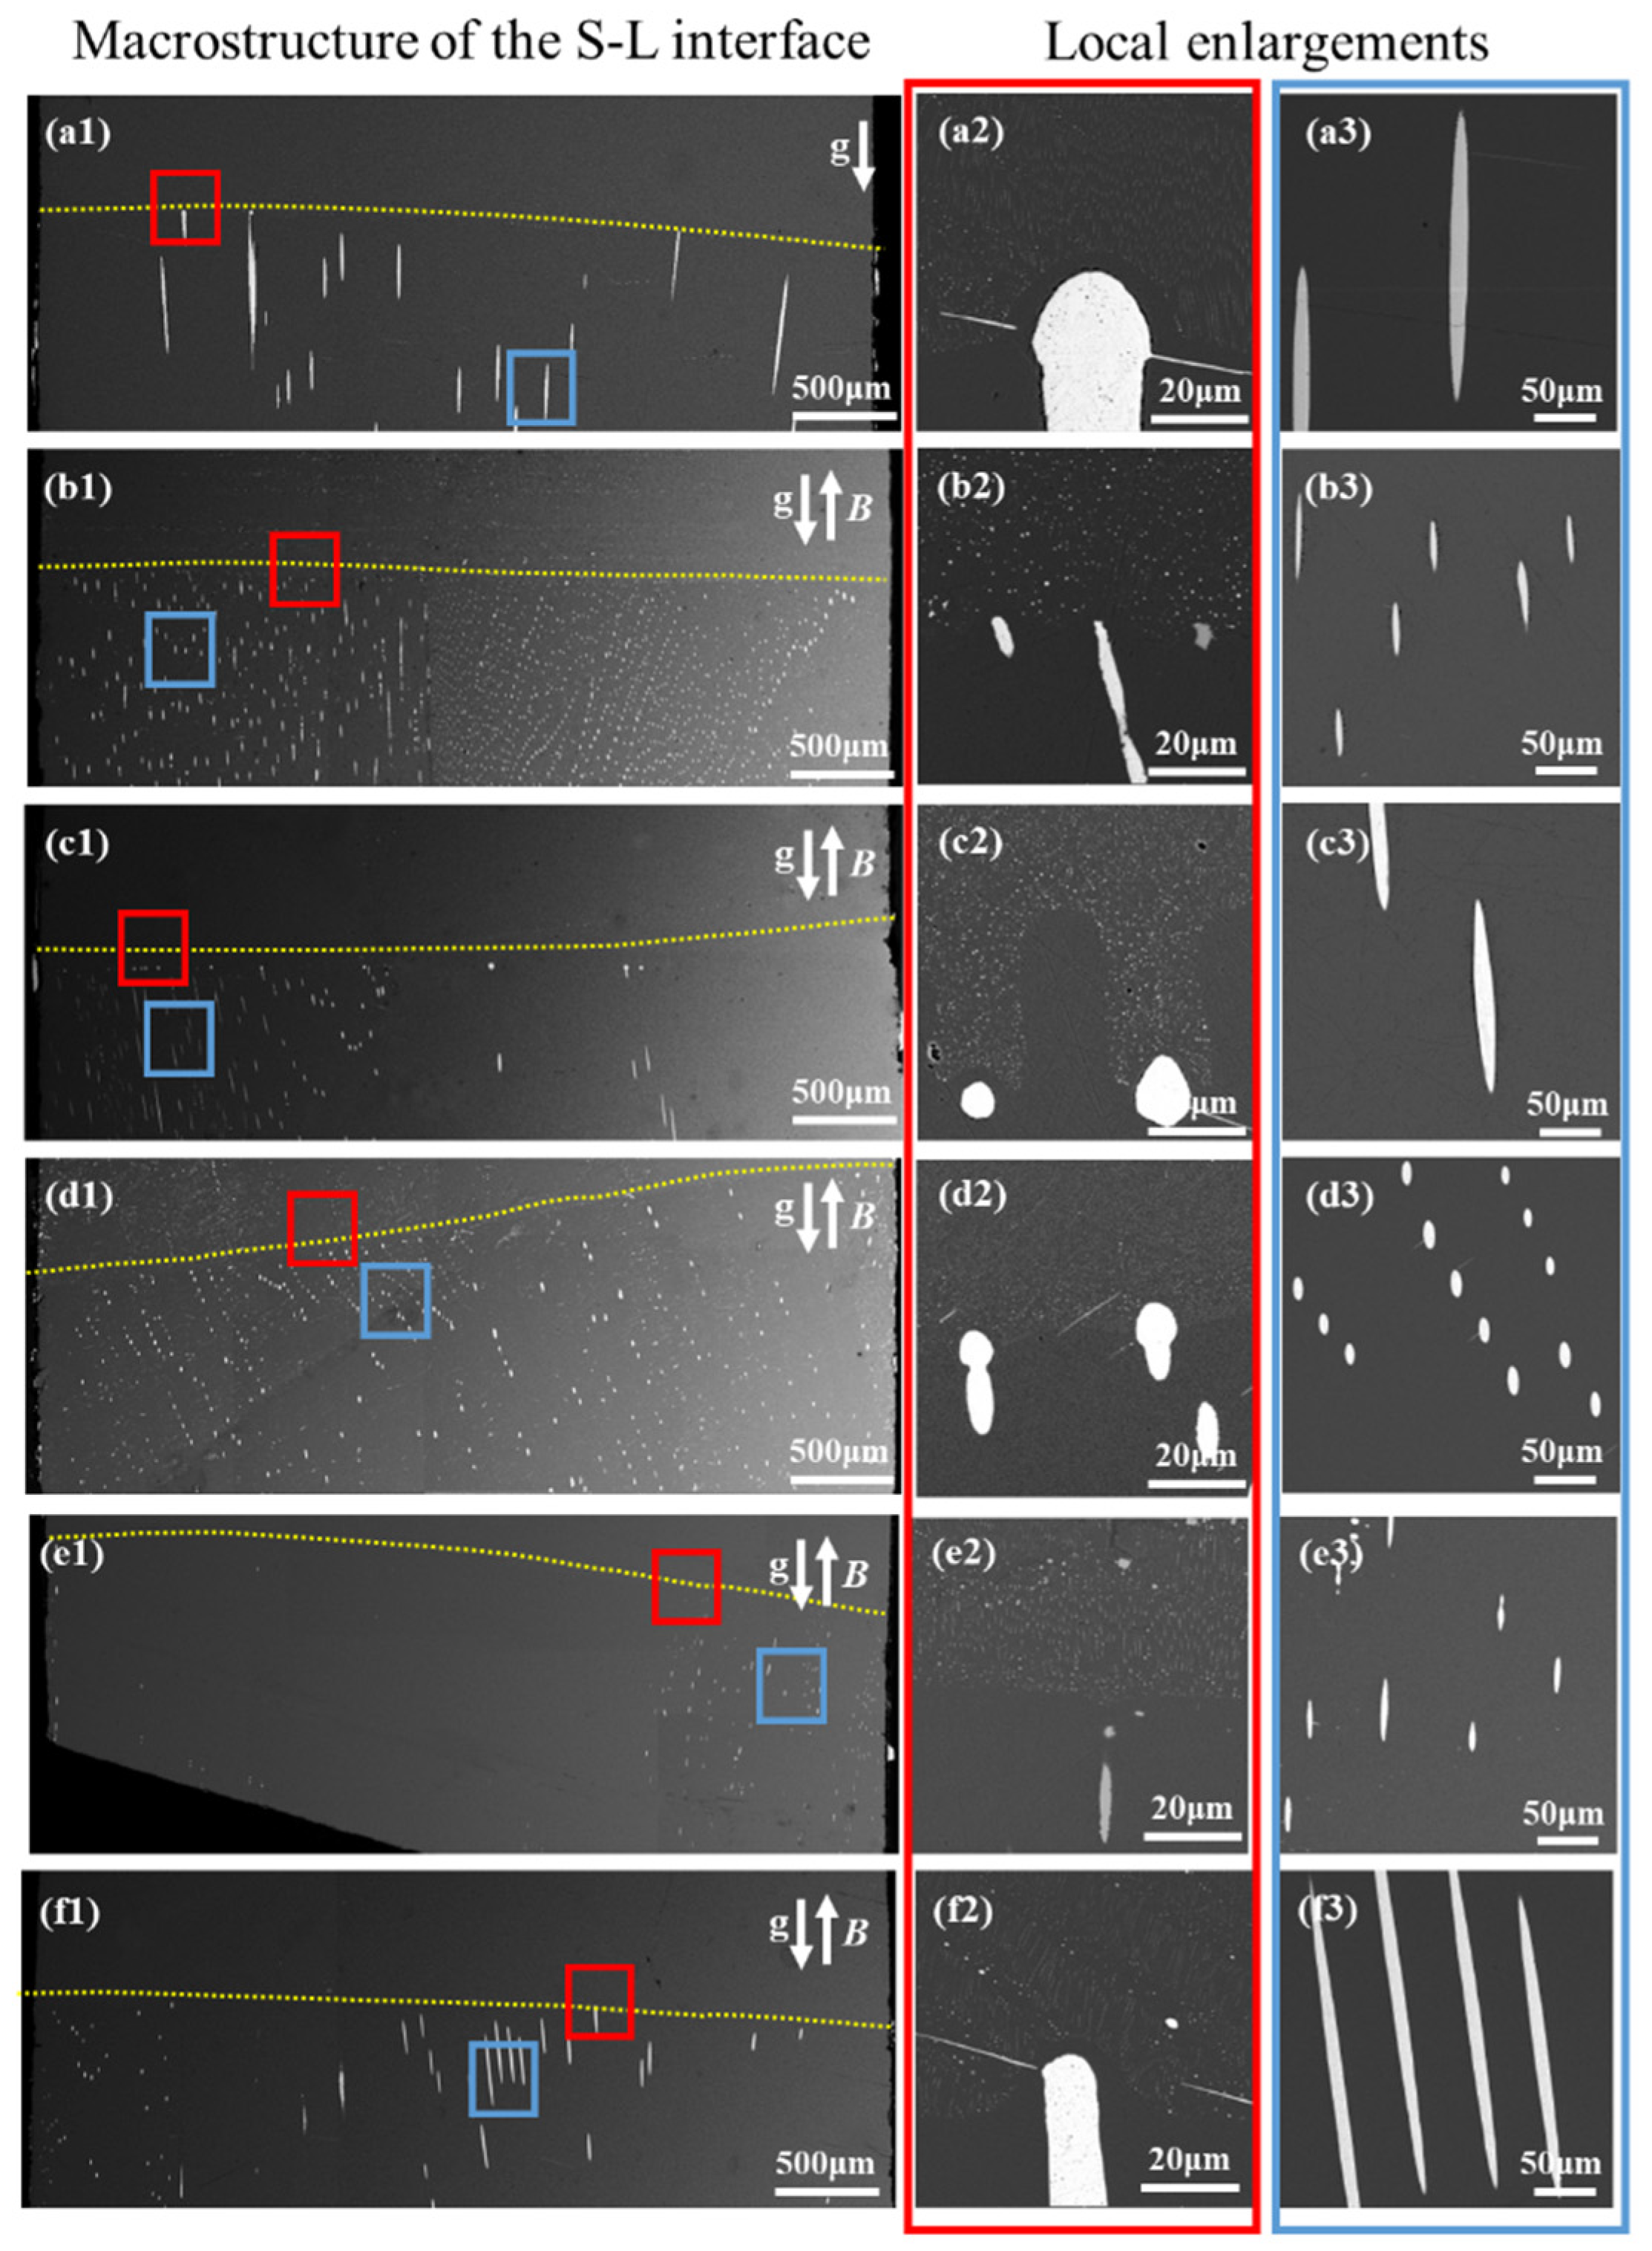
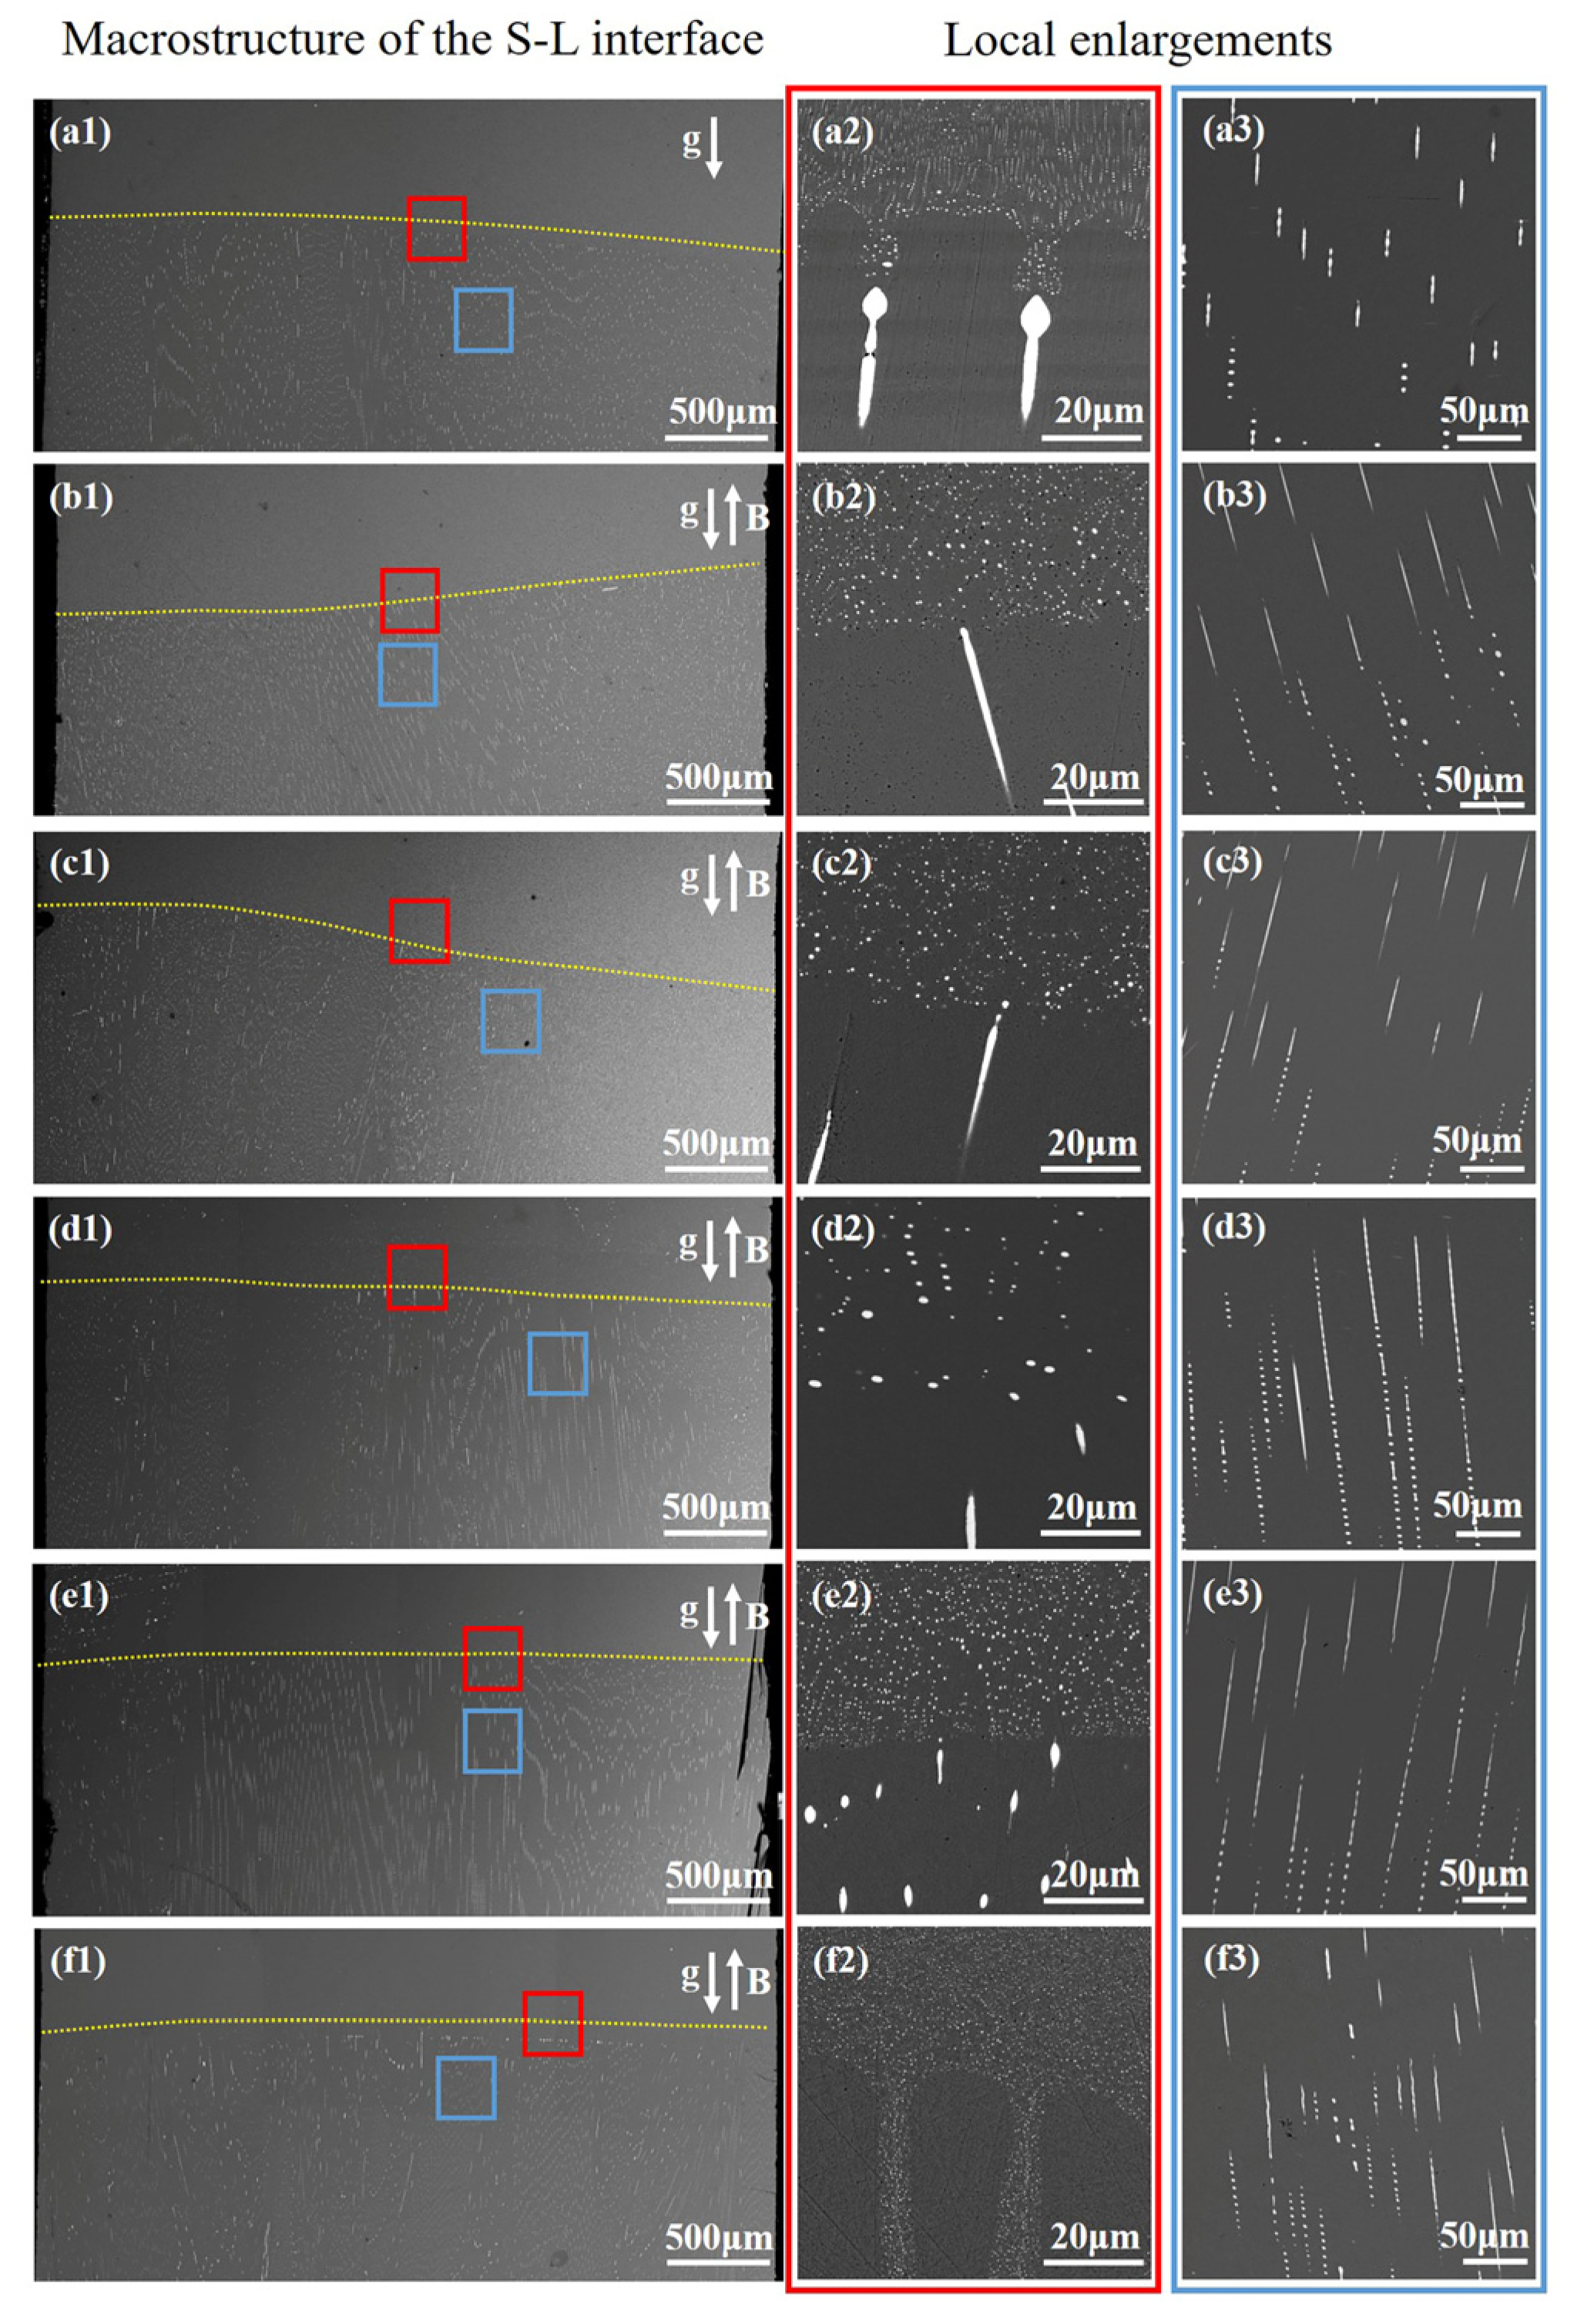
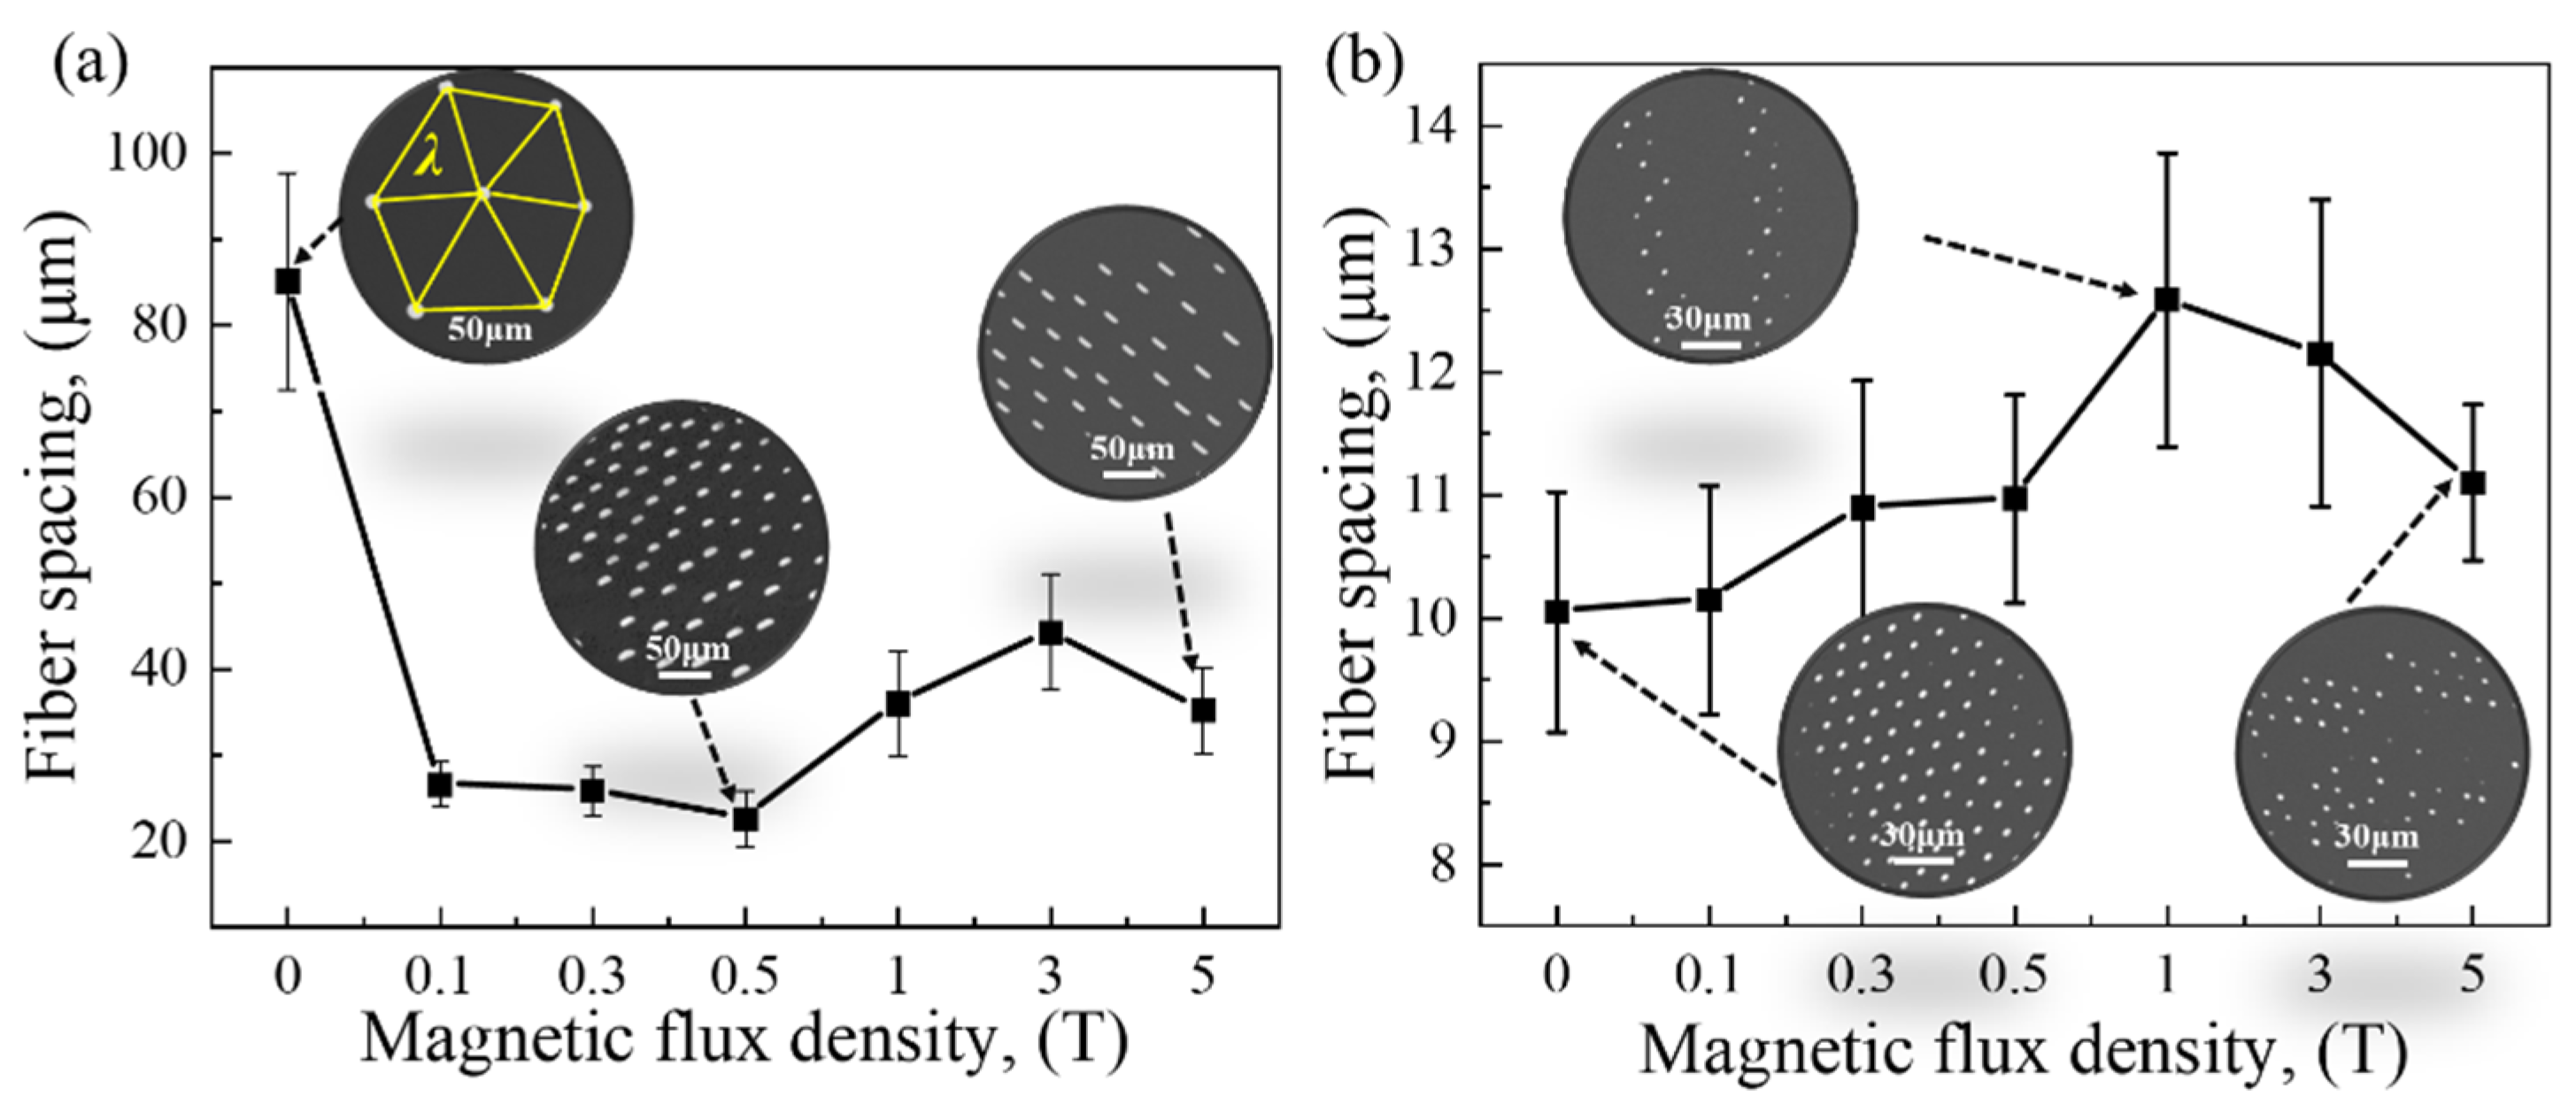
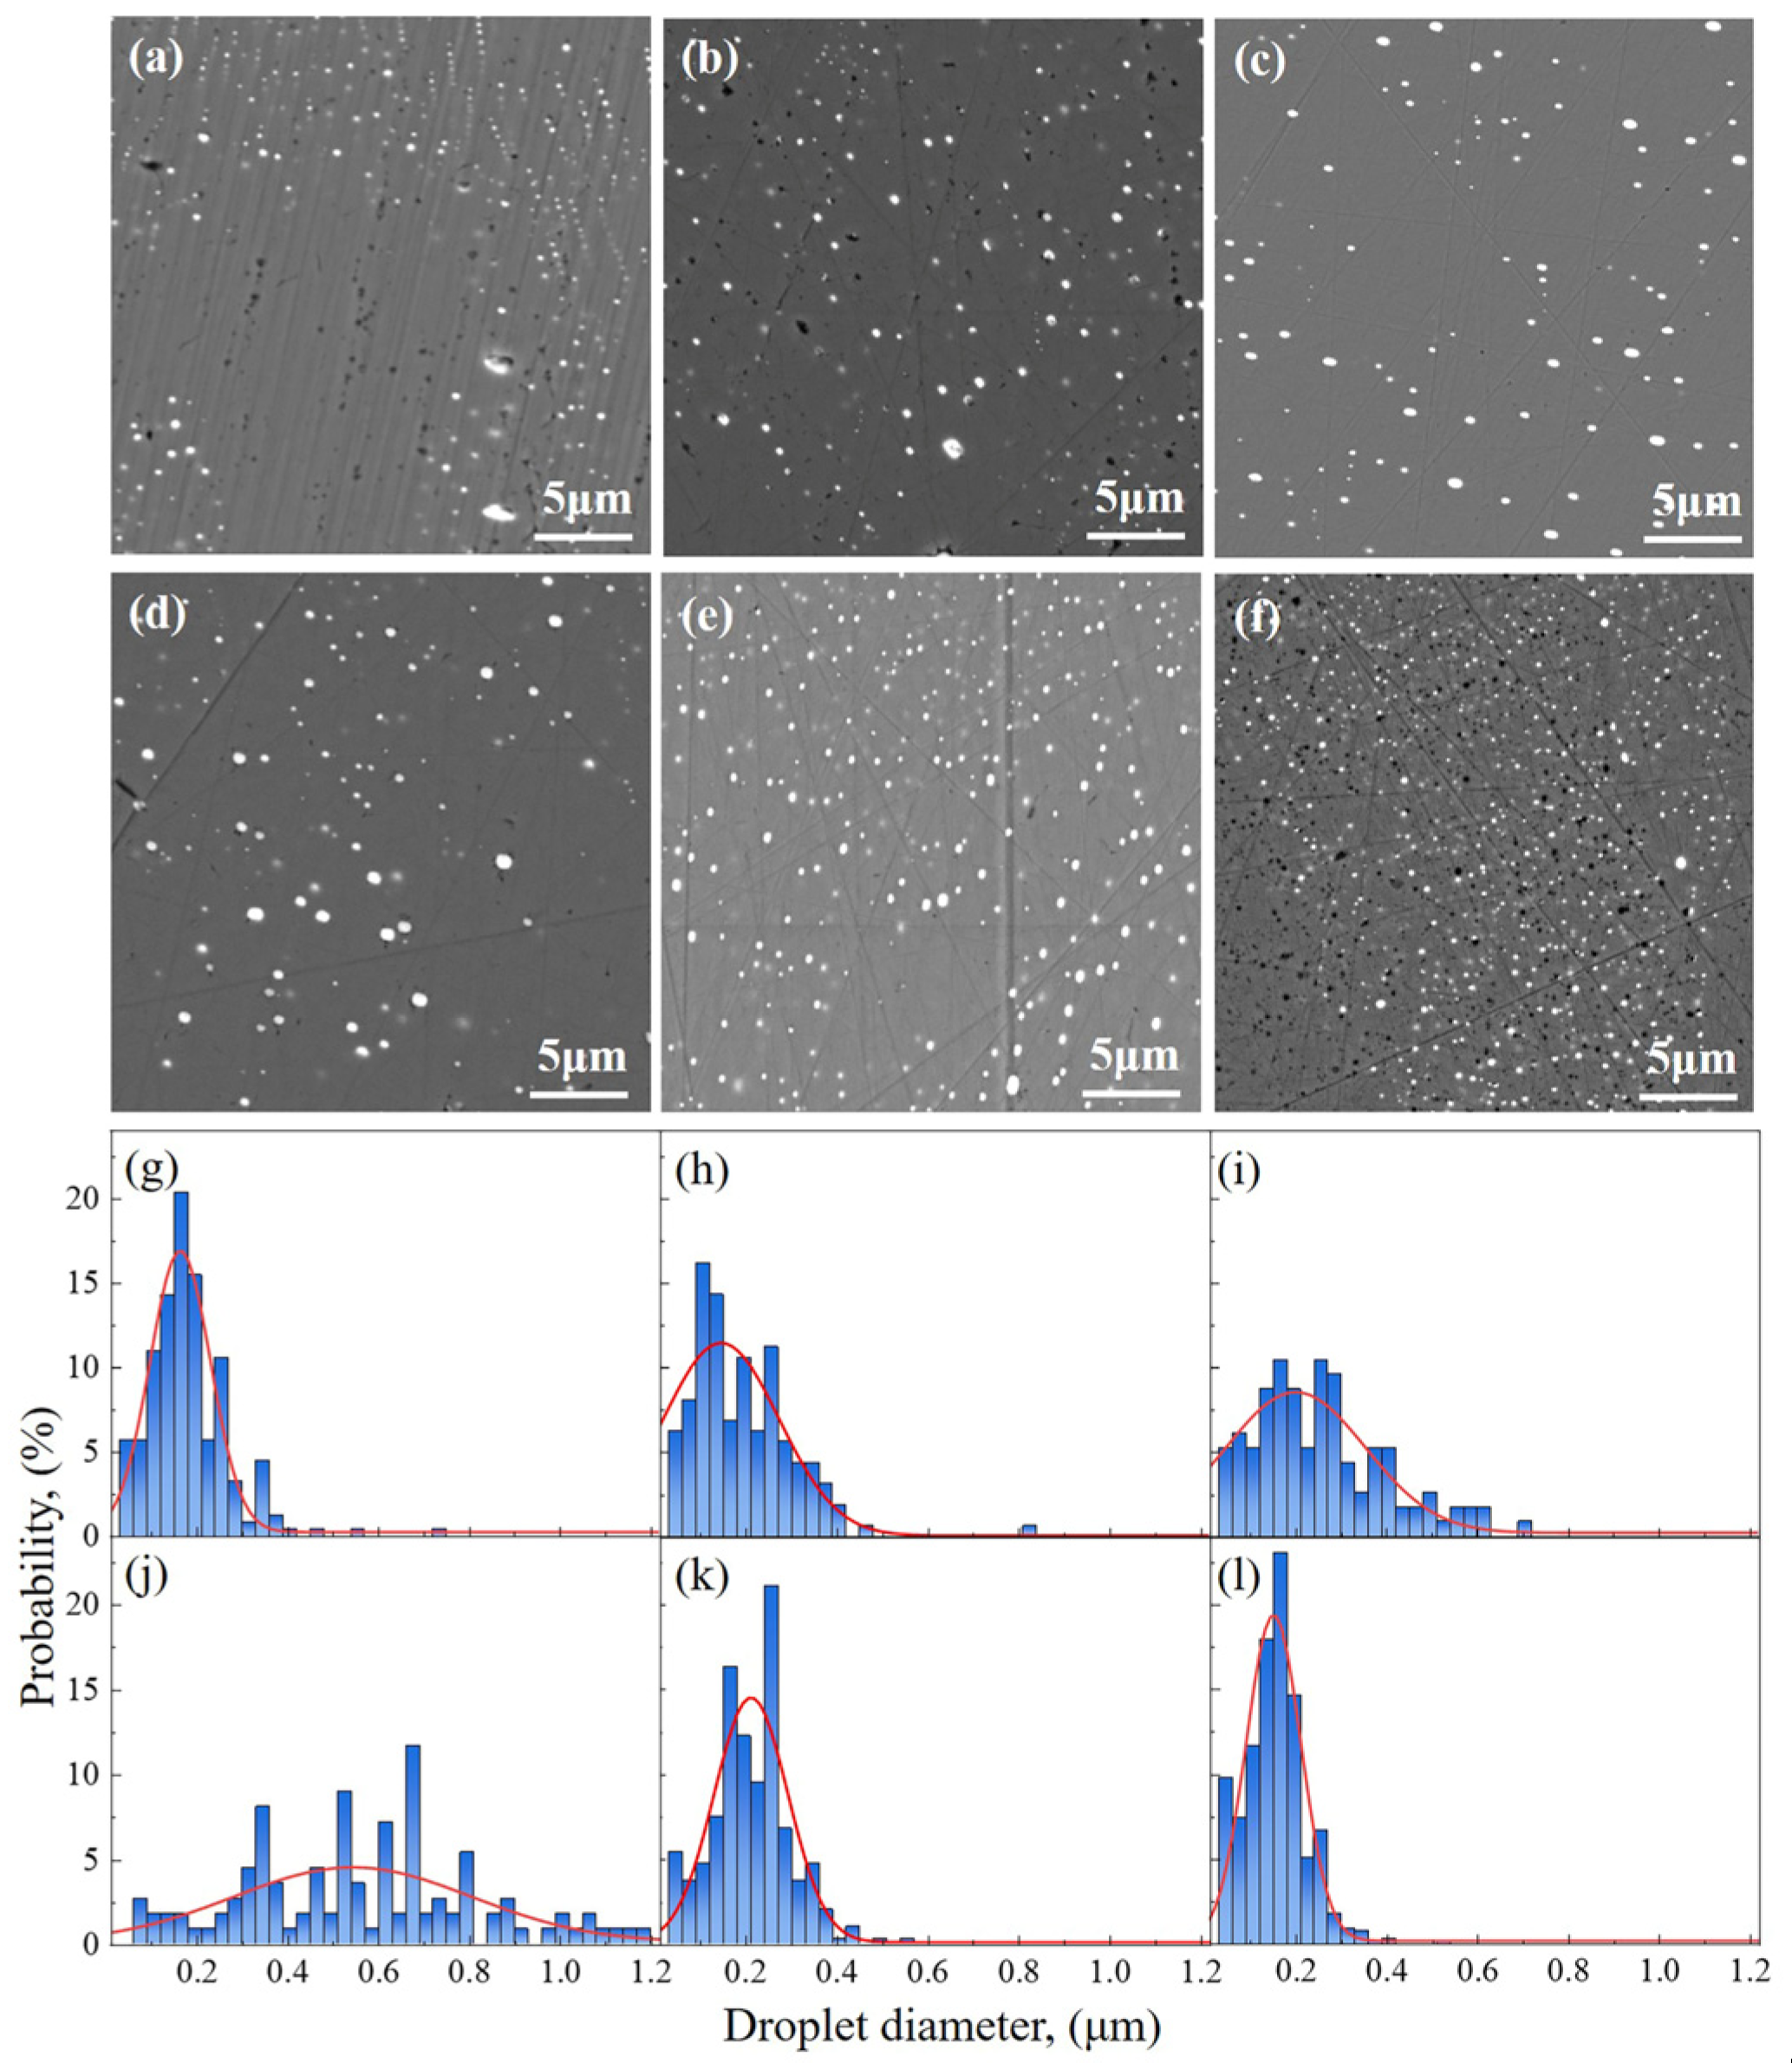
3. Results
4. Discussions
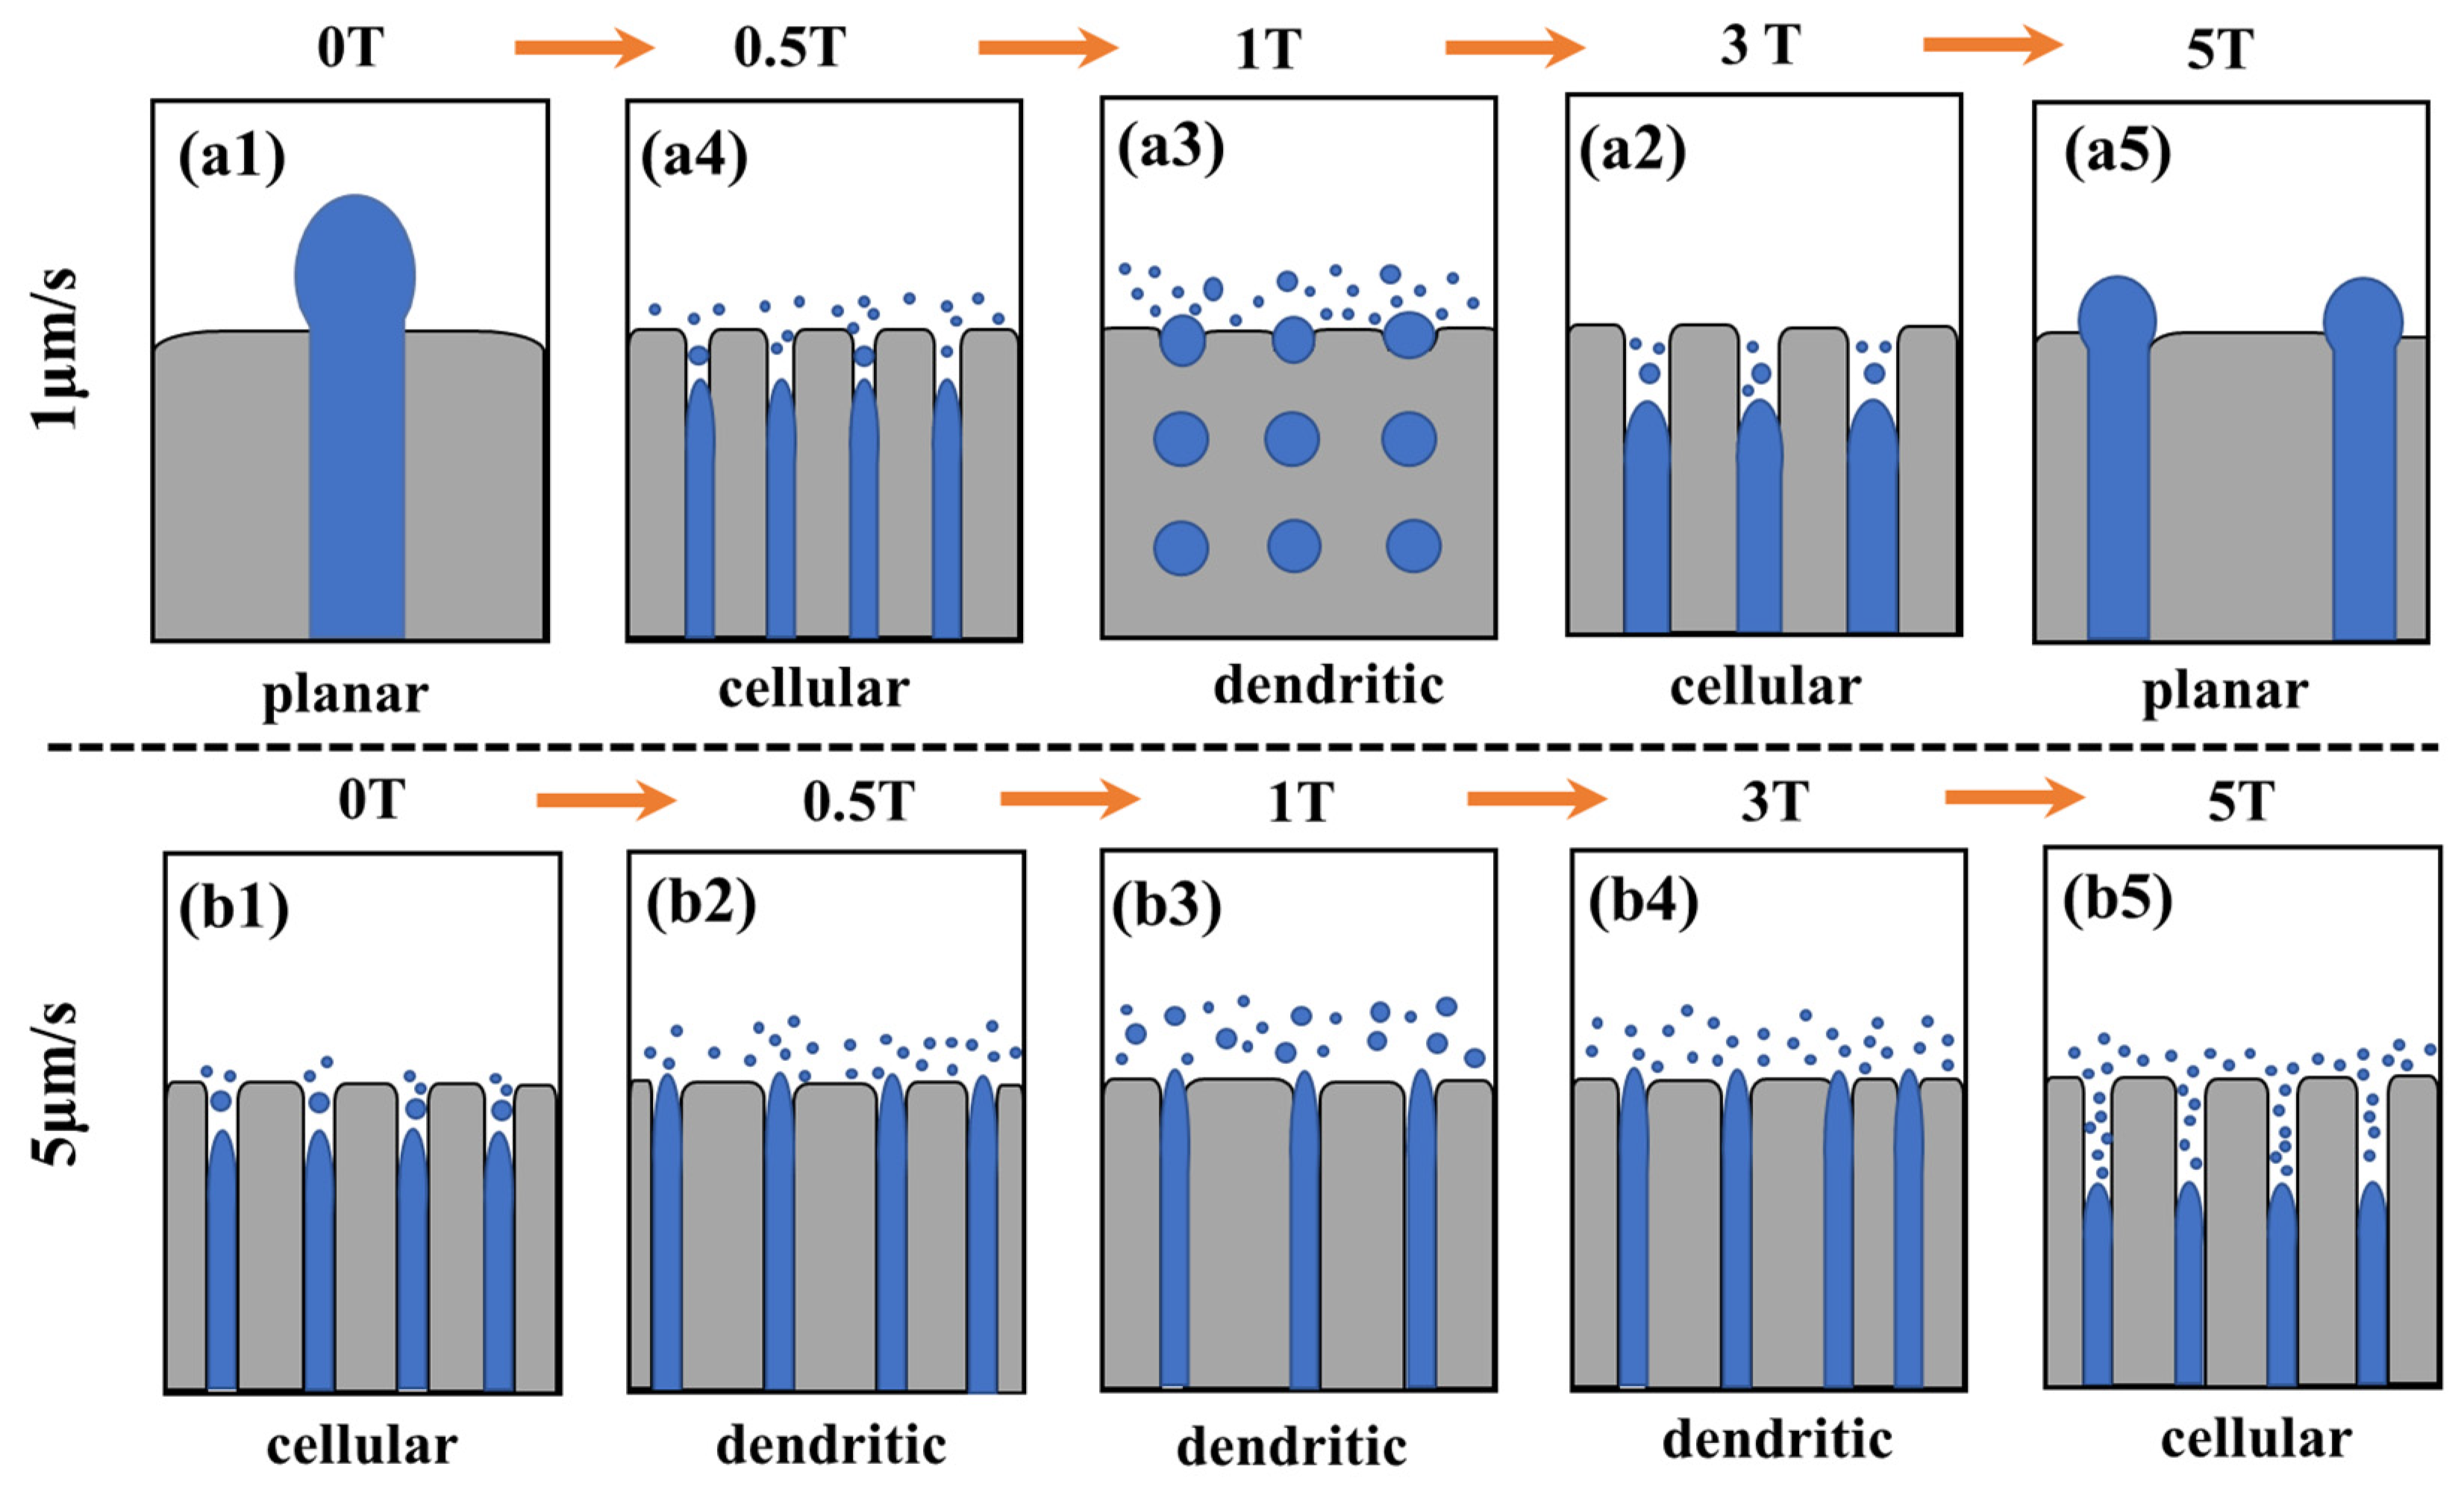
4.1. Morphological Evolution of the S-L Interface under Various MFDs
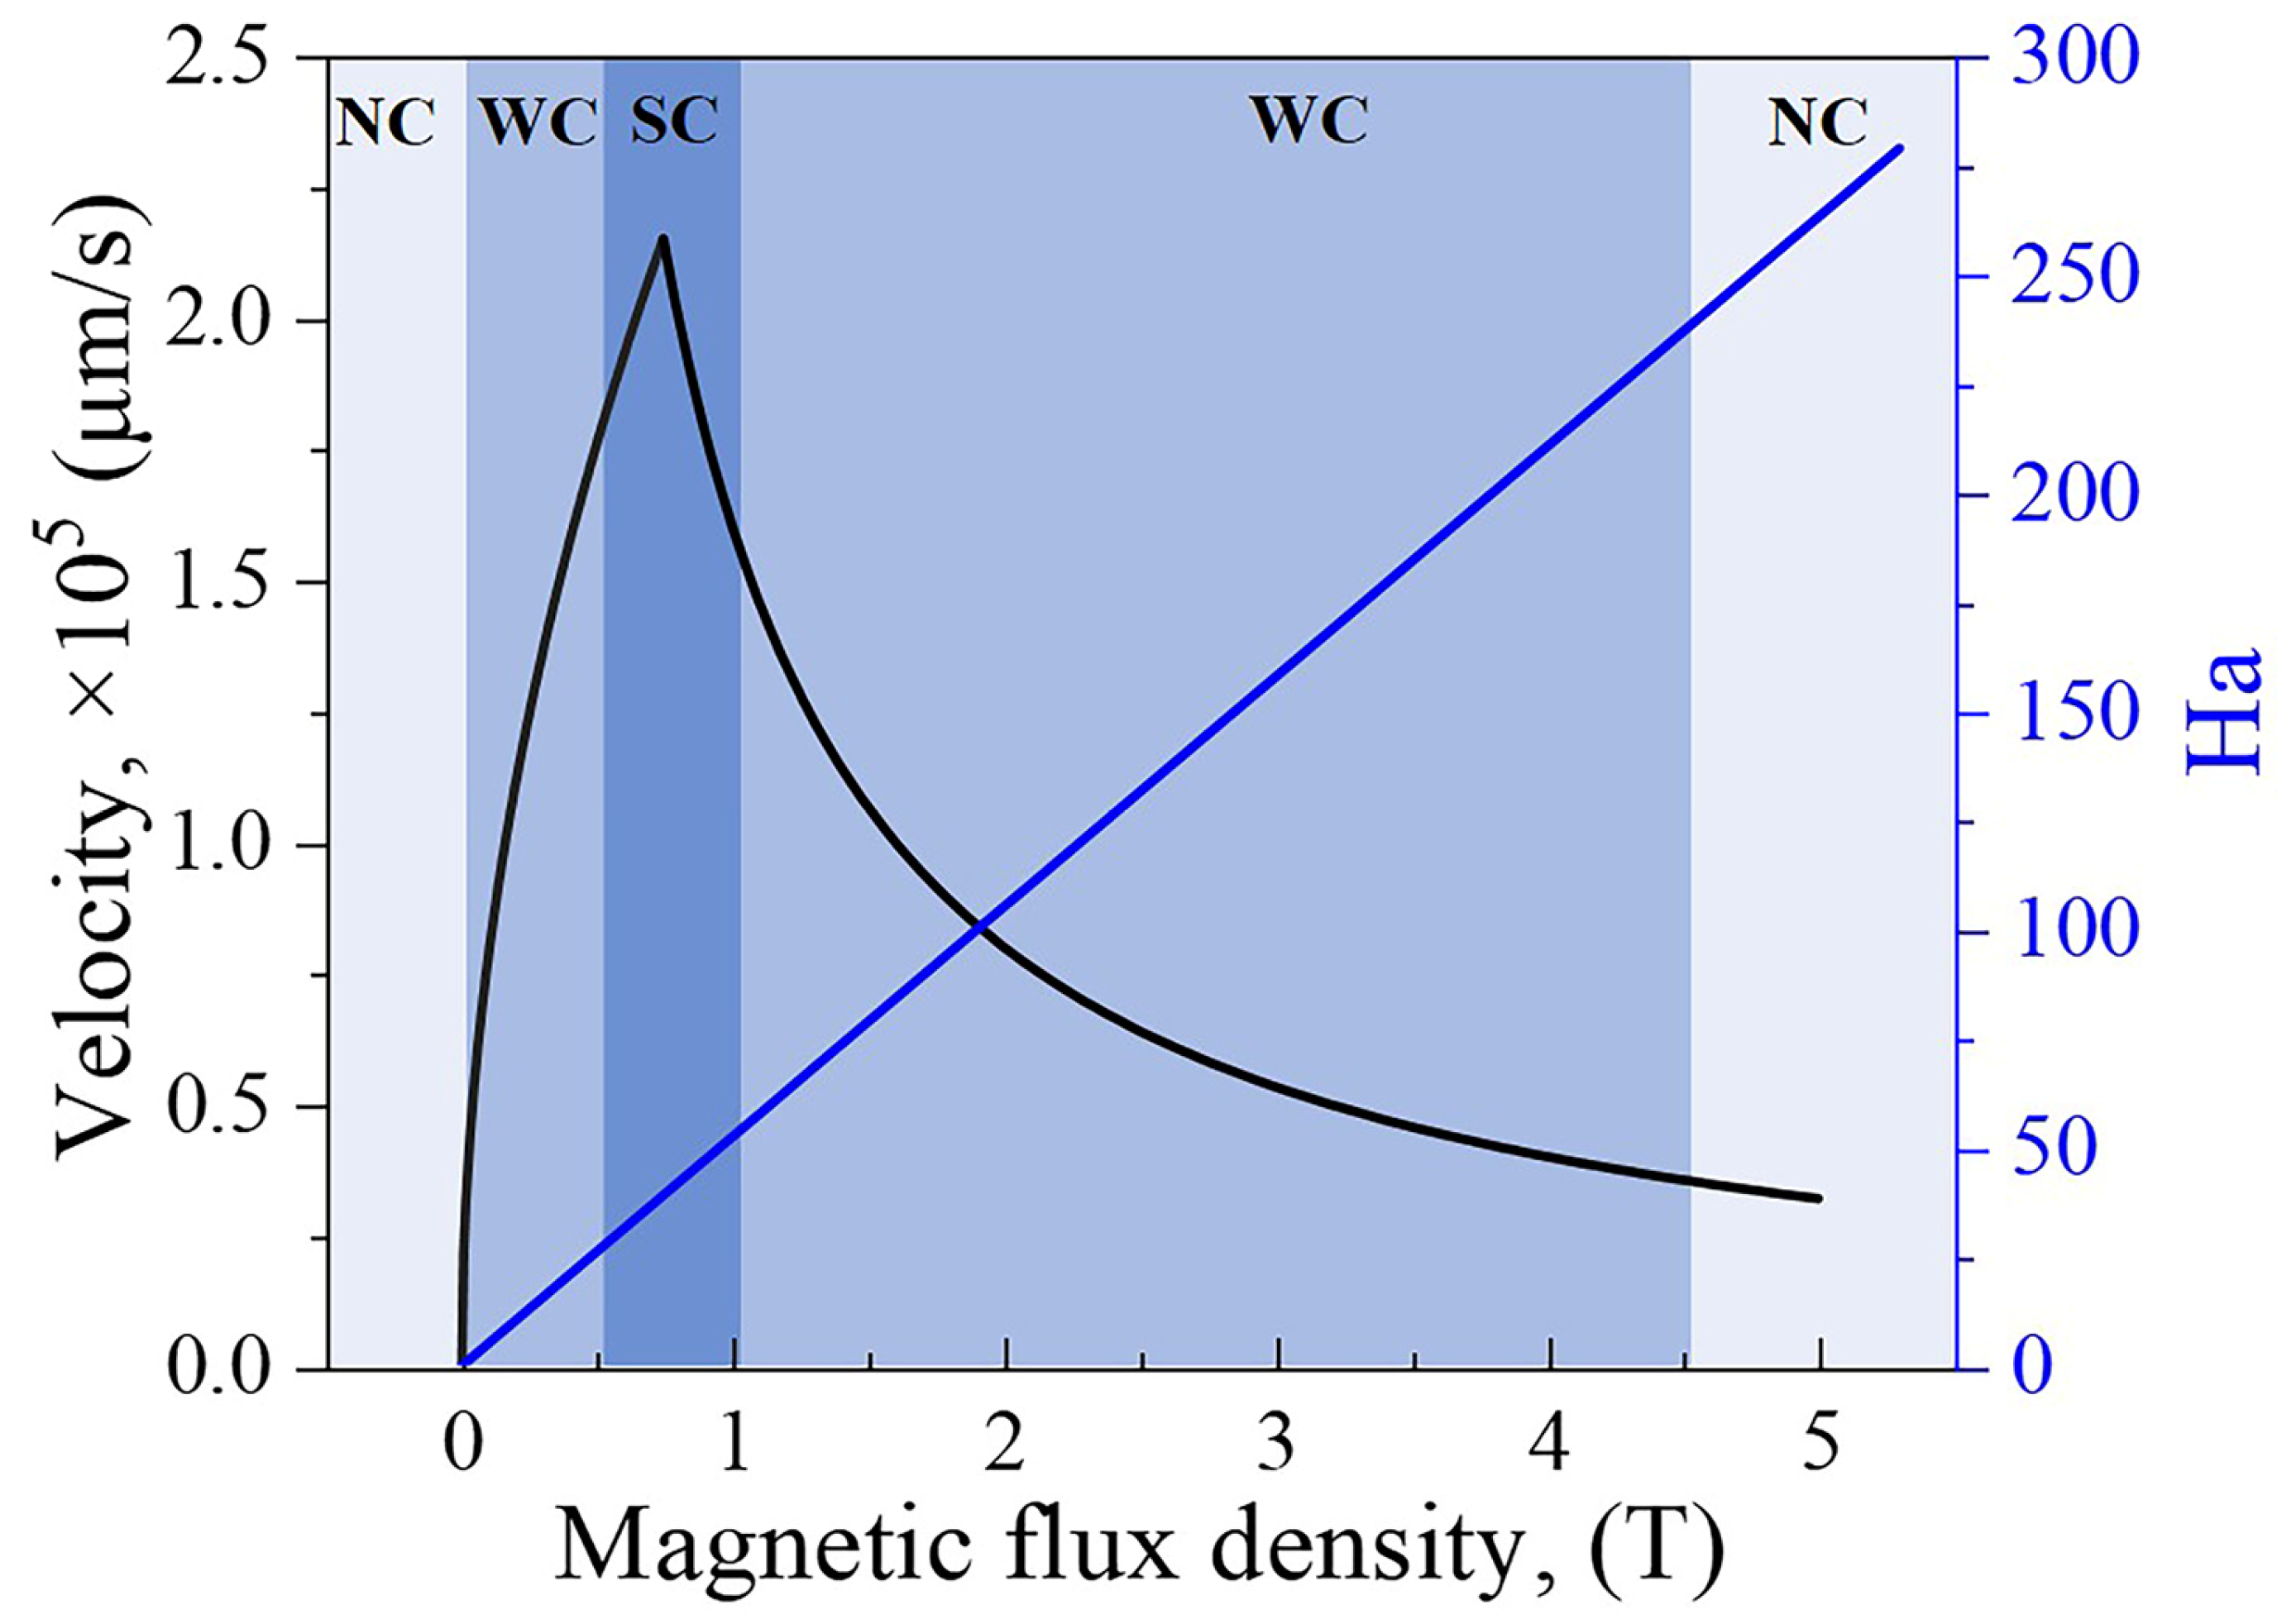
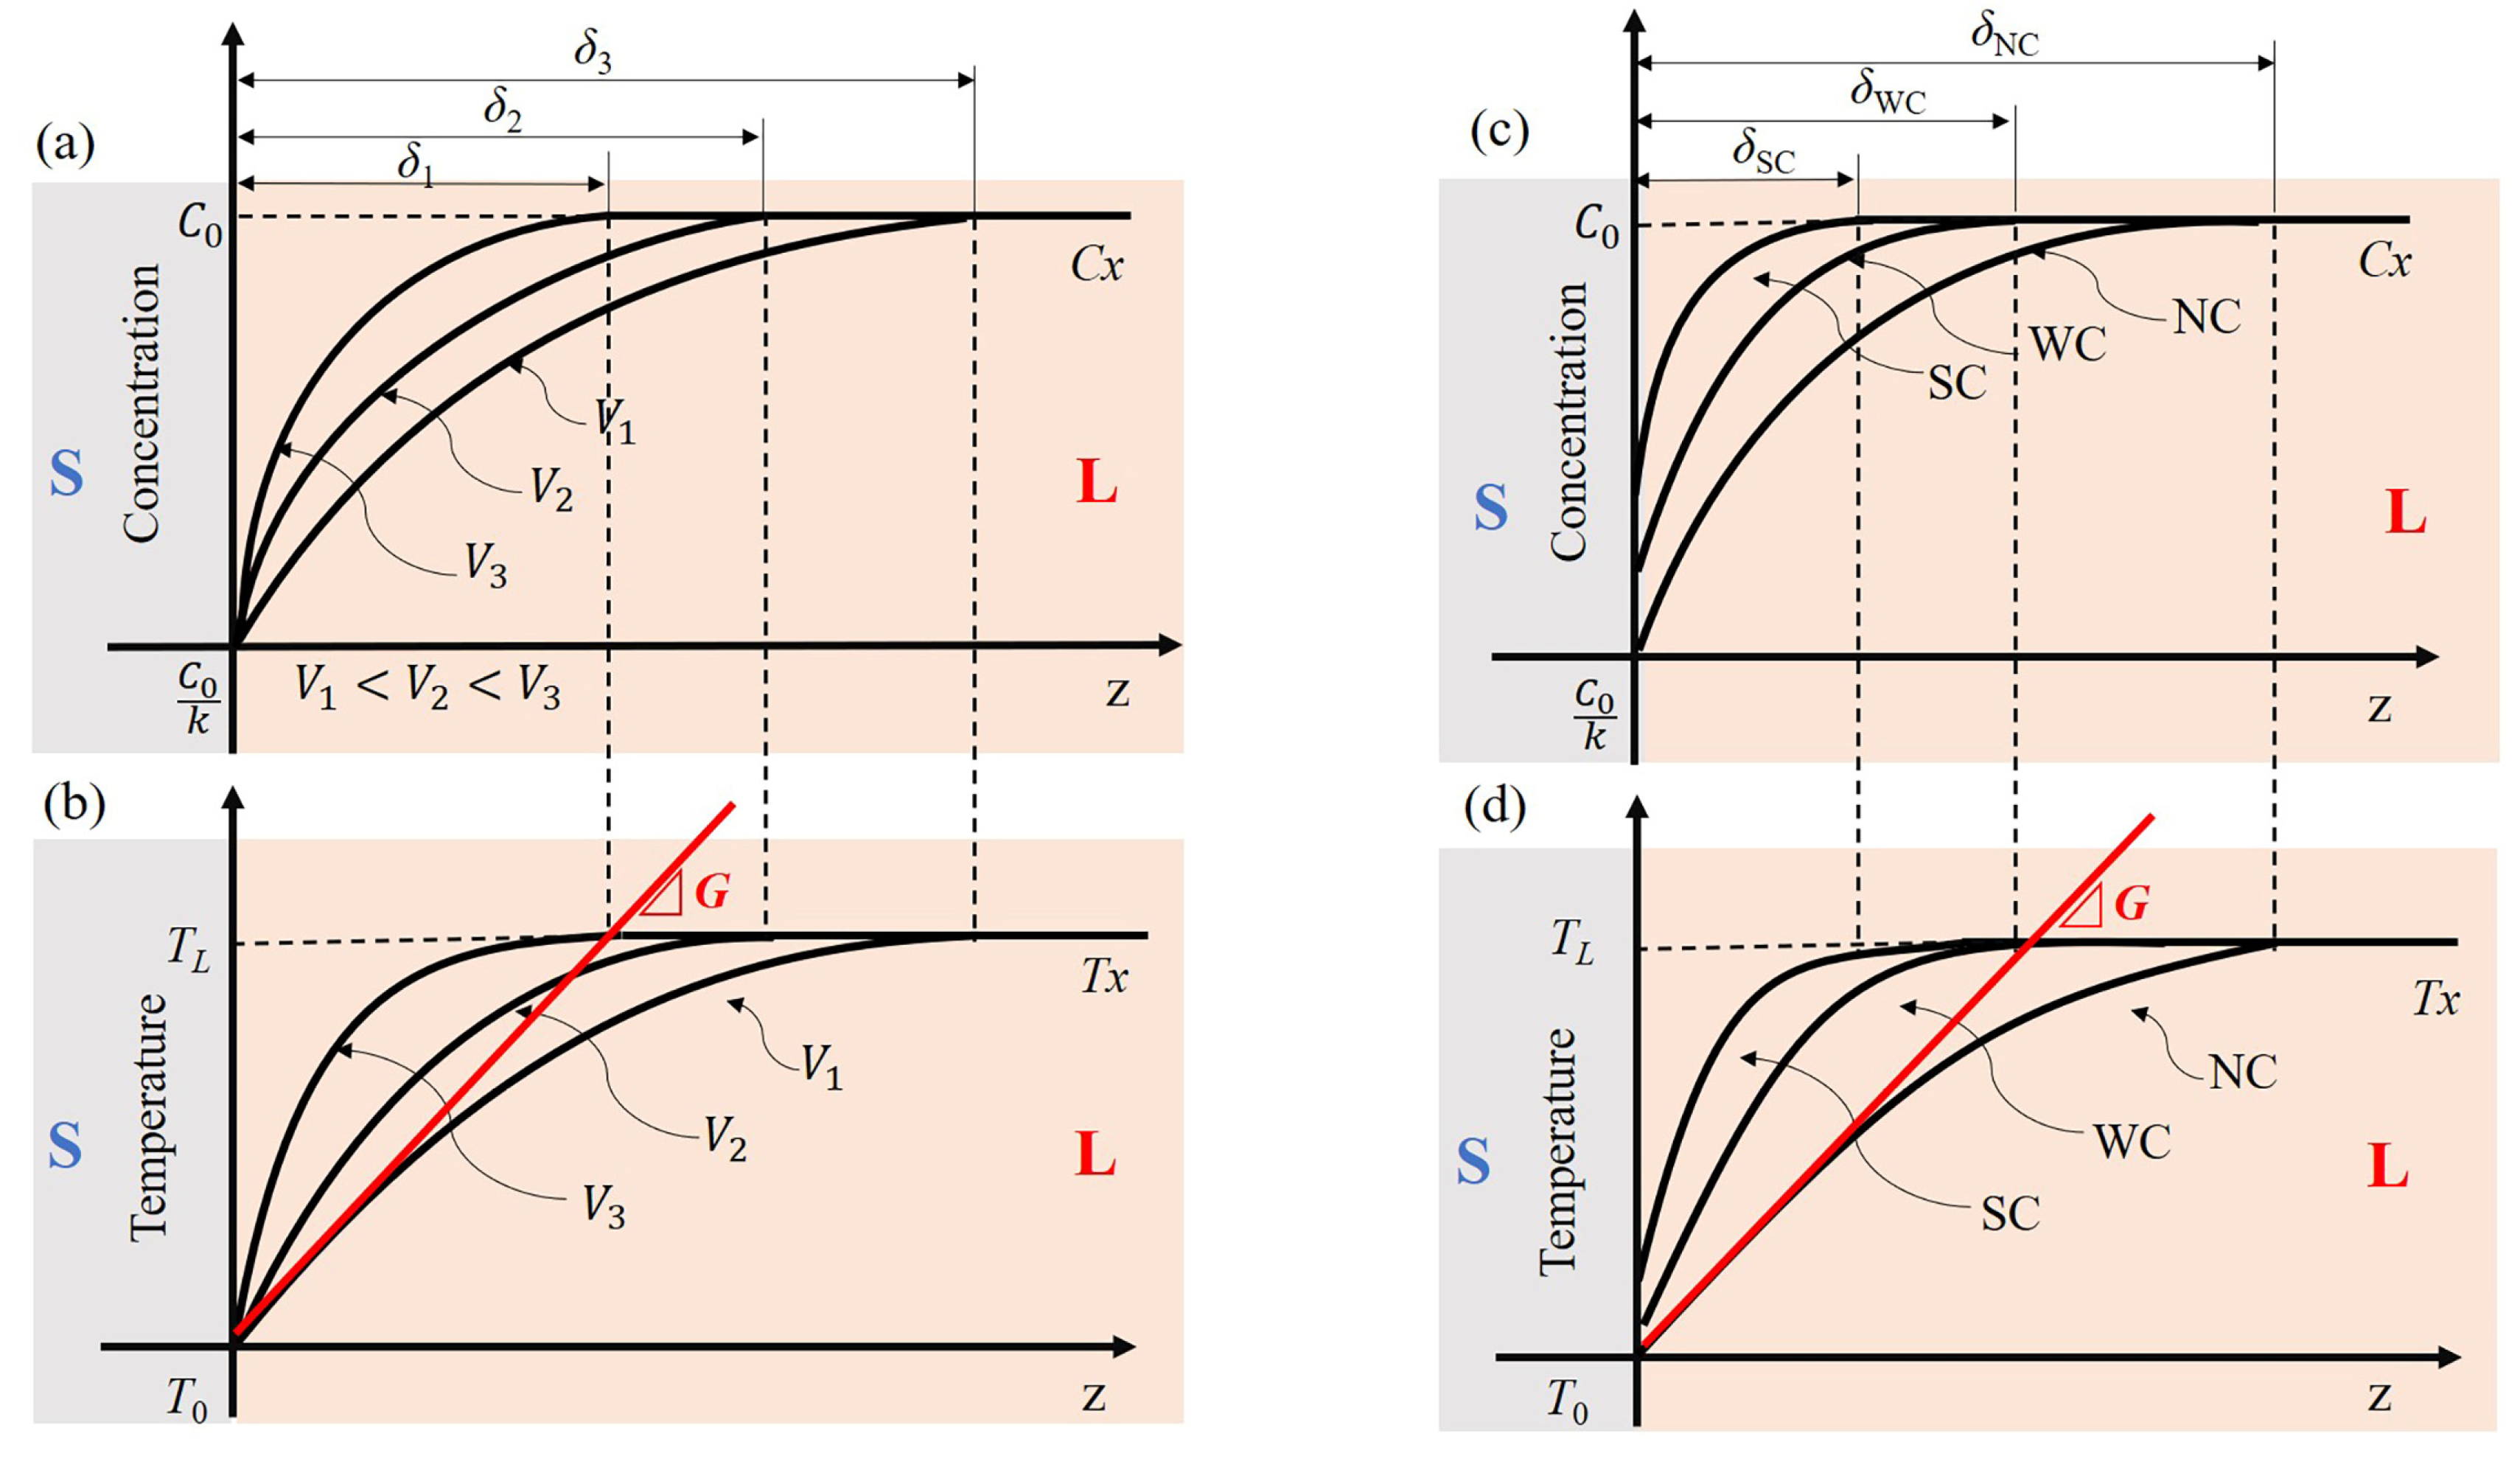
4.2. Dynamic Mechanism of Morphological Evolution of the S-L Interface
5. Conclusions
Author Contributions
Funding
Institutional Review Board Statement
Informed Consent Statement
Data Availability Statement
Conflicts of Interest
References
- Zheng, H.; Chen, R.; Qin, G.; Li, X.; Su, Y.; Ding, H.; Guo, J.; Fu, H. Transition of solid-liquid interface and tensile properties of CoCrFeNi high-entropy alloys during directional solidification. J. Alloys Compd. 2019, 787, 1023–1031. [Google Scholar] [CrossRef]
- Mehreen, S.U.; Nogita, K.; McDonald, S.D.; Yasuda, H.; StJohn, D.H. Peritectic phase formation kinetics of directionally solidifying Sn-Cu alloys within a broad growth rate regime. Acta Mater. 2021, 220, 117295. [Google Scholar] [CrossRef]
- Witusiewicz, V.T.; Sturz, L.; Viardin, A.; Pickmann, C.; Zimmermann, G. Effect of convection on directional solidification in transparent succinonitrile-2.2 wt.%(d) camphor alloy. Acta Mater. 2021, 216, 117086. [Google Scholar] [CrossRef]
- Ngomesse, F.; Reinhart, G.; Soltani, H.; Zimmermann, G.; Browne, D.; Sillekens, W.; Nguyen-Thi, H. In situ investigation of the Columnar-to-Equiaxed Transition during directional solidification of Al–20 wt.% Cu alloys on Earth and in microgravity. Acta Mater. 2021, 221, 117401. [Google Scholar] [CrossRef]
- Schulz, C.; Kauffmann, A.; Laube, S.; Kellner, M.; Nestler, B.; Heilmaier, M. Role of orientation relationship for the formation of morphology and preferred orientation in NiAl-(Cr, Mo) during directional solidification. Acta Mater. 2022, 231, 117857. [Google Scholar] [CrossRef]
- Tiller, W.; Jackson, K.; Rutter, J.; Chalmers, B. The redistribution of solute atoms during the solidification of metals. Acta Metall. 1953, 1, 428–437. [Google Scholar] [CrossRef]
- Rohatgi, P.K.; Ajay, K.P.; Chelliah, N.M.; Rajan, T.P.D. Solidification processing of cast metal matrix composites over the last 50 years and opportunities for the future. JOM 2020, 72, 2912–2926. [Google Scholar] [CrossRef]
- Mullins, W.W.; Sekerka, R. Stability of a planar interface during solidification of a dilute binary alloy. J. Appl. Phys. 1964, 35, 444–451. [Google Scholar] [CrossRef]
- Dong, Y.; Shuai, S.; Zheng, T.; Cao, J.; Chen, C.; Wang, J.; Ren, Z. In-situ observation of solid-liquid interface transition during directional solidification of Al-Zn alloy via X-ray imaging. J. Mater. Sci. Technol. 2020, 39, 113–123. [Google Scholar] [CrossRef]
- Yin, X.; Liu, J.; Wang, Q.; Wang, L. Investigation of beta fleck formation in Ti-17 alloy by directional solidification method. J. Mater. Sci. Technol. 2020, 48, 36–43. [Google Scholar] [CrossRef]
- Kang, J.; Li, J. Microstructural evolution in directional solidification of Nb-doped Co-Sn/Ni–Sn eutectic alloys. Appl. Phys. A Mater. Sci. Process. 2021, 127, 809. [Google Scholar] [CrossRef]
- Cai, B.; Wang, J.; Kao, A.; Pericleous, K.; Phillion, A.; Atwood, R.; Lee, P. 4D synchrotron X-ray tomographic quantification of the transition from cellular to dendrite growth during directional solidification. Acta Mater. 2016, 117, 160–169. [Google Scholar] [CrossRef]
- Clarke, A.; Tourret, D.; Song, Y.; Imhoff, S.; Gibbs, P.; Gibbs, J.; Fezzaa, K.; Karma, A. Microstructure selection in thin-sample directional solidification of an Al-Cu alloy: In situ X-ray imaging and phase-field simulations. Acta Mater. 2017, 129, 203–216. [Google Scholar] [CrossRef] [Green Version]
- Ratke, L.; Diefenbach, S. Liquid immiscible alloys. Mater. Sci. Eng. R. 1995, 15, 263–347. [Google Scholar] [CrossRef]
- Fujii, H.; Kimura, T.; Kitaguchi, H.; Kumakura, H.; Togano, K.; Mohri, M. Fabrication of uniform Al-Pb-Bi monotectic alloys under microgravity utilizing the space shuttle: Microstructure and superconducting properties. J. Mater. Sci. 1995, 30, 3429–3434. [Google Scholar] [CrossRef]
- Costa, T.A.; Freitas, E.S.; Dias, M.; Brito, C.; Cheung, N.; Garcia, A. Monotectic Al-Bi-Sn alloys directionally solidified: Effects of Bi content, growth rate and cooling rate on the microstructural evolution and hardness. J. Alloys Compd. 2015, 653, 243–254. [Google Scholar] [CrossRef]
- Deng, C.; Jiang, H.; Zhao, J.; He, J.; Zhao, L. Study on the solidification of Ag-Ni monotectic alloy. Acta Metall. Sin. 2019, 56, 212–220. [Google Scholar]
- Grugel, R.N.; Lograsso, T.; Hellawell, A. The solidification of monotectic alloys—Microstructures and phase spacings. Metall. Mater. Trans. A 1984, 15, 1003–1012. [Google Scholar] [CrossRef]
- Kamio, A.; Kumai, S.; Tezuka, H. Solidification structure of monotectic alloys. Mater. Sci. Eng. A 1991, 146, 105–121. [Google Scholar] [CrossRef]
- Majumdar, B.; Chattopadhyay, K. The Rayleigh instability and the origin of rows of droplets in the monotectic microstructure of zinc-bismuth alloys. Mater. Sci. Eng. A 1996, 27, 2053–2057. [Google Scholar] [CrossRef]
- Ratke, L. Theoretical considerations and experiments on microstructural stability regimes in monotectic alloys. Mater. Sci. Eng. A 2005, 413, 504–508. [Google Scholar] [CrossRef]
- Schafer, C.; Johnston, M.; Parr, R. The formation of aligned spheres in miscibility gap systems. Acta Metall. 1983, 31, 1221–1224. [Google Scholar] [CrossRef]
- Dedovets, D.; Monteux, C.; Deville, S. Five-dimensional imaging of freezing emulsions with solute effects. Science 2018, 360, 303–306. [Google Scholar] [CrossRef] [PubMed] [Green Version]
- Kaukler, W.F.; Rosenberger, F.; Curreri, P.A. In situ studies of precipitate formationin Al-Pb monotectic solidification by X-ray transmission microscopy. Metall. Mater. Trans. A 1997, 28, 1705–1710. [Google Scholar] [CrossRef]
- Yasuda, H.; Kato, S.; Shinba, T.; Nagira, T.; Yoshiya, M.; Sugiyama, A.; Umetani, K.; Uesugi, K. Regular structure formation of hypermonotectic Al-In alloys. Mater. Sci. Forum 2010, 649, 131–136. [Google Scholar] [CrossRef]
- Asta, M.; Beckermann, C.; Karma, A.; Kurz, W.; Napolitano, R.; Plapp, M.; Purdy, G.; Rappaz, M.; Trivedi, R. Solidification microstructures and solid-state parallels: Recent developments, future directions. Acta Mater. 2009, 57, 941–971. [Google Scholar] [CrossRef] [Green Version]
- Li, X.; Fautrelle, Y.; Ren, Z. Influence of thermoelectric effects on the solid–liquid interface shape and cellular morphology in the mushy zone during the directional solidification of Al-Cu alloys under a magnetic field. Acta Mater. 2007, 55, 3803–3813. [Google Scholar] [CrossRef]
- Khine, Y.; Walker, J. Thermoelectric magnetohydrodynamic effects during Bridgman semiconductor crystal growth with a uniform axial magnetic field. J. Cryst. Growth 1998, 183, 150–158. [Google Scholar] [CrossRef]
- Shercliff, J. Thermoelectric magnetohydrodynamics. J. Fluid Mech. 1979, 91, 231–251. [Google Scholar] [CrossRef]
- Du, D.; Fautrelle, Y.; Ren, Z.; Moreau, R.; Li, X. Effect of a high magnetic field on the growth of ternary Al-Cu-Ag alloys during directional solidification. Acta Mater. 2016, 121, 240–256. [Google Scholar] [CrossRef]
- Li, X.; Gagnoud, A.; Wang, J.; Li, X.; Fautrelle, Y.; Ren, Z.; Lu, X.; Reinhart, G.; Nguyen-Thi, H. Effect of a high magnetic field on the microstructures in directionally solidified Zn–Cu peritectic alloys. Acta Mater. 2014, 73, 83–96. [Google Scholar] [CrossRef]
- Zhou, B.; Lin, W.; Liu, Y.; Zheng, T.; Zhong, Y.; Wang, H.; Wang, Q. Effects of high static magnetic field on the microstructure of Zn-Bi monotectic alloys during directional solidification process. J. Alloys Compd. 2021, 889, 161670. [Google Scholar] [CrossRef]
- Zheng, T.; Zhong, Y.; Wang, J.; Ren, Z.; Ren, W.; Lei, Z.; Debray, F.; Beaugnon, E.; Wei, X. Droplet Evolution and Refinement During Liquid-Liquid Decomposition of Zn-6 Wt Pct Bi Immiscible Alloy Under High Static Magnetic Fields. Metall. Mater. Trans. A 2018, 49, 3333–3345. [Google Scholar] [CrossRef] [Green Version]
- Kim, W.; Zhang, D.; Cantor, B. Microstructure of rapidly solidified aluminium-based immiscible alloys. Metall. Mater. Trans. A 1991, 134, 1133–1138. [Google Scholar] [CrossRef]
- Yasuda, H.; Ohnaka, I.; Kawakami, O.; Ueno, K.; Kishio, K. Effect of magnetic field on solidification in Cu-Pb monotectic alloys. ISIJ Int. 2003, 43, 942–949. [Google Scholar] [CrossRef]
- Zhong, Y.; Zheng, T.; Dong, L.; Zhou, B.; Ren, W.; Wang, J.; Ren, Z.; Debray, F.; Beaugnon, H.; Wang, H.; et al. Controlling droplet distribution using thermoelectric magnetic forces during bulk solidification processing of a Zn-6wt.%Bi immiscible alloy. Mater. Des. 2016, 100, 168–174. [Google Scholar] [CrossRef]
- Abou-Khalil, L.; Salloum-Abou-Jaoude, G.; Reinhart, G.; Pickmann, C.; Zimmermann, G.; Nguyen-Thi, H. Influence of gravity level on columnar-to-equiaxed transition during directional solidification of al-20 wt.% cu alloys. Acta Mater. 2016, 110, 44–52. [Google Scholar] [CrossRef]
- Drevet, B.; Thi, H.N.; Camel, D.; Billia, B.; Dupouy, M.D. Solidification of aluminium-lithium alloys near the cell/dendrite transition-influence of solutal convection. J. Cryst. Growth 2000, 218, 419–433. [Google Scholar] [CrossRef]
- Stöcker, C.; Ratke, L. A new ‘Jackson–Hunt’ model for monotectic composite growth. J. Cryst. Growth 1999, 203, 582–593. [Google Scholar] [CrossRef]


Publisher’s Note: MDPI stays neutral with regard to jurisdictional claims in published maps and institutional affiliations. |
© 2022 by the authors. Licensee MDPI, Basel, Switzerland. This article is an open access article distributed under the terms and conditions of the Creative Commons Attribution (CC BY) license (https://creativecommons.org/licenses/by/4.0/).
Share and Cite
Zhou, B.; Guo, X.; Lin, W.; Liu, Y.; Guo, Y.; Zheng, T.; Zhong, Y.; Wang, H.; Wang, Q. Effect of Vertical High Magnetic Field on the Morphology of Solid-Liquid Interface during the Directional Solidification of Zn-2wt.%Bi Immiscible Alloy. Metals 2022, 12, 875. https://0-doi-org.brum.beds.ac.uk/10.3390/met12050875
Zhou B, Guo X, Lin W, Liu Y, Guo Y, Zheng T, Zhong Y, Wang H, Wang Q. Effect of Vertical High Magnetic Field on the Morphology of Solid-Liquid Interface during the Directional Solidification of Zn-2wt.%Bi Immiscible Alloy. Metals. 2022; 12(5):875. https://0-doi-org.brum.beds.ac.uk/10.3390/met12050875
Chicago/Turabian StyleZhou, Bangfei, Xianghui Guo, Wenhao Lin, Ying Liu, Yifeng Guo, Tianxiang Zheng, Yunbo Zhong, Hui Wang, and Qiuliang Wang. 2022. "Effect of Vertical High Magnetic Field on the Morphology of Solid-Liquid Interface during the Directional Solidification of Zn-2wt.%Bi Immiscible Alloy" Metals 12, no. 5: 875. https://0-doi-org.brum.beds.ac.uk/10.3390/met12050875