Reduction Kinetics of Hematite Powder in Hydrogen Atmosphere at Moderate Temperatures


1
Department of Materials Science and Engineering, Delft University of Technology, Mekelweg 2, 2628 CD Delft, The Netherland
2
College of Materials Science and Engineering, Chongqing University, Chongqing 400044, China
3
Chongqing Key Laboratory of Vanadium-Titanium Metallurgy and New Materials, Chongqing University, Chongqing 400044, China
4
State Key Laboratory of Advanced Metallurgy, University of Science and Technology Beijing, Beijing 100083, China
5
College of Metallurgy and Energy, North China University of Science and Technology, 21 Bohai Road, Caofeidian Xincheng, Tangshan 063210, China
*
Author to whom correspondence should be addressed.
Metals 2018, 8(10), 751; https://0-doi-org.brum.beds.ac.uk/10.3390/met8100751
Submission received: 31 August 2018
/
Revised: 20 September 2018
/
Accepted: 21 September 2018
/
Published: 23 September 2018
Abstract
:Hydrogen has received much attention in the development of direct reduction of iron ores because hydrogen metallurgy is one of the effective methods to reduce CO2 emission in the iron and steel industry. In this study, the kinetic mechanism of reduction of hematite particles was studied in a hydrogen atmosphere. The phases and morphological transformation of hematite during the reduction were characterized using X-ray diffraction and scanning electron microscopy with energy dispersive spectroscopy. It was found that porous magnetite was formed, and the particles were degraded during the reduction. Finally, sintering of the reduced iron and wüstite retarded the reductive progress. The average activation energy was extracted to be 86.1 kJ/mol and 79.1 kJ/mol according to Flynn-Wall-Ozawa (FWO) and Starink methods, respectively. The reaction fraction dependent values of activation energy were suggested to be the result of multi-stage reactions during the reduction process. Furthermore, the variation of activation energy value was smoothed after heat treatment of hematite particles.
1. Introduction
The iron and steel industry accounts for about a quarter of direct CO2 emissions from the industry sector [1]. Therefore, it is an essential task to upgrade iron and steel making technologies [2]. Direct reduction is one of the promising alternative ironmaking processes to effectively reduce carbon emission. It has been realized that H2 is a more ideal reducing agent comparing with CO in the aspect of kinetics [3,4]. Moreover, H2 is a clear energy and H2 reduction is a much more environmentally friendly method. Ranzani da Costa et al. [5] studied the possibility of direct reduction of iron ore in a hydrogen-operated shaft furnace. Their modeling results show that CO2 emissions in the ironmaking process can be reduced by more than 80%. Sohn et al. [6,7,8] has proposed a flash reduction process which uses H2 to reduce magnetite concentrates. With continuing studies, the feasibility of this process is more and more clear [9,10,11]. Recently, a direction reduction technology, named HYBRIT, was created by SSAB, LKAB and Vattenfall in Sweden, aiming to replace coking coal with hydrogen in the process [12]. They have already started a plan of building a pilot plant in Luleå. The progress of these ironmaking methods implies that hydrogen can be a potential solo reductant in direct reduction process.
Numerous studies have reported the reduction kinetics of iron ore by H2 or H2-containing mixtures [3,4,5,10,13,14,15,16,17,18,19,20,21]. The experimental research of Pineau et al. [18] indicates that the reduction path of hematite is as follows:
Fe2O3 → Fe3O4 → Fe3O4 + Fe(1−x)O + Fe → Fe
The intermediate product, Fe(1−x)O, forms normally above 570 °C. Especially, wüstite can be formed as a metastable state around 400–570 °C. According to studies for different ores, the kinetic behavior of iron ore varies due to the changed reduction conditions and diverse properties of the materials. Pineau et al. [18,19] reported the activation energy, Ea, of hematite reduction by stages. The different values of Ea are around 12 to 27 kJ/mol for the stage from hematite to magnetite and that from magnetite to metallic iron in different temperature range. The experimental studies of Munteanu et al. [22] and Jozwiak et al. [23] also show the hematite reduction could be apparently divided into multi-stages by temperature programmed reduction profiles. Whilst, Sastri et al. [24] found that the reaction followed a concurrent mechanism with additives in hematite. Another interesting phenomenon is that Ea of the roasted hematite is 16 kJ/mol which is higher than the one without heat treatment. All the reports imply that the study of reduction kinetics of iron oxides is necessary to understand its reaction mechanism, and then can provide basic knowledge to industrial development of direction reduction.
This work studied the reduction kinetics of fine hematite particles by hydrogen with isoconversional method. The effect of heat treatment on the reduction kinetics was investigated as well.
2. Experiment
Hematite powders (purity: 99.5 wt %, Longxi Co., Gansu, China), which was annealed at 1200 °C in air, were used as the raw material. A batch of hematite powders without heat treatment was also used in the kinetic study for a comparison of kinetic parameters. The weight change of samples during the reduction was monitored continuously by a thermal analyzer (HCT-2, Beijing Hengjiu, Instrument Ltd., Beijing, China), and the nominal sensitivity of the equipment is 0.1 µg. The sample of approximate 50.0 mg was loaded into an Al2O3 crucible without cover. The size of the crucible is Ф6.6 mm × h5.8 mm (inner diameter × inner height) and the thickness of the alumina crucible is 0.5 mm. Normally, kinetic studies use a large excess amount of reducing gas in the experiments [10,17]. Pure hydrogen with a flow rate of 50 mL/min STP was used as the reactant gas during the reaction. The gas velocity is about 0.3 × 10⁻² m/s and 0.7 × 10⁻² m/s at room temperature and 600 °C, respectively. The flow rate of the reactant gas was controlled by a mass flow controller (Alicant, Model MC-200SCCM-D, Tucson, AR, USA), and this level was found to be sufficient to diminish the diffusion resistance in the gas-boundary layer around the particle (the reaction rate was not changed with the hydrogen flow rate when the rate was higher than 40 mL/min). Isoconversional method was employed in this study, with considering its advantages (especially it is a model-free approach). Samples were heated with rates from 1 °C/min to 20 °C/min. After completing the reaction, argon gas diluted with 0.2–0.4% hydrogen was introduced into the system until the sample was quenched. The quenched samples were probed by X-ray diffraction analysis (XRD, MXP21VAHF, MAC Seience Co., Ltd., Tokyo, Japan) with a Cu Kα radiation source (Experiments with a larger number of samples were carried out in order to perform phases’ composition analysis). Morphologies of the reduced samples were observed by scanning electron microscope (SEM, CARL ZEISS EVO MA 10/LS 10 JS, Carl Zeiss AG, Oberkochen, Germany) with energy dispersive spectroscopy (EDS, Thermo NORAN System, Thermo Fisher Scientific, Waltham, MA, USA).
3. Results and Discussion
3.1. Phase Transformation
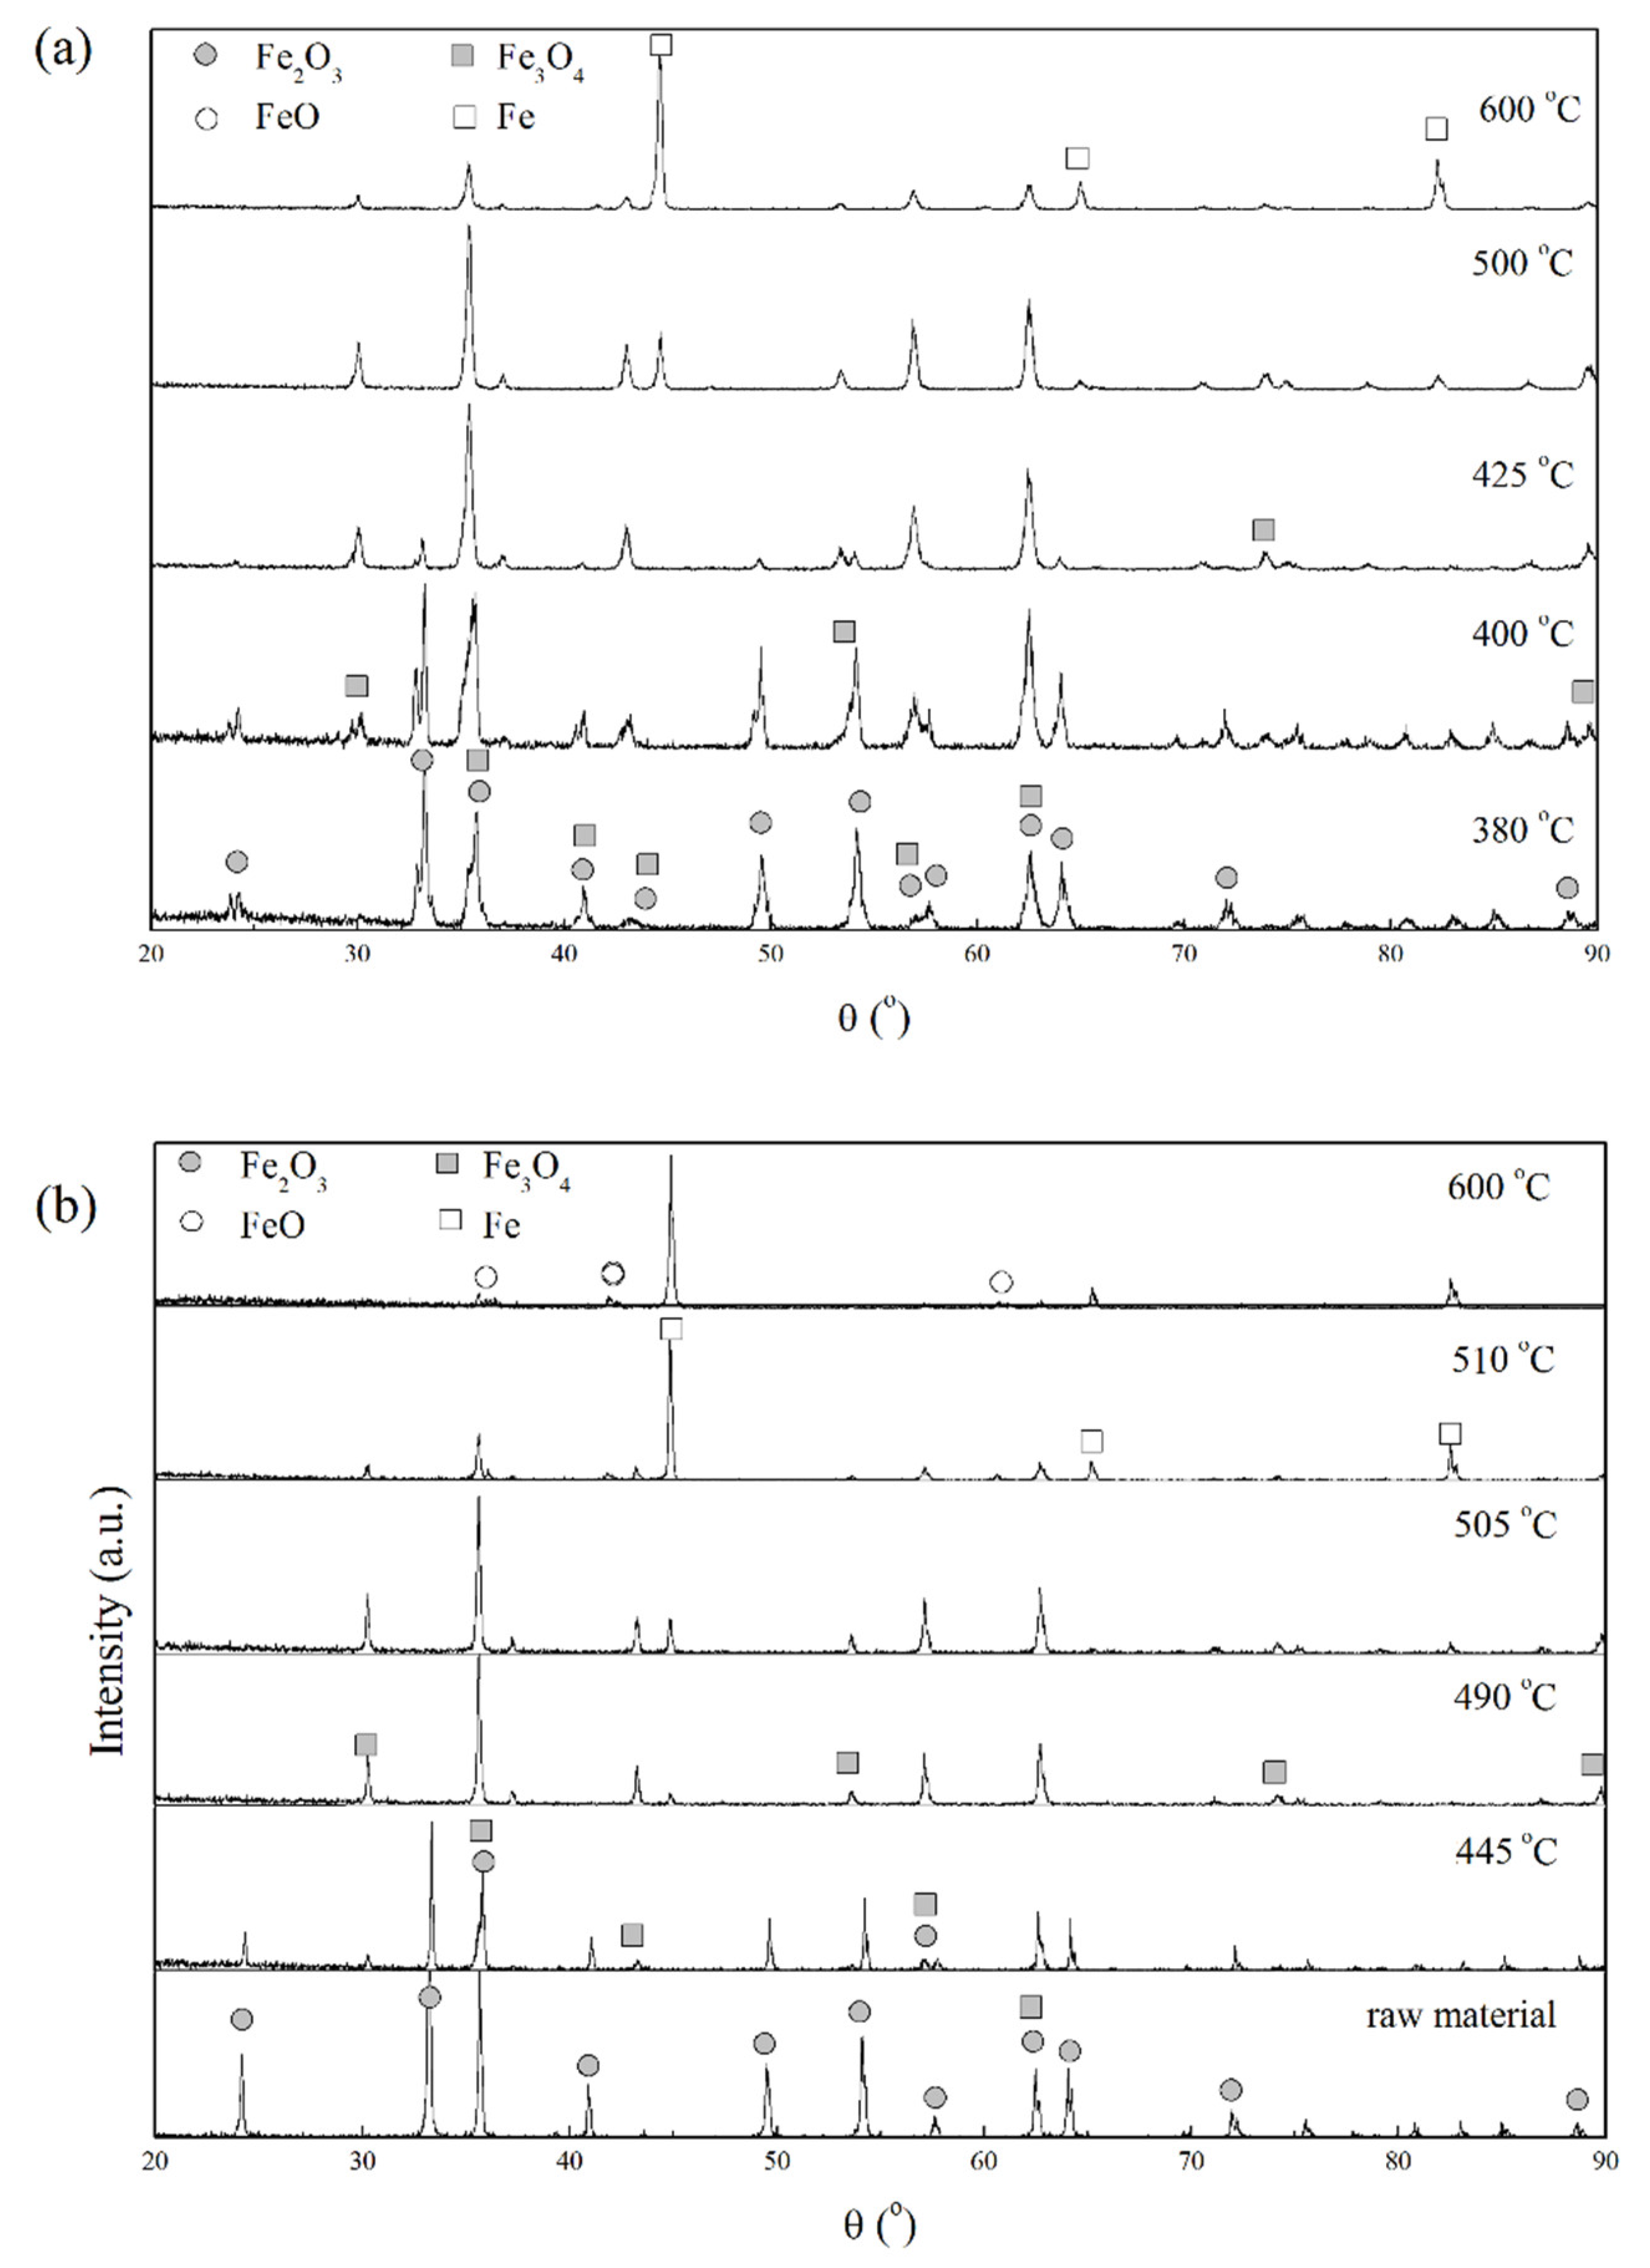
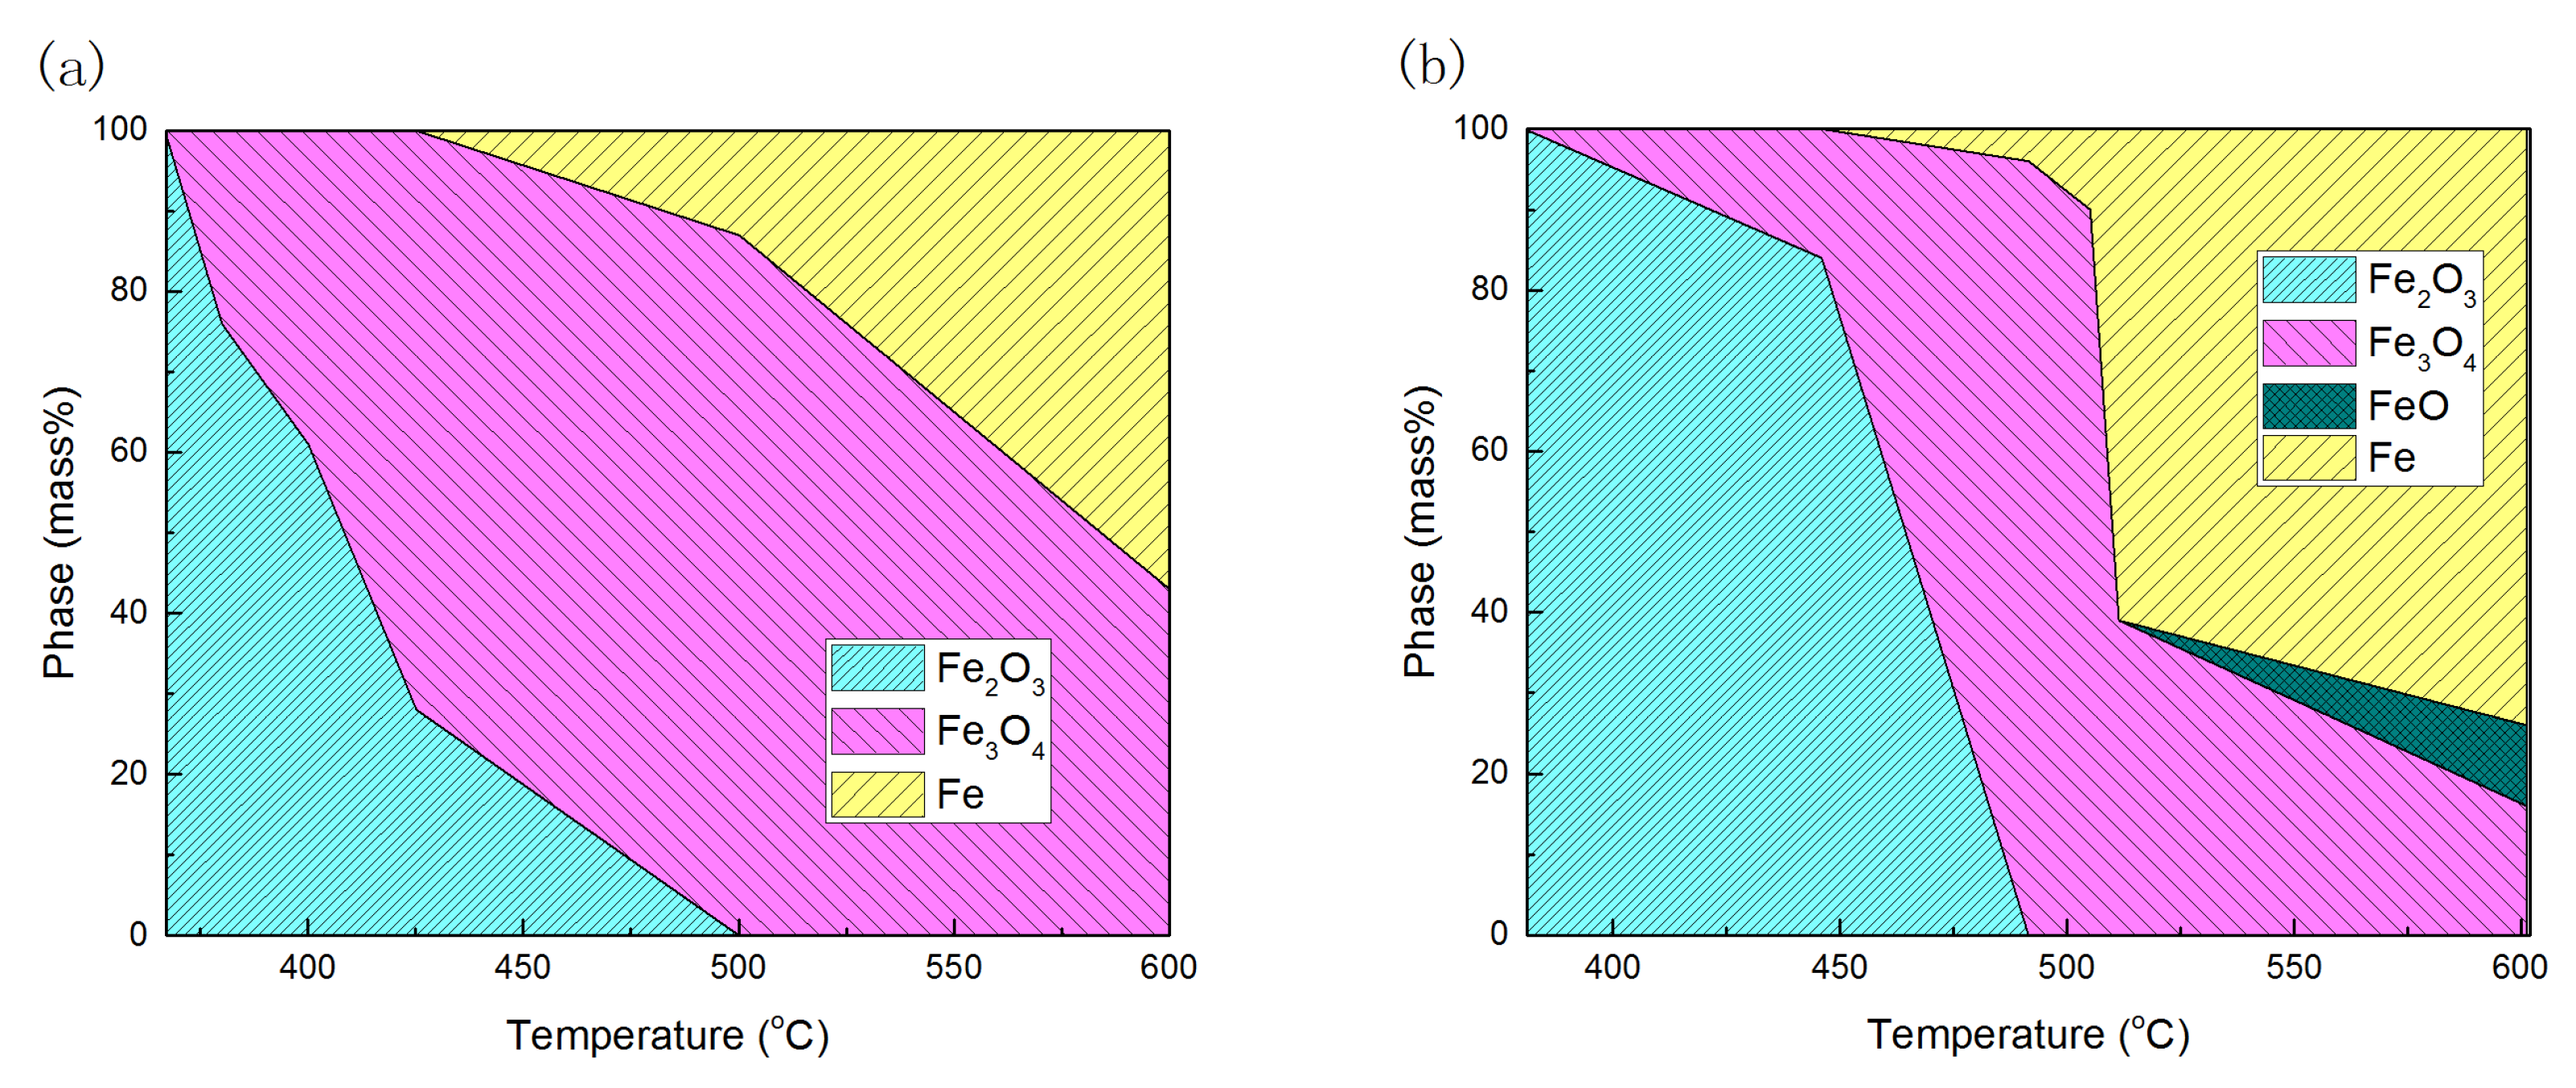
According to analysis, the reduction started at 367 °C and 380 °C for the non-isothermal reactions with heat rates of 10 and 20 °C/min, respectively. Samples reacted to certain temperatures (~100 mg per sample) were quenched and then characterized by XRD (Figure 1). Semi-quantitative analysis calculations were employed to estimate mass fractions of phases based on XRD patterns. Chung’s model [25,26] was used for the analysis with the reference intensity ratio values in the ICDD PDF2 database [27]. Compositions of the partially reduced samples for different exposure time were estimated and the results are shown in Figure 2. It is well known that the depth of X-ray in the sample is approximately 2–20 µm. Therefore, the reaction fraction calculated from XRD data would not completely agree well with that calculated from the thermal data. However, the XRD data can provide a general information of the phase change during the reaction.
Figure 2 also shows the sequential transformation of ferrite oxide during the reaction. The phase of the primary sample was verified to be hematite. Comparing with the phases in sample reduced at a heating rate of 10 °C/min, there was a phase transformation from an iron-magnetite mixture to wüstite above 510 °C for the sample reduced at a heating rate of 20 °C/min. However, because the cooling rate was not quick enough during the quenching, the retention of original phases during quenching could not be ensured, especially when the fresh product was highly reactive.
The EDS was employed to detect the element contribution in the zone near the particle surface. It should be noted that the EDS data show the nearly constant mole ratio of Fe/O regardless of reaction temperature, which implies that the surface of samples could be re-oxidized after exposure in air at room temperature. The depth of X-ray detection is also limited. As a result, the XRD results in Figure 2 can show a higher oxygen content than that of the reduced samples before exposing in Air. Thus, an in-situ measurement of the phase composition is expected in future researches.
Wüstite was not detected by XRD below 510 °C in this study. There could be several reasons for this. On the one hand, although it was found that nearly stoichiometric FeO remained metastable at approximately 357 °C [28], very careful handling was needed to prevent the decomposition of FeO before the measurement of phase composition. As we supposed, wüstite could quickly be re-oxidized in air [29] or decomposed into Fe and magnetite, for instance, at 200 °C in vacuum [30]. On the other hand, it is possible that metastable wüstite could only form under specified conditions. Thus, even a small amount of metastable wüstite could have formed, it would be difficult to observe it in the experiments. Based on the second conjecture, theoretical analysis has been carried out [31]. It indicates that additives and crystal structure deformation can increase the possibility of metastable wüstite formation.
3.2. Morphology
SEM photographs of samples reduced at a heating rate of 20 °C/min for various temperatures (final temperature) are shown in Figure 3. The morphology of samples was changed with increasing the reaction temperature. The surface of powders was becoming coarse and porous initially, and then gradually more agglomerated and less porous as the reaction time and temperature increasing. The predominant intermediate phase was suggested to be magnetite according to Figure 2. Reduction from hematite to magnetite and even to wüstite can create a number of pores due to the loss of oxygen in lattice. With further reduction, phases which are easy to be sintered, i.e., metallic iron or wüstite were formed and a dense shell seemed to cover the particles, blocking the microspores in the particles. As a typical result, these particles not only contain many pores but also are covered with a dense coat (Figure 3d). At the end of reaction, the increased amount of metallic iron (maybe contain some wüstite) on the surface of the particles resulted in the sintering of particles. The slow reduction rates in this stage were believed to be caused by the formation of a dense outer layer, which prevented the inward diffusion of hydrogen.
Hayes [32] suggested that the structural transformation in the hematite reduction could be divided into four steps, and it is generally accepted that the structural transformation could affect the reduction of hematite. Magnetite as an intermediate product could exhibit a lath or porous phase during reduction [33]. Lath magnetite could be formed as nucleation sites first before the growth of porous magnetite phase [34]. Lath magnetite formed at 445 and 490 °C in this experiment. Also, there is no obvious change of the particle surface topography except some small nuclei exist on the surface of the iron oxide particles. When the sample was heated to approximately 505 °C, porous magnetite formed on the lath magnetite. Weiss et al. [35] suggested that macro pores were the result of a high reduction rate. With the development of porous magnetite, the particles’ size became smaller than that of the raw material, which indicated that the sample degraded during the reduction. Some studies have suggested that degradation is the result of a volume increase of the magnetite nuclei [36,37]. Corresponding to our experiments, the further formation of the porous structure of the powders was accompanied by a quick reduction from magnetite to wüstite. Reduced wüstite has always been found to form large pores between its dendrites, and thus its reduction would be faster than that of magnetite [38]. However, the sintering property of wüstite at relatively high temperature made pores disappearing. In this experiment, a slower reducing rate was found above 600 °C, which is due to the sintering of the fresh iron and wüstite.
3.3. Kinetics
3.3.1. Annealed Hematite
The reduction of hematite can be estimated by the mass loss of the sample, which was defined as reduction fraction:
where, α is the reduction fraction; m is the sample’s weight at time t; m0 is the initial weight and mmax is the maximum mass loss of the sample.
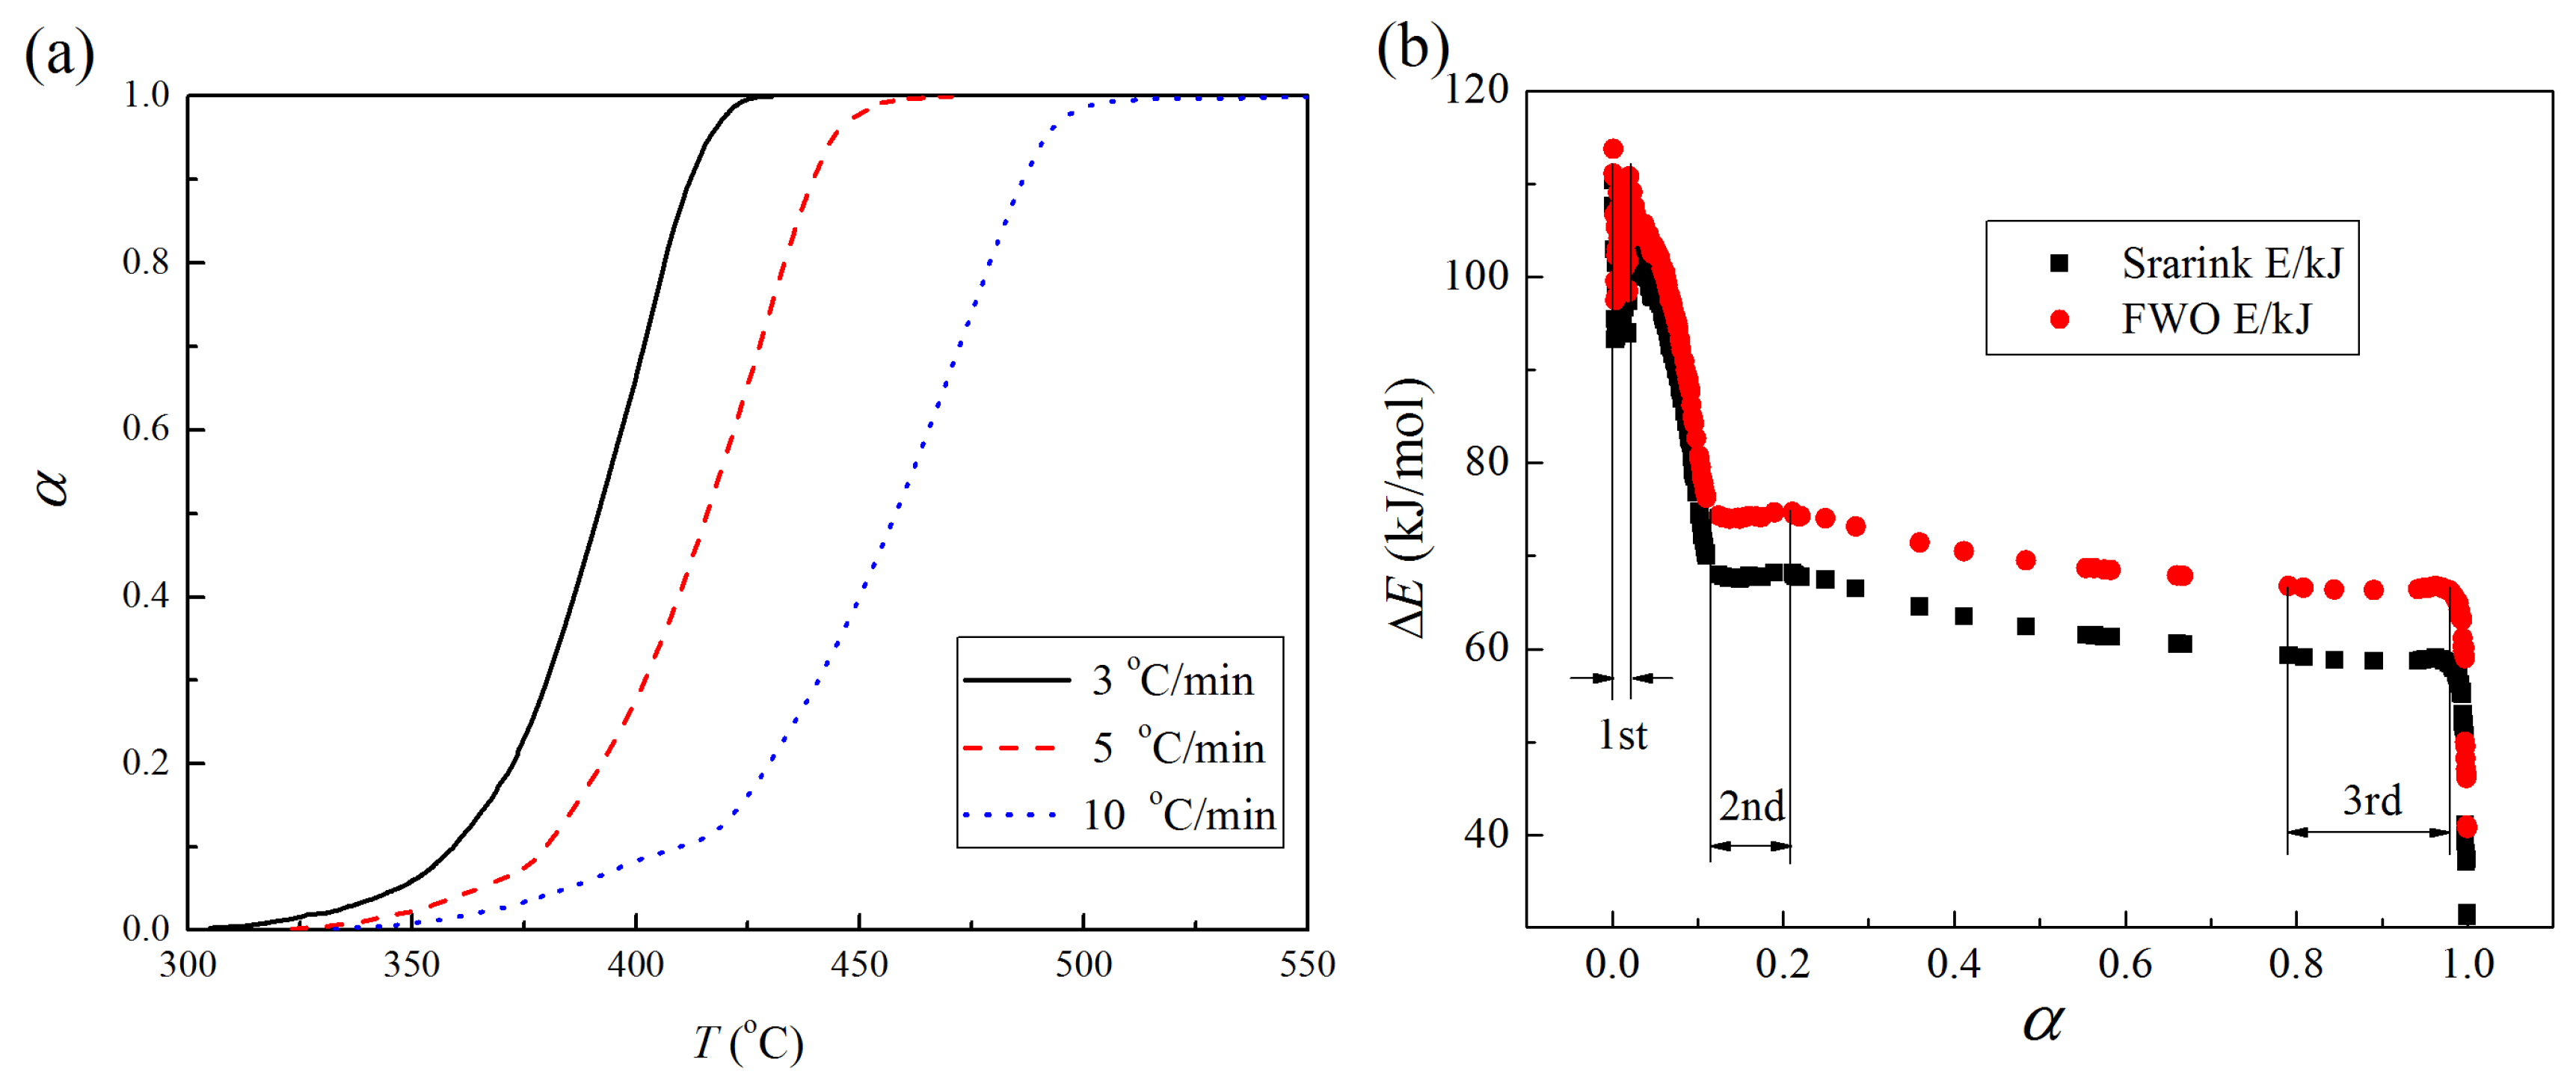
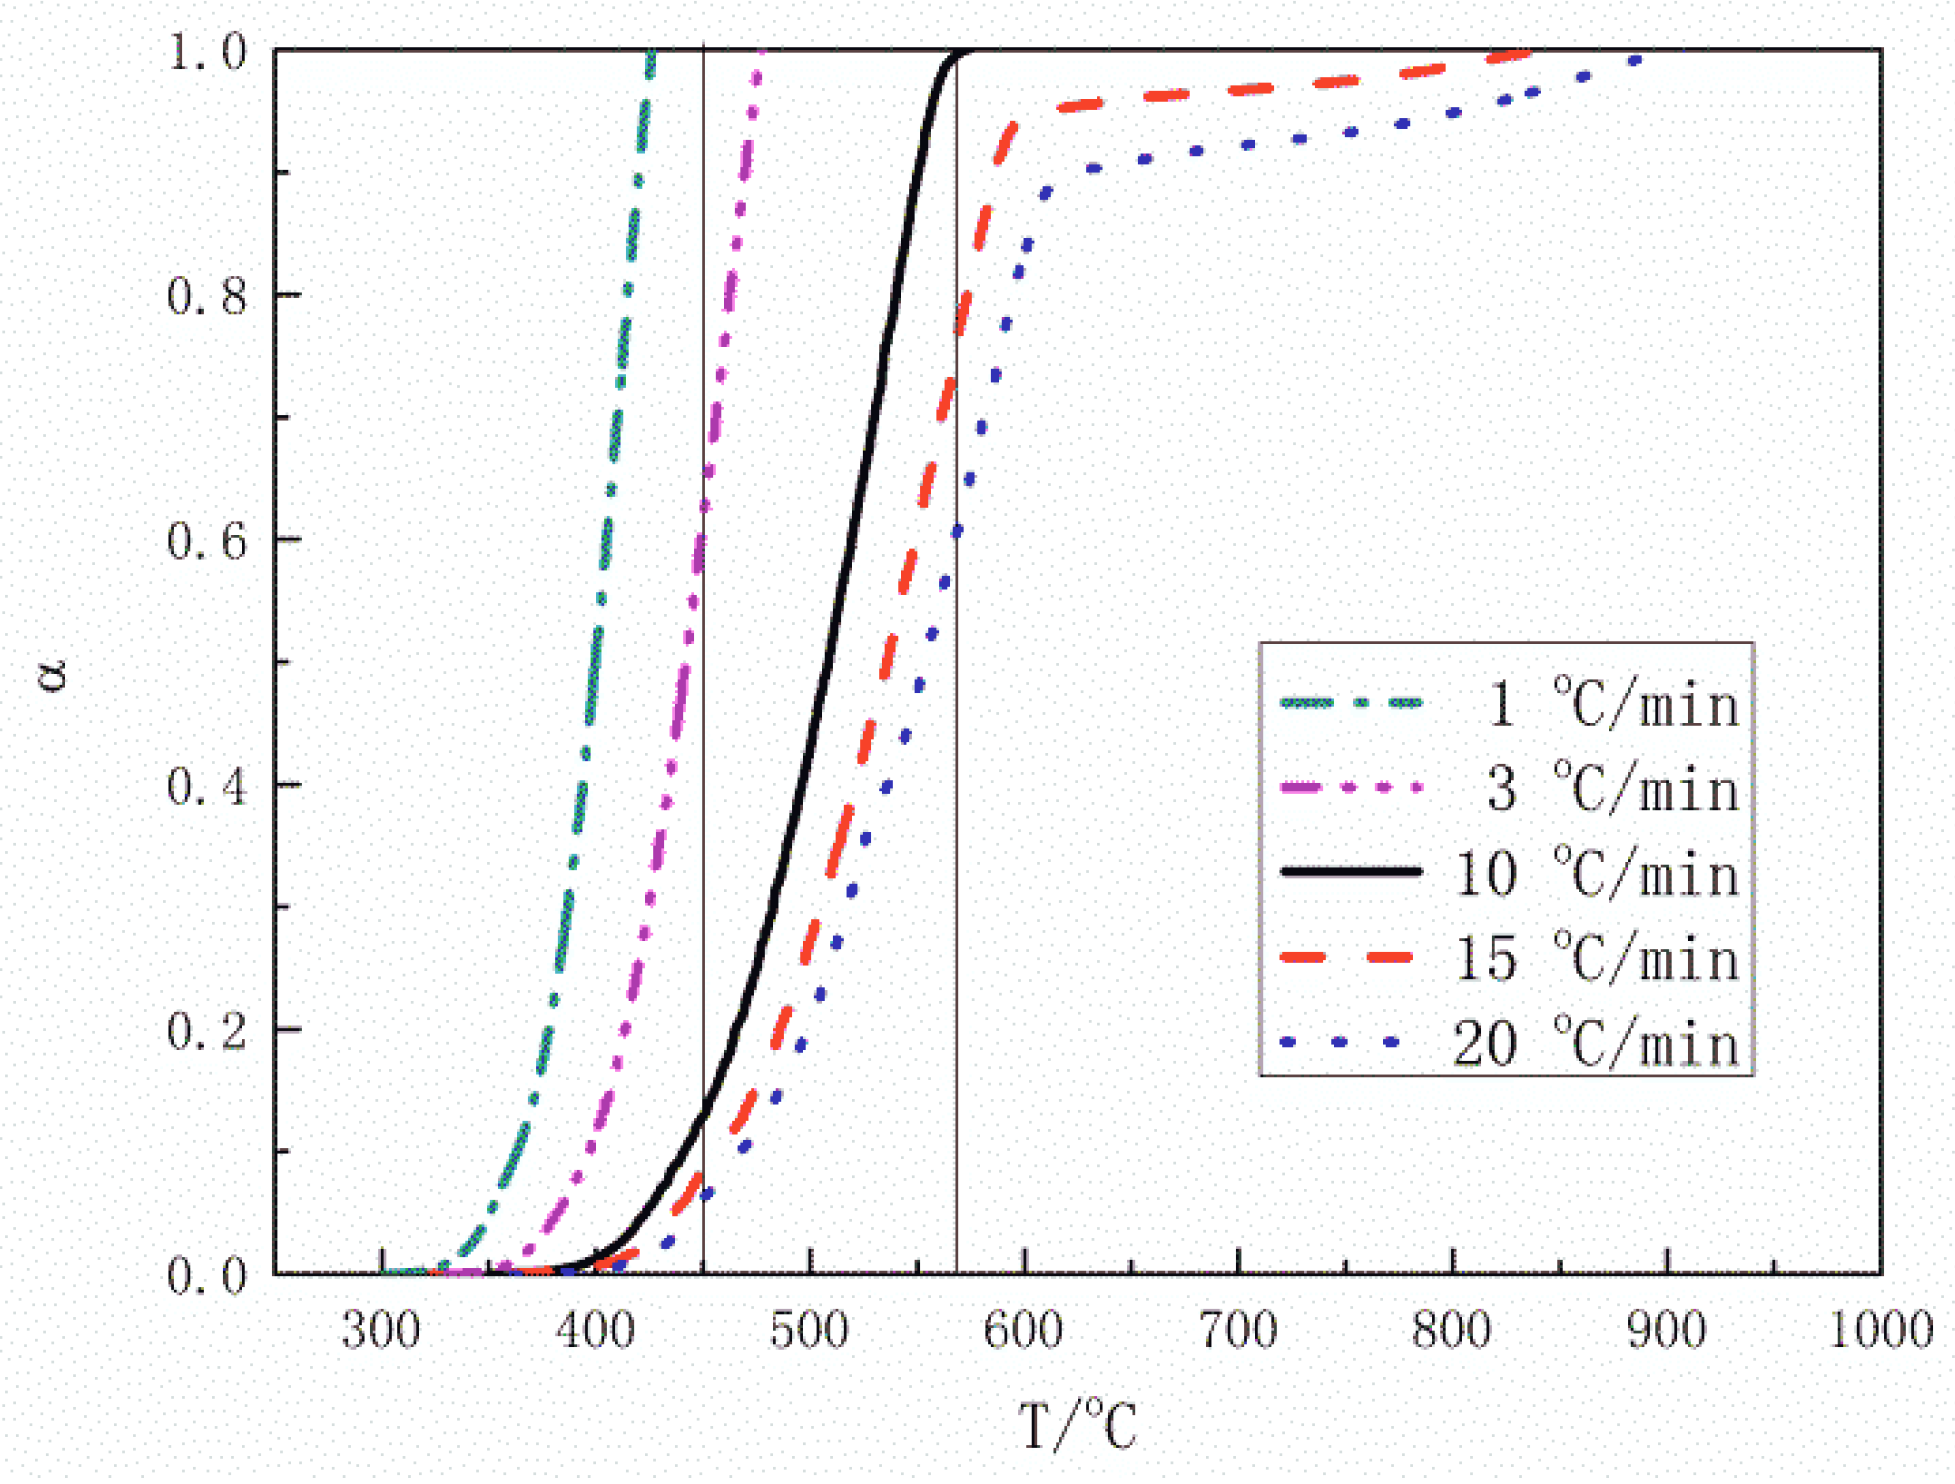
Thermal results of the experiments carried out at heating rates from 1 to 20 °C/min are shown in Figure 4. It shows that most of the reaction occurred in the temperature range of 450 °C and 570 °C (between the two vertical lines). It is in the temperature range reported in the literature [18]. As a whole, the reduction reaction proceeded fast, except for the final stage of samples with heating rates of 15 and 20 °C/min. Formation of dense outer layers and the sintering retarded the reduction at high temperature (>600 °C), of which the reaction mechanism can be different comparing with the low temperature reduction.
The values of Ea at different reaction fractions were calculated using Flynn-Wall-Ozawa (FWO) method [39,40], and Starink method [41]. The two methods are well known as model-free approach in kinetic analysis. FWO method is based on the numerical solution of the temperature integration. The equation is shown as follows:
where, is the temperature-increasing rate, is the gas constant, is the integral function of kinetic models, Ea is the apparent activation energy, is temperature and A is the pre-exponential factor. The requirement of FWO method application is .
Starink method was established from FWO method and Popescu method, and was also thought to be a valuable method to calculate Ea. The equation is as follows:
where, B = 1003.7 J/mol. Ea is the slope of line of .
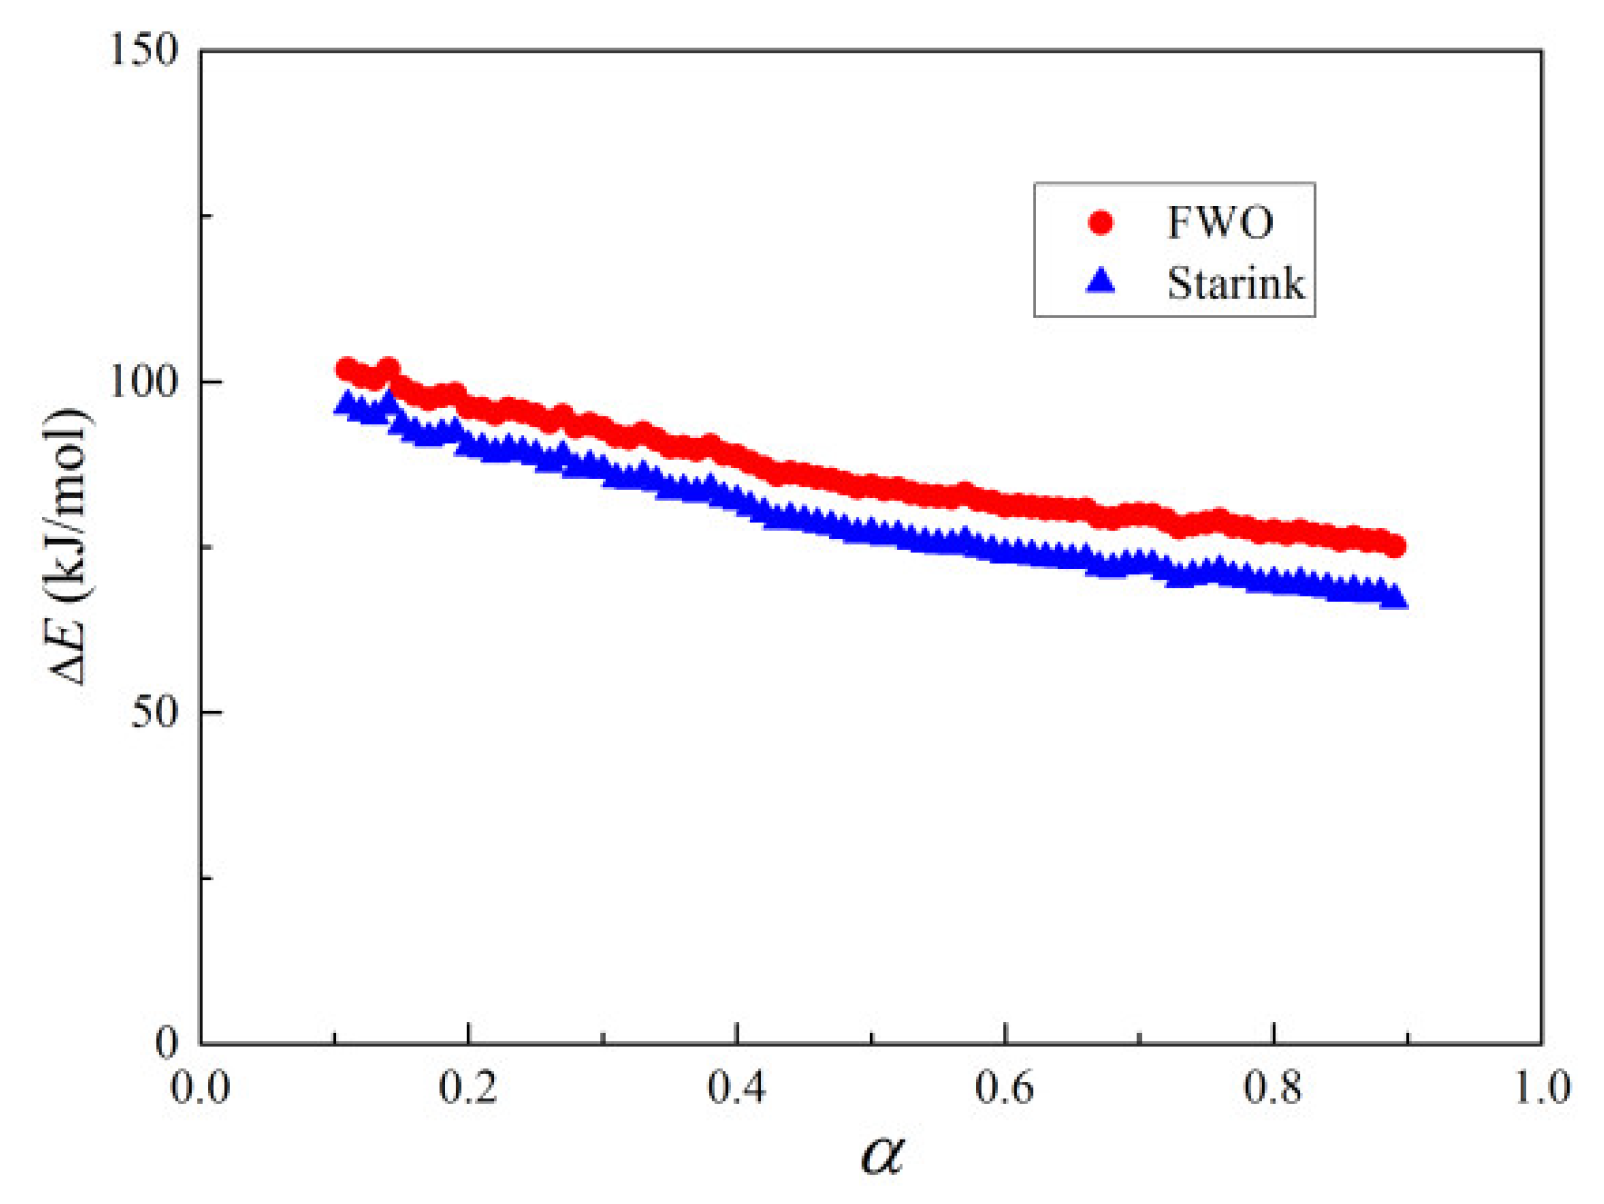
In the calculation, data of the last stage in the reduction with slow reaction rate were not considered. The results are shown in Figure 5 and the average apparent activation energies of the hematite reduction by hydrogen were extracted to be 86.1 kJ/mol, and 79.1 kJ/mol corresponding to the two methods, respectively, which are two rather close values. The average values of the coefficients of determination (R2) were 0.998, and 0.996 for the FWO method and Starink method, respectively. Pineau et al. [18] summarized that the apparent activation energy of the hematite reduction by hydrogen varied from 56.8 to 124.0 kJ/mol. It further proves that the obtained values are believable.
The values of Ea corresponding to different reaction fractions decreased from more than 100 kJ/mol (α = 0.1) to less than 80 kJ/mol (α = 0.9) smoothly. This variation is because that the reduction of hematite is a multi-step reaction.
3.3.2. Hematite without Heat Treatment
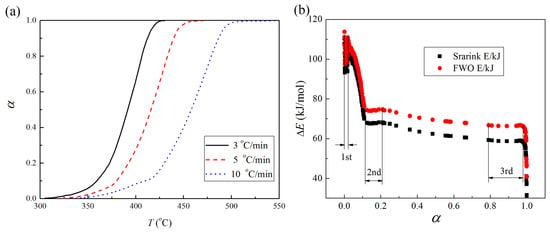
Figure 6 shows the reaction fraction curves and kinetic analysis results for the hematite particles without heat treatment. A turning point before α = 0.1 can be easily noticed in Figure 6a. Figure 6b shows that there are three platforms of the curves, and they are assigned as three stages. Steady reactions occurred in each stage. The two segments connecting the three stages are proposed to be the mixture of the reactions of the adjacent stages. Correspondingly, the activation energy of the reduction process decreases sharply from above 100 kJ/mol to lower than 80 kJ/mol. The 1st stage of reduction is supposed to be the reduction from hematite to magnetite. This stage lasted shorter than the other two stages as indicated in Figure 6b. The 2nd stage could be the reduction from magnetite to metallic iron, and then it turned to the parallel reductions of sub-oxides as the last stage: Fe3O4 → FeO and FeO → Fe. The apparent activation energies of the three stages are listed in Table 1. It also shows a decreasing tendency of the apparent activation energy with the increase of reaction fraction.
Here, the reduction stages are easy to be distinguished by the Ea-α curve in this reduction process, which is unlike the experiment result in Figure 5. The heat treatment of hematite is the reason to cause the difference. Similarly, Sastri et al. [23] found a variation of activation energy of hematite reduction after a heat treatment. It can be noted from the report of Pourghahramani et al. [42] that when α < 0.1, Ea is about 166~106 kJ/mol of non-activated hematite, and 102~70 kJ/mol of the sample after grinding for 9 h. Generally, grinding can create defects in materials, while annealing can redistribute and eradicate the dislocations in materials. Less defects result in the slow diffusion and less reactivity of hematite, and then the reaction kinetics can be influenced.
Nevertheless, all these experimental results indicated that the value of Ea decreases with increase of the reaction time during the reduction of hematite particles. In another word, the value of Ea of the reaction from hematite to magnetite is the highest in the whole reduction process, and the formation of metallic iron corresponding to the lowest value of Ea. Likewise, Pineau et al. [18] collected reference data of Ea of the reduction of iron oxides by H2. This paper reported that Ea of Fe2O3 → Fe3O4 is from 89.0 to 246.0 kJ/mol, which is higher than the Ea of Fe3O4 → FeO which is 77.3 kJ/mol, and Ea of FeO → Fe which is 85.4 kJ/mol or 72.0 kJ/mol.
4. Conclusions
The kinetic mechanism of the reduction of iron oxide particles was investigated in this study. It was found that the phase transformation of iron oxides was in multi-stages. Porous magnetite was formed with some degradation of the particles during the reduction. After that, the sintering of iron and wüstite formed a dense shell at the surface of the agglomeration of the particles, which retarded the further reduction reaction. Based on the isoconversional analysis of thermal results, the activation energy of the reaction was suggested to be time-dependent for the overall reaction. The kinetic mechanism could be affected by the pretreatments of the raw materials, such as a heat treatment. The average activation energies were reported to be 86.1 kJ/mol, and 79.1 kJ/mol as the results of FWO and Starink methods, respectively. The variation of activation energy with reaction fraction is smoother after a heat treatment, reflecting the heat treatment of raw materials has a significant influence on the reduction kinetics.
Author Contributions
Z.C., J.D., X.H. and H.Y. conceived and designed the experiments; Z.C. performed the experiments; Z.C. and J.D. analyzed the data; Z.C. and J.D. prepared the original draft; Z.C., J.D., X.H. and H.Y. reviewed it before submission.
Acknowledgments
Thanks are given to the financial supports from the National Key R&D Program of China (2017YFB0603800 & 2017YFB0603805), National Natural Science Foundation of China (51604046, 51674053), Fundamental and Frontier Research Project of Chongqing (cstc2017jcyjAX0322), Natural Science Foundation of Hebei Province (No. E2018209266) and Natural Science Foundation of Tangshan city (No. 17110208a).
Conflicts of Interest
The authors declare no conflict of interest.
References
- International Energy Agency. Tracking Industrial Energy Efficiency and CO2 Emissions; Media, Stedi: Paris, France, 2007; p. 24. [Google Scholar]
- Wang, X.; Lin, B. How to reduce CO2 emissions in China’s iron and steel industry. Renew. Sustain. Energy Rev. 2016, 57, 1496–1505. [Google Scholar] [CrossRef]
- Guo, D.; Hu, M.; Pu, C.; Xiao, B.; Hu, Z.; Liu, S.; Wang, X.; Zhu, X. Kinetics and mechanisms of direct reduction of iron ore-biomass composite pellets with hydrogen gas. Int. J. Hydrogen Energy 2015, 40, 4733–4740. [Google Scholar] [CrossRef]
- Hughes, R.; Kam, E.; Mogadam-Zadeh, H. The reduction of iron ores by hydrogen and carbon monoxide and their mixtures. Thermochim. Acta 1982, 59, 361–377. [Google Scholar] [CrossRef]
- Da Costa, A.R.; Wagner, D.; Patisson, F. Modelling a new, low CO2 emissions, hydrogen steelmaking process. J. Clean. Prod. 2013, 46, 27–35. [Google Scholar] [CrossRef]
- Sohn, H.Y. Suspension Hydrogen Reduction of Iron Ore Concentrate; University of Utah: Salt Lake City, UT, USA, 2008. [Google Scholar]
- Sohn, H. Suspension ironmaking technology with greatly reduced energy requirement and CO2 emissions. Steel Times Int. 2007, 31, 68. [Google Scholar]
- Sohn, H.; Moo, E.C.; Zhang, Y.; Ramos, J.E. Suspension reduction technology for ironmaking with low CO2 emission and energy requirement. In Proceedings of the Iron and Steel Technology Conference, St. Louis, MO, USA, 4–7 May 2009. [Google Scholar]
- Sohn, H.Y.; Mohassab, Y. Development of a Novel Flash Ironmaking Technology with Greatly Reduced Energy Consumption and CO2 Emissions. J. Sustain. Metall. 2016, 2, 216–227. [Google Scholar] [CrossRef]
- Elzohiery, M.; Sohn, H.Y.; Mohassab, Y. Kinetics of Hydrogen Reduction of Magnetite Concentrate Particles in Solid State Relevant to Flash Ironmaking. Steel Res. Int. 2017, 88, 1600133. [Google Scholar] [CrossRef]
- Fan, D.-Q.; Sohn, H.Y.; Mohassab, Y.; Elzohiery, M. Computational Fluid Dynamics Simulation of the Hydrogen Reduction of Magnetite Concentrate in a Laboratory Flash Reactor. Metall. Mater. Trans. B 2016, 47, 3489–3500. [Google Scholar] [CrossRef]
- Olsson, O. Low-Emission Steel Production: Decarbonising Heavy Industry. Available online: https://www.sei.org/perspectives/low-emission-steel-production-hybrit/ (accessed on 11 April 2018).
- Turkdogan, E.; Vinters, J. Gaseous reduction of iron oxides: Part I. Reduction of hematite in hydrogen. Metall. Mater. Trans. B 1971, 2, 3175–3188. [Google Scholar] [CrossRef]
- Park, E.; Ostrovski, O. Reduction of titania-ferrous ore by hydrogen. ISIJ Int. 2004, 44, 999–1005. [Google Scholar] [CrossRef]
- Dang, J.; Chou, K.C.; Hu, X.J.; Zhang, G.H. Reduction kinetics of metal oxides by hydrogen. Steel Res. Int. 2013, 84, 526–533. [Google Scholar] [CrossRef]
- Fruehan, R.; Li, Y.; Brabie, L.; Kim, E.J. Final stage of reduction of iron ores by hydrogen. Scand. J. Metall. 2005, 34, 205–212. [Google Scholar] [CrossRef]
- Habermann, A.; Winter, F.; Hofbauer, H.; Zirngast, J.; Schenk, J.L. An experimental study on the kinetics of fluidized bed iron ore reduction. ISIJ Int. 2000, 40, 935–942. [Google Scholar] [CrossRef]
- Pineau, A.; Kanari, N.; Gaballah, I. Kinetics of reduction of iron oxides by H2: Part I: Low temperature reduction of hematite. Thermochim. Acta 2006, 447, 89–100. [Google Scholar] [CrossRef]
- Pineau, A.; Kanari, N.; Gaballah, I. Kinetics of reduction of iron oxides by H2: Part II. Low temperature reduction of magnetite. Thermochim. Acta 2007, 456, 75–88. [Google Scholar] [CrossRef]
- Piotrowski, K.; Mondal, K.; Wiltowski, T.; Dydo, P.; Rizeg, G. Topochemical approach of kinetics of the reduction of hematite to wüstite. Chem. Eng. J. 2007, 131, 73–82. [Google Scholar] [CrossRef]
- Dang, J.; Hu, X.J.; Zhang, G.H.; Hou, X.M.; Yang, X.B.; Chou, K.C. Kinetics of reduction of titano-magnetite powder by H2. High Temp. Mater. Proc. 2013, 32, 229–236. [Google Scholar] [CrossRef]
- Munteanu, G.; Ilieva, L.; Andreeva, D. TPR data regarding the effect of sulfur on the reducibility of α-Fe2O3. Thermochim. Acta 1999, 329, 157–162. [Google Scholar] [CrossRef]
- Jozwiak, W.K.; Kaczmarek, E.; Maniecki, T.P.; Ignaczak, W.; Maniukiewicz, W. Reduction behavior of iron oxides in hydrogen and carbon monoxide atmospheres. Appl. Catal. A 2007, 326, 17–27. [Google Scholar] [CrossRef]
- Sastri, M.V.C.; Viswanath, R.P.; Viswanathan, B. Studies on the reduction of iron oxide with hydrogen. Int. J. Hydrogen Energy 1982, 7, 951–955. [Google Scholar] [CrossRef]
- Chung, F.H. Quantitative interpretation of X-ray diffraction patterns of mixtures. I. Matrix-flushing method for quantitative multicomponent analysis. J. Appl. Crystallogr. 1974, 7, 519–525. [Google Scholar] [CrossRef] [Green Version]
- Snyder, R.L. The use of reference intensity ratios in X-ray quantitative analysis. Powder Diffr. 1992, 7, 186–193. [Google Scholar] [CrossRef]
- ICDD. JCPDS PDF-2 Database; ICDD: Newtown Square, PA, USA, 2001; Volume 51. [Google Scholar]
- Stølen, S.; Glöckner, R.; Grønvold, F. Nearly stoichiometric iron monoxide formed as a metastable intermediate in a two-stage disproportionation of quenched wüstite. Thermodynamic and kinetic aspects. Thermochim. Acta 1995, 256, 91–106. [Google Scholar] [CrossRef]
- Khader, M.M.; El-Anadouli, B.E.; El-Nagar, E.; Ateya, B.G. Kinetics of the reduction of Fe2O3 with hydrogen. J. Solid State Chem. 1991, 93, 283–290. [Google Scholar] [CrossRef]
- Emel’yanov, D.; Korolev, K.; Mikhailenko, M.; Knot’ko, A.; Oleinikov, N.; Tret’yakov, Y.D.; Boldyrev, V. Mechanochemical Synthesis of Wüstite, Fe1–xO, in High-Energy Apparatuses. Inorg. Mater. 2004, 40, 632–635. [Google Scholar] [CrossRef]
- Chen, Z.; Chou, K.-C.; Morita, K. Mechanism of Metastable Wüstite Formation in the Reduction Process of Iron Oxide below 570 °C. Mater. Trans. 2016, 57, 1660–1663. [Google Scholar] [CrossRef]
- Hayes, P. Analysis of Product Morphologies and Reaction Mechanisms on Gaseous Reduction of Iron Oxides. Steel Res. Int. 2011, 82, 480–493. [Google Scholar] [CrossRef]
- Baguley, P.; John, D.H.S.; Hayes, P. The conditions for the formation of lath and porous magnetite on reduction of hematite in H2/H2O gas mixtures. Metall. Mater. Trans. B 1983, 14, 513–514. [Google Scholar] [CrossRef]
- Rau, M.-F.; Rieck, D.; Evans, J.W. Investigation of iron oxide reduction by TEM. Metall. Trans. B 1987, 18, 257–278. [Google Scholar] [CrossRef]
- Weiss, B.; Sturn, J.; Voglsam, S.; Strobl, S.; Mali, H.; Winter, F.; Schenk, J. Experimental and Morphological Investigations of the Reduction from Coarse Hematite to Magnetite and Wüstite under Fluidized Bed Conditions. Steel Res. Int. 2010, 81, 93–99. [Google Scholar] [CrossRef]
- Ettabirou, M.; Dupré, B.; Gleitzer, C. Nucleation and early growth of magnetite on synthetic and natural hematite crystals. React. Solids 1986, 1, 329–343. [Google Scholar] [CrossRef]
- Gleitzer, C. Some remarkable features in the reduction of iron oxides. Solid State Ionics 1990, 38, 133–141. [Google Scholar] [CrossRef]
- Holme, B. Morphology and Crystallographic Relationships in Reduced Magnetite: A Comprehensive Structural Study of the Porous Iron Ammonia Synthesis Catalyst. J. Catal. 1997, 167, 12–24. [Google Scholar] [CrossRef]
- Flynn, J.H.; Wall, L.A. A quick, direct method for the determination of activation energy from thermogravimetric data. J. Polym. Sci. Part B Polym. Lett. 1966, 4, 323–328. [Google Scholar] [CrossRef]
- Ozawa, T. Estimation of activation energy by isoconversion methods. Thermochim. Acta 1992, 203, 159–165. [Google Scholar] [CrossRef]
- Starink, M.J. The determination of activation energy from linear heating rate experiments: A comparison of the accuracy of isoconversion methods. Thermochim. Acta 2003, 404, 163–176. [Google Scholar] [CrossRef]
- Pourghahramani, P.; Forssberg, E. Reduction kinetics of mechanically activated hematite concentrate with hydrogen gas using nonisothermal methods. Thermochim. Acta 2007, 454, 69–77. [Google Scholar] [CrossRef]
Figure 1.
X-ray diffraction patterns of samples reduced partially by pure hydrogen at heating rates of (a) 10 and (b) 20 °C/min.
Figure 1.
X-ray diffraction patterns of samples reduced partially by pure hydrogen at heating rates of (a) 10 and (b) 20 °C/min.

Figure 2.
Calculated mass ratio of phases from XRD data by Chung’s model [25,26] in samples reduced partially with pure hydrogen at heating rates of (a) 10 and (b) 20 °C/min.

Figure 3.
Scanning Electron Microscope photographs of pure hematite samples before reduction (a) and after reduction in pure hydrogen at a heating rate of 20 °C/min from room temperature to (b) 445 °C, (c) 490 °C, (d) 505 °C, (e) 510 °C, and (f) 600 °C.
Figure 3.
Scanning Electron Microscope photographs of pure hematite samples before reduction (a) and after reduction in pure hydrogen at a heating rate of 20 °C/min from room temperature to (b) 445 °C, (c) 490 °C, (d) 505 °C, (e) 510 °C, and (f) 600 °C.

Figure 4.
Reaction fraction curves of pure hematite particles reduced by pure hydrogen.

Figure 5.
The extracted activation energy based on the Flynn-Wall-Ozawa (FWO) method and Starink method.
Figure 5.
The extracted activation energy based on the Flynn-Wall-Ozawa (FWO) method and Starink method.

Figure 6.
(a) Reaction fraction curves and (b) Activation energy of the reduction process of hematite particles without heat treatment in pure hydrogen.
Figure 6.
(a) Reaction fraction curves and (b) Activation energy of the reduction process of hematite particles without heat treatment in pure hydrogen.


Table 1.
Apparent activation energy of the three stages in the reduction process of hematite in hydrogen.
Table 1.
Apparent activation energy of the three stages in the reduction process of hematite in hydrogen.
| Ea (kJ/mol) | 1st Stage | 2nd Stage | 3rd Stage |
|---|---|---|---|
| FWO | 105.0 | 74.3 | 66.6 |
| Starink | 100.8 | 67.8 | 58.9 |
© 2018 by the authors. Licensee MDPI, Basel, Switzerland. This article is an open access article distributed under the terms and conditions of the Creative Commons Attribution (CC BY) license (http://creativecommons.org/licenses/by/4.0/).
Share and Cite
MDPI and ACS Style
Chen, Z.; Dang, J.; Hu, X.; Yan, H. Reduction Kinetics of Hematite Powder in Hydrogen Atmosphere at Moderate Temperatures. Metals 2018, 8, 751. https://0-doi-org.brum.beds.ac.uk/10.3390/met8100751
AMA Style
Chen Z, Dang J, Hu X, Yan H. Reduction Kinetics of Hematite Powder in Hydrogen Atmosphere at Moderate Temperatures. Metals. 2018; 8(10):751. https://0-doi-org.brum.beds.ac.uk/10.3390/met8100751
Chicago/Turabian StyleChen, Zhiyuan, Jie Dang, Xiaojun Hu, and Hongyan Yan. 2018. "Reduction Kinetics of Hematite Powder in Hydrogen Atmosphere at Moderate Temperatures" Metals 8, no. 10: 751. https://0-doi-org.brum.beds.ac.uk/10.3390/met8100751
Note that from the first issue of 2016, this journal uses article numbers instead of page numbers. See further details here.