Corrosion of Copper in Unpolluted Chloride-Rich Atmospheres
by
 and
and
Patricia Lopesino
, 
Jenifer Alcántara
,
Daniel De la Fuente
,
Belén Chico
,
José Antonio Jiménez
and
Manuel Morcillo
*
National Centre for Metallurgical Research (CENIM/CSIC), Avda. Gregorio del Amo 8, 28040 Madrid, Spain
*
Author to whom correspondence should be addressed.
Metals 2018, 8(11), 866; https://0-doi-org.brum.beds.ac.uk/10.3390/met8110866
Submission received: 24 September 2018
/
Revised: 17 October 2018
/
Accepted: 19 October 2018
/
Published: 24 October 2018
Abstract
:The atmospheric corrosion of copper in pure coastal atmospheres has not been extensively studied. This paper presents the results of research carried out in pure coastal atmospheres with annual chloride deposition rates of between 110–1640 mg/m2·d. Copper specimens (99.99 wt % Cu) were exposed for 3, 6, 9, and 12 months at six testing stations located at different distances from the seashore. Tests were performed to determine the copper corrosion rate, the surface area coated with corrosion products, and the evolution of both magnitudes with exposure time. Conventional and grazing X-ray diffraction techniques were used to analyze the corrosion products formed—cuprite and the polymorphs botallackite, atacamite, and clinoatacamite—and their presence through the patina thickness, while scanning electron microscopy/energy dispersive X-ray spectrometry was employed to study the morphology of the resulting corrosion layers. The most relevant findings are a notable increase in atacamite and clinoatacamite formation at higher atmospheric salinity levels and longer exposure times, and the flaking-off of the corrosion product layer formed in the marine atmospheres with the highest chloride deposition rates.
1. Introduction
Copper is a widely used material due to its high atmospheric corrosion resistance and its good thermal and electrical conductivity. However, though the magnitude of copper corrosion is low, it can nevertheless have a negative impact on the correct functioning of electronic equipment such as printed circuits [1]. Thanks to the attractive nature of the corrosion product layer (patina) formed on copper, this material has also long been used in architectural applications such as domes, roofing and frontages on churches, castles, and other monumental buildings [2,3,4,5,6,7,8,9].
Scientific literature on the atmospheric corrosion of copper is highly abundant [6,10,11,12] as is published information on the mechanisms by which copper patinas form in atmospheres polluted with SO2 and other atmospheric compounds [6,13,14,15,16,17]. However, data on the corrosion of copper in chloride-rich atmospheres is less abundant [6,18,19,20,21,22,23,24,25,26,27,28,29] and only a very small number of studies consider in depth the effect of marine aerosol (sea-chloride deposition) in pure marine atmospheres without SO2 pollution [26,27,28,29]. The present paper seeks to address this deficit by considering six pure marine atmospheres located at different distances from the seashore in the same coastal area.
Papers published long time ago, when very few information on coastal atmospheres was available, tended to generalize and indicate a copper corrosion rate in marine atmospheres of the order of 1 μm/year [3,6,30] or in the range of 1–2 μm/year [10], which as shall presently be seen are well below the real levels recently found in coastal atmospheres when more focused studies have been carried out. Table 1 sets out the corrosion rates found by different studies when testing copper behavior in pure marine atmospheres (without SO2 pollution). The table has been prepared after an exhaustive review of the literature published on this subject, considering only marine atmospheres with chloride deposition rates of ≥10 mg/m2/day and SO2 deposition rates of ≤10 mg/m2/day [27,28,31]. Published data referring to marine atmospheres with SO2 contents in excess of this value [20,22] has not been included in the table. It can be seen that the copper corrosion encountered in this type of atmosphere is often higher than the aforementioned 1–2 μm range.
It is well established among researchers who have studied this subject that the first stage of copper corrosion in marine atmospheres is the formation of a cuprite (Cu2O) film on the copper surface. Then, the formation of chlorinated corrosion products (nantokite and copper hydroxychlorides) takes place in the cuprite surface depending on the concentration of chloride ions in the atmosphere [6].
However, there is a lack in the scientific literature regarding the quantitative information of the crystalline phases present in the copper patina and its location in the corrosion layer, as well as the coverage of the cuprite surface by basic copper chlorides (Cu2(OH)3Cl).
The research exposed in this work is mainly focused on these issues.
2. Materials and Methods
2.1. Environmental Characteristics of the Atmospheric Testing Site: Cabo Vilano Wind Farm (Galicia, Spain)
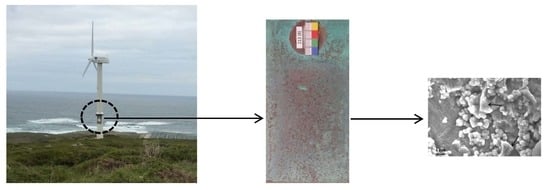
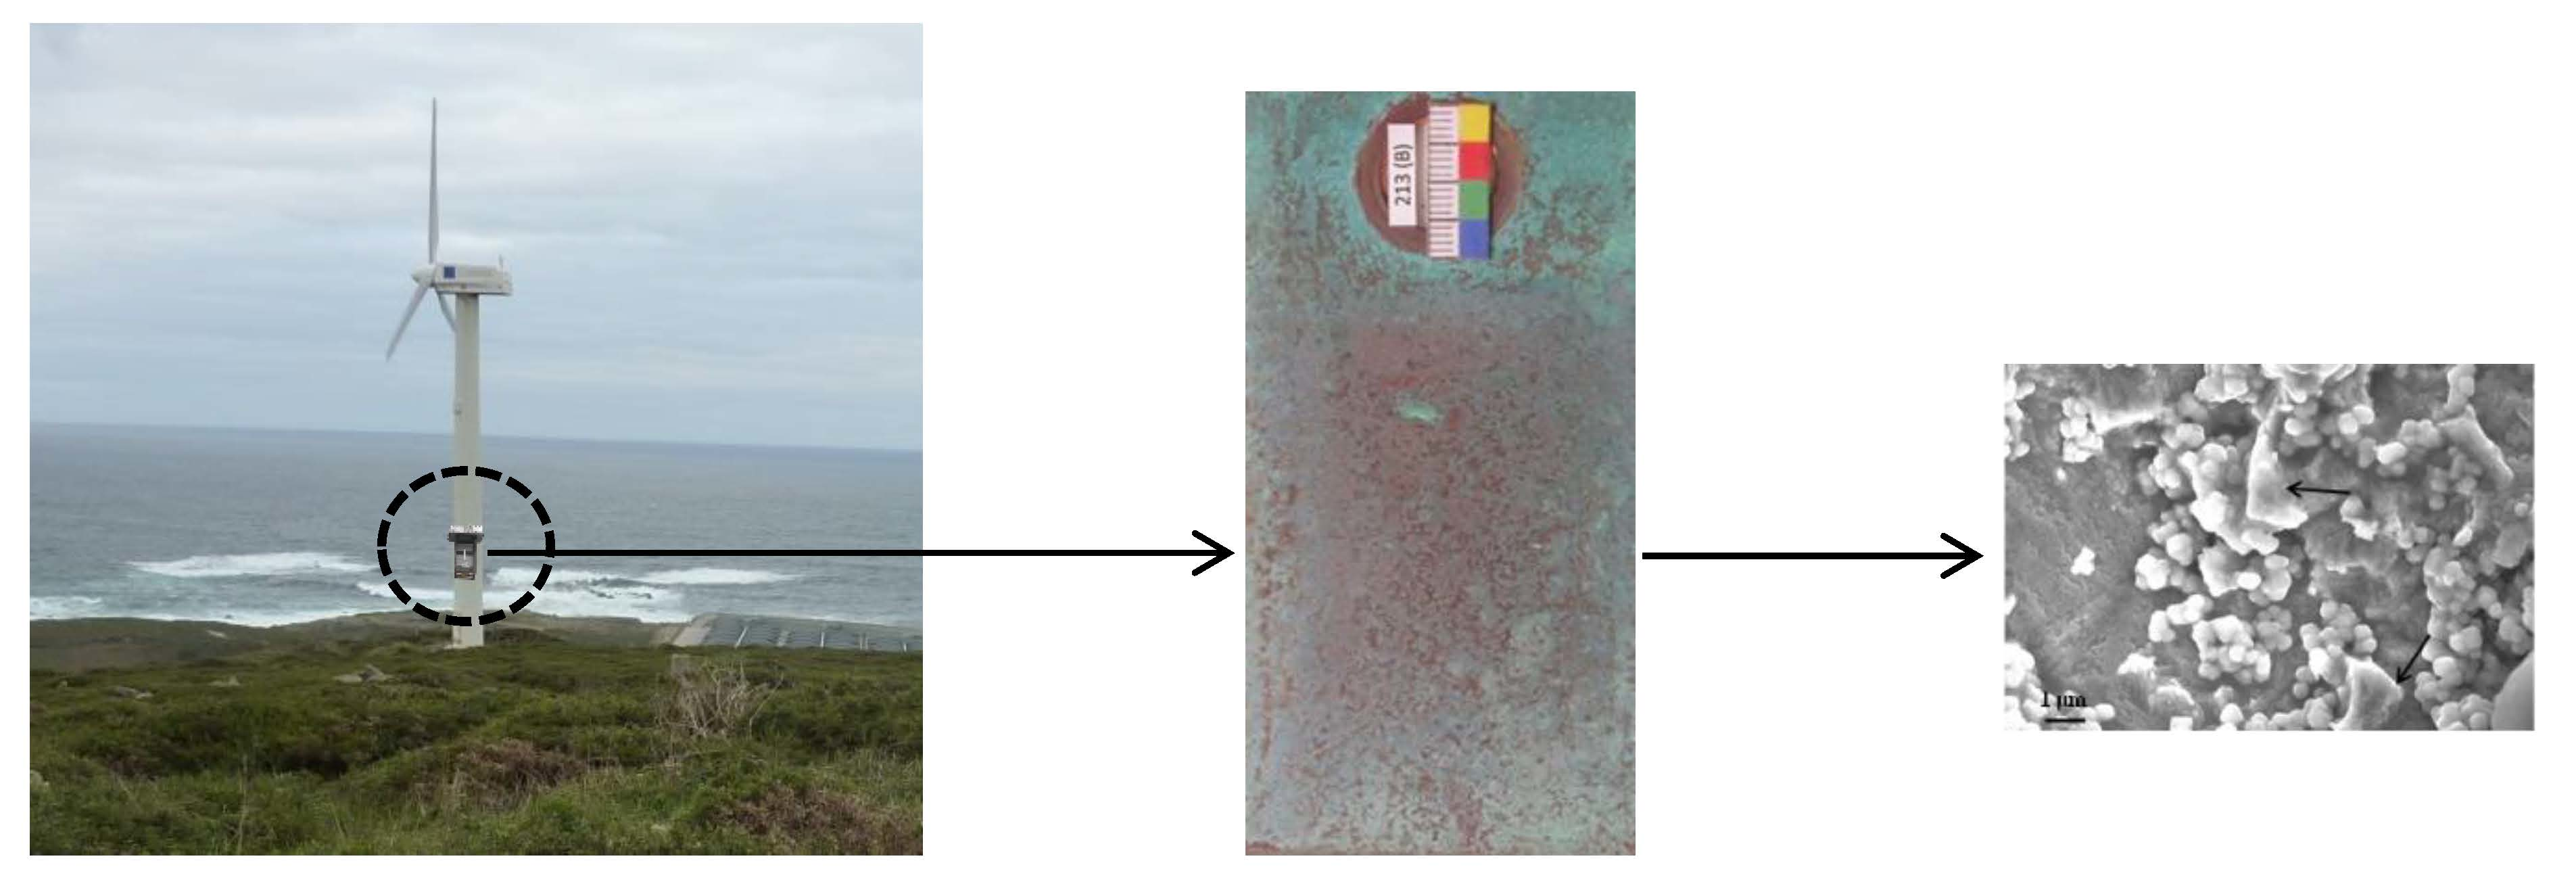
Environmental parameters characterizing the atmospheric testing site during the study period of April 2015 to March 2016 were obtained from the Spanish Meteorological Agency (AEMET) database for Cabo Vilano weather station, located on the same site. The area presents a high mean annual relative humidity (82.4%), a mild mean annual temperature (14.0 °C), and a high precipitation rate (11,109 L/m2/year) with >150 days precipitation/year. These values indicate a high time of wetness of the metallic surface that favors the atmospheric corrosion process. The test site is exposed to strong winds, mainly northeasterly (NE) and south–southwesterly (SSW), with a mean annual wind speed of 27.7 km/h. The testing stations were installed facing north (N) and so have been exposed to strong winds with considerable entrainment of marine aerosol (atmospheric salinity), which has invigorated the atmospheric corrosion process. Figure 1 shows the annual wind rose for the area during the study period.
2.2. Testing Stations
Research has been carried out at six testing stations located at different distances from the seashore. The atmosphere surrounding the testing stations may be considered pure marine, with a very low atmospheric SO2 content (0.7–0.9 mg SO2/m2/day) [32]. A description of the type of testing station used has been given elsewhere [33].
2.3. Test Specimens
Test specimens of 99.99 wt % Cu and dimensions of 100 mm × 50 mm × 1.5 mm were prepared from a cold-rolled half-hard copper sheet (Cu-DHP CW 024A R240 [34]). Before being exposed to the atmosphere the specimens were degreased and then washed in a sulfuric acid solution [35] followed by three rinses in distilled water, a final rinse in ethanol and drying with hot air. Prior to their atmospheric exposure the specimens were weighed to the nearest 10−4 g in a Mettler AT 261 Delta Range microbalance and stored in a desiccator over silica gel.
2.4. Evaluation of Corrosion Rates
The test specimens were exposed in outdoor (unsheltered) conditions with an inclination of 90° from the horizontal to better reproduce the exposure condition of copper sheets, widely used in covering the facades of buildings. Specimens were withdrawn after 3, 6, 9 and 12 months and three-monthly measurements of the atmospheric chloride deposition rate were carried out using the wet candle technique [32]. The corrosion experienced by copper was evaluated in triplicate using the mass loss technique in an amidosulfonic acid solution (Annex A ISO 9226 [36]).
2.5. Nature of the Corrosion Products Formed
X-ray diffraction (XRD) studies with a Bruker AXS D8 diffractometer (Bruker AXS, Karlsruhe, Germany) in parallel beam mode (Goebel mirror) were carried out for characterizing the crystalline phases forming the copper patinas and their evolution with exposure time. XRD data were collected in both, Bragg–Brentano geometry and under grazing incidence condition (GIXRD) keeping the incidence beam angle at 2° to obtain information on the evolution of the phase fractions as a function of depth. The penetration depth at which 90% of the X-ray are scattered (t0.90) upon a copper hydroxychloride (Cu2(OH)3Cl) surface was estimated in both cases using the AbsorbDX software by Bruker AXS (AbsorbDX program version 1.1.4, Bruker AXS GmbH, Karlsruhe, Germany). As for Co Kα radiation at an incidence angle of 2° t0.9 is about 2.5 µm, grazing incidence XRD is especially suitable for characterization of the phases present in the outermost layer of patina (final corrosion products). On the other hand, as in conventional of θ–2θ scan it was detected the presence of the diffraction peaks of Cu, the corresponding XRD patterns contain an average information of all the products generated under atmospheric corrosion.
In most of previous works, the phase identification of the phase present in the patina formed on a copper and its alloys has been performed by XRD diagrams using a search-match program supported by the Joint Committee on Power Diffraction Standards (JCPDS) cards. Thus in a first attempt, the phases present in our patina were identified from XRD patterns with the help of the JCPDS cards of International Centre for Diffraction Data (ICDD) for the most common copper chlorides. In Table 2 it is included the position of the strongest peak of theses phases for Co radiation.
As shown in Table 2, the most intense peaks of atacamite, paratacamite, clinoatacamite, and botallactite are placed at very near positions. Thus, matching the XRD pattern with the JCPDS data base did not allow to unambiguously characterizing the phases present in the patina due to the broad reflections normally observed in copper corrosion products. This problem could be overcome by using the Rietveld analysis since this method fits the whole diffraction pattern, including explicitly all reflections, overlapping or not, and peak broadening associated to microstructural details (crystallite size and microstrain), are explicitly included. Besides, quantitative information of the crystalline phases present in the patina from the XRD patterns is obtained by the Rietveld fitting method. In this study, the version 4.2 of the Rietveld analysis program TOPAS (Bruker AXS, Karlsruhe, Germany) has been used for modelling the full patterns with the crystallographic information for Cu, cuprite, copper hydroxychlorides (atacamite, clinoatacamite, botallackite) and nantokite obtained from Pearson’s Crystal Structure databases [37]. In order to eliminate the instrumental contribution from XRD patterns, the instrument function was calculated from a XRD pattern of a corundum plate standard recorded under the same conditions.
2.6. Coverage of the Cuprite Surface by Basic Copper Chlorides (Cu2(OH)3Cl)
The base copper is initially coated with a cuprite patina of a reddish color. As exposure time in the marine atmosphere advances, this cuprite surface gradually becomes coated with corrosion products of a turquoise blue color. It is of interest to evaluate this coverage in terms of a percentage and its evolution with exposure time. For this purpose use has been made of the ImageJ image analysis technique [38]. The selection of the covered area and the determination of the percentage of cuprite surface that is covered by basic copper chlorides were done automatically by the software, selecting the areas with similar turquoise blue color in contrast with the reddish tone corresponding to cuprite.
2.7. Morphology of the Patinas Formed
The morphology of the patinas formed was assessed by both surface and cross-section microscopic observations. Use was made of a Hitachi S4800 field emission gun scanning electron microscope (SEM, Hitachi, Tokyo, Japan). SEM images were recorded working at an acceleration voltage of 15 kV at different magnifications.
3. Results
3.1. Corrosion Rates
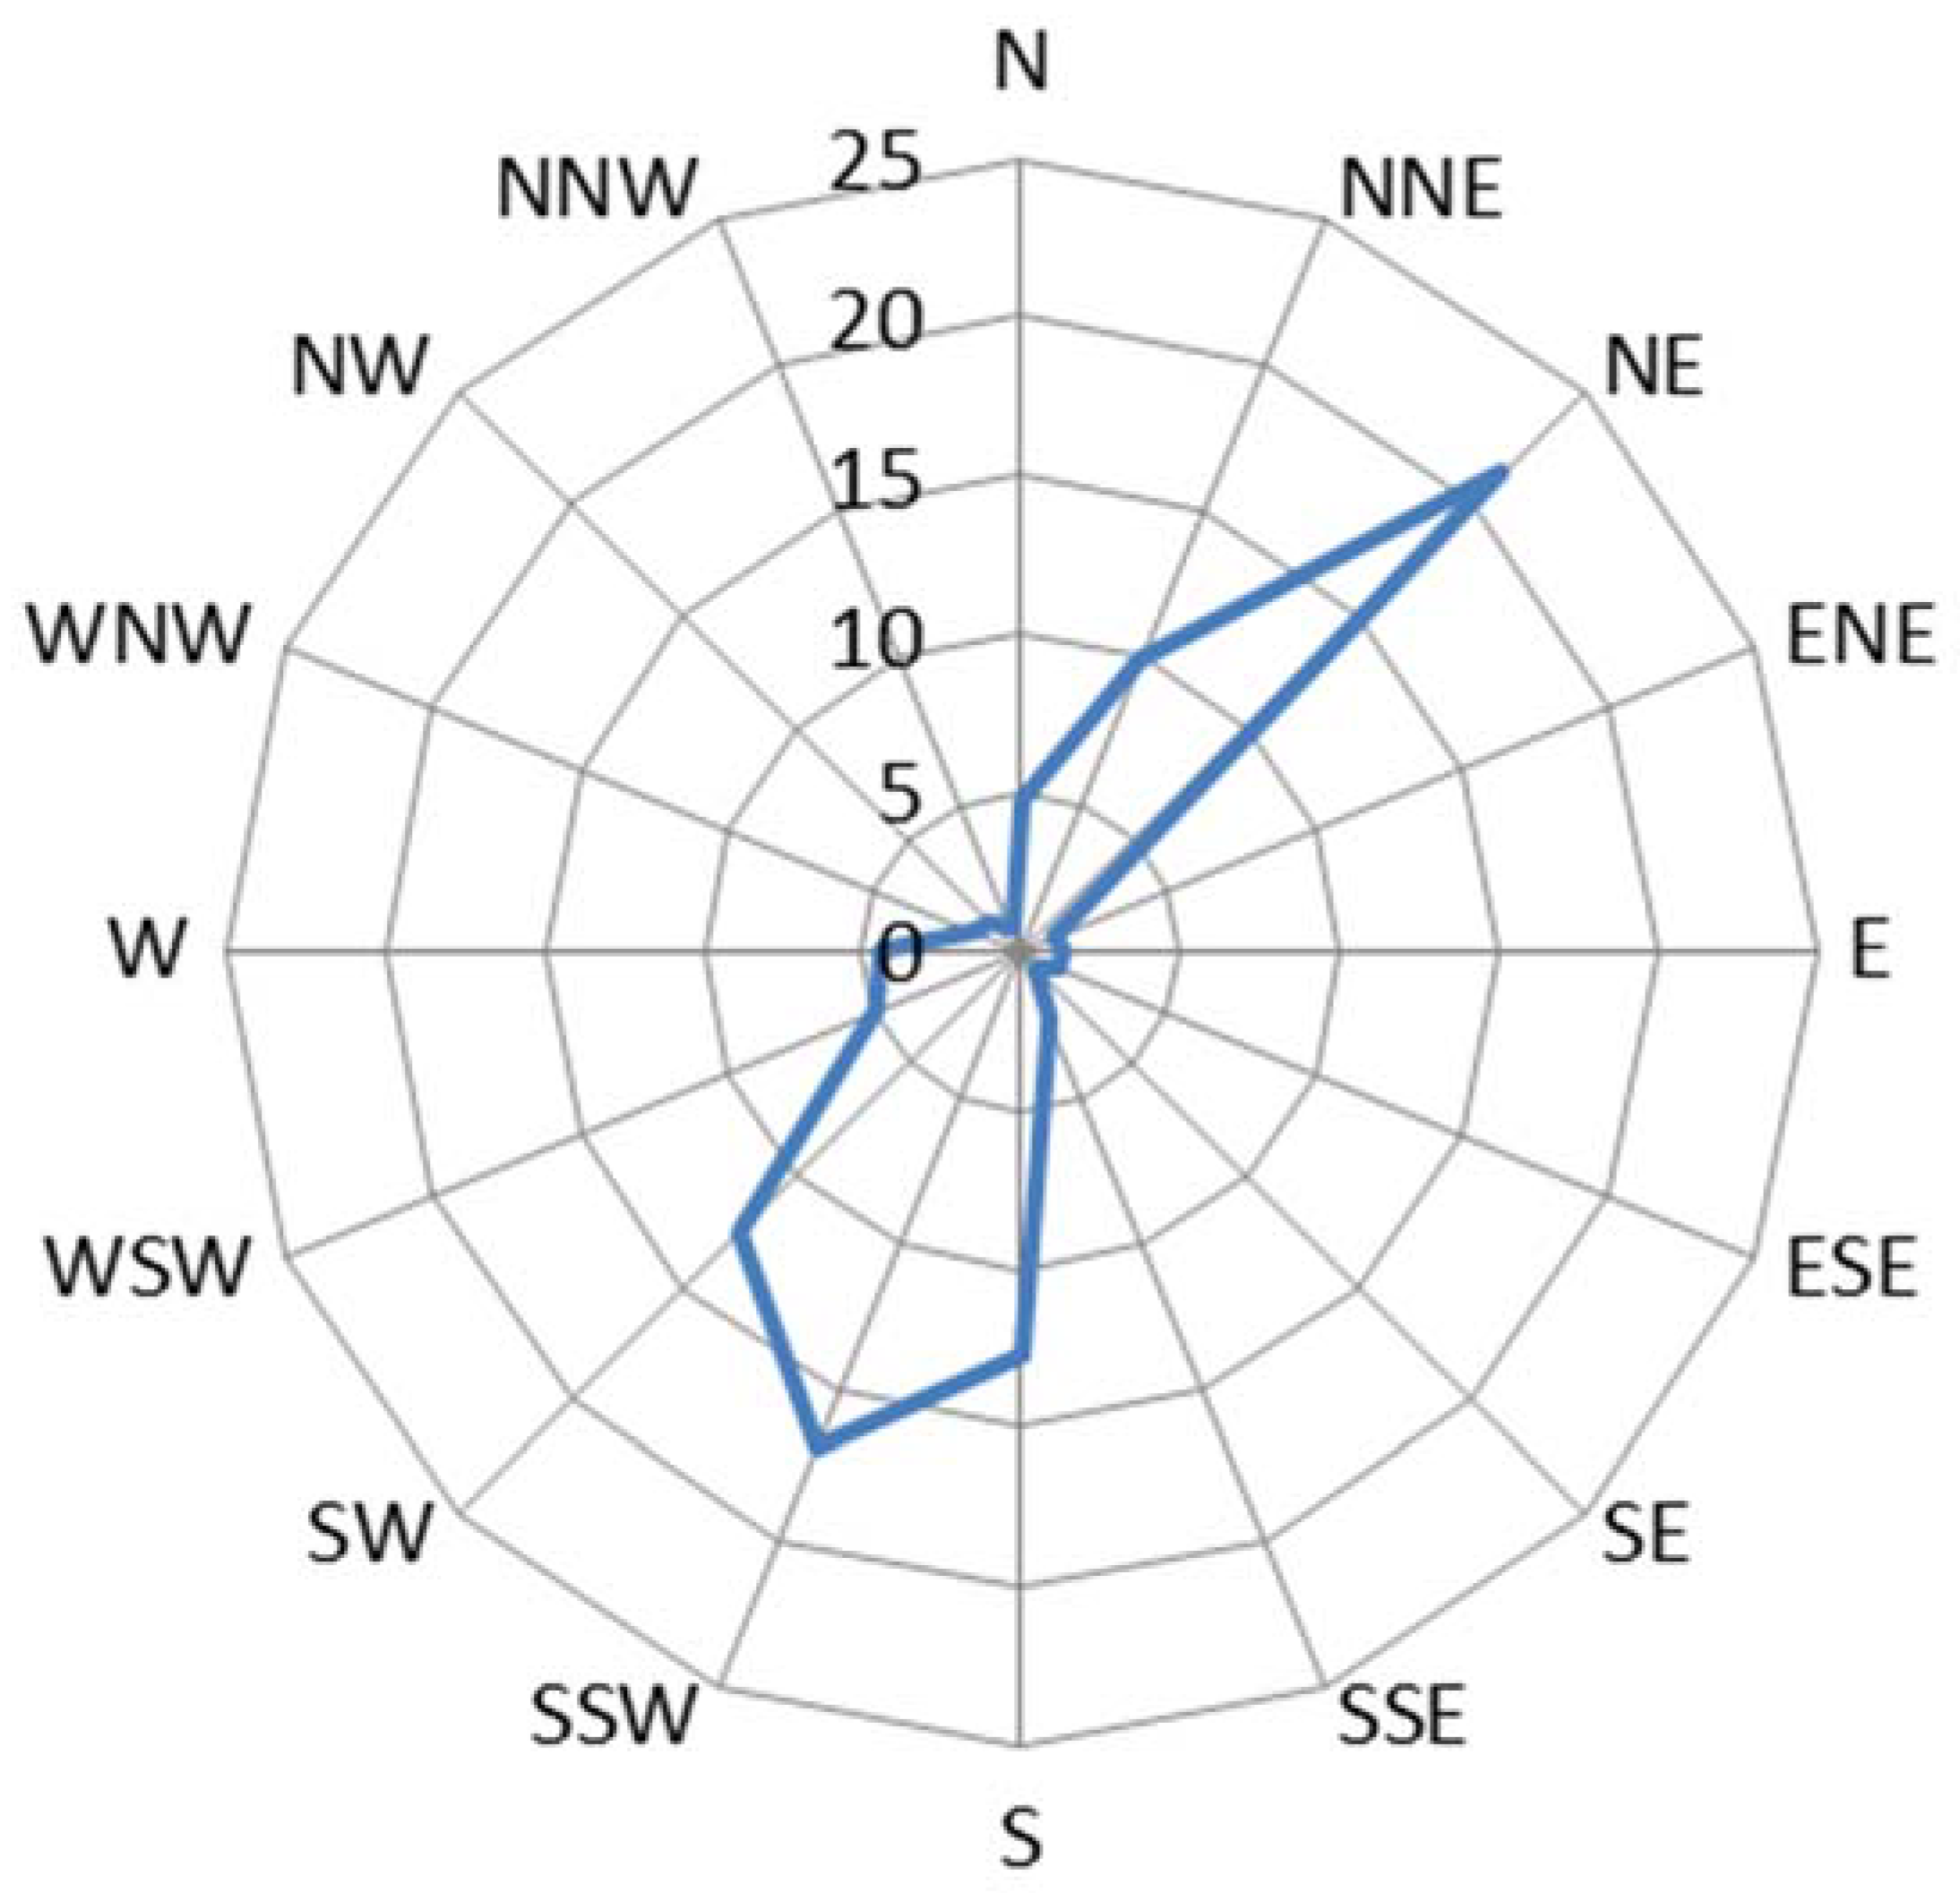
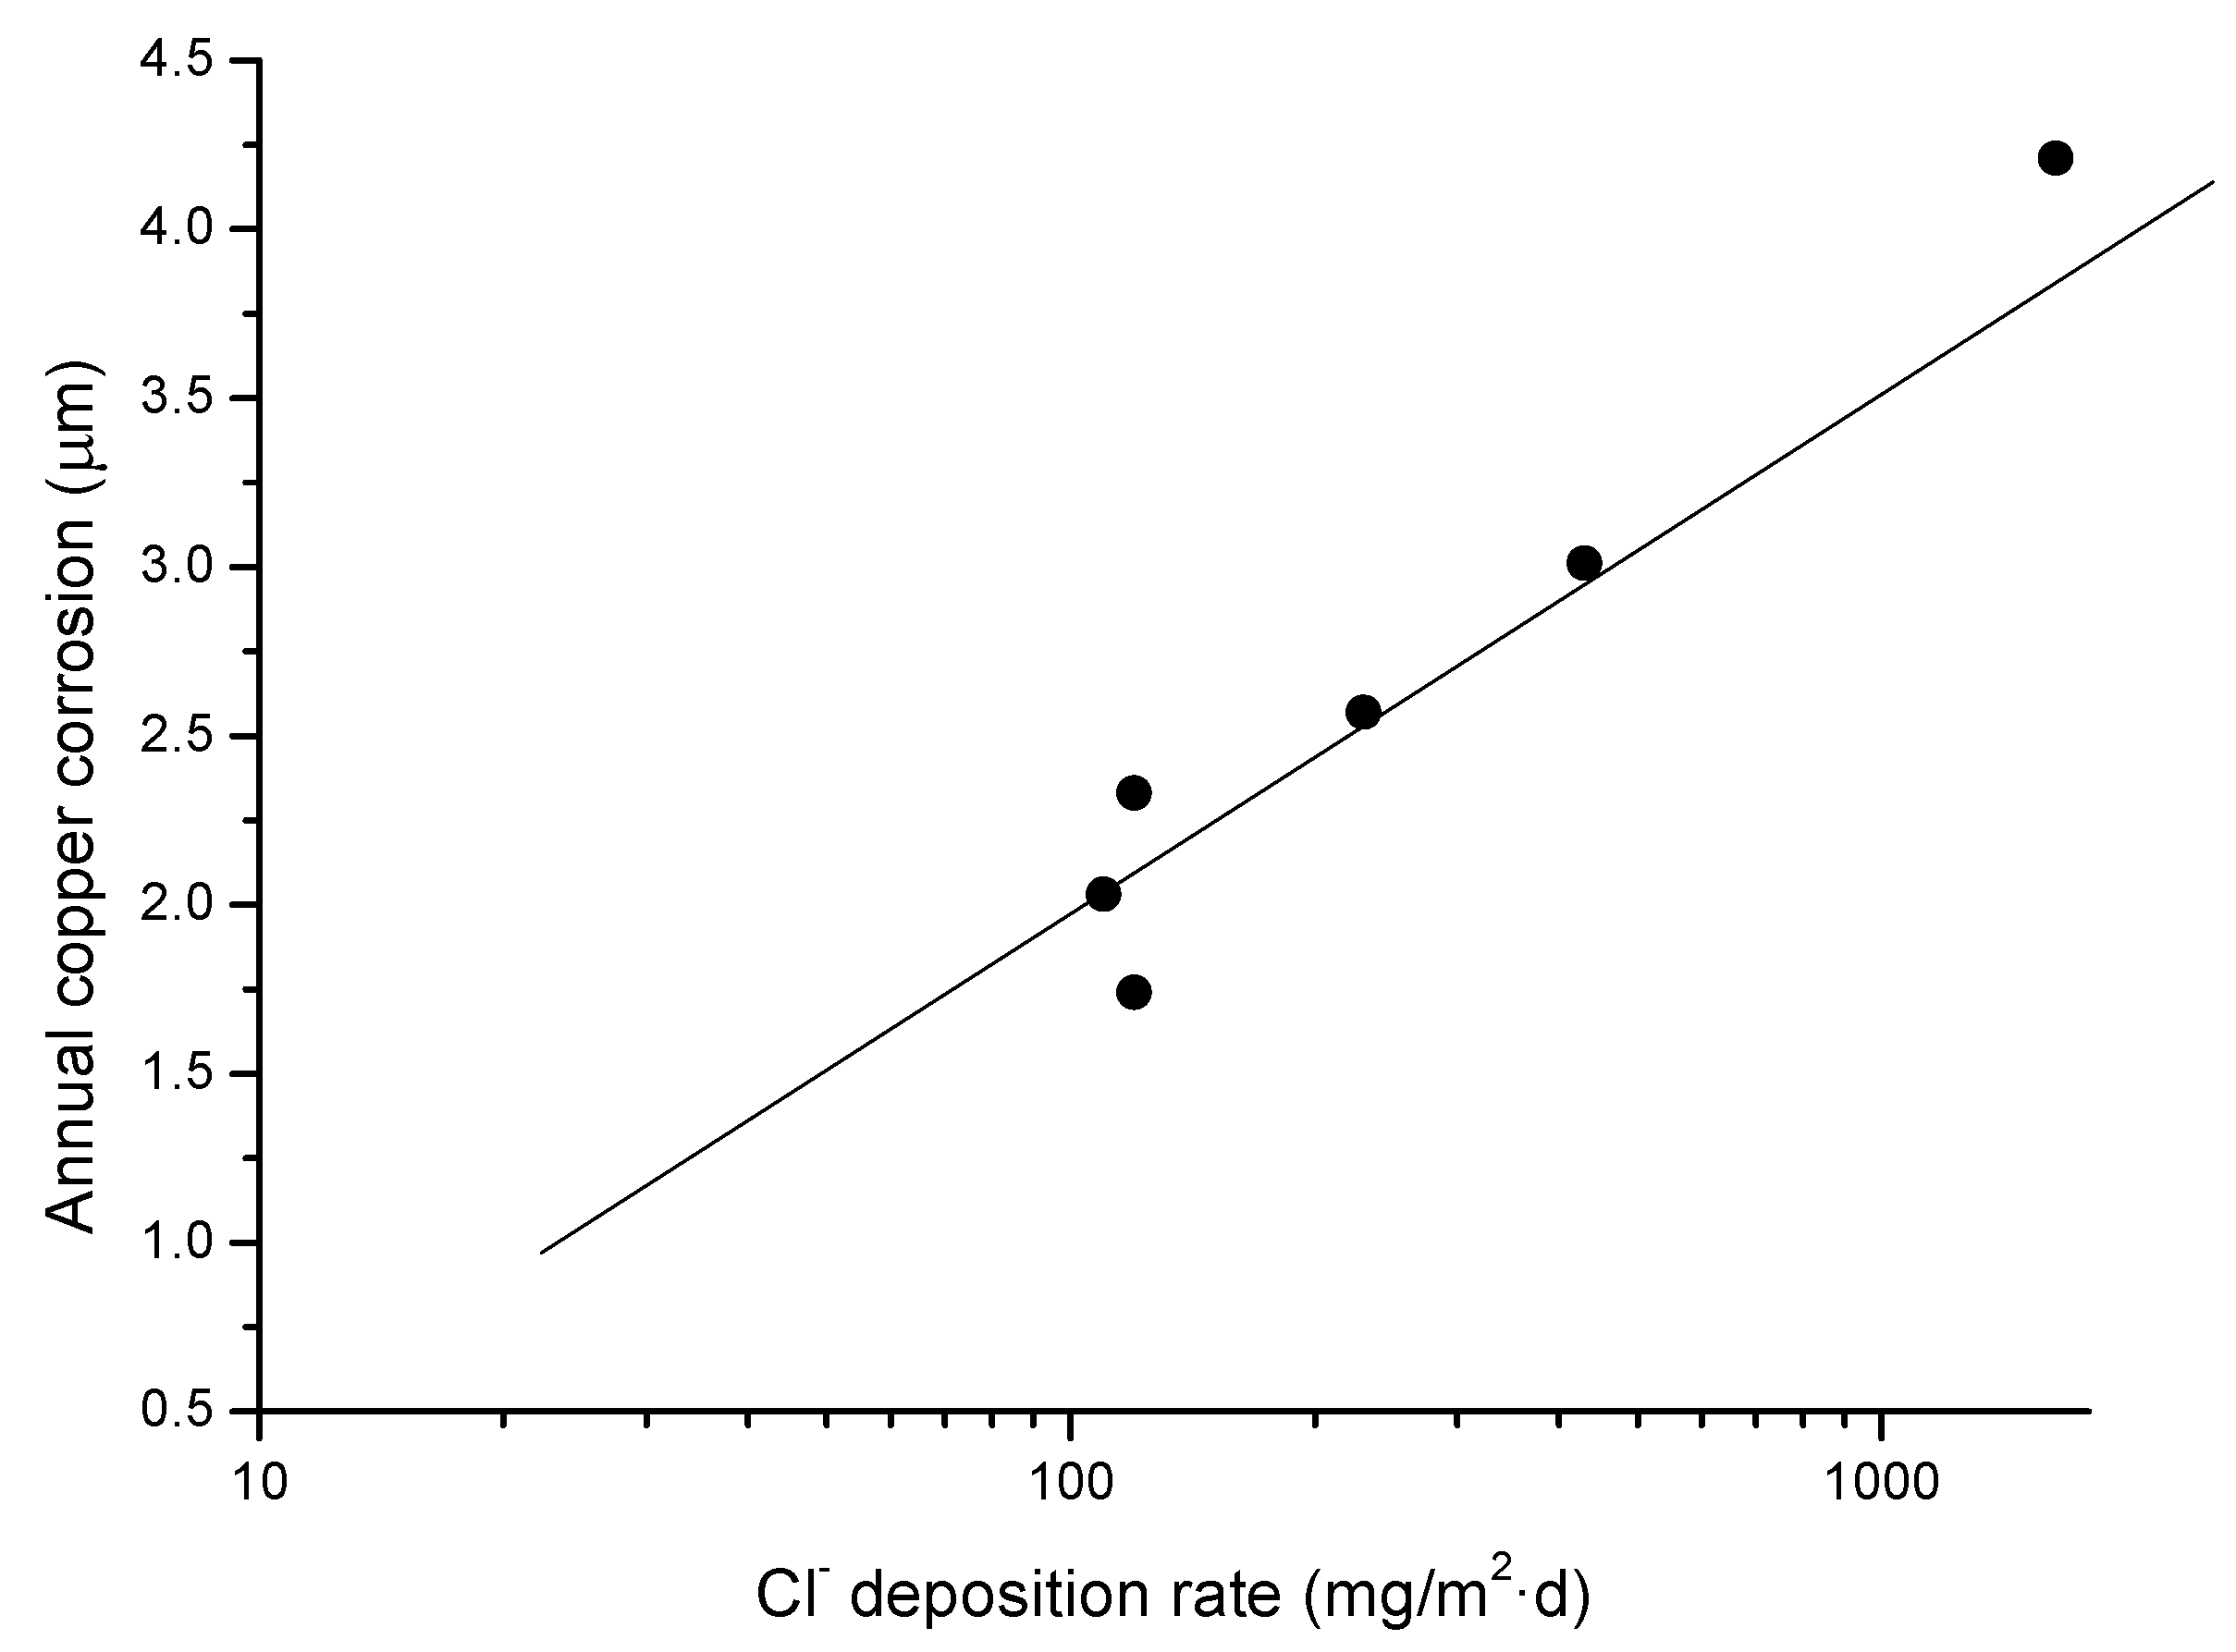
Table 3 sets out the copper corrosion rates found in this research. Copper corrosion clearly decreases inland from the seashore and the lower the chloride deposition rate (see Figure 2). The copper corrosion rate decreases notably in all the stations the longer the atmospheric exposure time. The variation in first year copper corrosion as a function of the chloride deposition rate follows a straight line (Figure 3).
3.2. Nature of the Corrosion Products Formed
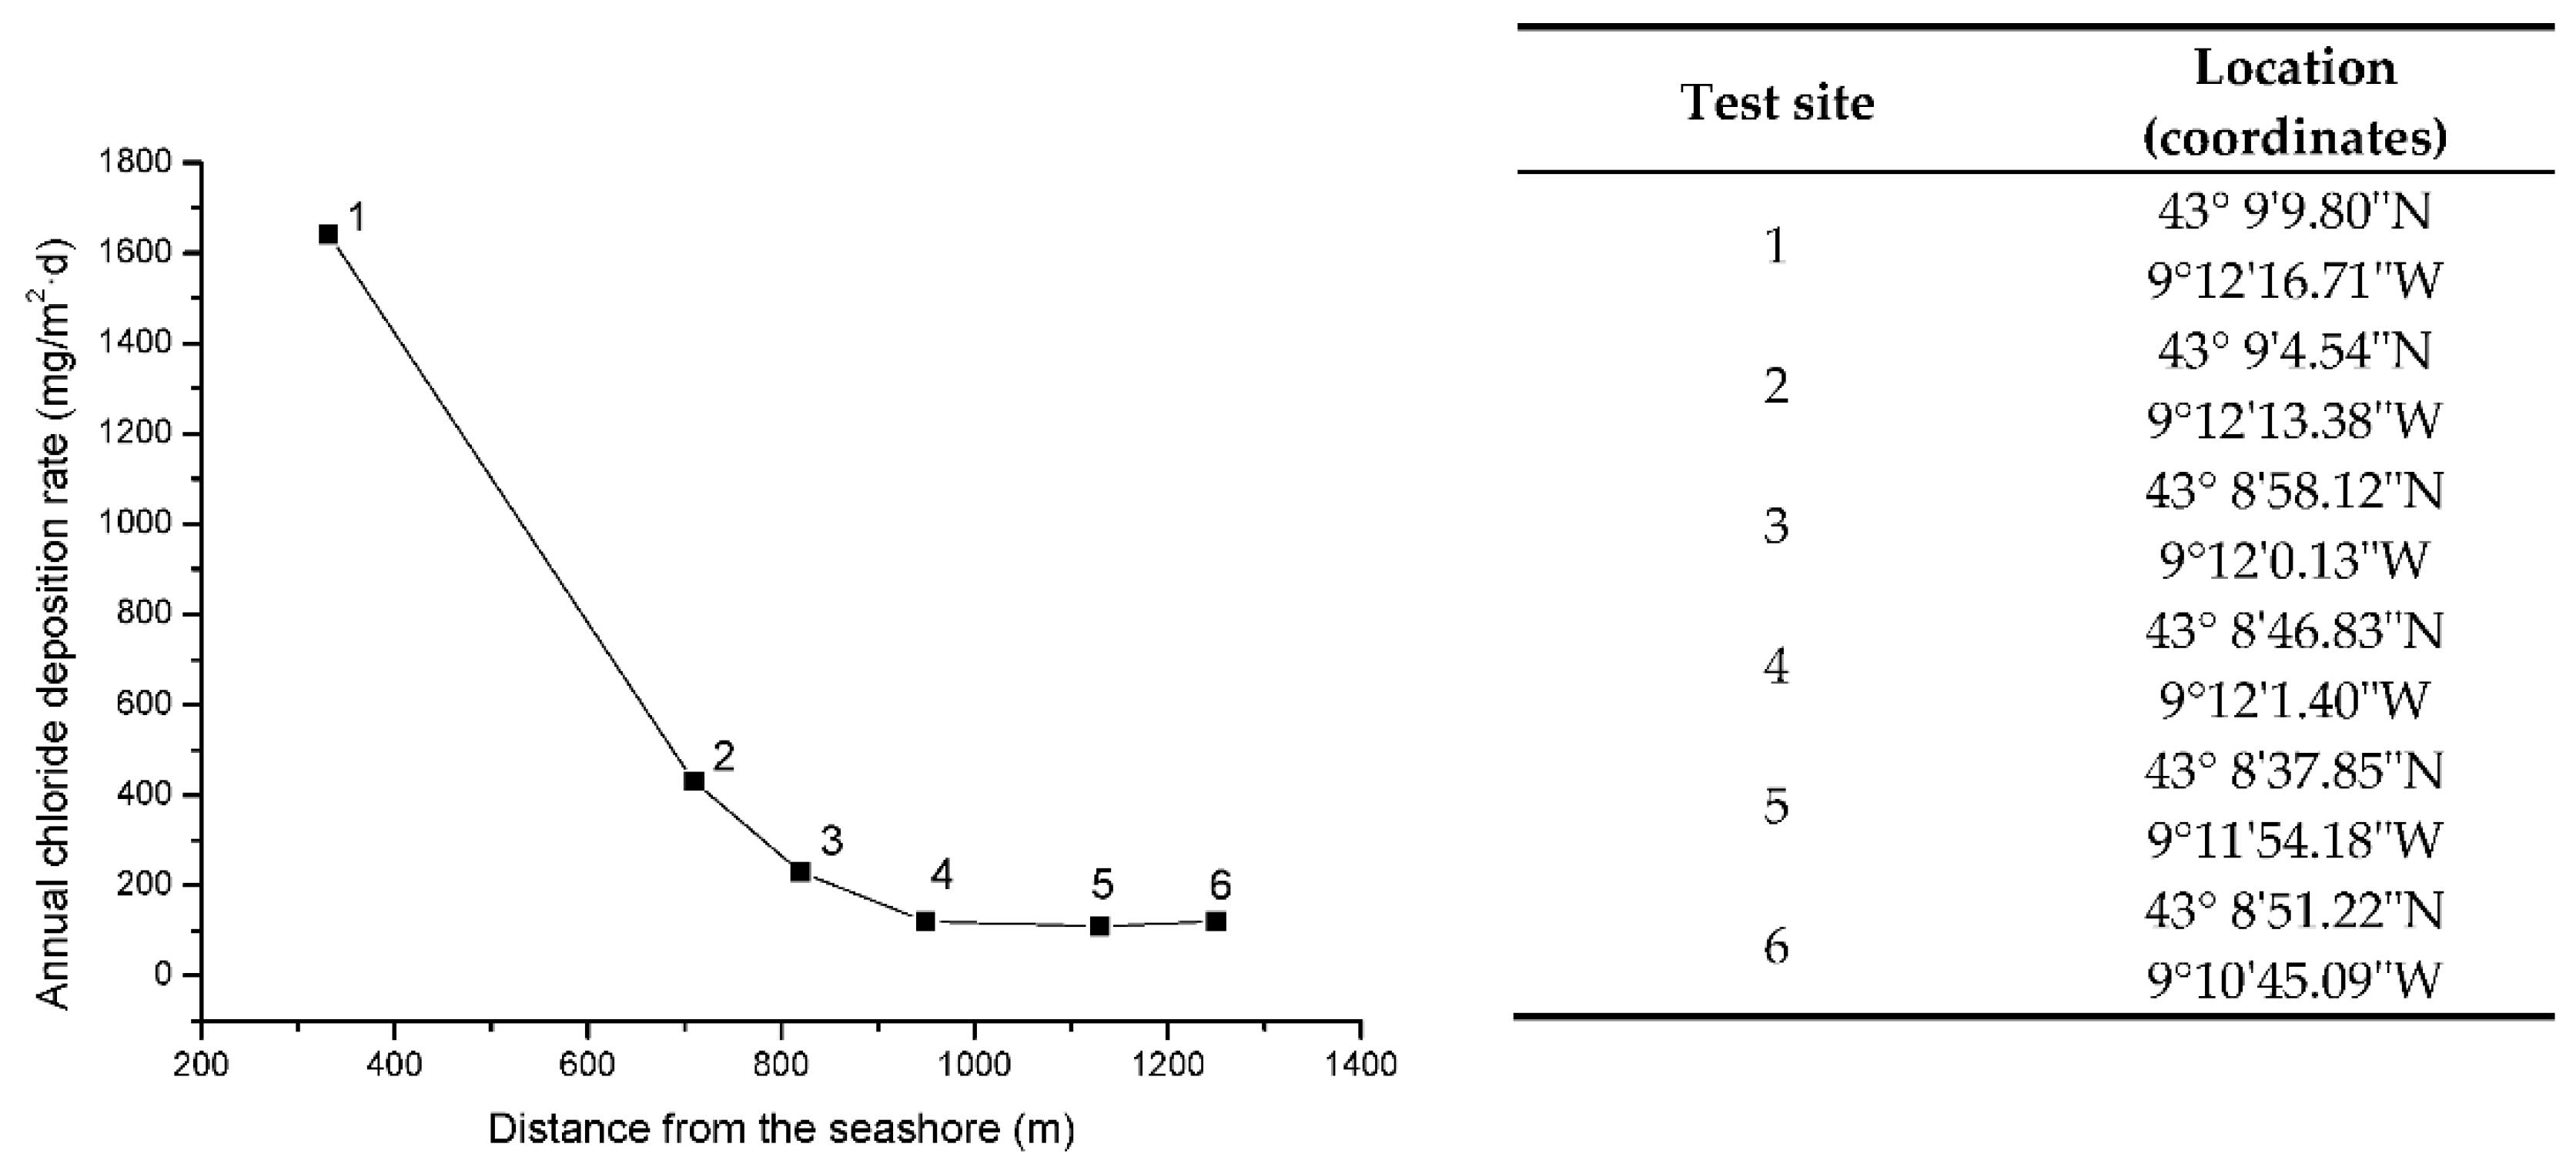
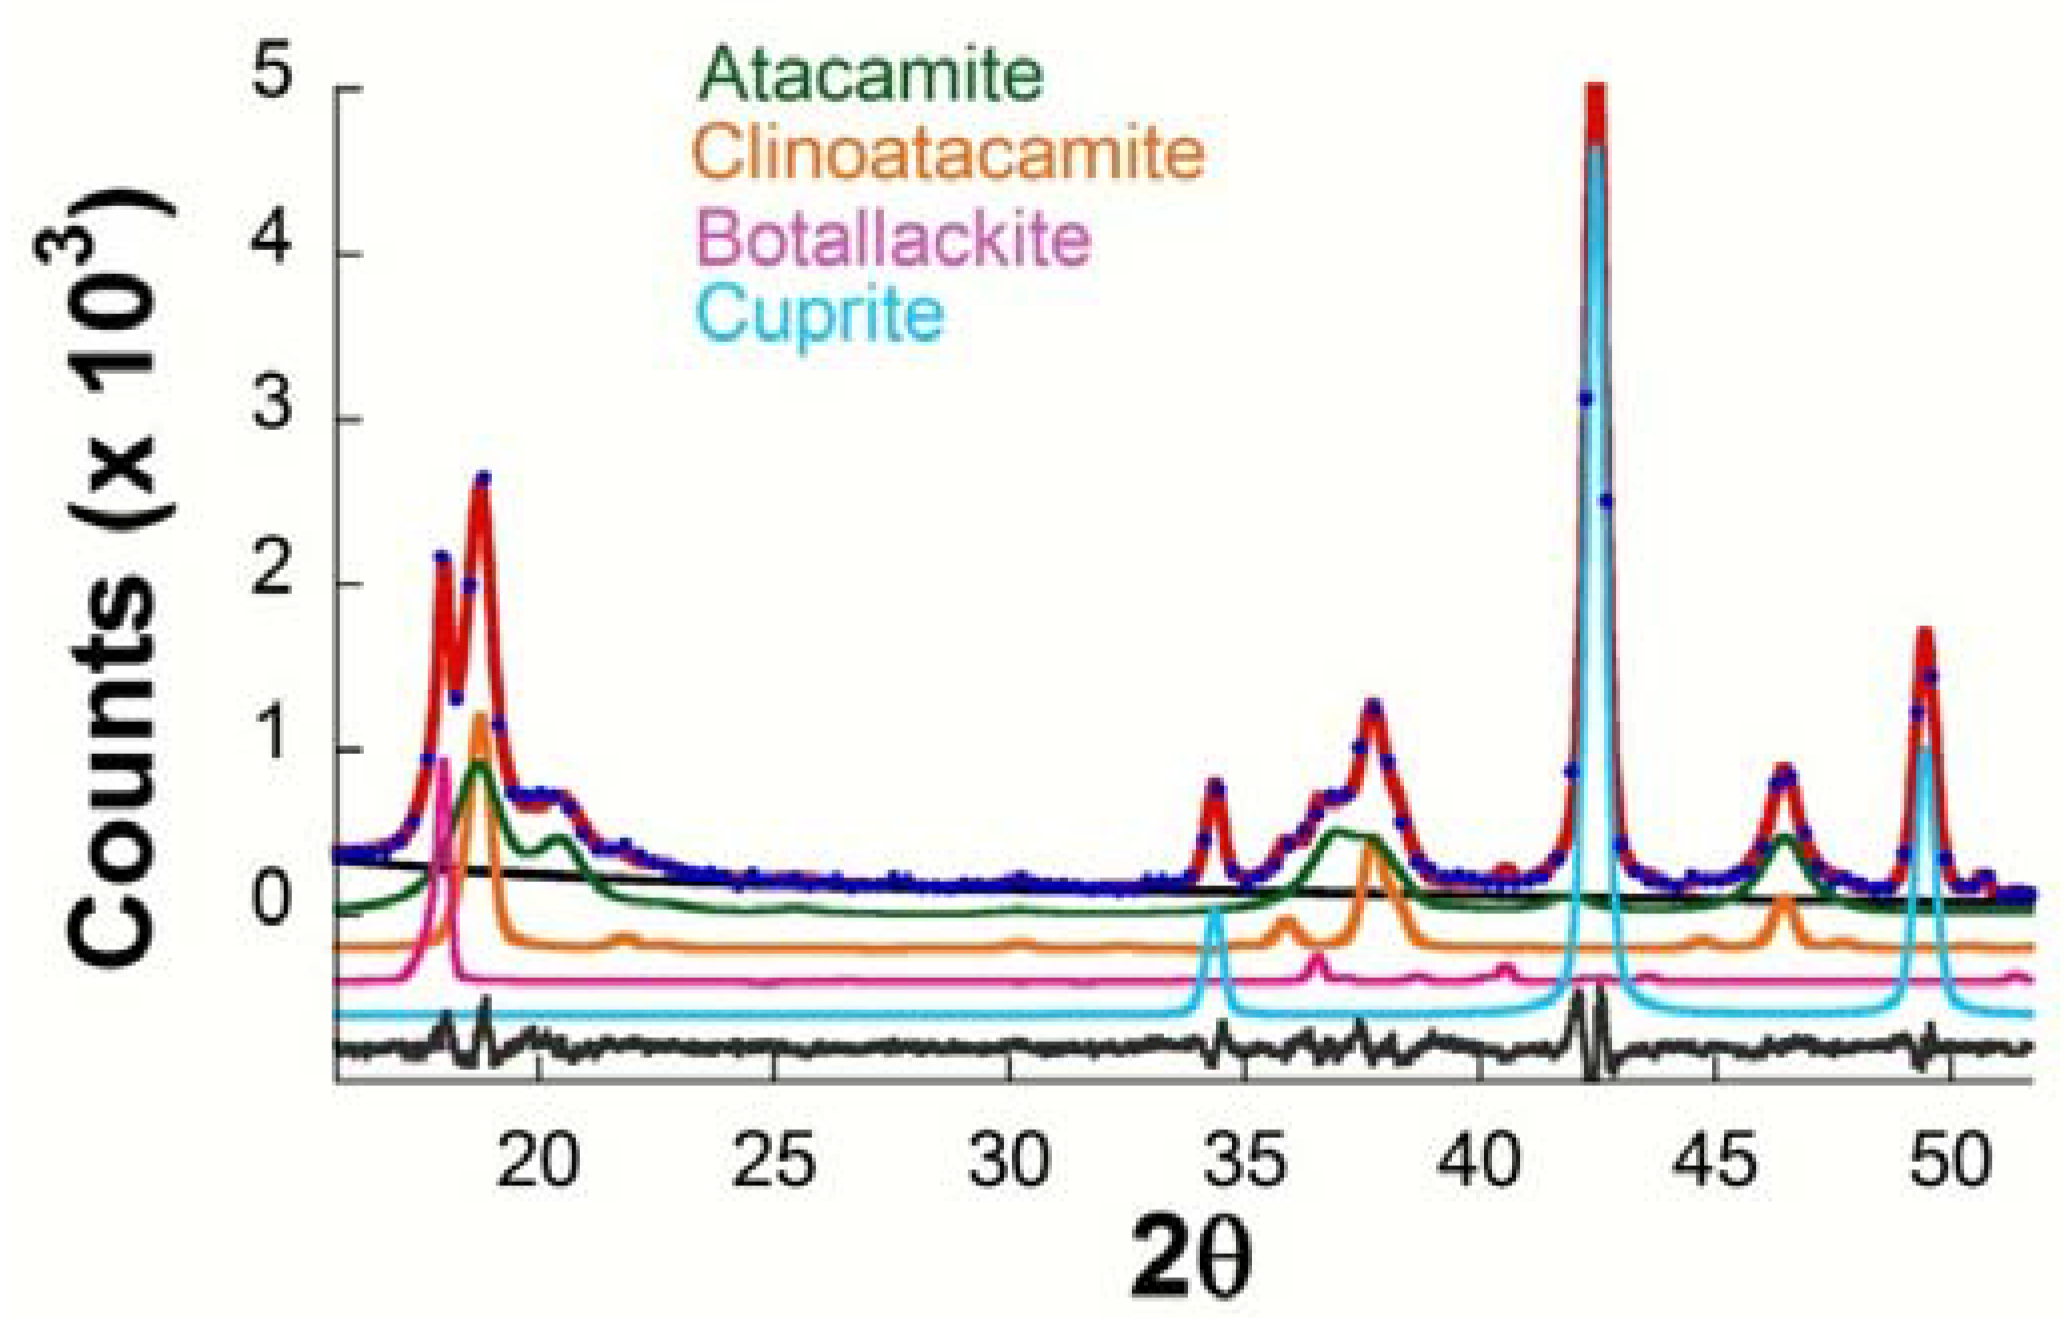
Table 4 presents a summary of the results obtained by XRD (Rietveld) concerning the phases present in the corrosion products formed on copper in different exposure conditions. The following phases are always seen to form on all the test specimens: cuprous oxide or cuprite (Cu2O) and the polymorphs of basic copper chloride (Cu2(OH)3Cl) botallackite (minor) and atacamite and clinoatacamite (major). Figure 4 presents the typical diffractogram obtained with fitting by the Rietveld method, showing the peaks corresponding to these four phases. The presence of nantokite (CuCl) was never observed.
But first of all it is important to clarify two matters related with copper chlorides that are the cause of some confusion in the scientific literature: “polymorphism” and “clinoatacamite”. With regard to the first of these matters, “polymorphism”, it is noted that some papers, including recent publications, make reference to isomorphous compounds instead of polymorphous compounds [3,6,16]. It should be recalled that polymorphism refers to different crystalline forms of the same compound, in this case Cu2(OH)3Cl, and that the crystalline structure of the different polymorphous compounds is different: botallackite is monoclinic, prismatic; atacamite is orthorhombic; and clinoatacamite is pseudo-rhombohedral [39,40]. Isomorphism, on the other hand, refers to similarity in the crystal structure of different compounds.
With regard to the second of these matters, “clinoatacamite”, another error that is very commonly seen in the literature on atmospheric corrosion products of copper, even nowadays, concerns the identification of paratacamite [3,6,18,20,24,28,29,41], which crystallizes in the trigonal–rhombohedral system [39,40], as a polymorph of atacamite, when really it is clinoatacamite. These then are two different compounds that present slightly different Raman spectra and XRD patterns [39]. Clinoatacamite, whose chemical formula is Cu2(OH)3Cl, is different to paratacamite, ((CuM)2(OH)3Cl) where M may be Zn, Ni, Co, which forms when any of these elements replaces some of the Cu [40]. According to Jambor et al. [42] and Malchevek and Schlüter [43], paratacamite may not exist as a pure copper mineral and its published JCPDS Power Diffraction File (PDF 25-1427) is only slightly different to the diffraction pattern for clinoatacamite. Thus, previous reports of paratacamite should probably be attributed to clinoatacamite instead. In the present work, it has not been possible to determine from XRD measurements exactly which of these phases is present, since the diffraction pattern fitting quality by the Rietveld method is basically the same for paratacamite or clinoatacamite crystallographic data.
In heavy marine environments, it has been reported that the cuprite patina reacts with chloride ions from the atmosphere primarily to form nantokite [6], which may rapidly change into the basic copper chlorides botallackite, atacamite, and clinoatacamite. Thus it is not unreasonable to expect the presence of a minor amount of this phase in the patinas, which may be missed in a phase identification procedure involving the comparison of experimental XRD patterns with patterns from the JCPDS database. This problem could be overcome by fitting the whole observed diffraction pattern by the Rietveld method to a structural model including nantokite along with cuprite, botallackite, atacamite, and clinoatacamite. As the quality of the simulated patterns did not improve compared to fitting using a crystal structure model without nantokite, it was concluded that this phase was not significantly present in the patinas.
3.3. Coverage of the Cuprite Surface by Basic Copper Chlorides (Cu2(OH)3Cl)
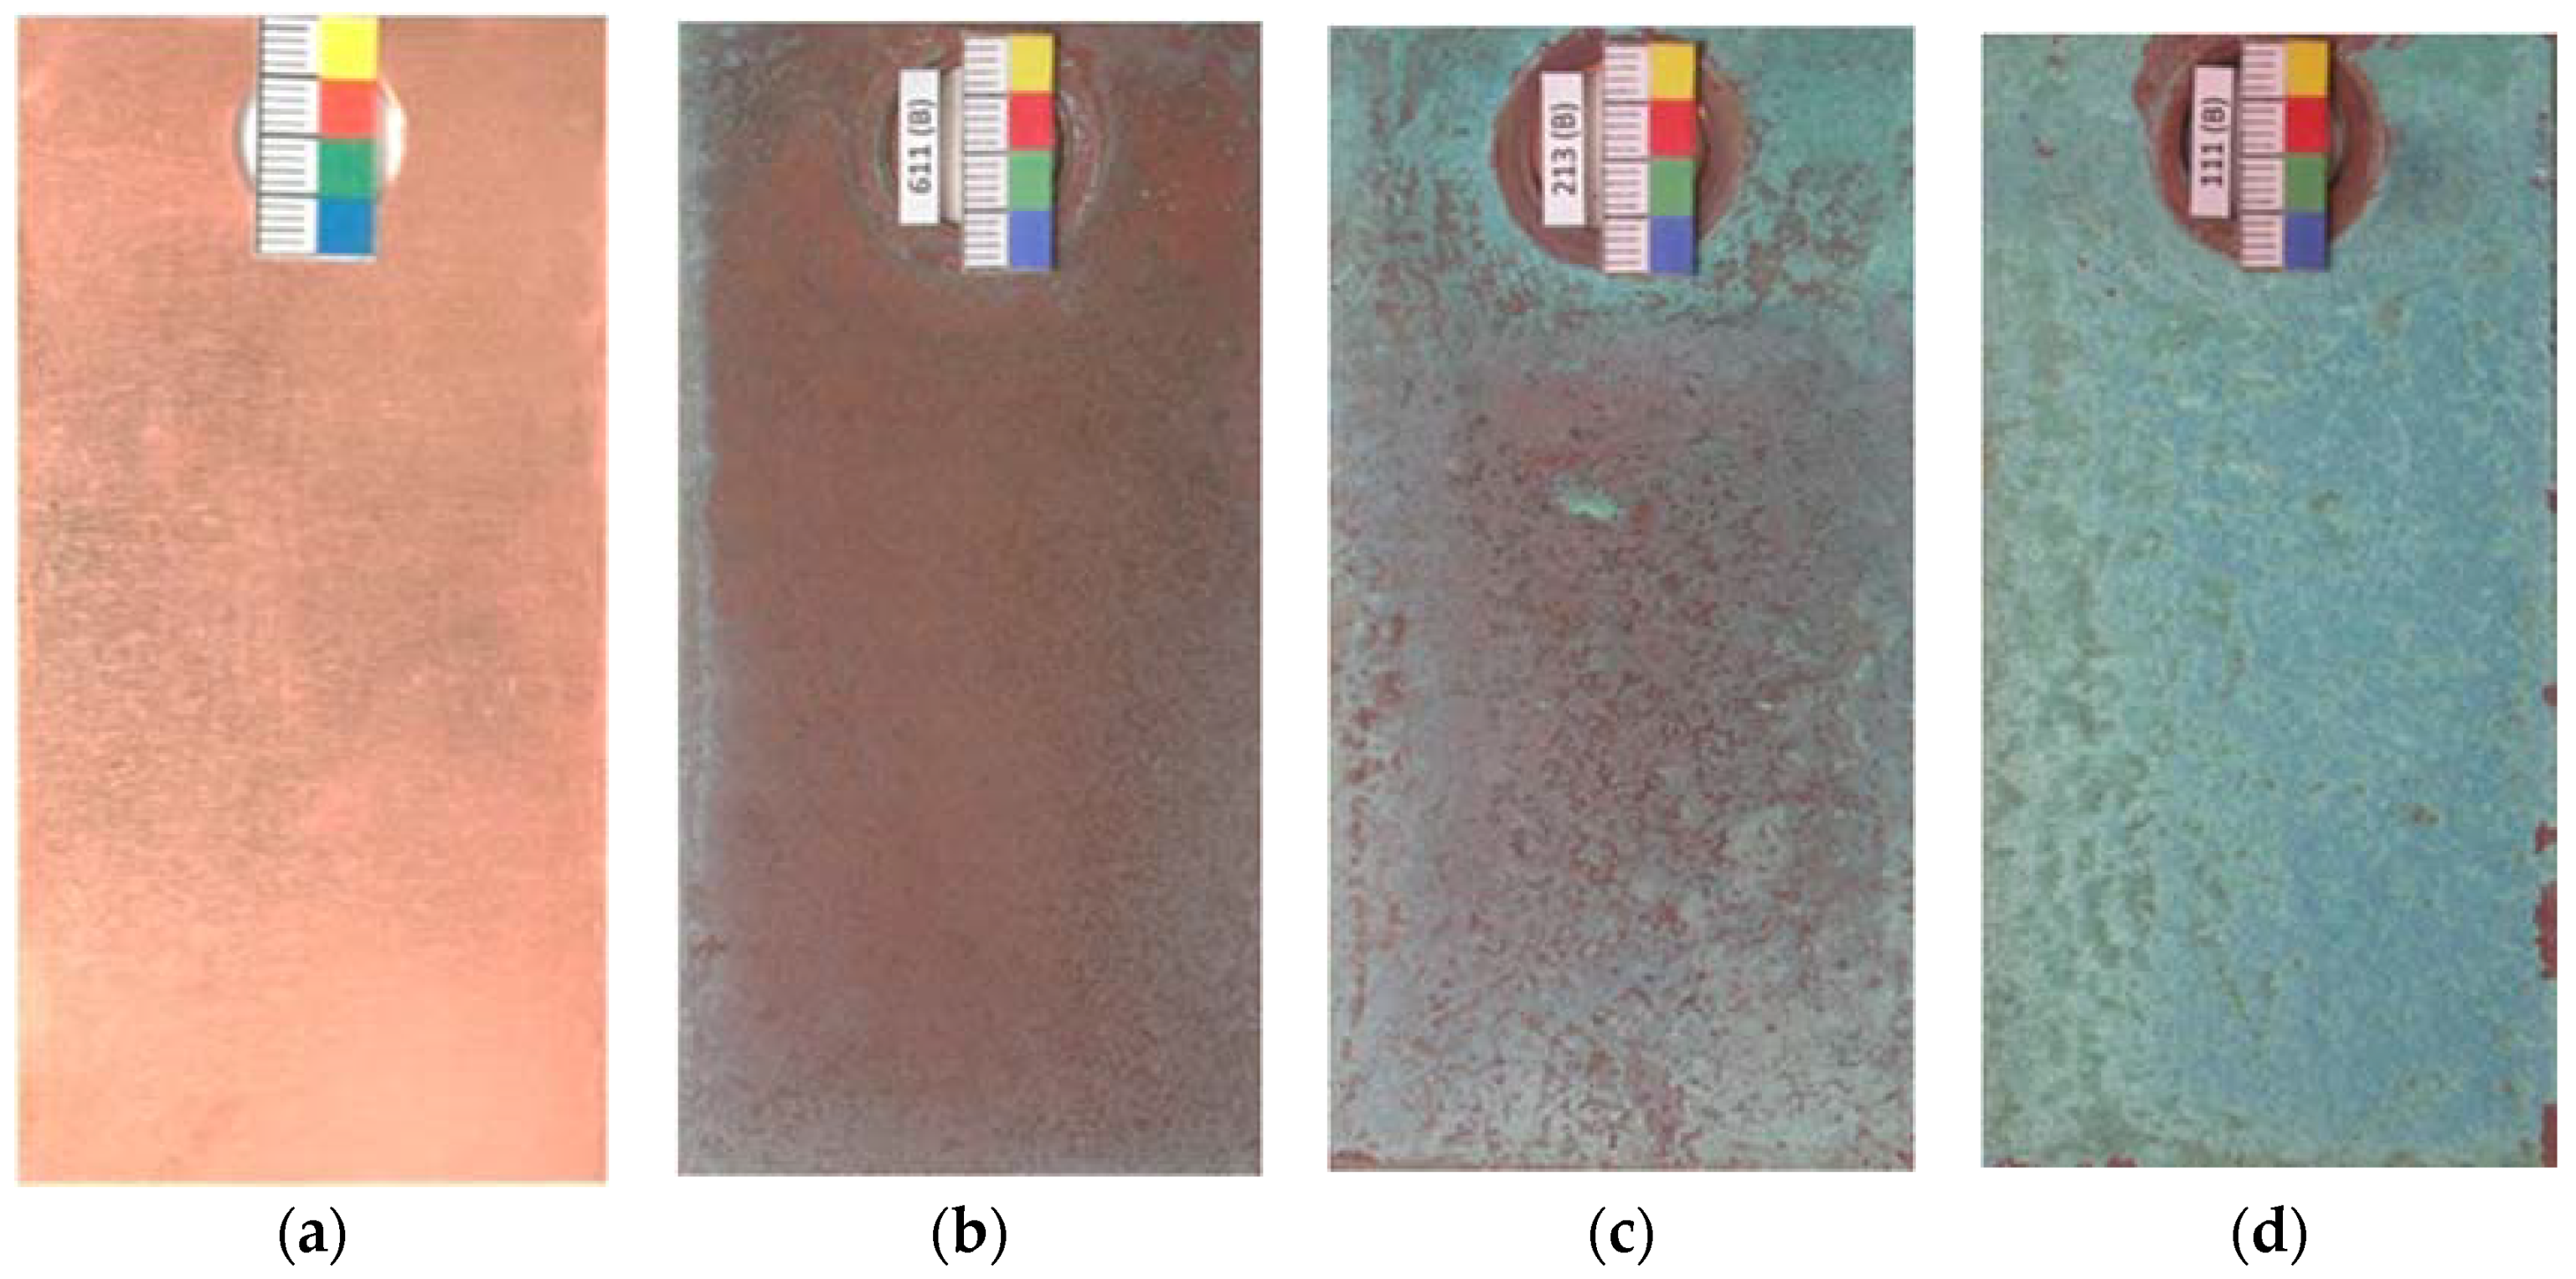
When copper is exposed to the marine atmosphere it immediately becomes coated with a copper oxide patina and its color goes from the initial salmon pink (Figure 5a) to more reddish tones (Figure 5b) corresponding to cuprous oxide (cuprite). Subsequently, corrosion products of a turquoise blue coloring corresponding to basic copper chlorides form on the cuprite surface. This new corrosion layer is heterogeneous and does not initially cover the entire cuprite surface (Figure 5c), and may in fact not achieve complete coverage even after a long exposure time, depending on the atmospheric salinity. In this respect, Cathcart [44] ironically noted that “when a young architect covers a roof with copper it will turn green when his hair turns grey”. Thus, in marine atmospheres the complete coverage of the cuprite surface as exposure time advances is dependent on the chloride deposition rate and the exposure conditions, and only happened in our testing station closest to the sea (Figure 5d).
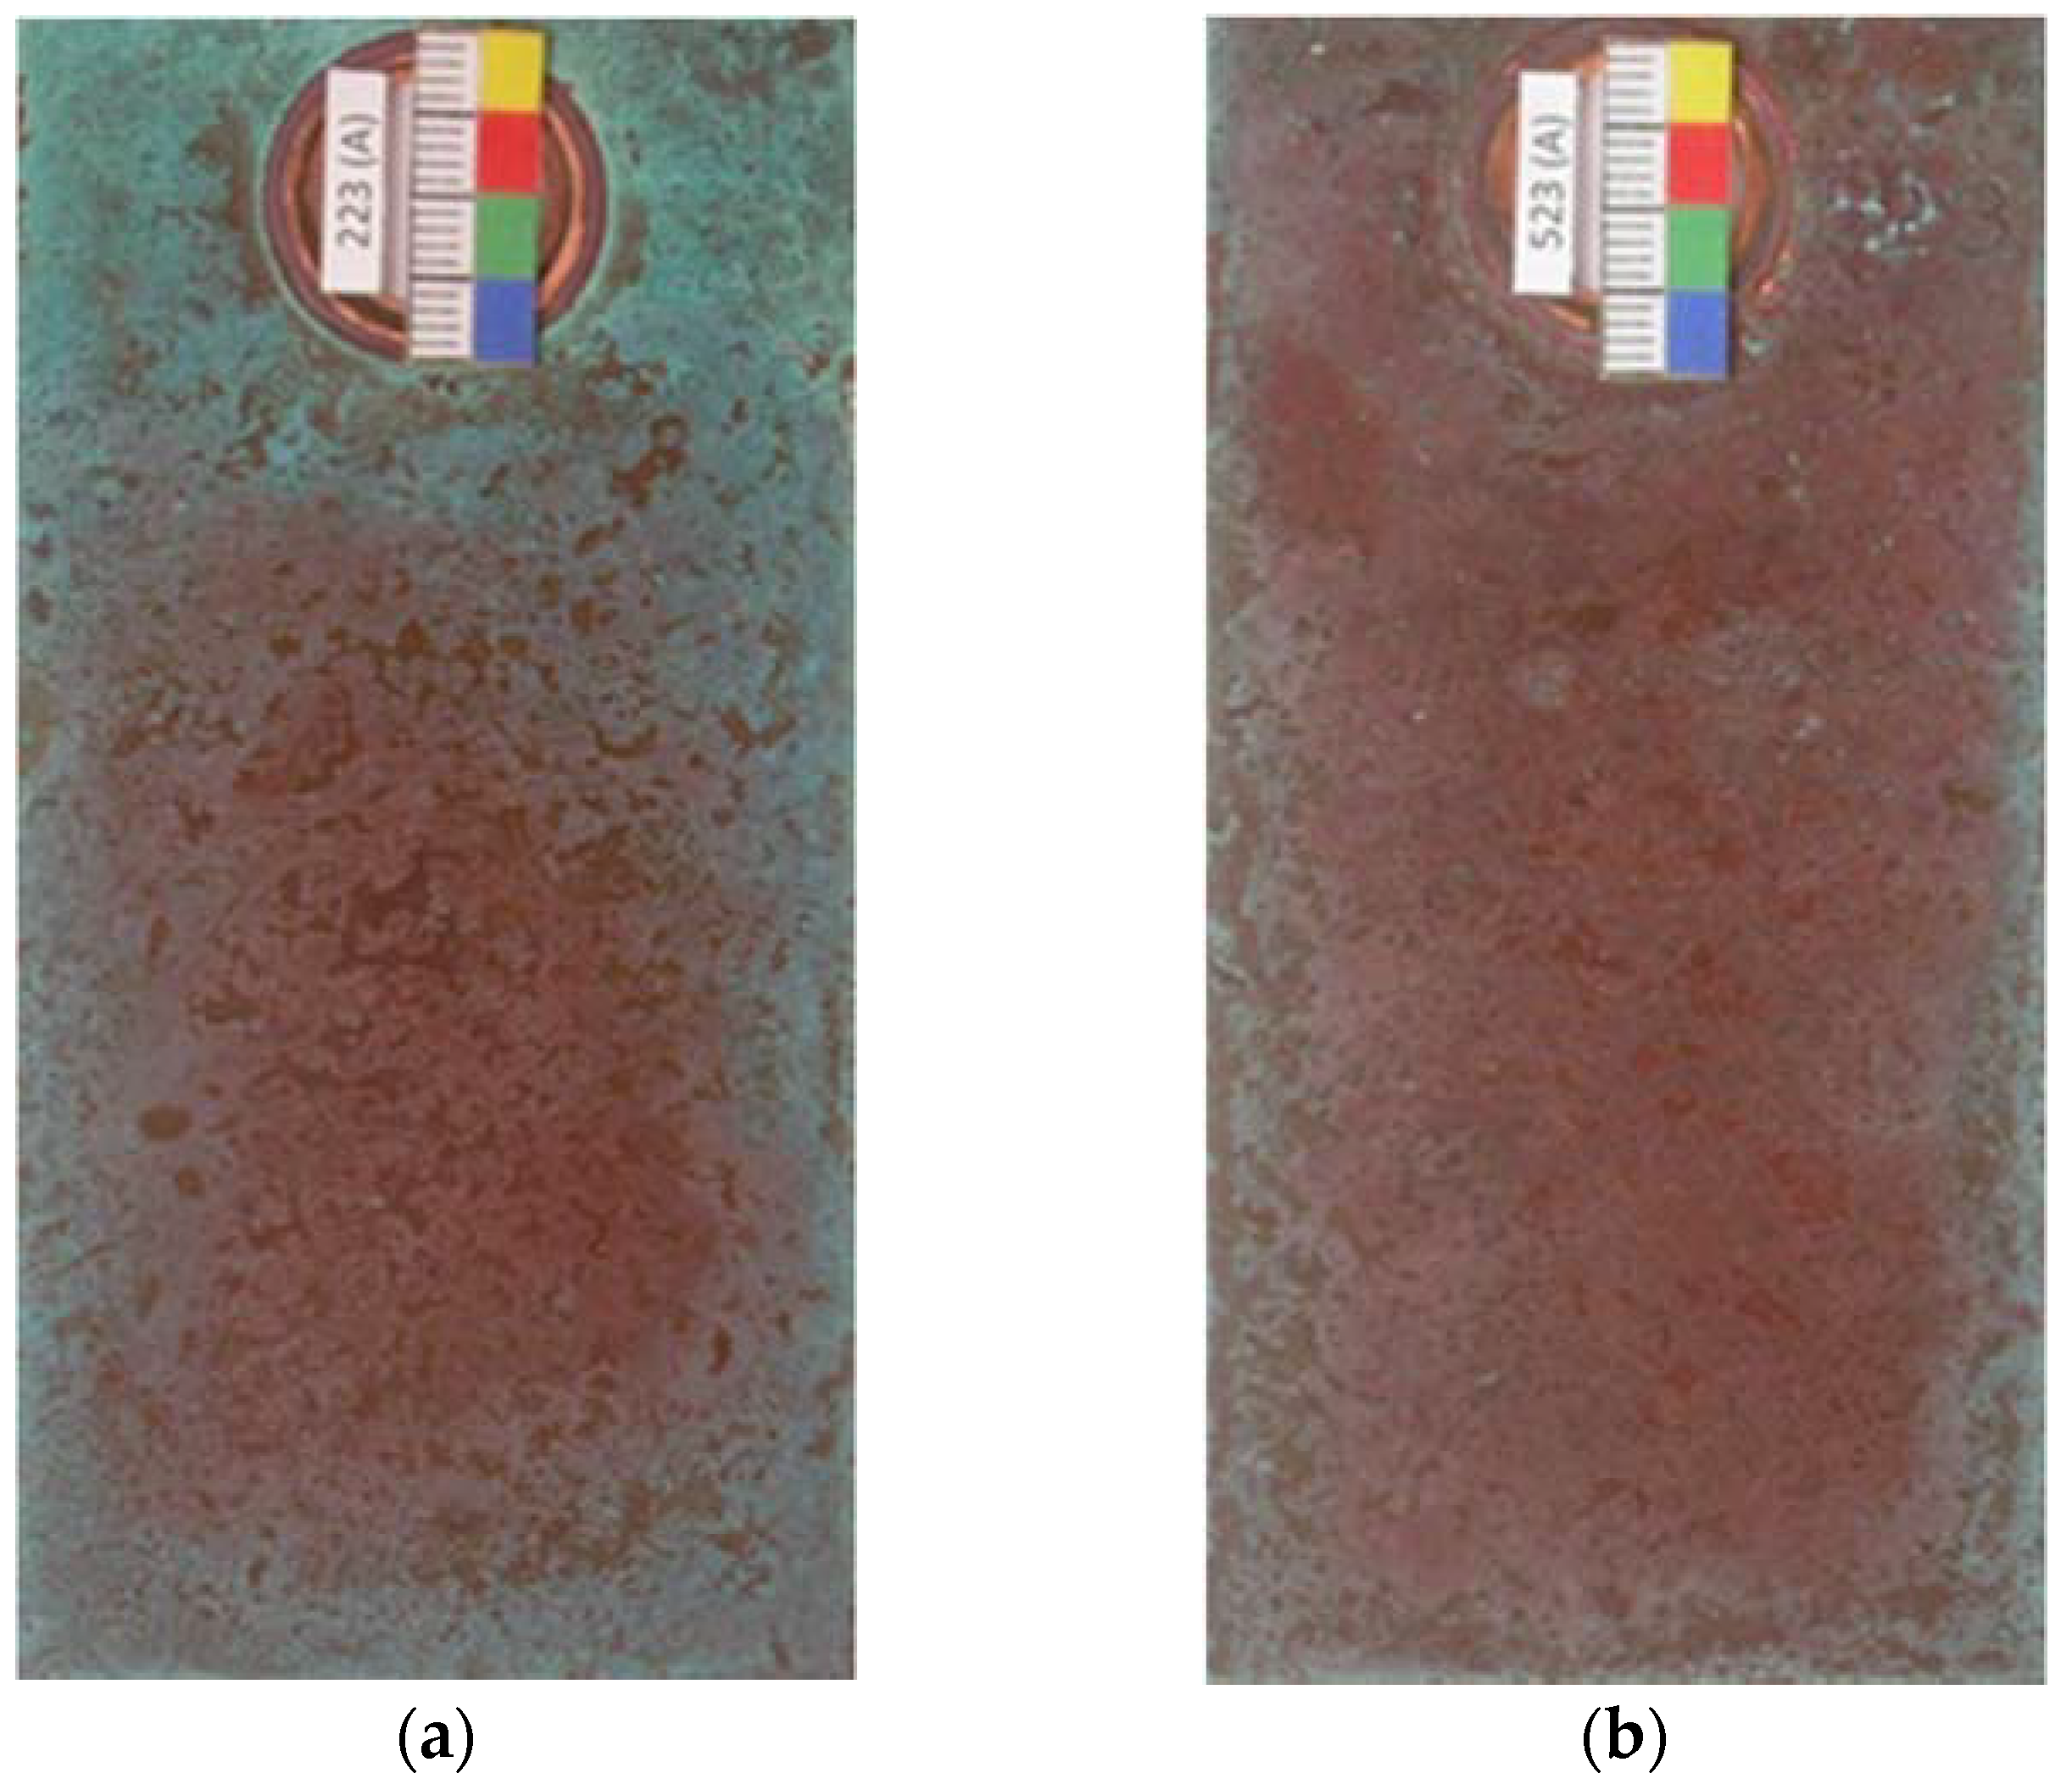
The present study considered the two sides of the test specimens; side A, which was facing the sea and the reverse side B. Coverage with basic chlorides starts at the edges of the test specimens and in areas around the fastening clips, where the time of moisture retention is longer and the saline concentration in the precipitated aqueous layer is higher as a result of evaporation during the drying period. This has also been referred to in a recent study [25] and can clearly be observed in the photographs in Figure 6. It should also be noted that side B becomes coated with turquoise blue corrosion products faster as it also receives the marine aerosol but is more protected from the rain, and so the deposited pollutant is less likely to be washed off.
It is of interest to quantify the percentage of the cuprite surface that is covered by basic copper chlorides, and Table 5 has been prepared for this purpose with the assistance of image treatment [38]. As exposure time advances and the atmospheric chloride deposition rate increases, the coverage percentage increases. The great importance of atmospheric salinity in relation with this effect is clearly shown. At station 1, with the highest chloride deposition rate, the coverage percentage after three months was already 80%, reaching approximately 100% after one year of exposure. Contrarily, at stations 5 and 6, with much lower chloride deposition rates, the coverage percentage was very small (1–4%) and the patina formed retained the characteristic reddish color of cuprite.
4. Discussion
Taking into account the results obtained in this research and existing literature on the subject of copper corrosion in pure marine atmospheres, there follows an overview of the atmospheric corrosion process of copper in this type of atmosphere.
There is unanimous agreement among researchers who have studied this subject that the copper corrosion process in marine atmospheres is of an electrochemical nature and develops in a series of stages, as described below.
4.1. Formation of a Cuprite Film
It is well established that the first stage is the formation of a cuprite (Cu2O) film on the copper surface. From the very first moments of exposure to clean air, copper becomes instantaneously coated with a nanometric thin film of Cu2O by means of a direct oxidation mechanism [45]; the oxidation rate decreases with time and practically comes to a halt when the cuprite film thickness reaches 5 nm [46,47].
The electrochemical corrosion of copper in the atmosphere takes place once an aqueous layer has formed on the surface as a result of rainfall, condensed humidity, etc. The possible anodic reactions in principle would be:
and the predominant cathodic reaction in neutral aerated solutions is the following:
Cu → Cu+ + e−
Cu → Cu2+ + 2e−
O2 + 2H2O + 4e− → 4OH
The formation of cuprite will take place according to the overall reaction:
2Cu+ + 2OH− → Cu2O + H2O
According to Graedel [30] this passive cuprite layer may have a sequential structure of Cu2O, CuO and Cu(OH)2 or CuO·xH2O, depending on its depth. Cu+ and Cu2+ ions can form stable complexes in the presence of Cl− ions, and for this reason the concentration of copper ions decreases notably. According to Veleva et al. [18] this means that the oxidation of Cu to Cu+ (Equation (1)) in marine atmospheres is the only possible reaction.
There is unanimous agreement that cuprite (Cu2O) is the initial corrosion product to form on copper in atmospheric conditions. The growth of the cuprite film goes from an initial nanometric thickness to heterogeneous layers of the order of several tens of microns in thickness after years or decades of atmospheric exposure, giving rise to more compact and protective layers. The color of the cuprite patina changes from an initial appearance of metallic luster into a dull brown, depending on the exposure conditions [6].
The aqueous deposit on the cuprite surface may give rise to an oxidation process according to the reaction:
Cu2O + 2H+ → 2Cu2+ + H2O + 2e−
According to Fitzgerald et al. [4] this cuprite oxidation process must be slower than copper oxidation, otherwise the cuprite layer would disappear.
Some studies report the rapid initial formation of tenorite (CuO) [19], but this is an unstable compound and would quickly be transformed into other more stable compounds [6]. In fact, tenorite does not usually appear among the corrosion products of copper exposed to the atmosphere, whereas cuprite always does [24].
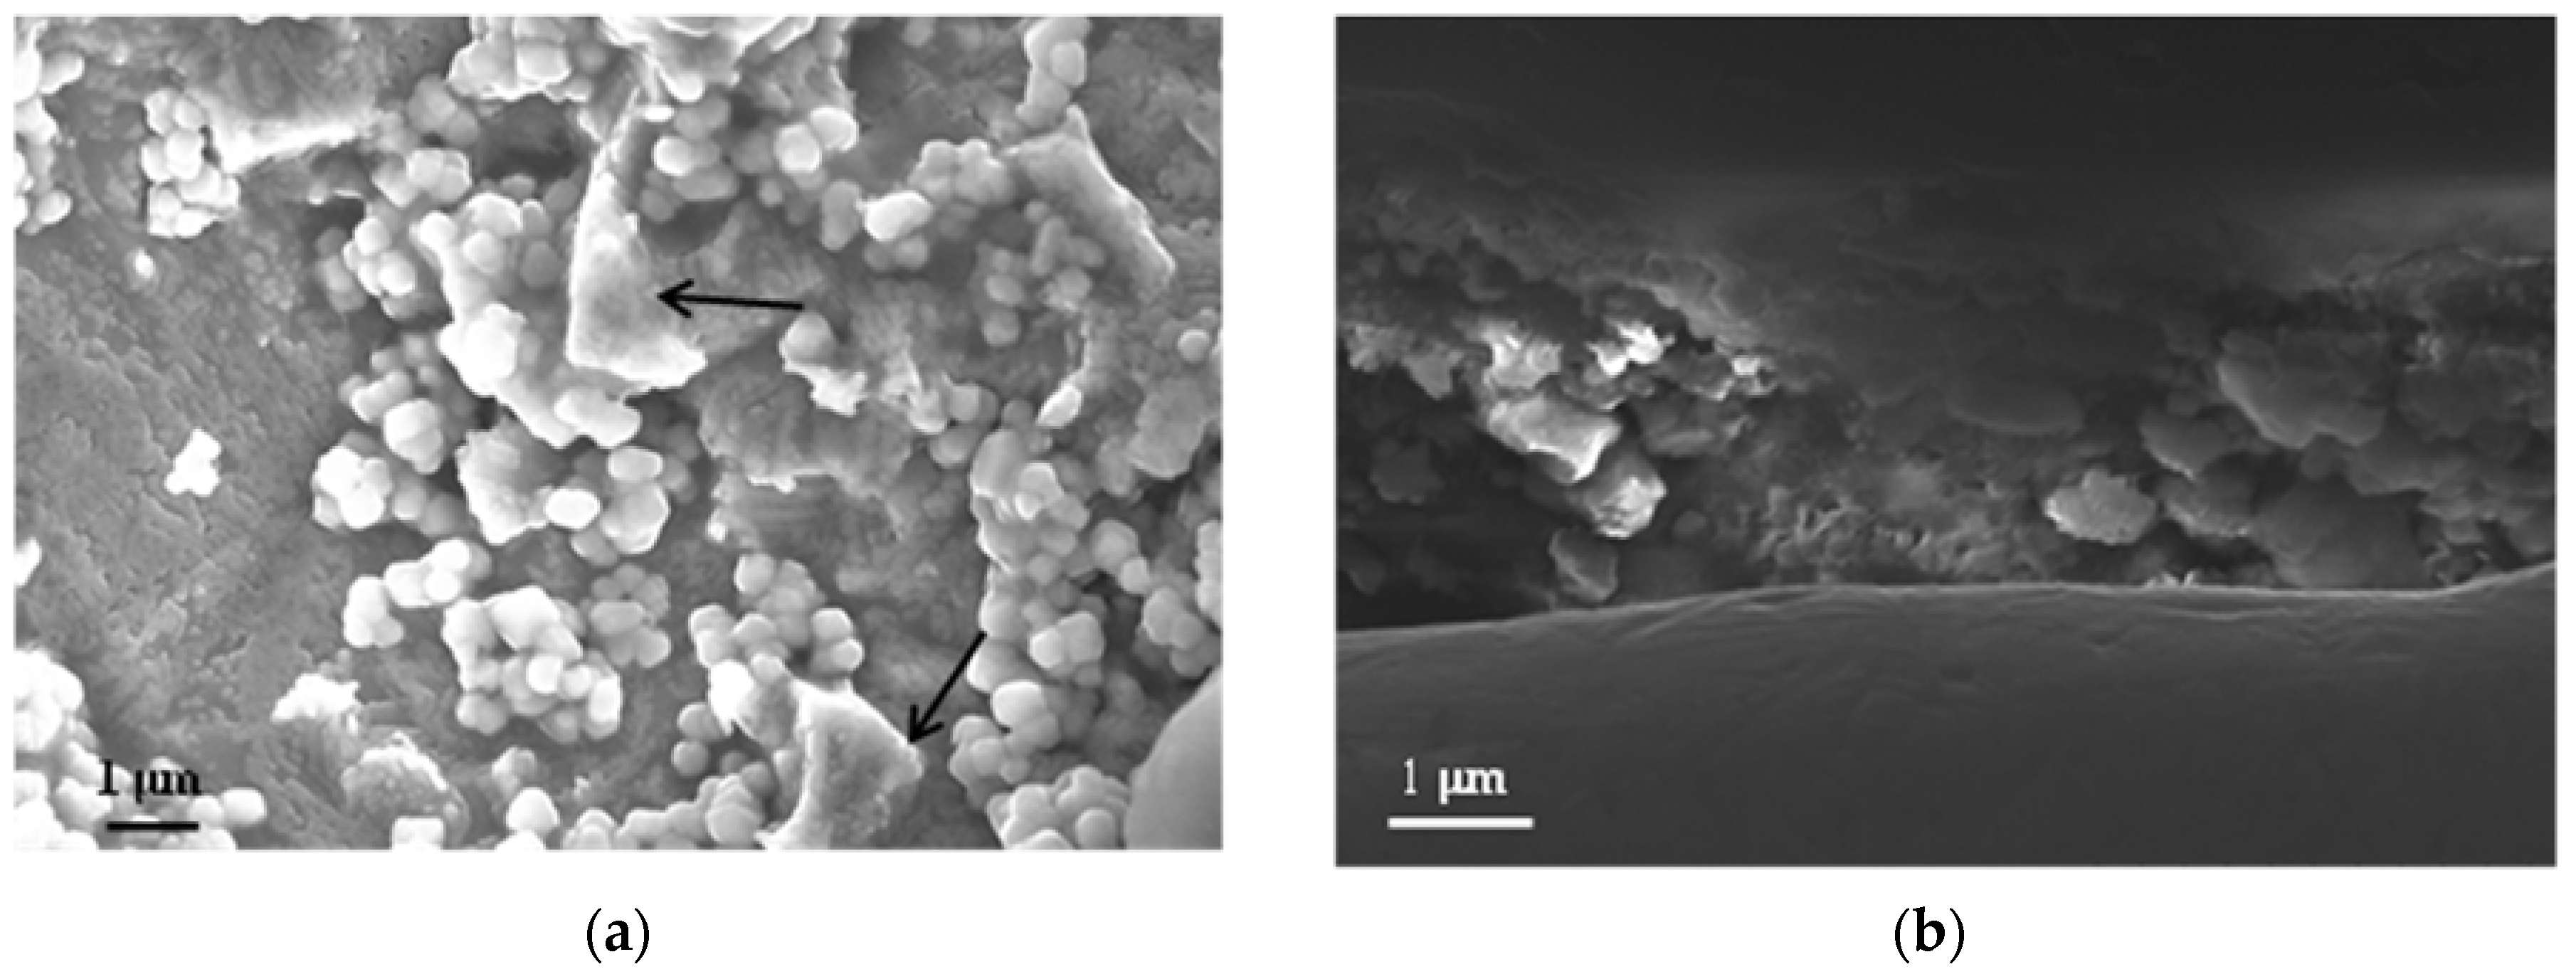
Cuprite crystals of a submicrometric size are initially formed and over time grow and acquire a characteristic cubic–octohedral appearance with highly symmetrical cubic crystals [48]. Figure 7 shows the formation of cuprite crystals on the copper surface when the metal is exposed for 3 months in the marine atmosphere with the lowest chloride deposition. In the right-hand area of Figure 7a it is possible to see among the cuprite crystals the initial formation of basic copper chlorides (according to the presence of chlorine in the energy dispersive X-ray spectrometry analysis), which will be analyzed in greater detail below.
The relatively low chloride concentration in this atmosphere and the short length of time that has passed means that the formation of basic chlorides is still very incipient. In fact, in the corresponding photograph of the specimen (Figure 5b) the characteristic turquoise blue coloring of the basic chlorides is barely perceptible and the color is predominantly of a reddish tone corresponding to the cuprite crystals.
4.2. Interaction of the Cuprite Layer with Marine Aerosol
In marine atmospheres the formation of chlorinated corrosion products takes place, depending on the concentration of chloride ions from the marine aerosol. These corrosion products form locally and grow on the surface of the cuprite film. They are relatively stable and have little solubility, ultimately giving rise to a patina of a turquoise blue color with protective characteristics.
In laboratory studies involving the interaction of copper with airborne chloride ions at different RH levels, Strandberg and Johansson [19] find that depending on the pH and the chloride concentration in the aqueous layer, Cu+ ions can precipitate:
- (a)
- as nantokite (CuCl):Cu+ + Cl− → CuCl
- (b)
- as cuprite (Cu2O), by the reaction of the cuprous ions with the hydroxyl ions from the cathodic reaction, as indicated in reaction (4) or
- (c)
- form chlorinated complexes of Cu+:CuCl + Cl− → CuCl2−
Both nantokite and the chlorinated complexes of Cu(I) oxidise in the presence of moisture with dissolved oxygen, giving rise to the formation of basic copper chlorides (Cu2(OH)3Cl) of a turquoise blue coloring.
3CuCl + 3/4O2 + 3/2H2O → Cu2(OH)3Cl + Cu2+ + 2Cl−
3CuCl2− + 3/4O2 + 3/2H2O → Cu2(OH)3Cl + Cu2+ + 5Cl−
If a cuprite patina previously exists, its interaction with the marine aerosol is also an electrochemical corrosion process, which is initiated by the breakdown of the passive cuprous oxide film, giving rise to the formation of soluble chlorinated complexes of Cu+ [19,49].
1/2Cu2O + 2Cl− + H+→ CuCl2−+ 1/2H2O
The oxidation of Cu+ (reactions (4) and (6)) close to the anodic areas implies a drop in pH due to the acidity of the Cu(H2O)42+ ion and the high activity of the Cl− ion. This contributes to the breakdown of the passive oxide film and accelerates anodic dissolution [49].
The nantokite initially formed (reaction (6)) is only stable in acid conditions and in the absence of oxygen and moisture (dry conditions). This explains its rapid transformation into other chlorinated products and that when present in the corrosion product layer formed on copper exposed to the marine atmosphere it is usually found in local areas (pockets) below the cuprite film [11,19], often making it difficult to detect. According to Leygraf et al. the relatively unstable nantokite crystals act as seed crystals for the formation of Cu2(OH)3Cl polymorphs through many subsequent dissolution‒ion-pairing‒precipitation steps [6]. These polymorphous compounds present a significantly larger molar mass and hence volume than the nantokite crystals from which they originate. The formation of these compounds, with a certain protective effect, means that the base copper corrosion rate decreases as exposure time advances (see Table 3).
With regard to the presence of nantokite in the patinas formed on copper exposed to marine atmospheres, this compound has been detected in a number of studies [6,11,14,15,19,28,29]. One of these refers to work carried out in the International Cooperative Programme (ICP) Materials/UNECE (United Nations Economic Commission for Europe) framework [14,15]. Although this study was not addressing the behavior of copper in marine atmospheres, some of the 39 testing stations considered presented a certain chloride content in the rainwater. XRD analysis of the corrosion products formed in up to eight years of exposure never indicated the presence of tenorite (CuO) on specimens exposed in sheltered or unsheltered conditions, but always detected the presence of cuprite. With regard to the presence of nantokite, this was never found on unsheltered specimens, as in our study, but was encountered on sheltered specimens (less exposed to marine aerosol), though in a very low proportion. The rapid transformation of unstable nantokite into basic copper chlorides (Cu2(OH)3Cl) (reaction [9]) was the reason why it was not found on unsheltered specimens. The proportion of basic copper chlorides in the patinas formed was a function of the chloride concentration in the rainwater.
4.3. Formation of Basic Copper Chlorides
The copper corrosion rate in this type of atmospheres is a function of chloride deposition and exposure time (Table 3). The corrosion rate may be very high at sites close to the seashore, but as exposure time advances it drops considerably due to the protective effect of the basic chloride patinas that form on the cuprite film, sealing its inherent porosity (see Figure 7b). These turquoise blue films formed on top of the cuprite may come to completely cover it (Figure 5d and Table 5) [28].
At sites further away from the seashore, where the chloride deposition rate is much lower, the copper corrosion rate is also reduced, and similarly decreases with exposure time (Table 3). The patinas formed show a lower presence of basic chlorides, with fairly small coverage percentages (Figure 5c and Table 5).
As in other studies carried out in pure marine atmospheres [18], the proportion of cuprite decreases as exposure time advances and the basic chloride content in the patinas formed increases (see Table 5). The basic chlorides formed: botallackite, atacamite and clinoatacamite, polymorphs with the formula Cu2(OH)3Cl, present fairly similar formation energies of −1322.6, −1339.2 and −1342.8 kJ/mol, respectively. The first phase to crystallize is botallackite, which is the least stable. It then rapidly recrystallizes to the other two polymorphs, atacamite and clinoatacamite, whose formation energies are fairly similar. In laboratory research carried out by Pollard et al. [39] it was seen when varying the chloride concentration in the solution that botallackite was the phase which formed at low chloride concentrations. When the chloride concentration was raised, botallackite recrystallized to atacamite. At high chloride concentrations atacamite formed and in turn recrystallized to clinoatacamite, and the transformation rate increased with the chloride concentration, in such a way that at very high chloride concentrations clinoatacamite was the only phase observed. Strandberg and Johansson [19], also in laboratory research, did not always detect the presence of atacamite but always found clinoatacamite. At intermediate chloride concentrations Pollard et al. [39] observed that the phases found depended on the specific nature of the medium and on the reaction kinetics (temperature, chloride concentration, etc.). According to Frost [40] the thermodynamic data shows that the more stable phase is clinoatacamite and the other phases are intermediates in the series of reactions with the end product being clinoatacamite.
An analysis of the XRD results obtained in our study allows us to know the nature of the phases in the patinas formed as a function of the atmospheric chloride deposition rate and the exposure time. Table 6 summarizes the results obtained in the testing stations with highly different salinity levels. Analysis of this table clearly shows how the cuprite content decreases (and in parallel the proportion of basic chlorides increases) as exposure time advances. With regard to basic chlorides, those corresponding to botallackite are much lower than the other two polymorphs due to their poorer stability, and lower contents are also seen after longer exposure times in the marine atmospheres with the highest salinity levels, perhaps due to the increase in their transformation rate to Cu2(OH)3Cl with the chloride concentration in the aqueous layer. The clinoatacamite contents in the patinas are lower than the atacamite contents which suggests an incomplete transformation of atacamite into clinoatacamite. As the chloride deposition rate rises and the exposure time advances, the clinoatacamite contents in the patinas formed tend to increase.
With regard to the location of the different phases in the patinas formed, it may be interesting to analyze the XRD data presented in Table 7, obtained on the same specimens with two techniques at different analysis depths: conventional XRD and grazing angle XRD (GIXRD).
It can clearly be seen how the cuprite signal decreases considerably when GIXRD is used, which is obvious as this phase is the innermost in the patina formed on copper. Similarly, the copper signal is not detected in the diffractogram, which indicates that the X-ray penetration has not generally reached the copper substrate. A weak signal of the base copper is only detected with the thinnest patina formed in the atmosphere with the lowest chloride deposition rate (station 6). With regard to the other three phases, botallackite, atacamite and clinoatacamite, these are located in the upper strata of the patina, and it may be suggested that the clinoatacamite phase is the outermost due to the greater increase in its proportion found when using the grazing angle technique. It may be speculated that the other two phases, botallackite and atacamite, are located at intermediate depths, as their contents in the patina obtained by the two XRD analysis techniques are not so different as in the case of the clinoatacamite phase. The smaller size of the atacamite phase crystallites in comparison with the clinoatacamite phase, as deduced from the XRD peak profile analysis, reinforces this hypothesis.
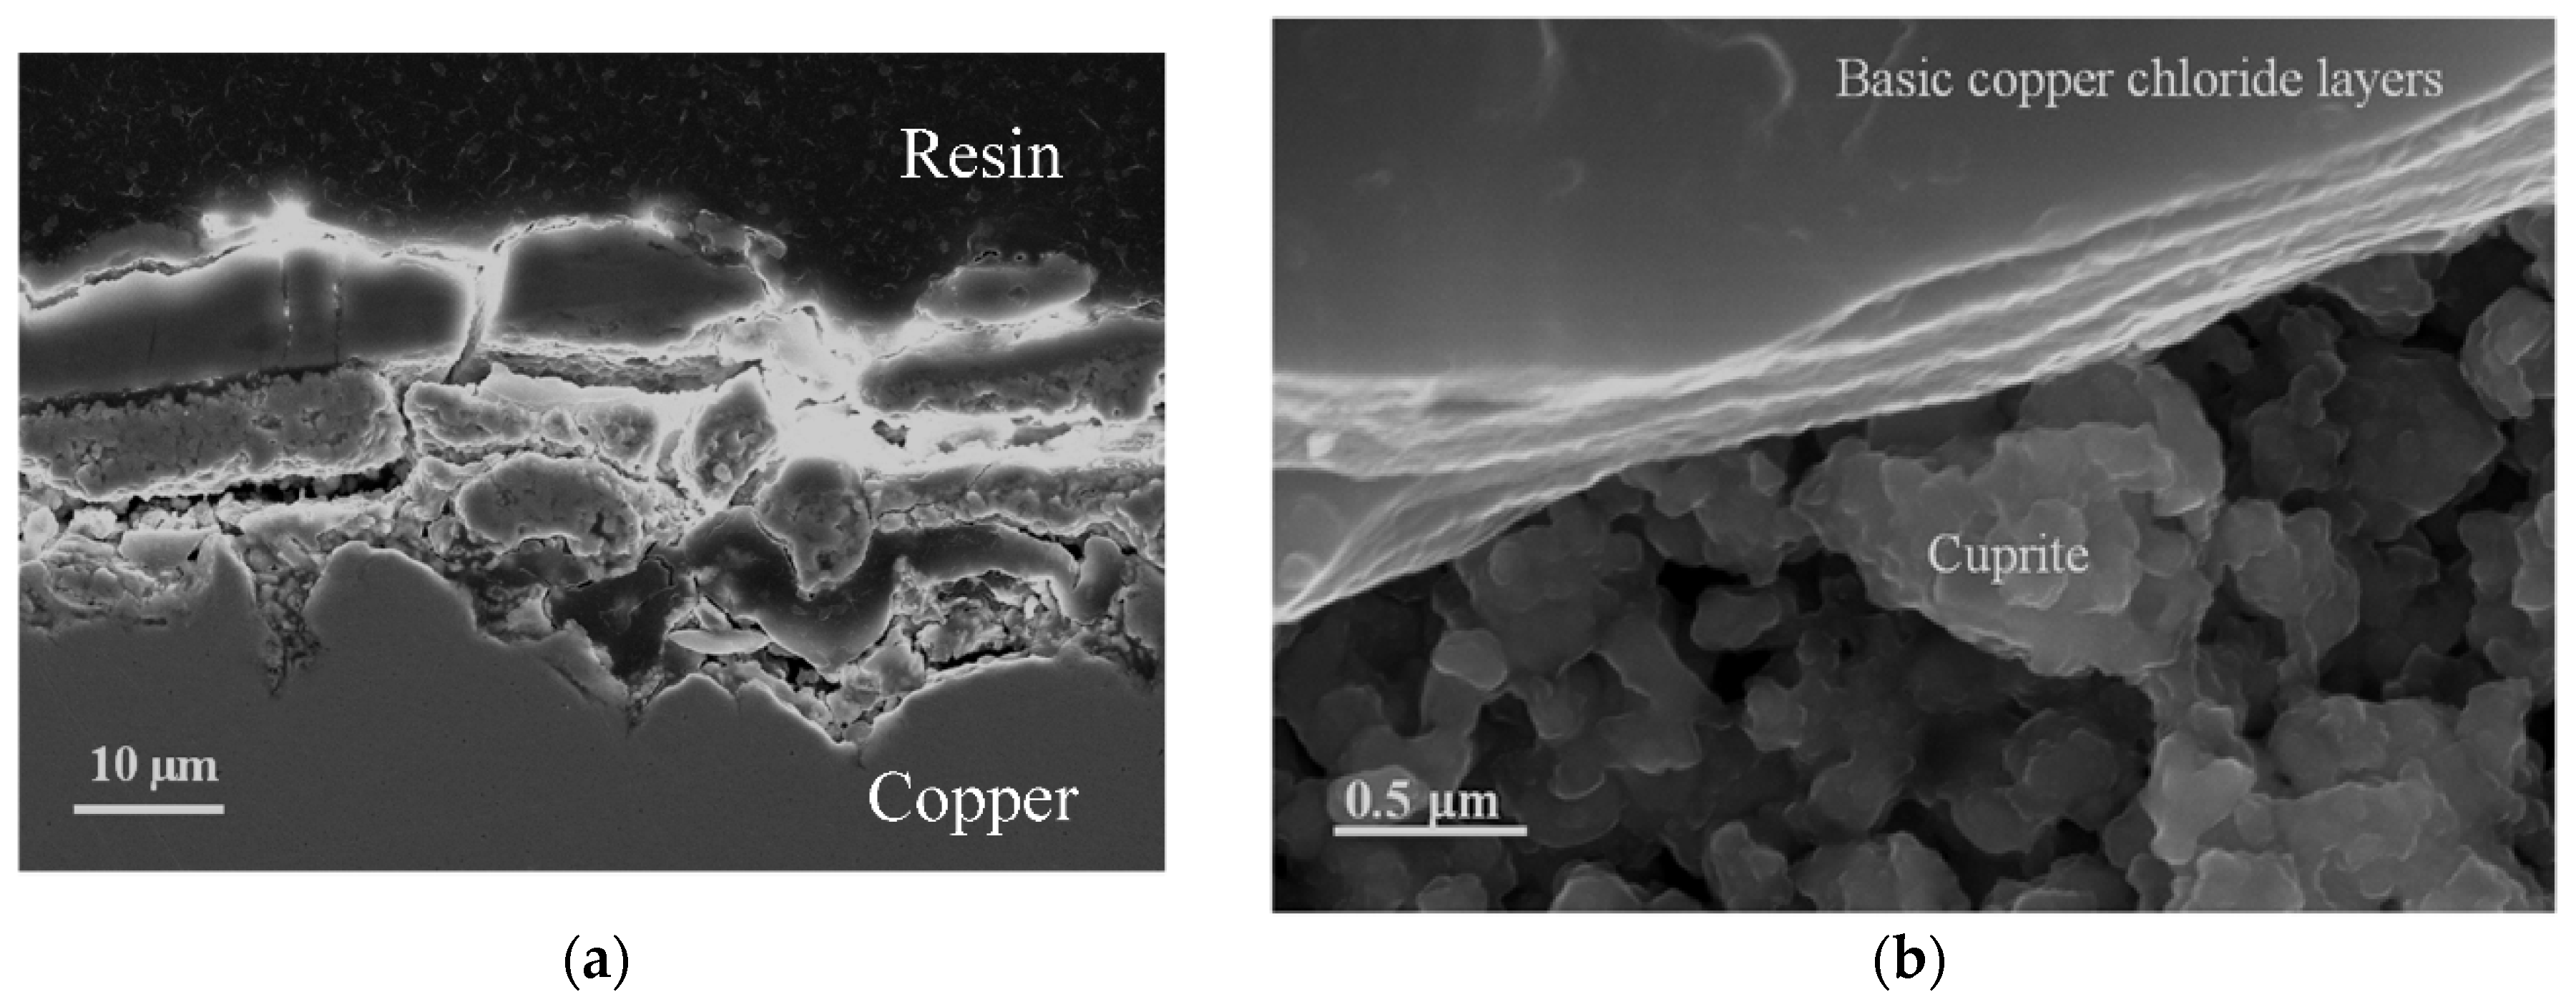
The formation of basic chlorides gives rise to superposed layers over the innermost cuprite layer. The superposed lamina structure is easily observable in the cross section in Figure 8a, and in the surface observation of the patina in an area close to the detachment of the basic chloride layer (Figure 8b), which allows the cuprite crystals in the innermost region to be seen.
4.4. Flaking of Basic Chloride Layers Present on the Cuprite Film
As noted by Graedel et al. [3], the patinas formed on copper are chemically and structurally complex. They do not have a uniform surface but are spatially heterogeneous, porous and therefore possess the capacity to retain moisture, rainwater and atmospheric pollutants [50]. The inner cuprite layer is not uniform, is highly porous and rich in defects. The outer patina presents a laminar structure, is also porous and presents poor adhesion.
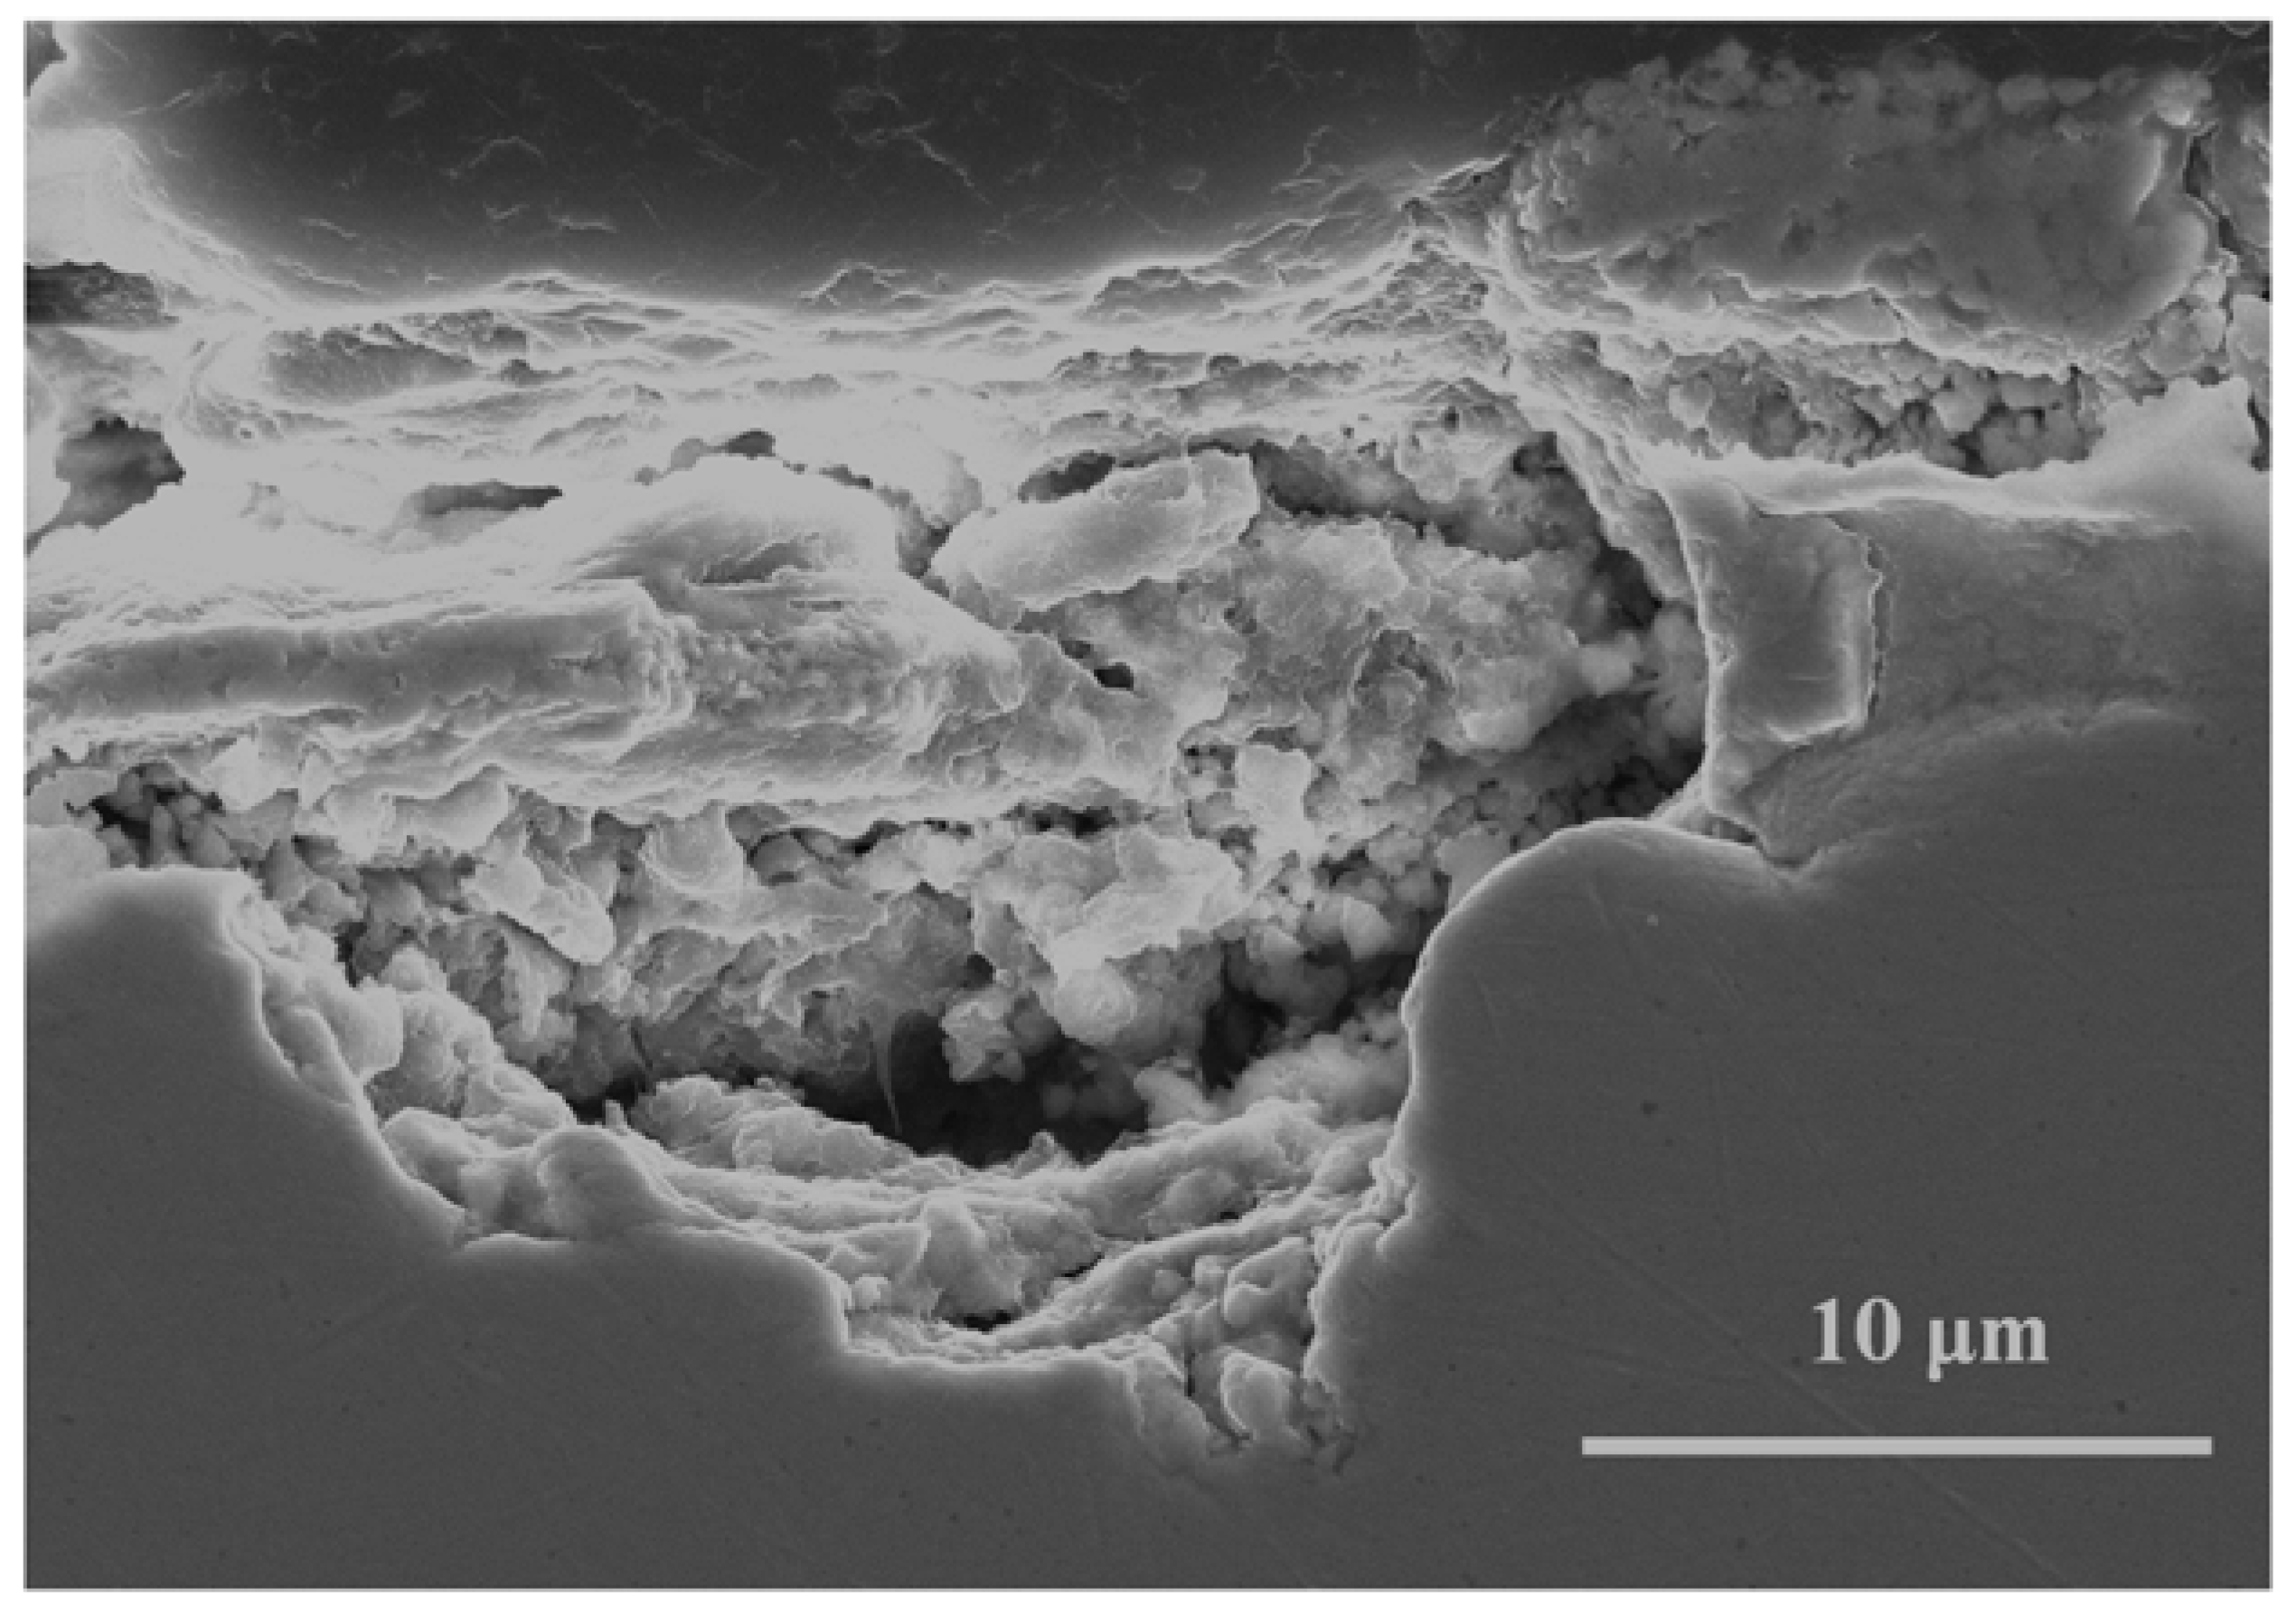
With regard to the basic chlorides formed on copper in marine atmospheres, these grow in a disorderly fashion, with numerous imperfections (voids, defects, etc.). Depending on the atmospheric chloride deposition rate they can come to completely cover the inner cuprite film, as has been seen above, providing the patinas with a certain protective ability. The entry of chloride ions through defects in the patina can cause localized attack of the base copper (Figure 9).
The outer patina of basic chlorides tends to crack and flake off the cuprite film as a consequence of its weak internal adhesion. This flaking phenomenon has been observed by several researchers [6,28,29,51], especially in severe marine atmospheres. Zhang et al. [29] attribute flaking to the presence of nantokite on the cuprite surface and its transformation into basic copper chlorides, confirming this by Fourier-Transform Infrared Spectroscopy (FTIR) and Raman spectroscopy. They also note as a contributing factor the greater volume of basic chlorides that induces physical stresses in the interior of the patina.
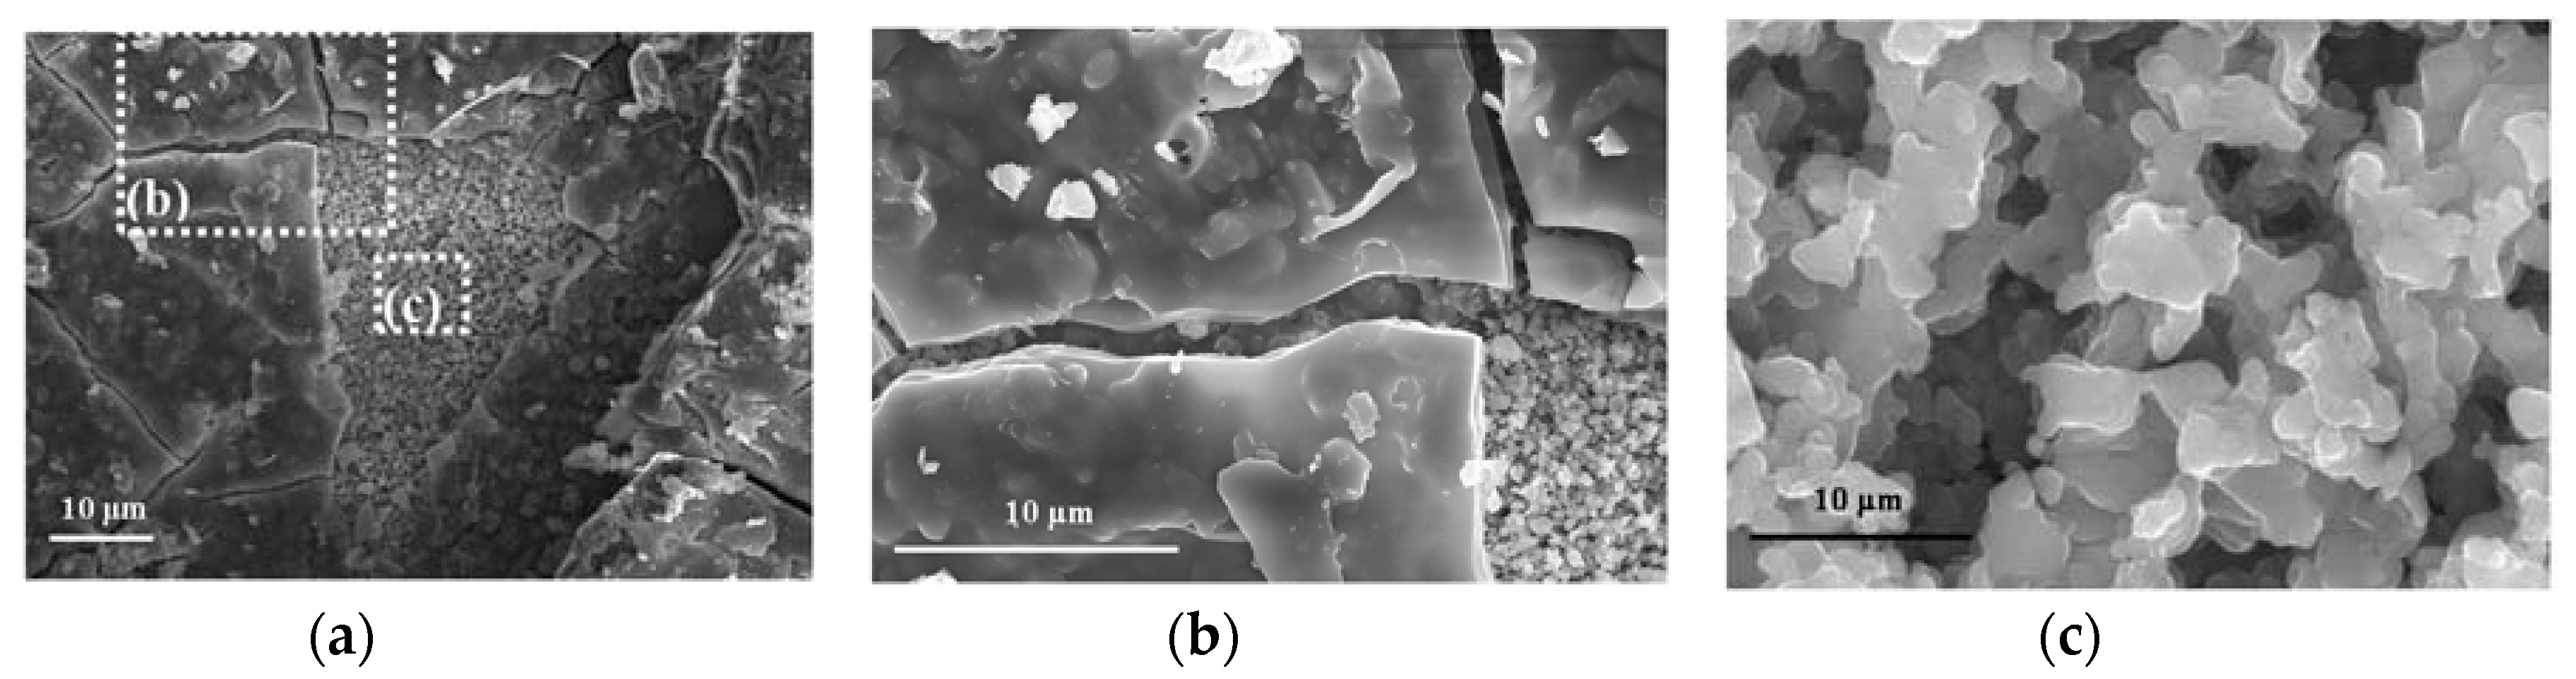
This flaking phenomenon has also been observed in our study, also especially in the marine atmospheres with high chloride deposition rates. Figure 10a shows the flaking process that has taken place in the patinas formed on copper exposed for nine months at station 1, with the highest chloride deposition rate. It is clearly seen how the basic chloride layer has undergone cracking and flaking-off (Figure 10b), leaving the internal cuprite region uncovered (Figure 10c). Energy-dispersive X-ray spectroscopy (EDS) analysis in both regions confirms the nature of both: an outer patina integrated by basic chlorides and an internal patina of cuprite.
As has already been mentioned, in this study we have not been able to detect the presence of nantokite in the corrosion products formed on copper exposed to the marine atmospheres. This is not surprising, since as has been noted throughout the paper nantokite is not stable in humid environments. However, in contrast it is stable in acid environments and in the absence of oxygen and moisture (dry conditions), and thus in the exposure of copper in marine atmospheres it will rapidly be transformed into the Cu2(OH)3Cl polymorphs, and nantokite will go unnoticed in XRD analysis. However, what is beyond all doubt is the remarkable increase in the molar volume of copper chlorides compared to cuprite [37] (see Table 8). The greater average molar volume of the basic copper chlorides would in itself explain the enormous physical stresses developed at the cuprite/basic copper chlorides interface which would lead to the cracking and flaking off of the loosely adherent turquoise blue colored outer patina preferentially integrated by the latter.
5. Conclusions
From the results obtained in this research, the following main conclusions may be drawn:
- -
- The copper corrosion rate may initially (three months of exposure) reach very high values (11.70 μm/year) at sites close to the seashore (332 m), notably decreasing further inland (1250 m) in the studied coastal region (4.29 μm/year). The corrosion rate also decreases as the exposure time advances. After 12 months of exposure, corrosion rates decrease to 4.21 and 1.74 μm/year, respectively.
- -
- The patinas formed on copper are comprised by the following phases: cuprite (Cu2O) and the polymorphs of basic chlorides (Cu2(OH)3Cl): botallackite, atacamite and clinoatacamite. Due to the instability of nantokite (CuCl) it was not possible to identify this phase by XRD.
- -
- The greater or lesser coverage of the cuprite film by basic chlorides (pleasant turquoise blue appearance) depends on the atmospheric chloride deposition rate and the exposure time of copper in the coastal atmosphere. In the atmosphere with the highest chloride deposition rate (1640 mg/m2/day) the coverage percentage after three months of exposure already reached 80%, arriving at 100% coverage after one year of exposure. In contrast, for lower atmospheric salinity levels (~100 mg Cl−/m2/day) the coverage percentage was very low (1–4%) and the patina formed maintained the characteristic reddish color of the cuprite film.
- -
- Information obtained by GIXRD confirms the location of the cuprite phase in the innermost region of the patina. In view of the greater relative increase in the proportion of clinoatacamite encountered when using GIXRD, compared to the proportions found with conventional XRD, it may be speculated that this phase preferentially comprises the outermost region of the patina. Moreover the smaller size of the atacamite phase crystallites, as deduced from the XRD peak profile analysis, suggests that this phase is preferentially located in intermediate strata of the patina.
- -
- At high chloride deposition rates in the marine atmosphere, the outer patina of basic chlorides cracks and flakes off locally, making it possible to observe the inner cuprite film. The greater average molar volume of the basic chlorides compared to cuprite would in itself explain the physical stresses developed at the cuprite/basic copper chlorides interface, which would lead to the cracking and flaking off of the loosely adherent outer patina preferentially integrated by the latter.
Author Contributions
Conceptualization, M.M.; Methodology, P.L., J.A. and B.C.; Software, J.A. and J.A.J.; Formal Analysis, M.M. and J.A.J.; Investigation, P.L., J.A., D.d.l.F. and B.C.; Writing-Original Draft Preparation, P.L. and M.M.; Writing-Review & Editing, M.M., P.L. and D.d.l.F.; Supervision, M.M. and D.d.l.F.
Funding
This research received no external funding.
Acknowledgments
The authors would like to express their gratitude to the companies ENEL and GAS NATURAL-FENOSA for the facilities provided and for allowing the location of the corrosion stations at Cabo Vilano wind farm (Camariñas, Spain). They would also like to thank the Spanish Meteorology Agency (AEMET) for the data provided on meteorological parameters in the study area.
References
- Henriksen, J.; Hienonen, R.; Imrell, T.; Leygraf, C.; Sjögren, L. Corrosion of Electronics; Bulletin No. 102; Swedish Corrosion Institute: Stockholm, Sweden, 1991. [Google Scholar]
- Graedel, T.E.; Franey, J.P. The Statue of Liberty Restoration; Baboian, R., Bellante, B.I., Cliver, E.B., Eds.; NACE: Houston, TX, USA, 1990. [Google Scholar]
- Graedel, T.E.; Nassau, K.; Franey, J.P. Copper patinas formed in the atmosphere—I. Introduction. Corros. Sci. 1987, 27, 639–657. [Google Scholar] [CrossRef]
- Fitzgerald, K.P.; Nairn, J.; Atrens, A. The chemistry of copper patination. Corros. Sci. 1998, 40, 2029–2050. [Google Scholar] [CrossRef]
- Fitzgerald, K.P.; Nairn, J.; Skennerton, G.; Atrens, A. Atmospheric corrosion of copper and the colour, structure and composition of natural patinas on copper. Corros. Sci. 2006, 48, 2480–2509. [Google Scholar] [CrossRef]
- Leygraf, C.; Odnevall Wallinder, I.; Tidblad, J.; Graedel, T. Atmospheric Corrosion, 2nd ed.; Wiley Blackwell: Hoboken, NJ, USA, 2016; pp. 1–374. [Google Scholar] [CrossRef]
- Chang, T.; Wallinder, I.O.; de la Fuente, D.; Chico, B.; Morcillo, M.; Welter, J.M.; Leygraf, C. Analysis of Historic Copper Patinas. Influence of Inclusions on Patina Uniformity. Materials 2017, 10, 298. [Google Scholar] [CrossRef] [PubMed]
- Morcillo, M.; Chang, T.; Chico, B.; de la Fuente, D.; Odnevall Wallinder, I.; Jiménez, J.A.; Leygraf, C. Characterisation of a centuries-old patinated copper roof tile from Queen Anne’s Summer Palace in Prague. Mater. Charact. 2017, 133, 146–155. [Google Scholar] [CrossRef]
- Wallinder, I.O.; Korpinen, T.; Sundberg, R.; Leygraf, C. Atmospheric corrosion of naturally and pre-patinated copper roofs in Singapore and Stockholm—Runoff rates and corrosion product formation. In Outdoor and Indoor Atmospheric Corrosion; Townsend, H.E., Ed.; ASTM International: West Conshohocken, PA, USA, 2002; pp. 230–244. [Google Scholar]
- Kucera, V.; Mattsson, E. Atmospheric corrosion. In Corrosion Mechanism; Dekker, M., Ed.; Marcel Dekker: New York, NY, USA, 1987; pp. 211–284. [Google Scholar]
- De la Fuente, D.; Simancas, J.; Morcillo, M. Morphological study of 16-year patinas formed on copper in a wide range of atmospheric exposures. Corros. Sci. 2008, 50, 268–285. [Google Scholar] [CrossRef] [Green Version]
- Hedberg, Y.S.; Hedberg, J.F.; Herting, G.; Goidanich, S.; Odnevall Wallinder, I. Critical Review: Copper Runoff from Outdoor Copper Surfaces at Atmospheric Conditions. Environ. Sci. Technol. 2014, 48, 1372–1381. [Google Scholar] [CrossRef] [PubMed]
- Strandberg, H. Reactions of copper patina compounds—I. Influence of some air pollutants. Atmos. Environ. 1998, 32, 3511–3520. [Google Scholar] [CrossRef]
- United Nations Economic Commission for Europe (UN/ECE). Effects of Sulphur Compounds on Materials, Including Historic and Cultural Monuments, Airborne Sulphur Pollution. Effects and Control; United Nations Economic Commission for Europe (UN/ECE): New York, NY, USA, 1984. [Google Scholar]
- United Nations Economic Commission for Europe (UN/ECE). International Cooperative Programme (ICP) on Materials including Historic and Cultural Monuments, Convention of Long-Range Transboundary Air Pollution (CLRTAP); United Nations Economic Commission for Europe: Geneva, Switzerland, 1998. [Google Scholar]
- Krätschmer, A.; Odnevall Wallinder, I.; Leygraf, C. The evolution of outdoor copper patina. Corros. Sci. 2002, 44, 425–450. [Google Scholar] [CrossRef]
- Watanabe, M.; Tomita, M.; Ichino, T. Characterization of Corrosion Products Formed on Copper in Urban, Rural/Coastal, and Hot Spring Areas. J. Electrochem. Soc. 2001, 148, B522–B528. [Google Scholar] [CrossRef]
- Veleva, L.; Quintana, P.; Ramanauskas, R.; Pomes, R.; Maldonado, L. Mechanism of copper patina formation in marine environments. Electrochim. Acta 1996, 41, 1641–1645. [Google Scholar] [CrossRef]
- Strandberg, H.; Johansson, L.G. Some Aspects of the Atmospheric Corrosion of Copper in the Presence of Sodium Chloride. J. Electrochem. Soc. 1998, 145, 1093–1100. [Google Scholar] [CrossRef]
- Núñez, L.; Reguera, E.; Corvo, F.; González, E.; Vazquez, C. Corrosion of copper in seawater and its aerosols in a tropical island. Corros. Sci. 2005, 47, 461–484. [Google Scholar] [CrossRef]
- Corvo, F.; Perez, T.; Dzib, L.R.; Martin, Y.; Castañeda, A.; Gonzalez, E.; Perez, J. Outdoor–indoor corrosion of metals in tropical coastal atmospheres. Corros. Sci. 2008, 50, 220–230. [Google Scholar] [CrossRef]
- Veleva, L.; Farro, W. Influence of seawater and its aerosols on copper patina composition. Appl. Surf. Sci. 2012, 258, 10072–10076. [Google Scholar] [CrossRef]
- Portella, M.O.G.; Portella, K.F.; Pereira, P.A.M.; Inone, P.C.; Brambilla, K.J.C.; Cabussú, M.S.; Cerqueira, D.P.; Salles, R.N. Atmospheric Corrosion Rates of Copper, Galvanized Steel, Carbon Steel and Aluminum in the Metropolitan Region of Salvador, BA, Northeast Brazil. Procedia Eng. 2012, 42, 171–185. [Google Scholar] [CrossRef]
- Lin, H.; Frankel, G.S. Atmospheric Corrosion of Cu during Constant Deposition of NaCl. J. Electrochem. Soc. 2013, 160, C336–C344. [Google Scholar] [CrossRef] [Green Version]
- Castañeda, A.; Corvo, F.; Fernández, D.; Valdés, C. Outdoor-indoor atmospheric corrosion in a coastal wind farm located in a tropical Island. Eng. J. 2017, 21, 43. [Google Scholar] [CrossRef]
- Morcillo, M.; Almeida, E.; Marrocos, M.; Rosales, B. Atmospheric Corrosion of Copper in Ibero-America. Corrosion 2001, 57, 967–980. [Google Scholar] [CrossRef] [Green Version]
- Knotkova, D.; Kreislova, K.; Sheldon, S.D., Jr. International Atmospheric Exposure Program: Summary of Results; ASTM Data Series 71; ASTM International: West Conshohocken, PA, USA, 2016. [Google Scholar]
- Odnevall Wallinder, I.; Zhang, X.; Goidanich, S.; Le Bozec, N.; Herting, G.; Leygraf, C. Corrosion and runoff rates of Cu and three Cu-alloys in marine environments with increasing chloride deposition rate. Sci. Total Environ. 2014, 472, 681–694. [Google Scholar] [CrossRef] [PubMed]
- Zhang, X.; Odnevall Wallinder, I.; Leygraf, C. Mechanistic studies of corrosion product flaking on copper and copper-based alloys in marine environments. Corros. Sci. 2014, 85, 15–25. [Google Scholar] [CrossRef]
- Graedel, T.E. Copper patinas formed in the atmosphere—II. A qualitative assessment of mechanisms. Corros. Sci. 1987, 27, 721–740. [Google Scholar] [CrossRef]
- Morcillo, M.; Almeida, E.; Rosales, B.; Uruchurtu, J.; Marrocos, M. Corrosión y Protección de Metales en las Atmósferas de Iberoamérica. Parte I: Mapas de Iberoamérica de Corrosividad Atmosférica (Proyecto MICAT, XV.1/CYTED); CYTED: Madrid, Spain, 1998. [Google Scholar]
- International Organization for Standardization. ISO 9225:2012, Corrosion of Metals and Alloys—Corrosivity of Atmospheres—Measurement of Environmental Parameters Affecting Corrosivity of Atmospheres; International Organization for Standardization: Geneva, Switzerland, 2012. [Google Scholar]
- Alcántara, J.; Chico, B.; Díaz, I.; de la Fuente, D.; Morcillo, M. Airborne chloride deposit and its effect on marine atmospheric corrosion of mild steel. Corros. Sci. 2015, 97, 74–88. [Google Scholar] [CrossRef] [Green Version]
- German Institute for Standardization. DIN EN 13599—Copper and Copper Alloys—Copper Plate, Sheet and Strip for Electrical Purposes; German Institute for Standardization: Berlin, Germany, 2014. [Google Scholar]
- ASTM International. ASTM G1-90 Standard Practice for Preparing, Cleaning, and Evaluation Corrosion Test Specimens; ASTM International: West Conshohocken, PA, USA, 1999. [Google Scholar]
- International Organization for Standardization. ISO 9226:2012 Corrosion of Metals and Alloys—Corrosivity of Atmospheres—Determination of Corrosion Rate of Standard Specimens for the Evaluation of Corrosivity; International Organization for Standardization: Geneva, Switzerland, 2012. [Google Scholar]
- ASTM International. Pearson’s Crystal Structure, Database for Inorganic Compounds; ASTM International: West Conshohocken, PA, USA, 2015. [Google Scholar]
- ImageJ Image Processing and Analysis in Java. Available online: https://imagej.nih.gov/ij/ (accessed on 1 July 2018).
- Pollard, A.M.; Thomas, R.G.; Williams, P.A. Synthesis and Stabilities of the Basic Copper(II) Chlorides Atacamite, Paratacamite and Botallackite. Mineral. Mag. 1989, 53, 557–563. [Google Scholar] [CrossRef]
- Frost, R.L. Raman spectroscopy of selected copper minerals of significance in corrosion. Spectrochim. Acta Part A 2003, 59, 1195–1204. [Google Scholar] [CrossRef] [Green Version]
- Slamova, K.; Duerr, I.; Kaltenbach, T.; Koehl, M. Degradation effects of maritime atmosphere on metallic components of solar collectors. Sol. Energy Mater. Sol. Cells 2016, 147, 246–254. [Google Scholar] [CrossRef]
- Jambor, J.L.; Dutrizac, J.E.; Roberts, A.C.; Grice, J.D.; Szymanski, J.T. Clinoatacamite, a new polymorph of Cu2(OH)3Cl, and its relationship to paratacamite and “anarakite”. Can. Mineral. 1996, 34, 61–72. [Google Scholar]
- Malcherek, T.; Schlüter, J. The crystal structure of clinoatacamite and the quest for paratacamite. In Proceedings of the Poster Annual Meeting of DMG, Berlin, Germany, 29 May–2 June 2008. [Google Scholar]
- Cathcart, A. Discussion on the open-air corrosion of copper. III—Artificial production of green patina. J. Inst. Met. 1932, 49, 161. [Google Scholar]
- Mattsson, E.; Holm, R. Copper and Copper alloys. In ASTM STP 435; ASTM International: West Conshohocken, PA, USA, 1968; pp. 187–210. [Google Scholar]
- Rice, D.W.; Peterson, P.; Rigby, E.B.; Phipps, P.B.P.; Cappell, R.J.; Tremoureux, R. Atmospheric Corrosion of Copper and Silver. J. Electrochem. Soc. 1981, 128, 275–284. [Google Scholar] [CrossRef]
- Kubaschewski, O.; Hopkins, B.E. Oxidation of Metals and Alloys; Butterworths Scientific Publications: London, UK, 1953. [Google Scholar] [CrossRef]
- Odnevall Wallinder, I.; Leygraf, C. Seasonal variations in corrosion rate and runoff rate of copper roofs in an urban and a rural atmospheric environment. Corros. Sci. 2001, 43, 2379–2396. [Google Scholar] [CrossRef]
- Drogowska, M.; Brossard, L.; Menard, H. Copper dissolution in NaHCO3 and NaHCO3 + NaCl aqueous solutions at pH 8. J. Electrochem. Soc. 1992, 139, 39–47. [Google Scholar] [CrossRef]
- Franey, J.P.; Davis, M.E. Metallographic studies of the copper patina formed in the atmosphere. Corros. Sci. 1987, 27, 659–668. [Google Scholar] [CrossRef]
- Scholes, I.R.; Jacob, W.R. Atmospheric corrosion of copper and copper-base alloys during twenty years’ exposure in a marine and industrial environment. J. Inst. Met. 1970, 98, 272–280. [Google Scholar]
Figure 1.
Wind rose for Cabo Vilano test site during the period April 2015 to March 2016. The numbers correspond to frequencies (%) of wind running in different directions.
Figure 1.
Wind rose for Cabo Vilano test site during the period April 2015 to March 2016. The numbers correspond to frequencies (%) of wind running in different directions.

Figure 2.
Variation in the annual chloride deposition rate with distance from the seashore at Cabo Vilano test sites. The numbers indicate the testing station.
Figure 2.
Variation in the annual chloride deposition rate with distance from the seashore at Cabo Vilano test sites. The numbers indicate the testing station.

Figure 3.
Representation of the variation in annual copper corrosion with the atmospheric chloride deposition rate.
Figure 3.
Representation of the variation in annual copper corrosion with the atmospheric chloride deposition rate.

Figure 4.
Typical representation for comparison of observed (blue circles) and calculated (solid red line) XRD patterns obtained after Rietveld refinement for patinas formed on copper in the marine atmosphere of Cabo Vilano. The differences between experimental data and the fitted simulated pattern are plotted as a continuous grey line at the bottom, and the contribution of the component phases in different colors.

Figure 5.
Overview of color changes in the patina formed on copper when exposed to marine atmospheres. (a) Initial salmon pink; (b) reddish tone corresponding to cuprite, (c,d) turquoise blue coloring corresponding to basic copper chlorides formed on cuprite.
Figure 5.
Overview of color changes in the patina formed on copper when exposed to marine atmospheres. (a) Initial salmon pink; (b) reddish tone corresponding to cuprite, (c,d) turquoise blue coloring corresponding to basic copper chlorides formed on cuprite.

Figure 6.
Early formation of basic copper chlorides at the edges of the test specimens (a,b) and in areas around the fastening clips (a) due to greater moisture retention and a higher saline concentration in the precipitated aqueous layer as a result of evaporation during the drying period.
Figure 6.
Early formation of basic copper chlorides at the edges of the test specimens (a,b) and in areas around the fastening clips (a) due to greater moisture retention and a higher saline concentration in the precipitated aqueous layer as a result of evaporation during the drying period.

Figure 7.
(a) Cuprite formations on the copper surface exposed for three months in the marine atmosphere with the lowest chloride deposition rate. The arrows indicate initial formations of chlorides on the cuprite crystals; (b) Cross section of the cuprite layer showing its great heterogeneity.
Figure 7.
(a) Cuprite formations on the copper surface exposed for three months in the marine atmosphere with the lowest chloride deposition rate. The arrows indicate initial formations of chlorides on the cuprite crystals; (b) Cross section of the cuprite layer showing its great heterogeneity.

Figure 8.
Piling of the basic copper chloride layers on the innermost cuprite layer. Cross section (a) and surface (b) views.
Figure 8.
Piling of the basic copper chloride layers on the innermost cuprite layer. Cross section (a) and surface (b) views.

Figure 9.
Pitting of the copper substrate when exposed to the marine atmosphere with a high chloride deposition rate.
Figure 9.
Pitting of the copper substrate when exposed to the marine atmosphere with a high chloride deposition rate.

Figure 10.
(a) Flaking of the basic copper chloride layers formed on copper exposed to a marine atmosphere with high chloride deposition rates; (b) SEM micrograph of the cracked surface of basic copper chlorides; (c) SEM micrograph of the cuprite surface.
Figure 10.
(a) Flaking of the basic copper chloride layers formed on copper exposed to a marine atmosphere with high chloride deposition rates; (b) SEM micrograph of the cracked surface of basic copper chlorides; (c) SEM micrograph of the cuprite surface.


Table 1.
First-year worldwide corrosion of copper in pure marine atmospheres, Cl−: ≥10 mg/m2·day; SO2: ≤10 mg/m2·d.
Table 1.
First-year worldwide corrosion of copper in pure marine atmospheres, Cl−: ≥10 mg/m2·day; SO2: ≤10 mg/m2·d.
| Ref. | Test Site | Country | Cl− Deposition Rate, (mg Cl−/m2·d) | First-Year Corrosion, (μm) |
|---|---|---|---|---|
| [31] | Sabanilla | Costa Rica | 11.3 | 1.2 |
| [27] | Vladivostok | Russia | 11.8 | 1.4 |
| [27] | Murmansk | Russia | 12.1 | 1.7 |
| [31] | Matanzas | Venezuela | 15.9 | 1.0 |
| [31] | Acapulco | Mexico | 23.8 | 1.2 |
| [31] | S. Cristobal | Ecuador | 25.0 | 1.5 |
| [31] | Coro | Venezuela | 27.5 | 2.4 |
| [27] | Camet | Argentina | 28.7 | 2.2 |
| [31] | Punto Fijo | Venezuela | 31.0 | 3.2 |
| [31] | Puntarenas | Costa Rica | 33.4 | 3.0 |
| [27] | Choshi | Japan | 40.5 | 1.4 |
| [31] | Salinas | Ecuador | 47.3 | 2.3 |
| [27] | Kattesand | Sweden | 51.9 | 1.7 |
| [31] | Camet | Argentina | 55.1 | 2.2 |
| [27] | Okinawa | Japan | 78.9 | 2.1 |
| [28] | Brest (S.2) | France | ~80.0 | 1.8 |
| [27] | Kure Beach | USA | 112.0 | 2.9 |
| [31] | Ubatuba | Brazil | 113.0 | 3.3 |
| [31] | P. del Este | Uruguay | 144.0 | 2.5 |
| [27] | Tannager | Norway | 182.9 | 1.9 |
| [31] | Limón | Costa Rica | 220.0 | 3.7 |
| [31] | A. do Cabo | Brazil | 229.0 | 2.5 |
| [27] | Kvarnvik | Sweden | 404.9 | 2.8 |
| [28] | Brest (S.1) | France | ~500.0 | 2.7 |
Table 2.
Position of the strongest peak of the most common copper chlorides for Co radiation.
| Phase | JCPDS Card | Reflection (hkl) | Peak Position (2θ) |
|---|---|---|---|
| Atacamite | 025-0269 | (011) | 18.789 |
| Paratacamite | 025-1427 | (−110) | 18.928 |
| Clinoatacamite | 050-1559 | (−101) (011) | 18.823 |
| Botallactite | 008-0088 | (001) | 18.186 |
| Nantokite | 006-0344 | (111) | 33.243 |
Table 3.
Variation in the copper corrosion rate at each testing station after the different exposure times. Average values considering both sides of the specimens.
Table 3.
Variation in the copper corrosion rate at each testing station after the different exposure times. Average values considering both sides of the specimens.
| Test Site (Figure 2) | Corrosion Rate (μm/year) | |||
|---|---|---|---|---|
| 3 Months | 6 Months | 9 Months | 12 Months | |
| 1 | 11.70 ± 1.14 | 7.56 ± 0.87 | 6.83 ± 0.12 | 4.21 ± 0.22 |
| 2 | 7.64 ± 0.32 | 5.17 ± 0.10 | 3.95 ± 0.11 | 3.01 ± 0.02 |
| 3 | 6.31 ± 0.02 | 4.42 ± 0.06 | 3.31 ± 0.09 | 2.57 ± 0.01 |
| 4 | 6.11 ± 0.05 | 4.03 ± 0.11 | 3.10 ± 0.07 | 2.33 ± 0.03 |
| 5 | 5.18 ± 0.04 | 3.44 ± 0.06 | 2.59 ± 0.06 | 2.03 ± 0.03 |
| 6 | 4.29 ± 0.14 | 3.12 ± 0.08 | 2.10 ± 0.05 | 1.74 ± 0.04 |
Table 4.
Composition of the patinas formed on copper in coastal marine atmospheres in different exposure conditions. Data obtained by X-ray diffraction (XRD).
Table 4.
Composition of the patinas formed on copper in coastal marine atmospheres in different exposure conditions. Data obtained by X-ray diffraction (XRD).
| Test Site (Figure 2) | Time of Exposure (Months) | XRD | Cuprite | Basic Copper Chlorides | ||
|---|---|---|---|---|---|---|
| Botallackite | Atacamite | Clinoatacamite | ||||
| 1 | 9 | conventional | 64.4 | 1.1 | 21.9 | 12.6 |
| GIXRD | 25.5 | 1.3 | 34.9 | 38.3 | ||
| 2 | 3 | conventional | 72.0 | 7.3 | 11.4 | 9.3 |
| 6 | conventional | 70.2 | 1.7 | 18.5 | 9.6 | |
| 12 | conventional | 60.6 | 1.1 | 23.9 | 14.4 | |
| GIXRD | 16.6 | 3.9 | 27.3 | 52.2 | ||
| 3 | 12 | Conventional | 61.7 | 1.7 | 20.8 | 15.8 |
| GIXRD | 35.3 | 2.5 | 31.6 | 30.6 | ||
| 6 | 3 | conventional | 72.7 | 2.4 | 17.0 | 7.9 |
| 9 | conventional | 65.9 | 2.5 | 20.6 | 11.0 | |
| 12 | conventional | 61.7 | 3.6 | 22.2 | 12.5 | |
| GIXRD | 50.6 | 4.9 | 26.8 | 17.7 | ||
Conventional XRD: XRD on corroded sheet; GIXRD: Grazing Incidence X-ray Diffraction.
Table 5.
Evolution with exposure time of the percentage coverage of the cuprite patina by basic copper chlorides. Information corresponding to the seaward facing specimen side at the different testing stations.
Table 5.
Evolution with exposure time of the percentage coverage of the cuprite patina by basic copper chlorides. Information corresponding to the seaward facing specimen side at the different testing stations.
| Test Site (Figure 2) | Time of Exposure | |||
|---|---|---|---|---|
| 3 Months | 6 Months | 9 Months | 12 Months | |
| 1 | 80 | 82 | 91 | 97 |
| 2 | 33 | 43 | 52 | 55 |
| 3 | 17 | 24 | 25 | 36 |
| 4 | 19 | 12 | 15 | 40 |
| 5 | 7 | 6 | 4 | 4 |
| 6 | 4 | 1 | 1 | 1 |
Table 6.
Proportions (wt %) of the different phases integrating the patinas formed on copper in different atmospheric exposure conditions.
Table 6.
Proportions (wt %) of the different phases integrating the patinas formed on copper in different atmospheric exposure conditions.
| Test Site | Chloride Deposition Rate (mg/m2·d) | Time of Exposure (Months) | Cuprite | Basic Copper Chlorides | |||
|---|---|---|---|---|---|---|---|
| Botallackite | Atacamite | Clinoatacamite | Total | ||||
| 2 | 430 | 3 | 72.0 | 7.3 | 11.4 | 9.3 | 28.0 |
| 6 | 70.2 | 1.7 | 18.5 | 9.6 | 29.8 | ||
| 12 | 60.6 | 1.1 | 23.9 | 14.4 | 39.4 | ||
| 6 | 120 | 3 | 72.7 | 2.4 | 17.0 | 7.9 | 27.3 |
| 9 | 65.9 | 2.5 | 20.6 | 11.0 | 34.1 | ||
| 12 | 61.7 | 3.6 | 22.2 | 12.5 | 38.3 | ||
Table 7.
Quantification (wt %) of the different phases formed on copper by conventional XRD and GIXRD.
Table 7.
Quantification (wt %) of the different phases formed on copper by conventional XRD and GIXRD.
| Test Site | Chloride Deposition Rate (mg/m2·d) | Time of Exposure (Months) | XRD Technique | Cuprite | Botallackite | Atacamite | Clinoatacamite | Copper Signal * |
|---|---|---|---|---|---|---|---|---|
| 1 | 1640 | 9 | conventional | 64.4 | 1.1 | 21.9 | 12.6 | 37.4 |
| GIXRD | 25.5 | 1.3 | 34.9 | 38.3 | ND | |||
| 2 | 430 | 12 | conventional | 60.6 | 1.1 | 23.9 | 14.4 | 64.5 |
| GIXRD | 16.6 | 3.9 | 27.3 | 52.2 | ND | |||
| 3 | 230 | 12 | conventional | 61.7 | 1.7 | 20.8 | 15.8 | 76.0 |
| GIXRD | 35.3 | 2.5 | 31.6 | 30.6 | ND | |||
| 6 | 120 | 12 | conventional | 61.7 | 3.6 | 22.2 | 12.5 | 69.6 |
| GIXRD | 50.6 | 4.9 | 26.8 | 17.7 | 2.3 |
ND—Not detected; * The quantification of the base copper signal obtained in the X-ray diffractogram has been performed prior to normalization of the diffractogram.
Table 8.
Molar volume of the different phases that usually form on copper when exposed to marine atmospheres [37].
Table 8.
Molar volume of the different phases that usually form on copper when exposed to marine atmospheres [37].
| Corrosion Product | Molar Volume (nm3) |
|---|---|
| Cuprite (Cu2O) | 0.078 |
| Nantokite (CuCl) | 0.160 |
| Botallackite (Cu2(OH)3Cl) | 0.200 |
| Atacamite (Cu2(OH)3Cl) | 0.377 |
| Clinoatacamite (Cu2(OH)3Cl) | 0.380 |
© 2018 by the authors. Licensee MDPI, Basel, Switzerland. This article is an open access article distributed under the terms and conditions of the Creative Commons Attribution (CC BY) license (http://creativecommons.org/licenses/by/4.0/).
Share and Cite
MDPI and ACS Style
Lopesino, P.; Alcántara, J.; De la Fuente, D.; Chico, B.; Jiménez, J.A.; Morcillo, M. Corrosion of Copper in Unpolluted Chloride-Rich Atmospheres. Metals 2018, 8, 866. https://0-doi-org.brum.beds.ac.uk/10.3390/met8110866
AMA Style
Lopesino P, Alcántara J, De la Fuente D, Chico B, Jiménez JA, Morcillo M. Corrosion of Copper in Unpolluted Chloride-Rich Atmospheres. Metals. 2018; 8(11):866. https://0-doi-org.brum.beds.ac.uk/10.3390/met8110866
Chicago/Turabian StyleLopesino, Patricia, Jenifer Alcántara, Daniel De la Fuente, Belén Chico, José Antonio Jiménez, and Manuel Morcillo. 2018. "Corrosion of Copper in Unpolluted Chloride-Rich Atmospheres" Metals 8, no. 11: 866. https://0-doi-org.brum.beds.ac.uk/10.3390/met8110866
Note that from the first issue of 2016, this journal uses article numbers instead of page numbers. See further details here.