Numerical Analysis of the Perforated Steel Sheets Under Uni-Axial Tensile Force


1
Department of Civil Engineering, College of Engineering, Assiut University, Assiut 71511, Egypt
2
Department of Civil and Environmental Engineering, College of Engineering, Majmaah University, Al-Majmaah 11952, Saudi Arabia
Metals 2019, 9(6), 632; https://0-doi-org.brum.beds.ac.uk/10.3390/met9060632
Submission received: 8 May 2019
/
Revised: 24 May 2019
/
Accepted: 28 May 2019
/
Published: 31 May 2019
Abstract
:The perforated steel sheets have many uses, so they should be studied under the influence of the uniaxial tensile load. The presence of these holes in the steel sheets certainly affects the mechanical properties. This paper aims at studying the behavior of the stress-strain engineering relationships of the perforated steel sheets. To achieve this, the three-dimensional finite element (FE) model is mainly designed to investigate the effect of this condition. Experimental tests were carried out on solid specimens to be used in the test of model accuracy of the FE simulation. Simulation testing shows that the FE modeling revealed the ability to calculate the stress-strain engineering relationships of perforated steel sheets. It can be concluded that the effect of a perforated rhombus shape is greater than the others, and perforated square shape has no effect on the stress-strain engineering relationships. The efficiency of the perforated staggered or linearly distribution shapes with the actual net area on the applied loads has the opposite effect, as it reduces the load capacity for all types of perforated shapes. Despite the decrease in load capacity, it improves the properties of the steel sheets.
1. Introduction
The mechanical behavior of steel material is generally determined by a standard uniaxial tension test. The standard tension protocol test [1], which was used in comparison for the different steel types, determined both the engineering stress and the strain. While using the area of the original cross-section and the change in the original length of the tension specimen, the engineering stress and corresponding strain were calculated. Many types of research have been carried out on the stress-strain relationships under engineering and true characteristics [2,3,4,5,6].
When a uniaxial tensile external applies loading on a test specimen, the plastic region after elastic deformations will be expected. At first, an elastic deformation will occur with a linear region relationship of load and a corresponding extension. Computation of both stress and corresponding strain are established using the original cross-section dimensions, and the original gauge length of the test specimen for the purpose of a relationship of engineering stress-strain through the use of Equations (1) and (2) as follows:
It is also possible to establish a relationship between stress and strain at the linear elastic relationship, as shown in Equation (3) where E is the elastic modulus of the metal.
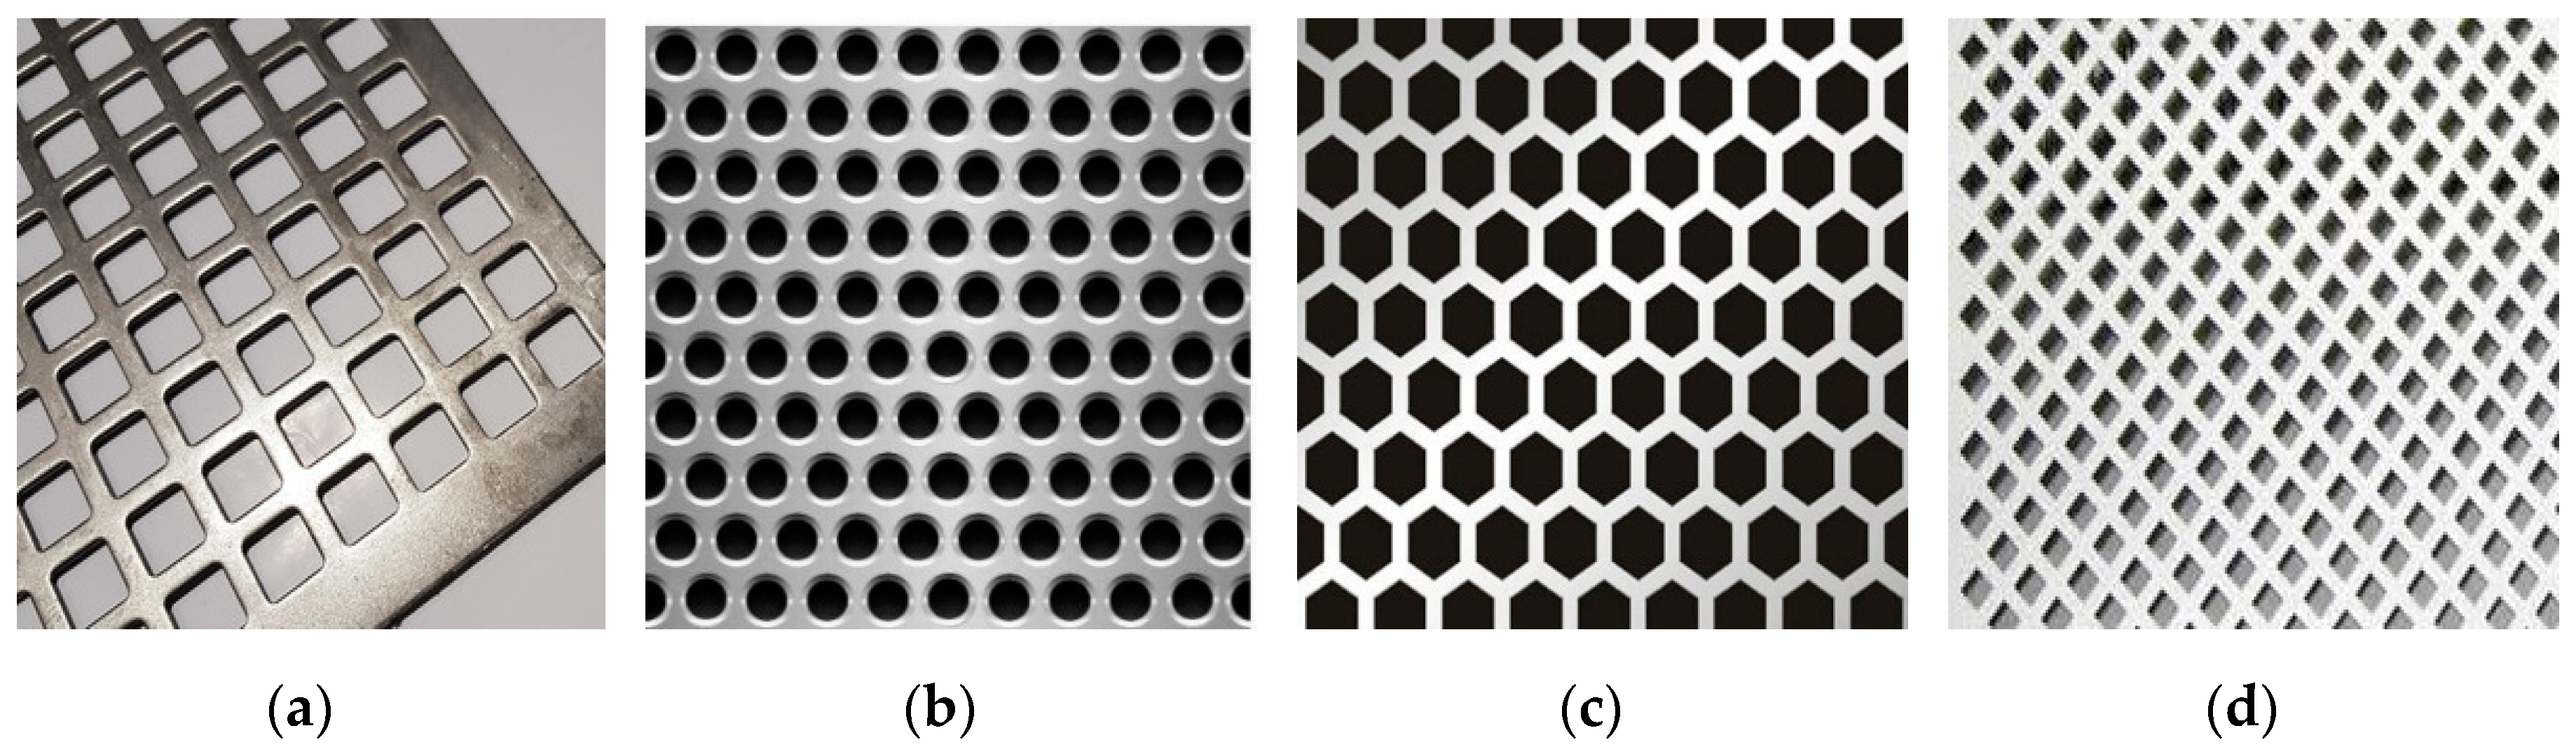
Perforated steel sheets have many uses in engineering installations either for structural reasons such as load relief, saving in raw materials or for architectural purposes such as inserting some lighting for the place and not blocking the vision through the steel sheets or to making some filters such as pipes used in wells. Figure 1 illustrates some of the shapes used in perforated steel sheets such as square, circular, hexagonal and rhombus.
There are many variables to consider when using perforated steel sheets. Some research has been done on this type of perforated steel plates under uniaxial compression [7,8,9,10,11], and some research has been done in the circular shape of the perforated sheets [12]. The steel sheets with a thickness of less than 5 mm were studied, which is the thickness that separates between the sheets and the plates [1,13]. Several variables were studied, such as the hole shape (square, circular, hexagonal and rhombus), the distance between the holes in the longitudinal and the width direction, the shape of the hole distribution (linear distribution or staggered), the hole size and also the thickness of the steel sheets.
Nowadays, finite-element FE modeling and simulation techniques are widely used in research involving structural analysis and design, especially of structural steel elements [14,15]. In some research, FE modeling techniques are often used to expand the limitations of the experimental testing analysis, because of the difficulty of implementation or high cost, and are also used to investigate the different parameters which that affect the problem study. For the modeling of steel structures elements, it is necessary to use realistic stress-strain engineering curve extending up to fracture point. Experimental tests were conducted for a steel sheet solid sample to be the standard when using the FE software ANSYS [16] and were compared to ensure the accuracy of the FE modeling in predicting stress-strain engineering relationships.
2. Research Methodology
2.1. Experimental Test Specimens
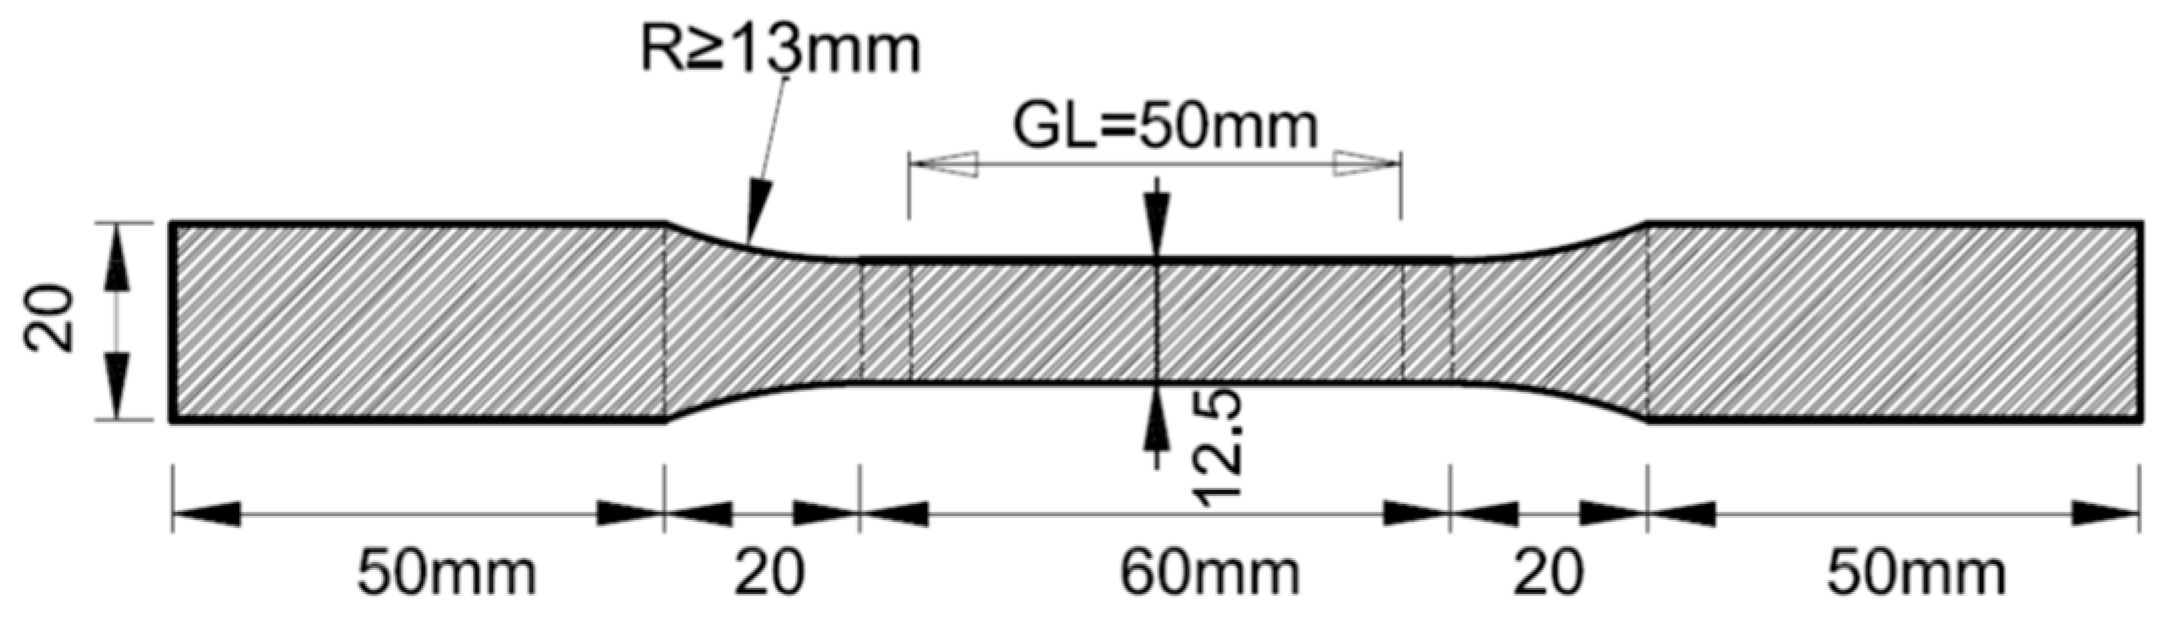
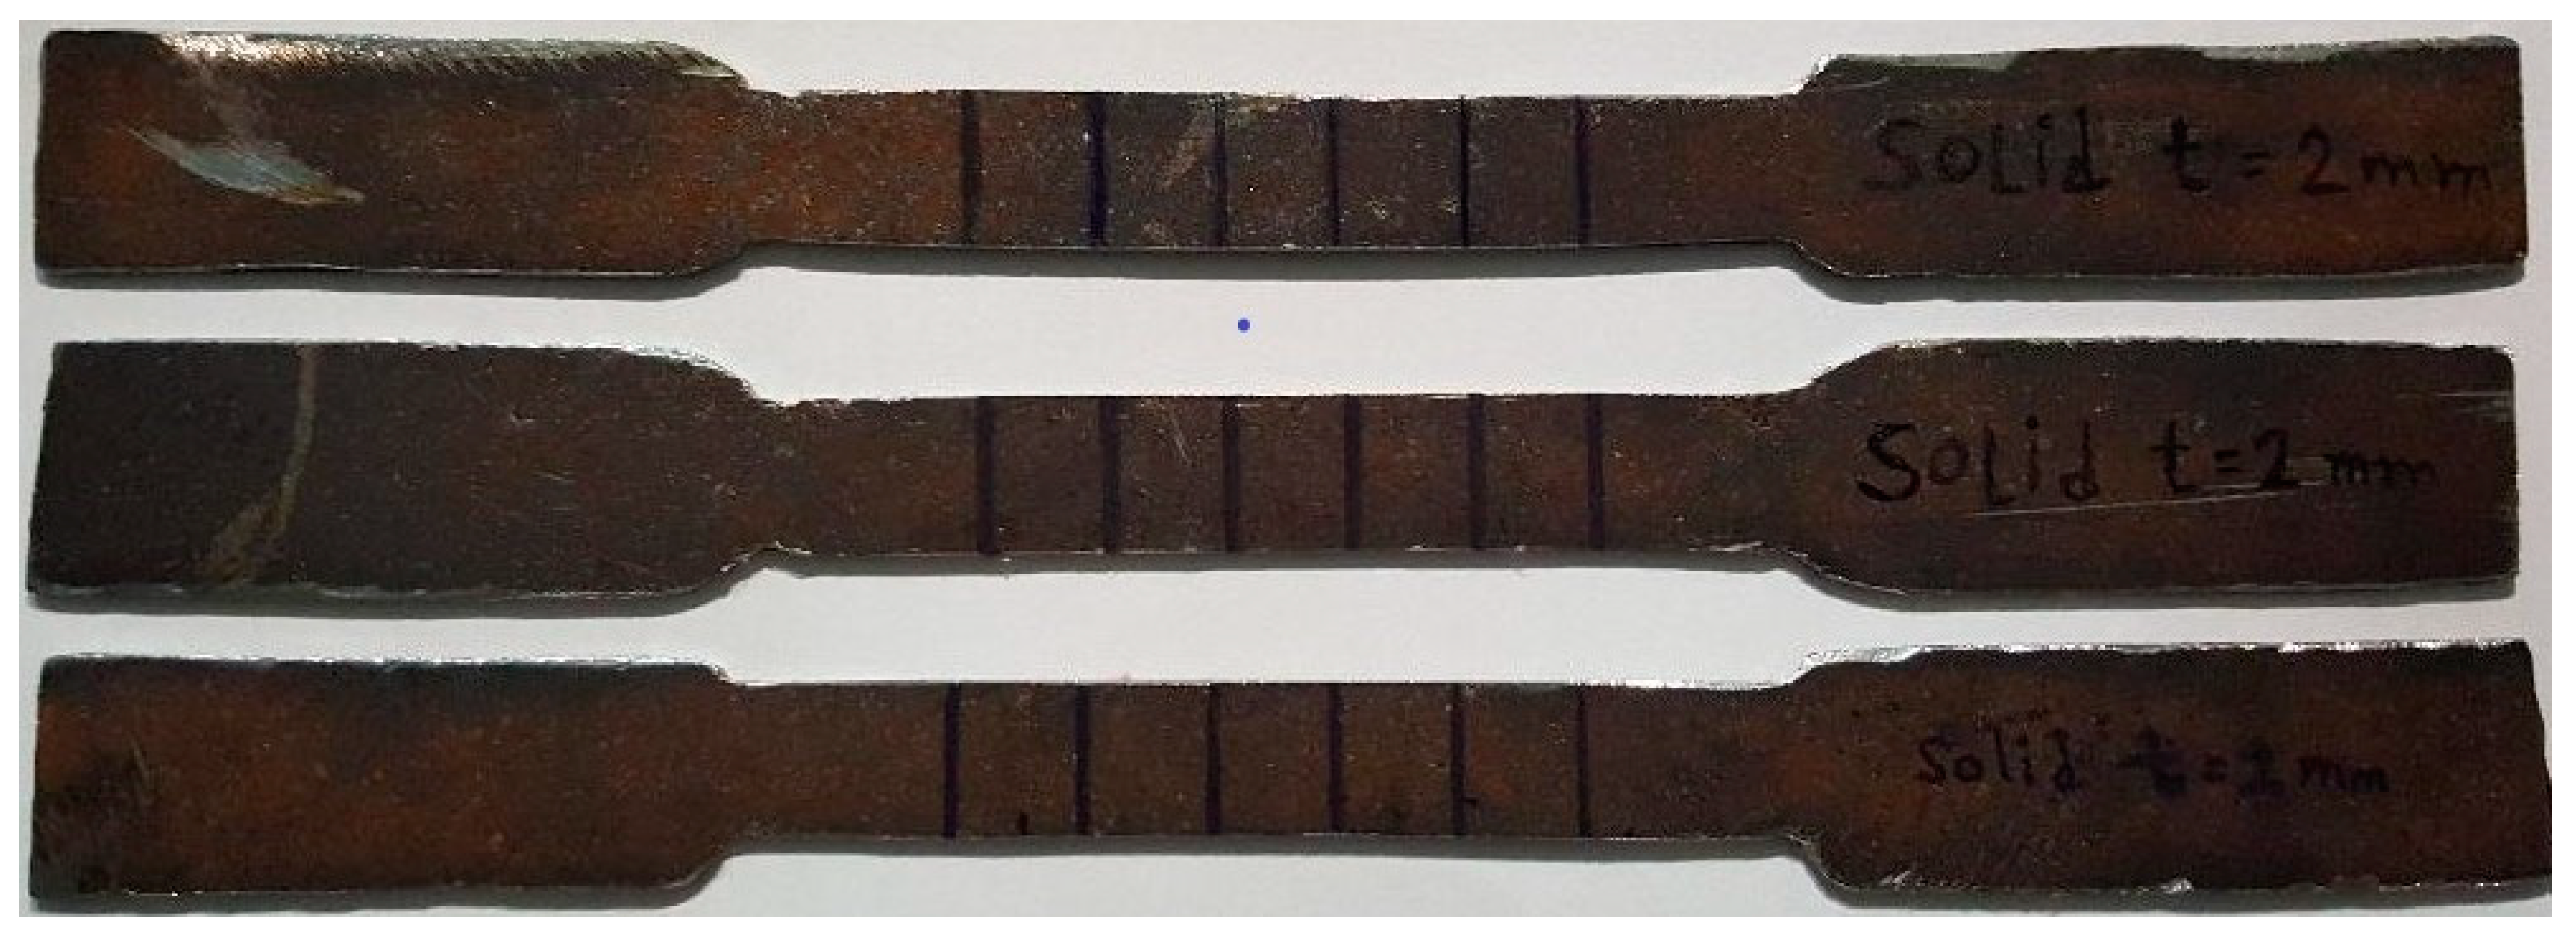
The test experimental program considered three tensile specimens with the thickness equal to 2.0 mm, from same steel grades. The samples were taken from the same steel sheet to ensure no big change in the mechanical properties of the samples. The dimensions of the tensile test specimens were in according to the standard test specimen steel sheet in conformance with ASTM A370 [1], as shown in Figure 2 and Figure 3. The width of the specimens was 12.5 mm. The extensometer has a gauge length of 50 mm which had the two faces of the test specimen attached.
2.2. Numerical Test Specimens
2.2.1. ANSYS Finite Element Model Study: Steel Sheet Modeling Characteristics
SOLID186 elements ANSYS-15 [16] were employed for modeling the steel sheets with a solid element. The definition of the SOLID186 is made as 20 nodes having three degrees of freedom at each node. This element allows certain properties from the other models such as hyperelasticity, plasticity, stiffening of stress, creep, larger capabilities of strain, and large deflection. Also, the capability to simulate the deformations of elastic-plastic materials. The steel sheets integrated into the FE numerical simulation models were expected to have linear elasticity. The elastic modulus and the stress-strain engineering relationships that depend upon the experimental test specimens which were done in this research and the Poisson ratio of 0.3 was applied [14,15]. The maximum size of the meshing elements was taken as being 1 mm in length, 1 mm in width, and 1 mm in height.
2.2.2. Numerical Model Studies
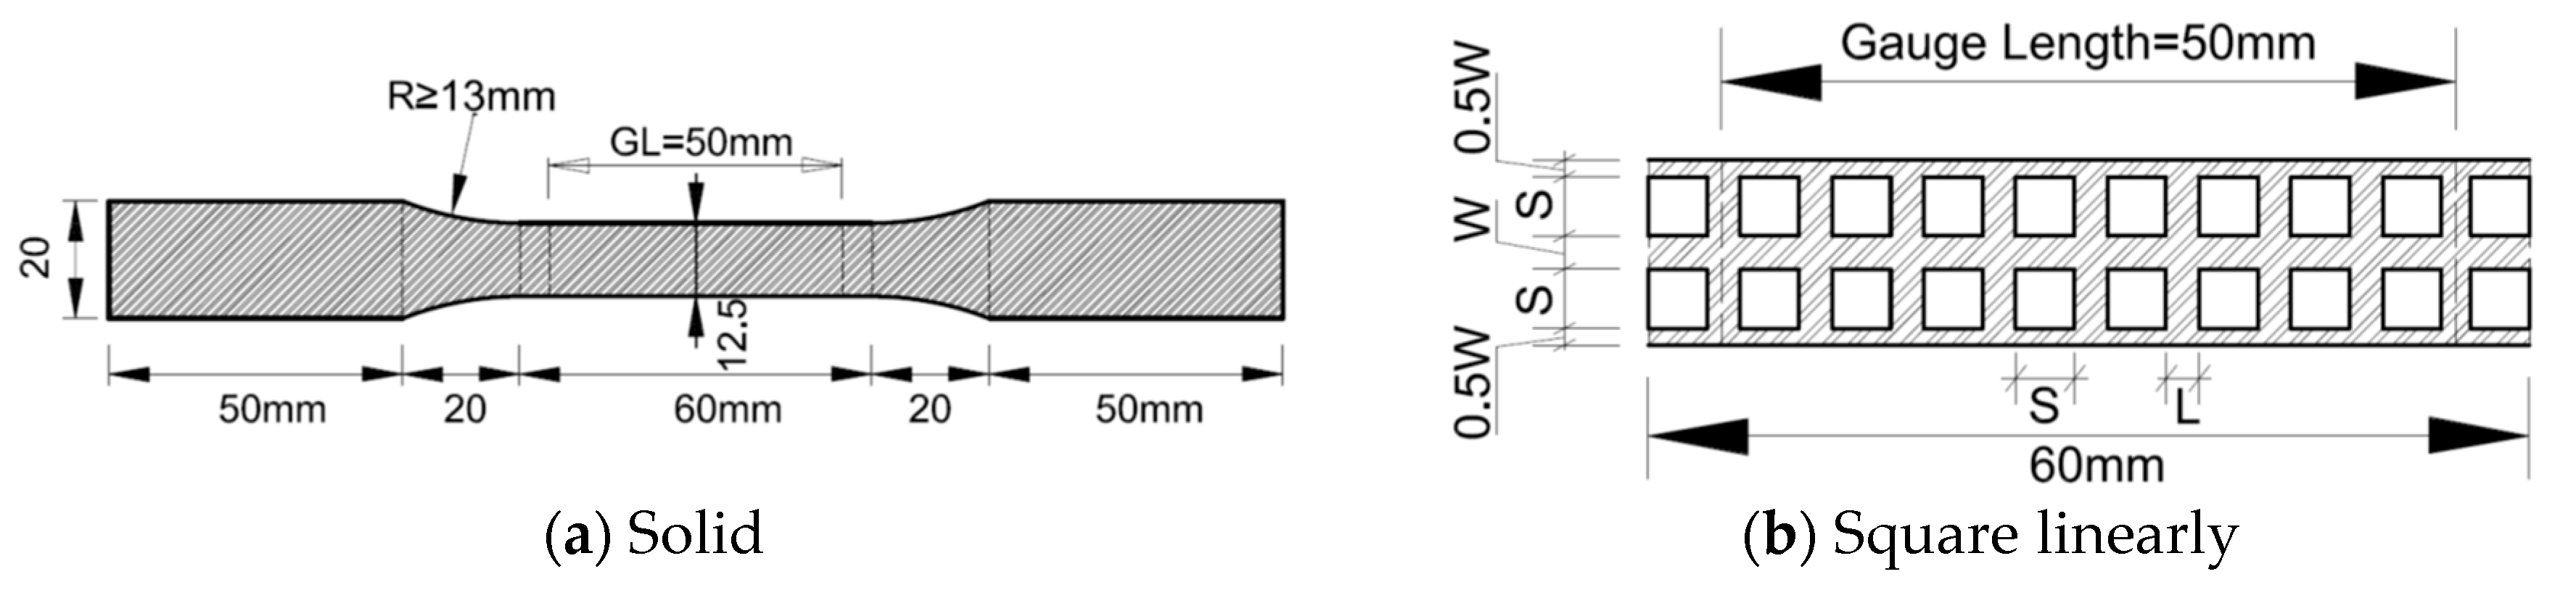
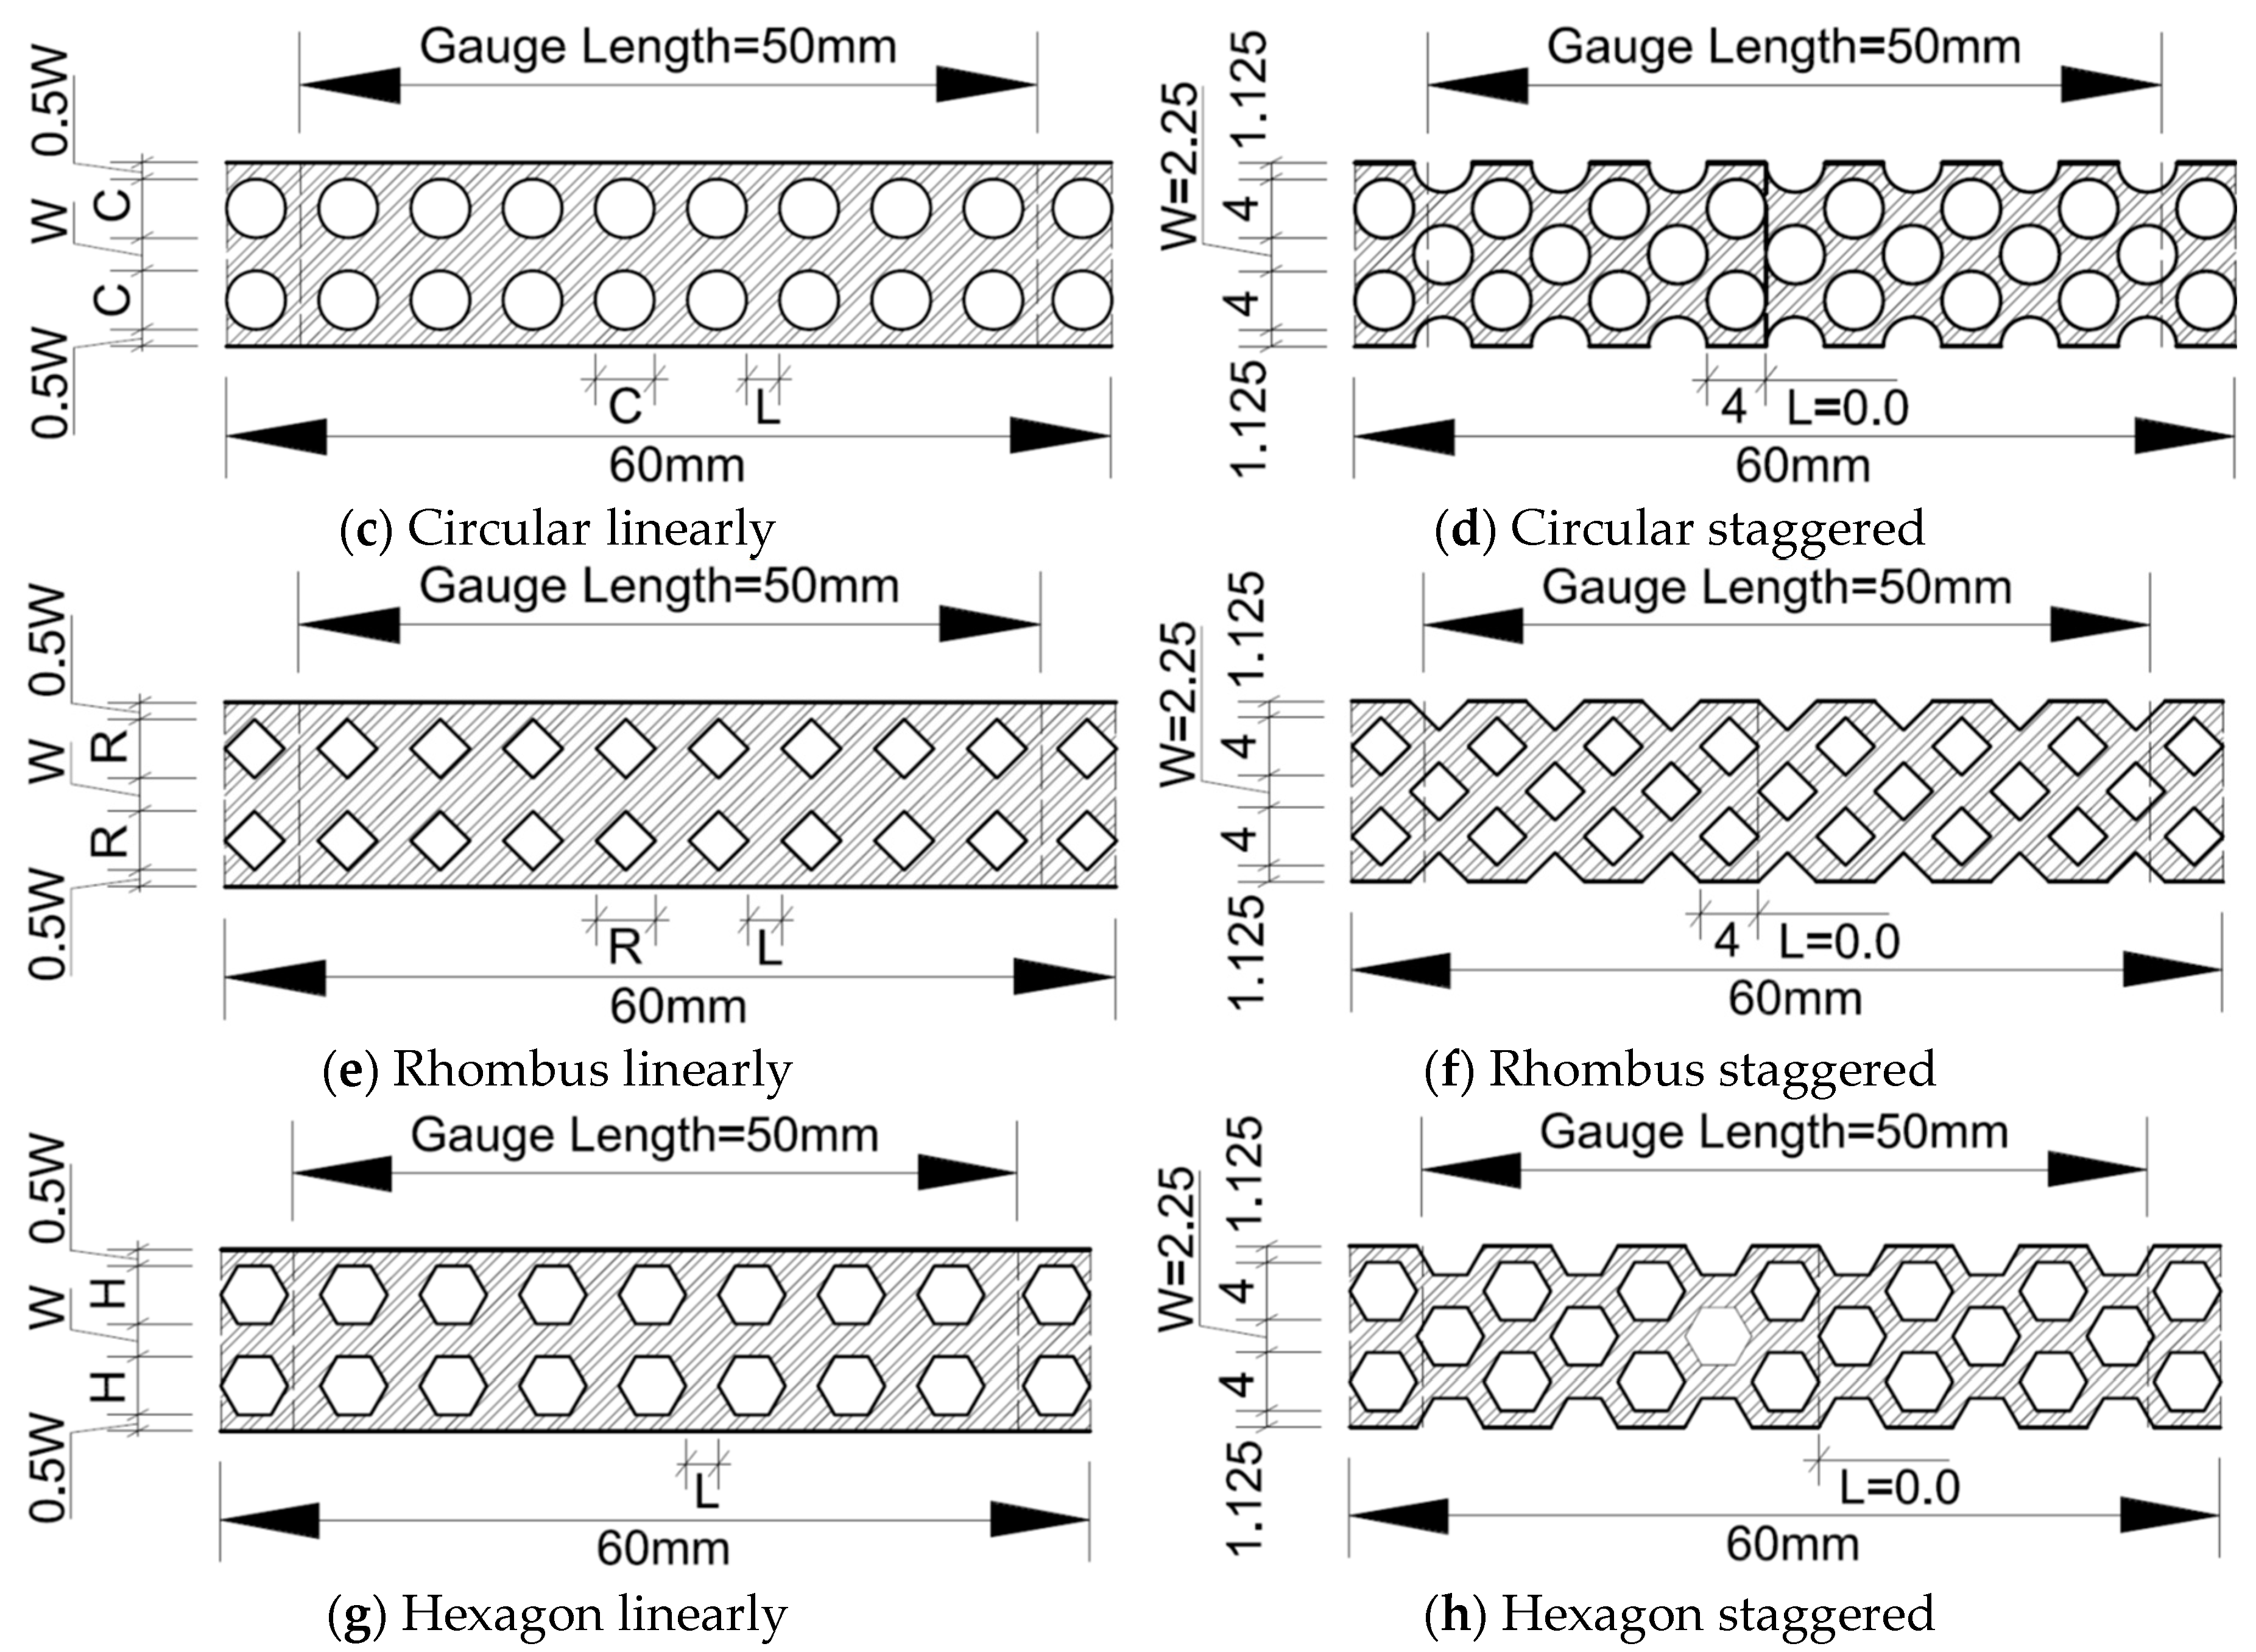
The numerical FE simulation was carried out on fifty-six steel sheets specimens with variable geometrical thicknesses and different perforated shapes and sizes considered in the present research. Four of these specimens are controlled specimens and without any being perforated. The fabrication dimensions of the tensile fifty-two specimens different perforated shapes and sizes were in accordance with a standard specimen steel sheet [1], as shown in Figure 4. For the specimen, four thickness measurements and four different perforated shapes took at different locations are illustrated in Table 1.
3. Experimental and Numerical Results and Discussion
3.1. Experimental Results and Comparison with FE Analysis
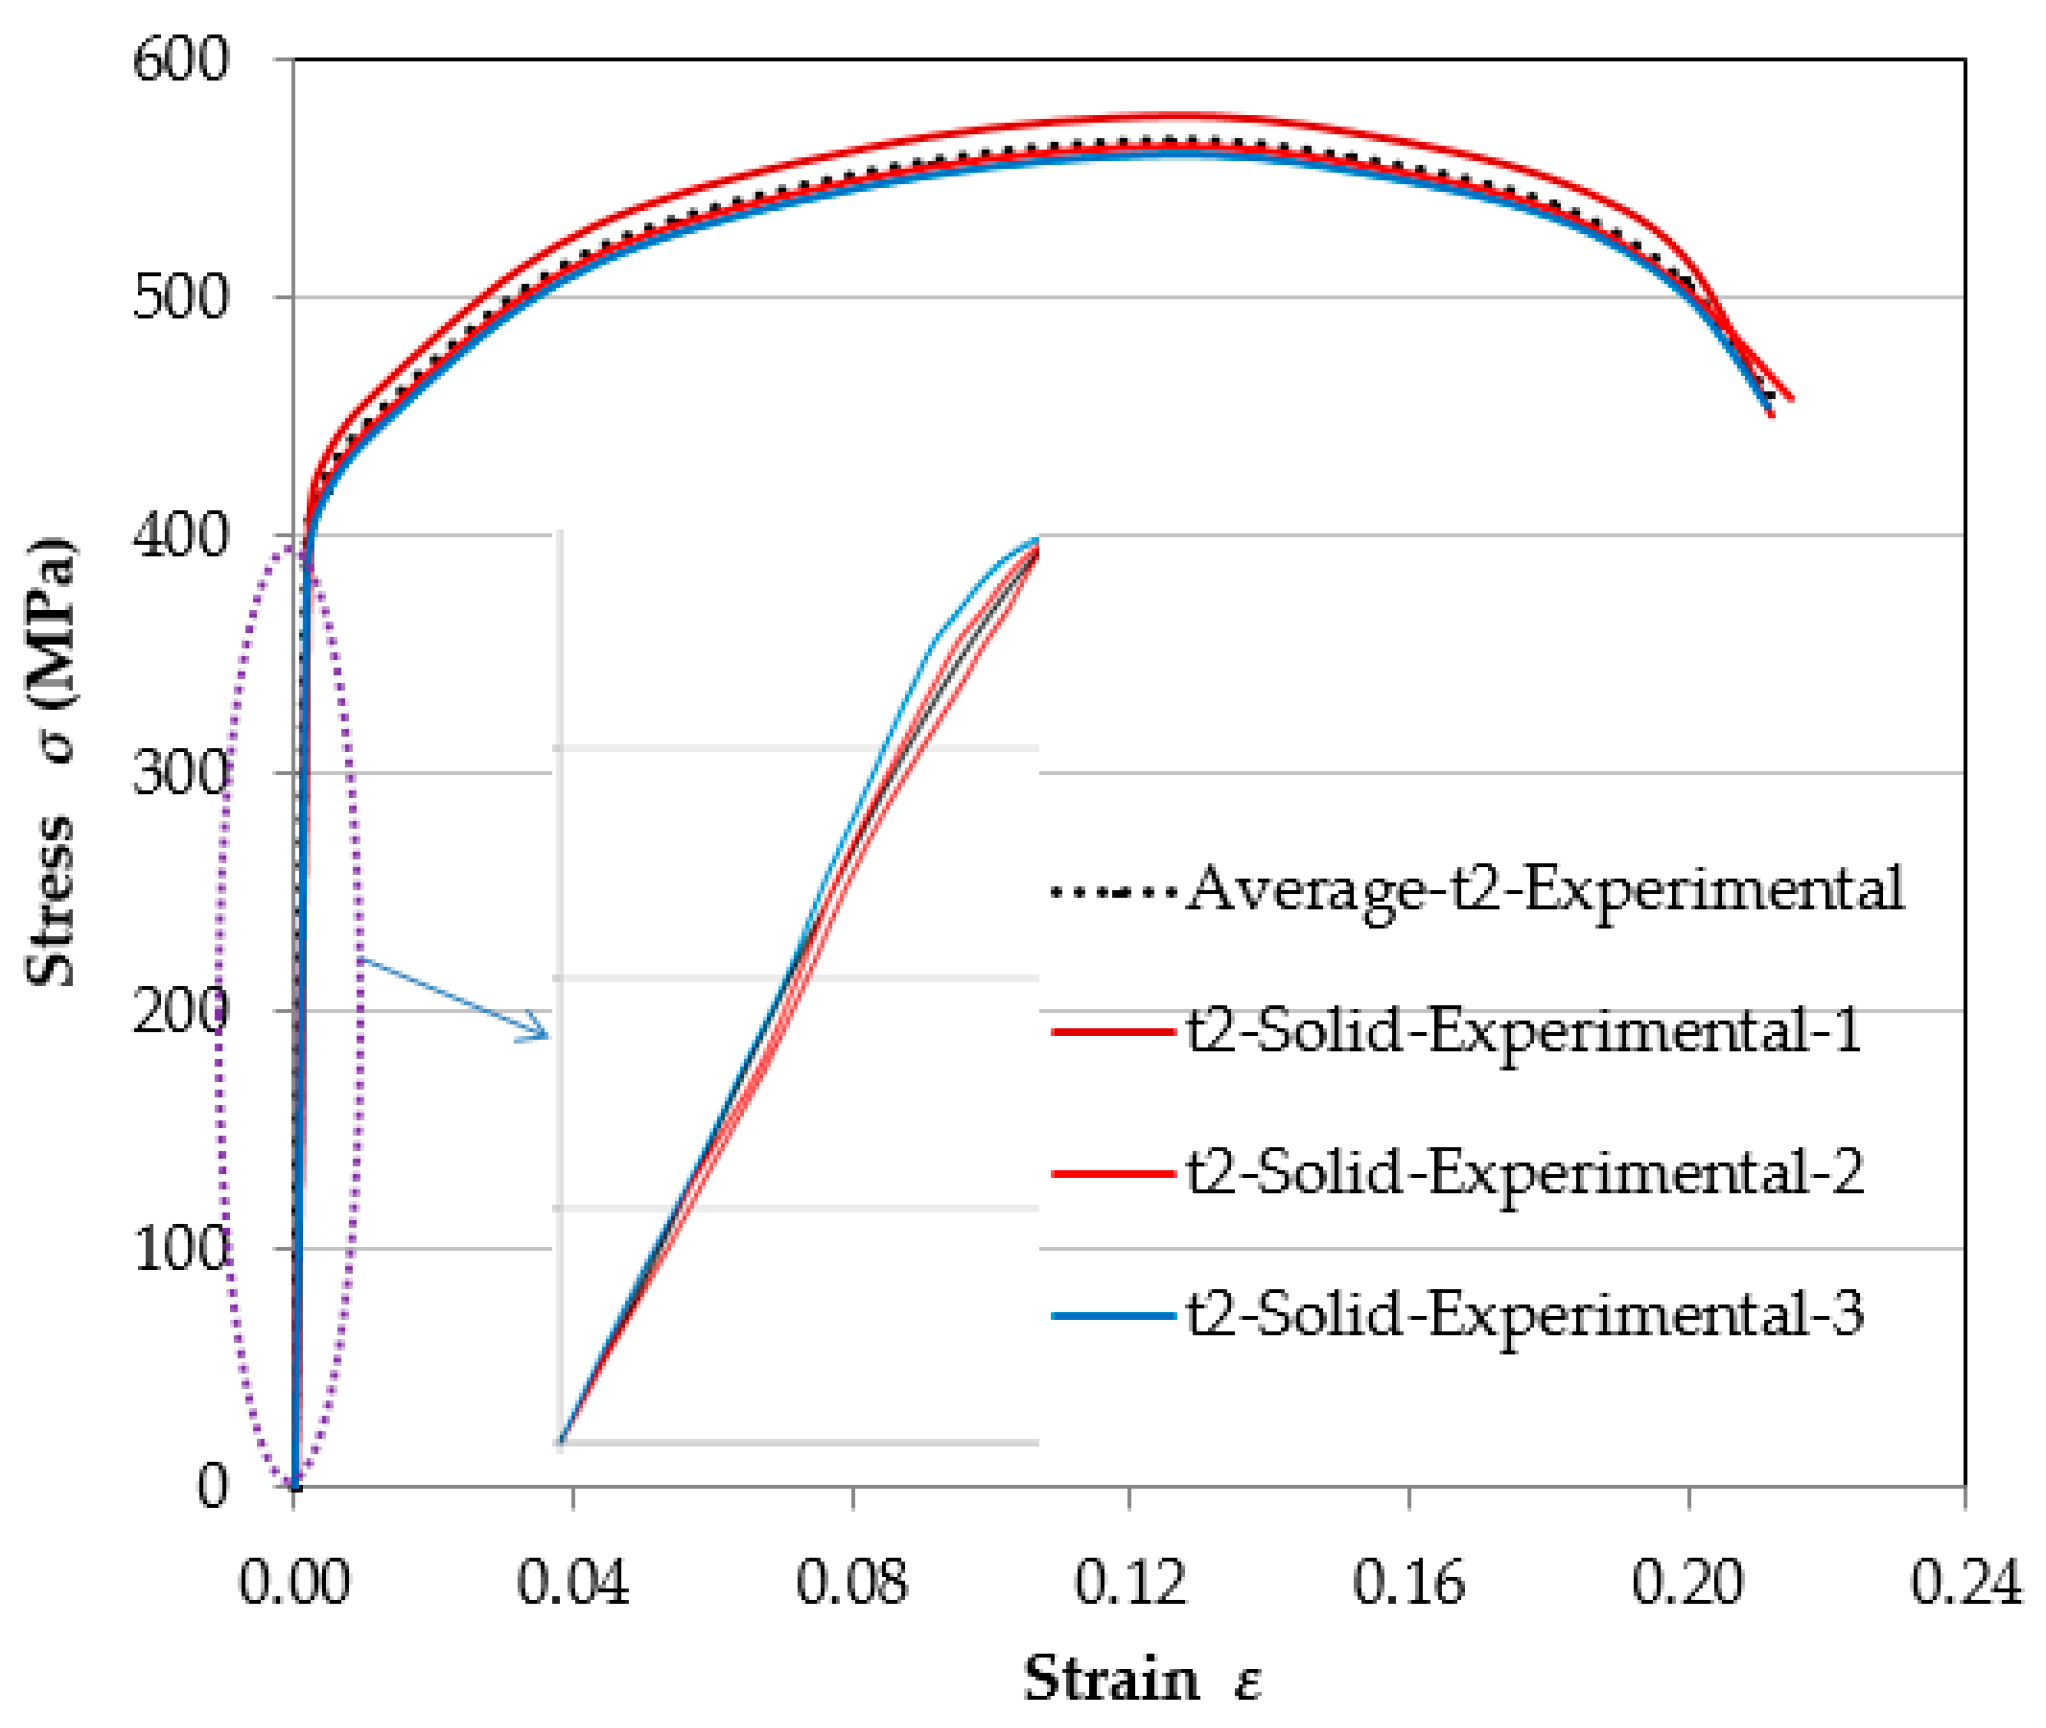
Figure 5 presented the stress-strain engineering relationships obtained from the experimental tests. As illustrated from this figure, consistent results were obtained for three identical experimental specimens. To examine the reliability and validity of the FE simulation, an extensive verification process was carried out using the experimental data results. Table 2 summarizes the mechanical and engineering properties established from the experimental solid specimen’s standard tensile tests. The average proportional limit stress σpl and ultimate stress σu are 397.33 MPa and 565.51 MPa, respectively, and the average ultimate strain εu is 0.1253 and the average modulus of elasticity is 203.76 GPa.
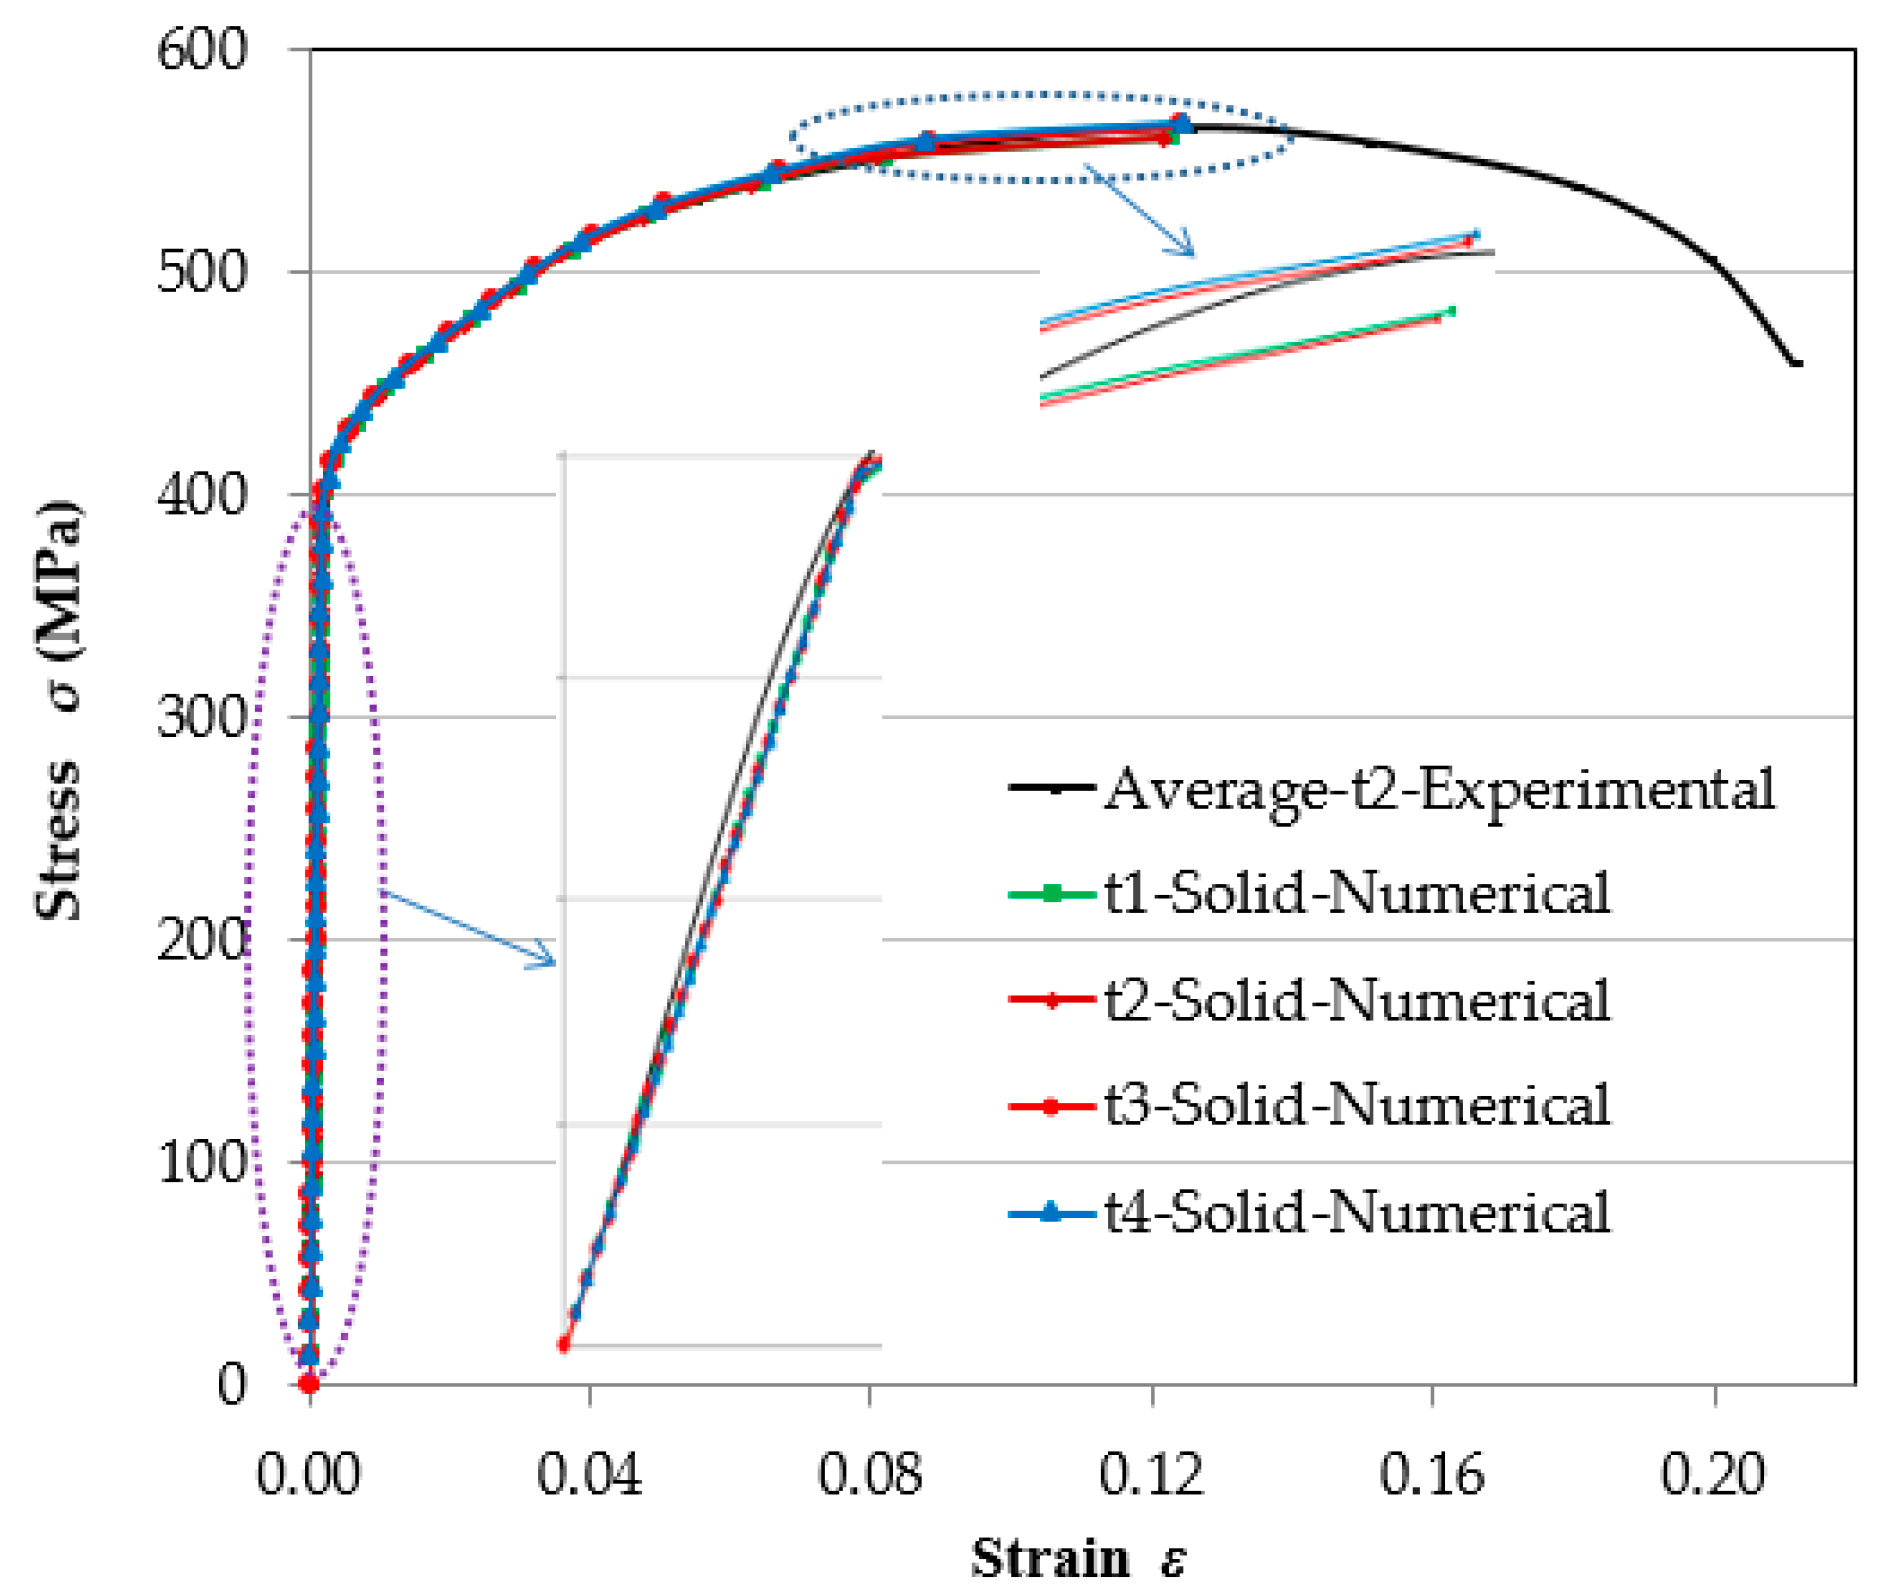
The mechanical properties established from both experimental and numerical FE results with the ratios between them are shown in Table 2. The mean values of the proportional limit stress σpl Exp./σpl.FE is 1.02 and the modulus of elasticity EExp./EFE. is 1.00, and the ultimate stress σu. Exp./σu.FE is 1.003 and the ultimate strain εu. Exp./εu.FE is 1.016. These values show that, from a statistical perspective, the FE simulation has high accuracy that can be observed for all engineering properties that were considered in the analysis.
Figure 6 shows the curve showing how the engineering stress-strain relationship for specimens used on the resultant FE modeling and the experimental test. When comparing the curves of the engineering stress-strain attained from the FE simulation with the ones attained from the experimental test for steel sheets that are not perforated, we can note an excellent match between them.
3.2. Comparison of Different Perforated and Solid Steel Sheets based on FE Analysis
The outcomes shown in the following segments are expressed relating to stress-strain engineering relationships, proportional limit stress, modulus of elasticity, ultimate stress and ultimate strain.
3.2.1. Stress-Strain Engineering Relationships
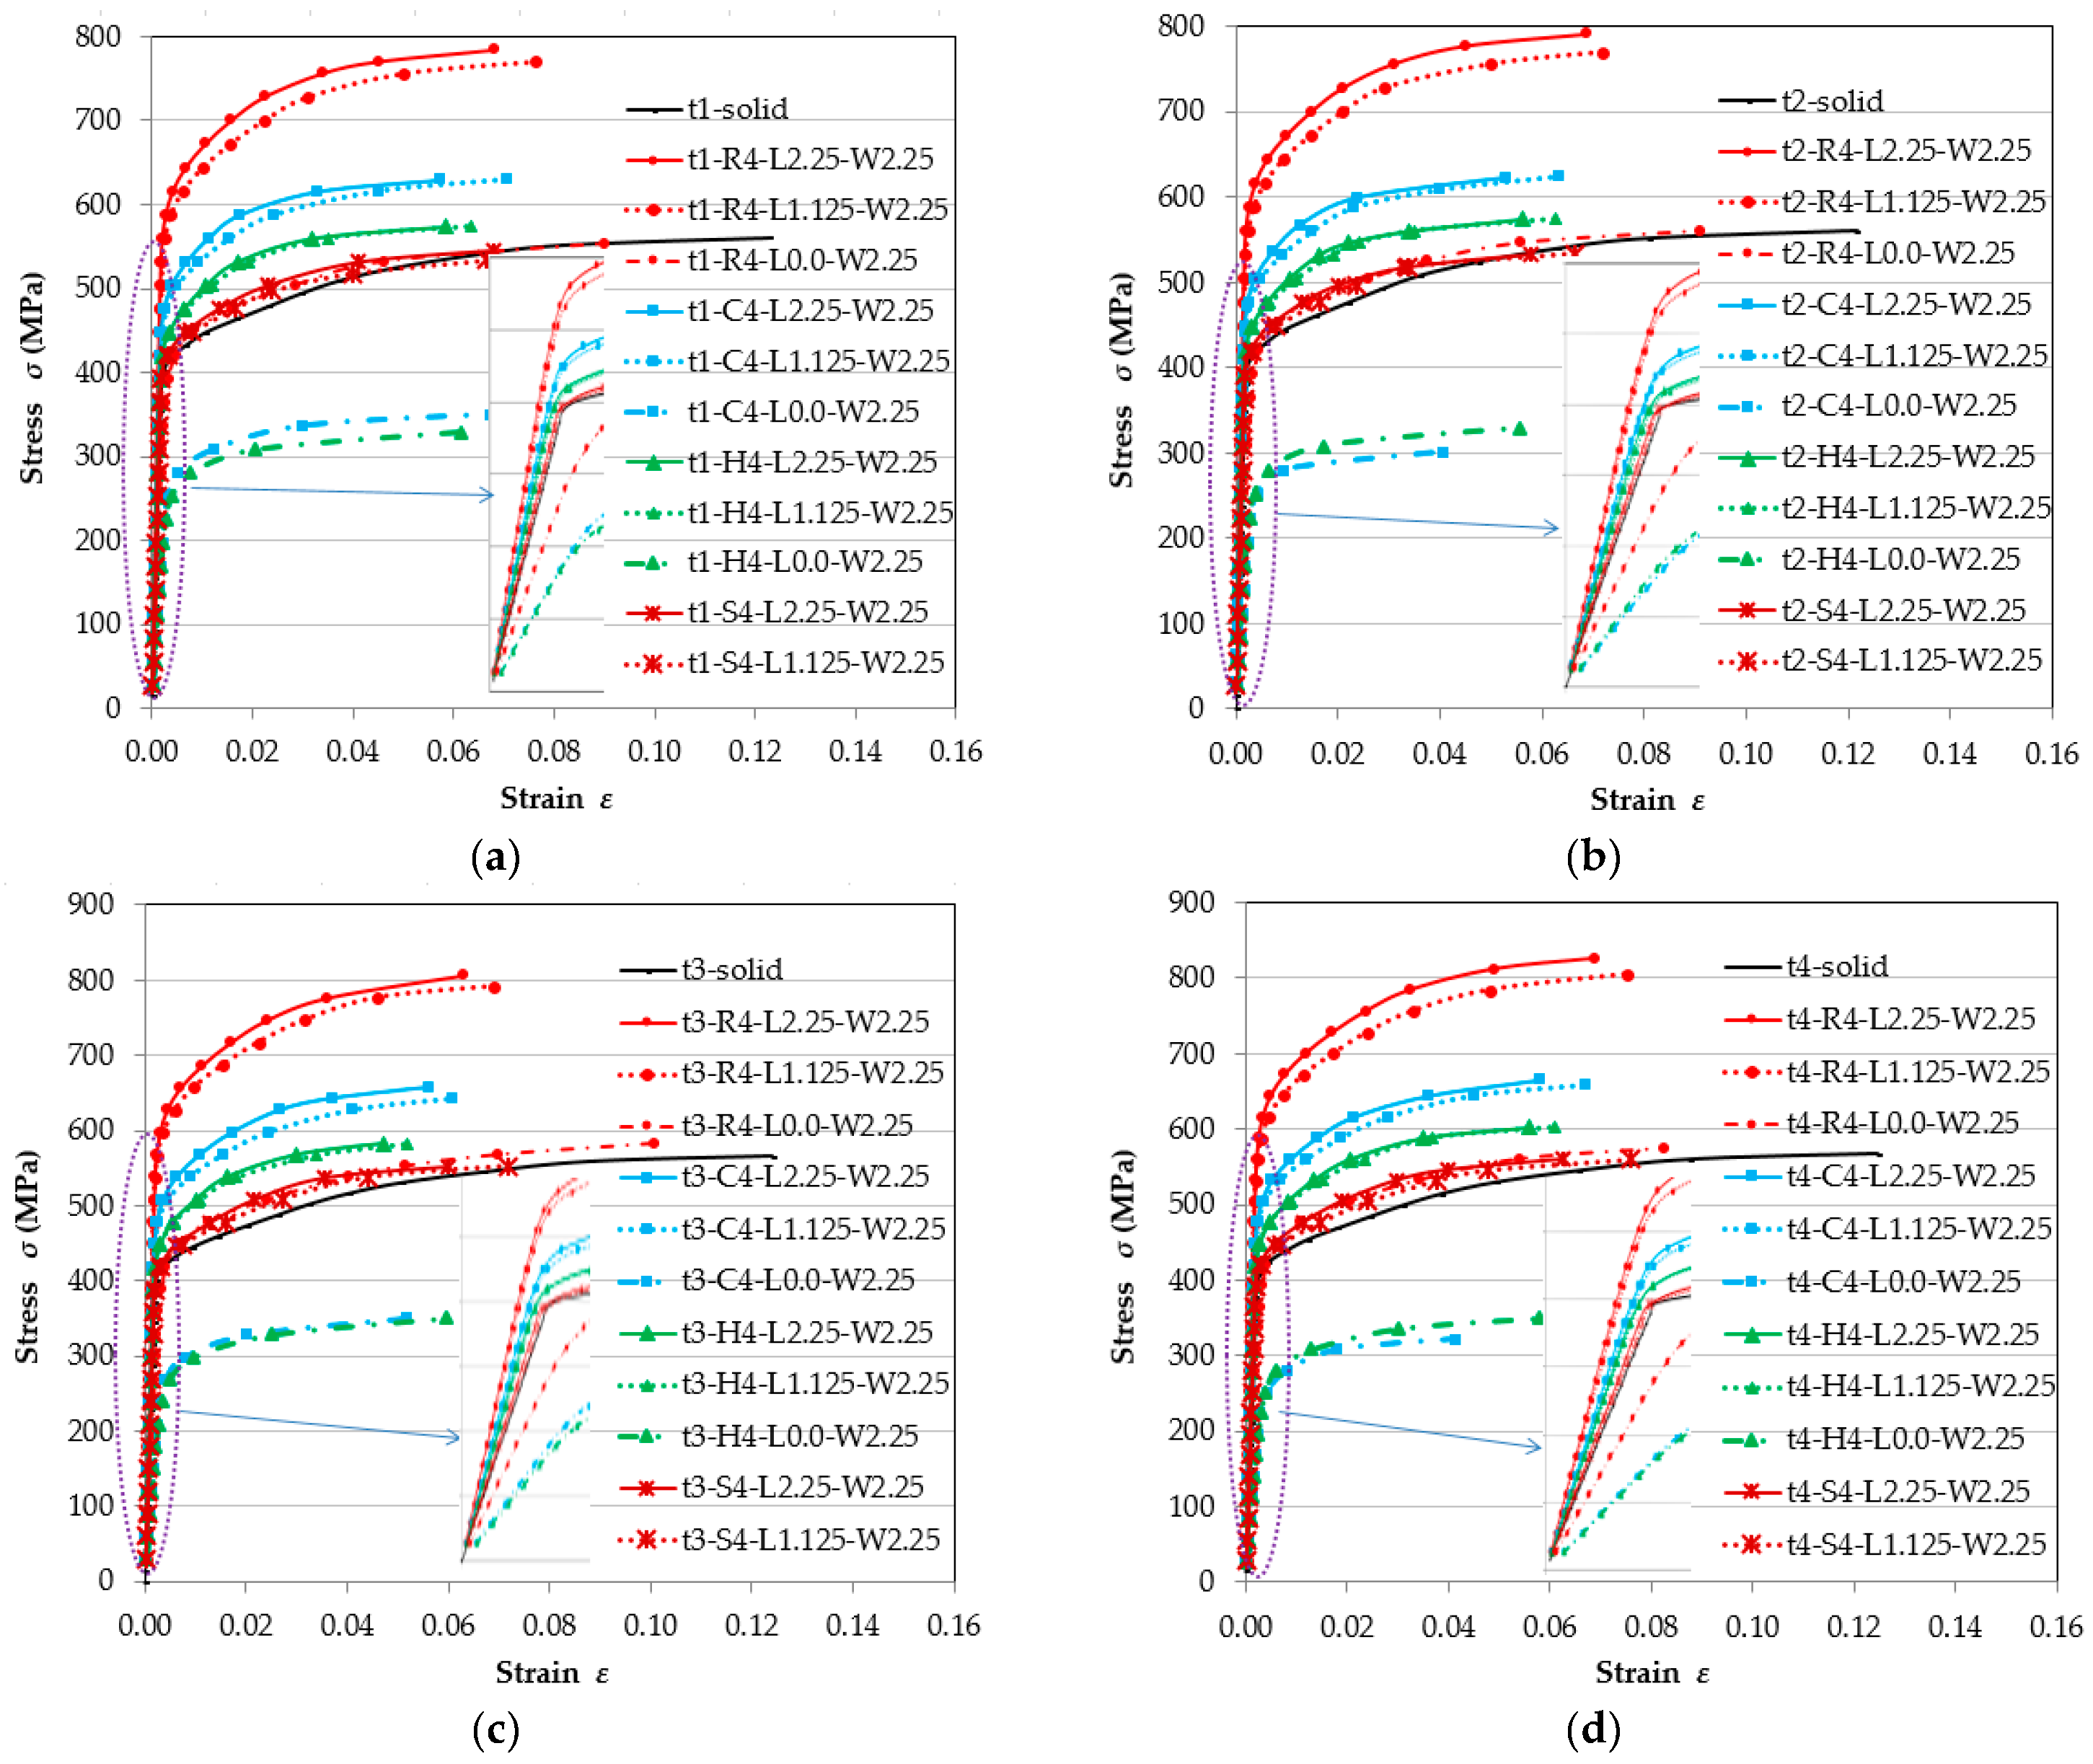
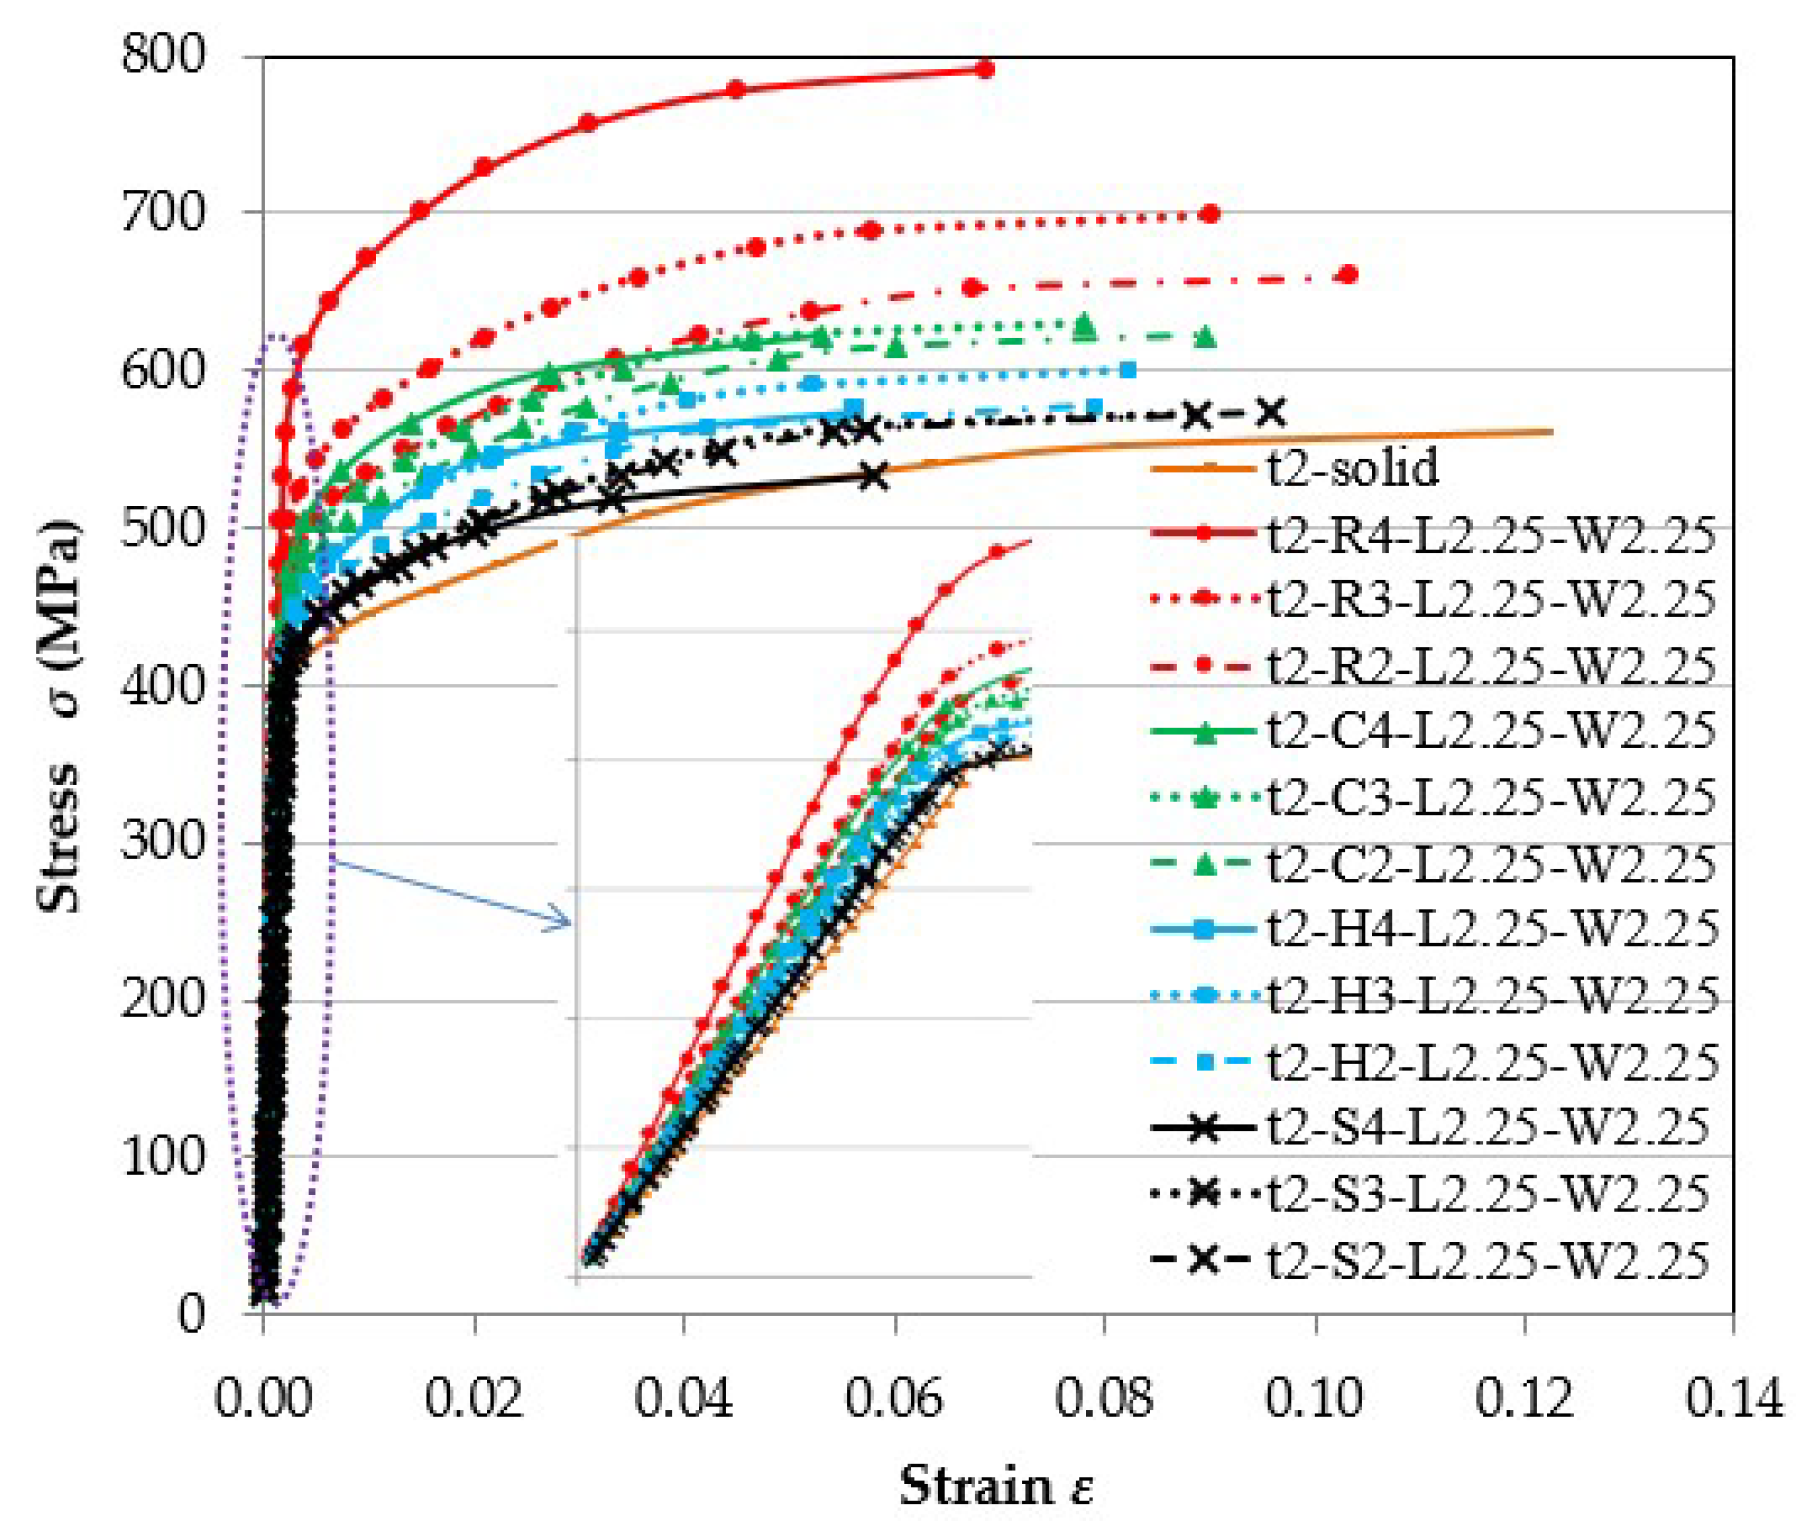
The relationships between engineering-stress established using the tensile applied load with the original critical cross-section area and engineering-strain established using the elongation with the original gauge length of the tested specimens are presented in Figure 7. Generally, the engineering-stress at any level for perforated steel sheets is bigger than that of control solid steel sheet at the same engineering-strain without that having staggered perforated shapes with L = 0.0. However, the maximum measured values of yield and ultimate stresses for steel sheets that have a Rhombus perforated shapes for any longitudinal distance. The Circular perforated shapes are second-ranked and the Hexagon perforated shapes are third-ranked. But for Square perforated shapes, the difference between them and the solid steel sheet is very small, as demonstrated in Figure 7. It is avowed from the figure that by changing the steel sheets perforated shapes, the maximum measured values of yield and ultimate stresses capacity also changes. This is ascribed to a change in the longitudinal direction, there is a reinforcement between the perforated shapes and the load is in the axial direction of the tensile sample. But in the case of staggered perforated shapes with L = 0.0 the load comes in two directions and with an inclined angle on the direction of the longitudinal of the tensile direction. The rate and value of the decrease differ between the control steel sheets specimens and other tested perforated shapes, as can be seen in Table 3.
3.2.2. Pattern of Maximum Ultimate Stresses
The pattern of maximum ultimate stresses that was observed for steel sheets for the different specimen’s series is presented in Figure 8. For all the tested perforated steel sheets that are linearly perforated, the maximum ultimate stress was observed at the critical cross-section area that passes through the smaller specimen’s width at the bigger perforated size. For all the tested perforated steel sheets that have a staggered perforation, the maximum ultimate stress was observed at the critical cross-section area that passes through two full perforated holes.
3.2.3. Influence of the Perforated Sizes
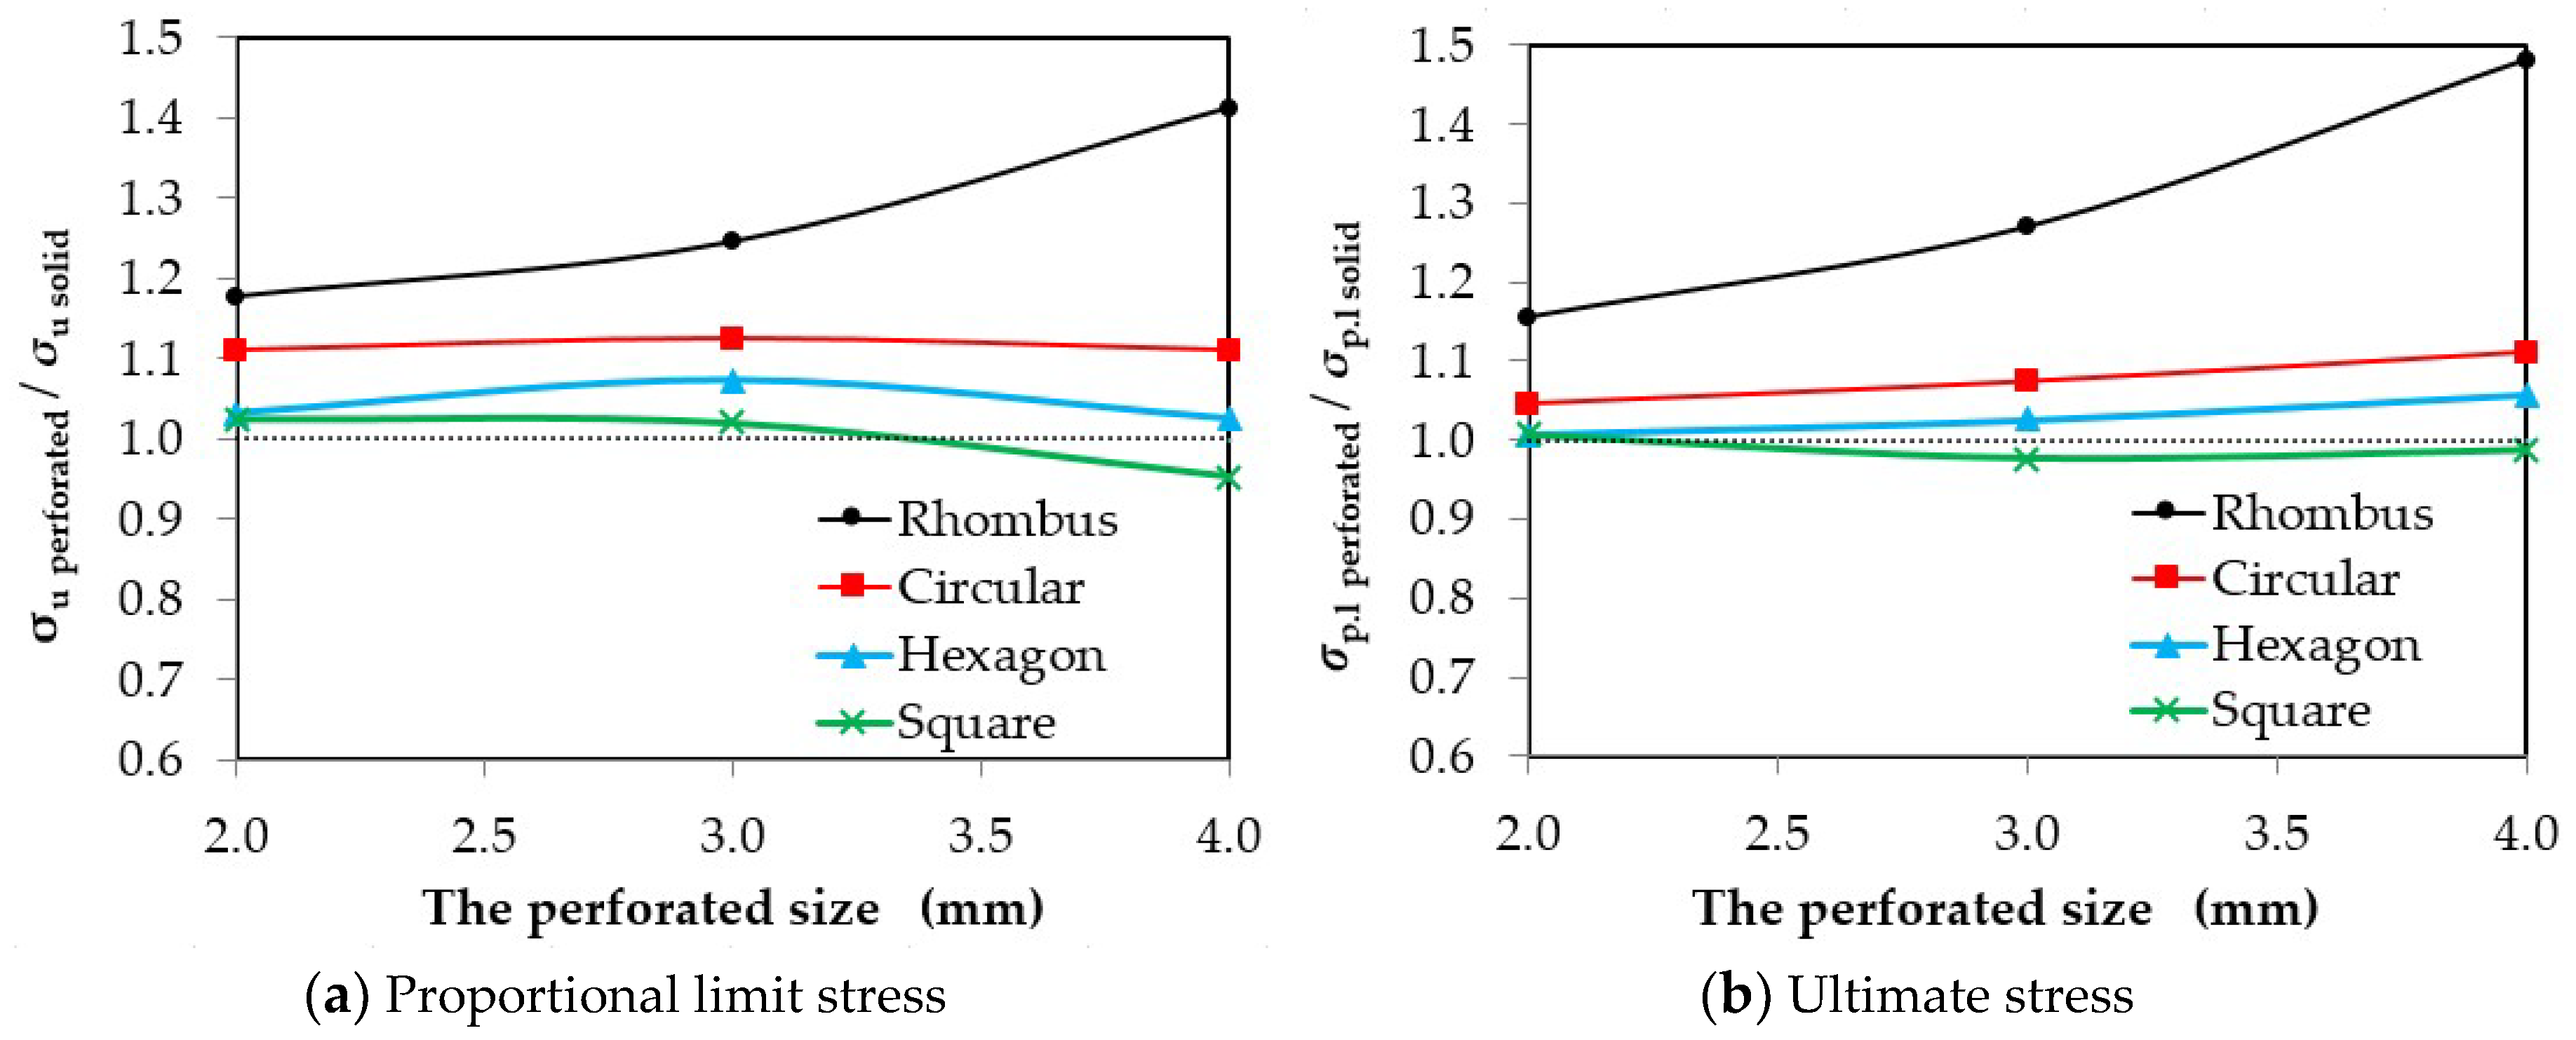
The perforated sizes are a significant feature that straightaway influences the stress-strain engineering relationships of the steel sheets. From Figure 9, it can be observed that in the first place, the perforated rhombus sizes have the biggest effect on stress-strain engineering relationships. Secondly, it shows the perforated circular and hexagon sizes. But in perforated square sizes, the figure finds that there is no observed difference in the proportional limit stress, and for the ultimate stress, it gives the opposite effect. It can be concluded that the effect of the perforated rhombus sizes is greater than the others, and the perforated square sizes have no effect, as shown in Figure 10.
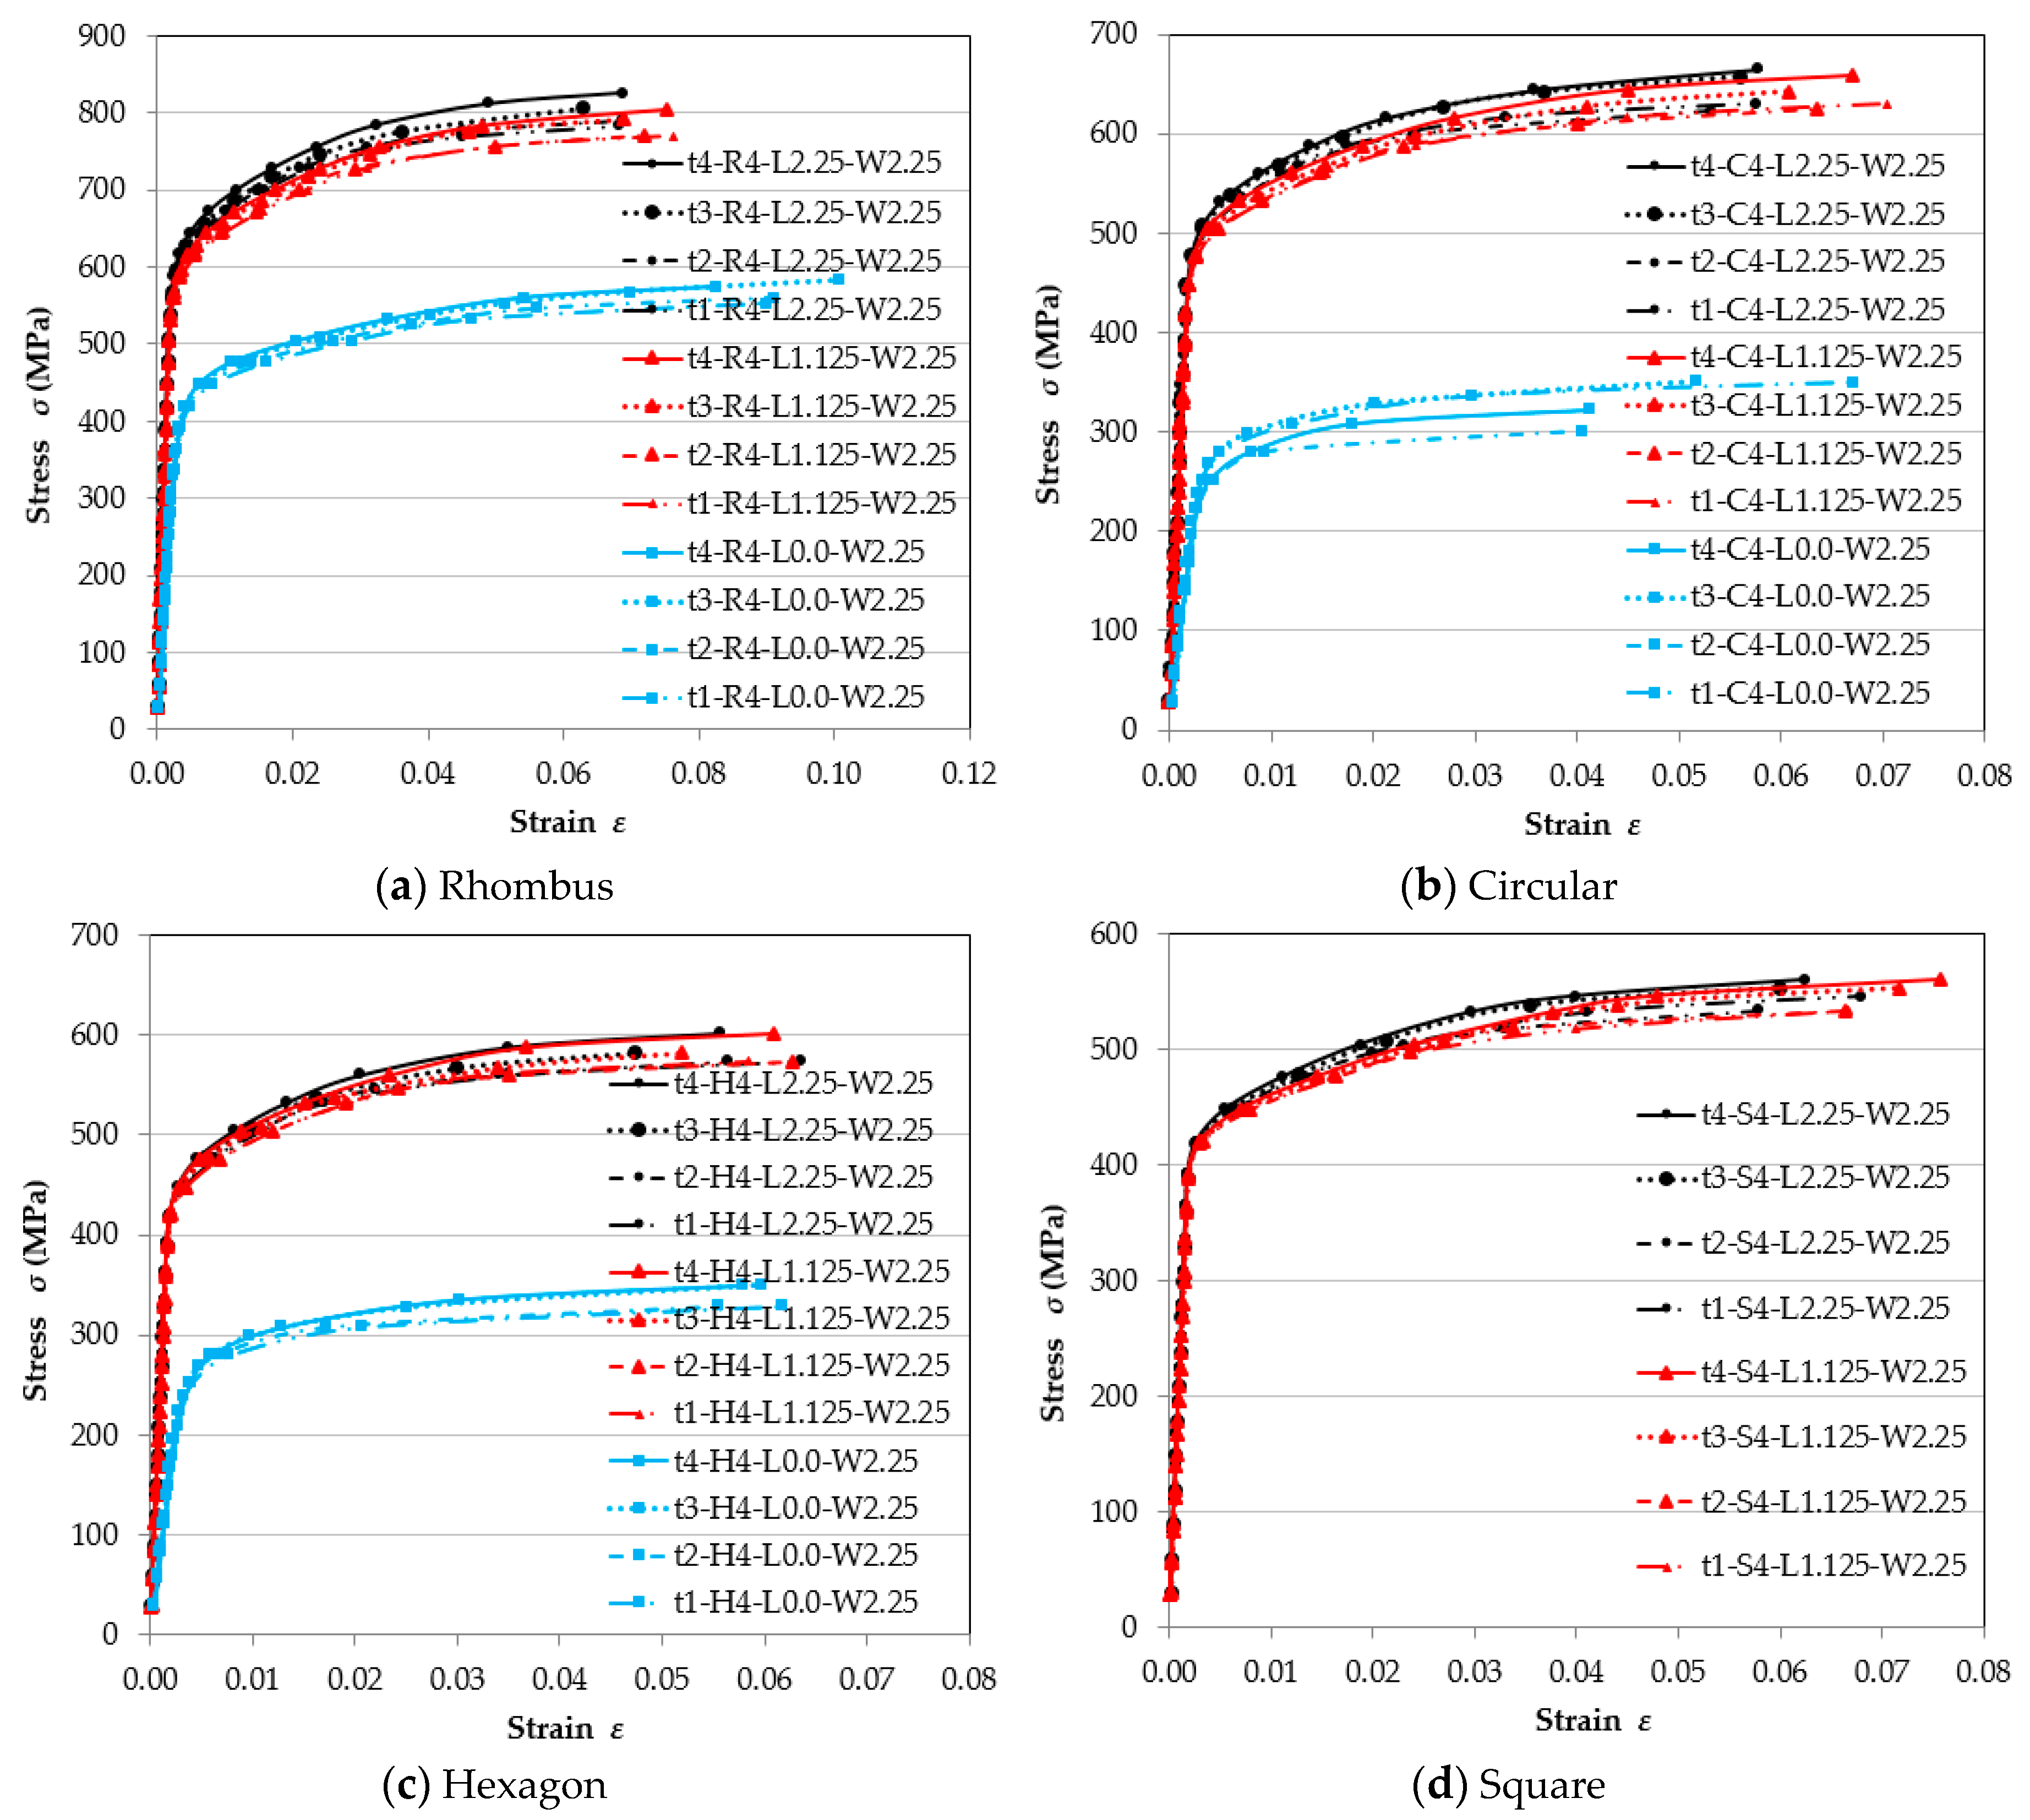
3.2.4. Influence of the Perforated Steel Sheets Thicknesses
3.2.5. Influence of the Distance between Perforated Shapes
- For stresses: The results obtained indicate that the effect of the perforated staggered shape on the stresses has the opposite effect, as it reduces the stress and the percentage of the decrease in the amount of stresses from the control specimen was measured and found that for the circular and hexagon shapes, the average proportional limit stresses are 60.1% and 60.1%, respectively, while the average ultimate stresses are 58.7% and 60.3%, respectively. However, it was observed in the perforated rhombus shape that the ratio was not less than the control specimen but did not improve the properties of the steel sheet where the ratios were found to be 103.8% and 100.6% for the average proportional limit and ultimate stresses, respectively.
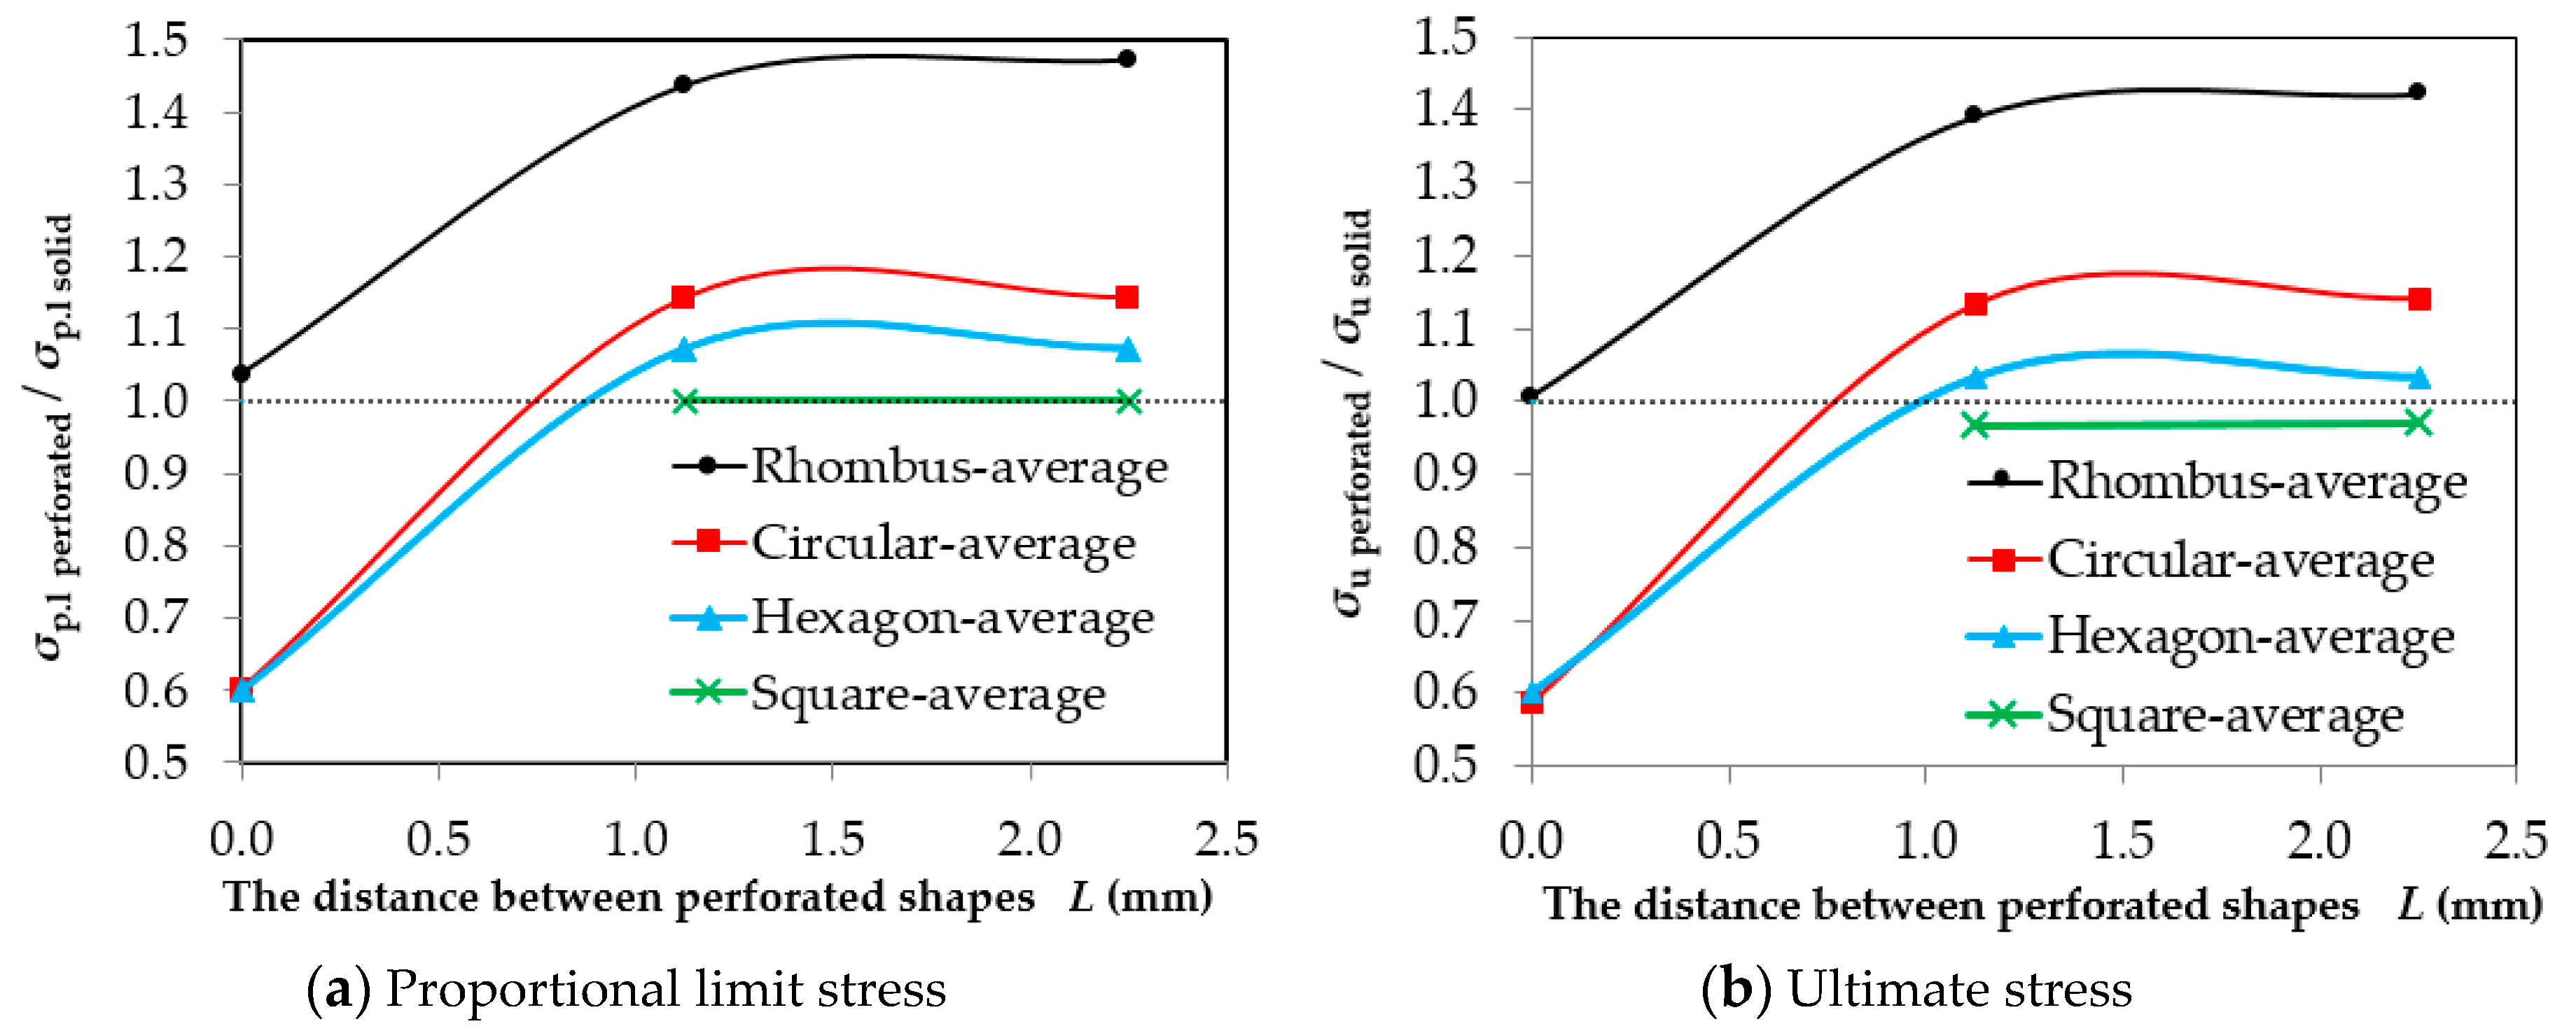
As for the shape of the linear distribution, the effect of the distance between the shapes was not very significant. The percentage of increase in the amount of stresses increased with the distance for the rhombus shape from 143.8% to 147.3% and 139.1% to 142.2% for average proportional limit and ultimate stresses respectively. As for the circular, hexagon and square shapes, the effect of the distance between the shapes almost nonexistent, because the rate of increase was not observed as shown in Figure 12.
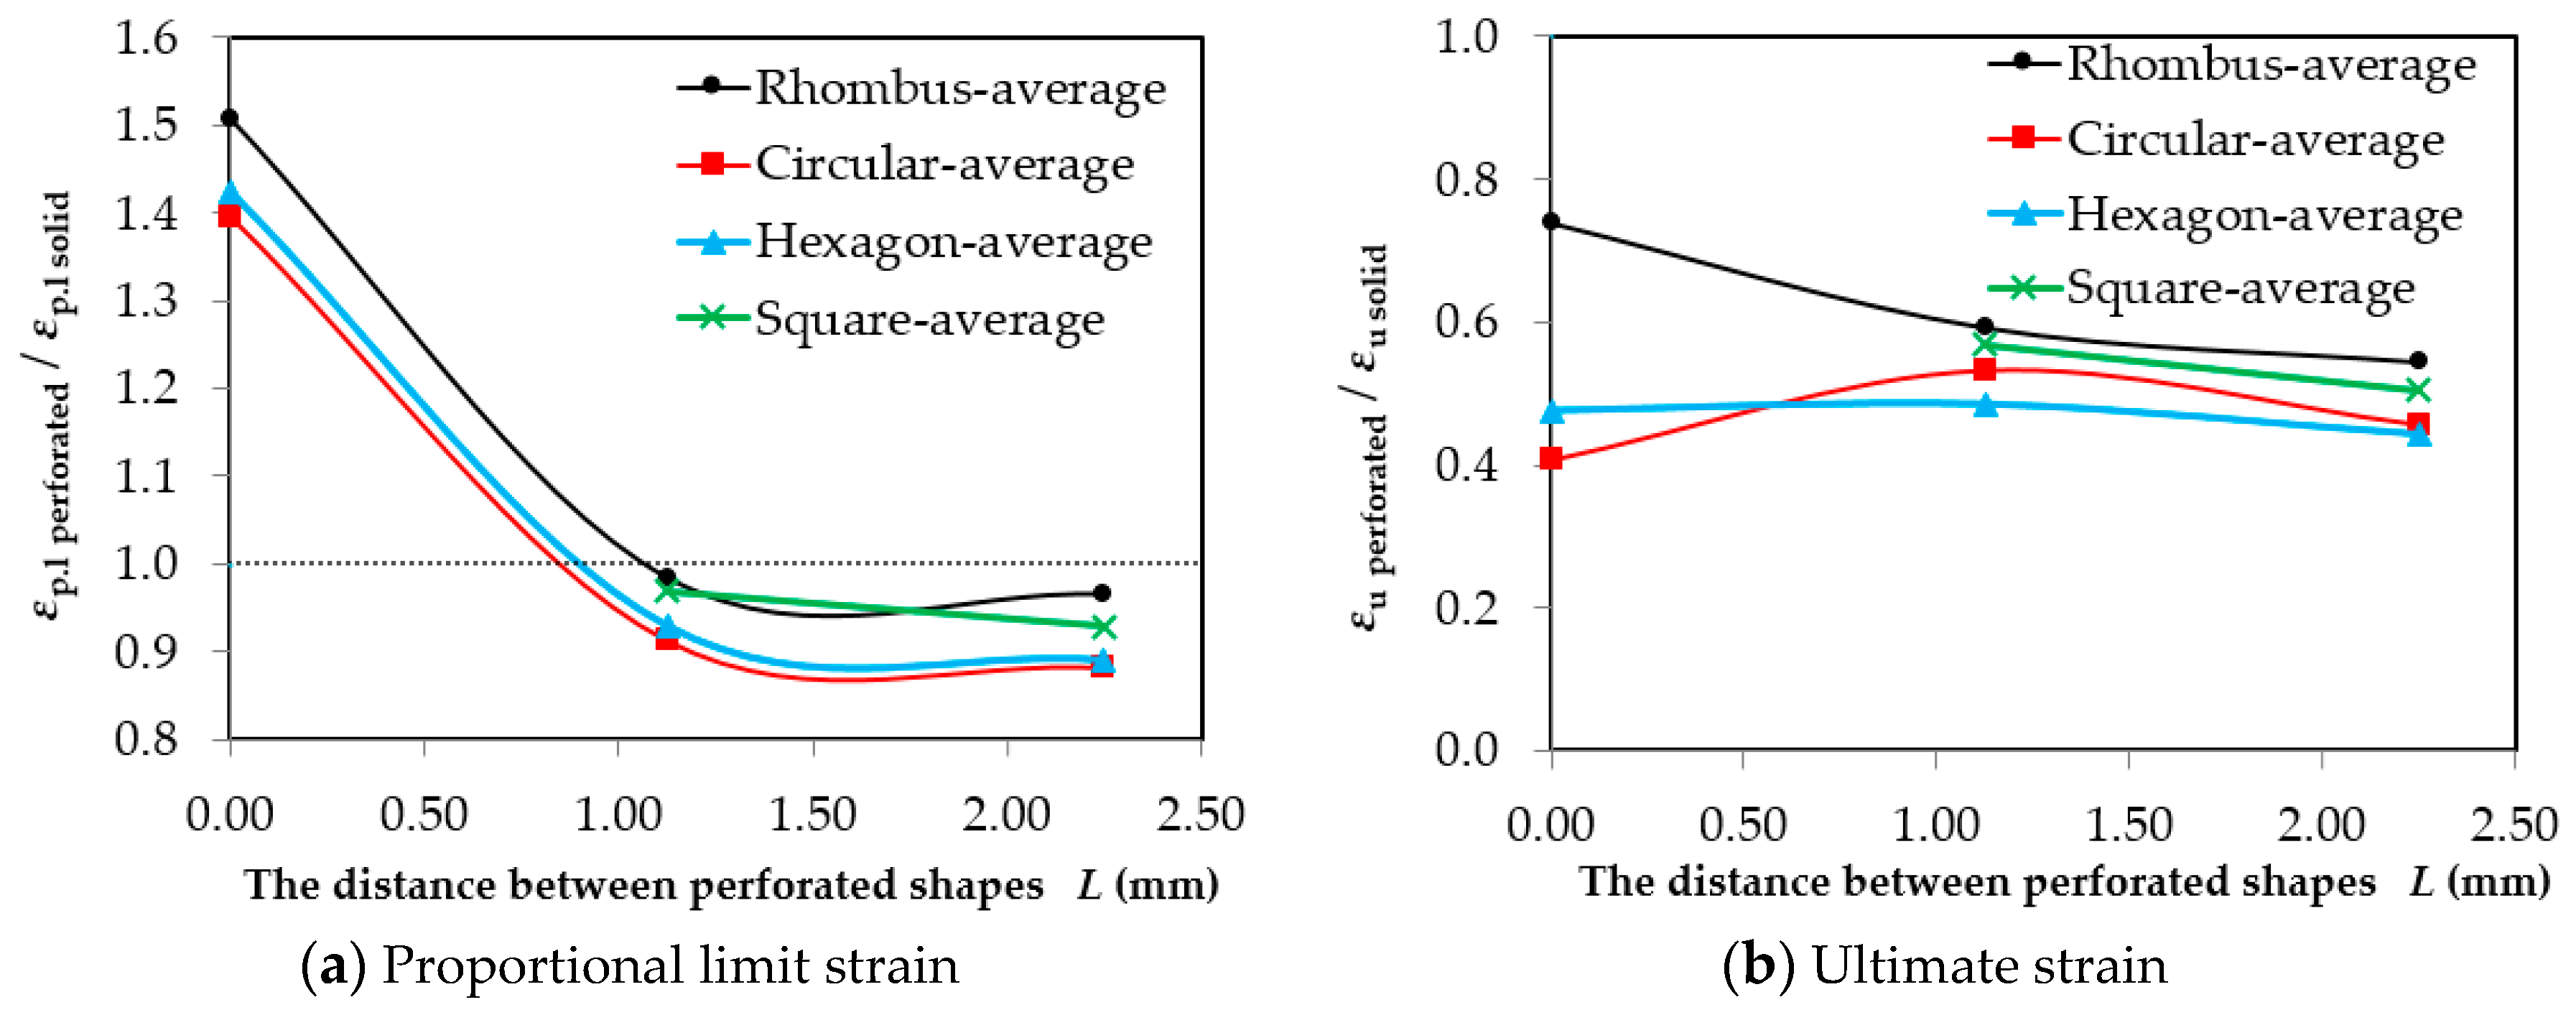
- For strain: The results obtained indicate that the effect of the perforated staggered shape on the proportional limit strains has a positive effect, as it increases the strain and the percentage of the increase in the amount of strain from the control specimen was measured and found for the rhombus, circular and hexagon shapes, which showed average proportional limit strains of 150.8%, 139.6%, and 142.5% respectively. However, it was observed that the ultimate strains have the opposite effect as it reduces the strain. The percentage of the decrease in the amount of strain from the control specimen was measured and found for the rhombus, circular and hexagon shapes, where the average proportional limit strains are 73.9%, 40.7%, and 47.6% respectively.
As for the shape of the linear distribution, the effect of the distance between the shapes has the opposite effect as it reduces the strain. The percentage of decrease in the amount of strains increased with the distance for the rhombus shape from 98.5% to 96.6% and 59.3% to 54.5%, for the circular shape from 91.3% to 88.2% and 53.1% to 45.6%, for the hexagon shape from 93.0% to 89.1% and 48.5% to 44.2%, for the square shape from 96.9% to 92.9%, and from 56.8% to 50.4% for the average proportional limit and ultimate strains respectively, as shown in Figure 13.
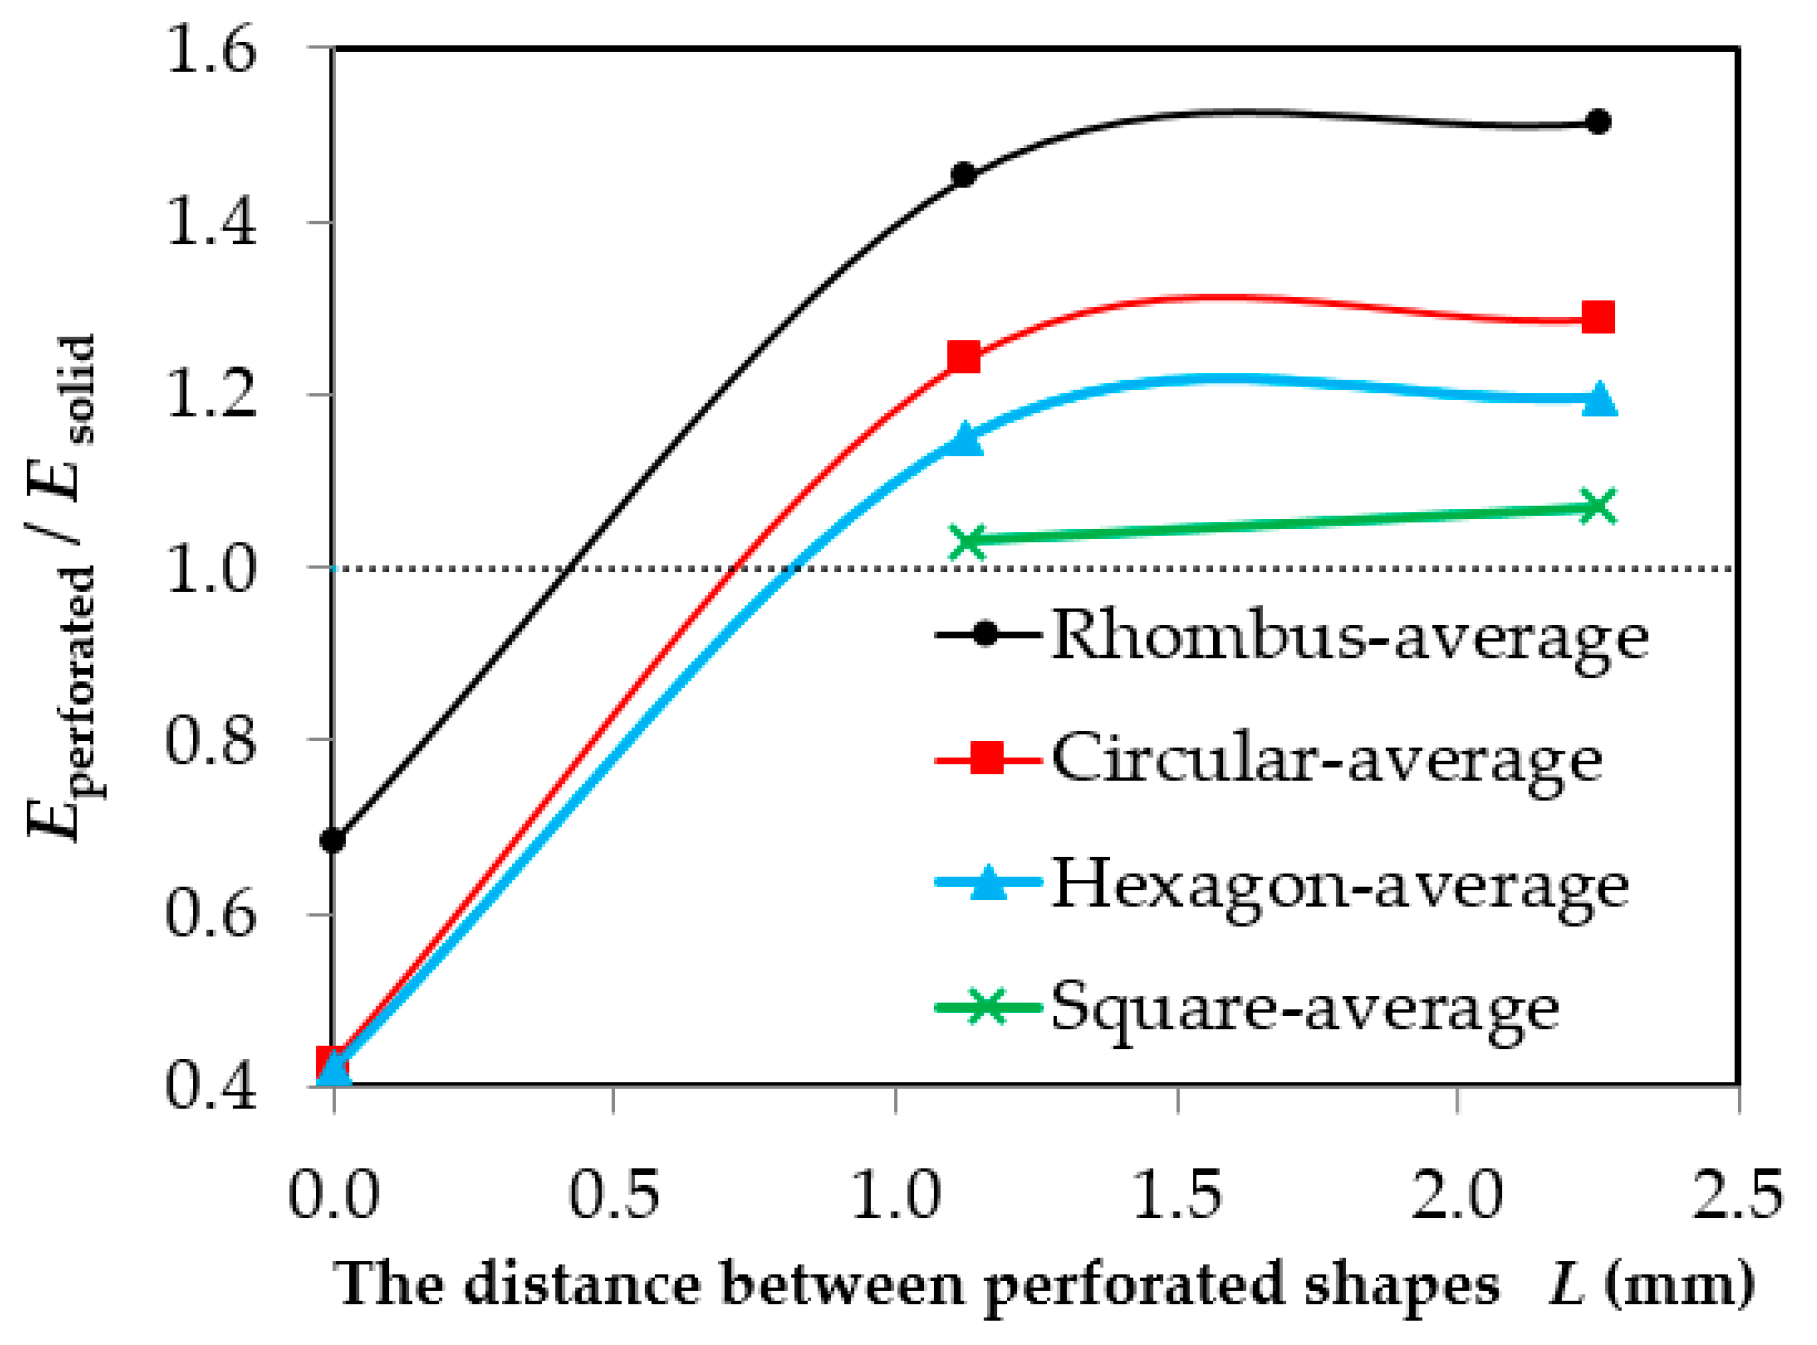
- For the modulus of elasticity: The results obtained indicate that the effect of the perforated staggered shape on the modulus of elasticity has the opposite effect, as it reduces the modulus of elasticity. The percentage of the average decrease in the amount of the modulus of elasticity from the control specimen was measured and found for the rhombus, circular and hexagon shapes to be 68.3%, 42.8%, and 42.1% respectively.
As for the shape of the linear distribution, the effect of the distance between the shapes has a positive effect, as it increases the modulus of elasticity. The percentage of the average increases in the amount of the modulus of elasticity when the distance increases for the rhombus shape from 145.1% to 151.5%, the circular shape from 124.0% to 128.8%, the hexagon shape from 115.0% to 119.6%, and the square shape from 103.0% to 107.0%, as shown in Figure 14.
3.2.6. The Efficiency of the Perforated Shapes with the Actual Net Area
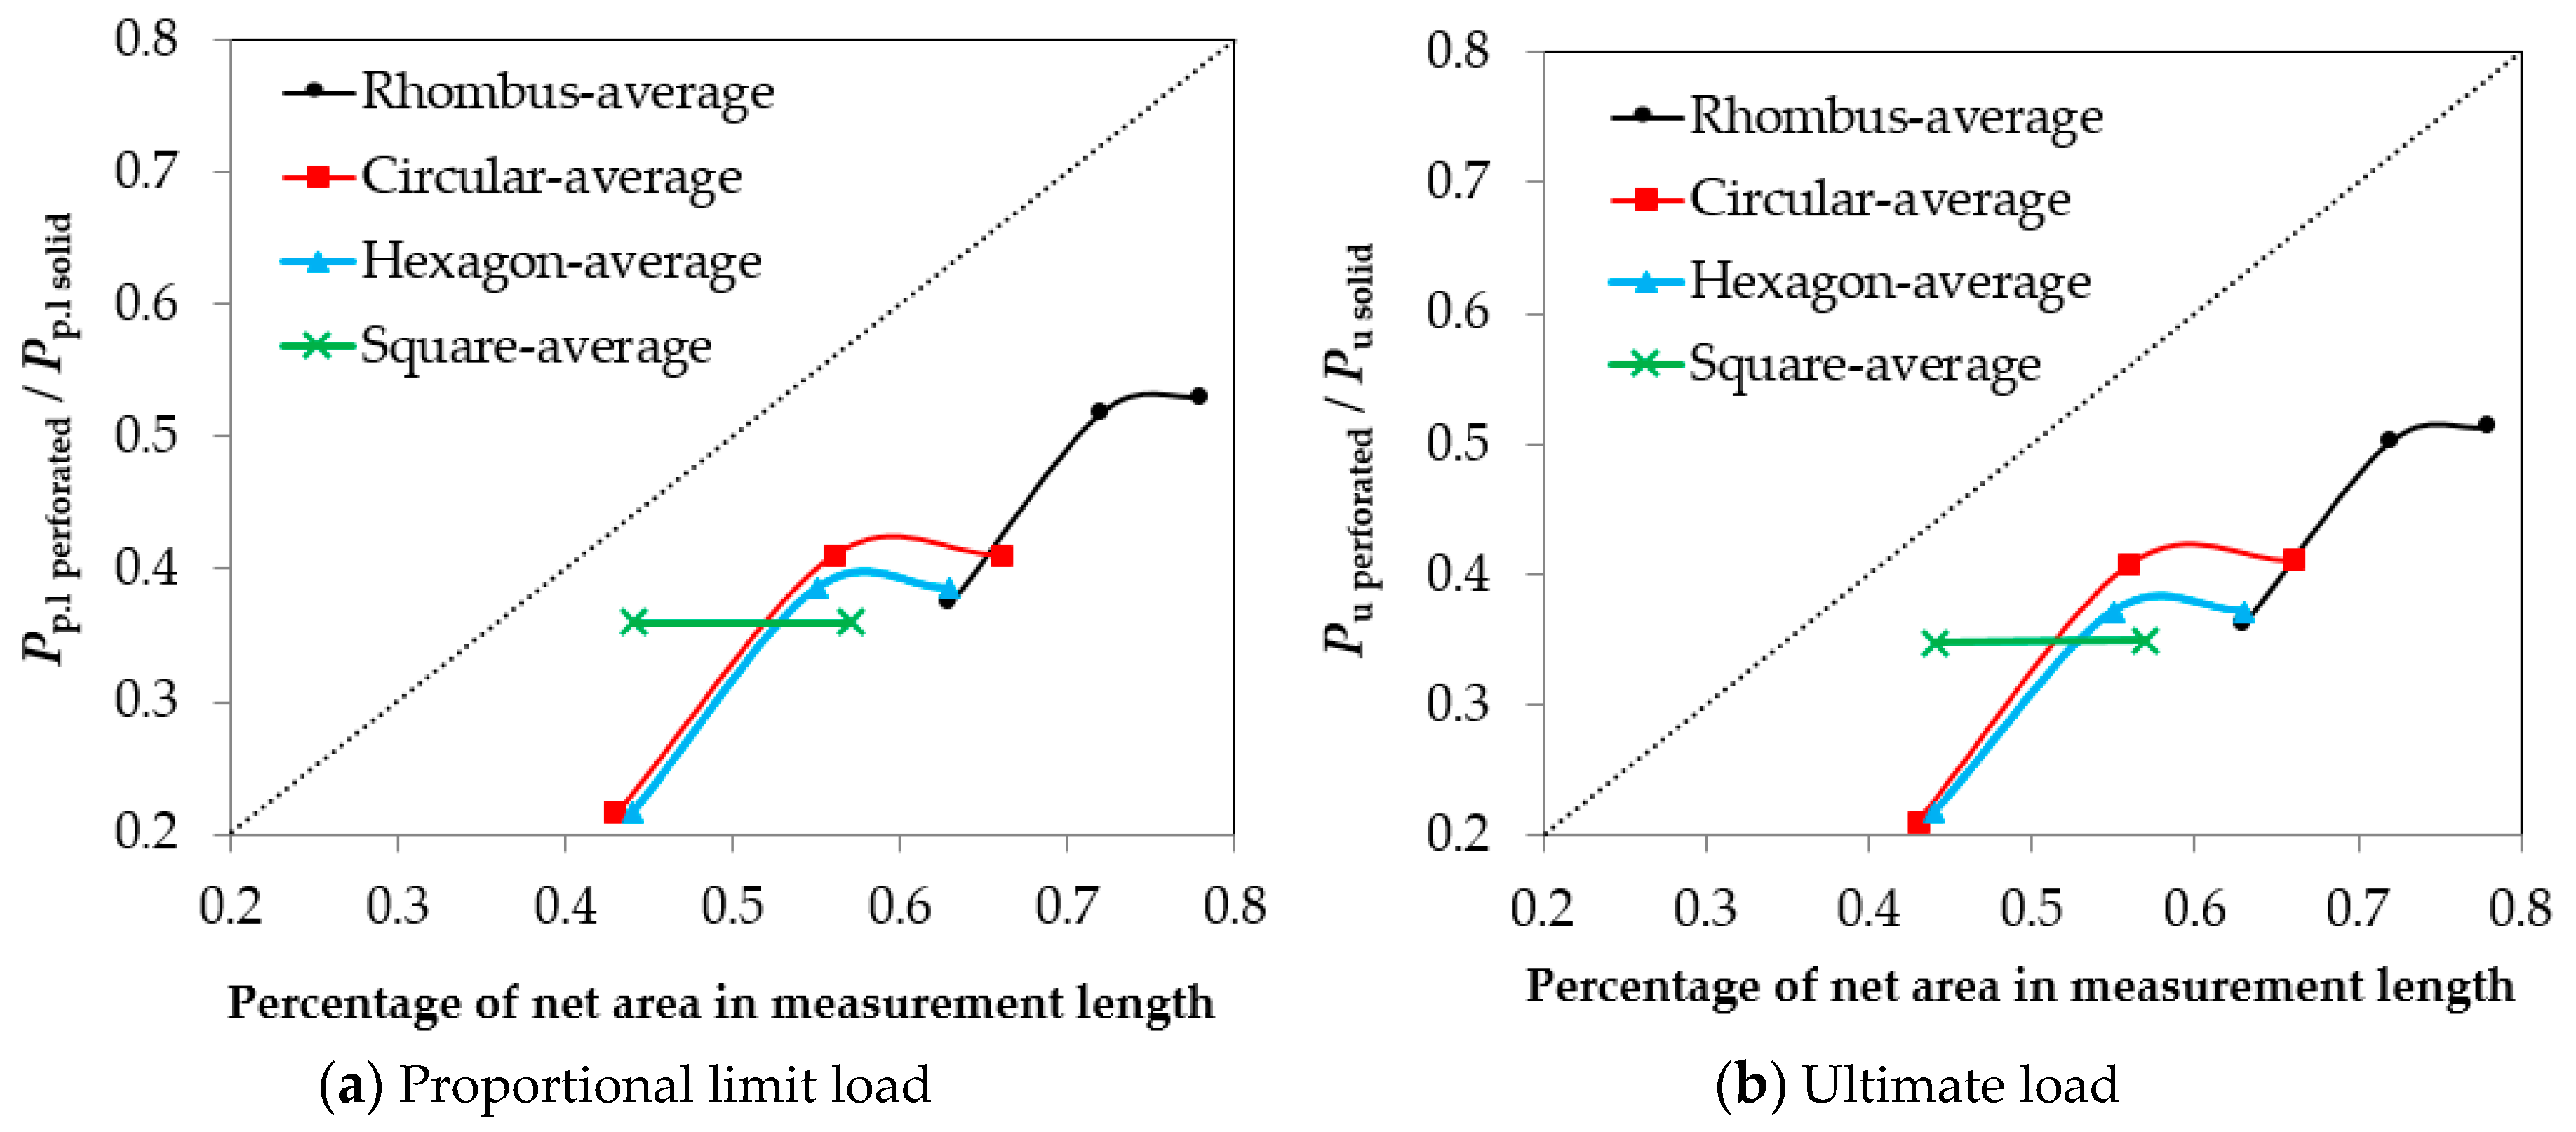
The results obtained indicate that the efficiency of the perforated staggered or linearly distribution shapes with the actual net area on the applied loads has the opposite effect as it reduces the load capacity for all types of perforated shapes, as shown in Figure 15. The percentage of the decrease from the control specimen was measured for the perforated staggered rhombus, circular and hexagon shapes (with L = 0.0), the average proportional limit loads are 37.4%, 21.6%, and 21.6% respectively, and for average ultimate loads are 36.2%, 21.1%, and 21.7% respectively. Despite the decrease in load capacity, it improves the properties of the steel sheets as mentioned above.
4. Conclusions
Perforated steel sheets have many uses, so they should be studied under the influence of uniaxial tensile load. Because of the presence of these perforated steel sheets, the characteristics of the steel sheets will either increase or decrease. The simulation by FE modeling has been introduced for making a prediction regarding the eventual uniaxial load capacity of the steel sheets with different perforated shapes. Parametric studies were carried out for evaluating the impacts of certain parameters on the relationships of stress-strain engineering. The investigative results deducted from the FE model were contrasted with the experimental consequences, dealing with a dissimilar structure relating to test geometries. On the basis of this research, it has been concluded that:
- After making a comparison with the experimental tests, the FE model is regarded as being more precise for predicting the stress-strain engineering relationships. The mean values of the proportional limit stress σpl Exp./σpl.FE is 1.02 and the modulus of elasticity EExp./E.FE is 1.00, the ultimate stress σu. Exp./σu.FE is 1.003 and the ultimate strain εu. Exp./εu.FE is 1.016.
- The effect of the perforated staggered shape on the stresses and modulus of elasticity has the opposite effect as it reduces the stress and modulus of elasticity.
- As for the shapes of the linear distribution, the effect of the distance between the shapes was not significant and almost was nonexistent.
- In the first place, the paper finds that the perforated rhombus shape has the biggest effect on stress-strain engineering relationships. In the second place, it finds that perforated circular and hexagon shapes have an effect on stress-strain engineering relationships. But in perforated square sizes, it finds that there is no observed difference in the proportional limit stress, and for ultimate stress, it gives the opposite effect.
- The efficiency of the perforated staggered or linearly distribution shapes with the actual net area on the applied loads has the opposite effect, as it reduces the load capacity for all types of perforated shapes. Despite the decrease in load capacity, the efficiency of the perforated staggered or linearly distribution improves the properties of the steel sheets.
Funding
This research received no external funding.
Acknowledgments
Deanship of Scientific Research, Majmaah University, deserves special thanks for his generous support for the accomplishment of this task under Project Number No. 1439-46.
Conflicts of Interest
The author declares no conflict of interest.
Abbreviations
The following abbreviations are used in this manuscript:
| σE | Engineering stress |
| εE | Engineering strain |
| P | Axial tensile applied load |
| A0 | Original area cross section |
| L0 | Original Length |
| ∆L | Elongation increasing in original length |
| R | Rhombus perforated |
| C | Circular perforated |
| H | Hexagon perforated |
| S | Square perforated |
| σy | Yield strength, |
| σu | Ultimate strength |
| E | Initial elastic modulus |
| σpl | Proportional limit stress |
| εu | Ultimate strain |
| εpl | Proportional limit strain |
References
- American Society for Testing and Materials (ASTM). ASTM Standards A370-08a: Standard Test Methods and Definitions for Mechanical Testing of Steel Products; American Society for Testing and Materials: West Conshohocken, PA, USA, 2008. [Google Scholar] [CrossRef]
- Arasaratnam, P.; Sivakumaran, K.S.; Tait, M.J. True stress-true strain models for structural steel elements. ISRN Civ. Eng. 2011, 2011, 11. [Google Scholar] [CrossRef]
- Faridmehr, I.; Osman, M.H.; Adnan, A.B.; Nejad, A.F.; Hodjati, R.; Azimi, M.A. Correlation between engineering stress-strain and true stress-strain curve. Am. J. Civ. Eng. Archit. 2014, 2, 53–59. [Google Scholar] [CrossRef]
- Kweon, H.D.; Heo, E.J.; Lee, D.H.; Kim, J.W. A methodology for determining the true stress-strain curve of SA-508 low alloy steel from a tensile test with finite element analysis. J. Mech. Sci. Technol. 2018, 32, 3137–3143. [Google Scholar] [CrossRef]
- Galambos, T.V. Guide to Stability Design Criteria for Metal Structures, 5th ed.; John Wiley & Sons: New York, NY, USA, 1998. [Google Scholar]
- Beygelzimer, Y.; Estrin, Y.; Kulagin, R. Synthesis of Hybrid Materials by Severe Plastic Deformation: A New Paradigm of SPD Processing. Adv. Eng. Mater. 2015, 17, 1853–1861. [Google Scholar] [CrossRef]
- Andh, U.B.; Chavan, S.M.; Kulakrni, S.G. Stress analysis of perforated plates under uniaxial compression using experimentation and finite element analysis. Int. J. Curr. Eng. Technol. 2017, 7, 431–437. [Google Scholar]
- Saroha, M. Analyse the stress concentration effect of a perforated plate under uniaxial loading using ansys. Int. J. All Res. Educ. Sci. Methods 2017, 5, 8–16. [Google Scholar]
- Saraçoğlu, M.H.; Albayrak, U. Linear static analysis of perforated plates with round and staggered holes under their self-weights. Res. Eng. Struct. Mater. 2015, 2, 39–47. [Google Scholar] [CrossRef]
- Maiorana, E.; Pellegrino, C.; Modena, C. Linear buckling analysis of perforated plates subjected to localised symmetrical load. Eng. Struct. 2008, 30, 3151–3158. [Google Scholar] [CrossRef]
- Ndubuaku, O.; Liu, X.; Martens, M.; Cheng, J.J.R.; Adeeb, S. The effect of material stress-strain characteristics on the ultimate stress and critical buckling strain of flat plates subjected to uniform axial compression. Constr. Build. Mater. 2018, 182, 346–359. [Google Scholar] [CrossRef]
- Lee, Y.C.; Chen, F.K. Yield criterion for a perforated sheet with a uniform triangular pattern of round holes and a low ligament ratio. J. Mater. Process. Technol. 2000, 103, 353–361. [Google Scholar] [CrossRef]
- American Society for Testing and Materials (ASTM). ASTM A370/ASME SA-370: Standard Test Methods and Definitions for Mechanical Testing of Steel Products; American Society for Testing and Materials: West Conshohocken, PA, USA, 2016. [Google Scholar] [CrossRef]
- Sayed, A.M.; Diab, H.M. Modeling of the Axial Load Capacity of RC Columns Strengthened with Steel Jacketing under Preloading Based on FE Simulation. Model. Simul. Eng. 2019, 2019, 8. [Google Scholar] [CrossRef]
- Seif, M.; Main, J.; Weigand, J.; McAllister, T.P.; Luecke, W. Finite element modeling of structural steel component failure at elevated temperatures. Structures 2016, 6, 134–145. [Google Scholar] [CrossRef]
- ANSYS User’s Manual; Version (15); Swanson Analysis Systems, Inc.: Cannonsburg, PA, USA, 2015.
Figure 1.
Some shapes of perforated steel sheets are used in structures such as (a) Square, (b) Circular, (c) Hexagonal and (d) Rhombus.
Figure 1.
Some shapes of perforated steel sheets are used in structures such as (a) Square, (b) Circular, (c) Hexagonal and (d) Rhombus.

Figure 2.
Standard tensile specimens of steel sheet.

Figure 3.
Experimental test specimens of the steel sheet.

Figure 4.
Geometrical details, perforated shapes and sizes of steel sheets were considered.


Figure 5.
Experimental engineering stress-strain relationships.

Figure 6.
Curves showing the engineering stress-strain gained from both experimental and FE simulation.
Figure 6.
Curves showing the engineering stress-strain gained from both experimental and FE simulation.

Figure 7.
Stress-strain engineering relationships obtained from FE simulation for perforated steel sheets. (a) Steel sheets thickness = 1 mm; (b) Steel sheets thickness = 2 mm; (c) Steel sheets thickness = 3 mm; (d) Steel sheets thickness = 4 mm.
Figure 7.
Stress-strain engineering relationships obtained from FE simulation for perforated steel sheets. (a) Steel sheets thickness = 1 mm; (b) Steel sheets thickness = 2 mm; (c) Steel sheets thickness = 3 mm; (d) Steel sheets thickness = 4 mm.

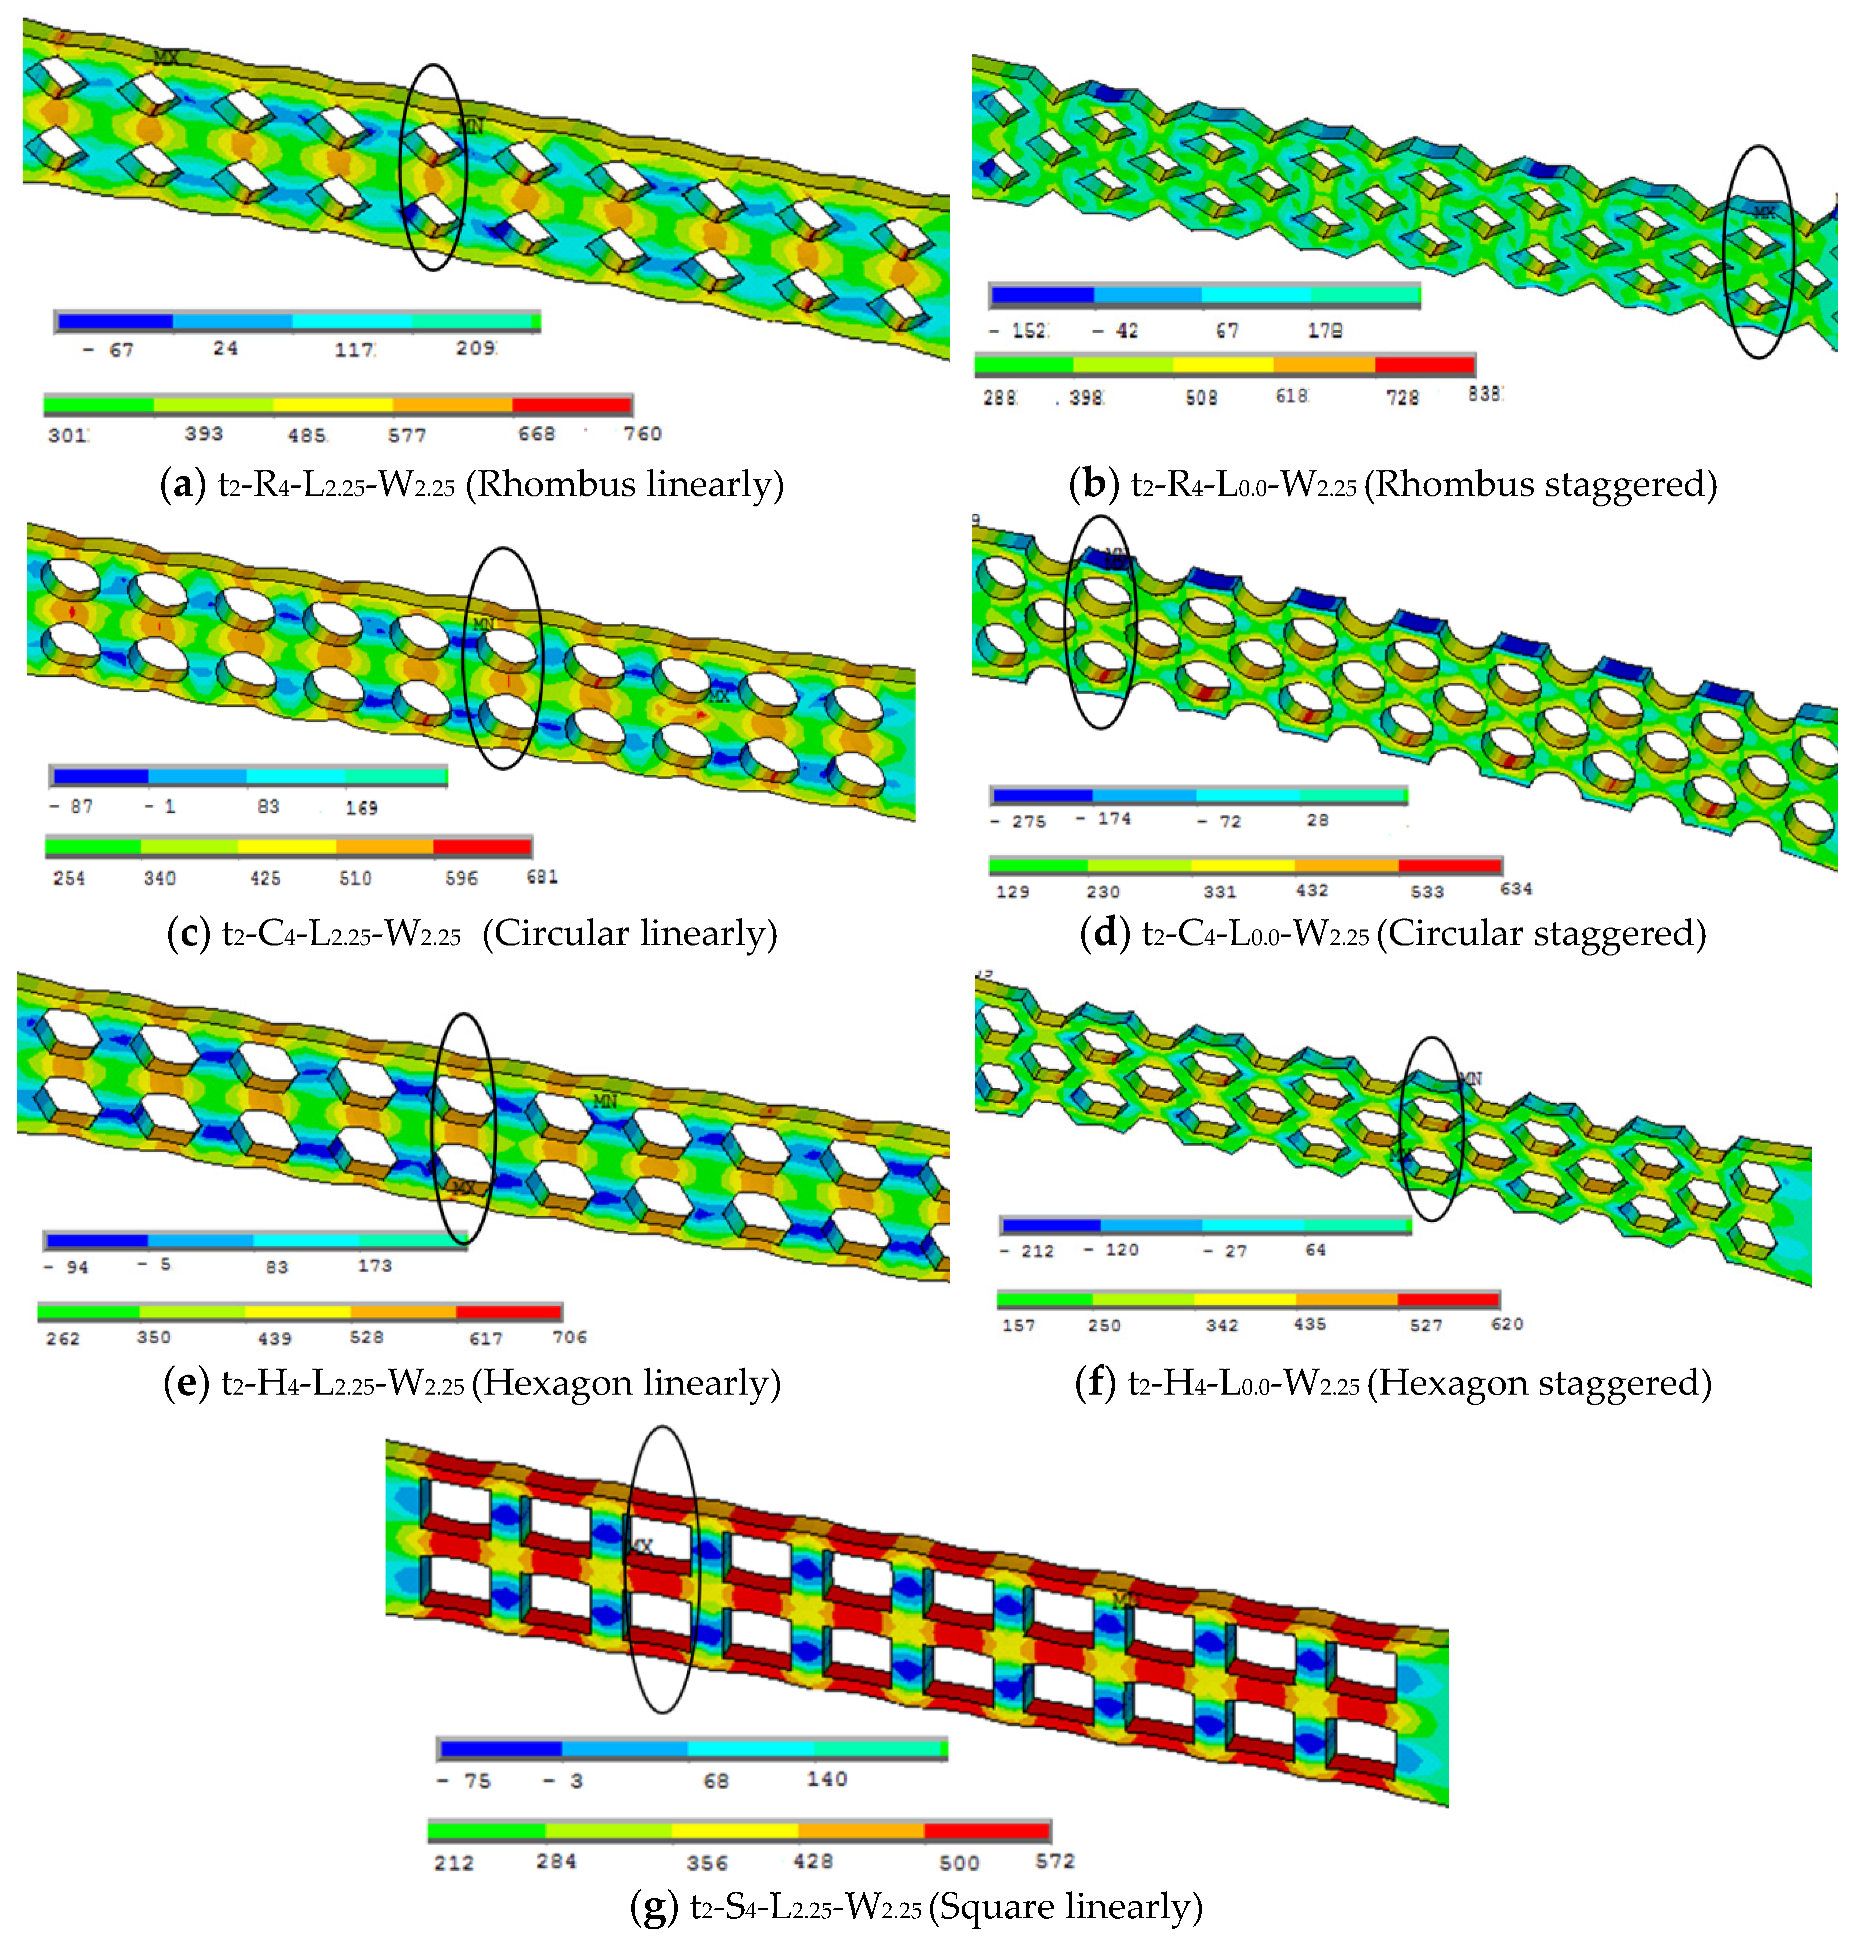
Figure 8.
Pattern of maximum ultimate stresses of steel sheets perforated for longitudinal and staggered shapes (MPa).
Figure 8.
Pattern of maximum ultimate stresses of steel sheets perforated for longitudinal and staggered shapes (MPa).

Figure 9.
Stress-strain engineering relationships obtained from FE simulation for different perforated steel sheets sizes.
Figure 9.
Stress-strain engineering relationships obtained from FE simulation for different perforated steel sheets sizes.

Figure 10.
Relation between the ratio of perforated steel sheets stresses to control solid steel sheets and the influence of the perforated size.
Figure 10.
Relation between the ratio of perforated steel sheets stresses to control solid steel sheets and the influence of the perforated size.

Figure 11.
Stress-strain engineering relationships obtained from FE simulation for different perforated steel sheets thicknesses.
Figure 11.
Stress-strain engineering relationships obtained from FE simulation for different perforated steel sheets thicknesses.

Figure 12.
Relation between the ratio of perforated steel sheets stresses to control solid steel sheets and the influence of the distance between perforated shapes.
Figure 12.
Relation between the ratio of perforated steel sheets stresses to control solid steel sheets and the influence of the distance between perforated shapes.

Figure 13.
Relation between the ratio of perforated steel sheets strains to control solid steel sheets and the influence of the distance between perforated shapes.
Figure 13.
Relation between the ratio of perforated steel sheets strains to control solid steel sheets and the influence of the distance between perforated shapes.

Figure 14.
Relation between the ratio of perforated steel sheets modulus of elasticity to control solid steel sheets and the influence of the distance between perforated shapes.
Figure 14.
Relation between the ratio of perforated steel sheets modulus of elasticity to control solid steel sheets and the influence of the distance between perforated shapes.

Figure 15.
Relation between the ratio of perforated steel sheets applied loads to control solid steel sheets and the percentage of net area.
Figure 15.
Relation between the ratio of perforated steel sheets applied loads to control solid steel sheets and the percentage of net area.


Table 1.
Summary of perforated steel sheets assessed in the current study using FE modeling.
| Steel Sheet Specimen | Steel Sheets Characteristics | Offset from Edge to Edge | |||
|---|---|---|---|---|---|
| Thickness (mm) | Perforated Type | Perforated Size (mm) | Longitudinal (mm) | Width (mm) | |
| t1-Soild | 1.00 | Control-Without | - | - | - |
| t1-R4-L2.25-W2.25 | 1.00 | Rhombus | 4.00 | 2.25 | 2.25 |
| t1-R4-L1.125-W2.25 | 1.00 | Rhombus | 4.00 | 1.125 | 2.25 |
| t1-R4-L0.0-W2.25 | 1.00 | Rhombus | 4.00 | 0.00 | 2.25 |
| t1-C4-L2.25-W2.25 | 1.00 | Circular | 4.00 | 2.25 | 2.25 |
| t1-C4-L1.125-W2.25 | 1.00 | Circular | 4.00 | 1.125 | 2.25 |
| t1-C4-L0.0-W2.25 | 1.00 | Circular | 4.00 | 0.00 | 2.25 |
| t1-H4-L2.25-W2.25 | 1.00 | Hexagon | 4.00 | 2.25 | 2.25 |
| t1-H4-L1.125-W2.25 | 1.00 | Hexagon | 4.00 | 1.125 | 2.25 |
| t1-H4-L0.0-W2.25 | 1.00 | Hexagon | 4.00 | 0.00 | 2.25 |
| t1-S4-L2.25-W2.25 | 1.00 | Square | 4.00 | 2.25 | 2.25 |
| t1-S4-L1.125-W2.25 | 1.00 | Square | 4.00 | 1.125 | 2.25 |
| t2-Soild | 2.00 | Control-Without | - | - | - |
| t2-R4-L2.25-W2.25 | 2.00 | Rhombus | 4.00 | 2.25 | 2.25 |
| t2-R4-L1.125-W2.25 | 2.00 | Rhombus | 4.00 | 1.125 | 2.25 |
| t2-R4-L0.0-W2.25 | 2.00 | Rhombus | 4.00 | 0.00 | 2.25 |
| t2-R3-L2.25-W3.25 | 2.00 | Rhombus | 3.00 | 2.25 | 3.25 |
| t2-R2-L2.25-W4.25 | 2.00 | Rhombus | 2.00 | 2.25 | 4.25 |
| t2-C4-L2.25-W2.25 | 2.00 | Circular | 4.00 | 2.25 | 2.25 |
| t2-C4-L1.125-W2.25 | 2.00 | Circular | 4.00 | 1.125 | 2.25 |
| t2-C4-L0.0-W2.25 | 2.00 | Circular | 4.00 | 0.00 | 2.25 |
| t2-C3-L2.25-W3.25 | 2.00 | Circular | 3.00 | 2.25 | 3.25 |
| t2-C2-L2.25-W4.25 | 2.00 | Circular | 2.00 | 2.25 | 4.25 |
| t2-H4-L2.25-W2.25 | 2.00 | Hexagon | 4.00 | 2.25 | 2.25 |
| t2-H4-L1.125-W2.25 | 2.00 | Hexagon | 4.00 | 1.125 | 2.25 |
| t2-H4-L0.0-W2.25 | 2.00 | Hexagon | 4.00 | 0.00 | 2.25 |
| t2-H3-L2.25-W3.25 | 2.00 | Hexagon | 3.00 | 2.25 | 3.25 |
| t2-H2-L2.25-W4.25 | 2.00 | Hexagon | 2.00 | 2.25 | 4.25 |
| t2-S4-L2.25-W2.25 | 2.00 | Square | 4.00 | 2.25 | 2.25 |
| t2-S4-L1.125-W2.25 | 2.00 | Square | 4.00 | 1.125 | 2.25 |
| t2-S3-L2.25-W3.25 | 2.00 | Square | 3.00 | 2.25 | 3.25 |
| t2-S2-L2.25-W4.25 | 2.00 | Square | 2.00 | 2.25 | 4.25 |
| t3-Soild | 3.00 | Control-Without | - | - | - |
| t3-R4-L2.25-W2.25 | 3.00 | Rhombus | 4.00 | 2.25 | 2.25 |
| t3-R4-L1.125-W2.25 | 3.00 | Rhombus | 4.00 | 1.125 | 2.25 |
| t3-R4-L0.0-W2.25 | 3.00 | Rhombus | 4.00 | 0.00 | 2.25 |
| t3-C4-L2.25-W2.25 | 3.00 | Circular | 4.00 | 2.25 | 2.25 |
| t3-C4-L1.125-W2.25 | 3.00 | Circular | 4.00 | 1.125 | 2.25 |
| t3-C4-L0.0-W2.25 | 3.00 | Circular | 4.00 | 0.00 | 2.25 |
| t3-H4-L2.25-W2.25 | 3.00 | Hexagon | 4.00 | 2.25 | 2.25 |
| t3-H4-L1.125-W2.25 | 3.00 | Hexagon | 4.00 | 1.125 | 2.25 |
| t3-H4-L0.0-W2.25 | 3.00 | Hexagon | 4.00 | 0.00 | 2.25 |
| t3-S4-L2.25-W2.25 | 3.00 | Square | 4.00 | 2.25 | 2.25 |
| t3-S4-L1.125-W2.25 | 3.00 | Square | 4.00 | 1.125 | 2.25 |
| t4-Soild | 4.00 | Control-Without | - | - | - |
| t4-R4-L2.25-W2.25 | 4.00 | Rhombus | 4.00 | 2.25 | 2.25 |
| t4-R4-L1.125-W2.25 | 4.00 | Rhombus | 4.00 | 1.125 | 2.25 |
| t4-R4-L0.0-W2.25 | 4.00 | Rhombus | 4.00 | 0.00 | 2.25 |
| t4-C4-L2.25-W2.25 | 4.00 | Circular | 4.00 | 2.25 | 2.25 |
| t4-C4-L1.125-W2.25 | 4.00 | Circular | 4.00 | 1.125 | 2.25 |
| t4-C4-L0.0-W2.25 | 4.00 | Circular | 4.00 | 0.00 | 2.25 |
| t4-H4-L2.25-W2.25 | 4.00 | Hexagon | 4.00 | 2.25 | 2.25 |
| t4-H4-L1.125-W2.25 | 4.00 | Hexagon | 4.00 | 1.125 | 2.25 |
| t4-H4-L0.0-W2.25 | 4.00 | Hexagon | 4.00 | 0.00 | 2.25 |
| t4-S4-L2.25-W2.25 | 4.00 | Square | 4.00 | 2.25 | 2.25 |
| t4-S4-L1.125-W2.25 | 4.00 | Square | 4.00 | 1.125 | 2.25 |
Table 2.
Comparison of proportional limit and ultimate strength ratios for experimental and FE results.
Table 2.
Comparison of proportional limit and ultimate strength ratios for experimental and FE results.
| Steel Sheet Specimen | Proportional Limit | Ultimate Strength | ||||||||||
|---|---|---|---|---|---|---|---|---|---|---|---|---|
| FE σpl (MPa) | Exp. σpl (MPa) | σpl Exp./σpl.FE | FE E (GPa) | Exp. E (GPa) | EExp./E.FE | FE σu (MPa) | Exp. σu (MPa) | σu. Exp./σu.FE | FE εu | Exp. εu | εu. Exp./εu.FE | |
| t1-Soild | 386.40 | 397.33 | 1.03 | 203.76 | 203.76 | 1.000 | 561.25 | 565.51 | 1.008 | 0.12284 | 0.1253 | 1.020 |
| t2-Soild | 396.90 | 397.33 | 1.00 | 203.84 | 203.76 | 1.000 | 560.62 | 565.51 | 1.009 | 0.12165 | 0.1253 | 1.030 |
| t3-Soild | 387.07 | 397.33 | 1.03 | 204.04 | 203.76 | 0.999 | 566.27 | 565.51 | 0.999 | 0.12406 | 0.1253 | 1.010 |
| t4-Soild | 393.12 | 397.33 | 1.01 | 203.63 | 203.76 | 1.001 | 567.00 | 565.51 | 0.997 | 0.12468 | 0.1253 | 1.005 |
| Average | - | - | 1.02 | - | - | 1.00 | - | - | 1.003 | - | - | 1.016 |
Table 3.
Summary of steel sheet specimens with perforated based on FE results in the present study.
| Steel Sheet Specimen | Proportional Limit | Ultimate Strength | ||||||||
|---|---|---|---|---|---|---|---|---|---|---|
| σpl (MPa) | σpl Perf./σpl.Solid | εpl | εpl Perf./εpl.Solid | E (GPa) | EPerf./E.Solid | σu (MPa) | σu Perf./σu.Solid | εu | εu Perf./εu.Solid | |
| t1-Soild | 386.40 | 1.00 | 0.00190 | 1.00 | 203.76 | 1.00 | 561.25 | 1.00 | 0.12284 | 1.00 |
| t1-R4-L2.25-W2.25 | 560.00 | 1.45 | 0.00181 | 0.95 | 308.96 | 1.52 | 784.00 | 1.40 | 0.06813 | 0.55 |
| t1-R4-L1.125-W2.25 | 560.00 | 1.45 | 0.00192 | 1.01 | 292.26 | 1.43 | 770.00 | 1.37 | 0.07614 | 0.62 |
| t1-R4-L0.0-W2.25 | 392.00 | 1.01 | 0.00283 | 1.49 | 138.38 | 0.68 | 553.00 | 0.99 | 0.08993 | 0.73 |
| t1-C4-L2.25-W2.25 | 448.00 | 1.16 | 0.00171 | 0.90 | 262.50 | 1.29 | 630.00 | 1.12 | 0.05757 | 0.47 |
| t1-C4-L1.125-W2.25 | 448.00 | 1.16 | 0.00177 | 0.93 | 252.46 | 1.24 | 630.00 | 1.12 | 0.07060 | 0.57 |
| t1-C4-L0.0-W2.25 | 224.00 | 0.58 | 0.00243 | 1.28 | 92.23 | 0.45 | 350.00 | 0.62 | 0.06722 | 0.55 |
| t1-H4-L2.25-W2.25 | 420.00 | 1.09 | 0.00173 | 0.91 | 243.63 | 1.20 | 574.00 | 1.02 | 0.05835 | 0.48 |
| t1-H4-L1.125-W2.25 | 420.00 | 1.09 | 0.00181 | 0.95 | 232.79 | 1.14 | 574.00 | 1.02 | 0.06358 | 0.52 |
| t1-H4-L0.0-W2.25 | 224.00 | 0.58 | 0.00251 | 1.32 | 89.24 | 0.44 | 329.00 | 0.59 | 0.06167 | 0.50 |
| t1-S4-L2.25-W2.25 | 392.00 | 1.01 | 0.00180 | 0.95 | 217.87 | 1.07 | 546.00 | 0.97 | 0.06804 | 0.55 |
| t1-S4-L1.125-W2.25 | 392.00 | 1.01 | 0.00187 | 0.98 | 210.07 | 1.03 | 533.75 | 0.95 | 0.06663 | 0.54 |
| t2-Soild | 396.90 | 1.00 | 0.00195 | 1.00 | 203.84 | 1.00 | 560.62 | 1.00 | 0.12165 | 1.00 |
| t2-R4-L2.25-W2.25 | 588.00 | 1.48 | 0.00192 | 0.98 | 306.41 | 1.50 | 791.00 | 1.41 | 0.06878 | 0.57 |
| t2-R4-L1.125-W2.25 | 560.00 | 1.41 | 0.00188 | 0.96 | 298.44 | 1.46 | 770.00 | 1.37 | 0.07187 | 0.59 |
| t2-R4-L0.0-W2.25 | 392.00 | 0.99 | 0.00280 | 1.44 | 139.85 | 0.69 | 560.00 | 1.00 | 0.09108 | 0.75 |
| t2-R3-L2.25-W3.25 | 504.00 | 1.27 | 0.00191 | 0.98 | 264.47 | 1.30 | 697.85 | 1.24 | 0.09025 | 0.74 |
| t2-R2-L2.25-W4.25 | 459.53 | 1.16 | 0.00188 | 0.96 | 245.07 | 1.20 | 659.65 | 1.18 | 0.10349 | 0.85 |
| t2-C4-L2.25-W2.25 | 441.00 | 1.11 | 0.00170 | 0.87 | 260.73 | 1.28 | 622.13 | 1.11 | 0.05309 | 0.44 |
| t2-C4-L1.125-W2.25 | 441.00 | 1.11 | 0.00174 | 0.89 | 252.99 | 1.24 | 624.75 | 1.11 | 0.06349 | 0.52 |
| t2-C4-L0.0-W2.25 | 224.00 | 0.56 | 0.00266 | 1.36 | 84.16 | 0.41 | 301.00 | 0.54 | 0.04052 | 0.33 |
| t2-C3-L2.25-W3.25 | 426.46 | 1.07 | 0.00173 | 0.89 | 247.01 | 1.21 | 630.00 | 1.12 | 0.07817 | 0.64 |
| t2-C2-L2.25-W4.25 | 415.06 | 1.05 | 0.00173 | 0.89 | 240.46 | 1.18 | 622.59 | 1.11 | 0.08956 | 0.74 |
| t2-H4-L2.25-W2.25 | 420.00 | 1.06 | 0.00173 | 0.89 | 243.18 | 1.19 | 574.00 | 1.02 | 0.05633 | 0.46 |
| t2-H4-L1.125-W2.25 | 420.00 | 1.06 | 0.00181 | 0.93 | 231.60 | 1.14 | 574.00 | 1.02 | 0.06277 | 0.52 |
| t2-H4-L0.0-W2.25 | 224.00 | 0.56 | 0.00247 | 1.27 | 90.55 | 0.44 | 329.00 | 0.59 | 0.05557 | 0.46 |
| t2-H3-L2.25-W3.25 | 407.08 | 1.03 | 0.00173 | 0.89 | 235.31 | 1.15 | 600.92 | 1.07 | 0.08210 | 0.67 |
| t2-H2-L2.25-W4.25 | 400.24 | 1.01 | 0.00178 | 0.91 | 225.39 | 1.11 | 578.12 | 1.03 | 0.07907 | 0.65 |
| t2-S4-L2.25-W2.25 | 392.00 | 0.99 | 0.00180 | 0.92 | 217.95 | 1.07 | 533.75 | 0.95 | 0.05792 | 0.48 |
| t2-S4-L1.125-W2.25 | 392.00 | 0.99 | 0.00187 | 0.96 | 210.07 | 1.03 | 533.75 | 0.95 | 0.06642 | 0.55 |
| t2-S3-L2.25-W3.25 | 387.69 | 0.98 | 0.00176 | 0.90 | 219.89 | 1.08 | 571.85 | 1.02 | 0.08888 | 0.73 |
| t2-S2-L2.25-W4.25 | 400.24 | 1.01 | 0.00184 | 0.94 | 217.25 | 1.07 | 574.41 | 1.02 | 0.09589 | 0.79 |
| t3-Soild | 387.07 | 1.00 | 0.00190 | 1.00 | 204.04 | 1.00 | 566.27 | 1.00 | 0.12406 | 1.00 |
| t3-R4-L2.25-W2.25 | 567.47 | 1.47 | 0.00183 | 0.96 | 310.94 | 1.52 | 806.40 | 1.42 | 0.06291 | 0.51 |
| t3-R4-L1.125-W2.25 | 567.47 | 1.47 | 0.00193 | 1.02 | 294.81 | 1.44 | 791.47 | 1.40 | 0.06889 | 0.56 |
| t3-R4-L0.0-W2.25 | 418.13 | 1.08 | 0.00302 | 1.59 | 138.65 | 0.68 | 582.40 | 1.03 | 0.10089 | 0.81 |
| t3-C4-L2.25-W2.25 | 448.00 | 1.16 | 0.00170 | 0.89 | 264.87 | 1.30 | 657.07 | 1.16 | 0.05623 | 0.45 |
| t3-C4-L1.125-W2.25 | 448.00 | 1.16 | 0.00177 | 0.93 | 253.22 | 1.24 | 642.13 | 1.13 | 0.06069 | 0.49 |
| t3-C4-L0.0-W2.25 | 238.93 | 0.62 | 0.00265 | 1.39 | 90.29 | 0.44 | 350.93 | 0.62 | 0.05182 | 0.42 |
| t3-H4-L2.25-W2.25 | 418.13 | 1.08 | 0.00171 | 0.90 | 243.89 | 1.20 | 582.40 | 1.03 | 0.04735 | 0.38 |
| t3-H4-L1.125-W2.25 | 418.13 | 1.08 | 0.00180 | 0.95 | 234.91 | 1.15 | 582.40 | 1.03 | 0.05184 | 0.42 |
| t3-H4-L0.0-W2.25 | 238.93 | 0.62 | 0.00290 | 1.53 | 82.51 | 0.40 | 350.93 | 0.62 | 0.05964 | 0.48 |
| t3-S4-L2.25-W2.25 | 388.27 | 1.00 | 0.00178 | 0.94 | 218.22 | 1.07 | 552.53 | 0.98 | 0.06005 | 0.48 |
| t3-S4-L1.125-W2.25 | 388.27 | 1.00 | 0.00186 | 0.98 | 209.23 | 1.03 | 552.53 | 0.98 | 0.07176 | 0.58 |
| t4-Soild | 393.12 | 1.00 | 0.00193 | 1.00 | 203.63 | 1.00 | 567.00 | 1.00 | 0.12468 | 1.00 |
| t4-R4-L2.25-W2.25 | 588.00 | 1.50 | 0.00191 | 0.99 | 308.79 | 1.52 | 826.00 | 1.46 | 0.06881 | 0.55 |
| t4-R4-L1.125-W2.25 | 560.00 | 1.42 | 0.00188 | 0.97 | 297.28 | 1.46 | 805.00 | 1.42 | 0.07536 | 0.60 |
| t4-R4-L0.0-W2.25 | 420.00 | 1.07 | 0.00300 | 1.55 | 139.56 | 0.69 | 574.00 | 1.01 | 0.08261 | 0.66 |
| t4-C4-L2.25-W2.25 | 448.00 | 1.14 | 0.00171 | 0.89 | 261.75 | 1.29 | 665.00 | 1.17 | 0.05801 | 0.47 |
| t4-C4-L1.125-W2.25 | 448.00 | 1.14 | 0.00178 | 0.92 | 252.16 | 1.24 | 658.00 | 1.16 | 0.06701 | 0.54 |
| t4-C4-L0.0-W2.25 | 252.00 | 0.64 | 0.00305 | 1.58 | 82.64 | 0.41 | 322.00 | 0.57 | 0.04135 | 0.33 |
| t4-H4-L2.25-W2.25 | 420.00 | 1.07 | 0.00172 | 0.89 | 243.98 | 1.20 | 602.00 | 1.06 | 0.05573 | 0.45 |
| t4-H4-L1.125-W2.25 | 420.00 | 1.07 | 0.00177 | 0.92 | 237.95 | 1.17 | 602.00 | 1.06 | 0.06087 | 0.49 |
| t4-H4-L0.0-W2.25 | 252.00 | 0.64 | 0.00313 | 1.62 | 80.62 | 0.40 | 350.00 | 0.62 | 0.05796 | 0.46 |
| t4-S4-L2.25-W2.25 | 392.00 | 1.00 | 0.00180 | 0.93 | 218.40 | 1.07 | 560.00 | 0.99 | 0.06254 | 0.50 |
| t4-S4-L1.125-W2.25 | 392.00 | 1.00 | 0.00186 | 0.96 | 210.54 | 1.03 | 560.00 | 0.99 | 0.07577 | 0.61 |
© 2019 by the author. Licensee MDPI, Basel, Switzerland. This article is an open access article distributed under the terms and conditions of the Creative Commons Attribution (CC BY) license (http://creativecommons.org/licenses/by/4.0/).
Share and Cite
MDPI and ACS Style
Sayed, A.M. Numerical Analysis of the Perforated Steel Sheets Under Uni-Axial Tensile Force. Metals 2019, 9, 632. https://0-doi-org.brum.beds.ac.uk/10.3390/met9060632
AMA Style
Sayed AM. Numerical Analysis of the Perforated Steel Sheets Under Uni-Axial Tensile Force. Metals. 2019; 9(6):632. https://0-doi-org.brum.beds.ac.uk/10.3390/met9060632
Chicago/Turabian StyleSayed, Ahmed M. 2019. "Numerical Analysis of the Perforated Steel Sheets Under Uni-Axial Tensile Force" Metals 9, no. 6: 632. https://0-doi-org.brum.beds.ac.uk/10.3390/met9060632
Note that from the first issue of 2016, this journal uses article numbers instead of page numbers. See further details here.