
High Glucose Shifts the Oxylipin Profiles in the Astrocytes towards Pro-Inflammatory States


Abstract
:1. Introduction
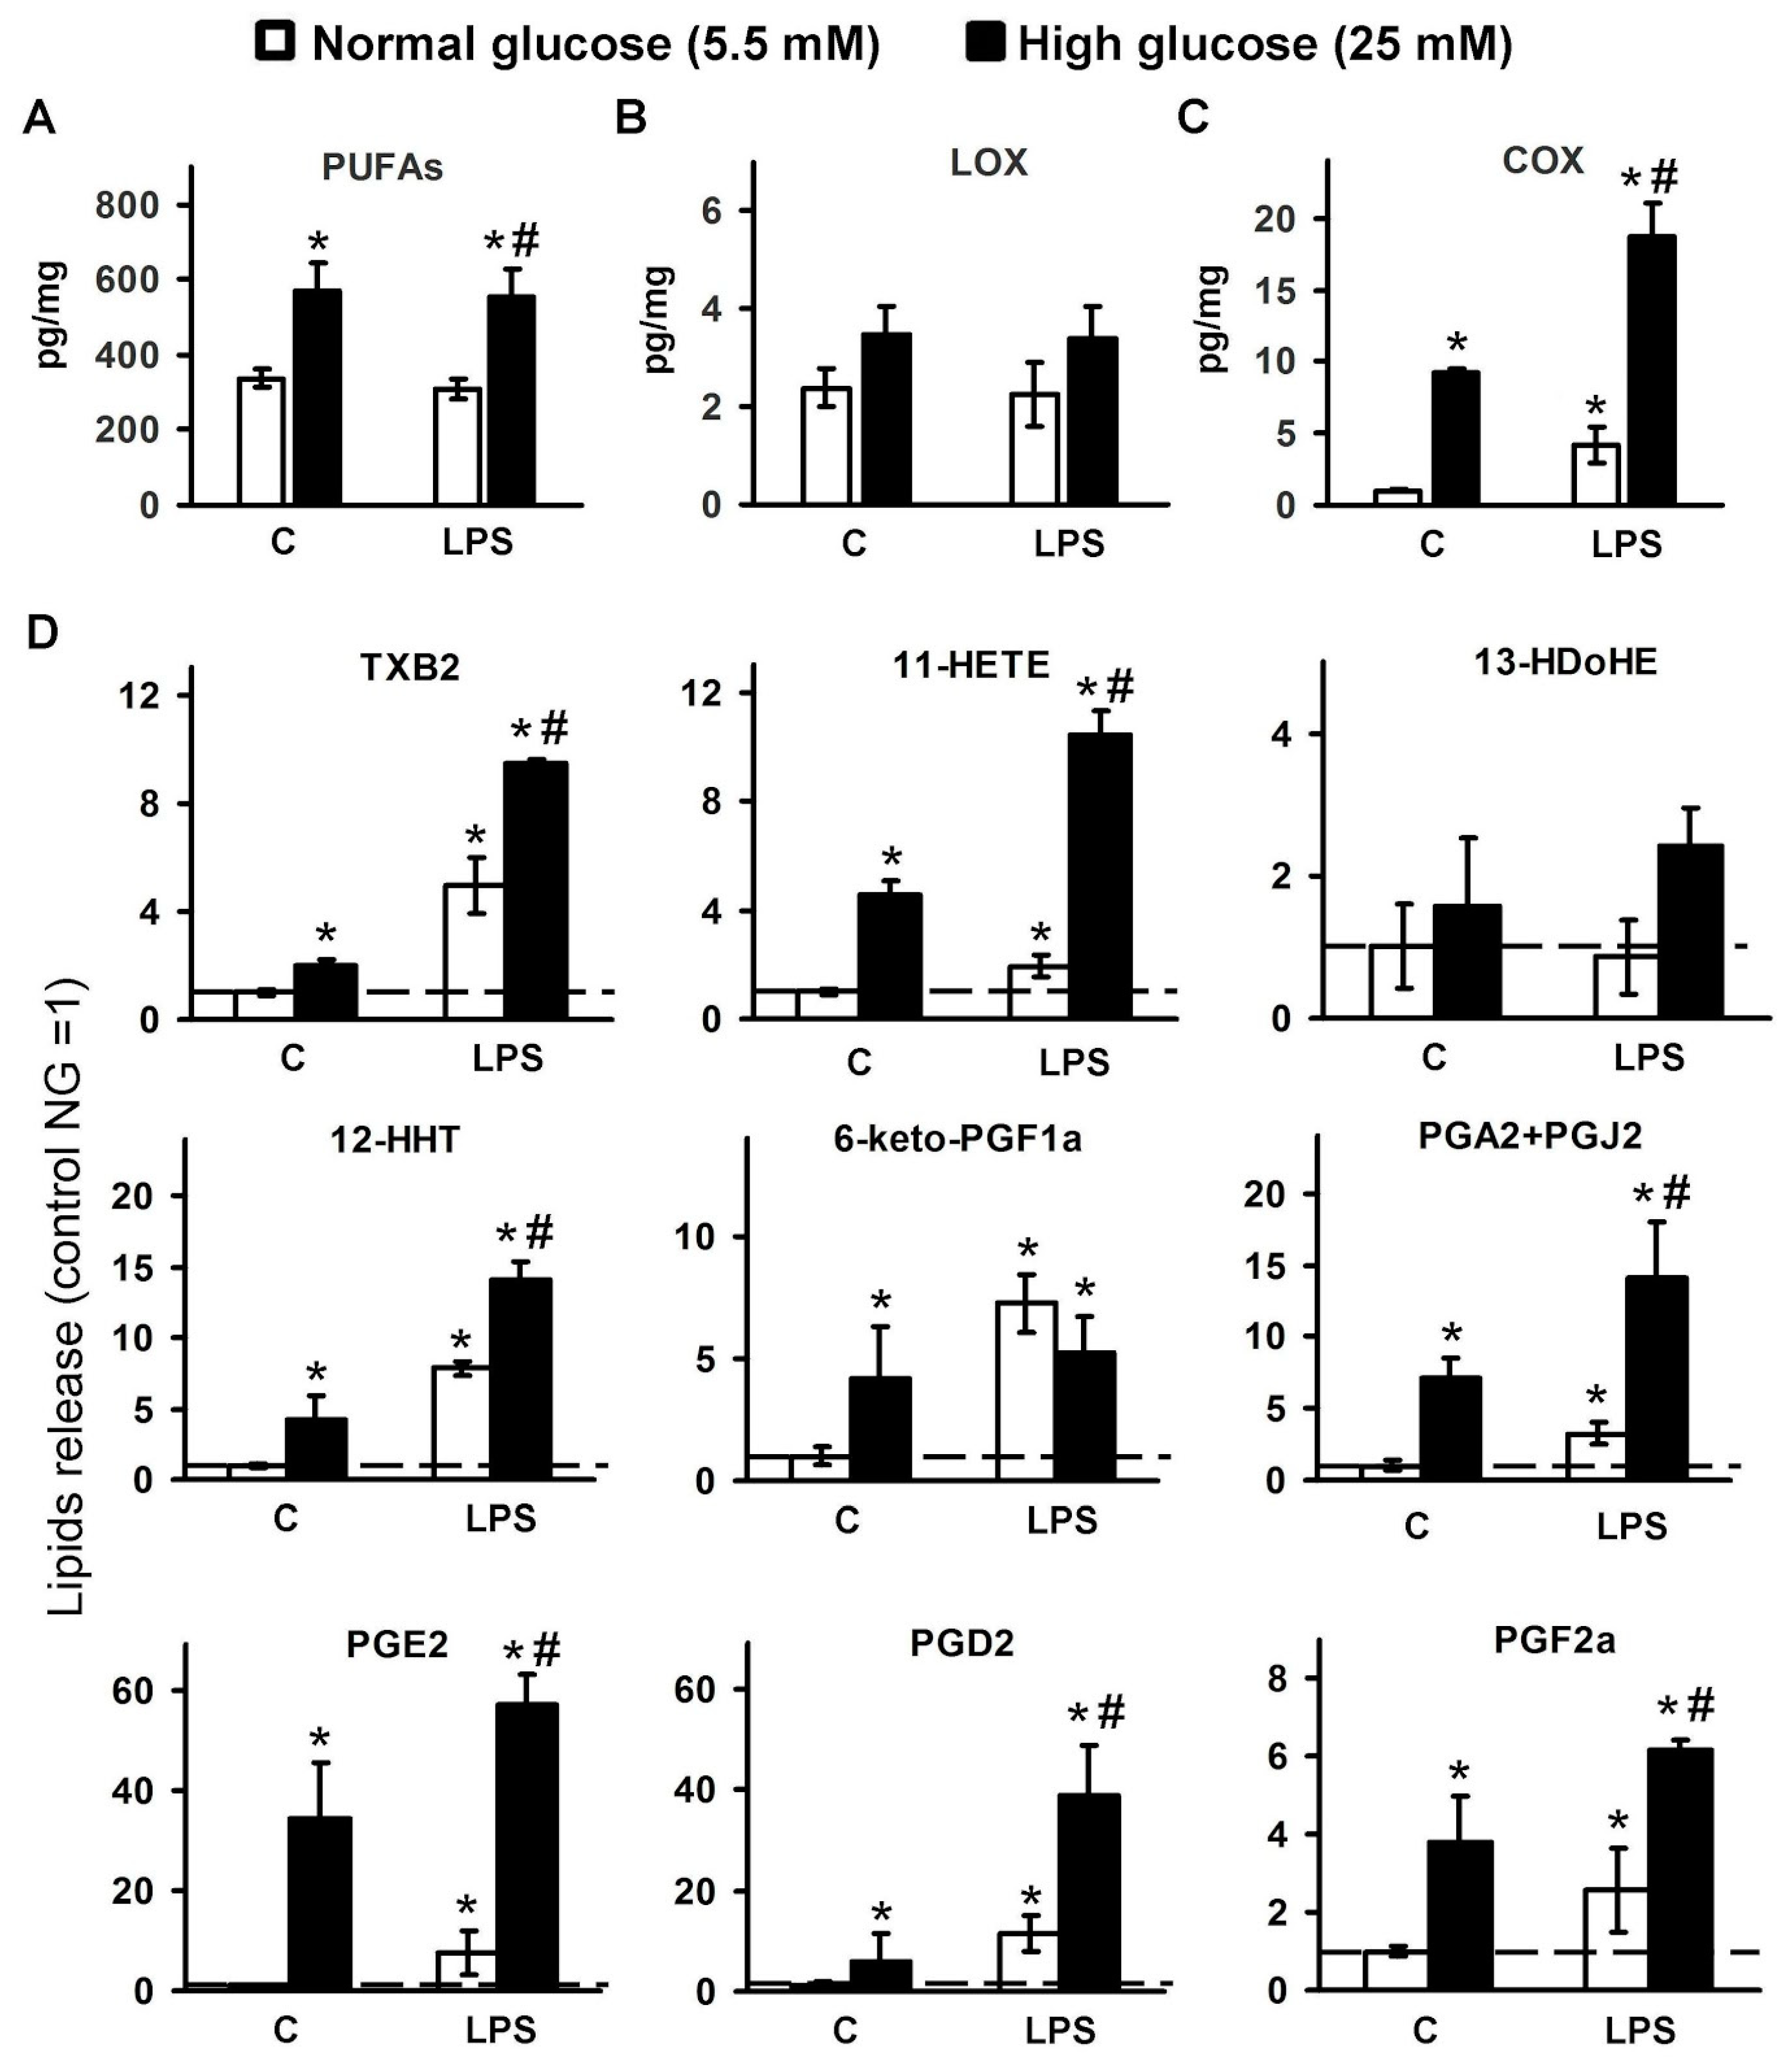
2. Results
2.1. Changes in the Oxylipin Profiles in Astrocytes, Cultured in Normal and High Glucose
2.2. Effect of Serum on Oxylipin Profiles in Astrocytes, Cultured at Normal and High Glucose
2.3. Effect of Serum Level and Different Glucose Concentrations in the Culture Medium on the IL-6 Release
3. Discussion
4. Materials and Methods
4.1. Reagents
4.2. Primary Astrocyte Cell Culture
4.3. UPLC-MS/MS Conditions and Sample Preparation
4.4. Western Blot Analysis
4.5. Determination of IL-6 Enzyme-Linked Immunoassay
4.6. Data Analysis and Statistics
5. Conclusions
Supplementary Materials
Author Contributions
Funding
Institutional Review Board Statement
Informed Consent Statement
Data Availability Statement
Acknowledgments
Conflicts of Interest
References
- Buczynski, M.W.; Dumlao, D.S.; Dennis, E.A. An integrated omics analysis of eicosanoid biology. J. Lipid Res. 2009, 50, 1015–1038. [Google Scholar] [CrossRef] [Green Version]
- Serhan, C.N.; Chiang, N.; Van Dyke, T.E. Resolving inflammation: Dual anti-inflammatory and pro-resolution lipid mediators. Nat. Rev. Immunol. 2008, 8, 349–361. [Google Scholar] [CrossRef] [PubMed] [Green Version]
- Chistyakov, D.V.; Astakhova, A.A.; Sergeeva, M.G. Resolution of inflammation and mood disorders. Exp. Mol. Pathol. 2018, 105, 190–201. [Google Scholar] [CrossRef]
- Gabbs, M.; Leng, S.; Devassy, J.G.; Monirujjaman, M.; Aukema, H.M. Advances in Our Understanding of Oxylipins Derived from Dietary PUFAs. Adv. Nutr. 2015, 6, 513–540. [Google Scholar] [CrossRef] [PubMed] [Green Version]
- Funk, C.D. Prostaglandins and leukotrienes: Advances in eicosanoid biology. Science 2001, 294, 1871–1875. [Google Scholar] [CrossRef] [PubMed] [Green Version]
- O’Donnell, V.B.; Murphy, R.C. Directing eicosanoid esterification into phospholipids. J. Lipid Res. 2017, 58, 837–839. [Google Scholar] [CrossRef] [Green Version]
- Dennis, E.A.; Cao, J.; Hsu, Y.H.; Magrioti, V.; Kokotos, G. Phospholipase A2 enzymes: Physical structure, biological function, disease implication, chemical inhibition, and therapeutic intervention. Chem. Rev. 2011, 111, 6130–6185. [Google Scholar] [CrossRef] [PubMed] [Green Version]
- Scaioli, E.; Liverani, E.; Belluzzi, A. The imbalance between N-6/N-3 polyunsaturated fatty acids and inflammatory bowel disease: A comprehensive review and future therapeutic perspectives. Int. J. Mol. Sci. 2017, 18, 2619. [Google Scholar] [CrossRef] [Green Version]
- Simopoulos, A.P. An increase in the Omega-6/Omega-3 fatty acid ratio increases the risk for obesity. Nutrients 2016, 8, 128. [Google Scholar] [CrossRef] [Green Version]
- Serhan, C.N. Pro-resolving lipid mediators are leads for resolution physiology. Nature 2014, 510, 92–101. [Google Scholar] [CrossRef] [Green Version]
- Liakh, I.; Pakiet, A.; Sledzinski, T.; Mika, A. Methods of the analysis of oxylipins in biological samples. Molecules 2020, 25, 349. [Google Scholar] [CrossRef] [PubMed] [Green Version]
- Hellhake, S.; Meckelmann, S.W.; Empl, M.T.; Rentmeister, K.; Wißdorf, W.; Steinberg, P.; Schmitz, O.J.; Benter, T.; Schebb, N.H. Non-targeted and targeted analysis of oxylipins in combination with charge-switch derivatization by ion mobility high-resolution mass spectrometry. Anal. Bioanal. Chem. 2020, 412, 5743–5757. [Google Scholar] [CrossRef] [PubMed]
- Chhonker, Y.S.; Bala, V.; Murry, D.J. Quantification of eicosanoids and their metabolites in biological matrices: A review. Bioanalysis 2018, 10, 2027–2046. [Google Scholar] [CrossRef] [PubMed]
- Escartin, C.; Galea, E.; Lakatos, A.; O’Callaghan, J.P.; Petzold, G.C.; Serrano-Pozo, A.; Steinhäuser, C.; Volterra, A.; Carmignoto, G.; Agarwal, A.; et al. Reactive astrocyte nomenclature, definitions, and future directions. Nat. Neurosci. 2021, 24, 312–325. [Google Scholar] [CrossRef] [PubMed]
- Liddelow, S.A.; Guttenplan, K.A.; Clarke, L.E.; Bennett, F.C.; Bohlen, C.J.; Schirmer, L.; Bennett, M.L.; Münch, A.E.; Chung, W.S.; Peterson, T.C.; et al. Neurotoxic reactive astrocytes are induced by activated microglia. Nature 2017, 541, 481–487. [Google Scholar] [CrossRef] [PubMed]
- Sofroniew, M.V. Astrocyte barriers to neurotoxic inflammation. Nat. Rev. Neurosci. 2015, 16, 249–263. [Google Scholar] [CrossRef] [PubMed] [Green Version]
- Cunningham, C.; Dunne, A.; Lopez-Rodriguez, A.B. Astrocytes: Heterogeneous and Dynamic Phenotypes in Neurodegeneration and Innate Immunity. Neuroscientist 2019, 25, 455–474. [Google Scholar] [CrossRef] [Green Version]
- Liddelow, S.A.; Barres, B.A. Reactive Astrocytes: Production, Function, and Therapeutic Potential. Immunity 2017, 46, 957–967. [Google Scholar] [CrossRef] [PubMed] [Green Version]
- Chistyakov, D.V.; Gavrish, G.E.; Goriainov, S.V.; Chistyakov, V.V.; Astakhova, A.A.; Azbukina, N.V.; Sergeeva, M.G. Oxylipin profiles as functional characteristics of acute inflammatory responses in astrocytes pre-treated with IL-4, IL-10, or LPS. Int. J. Mol. Sci. 2020, 21, 1780. [Google Scholar] [CrossRef] [Green Version]
- Tomlinson, D.R.; Gardiner, N.J. Glucose neurotoxicity. Nat. Rev. Neurosci. 2008, 9, 36–45. [Google Scholar] [CrossRef]
- Madhusudhanan, J.; Suresh, G.; Devanathan, V. Neurodegeneration in type 2 diabetes: Alzheimer’s as a case study. Brain Behav. 2020, 10, e01577. [Google Scholar] [CrossRef] [PubMed] [Green Version]
- Barrett, T.G.; Bundey, S.E.; Macleod, A.F. Neurodegeneration and diabetes: UK nationwide study of Wolfram (DIDMOAD) syndrome. Lancet 1995, 346, 1458–1463. [Google Scholar] [CrossRef]
- Chen, J.; Cui, X.; Zacharek, A.; Cui, Y.; Roberts, C.; Chopp, M. White matter damage and the effect of matrix metalloproteinases in type 2 diabetic mice after stroke. Stroke 2011, 42, 445–452. [Google Scholar] [CrossRef] [PubMed] [Green Version]
- Ristow, M. Neurodegenerative disorders associated with diabetes mellitus. J. Mol. Med. 2004, 82, 510–529. [Google Scholar] [CrossRef] [PubMed]
- Curia, G.; Lucchi, C.; Vinet, J.; Gualtieri, F.; Marinelli, C.; Torsello, A.; Costantino, L.; Biagini, G. Pathophysiogenesis of Mesial Temporal Lobe Epilepsy: Is Prevention of Damage Antiepileptogenic? Curr. Med. Chem. 2014, 21, 663–688. [Google Scholar] [CrossRef] [PubMed] [Green Version]
- Giordano, C.; Marchiò, M.; Timofeeva, E.; Biagini, G. Neuroactive peptides as putative mediators of antiepileptic ketogenic diets. Front. Neurol. 2014, 5, 63. [Google Scholar] [CrossRef] [PubMed]
- Stafstrom, C.E. Hyperglycemia Lowers Seizure Threshold. Epilepsy Curr. 2003, 3, 148–149. [Google Scholar] [CrossRef] [PubMed]
- Duran, J.; Gruart, A.; López-Ramos, J.C.; Delgado-García, J.M.; Guinovart, J.J. Glycogen in Astrocytes and Neurons: Physiological and Pathological Aspects. In Advances in Neurobiology; Springer: New York, NY, USA, 2019; Volume 23, pp. 311–329. [Google Scholar]
- Bélanger, M.; Allaman, I.; Magistretti, P.J. Brain energy metabolism: Focus on Astrocyte-neuron metabolic cooperation. Cell Metab. 2011, 14, 724–738. [Google Scholar] [CrossRef] [Green Version]
- Waitt, A.E.; Reed, L.; Ransom, B.R.; Brown, A.M. Emerging roles for glycogen in the CNS. Front. Mol. Neurosci. 2017, 10, 73. [Google Scholar] [CrossRef]
- Aleshin, S.; Strokin, M.; Sergeeva, M.; Reiser, G. Peroxisome proliferator-activated receptor (PPAR)β/δ, a possible nexus of PPARα- and PPARγ-dependent molecular pathways in neurodegenerative diseases: Review and novel hypotheses. Neurochem. Int. 2013, 63, 322–330. [Google Scholar] [CrossRef]
- Iglesias, J.; Morales, L.; Barreto, G.E. Metabolic and Inflammatory Adaptation of Reactive Astrocytes: Role of PPARs. Mol. Neurobiol. 2017, 54, 2518–2538. [Google Scholar] [CrossRef] [PubMed]
- Chistyakov, D.V.; Astakhova, A.A.; Goriainov, S.V.; Sergeeva, M.G. Comparison of PPAR ligands as modulators of resolution of inflammation, via their influence on cytokines and oxylipins release in astrocytes. Int. J. Mol. Sci. 2020, 21, 9577. [Google Scholar] [CrossRef] [PubMed]
- Chistyakov, D.V.; Azbukina, N.V.; Astakhova, A.A.; Polozhintsev, A.I.; Sergeeva, M.G.; Reiser, G. Toll-like receptors control p38 and JNK MAPK signaling pathways in rat astrocytes differently, when cultured in normal or high glucose concentrations. Neurochem. Int. 2019, 131, 104513. [Google Scholar] [CrossRef]
- Gandhi, G.K.; Ball, K.K.; Cruz, N.F.; Dienel, G.A. Hyperglycaemia and Diabetes Impair Gap Junctional Communication among Astrocytes. ASN Neuro 2010, 2, AN20090048. [Google Scholar] [CrossRef] [PubMed]
- Quincozes-Santos, A.; Bobermin, L.D.; de Assis, A.M.; Gonçalves, C.A.; Souza, D.O. Fluctuations in glucose levels induce glial toxicity with glutamatergic, oxidative and inflammatory implications. Biochim. Biophys. Acta Mol. Basis Dis. 2017, 1863, 1–14. [Google Scholar] [CrossRef] [PubMed]
- Wang, J.; Li, G.; Wang, Z.; Zhang, X.; Yao, L.; Wang, F.; Liu, S.; Yin, J.; Ling, E.A.; Wang, L.; et al. High glucose-induced expression of inflammatory cytokines and reactive oxygen species in cultured astrocytes. Neuroscience 2012, 202, 58–68. [Google Scholar] [CrossRef]
- Hsieh, H.L.; Chi, P.L.; Lin, C.C.; Yang, C.C.; Yang, C.M. Up-regulation of ROS-Dependent Matrix Metalloproteinase-9 from High-Glucose-Challenged Astrocytes Contributes to the Neuronal Apoptosis. Mol. Neurobiol. 2014, 50, 520–533. [Google Scholar] [CrossRef]
- Dennis, E.A.; Norris, P.C. Eicosanoid storm in infection and inflammation. Nat. Rev. Immunol. 2015, 15, 511–523. [Google Scholar] [CrossRef] [Green Version]
- Christi, W.W.; Harwoo, J.L. Oxidation of polyunsaturated fatty acids to produce lipid mediators. Essays Biochem. 2020, 64, 401–421. [Google Scholar] [CrossRef]
- Maclouf, J.; Kindahl, H.; Granström, E.; Samuelsson, B. Interactions of Prostaglandin H2 and Thromboxane A2 with Human Serum Albumin. Eur. J. Biochem. 1980, 109, 561–566. [Google Scholar] [CrossRef]
- Niederstaetter, L.; Neuditschko, B.; Brunmair, J.; Janker, L.; Bileck, A.; Favero, G.D.; Gerner, C. Eicosanoid content in fetal calf serum accounts for reproducibility challenges in cell culture. Biomolecules 2021, 11, 113. [Google Scholar] [CrossRef] [PubMed]
- Strokin, M.L.; Sergeeva, M.G.; Mevkh, A.T. The influence of serum fatty acid binding proteins on arachidonic acid uptake by macrophages. Appl. Biochem. Biotechnol. Part A Enzym. Eng. Biotechnol. 2000, 88, 195–200. [Google Scholar] [CrossRef]
- Stremmel, W.; Pohl, J.; Ring, A.; Herrmann, T. A new concept of cellular uptake and intracellular trafficking of long-chain fatty acids. Lipids 2001, 36, 981–989. [Google Scholar] [CrossRef] [PubMed]
- Du, F.; Qian, Z.M.; Zhu, L.; Wu, X.M.; Qian, C.; Chan, R.; Ke, Y. Purity, cell viability, expression of GFAP and bystin in astrocytes cultured by different procedures. J. Cell. Biochem. 2010, 109, 30–37. [Google Scholar] [CrossRef]
- Gong, P.; Xu, X.; Shi, J.; Ni, L.; Huang, Q.; Xia, L.; Nie, D.; Lu, X.; Chen, J.; Shi, W. Phosphorylation of mitogen- and stress-activated protein kinase-1 in astrocytic inflammation: A possible role in inhibiting production of inflammatory cytokines. PLoS ONE 2013, 8, e81747. [Google Scholar] [CrossRef]
- Chistyakov, D.V.D.V.; Nikolskaya, A.I.; Goriainov, S.V.S.V.; Astakhova, A.A.A.A.; Sergeeva, M.G.M.G. Inhibitor of hyaluronic acid synthesis 4-methylumbelliferone as an anti-inflammatory modulator of lps-mediated astrocyte responses. Int. J. Mol. Sci. 2020, 21, 8203. [Google Scholar] [CrossRef]
- Wellen, K.E.; Hotamisligil, G.S. Inflammation, stress, and diabetes. J. Clin. Investig. 2005, 115, 1111–1119. [Google Scholar] [CrossRef] [PubMed] [Green Version]
- Saura, J. Microglial cells in astroglial cultures: A cautionary note. J. Neuroinflamm. 2007, 4, 26. [Google Scholar] [CrossRef] [Green Version]
- Fonseca, J.; Moradi, F.; Valente, A.J.F.; Stuart, J.A. Oxygen and glucose levels in cell culture media determine resveratrol’s effects on growth, hydrogen peroxide production, and mitochondrial dynamics. Antioxidants 2018, 7, 157. [Google Scholar] [CrossRef] [PubMed] [Green Version]
- Li, W.; Choudhury, G.R.; Winters, A.; Prah, J.; Lin, W.; Liu, R.; Yang, S.H. Hyperglycemia alters astrocyte metabolism and inhibits astrocyte proliferation. Aging Dis. 2018, 9, 674–684. [Google Scholar] [CrossRef] [Green Version]
- Hansson, E.; Björklund, U.; Skiöldebrand, E.; Rönnbäck, L. Anti-inflammatory effects induced by pharmaceutical substances on inflammatory active brain astrocytes—Promising treatment of neuroinflammation. J. Neuroinflamm. 2018, 15, 321. [Google Scholar] [CrossRef] [PubMed]
- Staricha, K.; Meyers, N.; Garvin, J.; Liu, Q.; Rarick, K.; Harder, D.; Cohen, S. Effect of high glucose condition on glucose metabolism in primary astrocytes. Brain Res. 2020, 1732, 146702. [Google Scholar] [CrossRef] [PubMed]
- Kogel, V.; Trinh, S.; Gasterich, N.; Beyer, C.; Seitz, J. Long-Term Glucose Starvation Induces Inflammatory Responses and Phenotype Switch in Primary Cortical Rat Astrocytes. J. Mol. Neurosci. 2021. [Google Scholar] [CrossRef]
- Koepsell, H. Glucose transporters in brain in health and disease. Pflug. Arch. Eur. J. Physiol. 2020, 472, 1299–1343. [Google Scholar] [CrossRef]
- Ladu, M.J.; Shah, J.A.; Reardon, C.A.; Getz, G.S.; Bu, G.; Hu, J.; Guo, L.; Van Eldik, L.J. Apolipoprotein E receptors mediate the effects of β-amyloid on astrocyte cultures. J. Biol. Chem. 2000, 275, 33974–33980. [Google Scholar] [CrossRef] [PubMed] [Green Version]
- Jang, E.; Kim, J.-H.; Lee, S.; Kim, J.-H.; Seo, J.-W.; Jin, M.; Lee, M.-G.; Jang, I.-S.; Lee, W.-H.; Suk, K. Phenotypic Polarization of Activated Astrocytes: The Critical Role of Lipocalin-2 in the Classical Inflammatory Activation of Astrocytes. J. Immunol. 2013, 191, 5204–5219. [Google Scholar] [CrossRef] [Green Version]
- Strokin, M.; Sergeeva, M.; Reiser, G. Docosahexaenoic acid and arachidonic acid release in rat brain astrocytes is mediated by two separate isoforms of phospholipase A 2 and is differently regulated by cyclic AMP and Ca2+. Br. J. Pharmacol. 2003, 139, 1014–1022. [Google Scholar] [CrossRef] [Green Version]
- Corey, E.J.; Shih, C.; Cashman, J.R. Docosahexaenoic acid is a strong inhibitor of prostaglandin but not leukotriene biosynthesis. Proc. Natl. Acad. Sci. USA 1983, 80, 3581–3584. [Google Scholar] [CrossRef] [Green Version]
- Vecchio, A.J.; Simmons, D.M.; Malkowski, M.G. Structural basis of fatty acid substrate binding to cyclooxygenase-2. J. Biol. Chem. 2010, 285, 22152–22163. [Google Scholar] [CrossRef] [Green Version]
- Watanabe, K. Prostaglandin F synthase. Prostaglandins Other Lipid Mediat. 2002, 68–69, 401–407. [Google Scholar] [CrossRef]
- Matsunobu, T.; Okuno, T.; Yokoyama, C.; Yokomizo, T. Thromboxane A synthase-independent production of 12-hydroxyheptadecatrienoic acid, a BLT2 ligand. J. Lipid Res. 2013, 54, 2979–2987. [Google Scholar] [CrossRef] [PubMed] [Green Version]
- Chistyakov, D.V.; Grabeklis, S.; Goriainov, S.V.; Chistyakov, V.V.; Sergeeva, M.G.; Reiser, G. Astrocytes synthesize primary and cyclopentenone prostaglandins that are negative regulators of their proliferation. Biochem. Biophys. Res. Commun. 2018, 500, 204–210. [Google Scholar] [CrossRef] [PubMed]


Publisher’s Note: MDPI stays neutral with regard to jurisdictional claims in published maps and institutional affiliations. |
© 2021 by the authors. Licensee MDPI, Basel, Switzerland. This article is an open access article distributed under the terms and conditions of the Creative Commons Attribution (CC BY) license (https://creativecommons.org/licenses/by/4.0/).
Share and Cite
Chistyakov, D.V.; Goriainov, S.V.; Astakhova, A.A.; Sergeeva, M.G. High Glucose Shifts the Oxylipin Profiles in the Astrocytes towards Pro-Inflammatory States. Metabolites 2021, 11, 311. https://0-doi-org.brum.beds.ac.uk/10.3390/metabo11050311
Chistyakov DV, Goriainov SV, Astakhova AA, Sergeeva MG. High Glucose Shifts the Oxylipin Profiles in the Astrocytes towards Pro-Inflammatory States. Metabolites. 2021; 11(5):311. https://0-doi-org.brum.beds.ac.uk/10.3390/metabo11050311
Chicago/Turabian StyleChistyakov, Dmitry V., Sergei V. Goriainov, Alina A. Astakhova, and Marina G. Sergeeva. 2021. "High Glucose Shifts the Oxylipin Profiles in the Astrocytes towards Pro-Inflammatory States" Metabolites 11, no. 5: 311. https://0-doi-org.brum.beds.ac.uk/10.3390/metabo11050311