A New Microfluidic Platform for Studying Natural Killer Cell and Dendritic Cell Interactions

 and
and 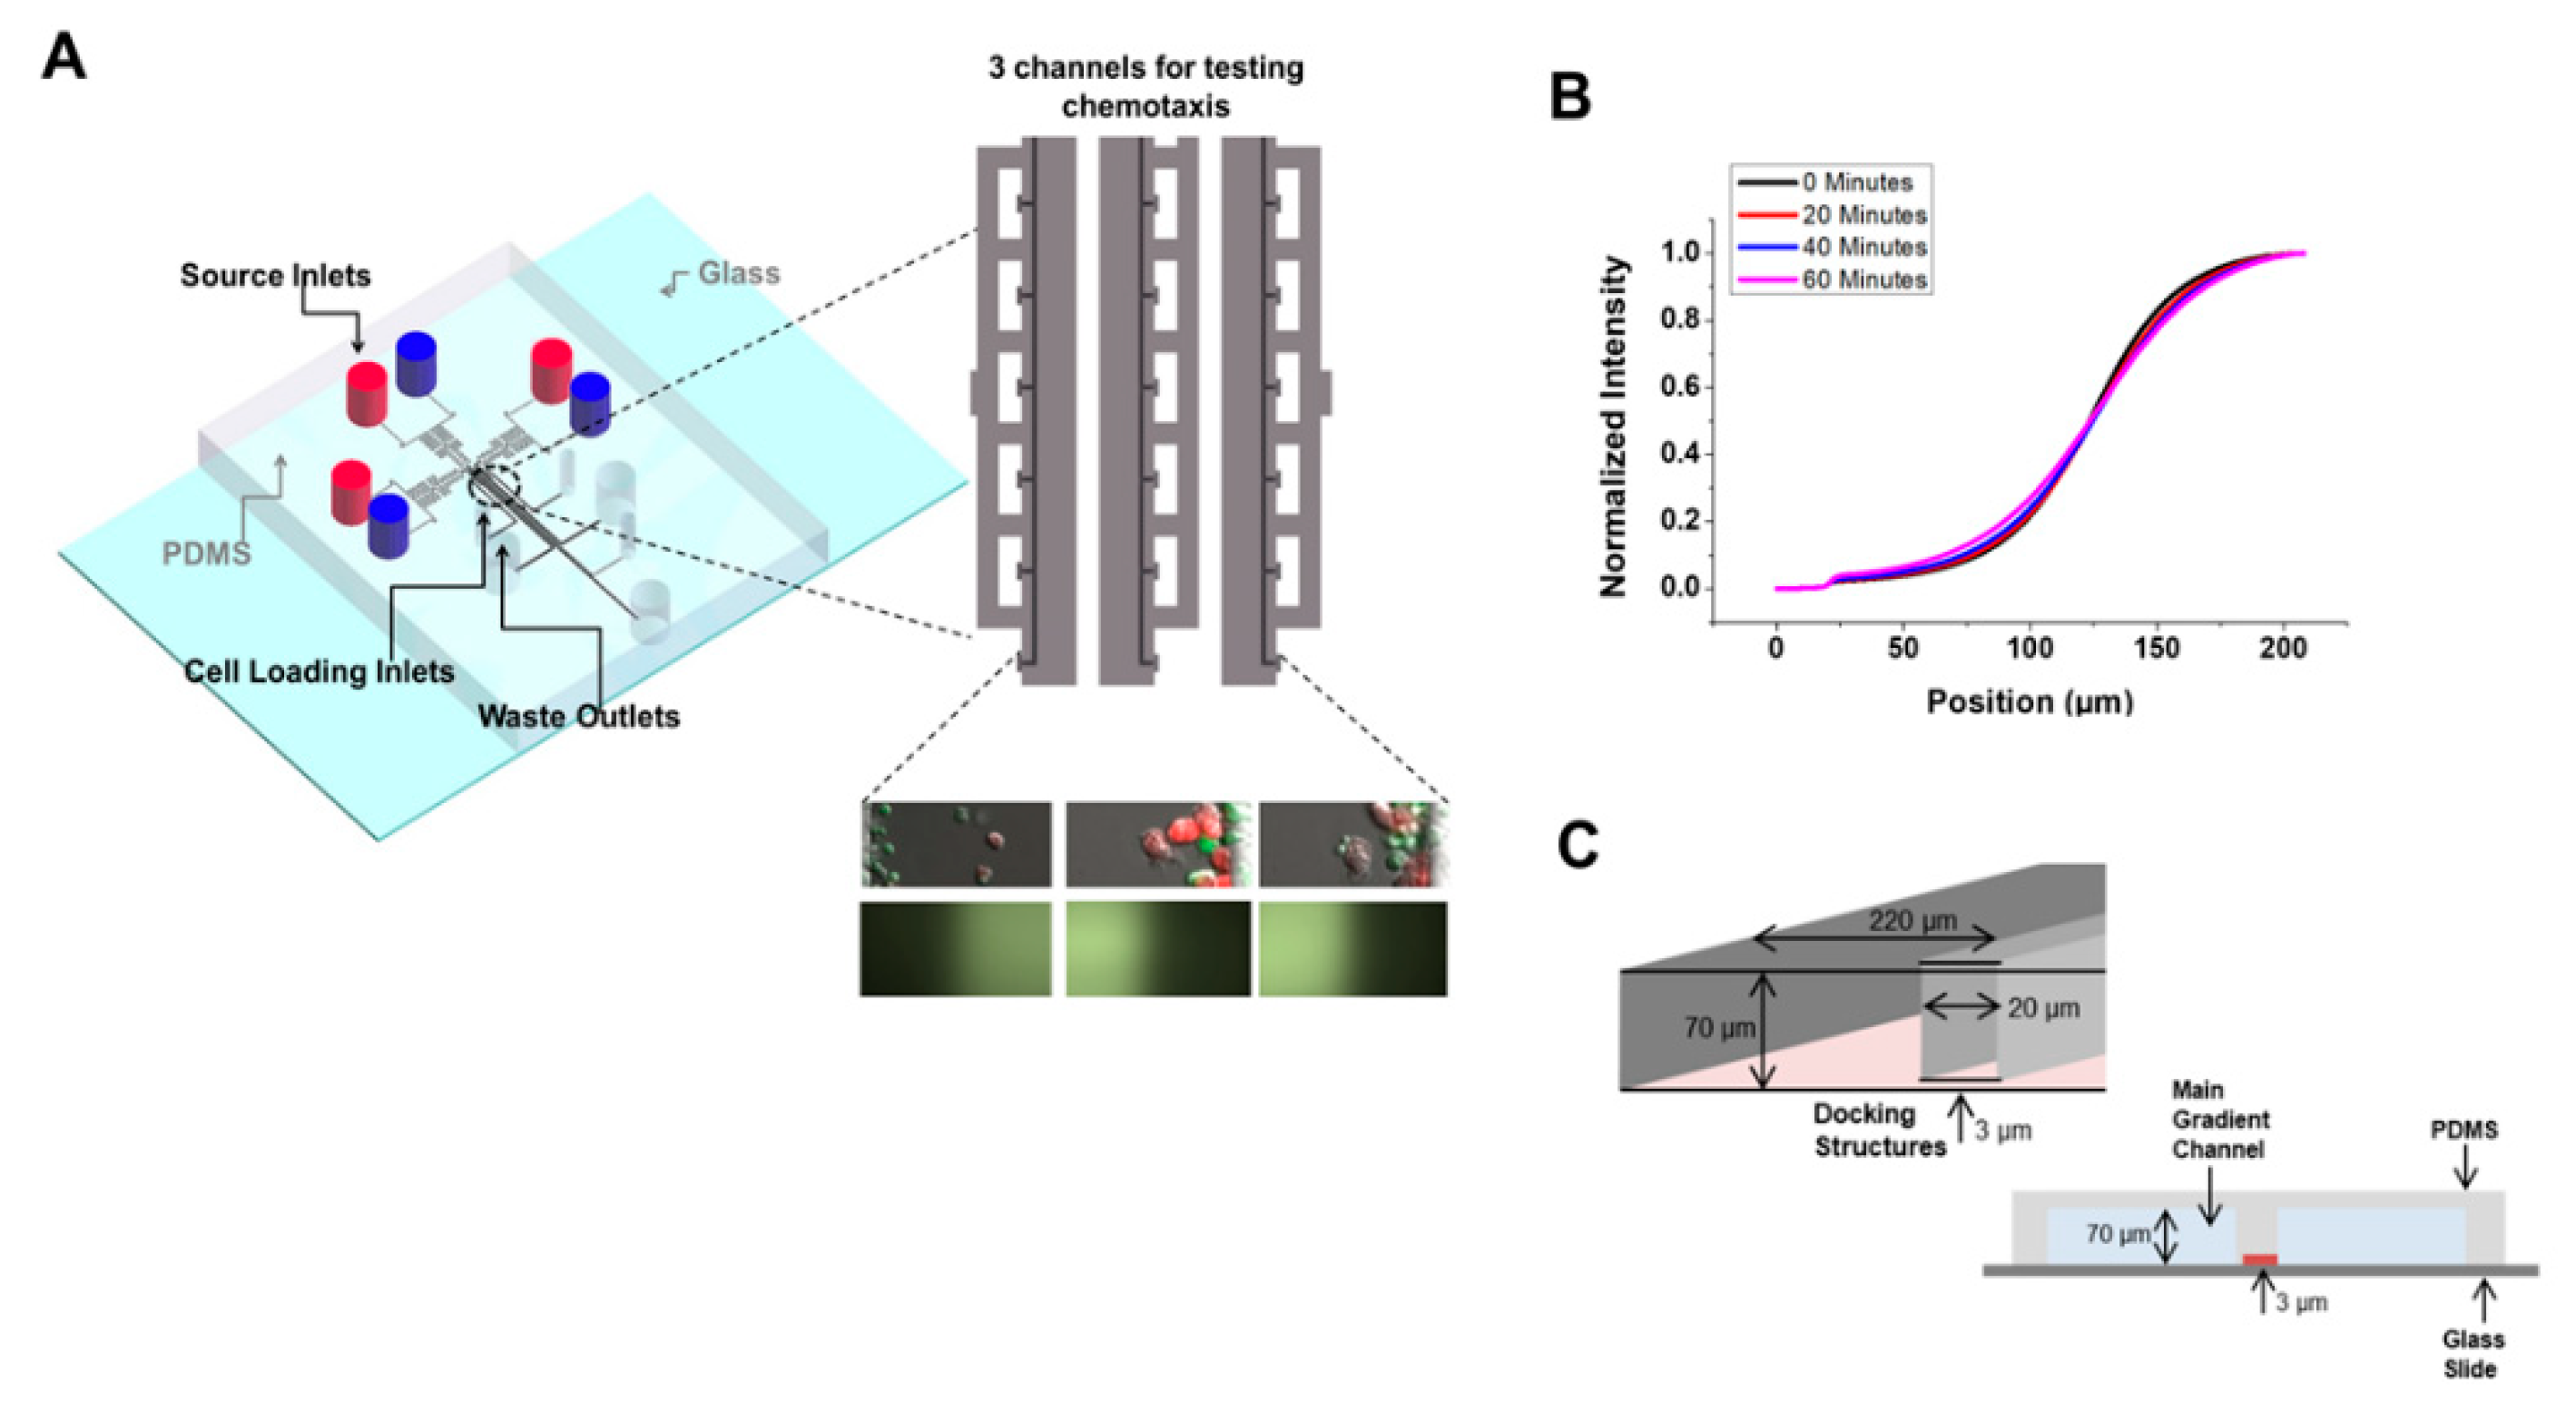
Abstract
:1. Introduction
2. Materials and Methods
2.1. Natural Killer (NK) Cell Isolation and Activation
2.2. Preparation of Dendritic Cell (DC) Cultures
2.3. Microfluidic Device Preparation
2.4. Cell Migration and Cell–Cell Interaction Experiments
3. Data Analysis
4. Results
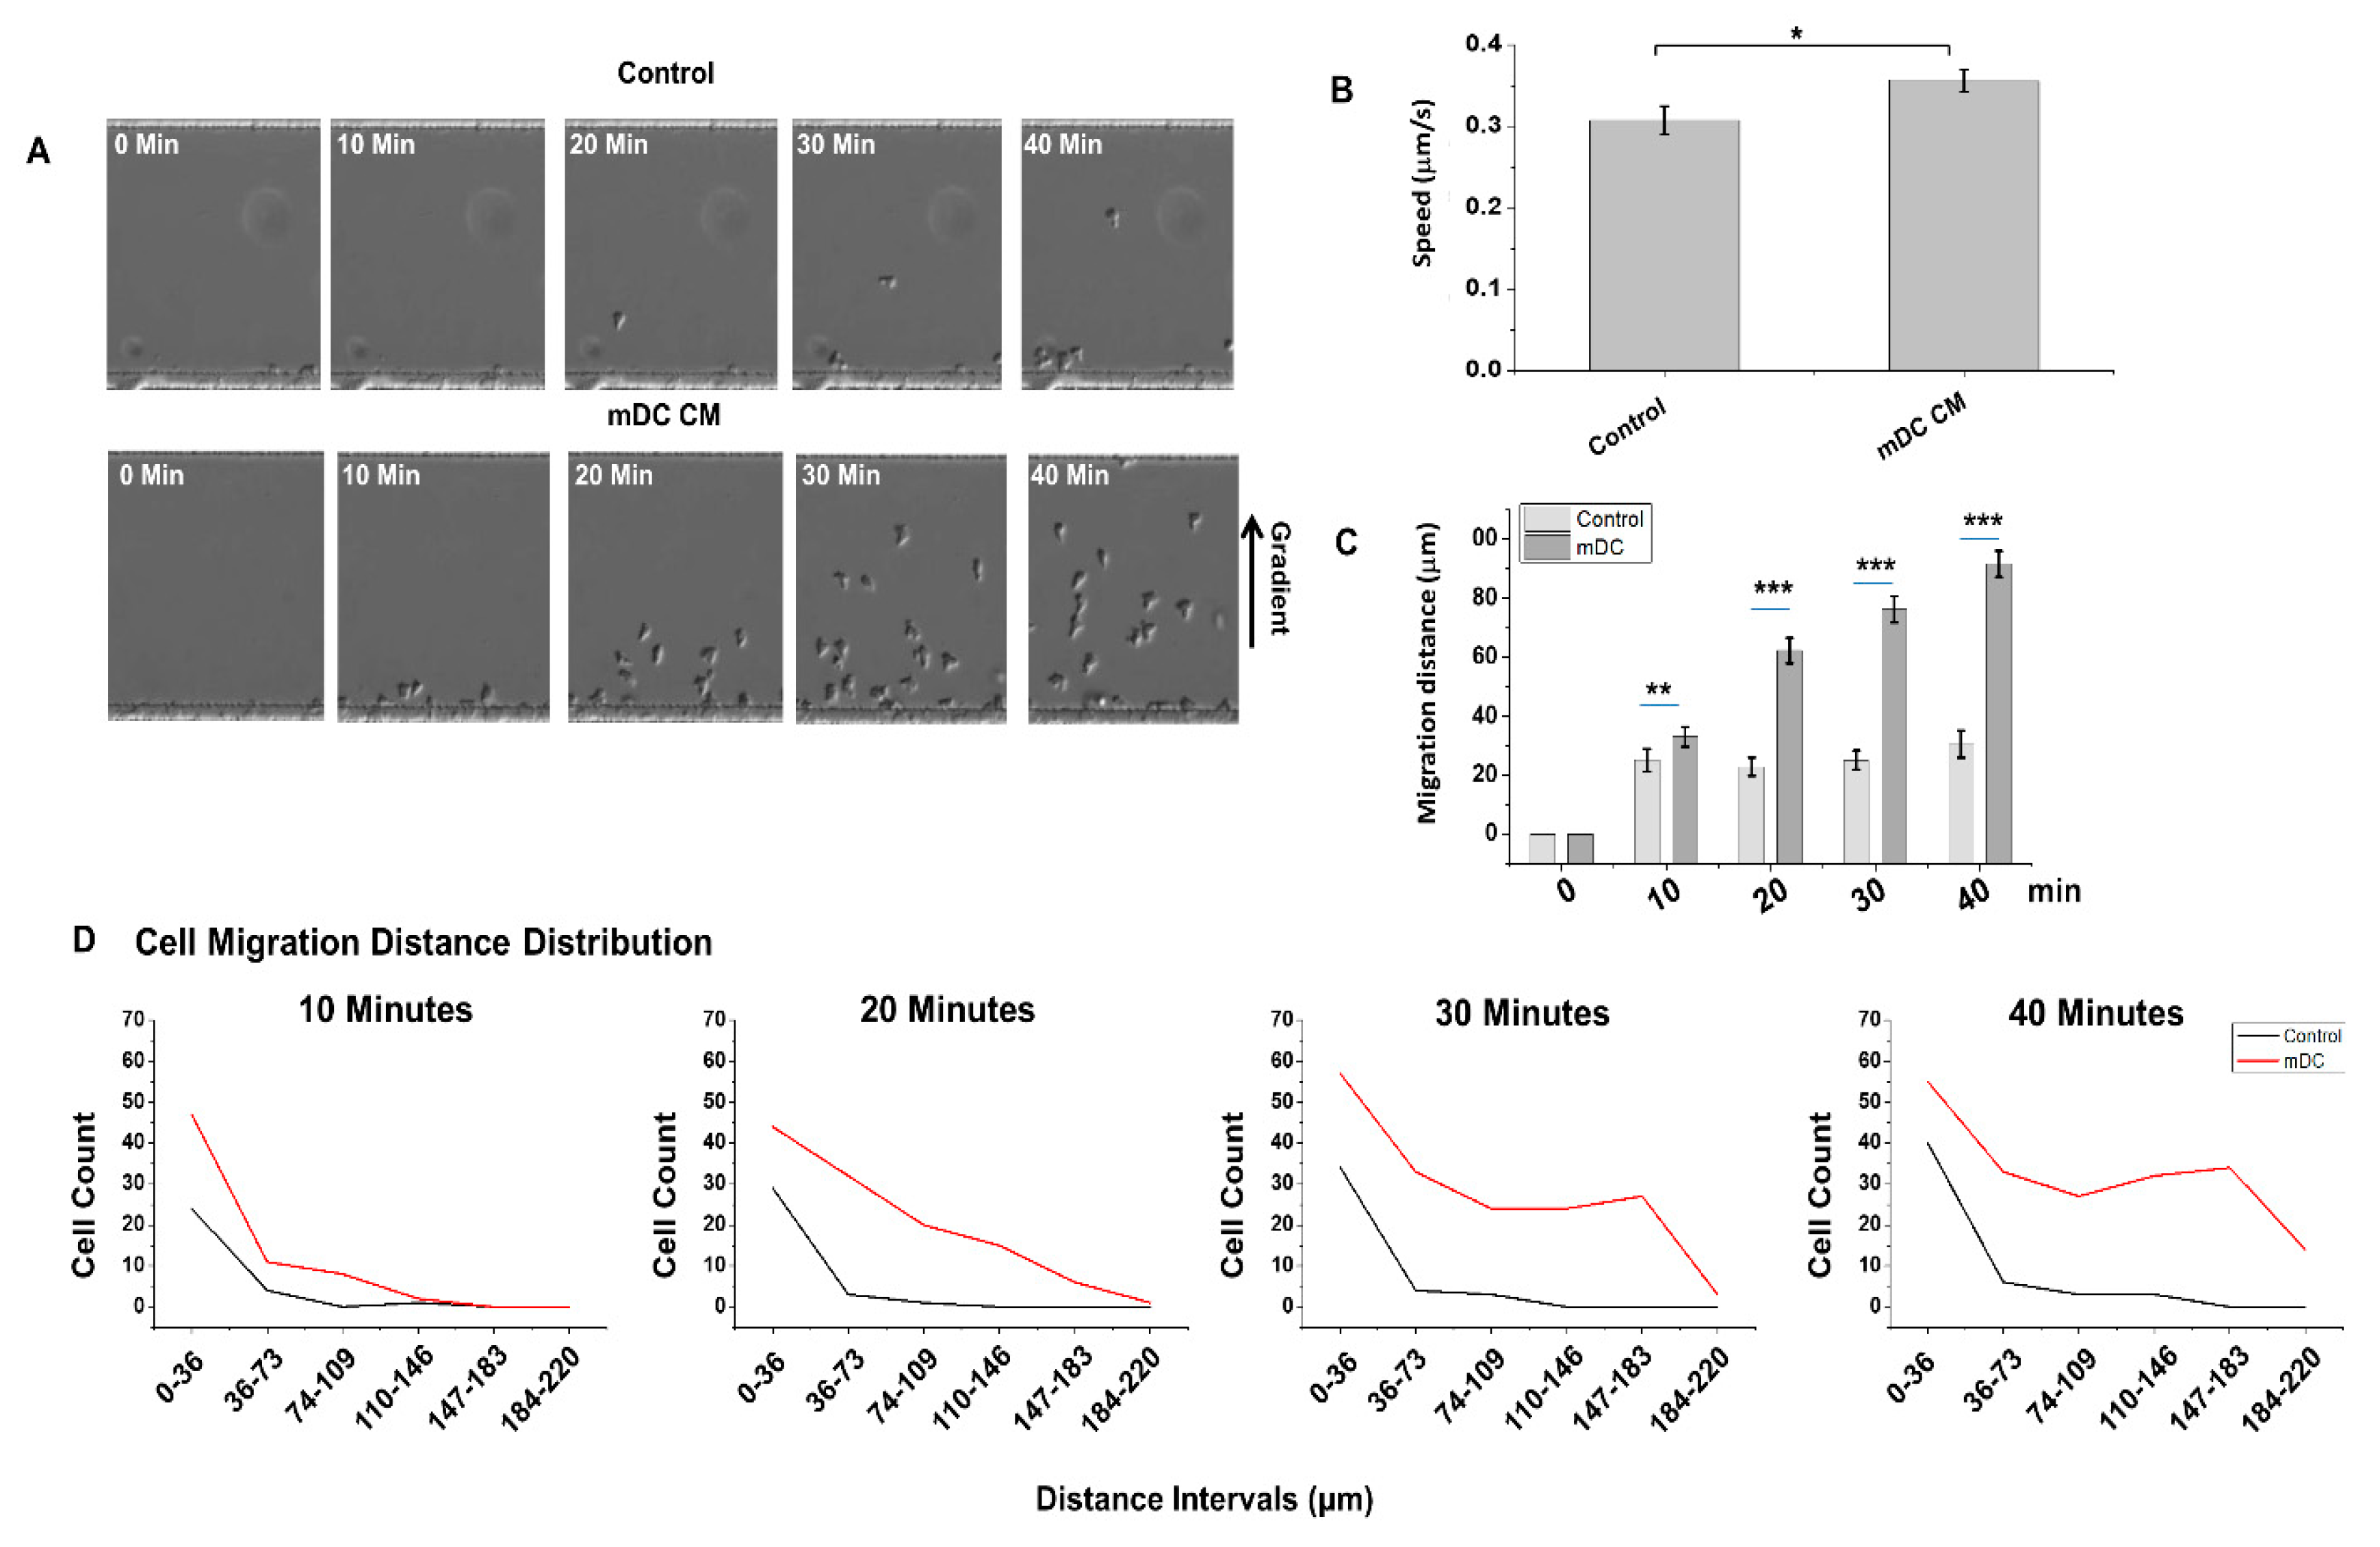
4.1. The Use of the D3-Chip Microfluidic Device in the Analyses of Chemotactic Responses of NK-Cells in NK–DC Crosstalk
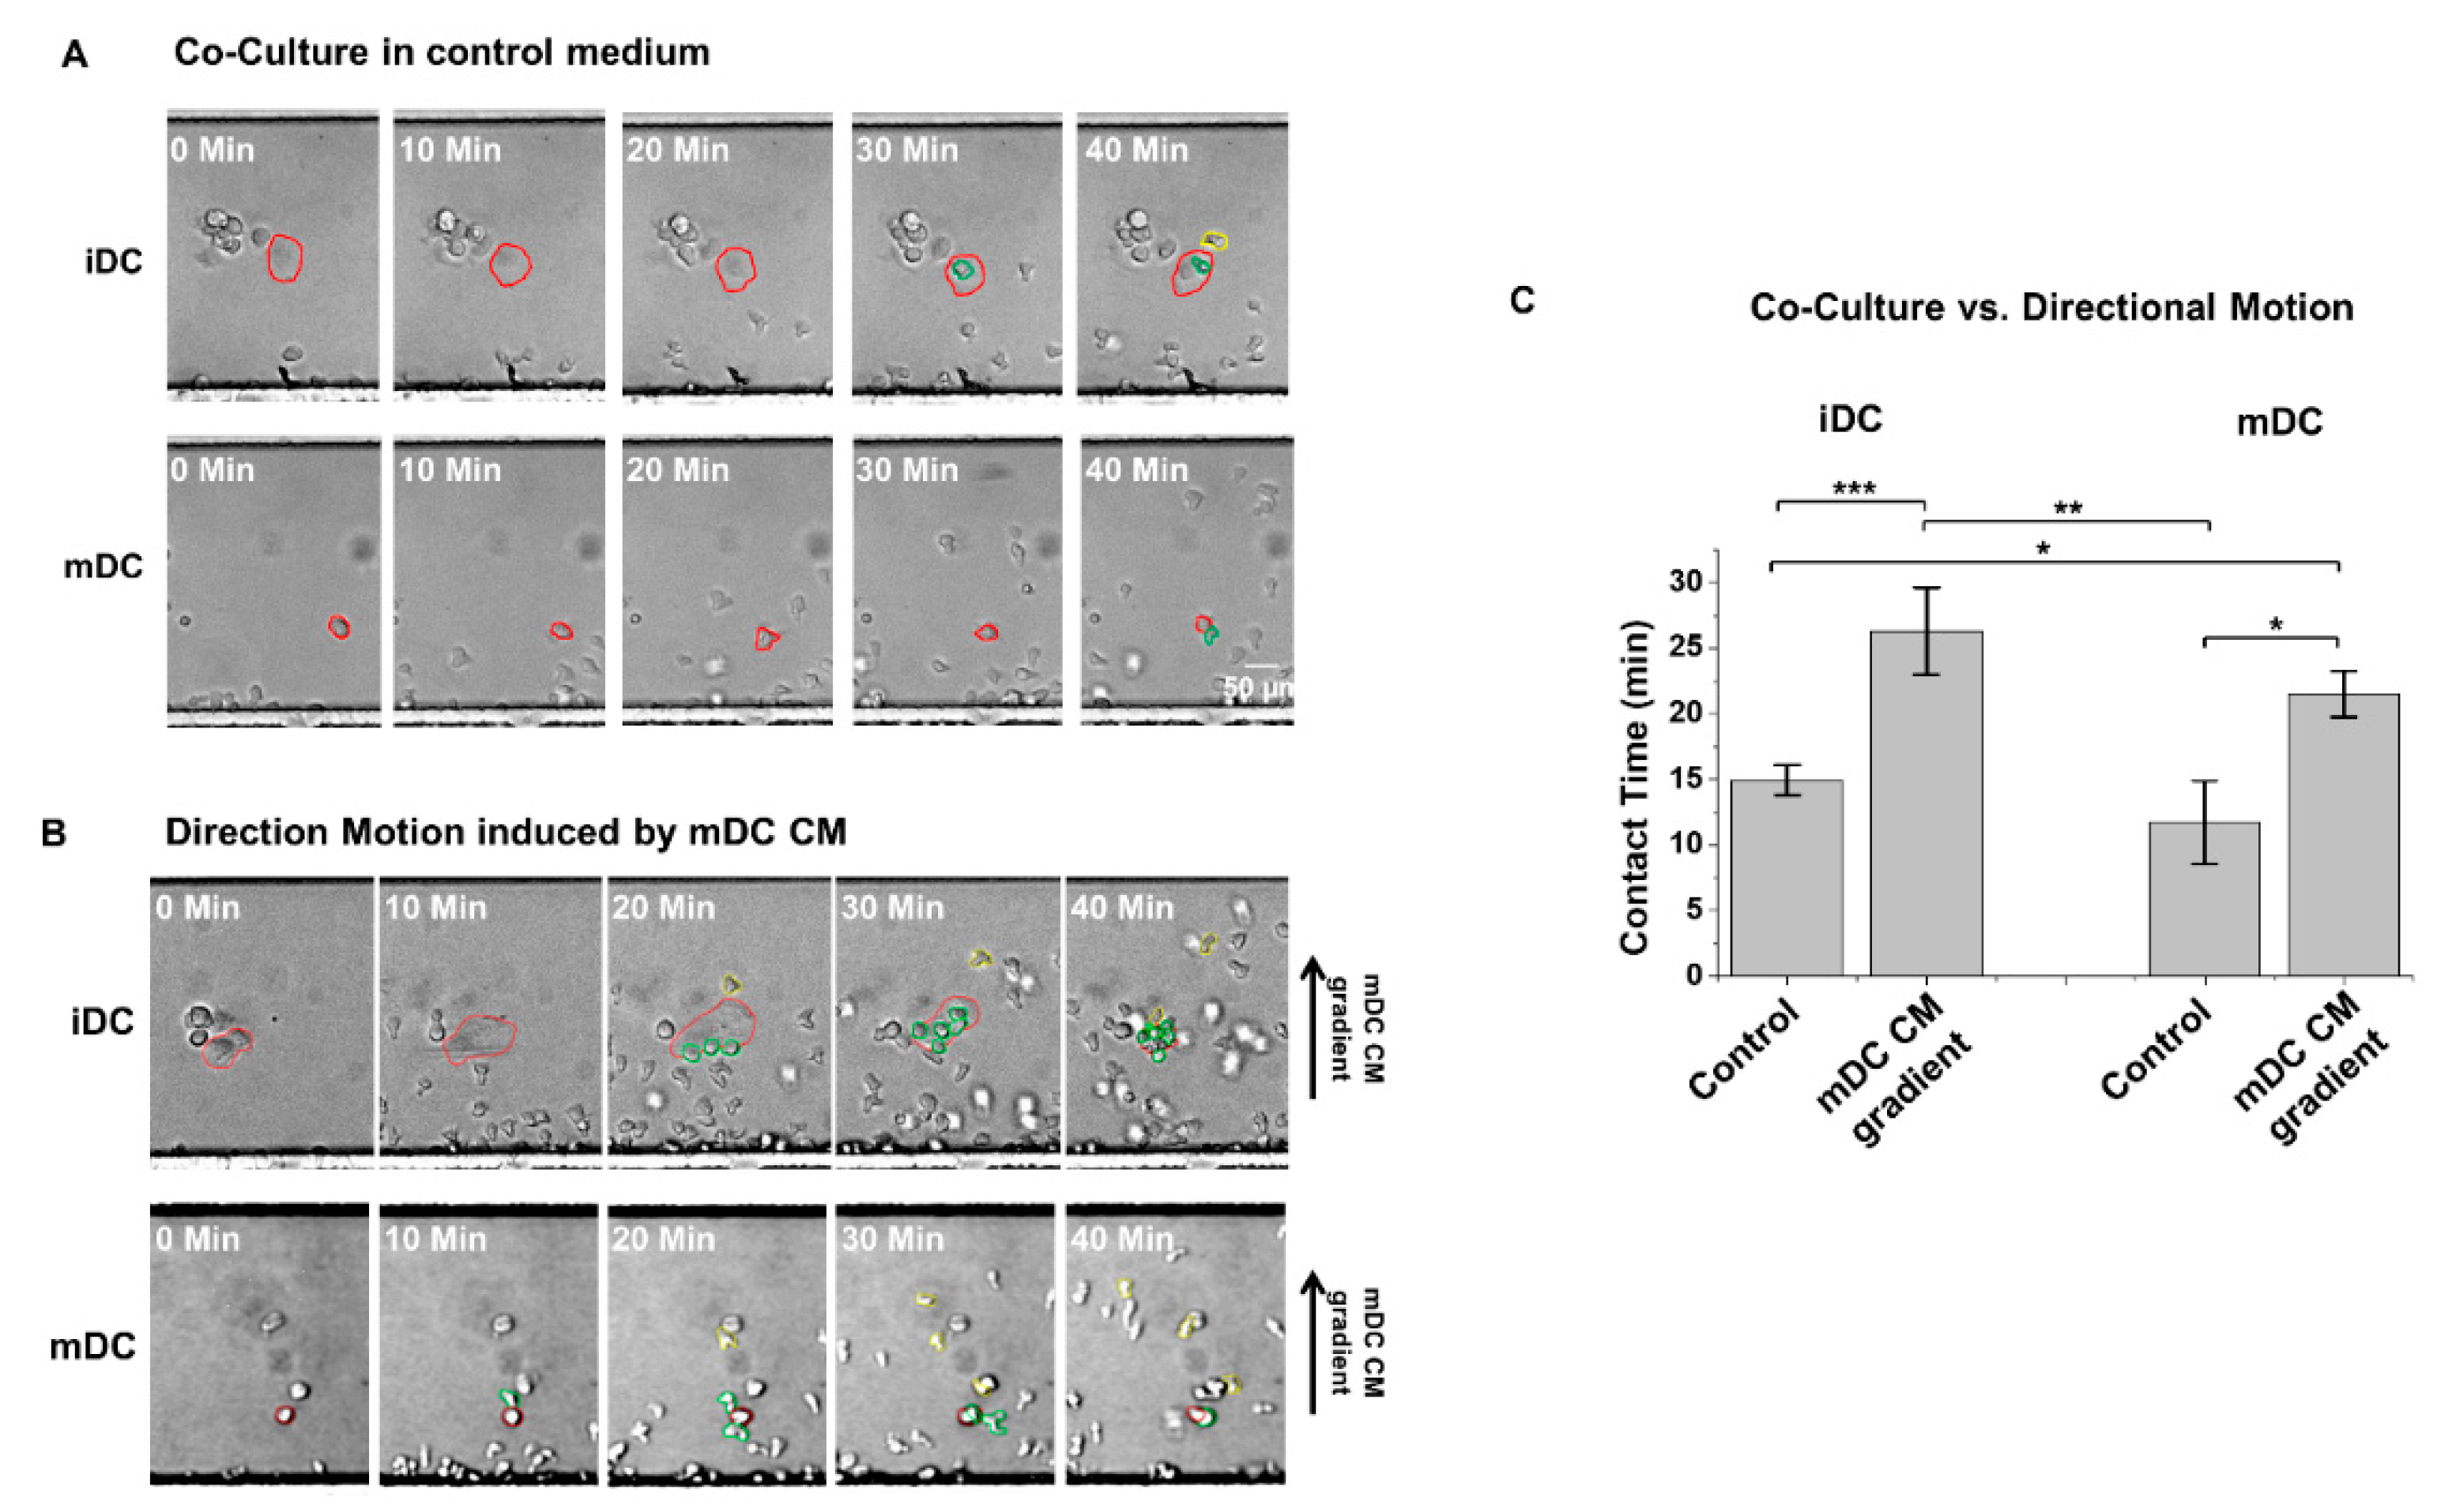
4.2. Induced Cell Migration Lengthens NK–DC Interaction Time in D3-Chip
4.3. The Use of a Novel T2-Chip to Further Examine NK–DC Interactions
5. Discussion
Supplementary Materials
Author Contributions
Funding
Conflicts of Interest
References
- Friedl, P.; Weigelin, B. Interstitial leukocyte migration and immune function. Nat. Immunol. 2008, 9, 960–969. [Google Scholar] [CrossRef] [PubMed]
- Campbell, K.S.; Hasegawa, J. Natural killer cell biology: An update and future directions. J. Allergy Clin. Immunol. 2013, 132, 536–544. [Google Scholar] [CrossRef] [PubMed] [Green Version]
- Bernardini, G.; Sciume, G.; Santoni, A. Differential chemotactic receptor requirements for NK cell subset trafficking into bone marrow. Front. Immunol. 2013, 4, 12. [Google Scholar] [CrossRef] [PubMed] [Green Version]
- Pachynski, R.K.; Zabel, B.A.; Kohrt, H.E.; Tejeda, N.M.; Monnier, J.; Swanson, C.D.; Holzer, A.K.; Gentles, A.J.; Sperinde, G.V.; Edalati, A.; et al. The chemoattractant chemerin suppresses melanoma by recruiting natural killer cell antitumor defenses. J. Exp. Med. 2012, 209, 1427–1435. [Google Scholar] [CrossRef]
- Shi, F.D.; Ljunggren, H.G.; La, C.A.; Van, K.L. Organ-specific features of natural killer cells. Nat. Rev. Immunol. 2011, 11, 658–671. [Google Scholar] [CrossRef]
- Somanchi, S.S.; Somanchi, A.; Cooper, L.J.N.; Lee, D.A. Engineering lymph node homing of ex vivo-expanded human natural killer cells via trogocytosis of the chemokine receptor CCR7. Blood 2012, 119, 5164–5172. [Google Scholar] [CrossRef]
- Walzer, T.; Chiossone, L.; Chaix, J.; Calver, A.; Carozzo, C.; Garrigue-Antar, L.; Jacques, Y.; Baratin, M.; Tomasello, E.; Vivier, E. Natural killer cell trafficking in vivo requires a dedicated sphingosine 1-phosphate receptor. Nat. Immunol. 2007, 8, 1337–1344. [Google Scholar] [CrossRef]
- Walzer, T.; Vivier, E. G-protein-coupled receptors in control of natural killer cell migration. Trends Immunol. 2011, 32, 486–492. [Google Scholar] [CrossRef]
- Fernandez, N.C.; Flament, C.; Crepineau, F.; Angevin, E.; Vivier, E.; Zitvogel, L. Dendritic cells (DC) promote natural killer (NK) cell functions: Dynamics of the human DC/NK cell cross talk. Eur. Cytokine Netw. 2002, 13, 17–27. [Google Scholar]
- McColl, S.R. Chemokines and dendritic cells: A crucial alliance. Immunol. Cell Biol. 2002, 80, 489–496. [Google Scholar] [CrossRef]
- Vujanovic, L.; Ballard, W.; Thorne, S.H.; Vujanovic, N.L.; Butterfield, L.H. Adenovirus-engineered human dendritic cells induce natural killer cell chemotaxis via CXCL8/IL-8 and CXCL10/IP-10. Oncoimmunology 2012, 1, 448–457. [Google Scholar] [CrossRef] [PubMed] [Green Version]
- Boudreau, J.E.; Bonehill, A.; Thielemans, K.; Wan, Y.H. Engineering dendritic cells to enhance cancer immunotherapy. Mol. Ther. 2011, 19, 841–853. [Google Scholar] [CrossRef] [PubMed] [Green Version]
- Irimia, D.; Ellett, F. Big insights from small volumes: Deciphering complex leukocyte behaviors using microfluidics. J. Leukoc. Biol. 2016, 100, 291–304. [Google Scholar] [CrossRef] [PubMed] [Green Version]
- Li, J.N.; Baskaran, H.; Dertinger, S.K.W.; Whitesides, G.M.; Van de Water, L.; Toner, M. Neutrophil chemotaxis in linear and complex gradients of interleukin-8 formed in a microfabricated device. Nat. Biotechnol. 2002, 20, 826–830. [Google Scholar]
- Mahmood, S.; Nandagopal, S.; Sow, I.; Lin, F.; Kung, S.K.P. Microfluidic-based, live-cell analysis allows assessment of NK-cell migration in response to crosstalk with dendritic cells. Eur. J. Immunol. 2014, 44, 2737–2748. [Google Scholar] [CrossRef] [PubMed]
- Kataria, H.; Alizadeh, A.; Shahriary, G.M.; Rizi, S.S.; Henrie, R.; Santhosh, K.T.; Thliveris, J.A.; Karimi-Abdolrezaee, S. Neuregulin-1 promotes remyelination and fosters a pro-regenerative inflammatory response in focal demyelinating lesions of the spinal cord. Glia 2018, 66, 538–561. [Google Scholar] [CrossRef]
- Nandagopal, S.; Lin, F.; Kung, S.K.P. Methods in Molecular Biology; Humana Press: New York, NY, USA, 2016; pp. 75–86. [Google Scholar]
- Yang, K.; Peretz-Soroka, H.; Wu, J.D.; Zhu, L.; Cui, X.L.; Zhang, M.; Rigatto, C.; Liu, Y.; Lin, F. Fibroblast growth factor 23 weakens chemotaxis of human blood neutrophils in microfluidic devices. Sci. Rep. 2017, 7, 3100. [Google Scholar] [CrossRef] [Green Version]
- Ferlazzo, G.; Morandi, B. Cross-Talks between Natural Killer Cells and Distinct Subsets of Dendritic Cells. Front. Immunol. 2014, 5, 159. [Google Scholar] [CrossRef] [Green Version]
- Mahmood, S.; Upreti, D.; Sow, I.; Amari, A.; Nandagopal, S.; Kung, S.K.P. Bidirectional interactions of NK cells and dendritic cells in immunotherapy: Current and future perspective. Immunotherapy 2015, 7, 301–308. [Google Scholar] [CrossRef]
- Thomas, R.; Yang, X. NK-DC Crosstalk in Immunity to Microbial Infection. J. Immunol. Res. 2016, 2016, 6374379. [Google Scholar] [CrossRef] [Green Version]
- Qi, H.; Kastenmuller, W.; Germain, R.N. Spatiotemporal basis of innate and adaptive immunity in secondary lymphoid tissue. Annu. Rev. Cell Dev. Biol. 2014, 30, 141–167. [Google Scholar] [CrossRef] [PubMed]
- Deguine, J.; Bousso, P. Dynamics of NK cell interactions in vivo. Immunol. Rev. 2013, 251, 154–159. [Google Scholar] [CrossRef] [PubMed]
- Beuneu, H.; Deguine, J.; Breart, B.; Mandelboim, O.; Di Santo, J.P.; Bousso, P. Dynamic behavior of NK cells during activation in lymph nodes. Blood 2009, 114, 3227–3234. [Google Scholar] [CrossRef] [PubMed]
- Burkett, P.R.; Koka, R.; Chien, M.; Chai, S.; Boone, D.L.; Ma, A. Coordinate expression and trans presentation of interleukin (IL)-15Ralpha and IL-15 supports natural killer cell and memory CD(8+) T cell homeostasis. J. Exp. Med. 2004, 200, 825–834. [Google Scholar] [CrossRef] [PubMed] [Green Version]
- Degli-Esposti, M.A.; Smyth, M.J. Close encounters of different kinds: Dendritic cells and NK cells take centre stage. Nat. Rev. Immunol. 2005, 5, 112–124. [Google Scholar] [CrossRef] [PubMed]
- Romee, R.; Schneider, S.E.; Leong, J.W.; Chase, J.M.; Keppel, C.R.; Sullivan, R.P.; Cooper, M.A.; Fehniger, T.A. Cytokine activation induces human memory-like NK cells. Blood 2012, 120, 4751–4760. [Google Scholar] [CrossRef] [Green Version]
- Peretz-Soroka, H.; Tirosh, R.; Hipolito, J.; Huebner, E.; Alexander, M.; Fiege, J.; Lin, F. A bioenergetic mechanism for amoeboid-like cell motility profiles tested in a microfluidic electrotaxis assay. Integr. Biol. 2017, 9, 844–856. [Google Scholar] [CrossRef] [Green Version]


© 2019 by the authors. Licensee MDPI, Basel, Switzerland. This article is an open access article distributed under the terms and conditions of the Creative Commons Attribution (CC BY) license (http://creativecommons.org/licenses/by/4.0/).
Share and Cite
Hipolito, J.; Peretz-Soroka, H.; Zhang, M.; Yang, K.; Karimi-Abdolrezaee, S.; Lin, F.; Kung, S.K.P. A New Microfluidic Platform for Studying Natural Killer Cell and Dendritic Cell Interactions. Micromachines 2019, 10, 851. https://0-doi-org.brum.beds.ac.uk/10.3390/mi10120851
Hipolito J, Peretz-Soroka H, Zhang M, Yang K, Karimi-Abdolrezaee S, Lin F, Kung SKP. A New Microfluidic Platform for Studying Natural Killer Cell and Dendritic Cell Interactions. Micromachines. 2019; 10(12):851. https://0-doi-org.brum.beds.ac.uk/10.3390/mi10120851
Chicago/Turabian StyleHipolito, Jolly, Hagit Peretz-Soroka, Manli Zhang, Ke Yang, Soheila Karimi-Abdolrezaee, Francis Lin, and Sam K.P. Kung. 2019. "A New Microfluidic Platform for Studying Natural Killer Cell and Dendritic Cell Interactions" Micromachines 10, no. 12: 851. https://0-doi-org.brum.beds.ac.uk/10.3390/mi10120851