Article

Enhancing Electrical Outputs of Piezoelectric Nanogenerators by Controlling the Dielectric Constant of ZnO/PDMS Composite

1
Department of Nano Energy Engineering & BK 21 PLUS Nanoconvergence Technology Division, Pusan National University, Busan 46241, Korea
2
Department of Mechanical Engineering, The University of Hong Kong, Pokfulam, Hong Kong 999077, China
3
Department of Optics and Mechatronics Engineering, Pusan National University, Busan 46241, Korea
*
Authors to whom correspondence should be addressed.
Y.A. and D.A. contributed equally to this work.
Submission received: 3 May 2021 / Revised: 18 May 2021 / Accepted: 27 May 2021 / Published: 28 May 2021

Abstract

:
Structural optimizations of the piezoelectric layer in nanogenerators have been predicted to enhance the output performance in terms of the figure of merit. Here, we report the effect of dielectric constant on electrical outputs of piezoelectric nanogenerator using ZnO/PDMS composites with varied ZnO coverages. The dielectric constant of piezoelectric layers was adjusted from 3.37 to 6.75. The electrical output voltage of 9 mV was achieved in the nanogenerator containing the ZnO/PDMS composite with the dielectric constant of 3.46, which is an 11.3-fold enhancement compared to the value of the nanogenerator featuring the composite with high dielectric constants. Significantly, lowering the dielectric constant of the piezoelectric layer improves the electrical output performance of piezoelectric nanogenerators.

1. Introduction

Ever since the conceptual study of piezoelectric nanogenerators (PENGs) in 2006 [1], most researchers have focused on nanogenerators featuring ZnO nanostructures due in a large part to their non-toxicity, biocompatibility, and sensitivity to tiny strains. In their early development, the performance of nanogenerator was governed by the Schottky contact at the metal–ZnO interface. However, the Schottky barrier concept is problematic especially for sustainability, reproducibility, processability, and uniformity, and has slowed down improvements in the performance of such devices. A milestone in 2010 [2], which was the integration of dielectric barriers into devices, shifted the paradigm for the structural design of devices. Subsequently, the effective integration of ZnO nanorod arrays dramatically increased the output performance up to 4.4 W m−2 [3]. Successes in nanogenerators comprising ZnO nanostructures have driven the development of many advanced piezoelectric materials [4,5,6,7,8,9,10,11]. Piezoelectric materials, which have been adopted in nanogenerators, can be categorized into two different groups: inorganic and organic materials. Specifically, two-dimensional inorganic and organic materials have been of great interest, as they fulfill the needs of flexible energy harvesting. Some promising piezoelectricity includes MoS2 [12] and WSe2 [13], with piezoelectric coefficients of ~3 pm V−1 and 3.4 pm V−1, respectively. After stacking many units using an efficient approach was found to greatly enhance the output, PbI2 [14] and hexagonal-BN [15] were used as active materials for nanogenerators. Researchers have also demonstrated piezoelectric polymers [16] and biomaterials [17,18,19] with piezoelectric coefficients in the range of ~7.8 to 30 pm V−1.
Apart from the material studies, structural optimizations of PENGs have been proposed to improve the performance in terms of the figure of merit (FOM) using the relationship of the open-circuit voltage, Voc, of the piezoelectric layer as follows:
V O C = d i j ε r ε 0 σ i j g e
where dij is the piezoelectric coefficient, σij is the applied stress, ge is the gap distance between electrodes, εr is the relative dielectric constant, and ε0 is the vacuum permittivity [20]. Control over the relative dielectric constant of the piezoelectric layer is predicted to be a factor in enhancing the FOM, and ultimately, the high open-circuit voltage. Herein, we investigated the effect of dielectric constant modulation on the electrical output of piezoelectric nanogenerators featuring a ZnO/polydimethylsiloxane (PDMS) composite. The porous ZnO membranes were fabricated by calcinating the ZnO/poly(methyl methacrylate) (PMMA) composite, and the elastomeric PDMS was infiltrated into the porous ZnO membrane to form the ZnO/PDMS composite. Our approach to control the dielectric constant of the ZnO/PDMS composite relied on regulating the porosity of the ZnO membrane. The dielectric constant of the piezoelectric composite was successfully modulated from 3.37 to 6.75 by changing the ZnO concentration in the ZnO/PMMA composite. The output voltage of the piezoelectric nanogenerator was shown to improve approximately 11.3-fold by lowering the dielectric constant of the composite, which is well matched with our simulation results.

2. Experimental Section

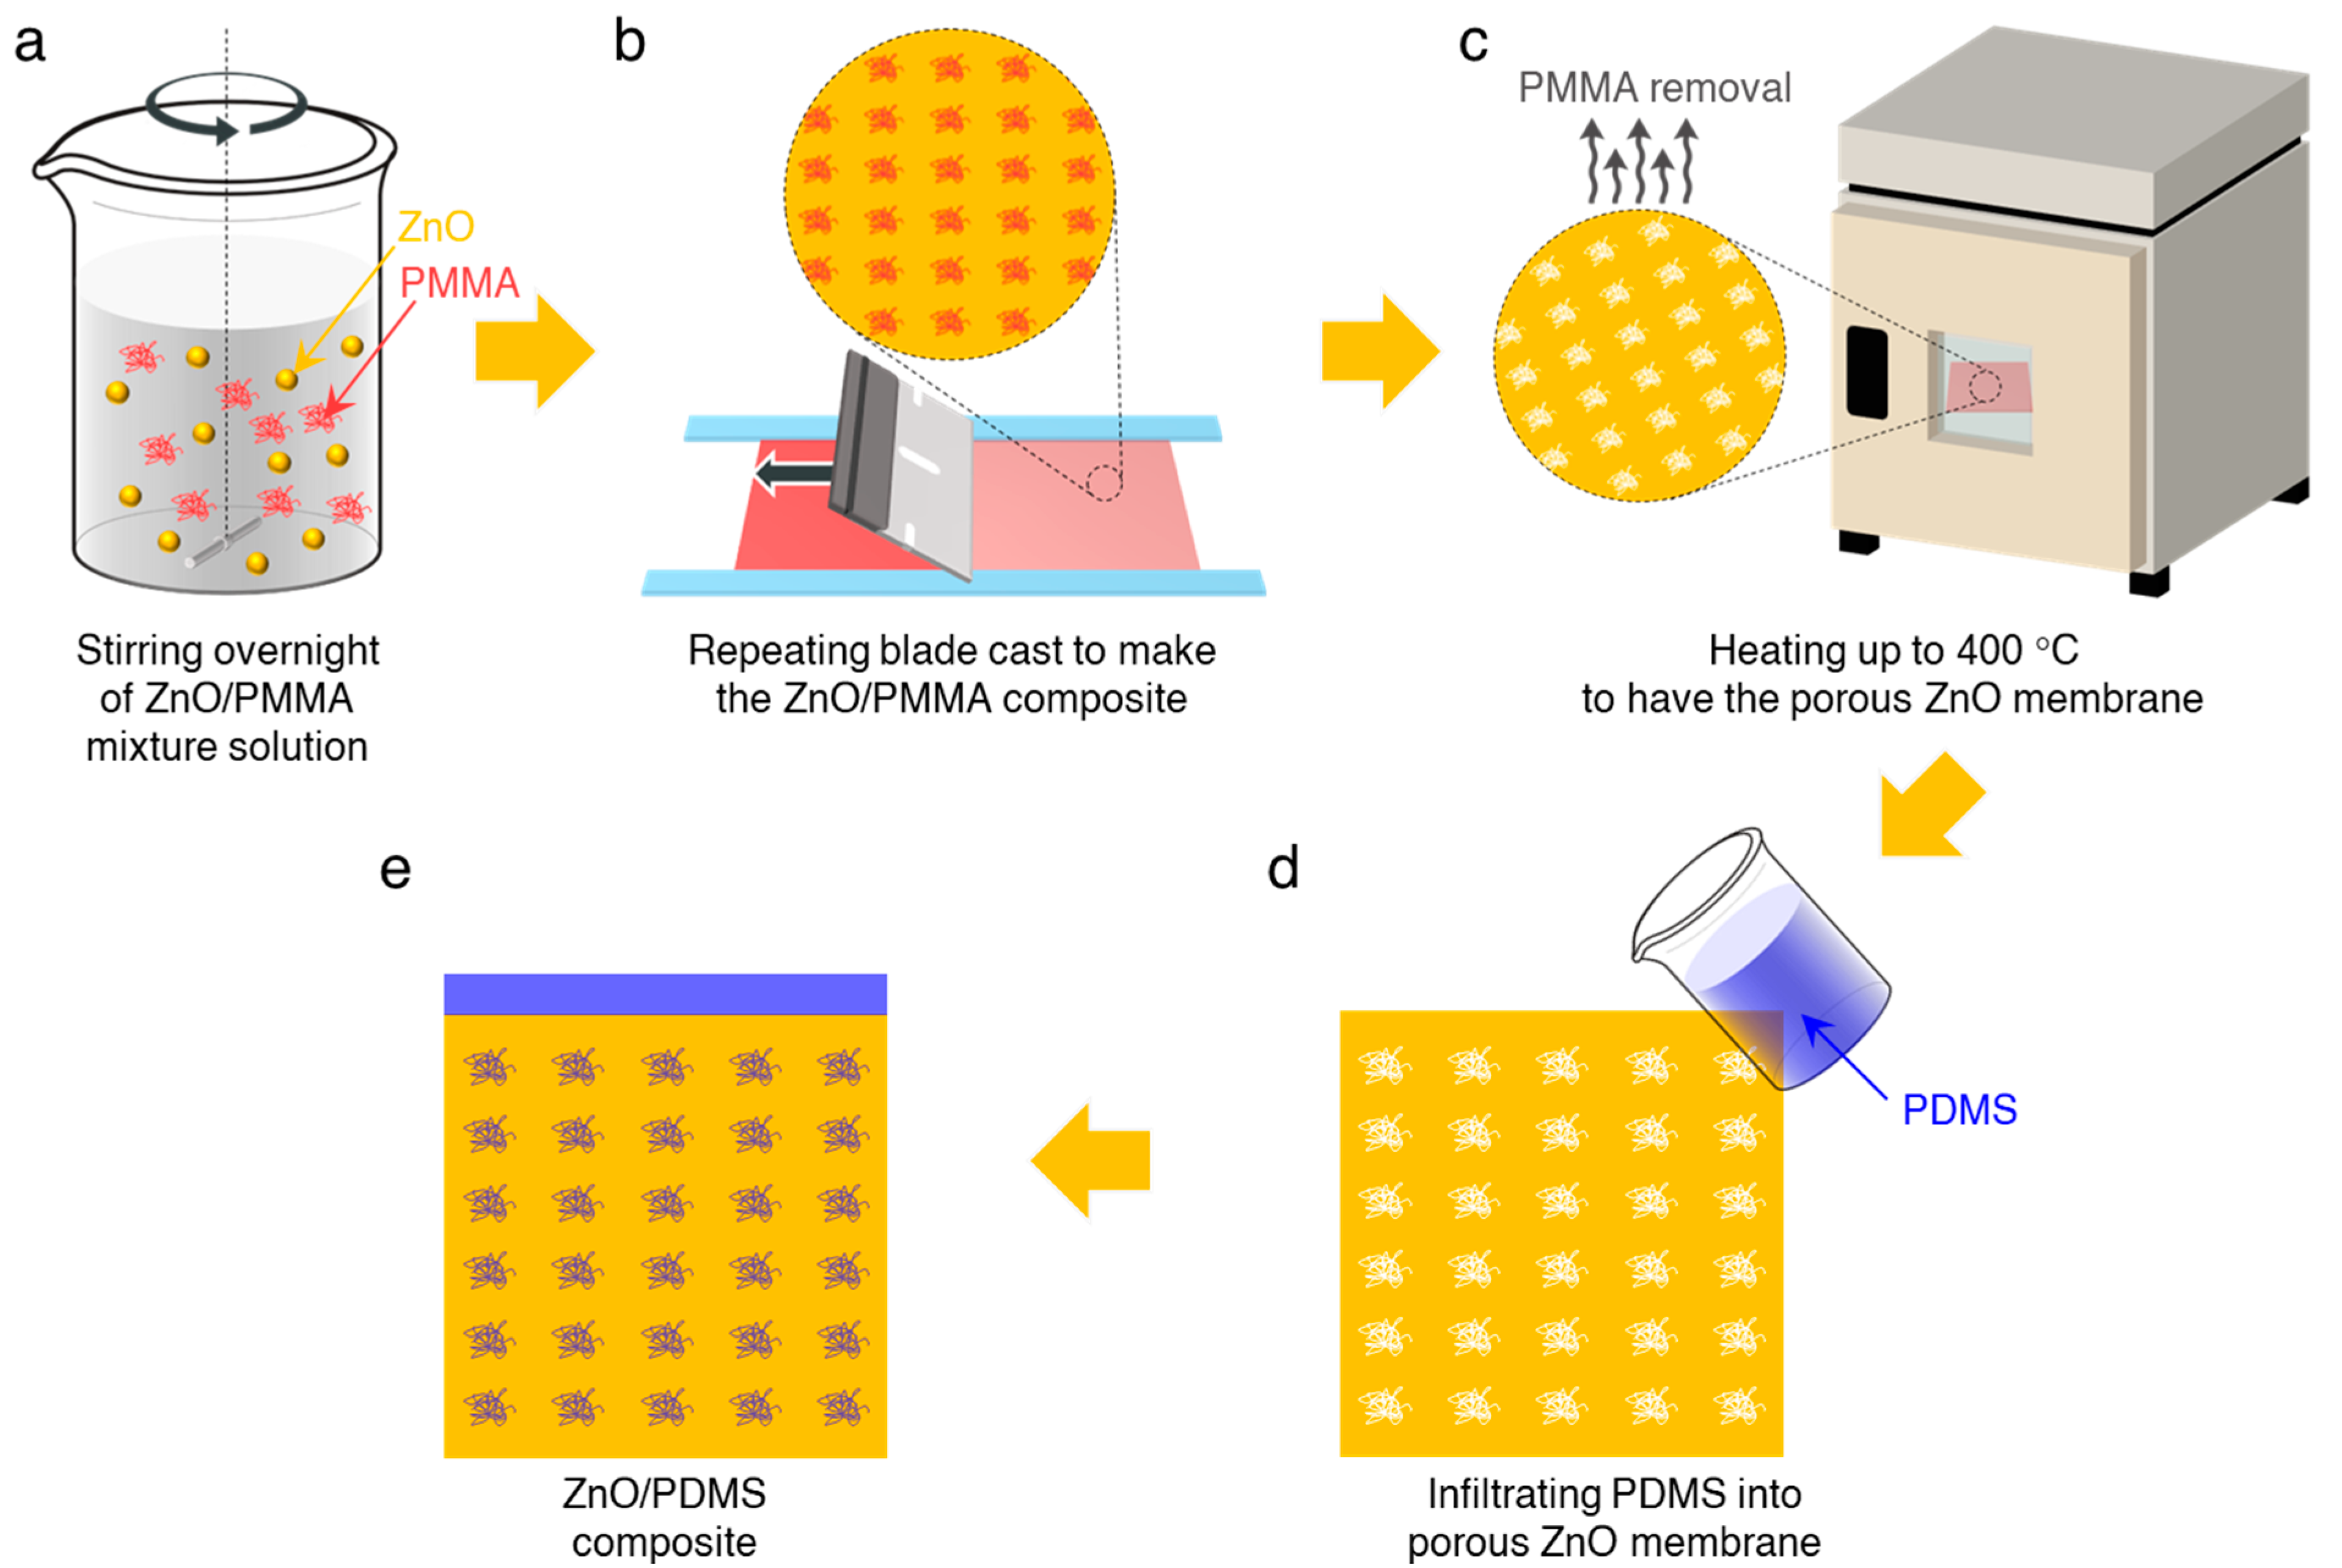
2.1. Fabrication of ZnO/PDMS Composite and Nanogenerators

A schematic illustration of a homogenous ZnO/polydimethylsiloxane (PDMS) composite is displayed in Figure 1. The ZnO powder was purchased from Sigma Aldrich and was used without further purification. The precursor solutions composed of ZnO powder in ethanol (15% w/w) and poly(methyl methacrylate) (PMMA, Sigma Alrich) in toluene (20% w/w) were stirred for 24 h (Figure 1a), and then were blade-casted onto the gold-coated glass substrate (Figure 1b). The ZnO/PMMA composites were heated to 75 °C for 10 min to evaporate the volatile solvent. The blade casting and subsequent drying process were repeated thrice. The ZnO/PMMA composites were heated to 400 °C for 4 h in a furnace to yield the porous ZnO membranes by calcinating PMMA (Figure 1c). Next, the porous ZnO membranes were immersed in a PDMS (SYLGARD™ 184, Dow Chemical) elastomeric layer (Figure 1d), which served not only as a potential barrier, but also as a buffer layer to improve the robustness and durability of the ZnO/PDMS composite, followed by curing at 70 °C for 120 min (Figure 1e). We deposited an adhesion layer of 5-nanometer-thick chromium (Cr), followed by a 100-nanometer-thick gold (Au) film using a radio frequency sputter. The Au films positioned at the top and bottom surfaces of the ZnO/PDMS composite serve as the electrodes for piezoelectric nanogenerators. Then, the composite with electrodes was immersed in a polydimethylsiloxane (PDMS) elastomeric layer.

2.2. Characterization

The morphologies of the composite were observed using a field-emission scanning electron microscope equipped with energy dispersive X-ray spectrometer (Hitachi S-4700), and X-ray diffraction (Xpert, 2016) analysis was performed to check the crystallinity of the ZnO after annealing. Adobe photoshop image analysis ‘count tool’ was used to determine the porosity of ZnO templates and study the ZnO and PDMS coverage of the composites. The dielectric constant was characterized using a broadband dielectric spectrometer (Concept 80, Novocontrol Corp). The output performance of PENGs was measured using an oscilloscope (Agilent DSO-X-2014A) equipped with a current preamplifier (SRS SR- 570) under different pushing loads applied by a customized pushing tester driven by a linear motor (LS Mechapion APM-SB02ADK). The output voltage was measured with a direct connection to a standard probe with 10 MΩ resistance, while the output current was recorded with a probe with 50 Ω resistance. The power of the system was calculated using varied load resistance. The COMSOL Multiphysics was used to simulate the piezoelectric potential in the ZnO/PDMS composite with varying ZnO coverage.

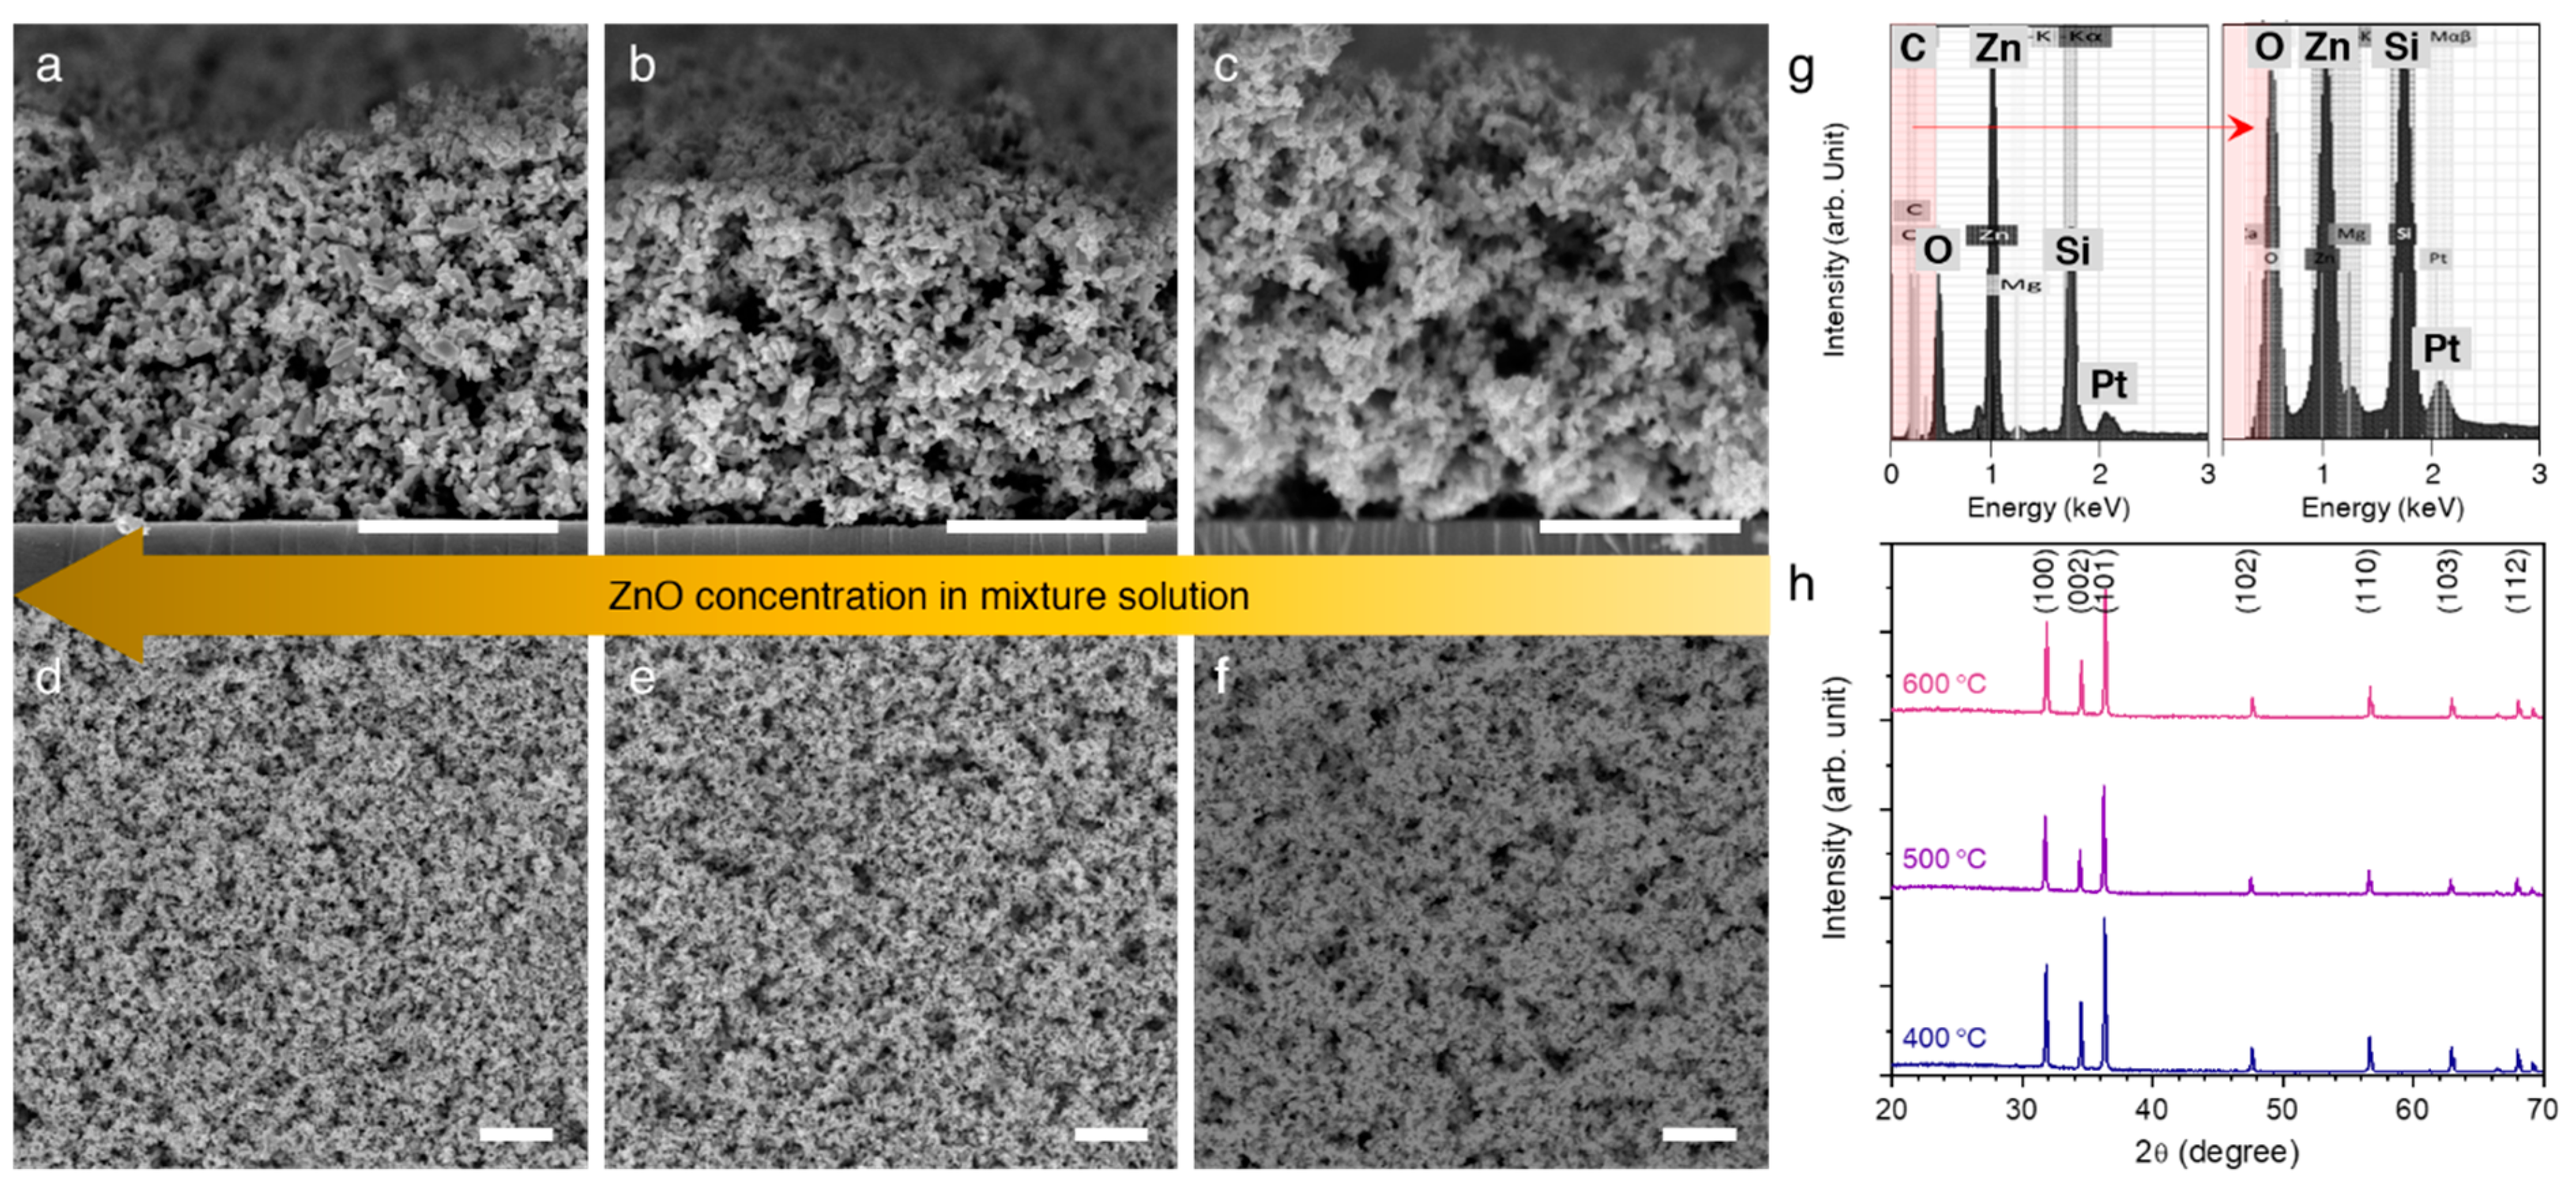
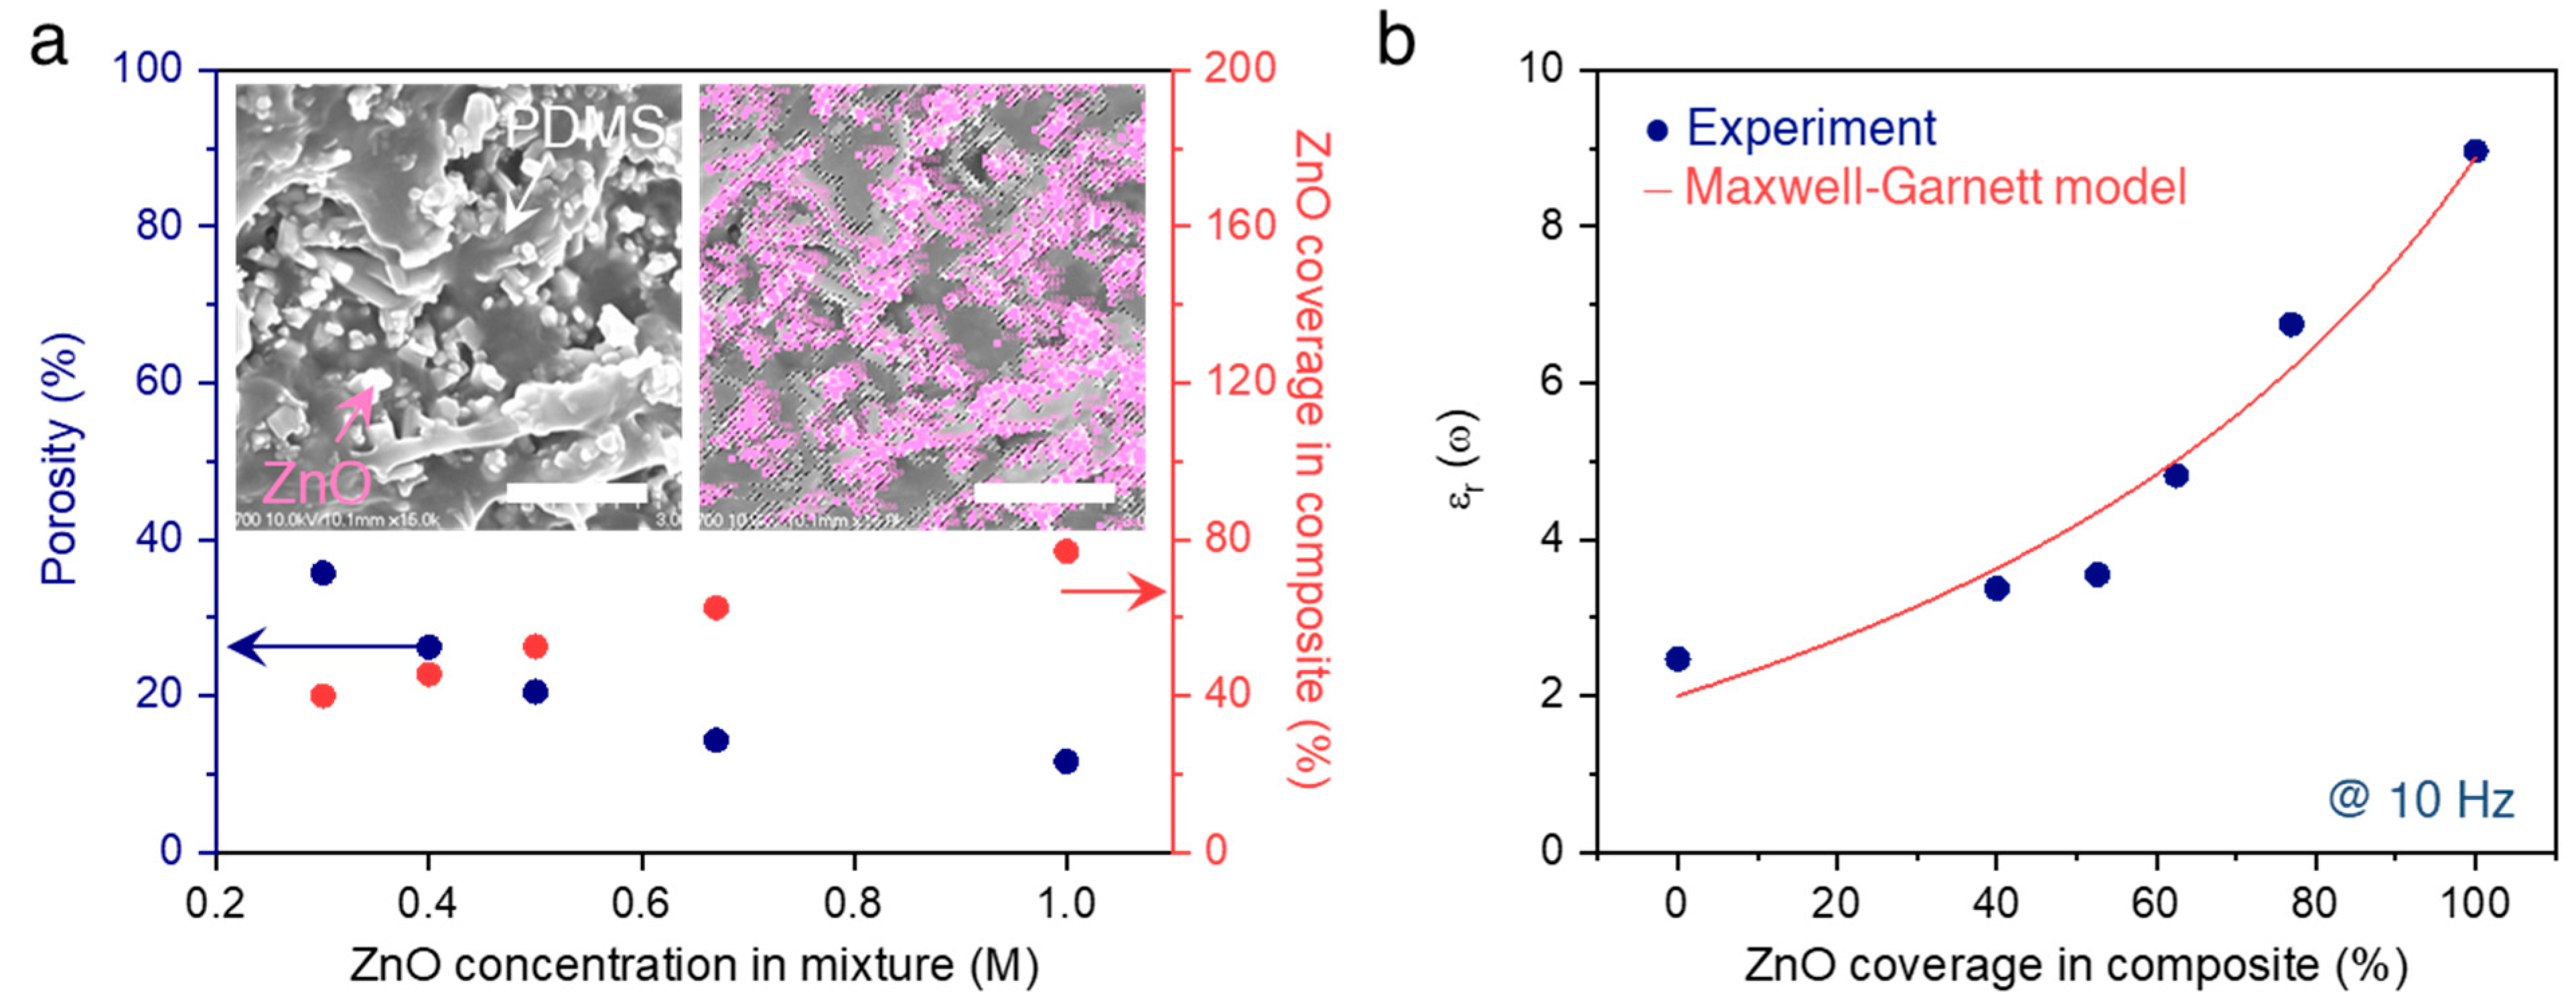
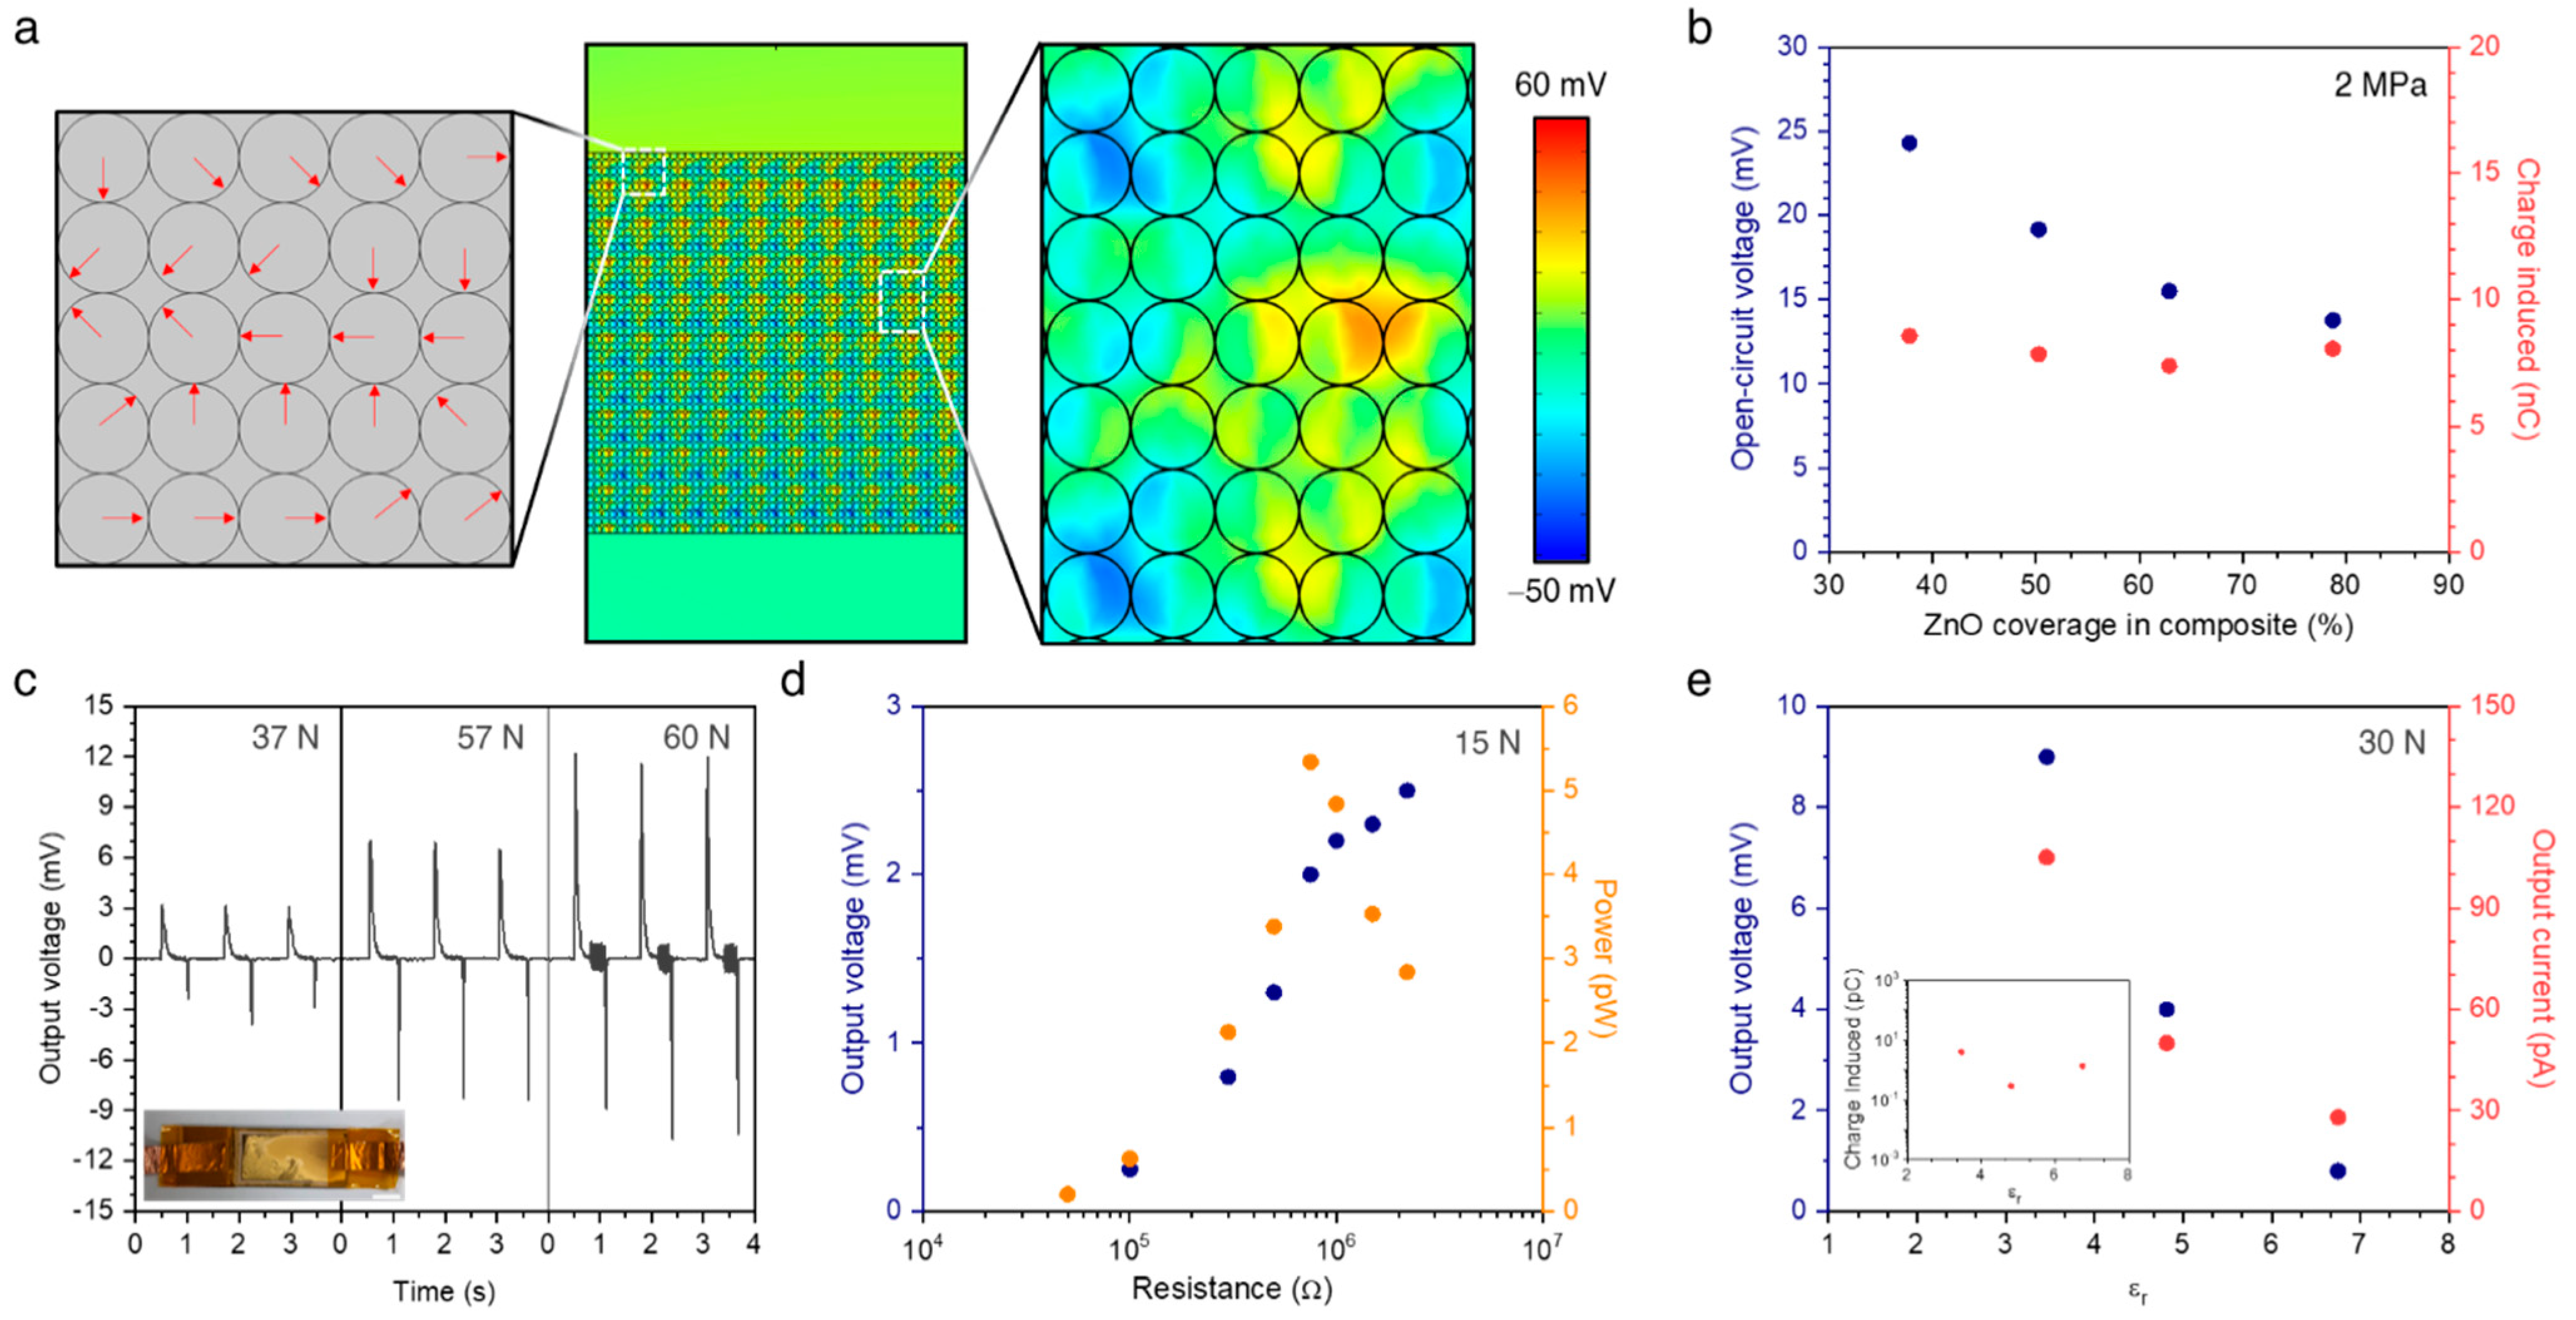
3. Results and Discussion

The scanning electron microscopy (SEM) images presented in Figure 2a–f show the typical morphologies of the porous ZnO membranes made from the precursor solutions of varying ZnO concentrations from 0.3 to 1 M. As the ZnO concentrations decreased, more PMMA agglomerates were trapped in the ZnO membranes, and then the sacrificial PMMA agglomerates were completely removed after calcination at 400 °C for 4 h. It is worth noting that the ZnO particles are known to be homogeneously dispersed in the PMMA matrix [21,22,23], facilitating the formation of the homogenous porous ZnO membrane. The SEM images indicate that the porous ZnO membranes, with thicknesses ranging from 8.7 to 11.3 μm, were successfully achieved over a large scale as high as 65 × 25 mm2, and the average volumetric density of ZnO in a given region considerably increased as a result of controlling the ZnO concentrations. Using energy-dispersive X-ray spectroscopy (Figure 2g), we confirmed that the carbon concentrations in the porous ZnO membrane decreased significantly after the calcination, indicating that the sacrificial PMMA was successfully removed from the ZnO/PMMA composite. The crystalline structures of the porous ZnO membrane of differing annealing temperatures from 400 to 600 °C were investigated using X-ray diffraction (XRD), as shown in Figure 2h. All of the diffraction peaks corresponding to (100), (002), (101), (102), (110), (103), and (112) planes belong to the standard pattern for ZnO powder, and can be indexed to the wurtzite structure of ZnO with lattice constants of a = 3.248 and c = 5.199 Å, which is in accordance with the reported values (a = 3.25 and c = 5.207 Å) in the JCPDS files (card no. 36-1451). The intensity ratio of (100)/(002) and (101)/(002) planes was calculated and is given in Table 1. A low annealing temperature resulted in the highest relative ratios of 1.50 and 2.15, respectively, with an increase in annealing temperature decreasing the relative ratios down to 1.09 and 1.17, respectively. We then calculated the lattice aspect ratio using the full width at half maximum of the (100) and (002) diffraction peak in Scherrer’s equation. The results indicated that the lattice aspect ratio was negligibly improved with increasing the annealing temperature, so that the subsequent measurements described below using the porous ZnO membranes were all performed with the samples annealed at 400 °C.
We employed the image analysis technique to further investigate the approximate porosity of ZnO membranes in the projected SEM images (Figure 3a, left). The white and dark regions were considered as the ZnO membrane and voids, respectively, and then the area of each region was calculated by counting the number of pixels. Remarkably, the porosity, representing the fraction of ZnO in the given area, was enhanced up to 35.7% as the ZnO concentration in the precursor solutions was decreasing. After infiltrating the PDMS into the porous ZnO membranes, the approximate ZnO coverages, CoverageZnO = AZnO/(AZnO + APDMS), where AZnO and A PDMS denote the area of ZnO and PDMS, respectively, in the ZnO/PDMS composites were also computed in a similar manner (Figure 3a, right). The white and grey regions were taken into account as the ZnO membrane and PDMS infiltrated, respectively (Inset of Figure 3a). The ZnO coverage is shown to increase with the decreasing of the porosity, and the ZnO coverage shrunk down to 40% in the ZnO membrane with a porosity of 35.7%, representing the successful infiltration of PDMS into the porous ZnO membrane. A broadband dielectric spectrometer was used to characterize the dielectric constant of ZnO/PDMS composites in a symmetric Au | ZnO/PDMS composite | Au configuration, as shown in Figure 3b. The experimental dielectric constant substantially increased with the ZnO coverage at 10 Hz. We estimated the dielectric constant of the composites using theoretical models developed by Maxwell Garnett, which is suitable for a two-phase composite and given by [24]:
ε c o m p o s i t e = ε P D M S 2 ε P D M S + ε Z n O + 2 f Z n O ( ε Z n O ε P D M S ) 2 ε P D M S + ε Z n O f Z n O ( ε Z n O ε P D M S )
where fZnO is the volume content of ZnO in the composite, and εPDMS, εZnO, and εcomposite represent the dielectric constant of the PDMS region, ZnO region, and composites, respectively. The relative permittivity of PDMS (εPDMS) and ZnO (εZnO) are known as 2.47 and 8.96, respectively, according to the previous studies [25,26]. It can be noticed that the Maxwell Garnett model yields a similar prediction of εZnO around 8.89, with a coefficient of determination, R2, very close to 1, reflecting an excellent correlation between the empirical data and estimated values. All the above results allow us to confirm that the dielectric constant of composites was clearly modified from 3.37 to 6.75 by modulating the ZnO coverage in the ZnO/PDMS composite.
In order to have an insight into the distribution of the electric field within the ZnO/PDMS composite, a two-dimensional finite element method simulation was carried out. The ZnO circular particles with a diameter of 200 nm were embedded in the PDMS matrix with a 20 μm width and 10 μm thickness. The ZnO coverage was controlled by varying the distance between particles while maintaining the particle size. Therefore, the number of ZnO particles for 78.7% ZnO coverage was 6250, and this value decreased to 5000, 4000, and 3000 in the ZnO coverages of 63%, 50.4%, and 37.8%, respectively. To represent the crystalline direction of the ZnO nanoparticles, we set the unit cell consisting of the ZnO/PDMS composite with a dimension of 1 μm × 1 μm, where the dominant polarization directions of each particle were randomly assigned (Figure 4a, left). Then, the imaginary circle, which was much larger than our sample, was set to be grounded as the zero potential references. The floating potential with zero initial potential was designated for both the top and bottom surfaces of the ZnO/PDMS composite. Upon the compressive force to the top surface, the ZnO/PDMS composite can be freely deformed in both lateral and vertical directions, while the movement of the bottom surface was restricted in a vertical direction. Figure 4a illustrates the electric field distribution in the ZnO/PDMS composite with a 78.7% ZnO coverage under a compressive pressure of 2 MPa. The ZnO/PDMS composite showed the random potential distribution, which is attributed to the random orientation of polarization induced by ZnO particles, but the net polarization induced the potential difference between the top and bottom electrodes. The open-circuit voltage was calculated from the potential difference between the top and bottom surfaces of the composite, and is presented in Figure 4b. Notably, the open-circuit voltage was found to increase gradually with decreasing ZnO coverage (i.e., lowering dielectric permittivity), whereas the charge induced by the piezo-potential plateaus for all ZnO coverages, implying a decrease in dielectric constants, enabled them to improve the output voltage of the nanogenerator in terms of the figure of merit.
We constructed the piezoelectric nanogenerators comprising the ZnO/PDMS composites with different ZnO coverages. The ZnO/PDMS composites acted as a piezoelectric material, and the top and bottom electrodes were deposited on both surfaces of the composite using a thermal evaporator. Encapsulation with an additional PDMS layer provides high structural stability of the nanogenerators. The dimensions of our device were 65 × 25 mm2 in the area and ~100 μm in thickness (Inset of Figure 4c). Each nanogenerator included the ZnO/PDMS composite with an almost similar thickness of 23–34 μm. The output voltage and current were measured by applying periodic compressive loads using a programmed linear motor. Under a compressive stimulus (37 N) perpendicular to the nanogenerator, the output voltage of the nanogenerator featuring composites with 52.6% ZnO coverage reached up to ~3.2 mV (Figure 4c). The electrical output increased linearly with applied loads from 30 N to 60 N. Then, the maximum peak power of the nanogenerator was investigated using different resistors, with a value of 5.34 pW at a load resistance of approximately 0.75 MΩ in the presence of 15 N external load (Figure 4d). We then investigated the effect of the dielectric constant of composites on the electrical output (Figure 4e). The electrical output voltage of 0.8 mV was achieved in the nanogenerator involving the ZnO/PDMS composite with the dielectric constant of 6.75, and this value increased to 4 and 9 mV in those with the dielectric constants of 4.81 and 3.46, respectively. The nanogenerator featuring the ZnO/PDMS composite with the highest dielectric constant produced an average output current of 28 pA, and the current was shown to increase up to 105 pA with the lowering of the dielectric constant. The charge values were extracted from the integration of a single current peak and the charge values plateau occurred for all dielectric constants, which exhibited good agreement with our simulation results. Ultimately, control over the relative dielectric constant of the piezoelectric layer is a promising approach for enhancing the FOM, and ultimately, the high open-circuit voltage.

4. Conclusions

The effect of the dielectric constant of the piezoelectric layer on electrical outputs of the piezoelectric nanogenerator was investigated using ZnO/PDMS composites with differing ZnO coverage. We adjusted the porosity of the ZnO membrane from 11.6% to 35.7% by changing the ZnO concentration in the precursor solution, and then the elastomeric PDMS was permeated into the porous ZnO membrane, yielding the ZnO/PDMS composites with the dielectric constants in the range of 3.37 and 6.75. The output voltage of the piezoelectric nanogenerator comprising the piezoelectric composite with the lowest dielectric constant was found to be boosted approximately 11 times compared to that of the nanogenerator with the highest dielectric constant. Additionally, the results found in experiments were well matched with those of the simulation study.

Author Contributions

Conceptualization, D.-M.S. and Y.-H.H.; Data curation, Y.A. and D.A.; Formal analysis, Y.A., D.A. and X.M.; Funding acquisition, D.-M.S. and Y.-H.H.; Investigation, Y.A. and D.A.; Methodology, Y.A., D.A., H.A. and K.K.; Project administration, D.-M.S. and Y.-H.H.; Software, X.M.; Supervision, K.K., D.-M.S. and Y.-H.H.; Writing—original draft, D.-M.S. and Y.-H.H.; Writing—review & editing, D.-M.S. and Y.-H.H. All authors have read and agreed to the published version of the manuscript.

Funding

This work was supported by the National Research Foundation of Korea (NRF) grant funded by the Korea government (MSIT) (2020R1A2C2007590). This research was also supported by the Creative Materials Discovery Program through the National Research Foundation of Korea (NRF) funded by the Ministry of Science and ICT (NRF-2017M3D1A1039287). X.M. and D.-M.S. acknowledge the financial support of Early Career Scheme of the Research Grants Council of Hong Kong Special Administrative Region, China, under Award Numbers 27202920.

Conflicts of Interest

The authors declare no conflict of interest.

References

  1. Wang, Z.L.; Song, J. Piezoelectric nanogenerators based on zinc oxide nanowire arrays. Science 2006, 312, 242. [Google Scholar] [CrossRef]
  2. Hu, Y.; Zhang, Y.; Xu, C.; Zhu, G.; Wang, Z.L. High-output nanogenerator by rational unipolar assembly of conical nanowires and its application for driving a small liquid crystal display. Nano Lett. 2010, 10, 5025. [Google Scholar] [CrossRef]
  3. Zhu, G.; Wang, A.C.; Liu, Y.; Zhou, Y.; Wang, Z.L. Functional electrical stimulation by nanogenerator with 58 V output. Nano Lett. 2012, 12, 3086. [Google Scholar] [CrossRef] [PubMed] [Green Version]
  4. Shin, D.-M.; Tsege, E.L.; Kang, S.H.; Seung, W.; Kim, S.-W.; Kim, H.K.; Hong, S.W.; Hwang, Y.-H. Freestanding ZnO nanorod/graphene/ZnO nanorod epitaxial double heterostructure for improved piezoelectric nanogenerators. Nano Energy 2015, 12, 268–277. [Google Scholar] [CrossRef]
  5. Choi, M.-Y.; Choi, D.; Jin, M.-J.; Kim, I.; Kim, S.-H.; Choi, J.-Y.; Lee, S.Y.; Kim, J.M.; Kim, S.-W. Mechanically Powered Transparent Flexible Charge-Generating Nanodevices with Piezoelectric ZnO Nanorods. Adv. Mater. 2009, 21, 2185–2189. [Google Scholar] [CrossRef]
  6. Shin, D.-M.; Hong, S.W.; Hwang, Y.-H. Recent Advances in Organic Piezoelectric Biomaterials for Energy and Biomedical Applications. Nanomaterials 2020, 10, 123. [Google Scholar] [CrossRef] [Green Version]
  7. Hu, Y.; Wang, Z.L. Recent progress in piezoelectric nanogenerators as a sustainable power source in self-powered systems and active sensors. Nano Energy 2015, 14, 3–14. [Google Scholar] [CrossRef] [Green Version]
  8. Park, K.-I.; Xu, S.; Liu, Y.; Hwang, G.-T.; Kang, S.-J.L.; Wang, Z.L.; Lee, K.J. Piezoelectric BaTiO3 Thin Film Nanogenerator on Plastic Substrates. Nano Lett. 2010, 10, 4939–4943. [Google Scholar] [CrossRef] [Green Version]
  9. Shin, D.-M.; Han, H.J.; Kim, W.-G.; Kim, E.; Kim, C.; Hong, S.W.; Kim, H.K.; Oh, J.-W.; Hwang, Y.-H. Bioinspired piezoelectric nanogenerators based on vertically aligned phage nanopillars. Energy Environ. Sci. 2015, 8, 3198–3203. [Google Scholar] [CrossRef]
  10. Yan, Y.; Kim, W.G.; Ma, X.; Tegafaw, T.; Nguyen, T.M.; Lee, J.M.; Hwang, Y.H. Nanogenerators facilitated piezoelectric and flexoelectric characterizations for bioinspired energy harvesting materials. Nano Energy 2021, 81, 105607. [Google Scholar] [CrossRef]
  11. Kim, G.H.; Shin, D.M.; Kim, H.K.; Hwang, Y.H.; Lee, S. Effect of the dielectric layer on the electrical output of a ZnO nanosheet-based nanogenerator. J. Korean Phys. Soc. 2015, 67, 1920–1924. [Google Scholar] [CrossRef]
  12. Wu, W.; Wang, L.; Li, Y.; Zhang, F.; Lin, L.; Niu, S.; Chenet, D.; Zhang, X.; Hao, Y.; Heinz, T.F.; et al. Piezoelectricity of single-atomic-layer MoS2 for energy conversion and piezotronics. Nature 2014, 514, 470. [Google Scholar] [CrossRef] [PubMed]
  13. Lee, J.-H.; Park, J.Y.; Cho, E.B.; Kim, T.Y.; Han, S.A.; Kim, T.-H.; Liu, Y.; Kim, S.K.; Roh, C.J.; Yoon, H.-J.; et al. Reliable piezoelectricity in bilayer WSe2 for piezoelectric nanogenerators. Adv. Mater. 2017, 29, 1606667. [Google Scholar] [CrossRef]
  14. Song, H.; Karakurt, I.; Wei, M.; Liu, N.; Chu, Y.; Zhong, J.; Lin, L. Lead iodide nanosheets for piezoelectric energy conversion and strain sensing. Nano Energy 2018, 49, 7. [Google Scholar] [CrossRef]
  15. Michel, K.H.; Verberck, B. Theory of elastic and piezoelectric effects in two-dimensional hexagonal boron nitride. Phys. Rev. B 2009, 80, 224301. [Google Scholar] [CrossRef]
  16. Chang, C.; Tran, V.H.; Wang, J.; Fuh, Y.-K.; Lin, L. Direct-write piezoelectric polymeric nanogenerator with high energy conversion efficiency. Nano Lett. 2010, 10, 726. [Google Scholar] [CrossRef]
  17. Lee, B.Y.; Zhang, J.; Zueger, C.; Chung, W.-J.; Yoo, S.Y.; Wang, E.; Meyer, J.; Ramesh, R.; Lee, S.-W. Virus-based piezoelectric energy generation. Nat. Nanotechnol. 2012, 7, 351. [Google Scholar] [CrossRef]
  18. Lee, J.-H.; Lee, J.H.; Xiao, J.; Desai, M.S.; Zhang, X.; Lee, S.-W. Vertical Self-Assembly of Polarized Phage Nanostructure for Energy Harvesting. Nano Lett. 2019, 19, 2661–2667. [Google Scholar] [CrossRef] [PubMed]
  19. Ghosh, S.K.; Mandal, D. Efficient natural piezoelectric nanogenerator: Electricity generation from fish swim bladder. Nano Energy 2016, 28, 356. [Google Scholar] [CrossRef]
  20. Liu, H.; Zhong, J.; Lee, C.; Lee, S.-W.; Lin, L. A comprehensive review on piezoelectric energy harvesting technology: Materials, mechanisms, and applications. Appl. Phys. Rev. 2018, 5, 41306. [Google Scholar] [CrossRef]
  21. Popović, D.; Bobovnik, R.; Bolka, S.; Vukadinović, M.; Lazić, V.; Rudolf, R. Synthesis of PMMA/ZnO nanoparticles composite used for resin teeth. Mater. Tehnol. 2017, 51, 871–878. [Google Scholar] [CrossRef]
  22. Thang, E.; Cheng, G.; Ma, X. Preparation of nano-ZnO/PMMA composite particles via grafting of the copolymer onto the surface of zinc oxide nanoparticle. Powder Technol. 2016, 161, 209–214. [Google Scholar] [CrossRef]
  23. Anzlovar, A.; Orel, Z.C.; Zigon, M. Sub micrometer and nano-ZnO as filler in PMMA materials. Mater. Tehnol. 2011, 45, 269–274. [Google Scholar]
  24. Garnett, J.C.M. Colours in metal glasses and in metallic films. Philos. Trans. R. Soc. A Math. Phys. Eng. Sci. 1904, 203, 385–420. [Google Scholar] [CrossRef] [Green Version]
  25. Zhang, X.; Le, M.Q.; Zahhaf, O.; Capsal, J.F.; Cottinet, P.J.; Petit, L. Enhancing dielectric and piezoelectric properties of micro-ZnO/PDMS composite-based dielectrophoresis. Mater. Des. 2020, 192, 108783. [Google Scholar] [CrossRef]
  26. Zamiri, R.; Singh, B.; Belsley, M.S.; Ferreira, J.M.F. Structural and dielectric properties of Al-doped ZnO nanostructures. Ceram. Int. 2014, 40, 6031–6036. [Google Scholar] [CrossRef]
Figure 1. Schematic illustration of the ZnO/PDMS composite fabrication. (a) Preparation of ZnO/PMMA precursor. (b) Blade casting of ZnO/PMMA composite. (c) PMMA removal by thermal annealing. (d) Infiltration of PDMS into ZnO membrane. (e) ZnO/PDMS composite.
Micromachines 12 00630 g001
Figure 2. Porous ZnO membrane. (ac): Cross-sectional SEM images of porous ZnO membranes made from the precursor solutions of varying ZnO concentrations from 0.3 to 1 M. Scale bar = 5 μm. (df): Surface morphology of the porous ZnO membranes. Scale bar = 5 μm. (g): EDX spectrum of the porous ZnO membrane before (left) and after (right) the calcination. (h): XRD results of the porous ZnO membranes annealed at different temperatures.
Micromachines 12 00630 g002
Figure 3. ZnO coverage and dielectric constant of the ZnO/PDMS composites. (a): porosity and ZnO coverage in the composite as a function of the ZnO concentration in the precursor solution. (b): Dielectric constant of the ZnO/PDMS composites. The data of 100% ZnO coverage and 0% ZnO coverage (fully covered by PDMS) were extracted from the literature: PDMS [25] and ZnO [26].
Micromachines 12 00630 g003
Figure 4. Effect of dielectric constant on piezoelectric output. (a): computed potential distribution in ZnO/PDMS composite with a 78.7% ZnO coverage under a compressive pressure of 2 MPa. (b): computed open-circuit voltage and charge simulated of ZnO/PDMS composites. (c): Output voltage of nanogenerator under different compressive loads. Inset indicates the photo of nanogenerator fabricated. Scale bar = 1 cm. (d): output voltage and power from nanogenerator as a function of different resistors as external loads. (e): Output voltage and output current as a function of dielectric constant. Inset indicates the charge values extracted from the integration of a single current peak.
Micromachines 12 00630 g004
Table 1. Geometric parameters of the ZnO nanostructures calculated from XRD spectra.
Annealing Temperature (°C)Crystalline Size
(nm)
Relative IntensityXRD Lattice
Aspect Ratio
(100)/(002)(101)/(002)
40058.91.502.151.00
50053.91.151.291.01
60048.51.091.170.99
Publisher’s Note: MDPI stays neutral with regard to jurisdictional claims in published maps and institutional affiliations.

