Article

Enhanced Photocatalytic Performance of Nitrogen-Doped TiO2 Nanotube Arrays Using a Simple Annealing Process

1
Ceramics and Biomaterials Research Group, Advanced Institute of Materials Science, Ton Duc Thang University, Ho Chi Minh City 700000, Vietnam
2
Faculty of Applied Sciences, Ton Duc Thang University, Ho Chi Minh City 700000, Vietnam
3
Department of Materials Science and Engineering, National Chiao Tung University, Hsinchu 30049, Taiwan
4
Faculty of Natural Sciences, Thu Dau Mot University, 6 Tran Van On Street, Thu Dau Mot City 820000, Vietnam
5
Faculty of Fundamental Sciences, Thai Nguyen University of Technology, Thai Nguyen 24000, Vietnam
6
Laboratory of Magnetism and Magnetic Materials, Advanced Institute of Materials Science, Ton Duc Thang University, Ho Chi Minh City 700000, Vietnam
*
Authors to whom correspondence should be addressed.
Micromachines 2018, 9(12), 618; https://0-doi-org.brum.beds.ac.uk/10.3390/mi9120618
Submission received: 10 September 2018 / Revised: 8 November 2018 / Accepted: 20 November 2018 / Published: 24 November 2018

Abstract

:
Nitrogen-doped TiO2 nanotube arrays (N-TNAs) were successfully fabricated by a simple thermal annealing process in ambient N2 gas at 450 °C for 3 h. TNAs with modified morphologies were prepared by a two-step anodization using an aqueous NH4F/ethylene glycol solution. The N-doping concentration (0–9.47 at %) can be varied by controlling N2 gas flow rates between 0 and 500 cc/min during the annealing process. Photocatalytic performance of as-prepared TNAs and N-TNAs was studied by monitoring the methylene blue degradation under visible light (λ ≥ 400 nm) illumination at 120 mW·cm−2. N-TNAs exhibited appreciably enhanced photocatalytic activity as compared to TNAs. The reaction rate constant for N-TNAs (9.47 at % N) reached 0.26 h−1, which was a 125% improvement over that of TNAs (0.115 h−1). The significant enhanced photocatalytic activity of N-TNAs over TNAs is attributed to the synergistic effects of (1) a reduced band gap associated with the introduction of N-doping states to serve as carrier reservoir, and (2) a reduced electron‒hole recombination rate.

Graphical Abstract

1. Introduction

Titanium dioxide (TiO2) is one of the most widely studied materials for applications in solar cells [1,2,3], pollutant degradation [4,5,6], photolysis of water [7], gas sensor [8], and bio-applications [9,10], due to its excellent photocatalytic activity, non-toxicity, high stability, low cost, and biocompatibility [11,12,13]. However, TiO2 is generally active under ultraviolet irradiation due to the wide band gap of approximately 3.2 eV [14,15], and has limited applications under visible light irradiation [16]. Thus, considerable effort has been made to improve the light absorption of TiO2 towards visible light via several schemes [17,18]: decorating TiO2 with noble metals [19], and doping TiO2 with noble metals [17] or non-metals (N, F, S) [20,21]. The studies of metal-doped TiO2 and noble metal-decorated TiO2 have demonstrated significant improvements in the photocatalytic performance of TiO2 under visible light irradiation [14]. However, these approaches showed several drawbacks such as thermal instability of doped TiO2, electron trapping by the metal centers, requirement of expensive ion-implantation facilities, and the use of precious metals. Alternatively, the substitution of anion species (i.e., C, N, F, P, S) in the anatase TiO2 crystal can induce a band gap narrowing effect [11,14,22]. Compared to other nonmetals, nitrogen doping is more appropriate for extending the photoactive region to visible light because of its comparable atomic size with oxygen, small ionization energy, metastable center formation, high stability, and low cost [23,24]. Theoretical calculations have also found that the p state of N is the most promising for substitutional doping into TiO2 and contributes to the band gap narrowing by mixing with O2p [14,21].
TiO2 nanomaterials are of great interest because of their large surface area and high light absorption capability [25,26,27,28,29]. Compared to other nanostructures, TiO2 nanotube arrays (TNAs) are of interest because they can provide a large surface-to-volume ratio and unidirectional electrical channel [30,31]. Several approaches to incorporate nitrogen into TNAs include one-step direct electrochemical anodization of a TiN alloy [32,33], anodization in the nitrogen-containing electrolyte [34], immersing TNAs in a N-containing solution, and performing post-annealing treatment [4,30,35]. It was found that N-doping was successfully achieved by thermal annealing of the as-prepared anodic TNAs in pure NH3 gas [36]. In addition, N-doped TiO2 thin films were prepared by sputtering in N2 gas containing ambient [37,38,39]. Jeon et al. [29] successfully developed three-dimensional nanostructured N-doped TiO2 monolith with enhanced visible light absorption, where the N-doping was obtained by thermal annealing of as-prepared 3D nanostructured TiO2 with a thin TiN layer coating on the surface. Recently, highly ordered TNAs with diverse top-layer morphology and enhanced photoelectrochemical and photocatalytic activity were obtained using the two-step anodization [31,40,41,42,43,44]. Based on these findings in the literature, we postulate that the synergetic effects of N-doping, modified morphology, and high-crystallinity TNAs can be achieved by using simple thermal annealing under controlled N2 gas flows.
In this work, the surface N-doped TiO2 nanotube arrays (TNAs) with various doping concentrations from 0 to 9.47 at % were successfully achieved by a facile annealing process at 450 °C for 3 h and under different N2 gas flows between vacuum and 500 cc/min. The TNAs in this study were highly-ordered TNAs with a grid-like capping top layer, which were successfully prepared by a two-step anodization method using an NH4F and glycerol−water electrolyte. Structural–morphological, optical properties, and photocatalytic performance of the pristine and N-doped TNAs in the degradation of methylene blue under visible light irradiation (λ ≥ 400 nm) were studied and discussed in detail.

2. Materials and Methods

Titanium foil (99.9% purity, 1 cm × 2.5 cm size, 0.4 mm thickness) was used as the substrate for forming TNAs with modified morphologies by a two-step anodic oxidation. Prior to anodization, titanium (Ti) foil was ultrasonically cleaned in acetone, methanol and deionized water (each solvent 10 min), and then dried by a purging N2 gas. The anodization was carried out using a two-electrode system with the Ti foil as an anode and a stainless steel foil (SS304) as a cathode. All the electrolytes consisted of 0.3 wt % NH4F (SHOWA, Tokyo, Japan) in ethylene glycol solution with 2 vol % water. In the first-step anodization, Ti foil was anodized at 50 V for 1 h to form a nanotube layer. Then, the as-grown layer was ultrasonically removed for approximately 15 min until a bright surface appeared. The same Ti foil underwent the second anodization at 40 V for 30 min to form TNAs with a grid-like top-layer structure on the Ti substrates. The prepared sample was then immersed in ethanol solution for 5 h to remove the ethylene glycol contamination. Nitrogen-doping for the prepared TNAs were carried out by thermal annealing process at 450 °C for 3 h under various nitrogen flows: vacuum (~7 Pa), 200, 350, and 500 cc/min. Prior to introducing pure N2 gas (purity 99.99%), the annealing chamber was evacuated to a pressure of approximately 7 Pa for preventing contamination.
The crystal structures of the pristine and N-doped TNAs were characterized by X-ray diffraction (XRD, Bruker D2, Bruker, Billerica, MA, USA) using Cu Kα radiation (λ = 1.5406 Å) and high-resolution transmission electron microscopy (TEM, JEOL JEM-ARM200F, JEOL Ltd., Tokyo, Japan), operated at 200 kV. The TEM specimen was prepared by crashing the TNAs on TEM grids. X-ray photoelectron spectroscopy (XPS) experiments were conducted at beamline 09A2, NSRRC, Taiwan to determine the chemical bonding and surface N-doping concentration. XPS curve were fitted using the freeware XPSPEAK4.1 with the Shirley background subtraction and assuming a Gaussian‒Lorentzian peak shape. Morphologies of the pristine and N-doped TNAs were characterized by scanning electron microscopy (SEM, JEOL JSM-6500, JEOL Ltd.). Fundamental information on the energy levels lying within the band gap and charge carrier trapping and transfer was gathered by photoluminescence (PL) spectra, measured at room temperature (~22 °C). The excitation light source of the PL spectroscopy was an He‒Cd laser with a wavelength of 325 nm. The PL signal was dispersed by a Horiba Jobin Yvon IHR-320 single-grating (1800 grooves/nm grating) spectrometer (Horiba, Kyoto, Japan). The performance of pristine and N-doped TNAs was characterized by ultraviolet photoelectron spectroscopy (UPS) using monochromatized He-I radiation at 21.2 eV. The electrochemical impedance spectroscopy (EIS) measurements were performed using an Autolab system with a scan rate of 50 mV·s−1 and a conventional three-electrode test cell. The counter electrode was a platinum sheet, the reference electrode was Ag/AgCl (aqueous 3 M KCl), and TNAs and N-TNAs samples were used as a working electrode. The electrolyte was 0.1 M Na2SO4 aqueous solution under room light irradiation.
The photocatalytic activity in the degradation of methylene blue (MB) of the samples was measured under visible light illumination at 120 mW·cm−2. The samples were illuminated using a Xenon lamp with a band-pass filter for λ ≥ 400 nm. Prior to illumination, the suspension was magnetically stirred for 20 min in the dark to ensure absorption‒desorption equilibrium between the photocatalyst and MB solution. The reaction temperature was kept at 32–33 °C for all samples. After a certain photocatalytic reaction time, the solution was taken for performing UV-Vis absorption spectrum to measure the MB concentration change using the characteristic peak at 654 nm.

3. Results and Discussion

Figure 1 shows the XRD patterns of the pristine TNAs and N-doped TNAs with various nitrogen contents (see Table 1). All the samples presented the peaks at approximately 25.1°, 37.8°, 47.7°, 53.8°, 62.6°, and 75.1° corresponding to (101), (004), (200), (105), (204), and (215) faces of an anatase TiO2 phase (JCPDS No. 21–1272). Also, there were no rutile peaks, indicating a pure anatase phase for the TNAs in this study. The XRD patterns of the TNAs and N-TNAs are similar, agreeing with those reported in the literature [4,5,13,22,24]. Notably, the preferred orientation changed from (101) for TNAs to (004) for N-TNAs. The reason is not clear at present, but the change in preferred orientation to (004) for N-TNAs should not be due to N atom incorporation, which usually coincides with the shift of the XRD peak [23,45]; meanwhile, the (004)-dominant orientation was also found in TNAs (without N-doping) prepared by one-step or two-step anodization [43]. Recently, the intrinsic electric fields were found to be responsible for the oriented self-assembly of multilevel branched rutile-type TiO2 structures [46]. Therefore, for the present case, the unintentional slight difference in electric fields during anodic oxidation processes may play a role in determining the preferred orientation, i.e., (101) or (004).
Figure 2a,b show a typical morphology of N-doped TNAs. Clearly, the TNAs exhibit a highly ordered, uniformed, and clean surface. The thickness of the TNAs was approximately 4 µm, as shown in the inset of Figure 2a. The inset of Figure 2b shows a grid-like top layer, which plays a role as a capping layer to protect the TNAs’ structure from bundling and crumpling. Figure 2c,d shows TEM images of typical N-doped TNAs (i.e., 9.47 at %). The TNAs have an average tube diameter of ~70 nm and a wall thickness of ~20 nm. In addition, the lattice fringes with a d-spacing of 0.245 nm can be assigned to the (004) lattice plane of anatase TiO2 (Figure 2d). The (004)-lattice fringes were primarily observed from HRTEM images, further confirming the (004)-preferred orientation for the N-doped TNAs.
It has been found that the two-step anodization is a good method for preparing much more uniform TNAs [31,41] and the growth of diverse top-layer morphologies covering on TNAs [42]. The TNAs with a grid-like top-layer structure are an outcome of competition between the electric-field-driven anodic oxidation of Ti to form TiO2, and the electric-field-assisted chemical dissolution of the TiO2 layer [41,47]. The reactions are given below:
Anodic reaction: Ti + 2H2O − 4e → TiO2 + 4H+
Cathodic reaction: 4H+ + 4e → 2H2
Chemical etching (dissolution) reaction: TiO2 + 6F + 4NH4+ → TiF62− + 2H2O.
The anodic oxidation reaction occurs as Ti4+ ejection and deposition on the surface in the form of TiO2, while the TiF62− etching reaction occurs from top to bottom of the as-grown TiO2. The anodic oxidation rate is very fast and dominated over the NH4F etching rate, resulting in a thin oxide layer in the early stage [31,41]. In the late stage, the deposition rate of TiO2 at the entrance of nanotubes slows down, while field-induced random dissolution of the surface becomes more significant or dominant to form pore-like structures, which further develop into TNA structures [31,41,47]. At certain relative rates between TiO2 deposition and dissolution, a layer of interconnected nanopores can be constructed on the top of TiO2, as shown in the inset of Figure 2b. Notably, the first anodization step offers highly ordered imprints after ultrasonication removal, which plays the role of a template for the subsequent growth of well-aligned nanotubes [31]. The highly ordered TNAs are believed to have potential applications in fields such as solar cells, photonic crystals, photocatalyst, and hydrogen storage [31,41,42].
XPS analysis was performed to quantitatively determine the N-doping concentrations for all the TNAs samples. Figure 3a shows the high-resolution XPS N1s core level spectra of the samples. There was no N1s peak for the TNA annealed in a vacuum. Meanwhile, clear N1s peaks appeared in all the TNAs annealed in N2 gas flows, indicating the presence of N species on the sample surfaces. The N1s peaks can be fitted well with three components, namely Ti–O–N linkage at 400.2 eV [48,49,50], O–Ti–N linkage at 398.7 eV [50], and Ti–N linkage at 397.1 eV [51]. Figure 3b shows a typical O1s spectrum of N-doped TNAs (i.e., the 9.47 at % N sample). As expected, the Ti–O and O–N bonds were clearly observed from O1s spectra of the N-doped TNAs at 530.4 eV and 532.2 eV, respectively [48,49,50]. Figure 3c presents the two Ti2p peaks: Ti2p1/2 at 459.2 eV and Ti2p3/2 at 464.9 eV. The XPS results for N-doped TiO2 agree well with those in [49,50,52].
The quantitative results of XPS analysis are summarized in Table 1. The N doping concentration varied with the N2 gas flows. The N concentration increased from 0 to 9.47 at % with increasing N2 gas flow from 0 (vacuum) to 350 cc/min, but it decreased under a sufficient high N2 gas flow of 500 cc/min. As shown in Figure 3a, the component of Ti–N monotonically increase with increasing N2 gas flows, suggesting the presence of TiN ultra-thin layer on the surfaces of N-TNAs. Thus, it is reasonable to believe that a considerably thick TiN layer was grown during the annealing process at 450 °C under a sufficient high N2 gas flow (i.e., 500 cc/min). The TiN layer can constrain the injection of N atoms into TNAs via thermal diffusion, resulting in the lower N-doping concentration for 500 cc/min than it is for 350 cc/min (Table 1).
The optical absorption is an important property of a photocatalyst. The UV-visible absorption (Figure 4a) is recorded in the range of 350–750 nm. The band gap (Eg) is determined by plotting of (αhν)1/2 against the energy (), and by extrapolating the straight line to hv axis, as shown in Figure 4b, where α is the absorption coefficient, is the photon energy. The Eg of TNAs, with 0, 5.76, 6.60, and 9.47 at % N-TNAs were found to be 3.13 eV, 3.05 eV, 2.91 eV, and 2.95 eV, respectively. The band gap narrowing effect for N-TNAs could be attributed to the presence of N-doped levels (see Figure 4d). It has been reported that N-doping will introduce N2p states near valance band (VB) [53]. Moreover, the incorporation of nitrogen into the TiO2 structure occurs via substitutional and interstitial means [11]. The substitutional doping (Ns) involves oxygen replacement, which reduces the Eg to 3.06 eV [11,54]. Meanwhile, the interstitial doping (Ni) significantly reduces the Eg to (~2.46 eV) [11,54]. The present slight Eg reduction of N-TNAs suggests that the substitutional N doping is the dominant mechanism.
To further elucidate band structures of the samples, the work functions of a pristine TNAs and a N-TNAs (9.47 at %) are characterized by UPS, and the results are shown in Figure 4c. In the experiments, the applied bias is 5 V, and the kinetic energy is determined by drawing the tangent of the spectra. The intercept of the straight line with x-axis are found to be 8.9 eV and 9.2 eV for the TNAs and the N-TNAs, respectively (Figure 4c). Thus, the calculated work functions are 3.9 eV for TNAs and 4.2 eV for the N-TNAs. The UPS results were consistent with the results by Sudhagar et al. [45], where the N-ion implanted TiO2 also had larger work function than that of pristine TiO2 (i.e., 3.9 vs. 3.7 eV). This reflects the incorporation of N atoms into TiO2, which induces the modification of the TiO2 lattice through substitutional doping of oxygen with nitrogen and interstitial nitrogen [53,55,56]. Figure 4d shows a schematic band diagram of N-TNAs, in which the N-doping states is located just above the VB, and will involve in photocatalytic activity of N-TNAs in the visible range.
The insights into the charge recombination process, the effectiveness of trapping, migration and transfer of charge carriers are revealed by means of PL spectra of the TNAs and N-TNAs. As PL emission mainly results from the recombination of excited electrons and holes, a lower PL intensity may indicate a lower recombination rate of electron‒hole pairs and higher separation efficiency under the same test conditions [57,58]. Figure 5a shows the PL spectra of TNAs (0 at % N) and N-TNAs (5.76–9.47 at % N). Clearly, broad PL peaks are observed around 558 nm (~2.22 eV) for the anatase-phase TNAs and N-TNAs, whose origin has been considered to be partially reduced titanium ions, self-trapped excitons, oxygen vacancies and surface states [35,59]. As shown in Figure 5b, the PL emission spectrum of a N-TNAs (9.47 at %) can be fitted by two peaks at 591 nm (2.2 eV) and 524 nm (2.36 eV). The energy levels of oxygen vacancies are located at ~0.5 eV and ~0.8 eV below the conduction band (CB) of TiO2 [60]. Thus, the photogenerated electrons in the CB can fall into the oxygen vacancies through a non-irradiative process, and then they recombine with photogenerated holes in the valence band (VB) to result in the fluorescence emission (see Figure 5c) [60]. Furthermore, as shown in Figure 5a, the PL intensity of N-TNAs systematically decreases with increasing N-doping concentration. The lower PL intensity of N-TNAs can be attributed to the capture of photogenerated holes by surface states (surface nitrogen species) and N states near VB (Figure 5c), agreeing with the PL results in [60]. The PL results further confirm the presence and N states, which serve as a hole reservoir to induce excitation under visible light irradiation and improve electron‒hole separation efficiency.
The photocatalytic activity of TNAs and N-TNAs were studied through photocatalytic degradation of methylene blue (MB) under visible light irradiation. As can be seen in Figure 6a,b, all the N-TNAs possessed higher photocatalytic activity in MB degradation than that of the TNAs, and the activity of N-TNAs increased with increasing N concentration from 5.76 to 9.47 at %. The pseudo-first-order rate constants were determined by fitting the data with the Langmuir–Hinshelwood kinetics rate model [61,62]. The TNAs had a reaction rate constant (k) of 0.115 (h−1), and k increased monotonically with increasing N-doping concentration (see Table 1). The N-TNA (9.47 at %) achieved the highest k value up to 0.259 (h−1), which was 125% higher than that of the pristine TNAs. The present enhancements in photocatalytic degradation MB for N-TNAs are attributed to the localized nitrogen (N-doping states) that enables N-TNAs to enhance both visible light absorption and electron‒hole separation. A local N inter-band induces the optical absorption of TNAs, which can enhance the generation of electron‒hole pairs. This study demonstrates that the facile thermal in N2 ambient at an elevated temperature of 450 °C allows introducing certain N-doping into TiO2 lattice to result in the significant enhancement in photocatalytic activity of TiO2 nanomaterials.
To investigate electron transport properties of TNAs and N-TNAs at the solid–liquid interface, the electrochemical impedance spectroscopy (EIS) data were collected under room light illumination. Figure 6c shows the EIS Nyquist plots for TNAs and N-TNAs (9.47 at %). Clearly, the circular arc radius of N-TNAs electrode is much smaller than TNAs electrode, indicating the smaller interface charge transfer resistance (Rct) of the former. Indeed, by fitting with the equivalent circuit in the inset, we yielded Rct = 19,869 Ω for TNAs and Rct = 6482 Ω for N-TNAs. Thus, it suggests that the introduction of N atom is more beneficial to the separation of the photo-induced electrons and holes and faster charge transfer than that of the TNAs electrode at the solid–liquid interface, agreeing with the results in [4,22,63].
Table 2 summarizes the synthesis methods of N-doped TiO2-based nanomaterials and their photocatalytic performance in degradation various organic pollutants under light irradiation. The photocatalytic degradation rate of the N-TNAs (9.47 at %, k = 0.26 h−1) in this study was twice as high than that of N-TNAs (k = 0.11 h−1) [22], N-TiO2 nanowires (k = 0.13 h−1) [63], and CdS–Ag/TiO2 nanotubes (k = 0.13 h−1) [64]. However, it was almost 2–6 times lower than the k constants of N-TiO2 nanoparticles (k = 0.44 h−1) prepared by sol-solvothermal process [58], N-TiO2 nanosheets (k = 0.45 h−1) synthesized chemical route and electrospinning technique [52], and N-TNAs prepared anodic oxidation [4]. It is worthy of mentioning that the difference in k-constant results can come from the differences in treated solution and intrinsic properties of the materials such as surface area, crystallinity, N-doping concentration, band structure, etc.

4. Conclusions

Modified TNAs and N-TNAs were fabricated by a two-step anodization, followed by thermal annealing at 450 °C in different N2 gas flows for 3 h. TNAs exhibits highly order uniformly and has a grid-like top layer that is grown by the competition between the electric-field-driven anodic oxidation of Ti to form TiO2, and the electric-field-assisted chemical dissolution of the TiO2 layer. The XPS, UV-Vis, UPS, and PL results confirm that N atoms are successfully incorporated into TiO2 lattice to introduce N states (or N-interband) just above the valance band. The N states induce the narrowing the band gap effect to yield the enhancement of visible light absorption for N-TNAs. In addition, N-states easily trap holes and thus serve as carrier reservoir to provide more photocarriers for enhancing photocatalytic activity under visible light irradiation. It also enables us to reduce the electron–hole recombination rate. Thanks to these synergetic effects, the N-doped TNAs with 9.47 at % N exhibit superior photocatalytic activity in MB degradation with k = 0.26 h−1, which accounts for a 125% enhancement as compared to the pristine TNAs. The results of this study demonstrate that the simple annealing process is beneficial for introducing N-doping into TiO2 and enhanced the photocatalytic activity and applications.

Author Contributions

L.T.H., L.T.C.T., N.T.N.H., N.V.T., P.T.P., and P.H.L. performed the experiments and analyzed the data; T.-N.L. performed the XPS and UPS measurements; P.H.L. and J.L. wrote and edited the paper; J.L. supervised the project.

Funding

This research was funded by the Vietnam National Foundation for Science and Technology Development (NAFOSTED) under grant number 103.99-2015.17 and 103.99-2016.75 (P.H.L.) and the Ministry of Science and Technology of Taiwan under grant number MOST107-2923-E-009-002-MY3 (J.L.).

Conflicts of Interest

The authors declare no conflicts of interest.

References

  1. Roy, P.; Kim, D.; Lee, K.; Spiecker, E.; Schmuki, P. TiO2 nanotubes and their application in dye-sensitized solar cells. Nanoscale 2010, 2, 45–59. [Google Scholar] [CrossRef] [PubMed]
  2. Gunawan, B.; Musyaroah; Huda, I.; Indayani, W.; Seni Ramadhanti, S.; Endarko. The influence of various concentrations of N-doped TiO2 as photoanode to increase the efficiency of dye-sensitized solar cell. AIP Conf. Proc. 2017, 1788, 30128. [Google Scholar]
  3. Mor, G.; Shankar, K.; Paulose, M.; Varghese, O.K.; Grimes, C.A. Use of highly-ordered TiO2 nanotube arrays in dye-sensitized solar cells. Nano Lett. 2006, 6, 215–218. [Google Scholar] [CrossRef] [PubMed]
  4. Lai, Y.K.; Huang, J.Y.; Zhang, H.F.; Subramaniam, V.P.; Tang, Y.X.; Gong, D.G.; Sundar, L.; Sun, L.; Chen, Z.; Lin, C.J. Nitrogen-doped TiO2 nanotube array films with enhanced photocatalytic activity under various light sources. J. Hazard. Mater. 2010, 184, 855–863. [Google Scholar] [CrossRef] [PubMed]
  5. Yang, G.; Jiang, Z.; Shi, H.; Xiao, T.; Yan, Z. Preparation of highly visible-light active N-doped TiO2 photocatalyst. J. Mater. Chem. 2010, 20, 5301–5309. [Google Scholar] [CrossRef]
  6. Hsu, M.-Y.; Hsu, H.-L.; Leu, J. TiO2 nanowires on anodic TiO2 nanotube arrays (TNWs/TNAs): Formation mechanism and photocatalytic performance. J. Electrochem. Soc. 2012, 159, H722–H727. [Google Scholar] [CrossRef]
  7. Mor, G.K.; Shankar, K.; Paulose, M.; Varghese, O.K.; Grimes, C.A. Enhanced photo-cleavage of water using titania nanotube arrays. Nano Lett. 2005, 5, 191–195. [Google Scholar] [CrossRef] [PubMed]
  8. Nisar, J.; Topalian, Z.; De Sarkar, A.; Österlund, L.; Ahuja, R. TiO2-based gas sensor: A possible application to SO2. ACS Appl. Mater. Interfaces 2013, 5, 8516–8522. [Google Scholar] [CrossRef] [PubMed]
  9. Abbasi, A.; Sardroodi, J.J. A theoretical investigation of the interaction of Immucillin-A with N-doped TiO2 anatase nanoparticles: Applications to nanobiosensors and nanocarriers. Nanomed. Res. J. 2017, 2, 7–17. [Google Scholar]
  10. Roy, S.C.; Paulose, M.; Grimes, C.A. The effect of TiO2 nanotubes in the enhancement of blood clotting for the control of hemorrhage. Biomaterials 2007, 28, 4667–4672. [Google Scholar] [CrossRef] [PubMed]
  11. Ansari, S.A.; Khan, M.M.; Ansari, M.O.; Cho, M.H. Nitrogen-doped titanium dioxide (N-doped TiO2) for visible light photocatalysis. New J. Chem. 2016, 40, 3000–3009. [Google Scholar] [CrossRef]
  12. Zhang, P.; Fujitsuka, M.; Majima, T. TiO2 mesocrystal with nitrogen and fluorine codoping during topochemical transformation: Efficient visible light induced photocatalyst with the codopants. Appl. Catal. B Environ. 2016, 185, 181–188. [Google Scholar] [CrossRef]
  13. Preethi, L.K.; Antony, R.P.; Mathews, T.; Loo, S.C.J.; Wong, L.H.; Dash, S.; Tyagi, A.K. Nitrogen doped anatase-rutile heterostructured nanotubes for enhanced photocatalytic hydrogen production: Promising structure for sustainable fuel production. Int. J. Hydrogen Energy 2016, 41, 5865–5877. [Google Scholar] [CrossRef]
  14. Asahi, R.; Morikawa, T.; Irie, H.; Ohwaki, T. Nitrogen-doped titanium dioxide as visible-light-sensitive photocatalyst: Designs, developments, and prospects. Chem. Rev. 2014, 114, 9824–9852. [Google Scholar] [CrossRef] [PubMed]
  15. Mazierski, P.; Nischk, M.; Gołkowska, M.; Lisowski, W.; Gazda, M.; Winiarski, M.J.; Klimczuk, T.; Zaleska-Medynska, A. Photocatalytic activity of nitrogen doped TiO2 nanotubes prepared by anodic oxidation: The effect of applied voltage, anodization time and amount of nitrogen dopant. Appl. Catal. B Environ. 2016, 196, 77–88. [Google Scholar] [CrossRef]
  16. Khan, M.M.; Ansari, S.A.; Pradhan, D.; Ansari, M.O.; Han, D.H.; Lee, J.; Cho, M.H. Band gap engineered TiO2 nanoparticles for visible light induced photoelectrochemical and photocatalytic studies. J. Mater. Chem. A 2014, 2, 637–644. [Google Scholar] [CrossRef]
  17. El Ruby Mohamed, A.; Rohani, S. Modified TiO2 nanotube arrays (TNTAs): Progressive strategies towards visible light responsive photoanode, a review. Energy Environ. Sci. 2011, 4, 1065–1086. [Google Scholar] [CrossRef]
  18. Zhang, J.; Wu, Y.; Xing, M.; Leghari, S.A.K.; Sajjad, S. Development of modified N doped TiO2 photocatalyst with metals, nonmetals and metal oxides. Energy Environ. Sci. 2010, 3, 715–726. [Google Scholar] [CrossRef]
  19. Pu, Y.; Wang, G.; Chang, K.; Ling, Y.; Lin, Y.; Fitzmorris, B.C.; Liu, C.; Lu, X.; Tong, Y.; Zhang, J.Z.; et al. Au nanostructure-decorated TiO2 nanowires exhibiting photoactivity across entire UV-visible region for photoelectrochemical water splitting. Nano Lett. 2013, 13, 3817–3823. [Google Scholar] [CrossRef] [PubMed]
  20. Gomathi Devi, L.; Kavitha, R. Review on modified N–TiO2 for green energy applications under UV/visible light: Selected results and reaction mechanisms. RSC Adv. 2014, 4, 28265–28299. [Google Scholar] [CrossRef]
  21. Asahi, R.; Morikawa, T.; Ohwaki, T.; Aoki, K.; Taga, Y. Visible-light photocatalysis in nitrogen-doped titanium oxides. Science 2001, 293, 269–271. [Google Scholar] [CrossRef] [PubMed]
  22. Sun, L.; Cai, J.; Wu, Q.; Huang, P.; Su, Y.; Lin, C. N-doped TiO2 nanotube array photoelectrode for visible-light-induced photoelectrochemical and photoelectrocatalytic activities. Electrochim. Acta 2013, 108, 525–531. [Google Scholar] [CrossRef]
  23. Jagadale, T.C.; Takale, S.P.; Sonawane, R.S.; Joshi, H.M.; Patil, S.I.; Kale, B.B.; Ogale, S.B. N-doped TiO2 nanoparticle based visible light photocatalyst by modi- fied peroxide sol-gel method. J. Phys. Chem. C 2008, 112, 14595–14602. [Google Scholar] [CrossRef]
  24. Preethi, L.K.; Antony, R.P.; Mathews, T.; Walczak, L.; Gopinath, C.S. A Study on Doped Heterojunctions in TiO2 Nanotubes: An Efficient Photocatalyst for Solar Water Splitting. Sci. Rep. 2017, 7, 14314. [Google Scholar] [CrossRef] [PubMed]
  25. Yu, Y.; Zhang, P.; Guo, L.; Chen, Z.; Wu, Q.; Ding, Y.; Zheng, W.; Cao, Y. The design of TiO2 nanostructures (nanoparticle, nanotube, and nanosheet) and their photocatalytic activity. J. Phys. Chem. C 2014, 118, 12727–12733. [Google Scholar] [CrossRef]
  26. Verma, R.; Gangwar, J.; Srivastava, A.K. Multiphase TiO2 nanostructures: A review of efficient synthesis, growth mechanism, probing capabilities, and applications in bio-safety and health. RSC Adv. 2017, 7, 44199–44224. [Google Scholar] [CrossRef]
  27. Tian, J.; Zhao, Z.; Kumar, A.; Boughton, R.I.; Liu, H. Recent progress in design, synthesis, and applications of one-dimensional TiO2 nanostructured surface heterostructures: A review. Chem. Soc. Rev. 2014, 43, 6920–6937. [Google Scholar] [CrossRef] [PubMed]
  28. Ahn, C.; Park, J.; Kim, D.; Jeon, S. Monolithic 3D titania with ultrathin nanoshell structures for enhanced photocatalytic activity and recyclability. Nanoscale 2013, 5, 10384–10389. [Google Scholar] [CrossRef] [PubMed]
  29. Cho, S.; Ahn, C.; Park, J.; Jeon, S. 3D nanostructured N-doped TiO2 photocatalysts with enhanced visible absorption. Nanoscale 2018, 10, 9747–9751. [Google Scholar] [CrossRef] [PubMed]
  30. Huang, J.; Zhang, K.; Lai, Y. Fabrication, modification, and emerging applications of TiO2 nanotube arrays by electrochemical synthesis: A review. Int. J. Photoenergy 2013, 2013, 761971. [Google Scholar] [CrossRef]
  31. Li, S.; Zhang, G.; Guo, D.; Yu, L.; Zhang, W. Anodization fabrication of highly ordered TiO2 nanotubes. J. Phys. Chem. C 2009, 113, 12759–12765. [Google Scholar] [CrossRef]
  32. Kim, D.; Tsuchiya, H.; Fujimoto, S.; Schmidt-Stein, F.; Schmuki, P. Nitrogen-doped TiO2 mesosponge layers formed by anodization of nitrogen-containing Ti alloys. J. Solid State Electrochem. 2012, 16, 89–92. [Google Scholar] [CrossRef]
  33. Kim, D.; Fujimoto, S.; Schmuki, P.; Tsuchiya, H. Nitrogen doped anodic TiO2 nanotubes grown from nitrogen-containing Ti alloys. Electrochem. Commun. 2008, 10, 910–913. [Google Scholar] [CrossRef]
  34. Su, Y.; Zhang, X.; Zhou, M.; Han, S.; Lei, L. Preparation of high efficient photoelectrode of N-F-codoped TiO2 nanotubes. J. Photochem. Photobiol. A Chem. 2008, 194, 152–160. [Google Scholar] [CrossRef]
  35. Kawai, T.; Kishimoto, Y.; Kifune, K. Photoluminescence studies of nitrogen-doped TiO2 powders prepared by annealing with urea. Philos. Mag. 2012, 92:33, 4088–4097. [Google Scholar] [CrossRef]
  36. Vitiello, R.P.; Macak, J.M.; Ghicov, A.; Tsuchiya, H.; Dick, L.F.P.; Schmuki, P. N-doping of anodic TiO2 nanotubes using heat treatment in ammonia. Electrochem. Commun. 2006, 8, 544–548. [Google Scholar] [CrossRef]
  37. Stranak, V.; Quaas, M.; Bogdanowicz, R.; Steffen, H.; Wulff, H.; Hubicka, Z.; Tichy, M.; Hippler, R. Effect of nitrogen doping on TiOxNy thin film formation at reactive high-power pulsed magnetron sputtering. J. Phys. D Appl. Phys. 2010, 43, 285203. [Google Scholar] [CrossRef]
  38. Stegemann, C.; Moraes, R.S.; Duarte, D.A.; Massi, M. Thermal annealing effect on nitrogen-doped TiO2 thin films grown by high power impulse magnetron sputtering plasma power source. Thin Solid Films 2017, 625, 49–55. [Google Scholar] [CrossRef]
  39. Vrakatseli, V.E.; Kalarakis, A.N.; Kalampounias, A.G.; Amanatides, E.K.; Mataras, D.S. Glancing Angle Deposition Effect on Structure and Light-Induced Wettability of RF-Sputtered TiO2 Thin Films. Micromachines 2018, 9, 389. [Google Scholar] [CrossRef] [PubMed]
  40. Mor, G.K.; Varghese, O.K.; Paulose, M.; Shankar, K.; Grimes, C.A. A review on highly ordered, vertically oriented TiO2 nanotube arrays: Fabrication, material properties, and solar energy applications. Sol. Energy Mater. Sol. Cells 2006, 90, 2011–2075. [Google Scholar] [CrossRef]
  41. Wang, D.; Yu, B.; Wang, C.; Zhou, F.; Liu, W. A novel protocol toward perfect alignment of anodized TiO2 nanotubes. Adv. Mater. 2009, 21, 1964–1967. [Google Scholar] [CrossRef]
  42. Zhang, Z.; Wang, P. Optimization of photoelectrochemical water splitting performance on hierarchical TiO2 nanotube arrays. Energy Environ. Sci. 2012, 5, 6506–6512. [Google Scholar] [CrossRef]
  43. Pishkar, N.; Ghoranneviss, M.; Ghorannevis, Z.; Akbari, H. Study of the highly ordered TiO2 nanotubes physical properties prepared with two-step anodization. Results Phys. 2018, 9, 1246–1249. [Google Scholar] [CrossRef]
  44. Le, P.H.; Leu, J. Recent advances in TiO2 nanotube-based materials for photocatalytic applications designed by anodic oxidation. In Titanium Dioxide-Material for Sustainable Environment; Yang, D., Ed.; INTECH: London, UK, 2018; pp. 131–150. [Google Scholar]
  45. Sudhagar, P.; Asokan, K.; Ito, E.; Kang, Y.S. N-Ion-implanted TiO2 photoanodes in quantum dot-sensitized solar cells. Nanoscale 2012, 4, 2416–2422. [Google Scholar] [CrossRef] [PubMed]
  46. Jordan, V.; Javornik, U.; Plavec, J.; Podgornik, A.; Rečnik, A. Self-assembly of multilevel branched rutile-type TiO2 structures via oriented lateral and twin attachment. Sci. Rep. 2016, 6, 24216. [Google Scholar] [CrossRef] [PubMed]
  47. Yan, J.; Zhou, F. TiO2 nanotubes: Structure optimization for solar cells. J. Mater. Chem. 2011, 21, 9406–9418. [Google Scholar] [CrossRef]
  48. Agyeman, D.A.; Song, K.-S.; Kang, S.-H.; Jo, M.; Cho, E.; Kang, Y. An improved catalytic effect of nitrogen-doped TiO2 nanofibers for rechargeable Li–O2 batteries; the role of oxidation states and vacancies on the surface. J. Mater. Chem. A 2015, 3, 22557–22563. [Google Scholar] [CrossRef]
  49. Peng, F.; Cai, L.; Huang, L.; Yu, H.; Wang, H. Preparation of nitrogen-doped titanium dioxide with visible-light photocatalytic activity using a facile hydrothermal method. J. Phys. Chem. Solids 2008, 69, 1657–1664. [Google Scholar] [CrossRef]
  50. Sathish, M.; Viswanathan, B.; Viswanath, R.P.; Gopinath, C.S. Synthesis, characterization, electronic structure, and photocatalytic activity of nitrogen-doped TiO2 nanocatalyst. Chem. Mater. 2005, 17, 6349–6353. [Google Scholar] [CrossRef]
  51. Kusumawardani, C.; Indiana, K. Synthesis of nanocrystalline N-doped TiO2 and its application on high efficiency of dye-sensitized solar cells. Sci. J. UBU 2010, 1, 1–8. [Google Scholar]
  52. Nikhil, A.; Anjusree, G.S.; Nair, S.V.; Nair, A.S. Visible light-induced photocatalytic activity of high surface area N-doped two-dimensional (2-D) TiO2 sheets. RSC Adv. 2015, 5, 88464–88470. [Google Scholar] [CrossRef]
  53. Batzill, M.; Morales, E.H.; Diebold, U. Influence of nitrogen doping on the defect formation and surface properties of TiO2 rutile and anatase. Phys. Rev. Lett. 2006, 96, 026103. [Google Scholar] [CrossRef] [PubMed]
  54. Dunnill, C.W.; Parkin, I.P. Nitrogen-doped TiO2 thin films: Photocatalytic applications for healthcare environments. Dalt. Trans. 2011, 40, 1635–1640. [Google Scholar] [CrossRef] [PubMed]
  55. Lynch, J.; Giannini, C.; Cooper, J.K.; Loiudice, A.; Sharp, I.D.; Buonsanti, R. Substitutional or interstitial site selective nitrogen doping in TiO2 nanostructures. J. Phys. Chem. C 2015, 119, 7443–7452. [Google Scholar] [CrossRef]
  56. Tao, J.; Luttrell, T.; Batzill, M. A two-dimensional phase of TiO2 with a reduced bandgap. Nat. Chem. 2011, 3, 296–300. [Google Scholar] [CrossRef] [PubMed]
  57. Liu, H.; Liu, G.; Xie, G.; Zhang, M.; Hou, Z.; He, Z. Gd3+, N-codoped trititanate nanotubes: Preparation, characterization and photocatalytic activity. Appl. Surf. Sci. 2011, 257, 3728–3732. [Google Scholar] [CrossRef]
  58. Jiang, H.; Yan, P.; Wang, Q.; Zang, S.; Li, J.; Wang, Q. High-performance Yb, N, P-tridoped anatase-TiO2 nano-photocatalyst with visible light response by sol-solvothermal method. Chem. Eng. J. 2013, 215–216, 348–357. [Google Scholar] [CrossRef]
  59. Preclíková, J.; Galář, P.; Trojánek, F.; Daniš, S.; Rezek, B.; Gregora, I.; Němcová, Y.; Malý, P. Nanocrystalline titanium dioxide films: Influence of ambient conditions on surface- and volume-related photoluminescence. J. Appl. Phys. 2010, 108, 113502. [Google Scholar] [CrossRef]
  60. Wang, E.; He, T.; Zhao, L.; Chen, Y.; Cao, Y. Improved visible light photocatalytic activity of titania doped with tin and nitrogen. J. Mater. Chem. 2011, 21, 144–150. [Google Scholar] [CrossRef]
  61. Hoffmann, M.R.; Martin, S.T.; Choi, W.; Bahnemann, D.W. Environmental Applications of Semiconductor Photocatalysis. Chem. Rev. 1995, 95, 69–96. [Google Scholar] [CrossRef]
  62. Sharma, S.D.; Saini, K.K.; Kant, C.; Sharma, C.P.; Jain, S.C. Photodegradation of dye pollutant under UV light by nanocatalyst doped titania thin films. Appl. Catal. B 2008, 84, 233–240. [Google Scholar] [CrossRef]
  63. Liu, C.; Zhang, L.; Liu, R.; Gao, Z.; Yang, X.; Tu, Z.; Yang, F.; Ye, Z.; Cui, L.; Xu, C.; et al. Hydrothermal synthesis of N-doped TiO2 nanowires and N-doped graphene heterostructures with enhanced photocatalytic properties. J. Alloys Compd. 2016, 656, 24–32. [Google Scholar] [CrossRef]
  64. Wang, Q.; Yang, X.; Liu, D.; Chi, L.; Hou, J. Ag and CdS nanoparticles co-sensitized TiO2 nanotubes for enhancing visible photoelectrochemical performance. Electrochim. Acta 2012, 83, 140–145. [Google Scholar] [CrossRef]
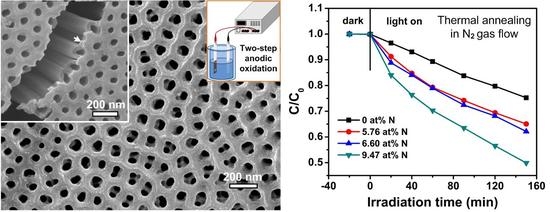
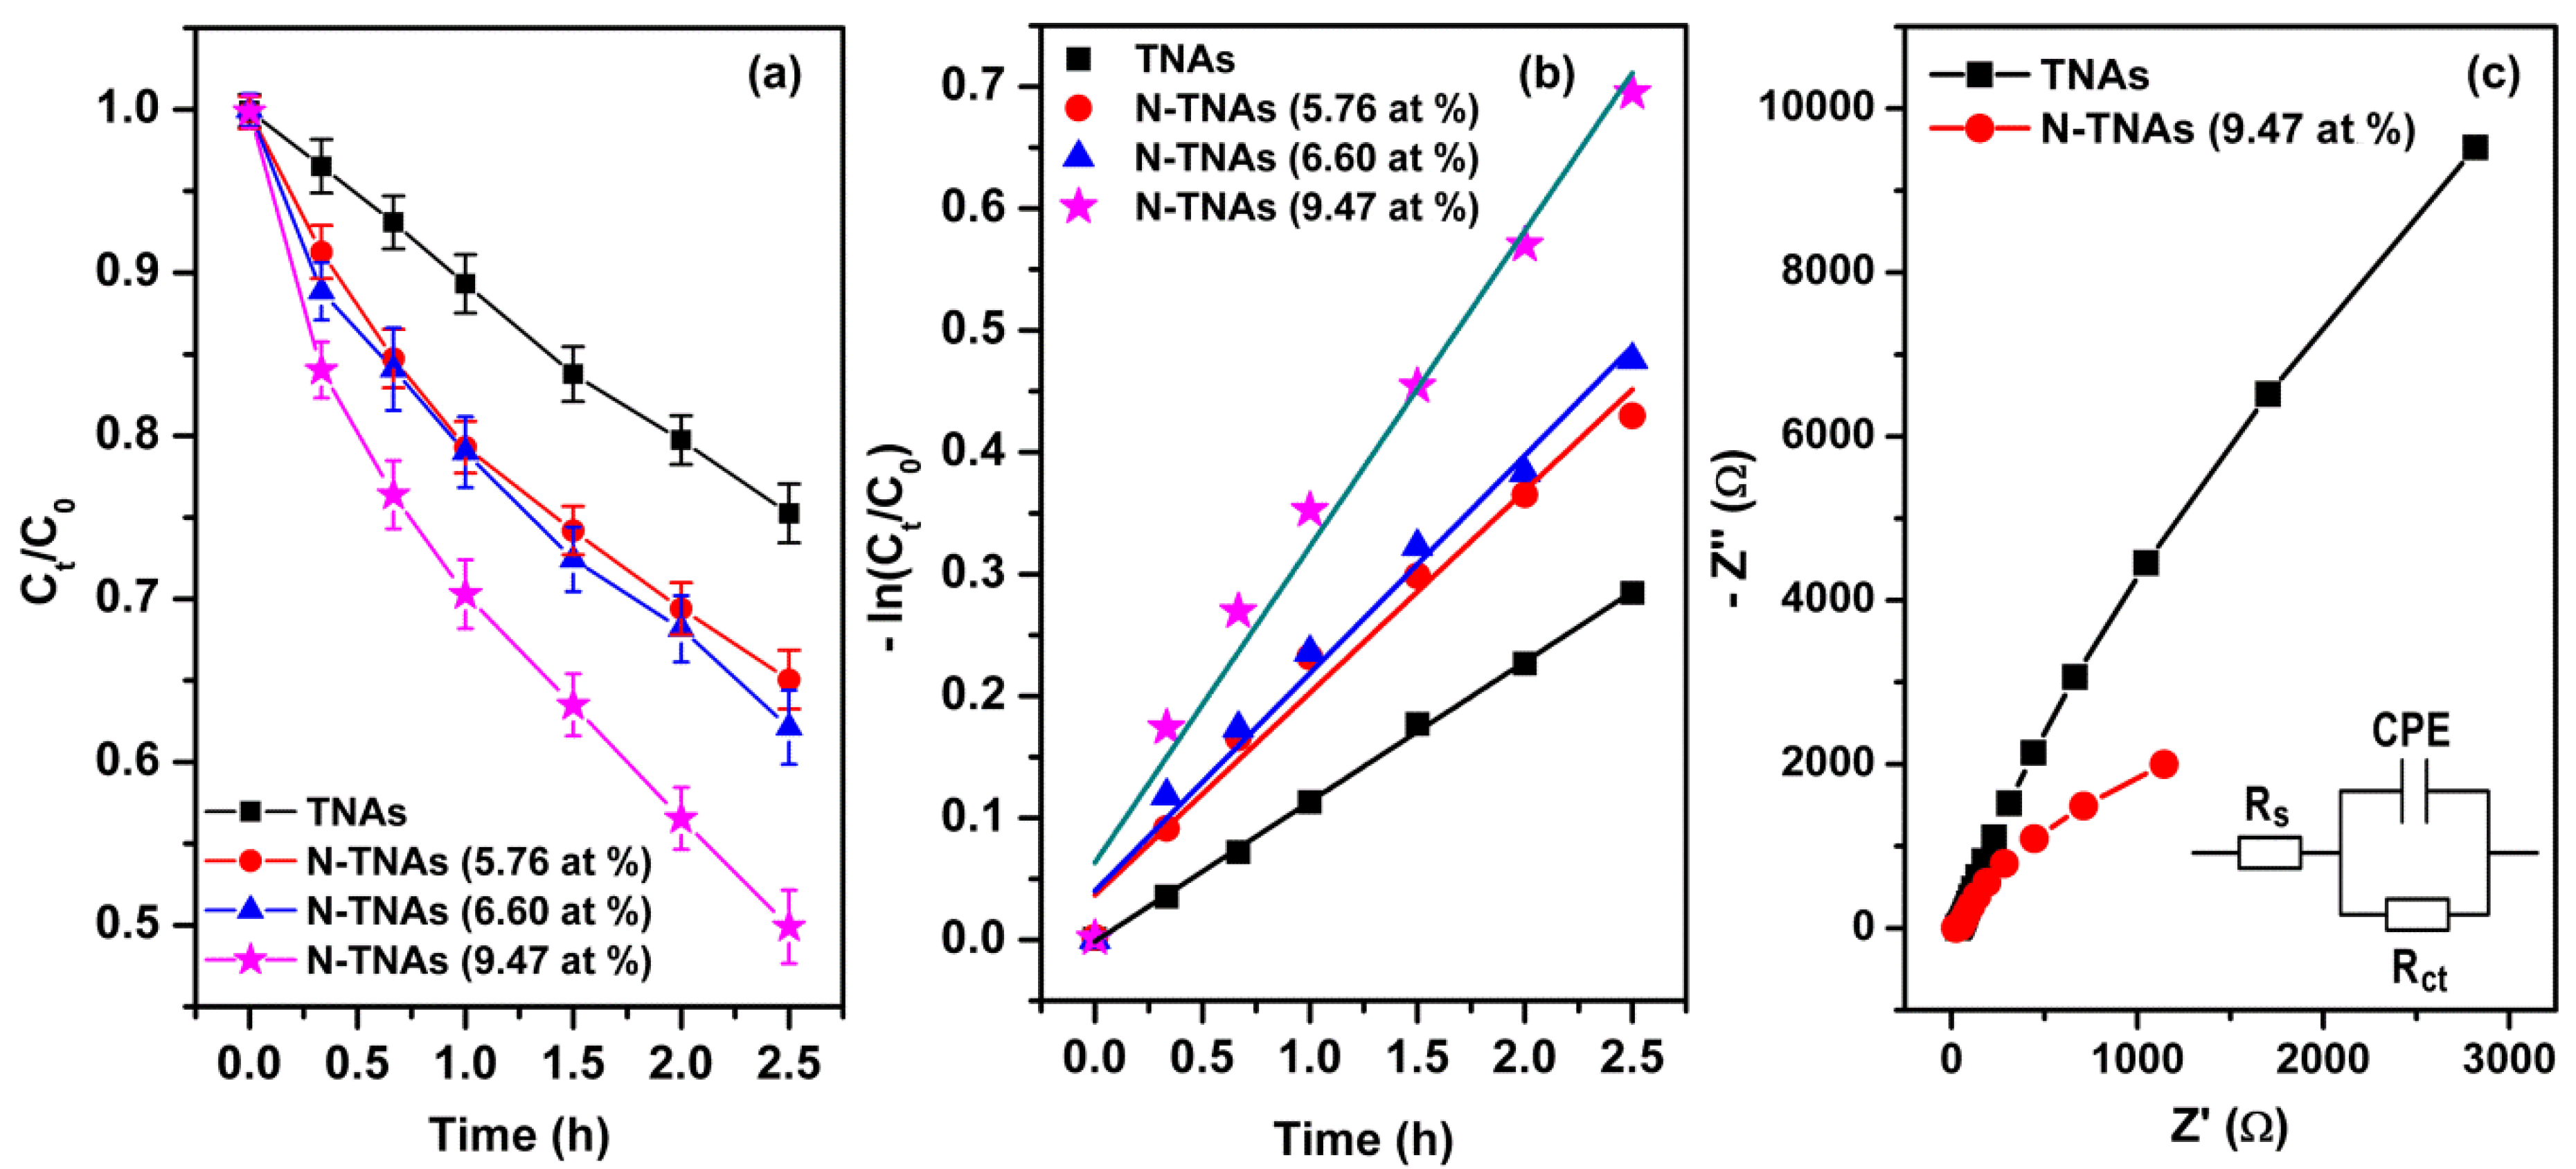
Figure 1. The XRD patterns of the pristine TNAs and N-doped TNAs with various N concentrations prepared by thermal annealing under different N2 gas flows: (a) 0 at % N in vacuum, (b) 5.76 at % N at 200 cc/min, (c) 9.47 at % N at 350 cc/min, and 6.60 at % N at 500 cc/min.
Micromachines 09 00618 g001
Figure 2. (a,b) SEM images of a typical N-doped TiO2 nanotube arrays (TNAs). The inset in (a) is a cross-sectional view of a TNA block. The inset in (b) shows grid-like top-layer covering on the TNAs. TEM images of a N-TNAs (9.47 at %): (c) a low magnification image at a TNA segment, (d) a high magnification image at the square area in (c).
Micromachines 09 00618 g002
Figure 3. (a) XPS spectra of N1s of the pristine and N-doped TNAs. XPS spectra of (b) O1s and (c) Ti2p of the 9.47 at % N-doped TNAs.
Micromachines 09 00618 g003
Figure 4. (a) UV-Vis absorption spectra of pristine TNAs and N-TNAs with various N-doping levels. (b) Plot of (αhν)1/2 vs. hν of the samples. (c) UPS spectroscopy of pristine TNAs and N (9.47 at %)-TNAs, (d) the schematic band diagram of N-TNAs.
Micromachines 09 00618 g004
Figure 5. (a) Photoluminescence spectra of TNAs and N-TNAs with different N concentrations from 5.76 to 9.47 at %. (b) The fitting PL spectrum for the N-TNAs (9.47 at %), two peaks can clearly be observed. (c) Energy level model for excitation and luminescence processes in N-TNAs.
Micromachines 09 00618 g005
Figure 6. (a) Photocatalytic activity of TNAs and N-TNAs recorded in 0.5 ppm methylene blue solution under visible light illumination; the error bar indicates standard error of the mean data of three sample series. (b) Methylene blue degradation kinetic curves of TNAs and N-TNAs with different N-doping concentrations under visible light illumination. (c) EIS Nyquist plots for a TNA and a N-TNAs (9.47 at %) under visible light irradiation.; the inset is the equivalent fitting circuit.
Micromachines 09 00618 g006
Table 1. N atomic concentration and reaction rate constant (k) in 0.5 ppm methylene blue solution of the TNA samples annealed in various N2 gas flows.
N2 Gas Flow (cc/min)N at % (Determined by XPS)Reaction Rate (h−1) under Visible Light Irradiation
001.15 × 10⁻¹
2005.761.66 × 10−1
5006.601.79 × 10−1
3509.472.59 × 10−1
Table 2. N-doped TiO2-based nanomaterials, synthesis methods, organic pollutants, N-doping concentration, and reaction rates of the optimal N-TNAs in this study and in the relevant literature.
PhotocatalystSynthesis MethodsOrganic PollutantsN Concentration (at. %)Reaction Rate (h−1)Ref.
Modified N-TNAsTwo-step anodizationMethylene blue9.470.26This study
N-TiO2 nanosheetsChemical routeMethyl orange-0.45[52]
N-TNAsAnodic oxidationRhB dye-0.11[22]
N-TNAsAnodic oxidationMethyl orange-1.62[4]
N-TiO2 nanowiresHydrothermal methodMethylene blue-0.13[63]
TiO2 nanoparticlesSol-gelMethylene blue5–10-[23]
CdS–Ag/TiO2 NTsTwo-step anodizationMethyl orange-0.13[64]
N-TiO2 nanoparticlesSol-solvothermal processMethylene blue-0.44[58]

