Rapid Detection of Echinocandins Resistance by MALDI-TOF MS in Candida parapsilosis Complex

 ,
,
Abstract
:1. Introduction
2. Materials and Methods
2.1. Specimen, Diagnosis and Storage
2.2. Antifungal Susceptibility Testing (AFST) by CLSI Method
2.3. Antifungal Susceptibility Testing by MALDI-TOF MS (AFST-MS)
2.4. Data Analysis
3. Results
4. Discussion
5. Conclusions
Author Contributions
Funding
Acknowledgments
Conflicts of Interest
References
- Arendrup, M.C. Epidemiology of invasive candidiasis. Curr. Opin. Crit. Care 2010, 16, 445–452. [Google Scholar] [CrossRef] [PubMed]
- Cordeiro, R.A.; Evangelista, A.J.J.; Serpa, R.; Andrade, A.R.C.; Mendes, P.B.L.; Oliveira, J.S.; Alencar, L.P.; Pereira, V.S.; Lima-Neto, R.G.; Brilhante, R.N.; et al. Cefepime and Amoxicillin Increase Metabolism and Enhance Caspofungin Tolerance of Candida albicans Biofilms. Front. Microbiol. 2019, 10, 1337. [Google Scholar] [CrossRef] [PubMed]
- Hinrichsen, S.L.; Falcão, E.; Vilella, T.A.S.; Rêgo, L.; Lira, C.; Almeida, L.; Martins, M.; Araújo, C.; Duarte, M.; Lopes, G. Candida isolates in tertiary hospitals in Northeastern Brazil. Braz. J. Microbiol. 2009, 40, 325–328. [Google Scholar] [CrossRef] [PubMed] [Green Version]
- Nucci, M.; Queiroz-Telles, F.; Alvarado-Matute, T.; Tiraboschi, I.N.; Cortes, J.; Zurita, J.; Guzman-Blanco, M.; Santolaya, M.E.; Thompson, L.; Sifuentes-Osornio, J.; et al. Epidemiology of candidemia in Latin America: A laboratory-based survey. PLoS ONE 2013, 8, 59373. [Google Scholar] [CrossRef] [PubMed] [Green Version]
- Silva, R.B.; Hinrichsen, S.L.; Neves, R.P.; Lima-Neto, R.G. Candidemia in a public hospital in Northeastern Brazil: Epidemiological features and risk factors in critically ill patients. Rev. Iberoam. Micol. 2019, 36, 181–185. [Google Scholar] [CrossRef] [PubMed]
- Clancy, C.J.; Nguyen, M.H. Finding the “missing 50%” of invasive candidiasis: How nonculture diagnostics will improve understanding of disease spectrum and transform patient care. Clin. Infect. Dis. 2013, 56, 1284–1292. [Google Scholar] [CrossRef] [PubMed]
- Groll, A.; Shah, P.M.; Mentzel, C.; Schneider, M.; Just-Nuebling, G.; Huebner, K. Trends in the postmortem epidemiology of invasive fungal infections at a university hospital. J. Infect. 1996, 33, 23–32. [Google Scholar] [CrossRef]
- Klingspor, L.; Jalal, S. Molecular detection and identification of Candida and Aspergillus spp. from clinical samples using real-time PCR. Clin. Microbiol. Infect. 2006, 12, 745–753. [Google Scholar] [CrossRef] [PubMed] [Green Version]
- Saracli, M.A.; Fothergill, A.W.; Sutton, D.A.; Wiederhold, N.P. Detection of triazole resistance among Candida species by matrix-assisted laser desorption/ionization-time of flight mass spectrometry (MALDI-TOF MS). Med. Mycol. 2015, 53, 736–742. [Google Scholar] [CrossRef] [PubMed] [Green Version]
- Lima-Neto, R.G.; Santos, C.; Lima, N.; Sampaio, P.; Pais, C.; Neves, R.P. Application of MALDI-TOF MS for requalification of Candida clinical isolates culture collection. Braz. J. Microbiol. 2014, 45, 515–522. [Google Scholar] [CrossRef] [PubMed] [Green Version]
- Marinach, C.; Alanio, A.; Palous, M.; Kwasek, S.; Fekkar, A.; Brossas, J.Y.; Brun, S.; Snounou, G.; Hennequin, C.; Sanglard, D.; et al. MALDI-TOF MS-based drug susceptibility testing of pathogens: The example of Candida albicans and fluconazole. Proteomics 2009, 9, 4627–4631. [Google Scholar] [CrossRef] [PubMed]
- Vella, A.; De Carolis, E.; Vaccaro, L.; Posteraro, P.; Perlin, D.S.; Kostrzewa, M.; Posteraro, B.; Sanguinetti, M. Rapid antifungal susceptibility testing by Matrix-Assisted Laser Desorption Ionization Time-of-Flight Mass Spectrometry analysis. J. Clin. Microbiol. 2013, 51, 2964–2969. [Google Scholar] [CrossRef] [PubMed] [Green Version]
- CLSI. Reference Method for Broth Dilution Testing of Yeasts Approved Standard Document M27-A3; Clinical and Laboratory Standards Institute: Wayne, PA, USA, 2008; Volume 28, pp. 1–25. ISBN 1-56238-66-2. [Google Scholar]
- CLSI. Reference Method for Broth Dilution Antifungal Susceptibility Testing of Yeasts. M27-S4; Fourth Informational Supplement; Clinical and Laboratory Standards Institute: Wayne, PA, USA, 2012; Volume 28, pp. 1–23. [Google Scholar]
- Vella, A.; De Carolis, E.; Mello, E.; Perlin, D.S.; Sanglard, D.; Sanguinetti, M.; Posteraro, B. Potential use of MALDI-TOF mass spectrometry for rapid detection of antifungal resistance in the human pathogen Candida glabrata. Sci. Rep. 2017, 7, 9099. [Google Scholar] [CrossRef] [PubMed]
- De Carolis, E.; Vella, A.; Florio, A.R.; Posteraro, P.; Perlin, D.S.; Sanguinetti, M.; Posteraro, B. Use of matrix-assisted laser desorption ionization-time of flight mass spectrometry (MALDITOF MS) for caspofungin susceptibility testing of Candida and Aspergillus species. J. Clin. Microbiol. 2012, 50, 2479–2483. [Google Scholar] [CrossRef] [PubMed] [Green Version]
- Paul, S.; Singh, P.; Shamanth, A.S.; Rudramurthy, S.M.; Chakrabarti, A.; Ghosh, A.K. Rapid detection of fluconazole resistance in Candida tropicalis by MALDI-TOF MS. Med. Mycol. 2018, 56, 234–241. [Google Scholar] [CrossRef] [PubMed]
- Espinel-Ingroff, A.; Barchiesi, F.; Cuenca-Estrella, M.; Pfaller, M.A.; Rinaldi, M.; Rodriguez-Tudela, J.L.; Verweij, P.E. International and multicenter comparison of EUCAST and CLSI M27-A2 broth microdilution methods for testing susceptibilities of Candida spp. to fluconazole, itraconazole, posaconazole, and voriconazole. J. Clin. Microbiol. 2005, 43, 3884–3889. [Google Scholar] [CrossRef] [PubMed] [Green Version]
- Martines-Lamas, L.; Molino, M.L.P.; Pardo, F.; Varela, E.; Regueiro, B.J. Espectrometría de masas matrix-assisted laser desorption ionization time-of-flight vs. metodología convencional en la identificación de Candida no-albicans. Enferm. Infecc. Microbiol. Clin. 2011, 29, 568–572. [Google Scholar] [CrossRef] [PubMed]


| Isolated and Lab Number | Breakpoint (MIC in µg/mL) Breakpoint (MPCC in µg/mL) | |||||
|---|---|---|---|---|---|---|
| Anidula. | Caspo. | Mica. | Anidula. | Caspo. | Mica. | |
| C. parapsilosis 346A | S (0.25) | S (0.25) | S (2) | S (0.5) | S (0.125) | S (0.5) |
| C. parapsilosis 346B | S (0.25) | S (0.25) | S (2) | S (0.25) | S (0.0625) | S (0.5) |
| C. parapsilosis 474 | S (0.5) | S (0.5) | S (2) | S (0.125) | S (0.5) | S (0.5) |
| C. parapsilosis 595 | S (0.25) | S (0.25) | S (1) | S (0.0625) | S (0.25) | S (0.25) |
| C. parapsilosis 596A | S (0.25) | S (0.25) | S (0.5) | S (0.0625) | S (0.125) | S (0.5) |
| C. parapsilosis 596B | S (0.25) | S (0.25) | S (0.5) | S (0.125) | S (0.0625) | S (2) |
| C. parapsilosis 5902 | S (0.0625) | S (0.0625) | S (0.03125) | S (0.25) | S (0.25) | S (0.03125) |
| C. parapsilosis 12 | S (0.125) | S (0.03125) | S (0.03125) | S (0.03125) | S (0.125) | S (0.06125) |
| C. parapsilosis 29 | S (0.125) | S (0.0625) | S (0.0625) | S (0.0625) | S (0.25) | S (0.25) |
| C. parapsilosis 30 | S (0.0625) | S (0.0625) | S (0.0625) | S (0.125) | S (0.25) | S (0.25) |
| C. parapsilosis 31 | S (0.25) | S (0.125) | S (0.0625) | S (1) | S (0.5) | S (0.25) |
| C. parapsilosis 39 | S (0.0625) | S (0.125) | S (0.0625) | S (0.03125) | S (0.5) | S (0.25) |
| C. parapsilosis 40 | R (16) | S (0.25) | S (2) | S (1) | S (0.5) | S (2) |
| C. parapsilosis 44 | S (0.03125) | S (0.0625) | S (0.0625) | S (0.03125) | S (0.25) | S (0.25) |
| C. parapsilosis 45 | S (0.25) | S (0.0625) | S (0.0625) | S (0.125) | S (0.0625) | S (0.25) |
| C. parapsilosis 48 | S (0.0625) | S (0.0625) | S (0.03125) | S (0.25) | S (0.25) | S (0.03125) |
| C. parapsilosis 49 | S (0.03125) | S (0.03125) | S (0.06125) | S (0.03125) | S (0.125) | S (0.25) |
| C. orthopsilosis 03 | S (0.0625) | S (0.125) | S (0.5) | S (0.25) | I+(4) | S (0.5) |
| C. orthopsilosis 07 | S (2) | S (0.0625) | S (0.5) | S (0.03125) | S (0.03125) | S (0.03125) |
| C. metapsilosis 32 | S (1) | S (1) | S (0,5) | S (0.25) | S (0.25) | S (0.5) |
| ATCC 22019 | S (0.5) | S (0.5) | S (1) | S (0.5) | S (0.25) | S (0.5) |
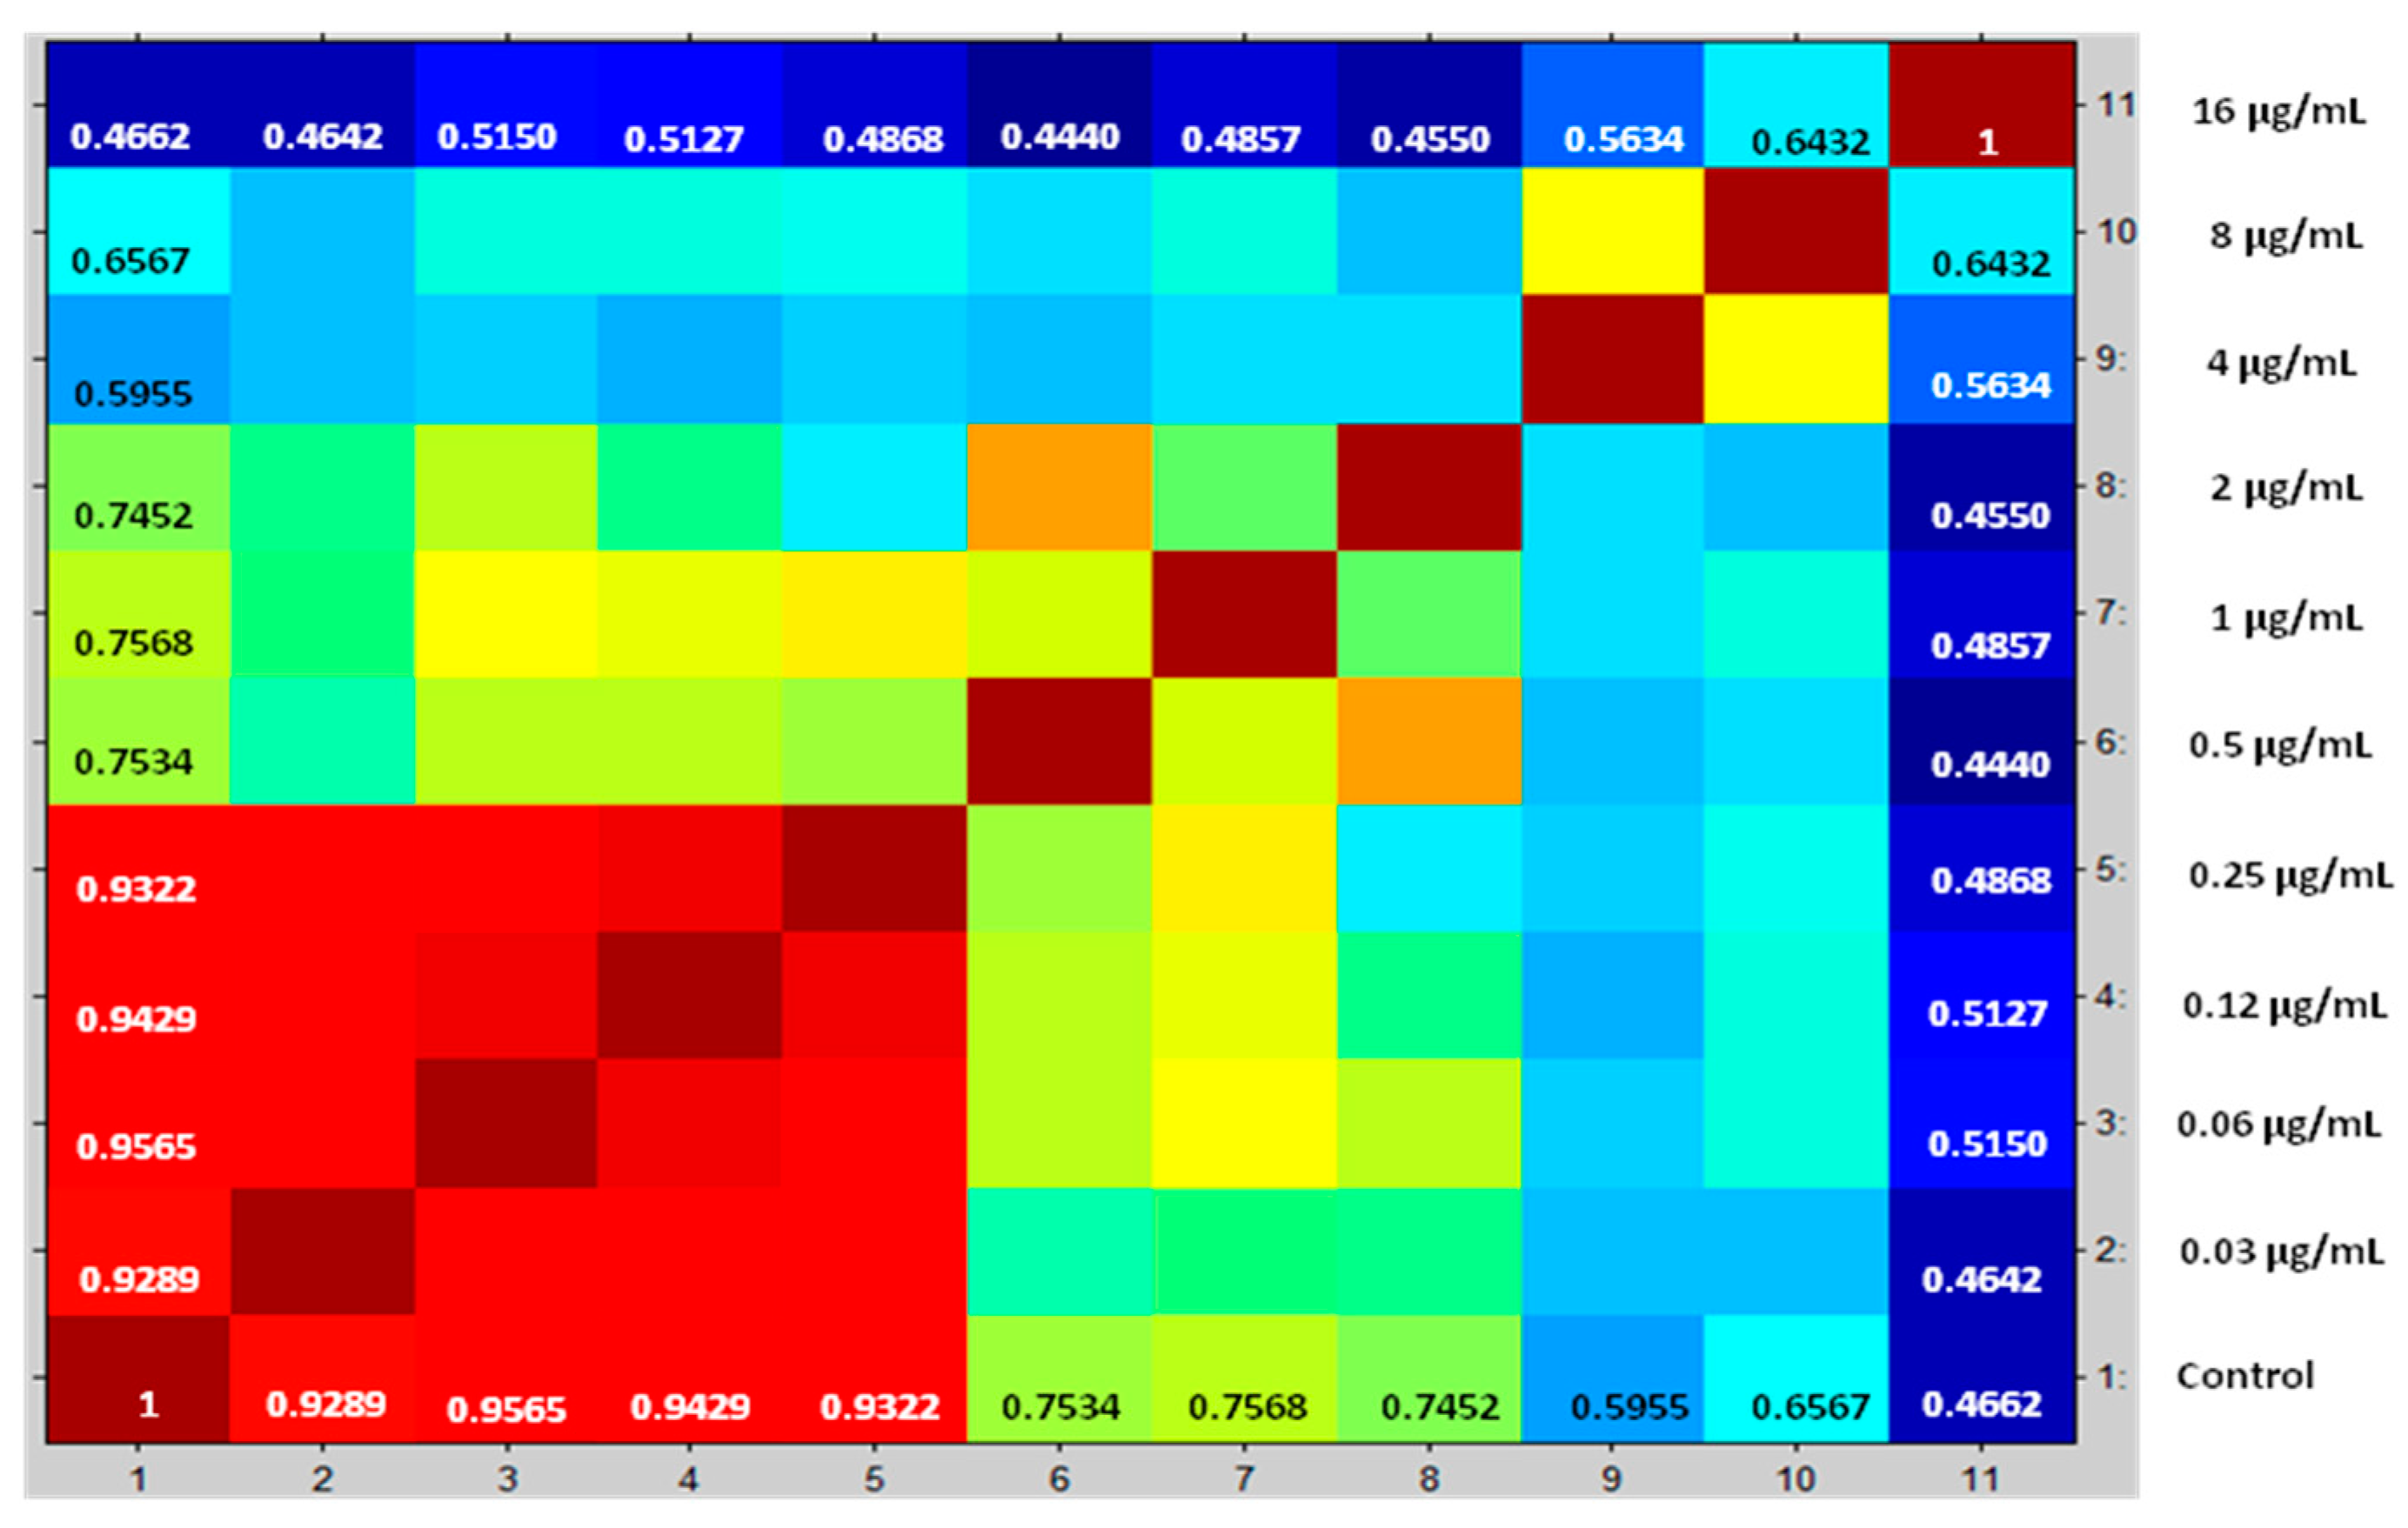
| MPCC (µg/mL) | CCI Null | CCI Maximum |
|---|---|---|
| 0.0000 | 0.4662 | 1.0000 |
| 0.0313 | 0.4642 | 0.9289 |
| 0.0625 | 0.5150 | 0.9565 |
| 0.1250 | 0.5127 | 0.9429 |
| 0.2500 | 0.4868 | 0.9322 |
| 0.5000 | 0.4440 | 0.7534 |
| 1.0000 | 0.4857 | 0.7568 |
| 2.0000 | 0.4550 | 0.7452 |
| 4.0000 | 0.5634 | 0.5955 |
| 8.0000 | 0.6432 | 0.6567 |
| 16.0000 | 1.0000 | 0.4662 |
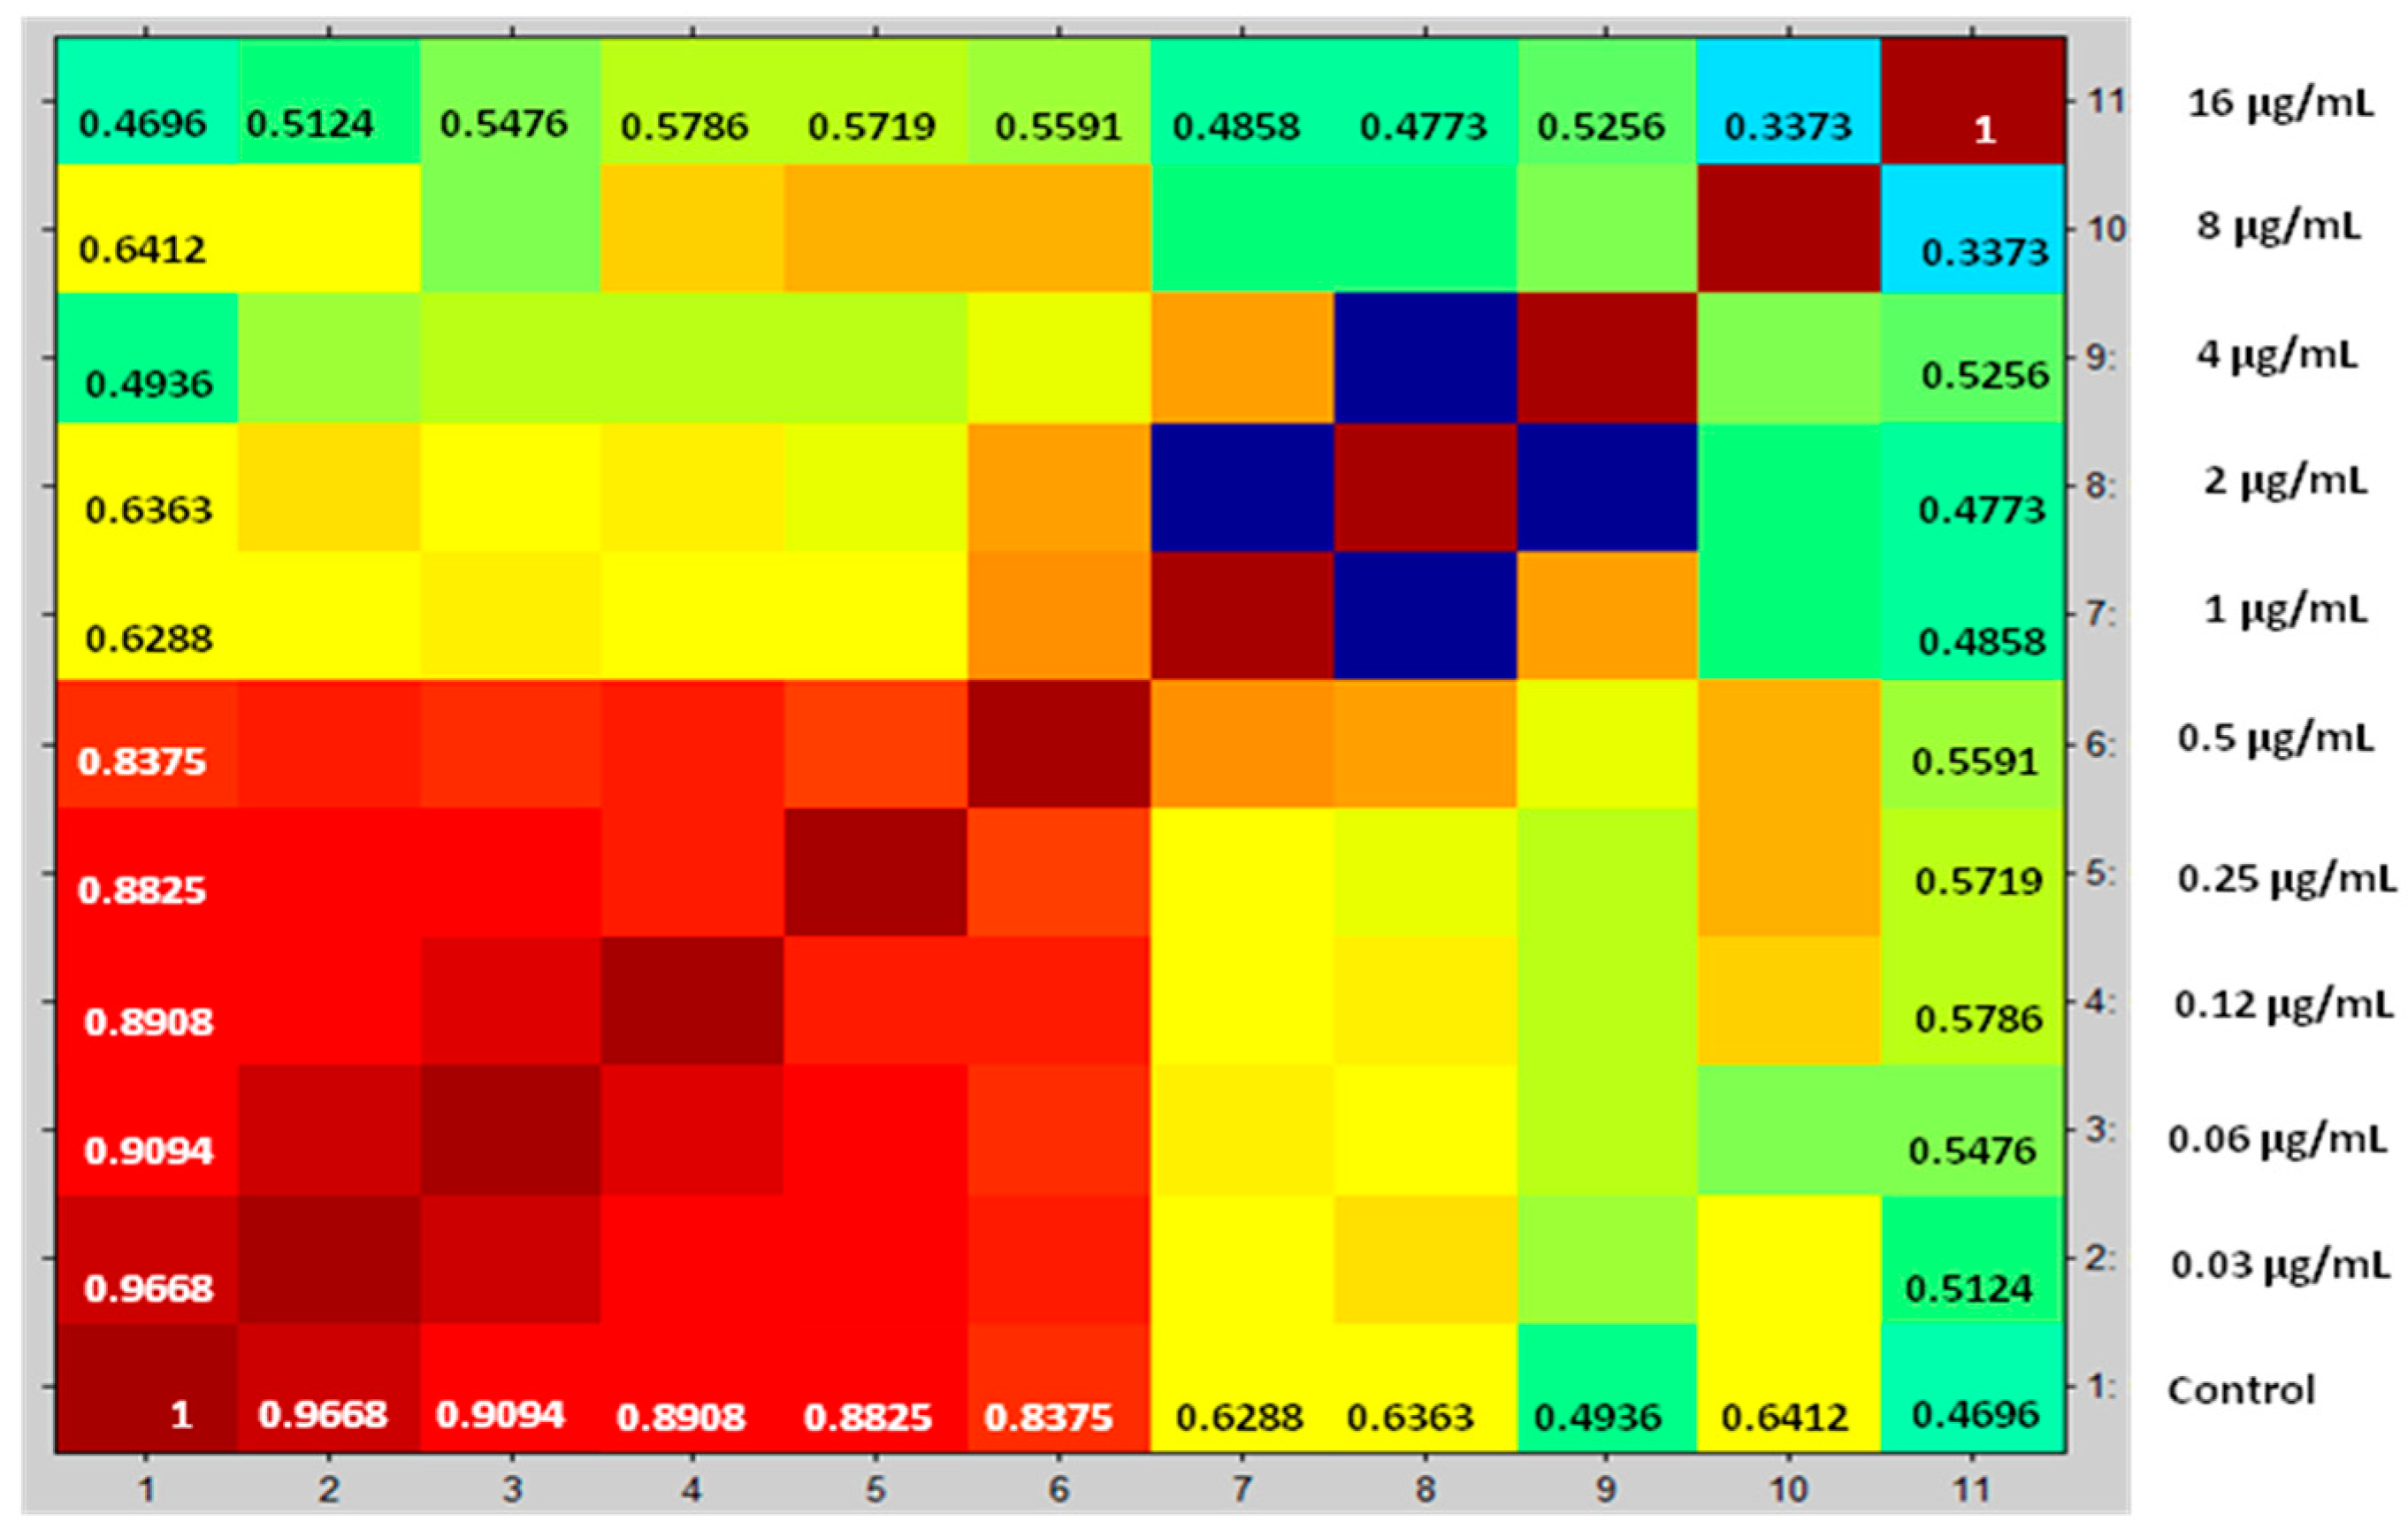
| MPCC (µg/mL) | CCI Null | CCI Maximum |
|---|---|---|
| 0.0000 | 0.4696 | 1.0000 |
| 0.0313 | 0.5124 | 0.9668 |
| 0.0625 | 0.5476 | 0.9094 |
| 0.1250 | 0.5786 | 0.8908 |
| 0.2500 | 0.5719 | 0.8825 |
| 0.5000 | 0.5591 | 0.8375 |
| 1.0000 | 0.4858 | 0.6288 |
| 2.0000 | 0.4773 | 0.6363 |
| 4.0000 | 0.5256 | 0.4936 |
| 8.0000 | 0.3373 | 0.6412 |
| 16.0000 | 1.0000 | 0.4696 |
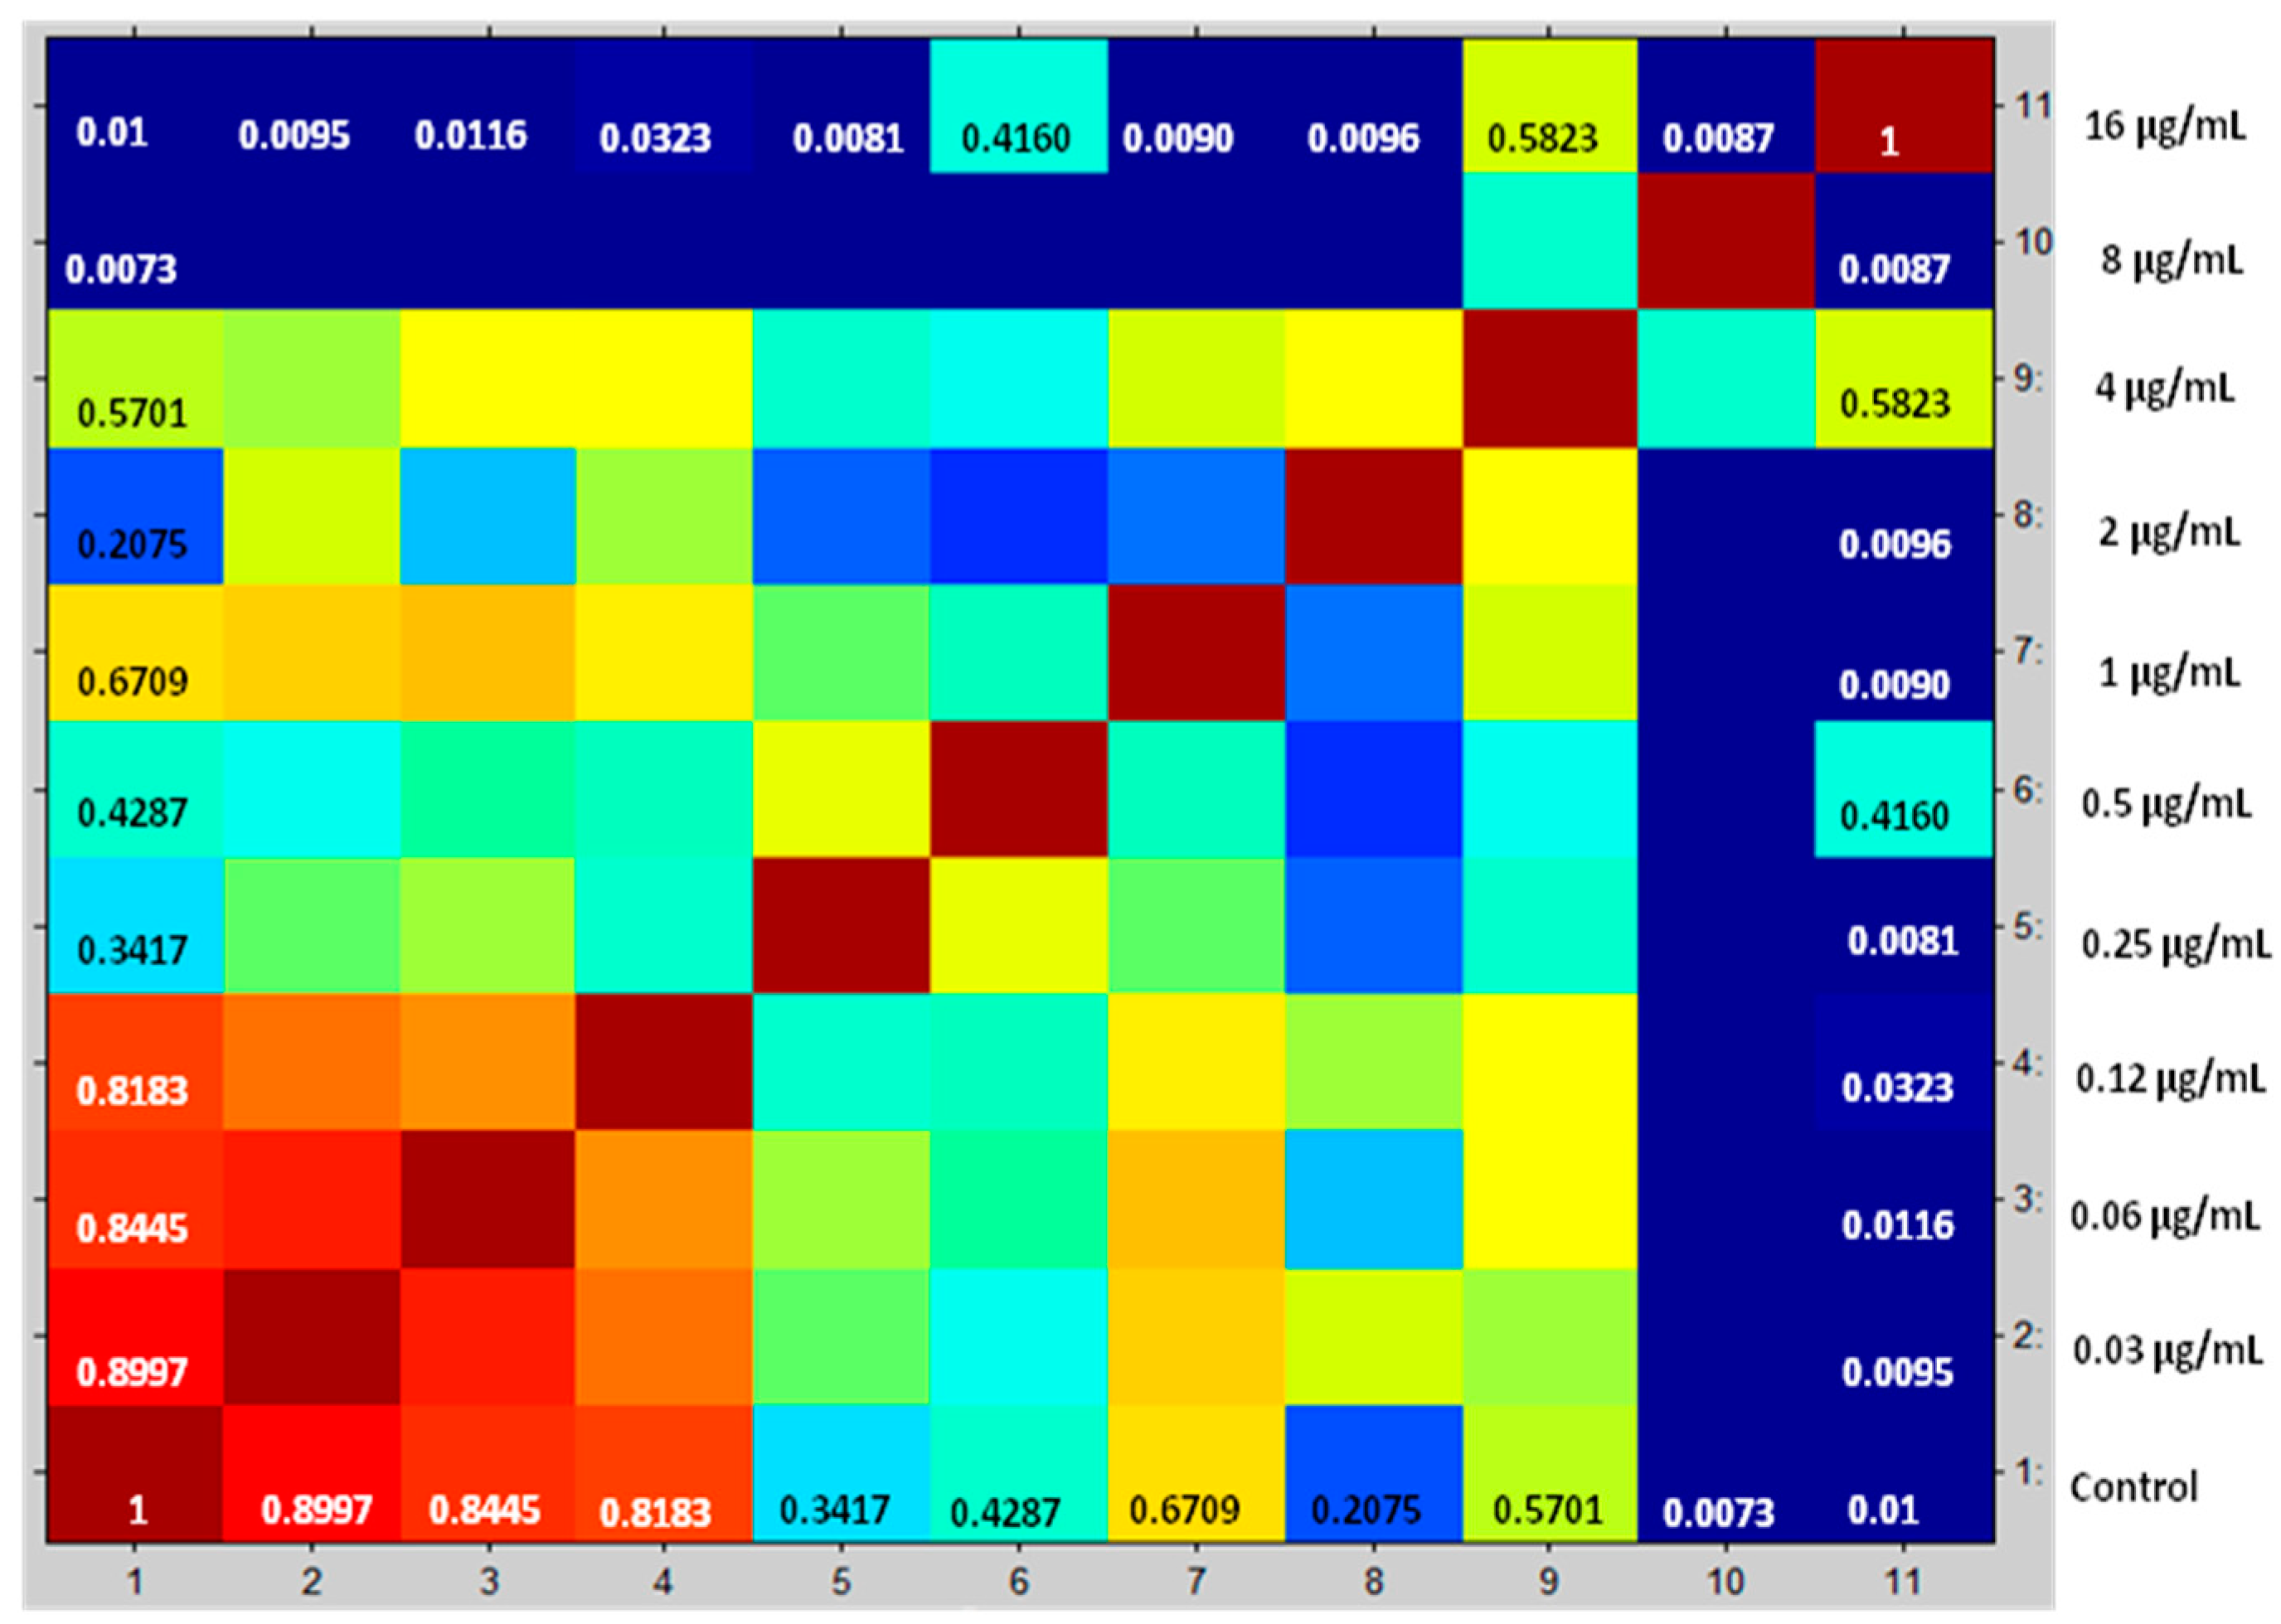
| MPCC (µg/mL) | CCI Null | CCI Maximum |
|---|---|---|
| 0.0000 | 0.0100 | 1.0000 |
| 0.0313 | 0.0095 | 0.8997 |
| 0.0625 | 0.0116 | 0.8445 |
| 0.1250 | 0.0323 | 0.8183 |
| 0.2500 | 0.0081 | 0.3417 |
| 0.5000 | 0.4160 | 0.4287 |
| 1.0000 | 0.0090 | 0.6709 |
| 2.0000 | 0.0096 | 0.2075 |
| 4.0000 | 0.5823 | 0.5701 |
| 8.0000 | 0.0087 | 0.0073 |
| 16.0000 | 1.0000 | 0.0100 |
© 2020 by the authors. Licensee MDPI, Basel, Switzerland. This article is an open access article distributed under the terms and conditions of the Creative Commons Attribution (CC BY) license (http://creativecommons.org/licenses/by/4.0/).
Share and Cite
Roberto, A.E.M.; Xavier, D.E.; Vidal, E.E.; Vidal, C.F.d.L.; Neves, R.P.; Lima-Neto, R.G.d. Rapid Detection of Echinocandins Resistance by MALDI-TOF MS in Candida parapsilosis Complex. Microorganisms 2020, 8, 109. https://0-doi-org.brum.beds.ac.uk/10.3390/microorganisms8010109
Roberto AEM, Xavier DE, Vidal EE, Vidal CFdL, Neves RP, Lima-Neto RGd. Rapid Detection of Echinocandins Resistance by MALDI-TOF MS in Candida parapsilosis Complex. Microorganisms. 2020; 8(1):109. https://0-doi-org.brum.beds.ac.uk/10.3390/microorganisms8010109
Chicago/Turabian StyleRoberto, Ana Emília M., Danilo E. Xavier, Esteban E. Vidal, Cláudia Fernanda de L. Vidal, Rejane P. Neves, and Reginaldo G. de Lima-Neto. 2020. "Rapid Detection of Echinocandins Resistance by MALDI-TOF MS in Candida parapsilosis Complex" Microorganisms 8, no. 1: 109. https://0-doi-org.brum.beds.ac.uk/10.3390/microorganisms8010109