Article

Ultrasonic Modulation of the Technological and Functional Properties of Yeast Strains

by
Barbara Speranza
,
Daniela Campaniello
,
Clelia Altieri
,
Milena Sinigaglia
,
Antonio Bevilacqua
* and
Maria Rosaria Corbo
*
Department of the Science of Agriculture, Food and Environment, University of Foggia, 71122 Foggia, Italy
*
Authors to whom correspondence should be addressed.
Submission received: 20 July 2020 / Revised: 9 September 2020 / Accepted: 10 September 2020 / Published: 11 September 2020
(This article belongs to the Special Issue Microbial Populations of Fermented Foods)

Abstract

:
This research was aimed at studying the effects of low intensity ultrasound (US) on some technological and functional properties of eight strains of Saccharomyces cerevisiae; namely, growth patterns (growth at 2–5% of NaCl or at 37 °C), autoaggregation and tolerance to simulated gastrointestinal conditions were evaluated. A US treatment was applied at 20% of net power (130 W) by a modulating duration (2–10 min) and pulses (2–10 s). The viable count (4.81–6.33 log CFU/mL) was not affected by US, while in terms of technological traits the effect was strain specific; in particular, for some strains a positive effect of US was found with a significant growth enhancement (growth index > 120%). The treatment was also able to increase the autoaggregation of some strains, thus suggesting that US could represent a promising way to treat and select nonconventional functional yeasts for food applications.

1. Introduction

Ultrasound (US) is a “green” technology which uses sonic waves (from 20 kHz to 10 MHz) widely applied in food processing, sonochemistry and medical diagnosis [1,2,3]. In general, high intensity and low frequency USs (intensity from 10 to 1000 W/cm2 and frequency from 20 to 100 kHz) are used in food processing as antimicrobial treatments, whereas low intensity and high frequency USs (intensity < 1 W/cm2; frequency > 100 kHz) are used for nondestructive applications, such as changing the physical and chemical structure of matrices (defoaming, deaeration, filtration, pickling, drying, defrosting, fractionation, accelerated wine aging, and extrusion) [3].
Regarding food applications, most studies performed on US have been initially addressed on the effects on cell destruction—high intensity USs (10–1000 W/cm2) have, in fact, a great effectiveness in terms of disrupting microbial cells, due to the power levels associated, which are high enough to generate cavitation and exert an antimicrobial effect [4].
However, in recent years, low intensity USs (less than 10 W/cm2) have been proposed as an innovative treatment to increase the yield of some biotechnological processes without affecting cell viability [1,5,6], since several studies have demonstrated that this form of US application produces a steady cavitation and provides repairable damages to cells, changing their living state and, consequently, accelerating their proliferation and metabolism [7,8]. For example, in food fermentation, the application of low intensity USs was found to improve the performances of microorganisms and the quality of the final products [9,10,11]. The literature reports some positive effects, such as: (a) the enhancement of the activity of different enzymes [7,12]; (b) a shortening of the fermentation time with a high reproducibility and accuracy of the process [13,14]; (c) the improvement of some technological properties of the end products [15]. Regarding bacteria, some positive effects include an enhanced biofilm formation for an increased transport of oxygen and nutrients to deeper layers of the microbial association [16,17], a lower acidification and postacidification of probiotics inoculated in functional beverages [17,18,19] and an increase in fermentation efficiency [20]. An improved growth of probiotics (e.g., Bifidobacterium sp.), associated to an increase in the lactose hydrolysis and transgalactosylation in milk, was also observed [21,22].
Most data are on US-treated bacteria, but promising positive applications on yeasts are also described in the literature, such as the growth enhancement of Saccharomyces cerevisiae [23], a better kinetics of fermentation both using pentose and hexose [24], a reduction in wine and beer fermentation time by 50%, as well as an increased yield of ethanol production and a reduction in dissolved CO2 [25].
However, these studies highlight a high variability and that the impact of US on yeasts’ performances depends on the type of microorganism, the growth phase (e.g., adaptation, exponential, etc.), the properties of the medium and the parameters of the treatment (intermittent or continuous application of US), thus it is difficult to find a general model.
This research was aimed at studying the effects of low intensity US on some technological and functional properties of eight strains of Saccharomyces cerevisiae; namely, growth patterns (growth at 2–5% of NaCl or at 37 °C), autoaggregation and tolerance to simulated gastrointestinal conditions were evaluated. The US treatment was applied at 20% of net power (130 W) by modulating the duration (2–10 min) and pulses (2–10 s).

2. Materials and Methods

2.1. Strains

Eight strains of S. cerevisiae, labelled with a numerical code (2, 4, 17, 41, 4y, WB, W21, WL43) and isolated from sourdough [26] or from Uva di Troia grapes [27], were used in this research. All strains belong to the Culture Collection of the Laboratory of Predictive Microbiology, University of Foggia; they were maintained at 4 °C on yeast–peptone–glucose-agar slants (YPG agar) (10 g/L yeast extract; 20 g/L bacteriological peptone; 20 g/L glucose; 15 g/L agar) and grown in YPG broth (25 °C for 48 h) before each assay. All media and ingredients were purchased from Oxoid (Basingstoke, UK).

2.2. Ultrasound Treatment (US)
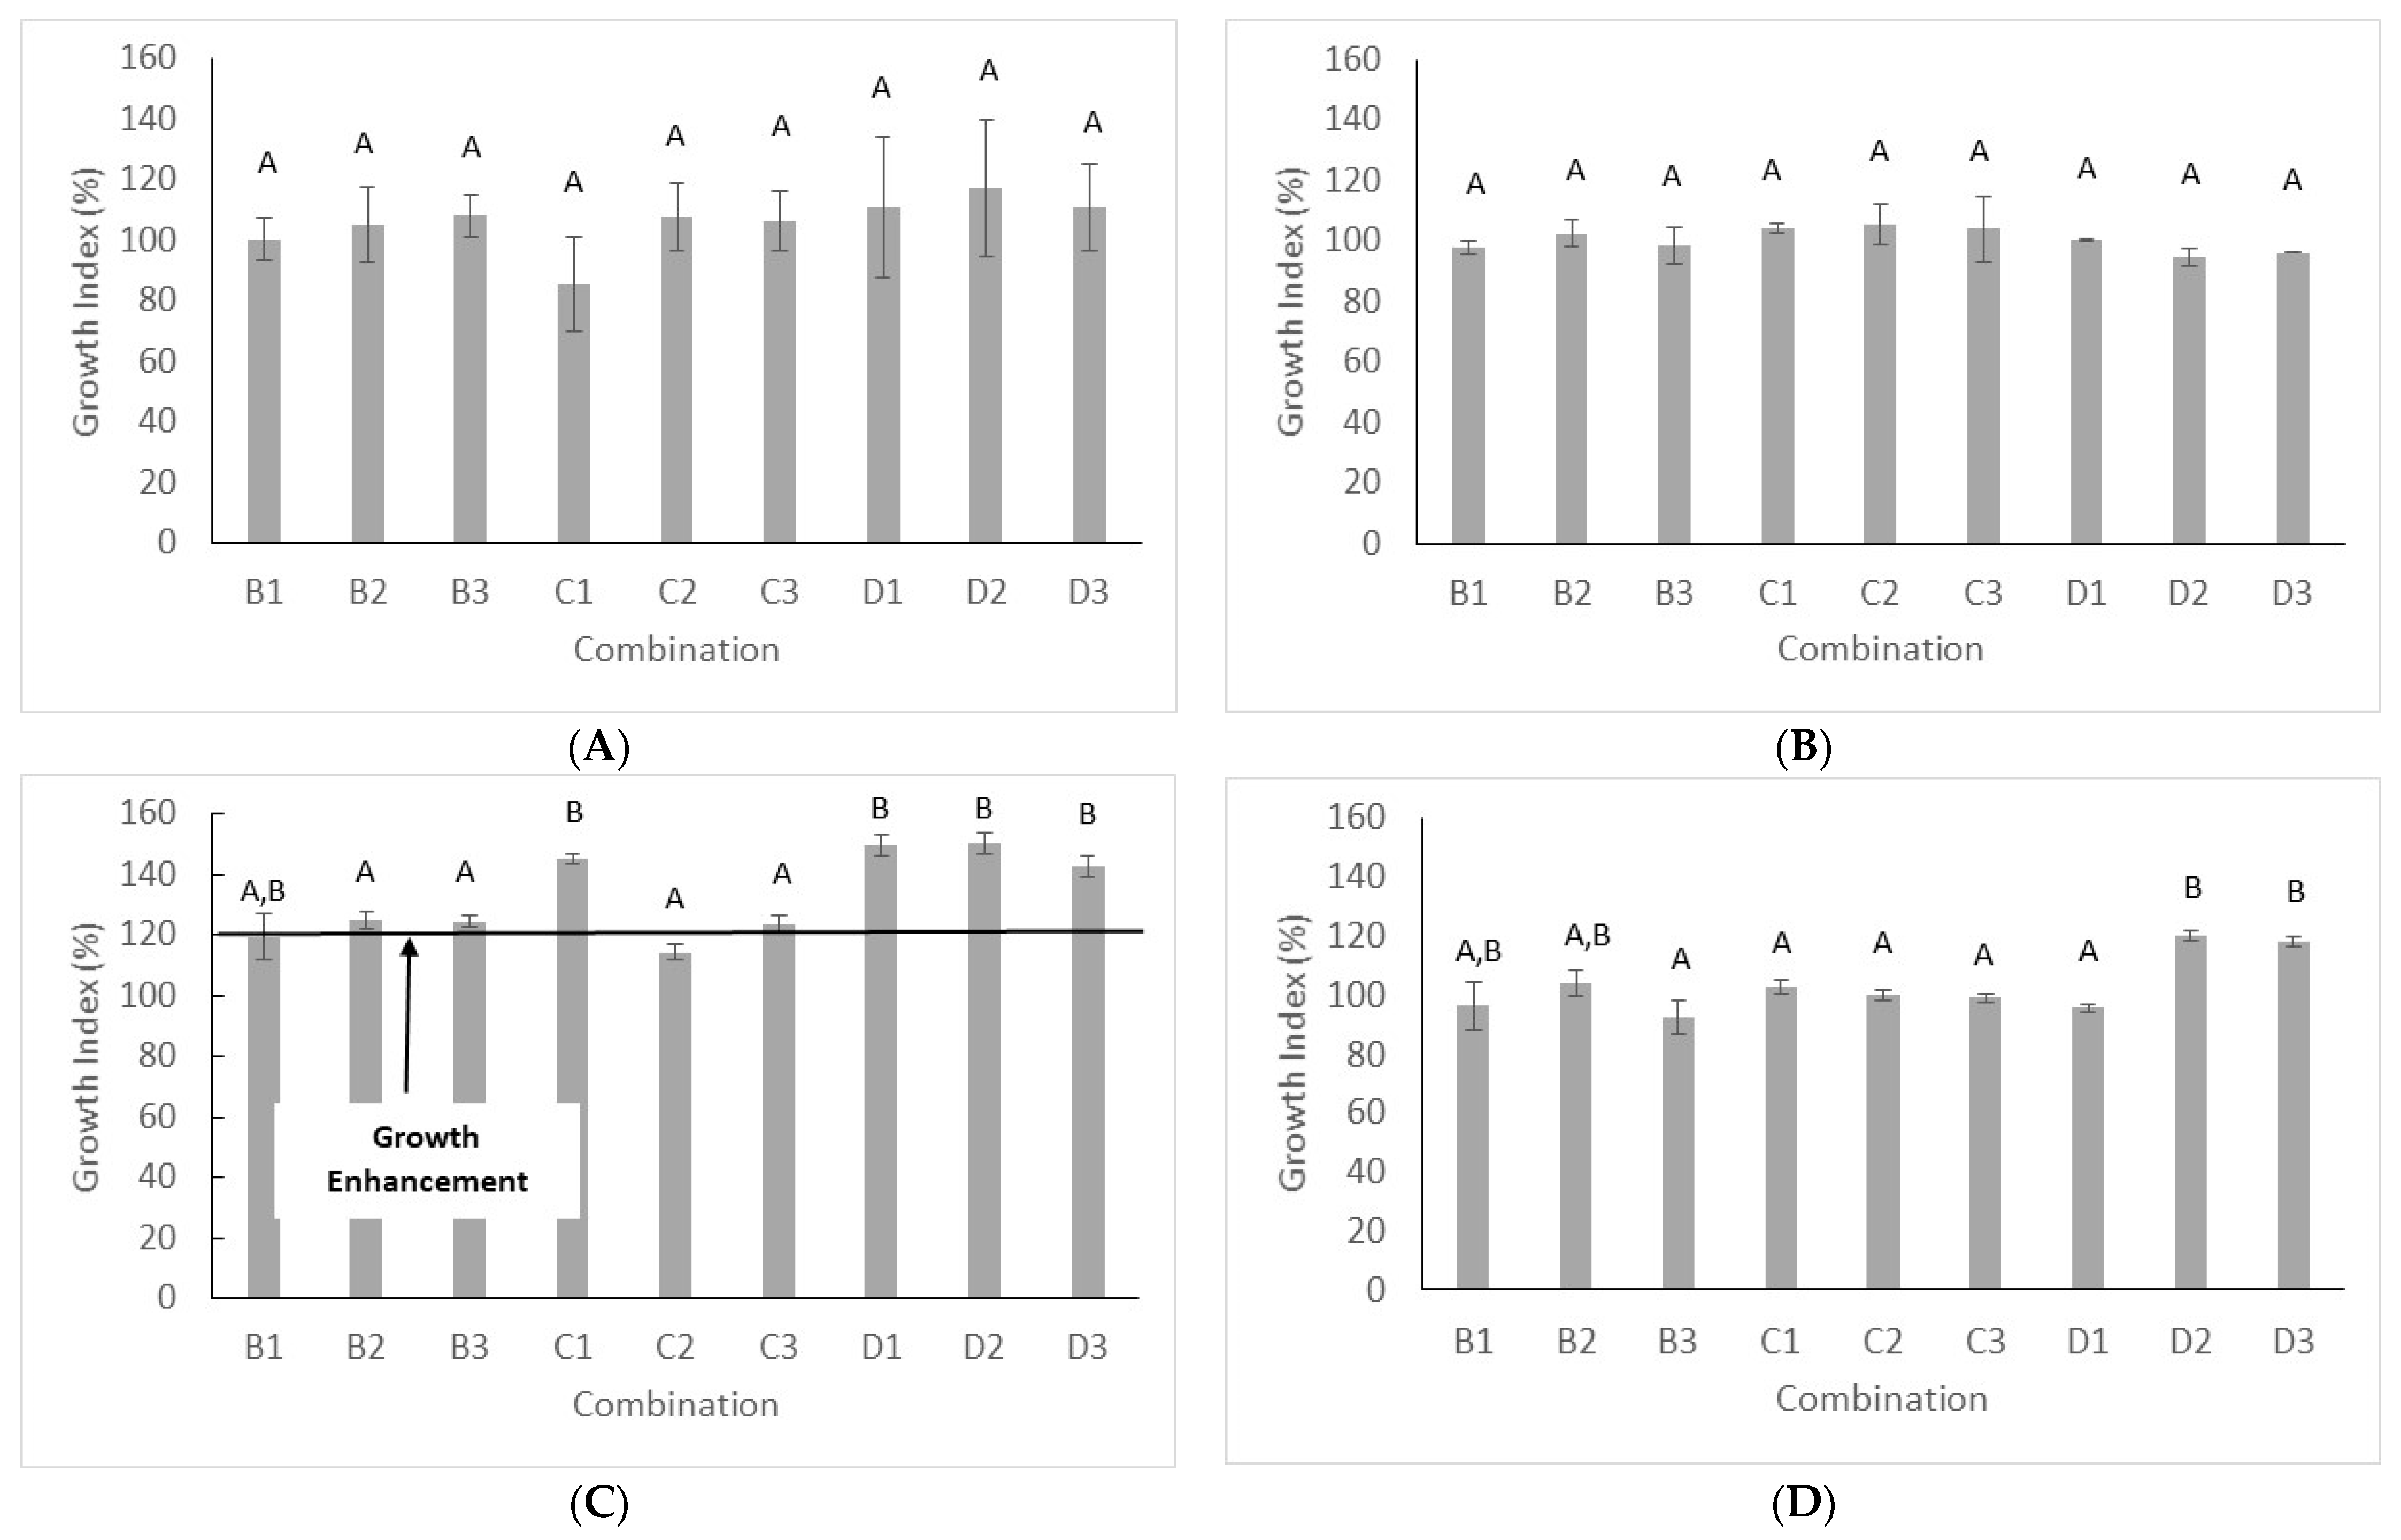
Aliquots of 20 mL saline solution (9% NaCl w/V) were individually inoculated to ca. 5 log CFU/mL with each tested strain and treated by a VC 130 Vibra Cell Ultrasound device (Sonics and Materials Inc., Newtown, CT, USA: net power, 130 W). The combinations used for US processing are in Table 1; in particular, the treatment was applied at 20% of net power by modulating the duration (2–10 min) and the pulses (2–10 s). Before each treatment, the ultrasonic probe (5 × 60 mm; diameter × the active component of horn) was cleaned with ethanol and washed with sterile distilled water. After the treatment, the sample was immediately cooled in ice to avoid a potential thermal effect.
The viable count was measured before and after each treatment on YPG agar (25 °C for 48 h). A sterile saline solution inoculated with each strain but untreated through US was used as the control (A1).

2.3. Growth Assays

US-treated yeasts were inoculated in YPG broth to 3 log CFU/mL; the medium was supplemented with NaCl (2–5%-stress conditions for the strains used in this research) and incubated at 25 °C (yeast optimal temperature) or 37 °C (temperature of human body; probiotic properties for yeasts). Growth was evaluated after 24 and 48 h at an absorbance of 600 nm using a spectrophotometer UV–Vis DU 640 Beckman (Fullerton, CA, USA).
The results were modelled as the growth index [28] modified by Racioppo et al. [19]:
GI = Abss/Absc × 100
where Abss is the absorbance of US-treated strain and Absc is the absorbance of the control (untreated microorganism, combination A1).
GI was analyzed as suggested by Bevilacqua et al. [28] and modified as follows:
  • GI < 25%: complete inhibition;
  • 25% < GI < 75%: partial inhibition;
  • GI > 75%: no inhibition.
A new class was added to point out a positive effect on yeast growth:
  • GI > 120%: growth enhancement.

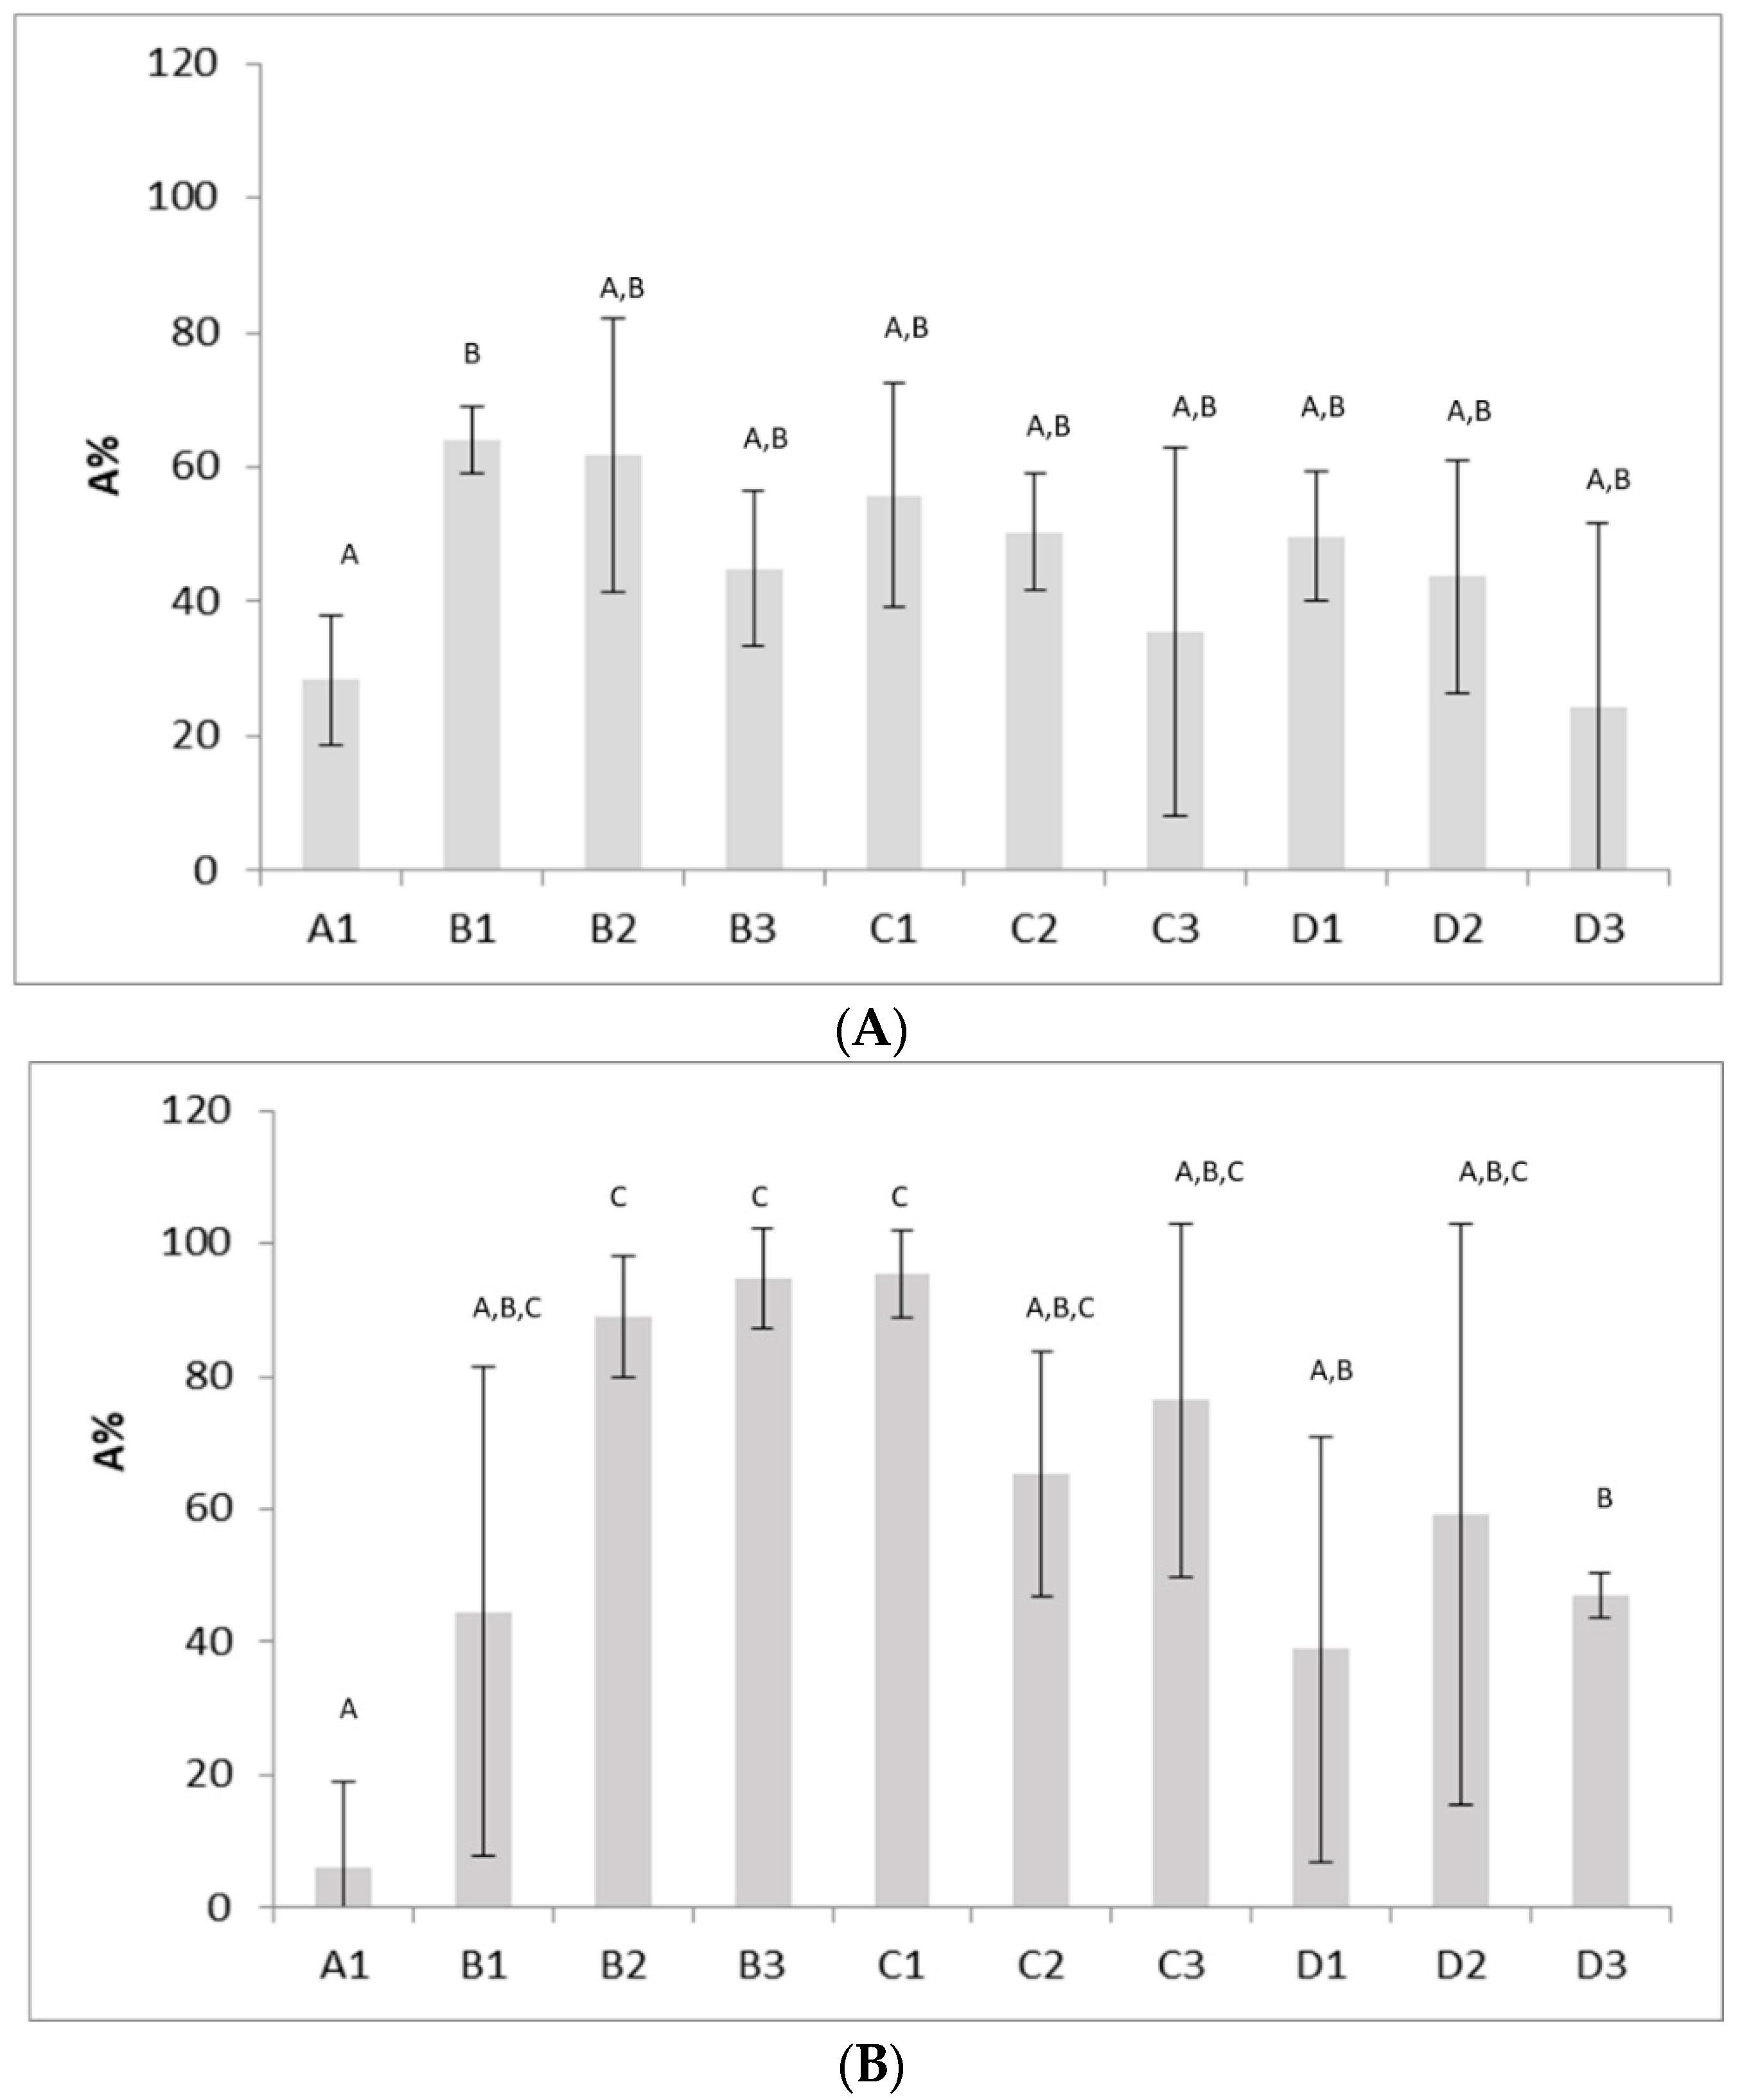
2.4. Autoaggregation Assays

This assay was performed for all strains using a modified method reported by Bautista-Gallego et al. [29]. After growth at 25 °C for 48 h, 20 mL aliquots of yeast cultures were harvested by centrifugation and washed twice with PBS (phosphate saline buffer, 9 g/L NaCl and 0.30 g/L Na2HPO4·2H2O, Sigma-Aldrich, St. Louis, MO, USA). Afterwards, 2 mL of suspension was placed in sterile tubes containing 18 mL of PBS, and each tube was treated by US, according to Table 1. After the treatment, the absorbance at 600 nm of the upper suspension was monitored after 0 (A0) and 2 h at 25 °C (room temperature) (At). The experiments were performed at least in duplicate. The autoaggregation percentage was calculated with the following formula [29]:
A % = 1 ( A t A 0 ) × 100
where At and A0 are the absorbance at the time t (2 h) and the initial value, respectively.

2.5. Simulated Gastrointestinal Conditions

Tolerance to simulated gastrointestinal conditions was evaluated using the method reported by Petruzzi et al. [30]; the assay was performed only on S. cerevisiae 2 and 17, untreated or treated at 20% for 10 min and pulses at 10 s (combination D3). Three different solutions (SS, SGJ and SIF) were freshly prepared as follows:
  • SS, Salivary conditions, i.e., a sterile electrolyte solution (pH 6.5) containing 0.22 g/L CaCl2 (C. Erba, Milan, Italy), 6.5 g/L NaCl (C. Erba), 2.2 g/L KCl (J.T. Baker, Milan, Italy), 1.2 g/L NaHCO3 (Sigma-Aldrich), and 100 mg/L lysozyme (Sigma-Aldrich) [31].
  • SGJ, Simulated Gastric Juice, i.e., a saline solution (0.9% NaCl) containing 3 g/L pepsin (porcine gastric mucosal, Sigma-Aldrich) and buffered to pH 2 [32].
  • SIF, Simulated Intestinal Fluid, i.e., a fluid prepared by mixing 1 g/L of pancreatin (porcine pancreas, Sigma-Aldrich) and 3 g/L of bile extract (bile extract porcine, Sigma-Aldrich) in a solution (pH 8) containing 6.5 g/L NaCl, 0.835 g/L KCl, 0.22 g/L CaCl2, 1386 g/L NaHCO3) [32].
Prior to use, each solution was sterilized by filtering through membranes (0.20 μm pore size; Minisart, Sartorius, Goettingen, Germany). Yeasts were suspended (about 6.5–7 log CFU/mL) into SS, SGJ and SIF and incubated at 37 °C for 5, 120 and 240 min, respectively, on an orbital shaker (200 rpm). The viable count was determined before and after each phase on YPG agar (25 °C for 48 h).
A further assay was also performed through a sequential protocol (SS → SGJ → SIF); after each step, yeast cells were recovered by centrifugation at 13,500× g, 15 min at 25 °C to completely remove the broth and used to inoculate the subsequent solution.

2.6. Statistical Analysis

The experiments were performed at least on two independent samples; for each sample, the analyses were conducted twice. Significant differences were pointed out through a t-test (paired comparison) or one-way ANOVA (Analysis of Variance) and Tukey’s test (multiple comparison). The p-level was set to 0.05. Statistical analysis was conducted through the software Statistica for Windows, v12.0 (Statsoft, Tulsa, OK, USA).

3. Results

Table 2 reports the viable count (log CFU/mL) of US-treated S. cerevisiae strains, compared to the control (A1, untreated yeast): US treatment did not reduce yeasts cell count, which comprised between 5 ± 0.30 log CFU/mL (strain 4) and 5.73 ± 0.31 log CFU/mL (strain WB) in the control, against values of 5.16 ± 0.29 log CFU/mL (strain 4) and 5.73 ± 0.28 log CFU/mL (strain 41) recovered after the most drastic treatment (D3, 20% of the net power, 10 min, pulses at 10 s). Moreover, no significant differences were found among US treatments (p > 0.05).
After a US application, even if a microorganism does not lose its viability, its growth could be compromised resulting in it being delayed, inhibited or even enhanced; thus, to evaluate how US-treated yeasts were able to grow under different conditions, their profiles were studied during growth at 25 and 37 °C and in presence of NaCl (2–5%). The approach of the Growth Index (GI) was used, as suggested by Bevilacqua et al. [28] and Racioppo et al. [19]. In general, a GI > 75% suggests that a treatment does not affect the growth kinetic, a GI < 25% or in the range 25–75% highlights a strong or a partial inhibition, respectively, and GI > 120% indicates a growth enhancement.
Growth was evaluated either after 24 and 48 h; generally, yeast growth after 24 h was stunted, thus GI evaluation could lead to artefacts. However, some strains experienced a significant growth (OD at least 0.6–0.8), therefore, for these microorganisms, GI was evaluated (strains 17, 41, 4y and WB). Figure 1A,B show the GI of the strains 17 and 41; GI was in the range 100–120% (growth similar to the untreated sample, combination A1) and comparable results were found for the strains 4y and WB. However, for these last strains, the GI in presence of salt revealed a positive effect of US, with a GI > 120% (growth enhancement). This effect was found in the combination B1, D1, D2, and D3 (Figure 1C) for the strains 4y and D2, and D3 for the strain WB (Figure 1D).
Table 3 shows yeasts’ GI after 48 h; generally, US treatment did not exert a negative effect on yeast growth at 25, 37 °C or in presence of 2% salt, because GI was >75%. However, some strains experienced a GI > 120% in some combinations and for some assays, that is:
(a)
Strain 17 in the combinations B2, B3 and C1 at 37 °C, with a GI ranging from 132.19 to 159.59%
(b)
Strain 41 at 37 °C in the combinations C1 (GI, 233%) and C2 (GI, 185.71%).
Once the effects of US on technological properties was studied, a second step focusing on two main functional yeast characters, i.e., autoaggregation and survival during gastrointestinal transit, was performed.
As known, autoaggregation is an indirect tool to assess the ability of microorganisms to adhere to gut mucosa [33,34,35,36]. Figure 2 shows the effects of US on autoaggregation for S. cerevisiae 2 (A) and S. cerevisiae 17 (B) which were the yeasts showing the most interesting results. In general, US treatments did not affect this property for most yeasts, recovering autoaggregation values of 30–40%. However, for S. cerevisiae 2 and S. cerevisiae 17, the capacity to form aggregates was improved by US application—S. cerevisiae 2 experienced an increase in autoaggregation from 30 (combination A1) to 63% (combination B1), while for strain 17, autoaggregation values were 94.69 (±7.51%) and 95.32% (±6.62%), respectively, against an autoaggregation of 5.95% (±13%) measured for the untreated yeast (A1) (Figure 2B). The autoaggregation of other strains was not affected.
In the last step, the tolerance of US-treated yeast strains to simulated gastrointestinal conditions was evaluated by first testing each phase separately (salivary condition, gastric condition, intestinal condition), and then, in a sequential protocol; only the effect of the most drastic treatment (combination D3) was evaluated.
The test strain S. cerevisiae 17 was used because of the positive effect exerted by US on both growth patterns and autoaggregation, and so S. cerevisiae strain 2 was used as a control because in the past it was characterized as a potential probiotic strain able to survive the transit into the gut [26,37]. US did not affect viability both in the phases studied alone and in the sequential experiment (p > 0.05) and this result is of concern, because it suggests that a preliminary treatment with US does not exert a negative effect of yeast viability even if they experience a harsh environment such as the gastrointestinal tract (Table 4).

4. Discussion

To date, most studies have shown the possibility to use low intensity US for positive applications such as the inactivation/enhancement of some enzymes, extraction of bioactive compounds from different sources, modulation of microbial metabolism, enhancement of biofilm formation, and other useful food applications such as changing the physical and chemical structure of matrices [3,38,39]. Nevertheless, although the application of low intensity US is gaining more and more consensus in food processing, conflicting results were often recovered and finding a unifying behavior or conclusion about the effects of US on yeasts appears almost impossible. For example, when applied on S. cerevisiae cells, US was found to promote a growth acceleration by Lanchun and coworkers [23], but also a growth reduction. Some studies showed positive effects [40,41]; a 4-fold increase in ethanol productivity was found when US (35 kHz, 1.48 W/cm2) was applied on S. cerevisiae MTCC 170 [40], but negative effects on yeast performances have been recovered by Huezo et al. [42], using either direct US (at different intensities ranging from 23 to 32 W/L) or indirect US (1.4 W/L intensity). Besides the contradictory results, some aspects have been never explored, such as the ultrasonic effects on the technological and functional properties of potential functional yeasts; in fact, an open question remains on the possibility to use US as a promising way to improve yeast growth in suboptimal conditions (more salt or higher temperature) and to increase their functional properties such as autoaggregation and tolerance to simulated gastrointestinal conditions. In this research, a US treatment was applied at 20% of net power (130 W) by a modulating duration (2–10 min) and pulses (2–10 s) on eight strains of S. cerevisiae, isolated from sourdough [26] and from Uva di Troia grapes [27] for their functional traits. In particular, four S. cerevisiae strains (2, 4, 17 and 41) were selected as they showed an advantageous survival during transit into the gut, had high resistance to pH and salt, as well as a good ability to grow in a wide range of temperatures; moreover, they showed very interesting probiotic traits in terms of biofilm formation, hydrophobicity and survival at pH 2.5 and with bile salts added [26], while S. cerevisiae 4y, WB, W21, WL43 were selected as promising functional strains due to their ability to remove ochratoxin A (OTA) in the gut (unpublished results).
When a US treatment is applied, especially on potentially probiotic strains, the first aspect to be evaluated is the effect on viability. The results obtained showed that the treatments tested in this research never reduced yeast viability, even after the most drastic treatment.
However, after a US treatment, a microorganism, even if viable, could be damaged and thus present a delay or an inhibition in its growth. To evaluate how US-treated yeasts grow under nonoptimal conditions, the Growth Index (GI) approach [19,28] was used: both at 37 °C and in presence of 2% salt, US treatment did not affect growth. On the other hand, for four strains (S. cerevisiae 4, 17, 41 and WB) a significant growth enhancement was found, due probably to a potential improved membrane permeability. In fact, numerous evidence on bacteria indicate that low intensity US can stimulate growth and metabolic changes for a facilitated transportation of molecules across the cell membrane and an accelerated exchange of substances [43,44,45,46]. Wu et al. [47] demonstrated that an ultrasonic application on yeasts first caused the breakdown of the cell wall, then the cell membrane was weakened by thinning, causing the release of polysaccharides from the cell wall and intracellular proteins from the membrane. These effects are due to cavitation and to the formation of micromechanical shock waves which, associated with changes in temperature (up to 5 °C) and pressure (1 atm), are able to alter the membrane structure and its functional components [48,49,50]. In 2017, the mechanism of sonoporation (i.e., the formation of transient cavities or pores on cell membranes from cavitation) has been suggested by Ojha and coworkers [11] who explained the effect of US on cells as the result of at least six different mechanisms (cavitation, push, pull, jetting, streaming and translation) which can act alone or together [3].
Growth enhancement of US on yeasts was found in the past by several authors for other purposes. Dai et al. [8] found that a low intensity treatment could improve biomass production by S. cerevisiae (yield increased by 127%) and ethanol production. They attributed these effects to at least two phenomena: the decrease in CO2 content in the liquid media with a positive effect on yeast metabolism and the increase in cell permeability, as evidenced by an increased ratio of proteins and polysaccharides in the broth. However, some factors, such as yeast size, floccules, surface charges and to some extent composition, could change as a function of species and strains and this could be related to the different effect of US on the strains used in this research, although they belonged to the same species.
The second step of this study was on the effects of US on two main functional yeast characters, i.e., autoaggregation and survival to gastrointestinal transit. In general, US treatments did not affect autoaggregation for most yeasts, but for S. cerevisiae 2 and S. cerevisiae 17, this capacity was increased by a US application.
The increase in autoaggregation as a consequence of US is a desirable property, because aggregates can increase the microbial adherence to the intestine, thus providing advantages in the colonization of the GI tract [51], as well as the ability to survive in harsh environments [52]. This result was already observed by Bevilacqua et al. [17] and Racioppo et al. [19] for the application of US on bacteria and it is a very promising effect, since a higher autoaggregation is related to an increased adhesion in the gut (adhesion to mucus) [34], although this effect should be confirmed by other assays, such as biofilm formation and adhesion to intestinal model cell lines.
The positive effect of US on autoaggregation could be the result of a clumping effect reported in the past at least on bacteria. Tabatabaie and Mortazavi [53] studied the effect of sonic waves on Lactobacillus acidophilus, Lacticaseibacillus casei and Lactococcus lactis subsp. cremoris, and found that US induced an increase in the ability to autoaggregate in lactobacilli, and form “streptobacillus”-like clumps with an enhanced adhesion.
Autoaggregation, or flocculation, depends on several factors, such as cell surface properties, the presence of Ca2+ or mannose in the medium [54], culture replicative age [55]. It is mediated by cell-surface molecules; thus, it is strongly affected by the different cell wall composition of each strain and the presence of appendages protruding from the wall [54]. This may explain the differences found on the effect of US of autoaggregation of different strains.
Finally, US did not affect yeasts’ tolerance to simulated gastrointestinal conditions; this is another crucial aspect for probiotic yeasts, since a probiotic strain should remain viable after facing the digestive tract conditions and reach the colon where it should proliferate, exerting its beneficial probiotic effects [56,57,58].
In conclusion, US could represent a promising way to improve some technological and functional properties of S. cerevisiae strains. In fact, a low intensity US treatment was able to enhance the growth of S. cerevisiae at 37 °C (strains 4y and WB) and in the presence of 2% salt (strains 17 and 41). The treatment could modulate the metabolism of yeasts: in fact, an increase in the autoaggregation capacity was recovered for S. cerevisiae 2 and 17. However, since a strain-dependence was found, further investigations are required to understand the mechanisms behind the recovered ultrasonic modulation of yeast properties.

Author Contributions

Conceptualization, A.B., M.R.C., C.A. and M.S.; methodology, A.B., C.A. and B.S.; investigation, B.S., D.C., and A.B.; data curation, A.B.; writing—original draft preparation, B.S. and A.B.; writing—review and editing, all authors; funding acquisition, M.S. and M.R.C. All authors have read and agreed to the published version of the manuscript.

Funding

This research received no external funding.

Conflicts of Interest

The authors declare no conflict of interest.

References

  1. Chisti, Y. Sonobioreactors: Using ultrasound for enhanced microbial productivity. Trends Biotechnol. 2003, 21, 89–93. [Google Scholar] [CrossRef]
  2. Zhao, Y.; Ang, W.T.; Xing, J.; Zhang, J.; Chen, J. Applications of ultrasound to enhance mycophenolic acid production. Ultrasound Med. Biol. 2012, 38, 1582–1588. [Google Scholar] [CrossRef] [PubMed]
  3. Bevilacqua, A.; Campaniello, D.; Speranza, B.; Altieri, C.; Sinigaglia, M.; Corbo, M.R. Two Nonthermal Technologies for Food Safety and Quality—Ultrasound and High Pressure Homogenization: Effects on Microorganisms, Advances, and Possibilities: A Review. J. Food Prot. 2019, 82, 2049–2064. [Google Scholar] [CrossRef] [PubMed] [Green Version]
  4. Liu, J.; Li, L.; Zhou, L.; Li, B.; Xu, Z. Effect of ultrasound treatment conditions on Saccharomyces cerevisiae by response surface methodology. Microb. Pathog. 2017, 111, 497–502. [Google Scholar] [CrossRef]
  5. Gogate, P.R.; Kabadi, A.M. A review of applications of cavitation in biochemical engineering/biotechnology. Biochem. Eng. J. 2009, 44, 60–72. [Google Scholar] [CrossRef]
  6. Pagnossa, J.P.; Rocchetti, G.; Ribeiro, A.C.; Piccoli, R.H.; Lucini, L. Ultrasound: Beneficial biotechnological aspects on microorganisms-mediated processes. Curr. Opin. Food Sci. 2020, 31, 24–30. [Google Scholar] [CrossRef]
  7. Huang, G.; Chen, S.; Dai, C.; Sun, L.; Sun, W.; Tang, Y.; Xiong, F.; He, R.; Ma, H. Effects of ultrasound on microbial growth and enzyme activity. Ultrason. Sonochem. 2017, 37, 144–149. [Google Scholar] [CrossRef]
  8. Dai, C.; Xiong, F.; He, R.; Zhang, W.; Ma, H. Effects of low intensity ultrasound on the growth, cell membrane permeability and ethanol tolerance of Saccharomyces cerevisiae. Ultrason. Sonochem. 2017, 36, 191–197. [Google Scholar] [CrossRef]
  9. Awad, T.S.; Moharram, H.A.; Shaltout, O.E.; Asker, D.; Youssef, M.M. Applications of ultrasound in analysis, processing and quality control of food: A review. Food Res. Int. 2012, 48, 410–427. [Google Scholar] [CrossRef]
  10. Kwiatkowska, B.; Bennett, B.J.; Akunna, J.; Walker, G.M.; Bremner, D.H. Stimulation of bioprocesses by ultrasound. Biotechnol. Adv. 2011, 29, 768–780. [Google Scholar] [CrossRef] [Green Version]
  11. Ojha, K.S.; Mason, T.J.; O’Donnell, C.P.; Kerry, J.P.; Tiwari, B.K. Ultrasound technology for food fermentation applications. Ultrason. Sonochem. 2017, 34, 410–417. [Google Scholar] [CrossRef] [PubMed]
  12. Ma, H.; Huang, L.; Jia, J.; He, R.; Luo, L.; Zhu, W. Effect of energy-gathered ultrasound on Alcalase. Ultrason. Sonochem. 2011, 18, 419–424. [Google Scholar] [CrossRef] [PubMed]
  13. Wu, F.; Chao, L.; Li, H.; Zhao, L.; Xu, Y.; Long, Y.; Chen, Q.; Zhang, Z. Research progress of applications of ultrasonic technology in food industry. J. Food Saf. Qual. 2017, 8, 2670–2677. [Google Scholar]
  14. Polonorum, A.S.; Stadnik, J.; Stasiak, D. Applications of ultrasound in food technology. Acta Sci. Pol. Technol. Aliment. 2007, 6, 89–99. [Google Scholar]
  15. Vercet, A.; Oria, R.; Marquina, P.; Crelier, S.; Lopez-Buesa, P. Rheological properties of yoghurt made with milk submitted to manothermosonication. J. Agric. Food Chem. 2002, 50, 6165–6171. [Google Scholar] [CrossRef]
  16. Erriu, M.; Blus, C.; Szmukler-Moncler, S.; Buogo, S.; Levi, R.; Barbato, G.; Madonnaripa, D.; Denotti, G.; Piras, V.; Orrù, G. Microbial biofilm modulation by ultrasound: Current concepts and Controversies. Ultrason. Sonochem. 2014, 21, 15–22. [Google Scholar] [CrossRef]
  17. Bevilacqua, A.; Racioppo, A.; Sinigaglia, M.; Speranza, B.; Campaniello, D.; Corbo, M.R. A low-power ultrasound attenuation improves the stability of biofilm and hydrophobicity of Propionibacterium freudenreichii subsp. freudenreichii DSM 20271 and Acidipropionibacterium jensenii DSM 20535. Food Microbiol. 2019, 78, 104–109. [Google Scholar] [CrossRef]
  18. Bevilacqua, A.; Speranza, B.; Iorio, M.C.; Loi, M.; Sinigaglia, M.; Corbo, M.R. US-inactivation of foodborne bacteria: Screening in distilled water and combination with citrus extract in skim milk. LWT Food Sci. Technol. 2016, 70, 135–141. [Google Scholar] [CrossRef]
  19. Racioppo, A.; Corbo, M.R.; Piccoli, C.; Sinigaglia, M.; Speranza, B.; Bevilacqua, A. Ultrasound attenuation of lactobacilli and bifidobacteria: Effect on some technological and probiotic properties. Int. J. Food Microbiol. 2017, 243, 78–83. [Google Scholar] [CrossRef]
  20. Dahroud, B.D.; Mokarram, R.R.; Khiabani, M.S.; Hamishehkar, H.; Bialvaei, A.Z.; Yousefi, M.; Kafil, H.S. Low intensity ultrasound increases the fermentation efficiency of Lactobacillus casei subsp. casei ATTC 39392. Int. J. Biol. Macromol. 2016, 86, 462–467. [Google Scholar] [CrossRef]
  21. Nguyen, T.M.P.; Lee, Y.K.; Zhou, W. Stimulating fermentative activities of bifidobacteria in milk by high intensity ultrasound. Int. Dairy J. 2009, 19, 410–416. [Google Scholar] [CrossRef]
  22. Yeo, S.K.; Liong, M.T. Effect of ultrasound on the growth of probiotics and bioconversion of isoflavones in prebiotic-supplemented soymilk. J. Agric. Food Chem. 2011, 59, 885–897. [Google Scholar] [CrossRef] [PubMed]
  23. Lanchun, S.; Bochu, W.; Zhiming, L.; Chuanren, D.; Dai, C.; Sakanishi, A. The research into the influence of low-intensity ultrasonic on the growth of S. cerevisiae. Colloids Surf. B Biointerfaces 2003, 30, 43–49. [Google Scholar] [CrossRef]
  24. Borah, A.J.; Agarwal, M.; Goyal, A.; Moholkar, V.S. Physical insights of ultrasound-assisted ethanol production from composite feedstock of invasive weeds. Ultrason. Sonochem. 2019, 51, 378–385. [Google Scholar] [CrossRef]
  25. Al Daccache, M.; Kouba, M.; Salameh, D.; Maroun, R.G.; Louka, N.; Vorobieva, E. Ultrasound-assisted fermentation for cider production from Lebanese apples. Ultrason. Sonochem. 2020, 63, 104952. [Google Scholar] [CrossRef]
  26. Perricone, M.; Bevilacqua, A.; Corbo, M.R.; Sinigaglia, M. Technological characterization and probiotic traits of yeasts isolated from Altamura sourdough to select promising microorganisms as functional starter cultures for cereal-based products. Food Microbiol. 2014, 38, 26–35. [Google Scholar] [CrossRef]
  27. Petruzzi, L.; Bevilacqua, A.; Baiano, A.; Beneduce, L.; Corbo, M.R.; Sinigaglia, M. Study of Saccharomyces cerevisiae W13 as a functional starter for the removal of ochratoxin A. Food Control 2014, 35, 373–377. [Google Scholar] [CrossRef]
  28. Bevilacqua, A.; Perricone, M.; Cannarsi, M.; Corbo, M.R.; Sinigaglia, M. Technological and spoiling characteristics of the yeast microflora isolated from Bella di Cerignola table olives. Int. J. Food Sci. Technol. 2009, 44, 2198–2207. [Google Scholar] [CrossRef]
  29. Bautista-Gallego, J.; Arroyo-López, F.N.; Rantsiou, K.; Jiménez-Díaz, R.; Garrido- Fernández, A.; Cocolin, L. Screening of lactic acid bacteria isolated from fermented table olives with probiotic potential. Food Res. Int. 2013, 50, 135–142. [Google Scholar] [CrossRef]
  30. Petruzzi, L.; Corbo, M.R.; Sinigaglia, M.; Bevilacqua, A. Ochratoxin A Removal by Yeasts after Exposure to Simulated Human Gastrointestinal Conditions. J. Food Sci. 2016, 81, M2756–M2760. [Google Scholar] [CrossRef]
  31. Russo, P.; de Palencia, P.F.; Romano, A.; Fernandez, M.; Lucas, P.; Spano, G.; Lopez, P. Biogenic amine production by the wine Lactobacillus brevis IOEB 9809 in systems that partially mimic the gastrointestinal tract stress. BMC Microbiol. 2012, 12, 247. [Google Scholar] [CrossRef] [PubMed] [Green Version]
  32. Priya, A.J.; Vijayalakshmi, S.P.; Raichur, A.M. Enhanced survival of probiotic Lactobacillus acidophilus by encapsulation with nanostructured polyelectrolyte layers through layer-by-layer approach. J. Agric. Food Chem. 2011, 59, 11838–11845. [Google Scholar] [CrossRef] [PubMed]
  33. de Wouters, T.; Jans, C.; Niederberger, T.; Fischer, P.; Rühs, P.A. Adhesion potential of intestinal microbes predicted by physico-chemical characterization methods. PLoS ONE 2015, 10, e0136437. [Google Scholar] [CrossRef] [PubMed]
  34. Haddaji, N.; Mahdhi, A.K.; Krifi, B.; Ben Ismail, M.; Bakhrouf, A. Change in cell surface properties of Lactobacillus casei under heat shock treatment. FEMS Microbiol. Lett. 2015, 362, fnv047. [Google Scholar] [CrossRef] [PubMed] [Green Version]
  35. Del Re, B.; Sgorbati, B.; Miglioli, M.; Palenzona, D. Adhesion, autoaggregation and hydrophobicity of 13 strains of Bifidobacterium longum. Lett. Appl. Microbiol. 2000, 31, 438–442. [Google Scholar] [CrossRef] [PubMed]
  36. Kotzamandis, C.; Kourelis, A.; Litopoilou-Tzanetaki, E.; Tzanetakis, N.; Yiangou, M. Evaluation of adhesion capacity, cell surface traits and immunomodulatory activity of presumptive probiotic Lactobacillus strains. Int. J. Food Microbiol. 2010, 140, 154–163. [Google Scholar] [CrossRef]
  37. Bevilacqua, A.; Campaniello, D.; Speranza, B.; Racioppo, A.; Altieri, C.; Sinigaglia, M.; Corbo, M.R. Microencapsulation of Saccharomyces cerevisae into alginate beads: A focus of functional properties of released cells. Foods 2020, 9, 1051. [Google Scholar] [CrossRef]
  38. Ashokkumar, M. Applications of ultrasound in food and bioprocessing. Ultrason. Sonochem. 2015, 25, 17–23. [Google Scholar] [CrossRef]
  39. Majid, I.; Nayik, G.A.; Nanda, V. Ultrasonication and food technology: A review. Cogent Food Agric. 2015, 1, 1071022. [Google Scholar] [CrossRef]
  40. Jomdecha, C.; Prateepasen, A. Effects of pulse ultrasonic irradiation on the lag phase of Saccharomyces cerevisiae growth. Lett. Appl. Microbiol. 2011, 52, 62–69. [Google Scholar] [CrossRef]
  41. Singh, S.; Agarwal, M.; Sarma, S.; Goyal, A.; Moholkar, V.S. Mechanistic insight into ultrasound induced enhancement of simultaneous saccharification and fermentation of Parthenium hysterophorus for ethanol production. Ultrason. Sonochem. 2015, 26, 249–256. [Google Scholar] [CrossRef] [PubMed]
  42. Huezo, L.; Shah, A.; Michel, F.C., Jr. Effects of ultrasound on fermentation of glucose to ethanol by Saccharomyces cerevisiae. Fermentation 2019, 5, 16. [Google Scholar] [CrossRef] [Green Version]
  43. Chuanyun, W.; Bochu, D.; Chuanren, A. Low ultrasonic stimulates fermentation of riboflavin producing strain Ecemothecium ashbyii. Colloids Surf. B Biointerfaces 2003, 30, 37–41. [Google Scholar] [CrossRef]
  44. Karshafian, R.; Samac, S.; Bevan, P.D.; Burns, P.N. Microbubble mediated sonoporation of cells in suspension: Clonogenic viability and influence of molecular size on uptake. Ultrasonics 2010, 50, 691–697. [Google Scholar] [CrossRef] [PubMed]
  45. Herrán, N.S.; Casas, J.L.; López, J.A.; Sánchez Pérez, M.M.; Ballesteros Martín, B.; Chisti, Y. Ultrasound affects fungal morphology and broth rheology of Aspergillus terreus. J. Biotechnol. 2008, 136, S489–S490. [Google Scholar] [CrossRef]
  46. Mota, M.J.; Lopes, R.P.; Koubaa, M.; Shahin Roohinejad, S.; Barba, F.J.; Delgadillo, I.; Saraiva, J.A. Fermentation at non-conventional conditions in food- and bio-sciences by the application of advanced processing technologies. Crit. Rev. Biotechnol. 2017, 38, 122–140. [Google Scholar] [CrossRef]
  47. Wu, T.; Yu, X.; Hu, A.; Zhang, L.; Jin, Y.; Abid, M. Ultrasonic disruption of yeast cells: Underlying mechanism and effects of processing parameters. Innov. Food Sci. Emerg. Technol. 2015, 28, 59–65. [Google Scholar]
  48. Sango, D.M.; Abela, D.; McElhatton, A.; Valdramidis, V.P. Assisted ultrasound applications for the production of safe foods. J. Appl. Microbiol. 2014, 116, 1067–1083. [Google Scholar] [CrossRef]
  49. Ye, S.Y.; Qiu, Y.X.; Song, X.L.; Luo, S.C. Optimization of process parameters for the inactivation of Lactobacillus sporogenes in tomato paste with ultrasound 60 Cogamma irradiation using response surface methodology. Radiat. Phys. Chem. 2009, 78, 227–233. [Google Scholar] [CrossRef]
  50. Niemczewski, B. Maximisation of cavitation intensity in ultrasonic cleaning in aqueous solutions through selection of salt solution. Trans. Inst. Met. Finish. 2011, 89, 104–108. [Google Scholar] [CrossRef]
  51. García-Cayuela, T.; Korany, A.M.; Bustos, I.; Gómez de Cadiñanos, L.P.; Requena, T.; Peláez, P.; Martínez-Cuesta, M.C. Adhesion abilities of dairy Lactobacillus plantarum strains showing an aggregation phenotype. Food Res. Int. 2014, 57, 44–50. [Google Scholar] [CrossRef]
  52. Brückner, S.; Mösch, H.U. Choosing the right lifestyle: Adhesion and development in Saccharomyces cerevisiae. FEMS Microbiol. Rev. 2012, 36, 25–58. [Google Scholar] [CrossRef] [PubMed] [Green Version]
  53. Tabatabaie, F.; Mortazavi, A. Studying the effects of ultrasound shock on cell wall permeability and survival of some LAB in milk. World Appl. Sci. J. 2008, 3, 119–121. [Google Scholar]
  54. Touhami, A.; Hoffmann, B.; Vasella, A.; Denis, F.A.; Dufrene, Y.F. Aggregation of yeast cells: Direct measurement of discrete lectin-carbohydrate interactions. Microbiology 2003, 149, 2873–2878. [Google Scholar] [CrossRef] [Green Version]
  55. Powell, C.D.; Quain, D.E.; Smart, K.A. The impact of brewing yeast cell age on fermentation performance, attenuation and flocculation. FEMS Yeast Res. 2003, 3, 149–157. [Google Scholar] [CrossRef] [Green Version]
  56. Zamora-Vega, R.; Montanez-Soto, J.L.; Martınez-Flores, H.E.; Flores-Magallon, R.; Munoz-Ruiz, C.V.; Venegas-Gonzalez, J.; Ariza, O.T. Effect of incorporating prebiotics in coating materials for the microencapsulation of Saccharomyces boulardii. Int. J. Food Sci. Nutr. 2012, 63, 930–935. [Google Scholar] [CrossRef] [PubMed]
  57. Zamora-Vega, R.; Martınez-Flores, E.; Montanez-Soto, J.L.; Rodiles-Lopez, J.O. Viabilidad de Saccharomyces boulardii en queso fresco bajo condiciones de acidez. Rev. Electron. Nova Sci. 2015, 15, 68–80. [Google Scholar]
  58. Rodriguez, E.T.; Flores, H.E.M.; Lopez, J.O.R.; Vega, R.Z.; Garciglia, R.S.; Sanchez, R.E.P. Survival rate of Saccharomyces boulardii adapted to a functional freeze-dried yogurt: Experimental study related to processing, storage and digestion by Wistar rats. Funct. Foods Health Dis. 2017, 7, 98–114. [Google Scholar]
Figure 1. Growth Index (%) of US-treated S. cerevisiae 17 (A) and S. cerevisiae 41 (B) after 24 h in YPG incubated at 37 °C and S. cerevisiae 4y (C) and S. cerevisiae WB (D) after 48 h in YPG with 5% NaCl added incubated at 25 °C. The growth index was evaluated as the ratio absorbance of treated yeasts vs. absorbance of untreated yeasts (combination A1). Mean values ± standard deviation. Letters indicate significant differences (one-way ANOVA and Tukey’s test, p < 0.05).
Microorganisms 08 01399 g001
Figure 2. Autoaggregation percentage (A%) of S. cerevisiae 2 (A) and S. cerevisiae 17 (B), 2 h after the US treatment. Mean values ± standard deviation. A1, untreated yeast. The letters indicate significant differences (one-way ANOVA and Tukey’s test, p < 0.05).
Microorganisms 08 01399 g002
Table 1. Combinations of power, duration of the treatment and pulse.
Power (%)Time (min)Pulse (s)
A1000
B12022
B22026
B320210
C12062
C22066
C320610
D120102
D220106
D3201010
Table 2. Viable count (log CFU/mL) of US-treated Saccharomyces cerevisiae strains, compared to the control (untreated microorganism, A1). Mean values ± standard deviation. ns, for each strain the differences were not significant (one-way ANOVA and Tukey’s test, p > 0.05).
StrainsCombinations
A1B1B2B3C1C2C3D1D2D3
25.55 ± 0.055.64 ± 0.025.67 ± 0.085.70 ± 05.68 ± 05.77 ± 0.105.76 ± 0.065.69 ± 0.175.65 ± 0.115.71 ± 0.01ns
45 ± 0.304.98 ± 0.325 ± 0.354.98 ± 0.314.81 ± 0.304.95 ± 0.305.22 ± 0.345.19 ± 0.305 ± 0.325.16 ± 0.29ns
175.68 ± 0.265.90 ± 0.205.79 ± 05.78 ± 0.065.82 ± 0.105.89 ± 0.275.76 ± 0.215.83 ± 0.075.78 ± 0.256.07 ± 0.36ns
415.64 ± 0.156.02 ± 0.125.72 ± 0.385.48 ± 0.335.66 ± 0.305.55 ± 0.335.57 ± 0.355.63 ± 0.335.65 ± 0.345.73 ± 0.28ns
4y5.54 ± 0.145.51 ± 0.305.42 ± 0.355.52 ± 0.325.49 ± 0.325.48 ± 0.315.39 ± 0.345.40 ± 0.315.44 ± 0.305.49 ± 0.29ns
WB5.73 ± 0.315.67 ± 0.335.68 ± 0.354.81 ± 0.334.81 ± 0.335.52 ± 0.305.53 ± 0.345.41 ± 0.355.43 ± 0.335.66 ± 0.35ns
W215.49 ± 0.215.49 ± 0.215.53 ± 0.285.28 ± 0.305.48 ± 0.295.64 ± 0.306.19 ± 0.315.58 ± 0.345.46 ± 0.355.56 ± 0.27ns
WL435.70 ± 0.215.48 ± 0.205.81 ± 0.255.59 ± 0.235.68 ± 0.275.50 ± 0.225.18 ± 0.335.58 ± 0.275.45 ± 0.355.56 ± 0.20ns
Table 3. Growth Index (%) of US-treated strains (S. cerevisiae 2, 4, 17, 41, 4y, WB, W21 and WL43) in YPG broth incubated at 25 and 37 °C or in presence of 2% NaCl after 48 h. The growth index was evaluated as the ratio absorbance of treated yeasts vs. absorbance of untreated yeasts (combination A1). Mean values ± standard deviation. The letters indicate significant differences in a line (one-way ANOVA and Tukey’s test, p < 0.05).
CombinationsB1B2B3C1C2C3D1D2D3
Strain 2
25 °C70.85 ± 13.82A65.26 ± 7.85A67.66 ± 26.79A64.21 ± 17.45A72.16 ± 23.98A84.91 ± 11.19A66.73 ± 34.87A69.31 ± 16.34A82.11 ± 30.71A
37 °C87.30 ± 10.41A98.98 ± 1.27A101.31 ± 11.13A104.80 ± 10.06A94.18 ± 14.72A115.85 ± 7.59A108.61 ± 18.88A129.33 ± 13.97A,B90.30 ± 2.67A
2% NaCl129.17 ± 0C129.76 ± 0C84.52 ± 0A106.55 ± 0B106.55 ± 0B80.65 ± 9.68A93.75 ± 8.84A,B109.82 ± 14.73A,B,C85.42 ± 2.10A
Strain 4
25 °C89.64 ± 3.50A98.54 ± 8.50A94.31 ± 9.42A105.73 ± 2.01A101.95 ± 0.34A105.48 ± 5.92A103.66 ± 6.43A106.86 ± 1.44A108.16 ± 1.09A
37 °C100.93 ± 7.45A104.65 ± 3.16A103.48 ± 1.50A97.20 ± 1.81A100.57 ± 10.89A99.34 ± 7.36A101.51 ± 0.57A97.28 ± 2.10A98.61 ± 2.36A
2% NaCl106.29 ± 11.31A117.64 ± 12.51A124.72 ± 13.27A108.52 ± 11.54A120.06 ± 12.77A121.13 ± 12.88A117.54 ± 12.50A132.38 ± 14.08A131.70 ± 14.01A
Strain 17
25 °C117.95 ± 24.52A113.54 ± 33.88A131.62 ± 20.05A123.28 ± 17.44A130.19 ± 14.21A119.73 ± 31.37A110.59 ± 44.45A104.93 ± 25.55A104.30 ± 13.38A
37 °C103.81 ± 20.15 A,B159.59 ± 20.49B132.19 ± 9.47B133.44 ± 1.75B104.96 ± 9.63 A97.85 ± 11.63 A98.71 ± 11.71 A97.90 ± 16.48 A90.03 ± 11.61 A
2% NaCl111.46 ± 16.20A137.59 ± 21.00A125.93 ± 28.08A136.73 ± 25.65A134.27 ± 16.30A113.90 ± 21.86A133.17 ± 3.46A106.61 ± 24.29A146.80 ± 12.41A
Strain 41
25 °C91.48 ± 45.95A140.80 ± 21.78A138.89 ± 26.72A132.81 ± 30.71A110.69 ± 15.75A88.45 ± 201.64A111.94 ± 87.35A87.82 ± 0.48A149.82 ± 48.96A
37 °C133.68 ± 12.76A127.11 ± 8.15A132.85 ± 1.97A233.01 ± 11.63C185.71 ± 25.08B112.99 ± 35.86A100.64 ± 33.34A137.91 ± 5.18A96.63 ± 35.94A
2% NaCl92.04 ± 3.12C73.48 ± 9.64A,B72.37 ± 13.43A,B83.67 ± 12.23A,B67.58 ± 2.99A75.51 ± 3.93B90.73 ± 2.55C87.55 ± 13.31A,B102.76 ± 0.24D
Strain 4y
25 °C111.42 ± 31.77A116.27 ± 57.24A149.59 ± 17.92A108.11 ± 33.34A93.04 ± 38.29A91.97 ± 37.85A79.81 ± 32.84A142.75 ± 58.75A171.35 ± 70.52A
37 °C94.15 ± 26.00A102.40 ± 7.63A94.84 ± 10.43A98.99 ± 3.55A96.69 ± 3.47A95.37 ± 3.42A105.73 ± 3.79A100.17 ± 3.59A97.11 ± 3.48A
2% NaCl114.68 ± 18.47A110.90 ± 23.38A101.60 ± 4.89A118.40 ± 17.69A120.78 ± 18.05A113.91 ± 17.02A114.29 ± 17.08A117.61 ± 17.51A138.62 ± 20.71A
Strain WB
25 °C144.23 ± 66.79A134.73 ± 60.40A101.09 ± 28.64A155.38 ± 45.86A167.74 ± 49.50A123.34 ± 36.40A201.03 ± 59.33A215.41 ± 63.57A275.44 ± 81.29A
37 °C90.46 ± 3.88A99.75 ± 2.72A98.31 ± 5.18A100.31 ± 3.59A96.57 ± 3.46A90.35 ± 3.23A90.90 ± 3.25A92.89 ± 3.33A89.99 ± 3.22A
2% NaCl112.17 ± 1.45A105.95 ± 18.73A112.64 ± 11.17A121.05 ± 13.48A87.42 ± 9.73A122.17 ± 13.60A115.49 ± 12.86A128.00 ± 14.25A120.12 ± 14.38A
Strain W21
25 °C81.72 ± 13.80A102.02 ± 32.70A59.60 ± 51.48A109.05 ± 33.59A93.83 ± 33.46A105.93 ± 23.20A106.78 ± 33.29A93.70 ± 33.33A102.57 ± 23.28A
37 °C91.80 ± 13.68A82.02 ± 22.62A93.54 ± 25.11A60.34 ± 43.19A89.78 ± 23.36A86.23 ± 33.23A89.38 ± 43.20A86.13 ± 23.30A83.48 ± 43.12A
2% NaCl97.30 ± 28.70A97.82 ± 25.20A101.58 ± 19.90A102.04 ± 23.14A98.95 ± 18.22A97.56 ± 35.00A95.45 ± 31.83A100 ± 38.70A98.95 ± 40.13A
Strain WL43
25 °C101.38 ± 23.50A87.26 ± 12.90A86.30 ± 41.88A88.46 ± 30.50A95.07 ± 30.40A84.44 ± 33.25A92.25 ± 38.89A93.15 ± 33.35A92.97 ± 37.28A
37 °C113.28 ± 18.60A93.33 ± 27.42A83.59 ± 35.19A86.30 ± 40.89A71.61 ± 28.33A86.25 ± 31.20A83.18 ± 23.20A75.74 ± 13.90A83.85 ± 40.10A
2% NaCl106.75 ± 25.50A110.97 ± 28.80A102.27 ± 29.77A107.72 ± 33.15A108.96 ± 18.20A113.37 ± 30A99.68 ± 30.87A105.52 ± 28.50A104.35 ± 44.33A
Table 4. Viable count of US-treated S. cerevisiae 2 and S. cerevisiae 17 after simulated gastrointestinal transit. Mean values ± standard deviation. A1, untreated microorganism; D3, 20% of the net power, 10 min, pulses every 10 s (the more drastic treatment). ns, for each strain and step the differences between A1 (control) and US-treated combination (D3) were not significant (t-student’s test, p > 0.05).
YeastTreatmentInoculumSalivary ConditionsGastric ConditionsIntestinal ConditionsSequential Transit
S. cerevisiae 2A16.40 ± 0.306.54 ± 0.296.78 ± 0.106.78 ± 0.085.81 ± 0.50
D36.78 ± 0.146.64 ± 0.306.34 ± 0.326.48 ± 0.336.32 ± 0.18
nsnsnsnsns
S. cerevisiae 17A17.02 ± 0.357.16 ± 0.366.51 ± 0.336.50 ± 0.306.37 ± 0.25
D36.54 ± 0.336.54 ± 0.356.45 ± 0.316.46 ± 0.366.23 ± 0.40
nsnsnsnsns

