
Shedding Light on the African Enigma: In Vitro Testing of Homo sapiens-Helicobacter pylori Coevolution

 , , , ,
  , , , and
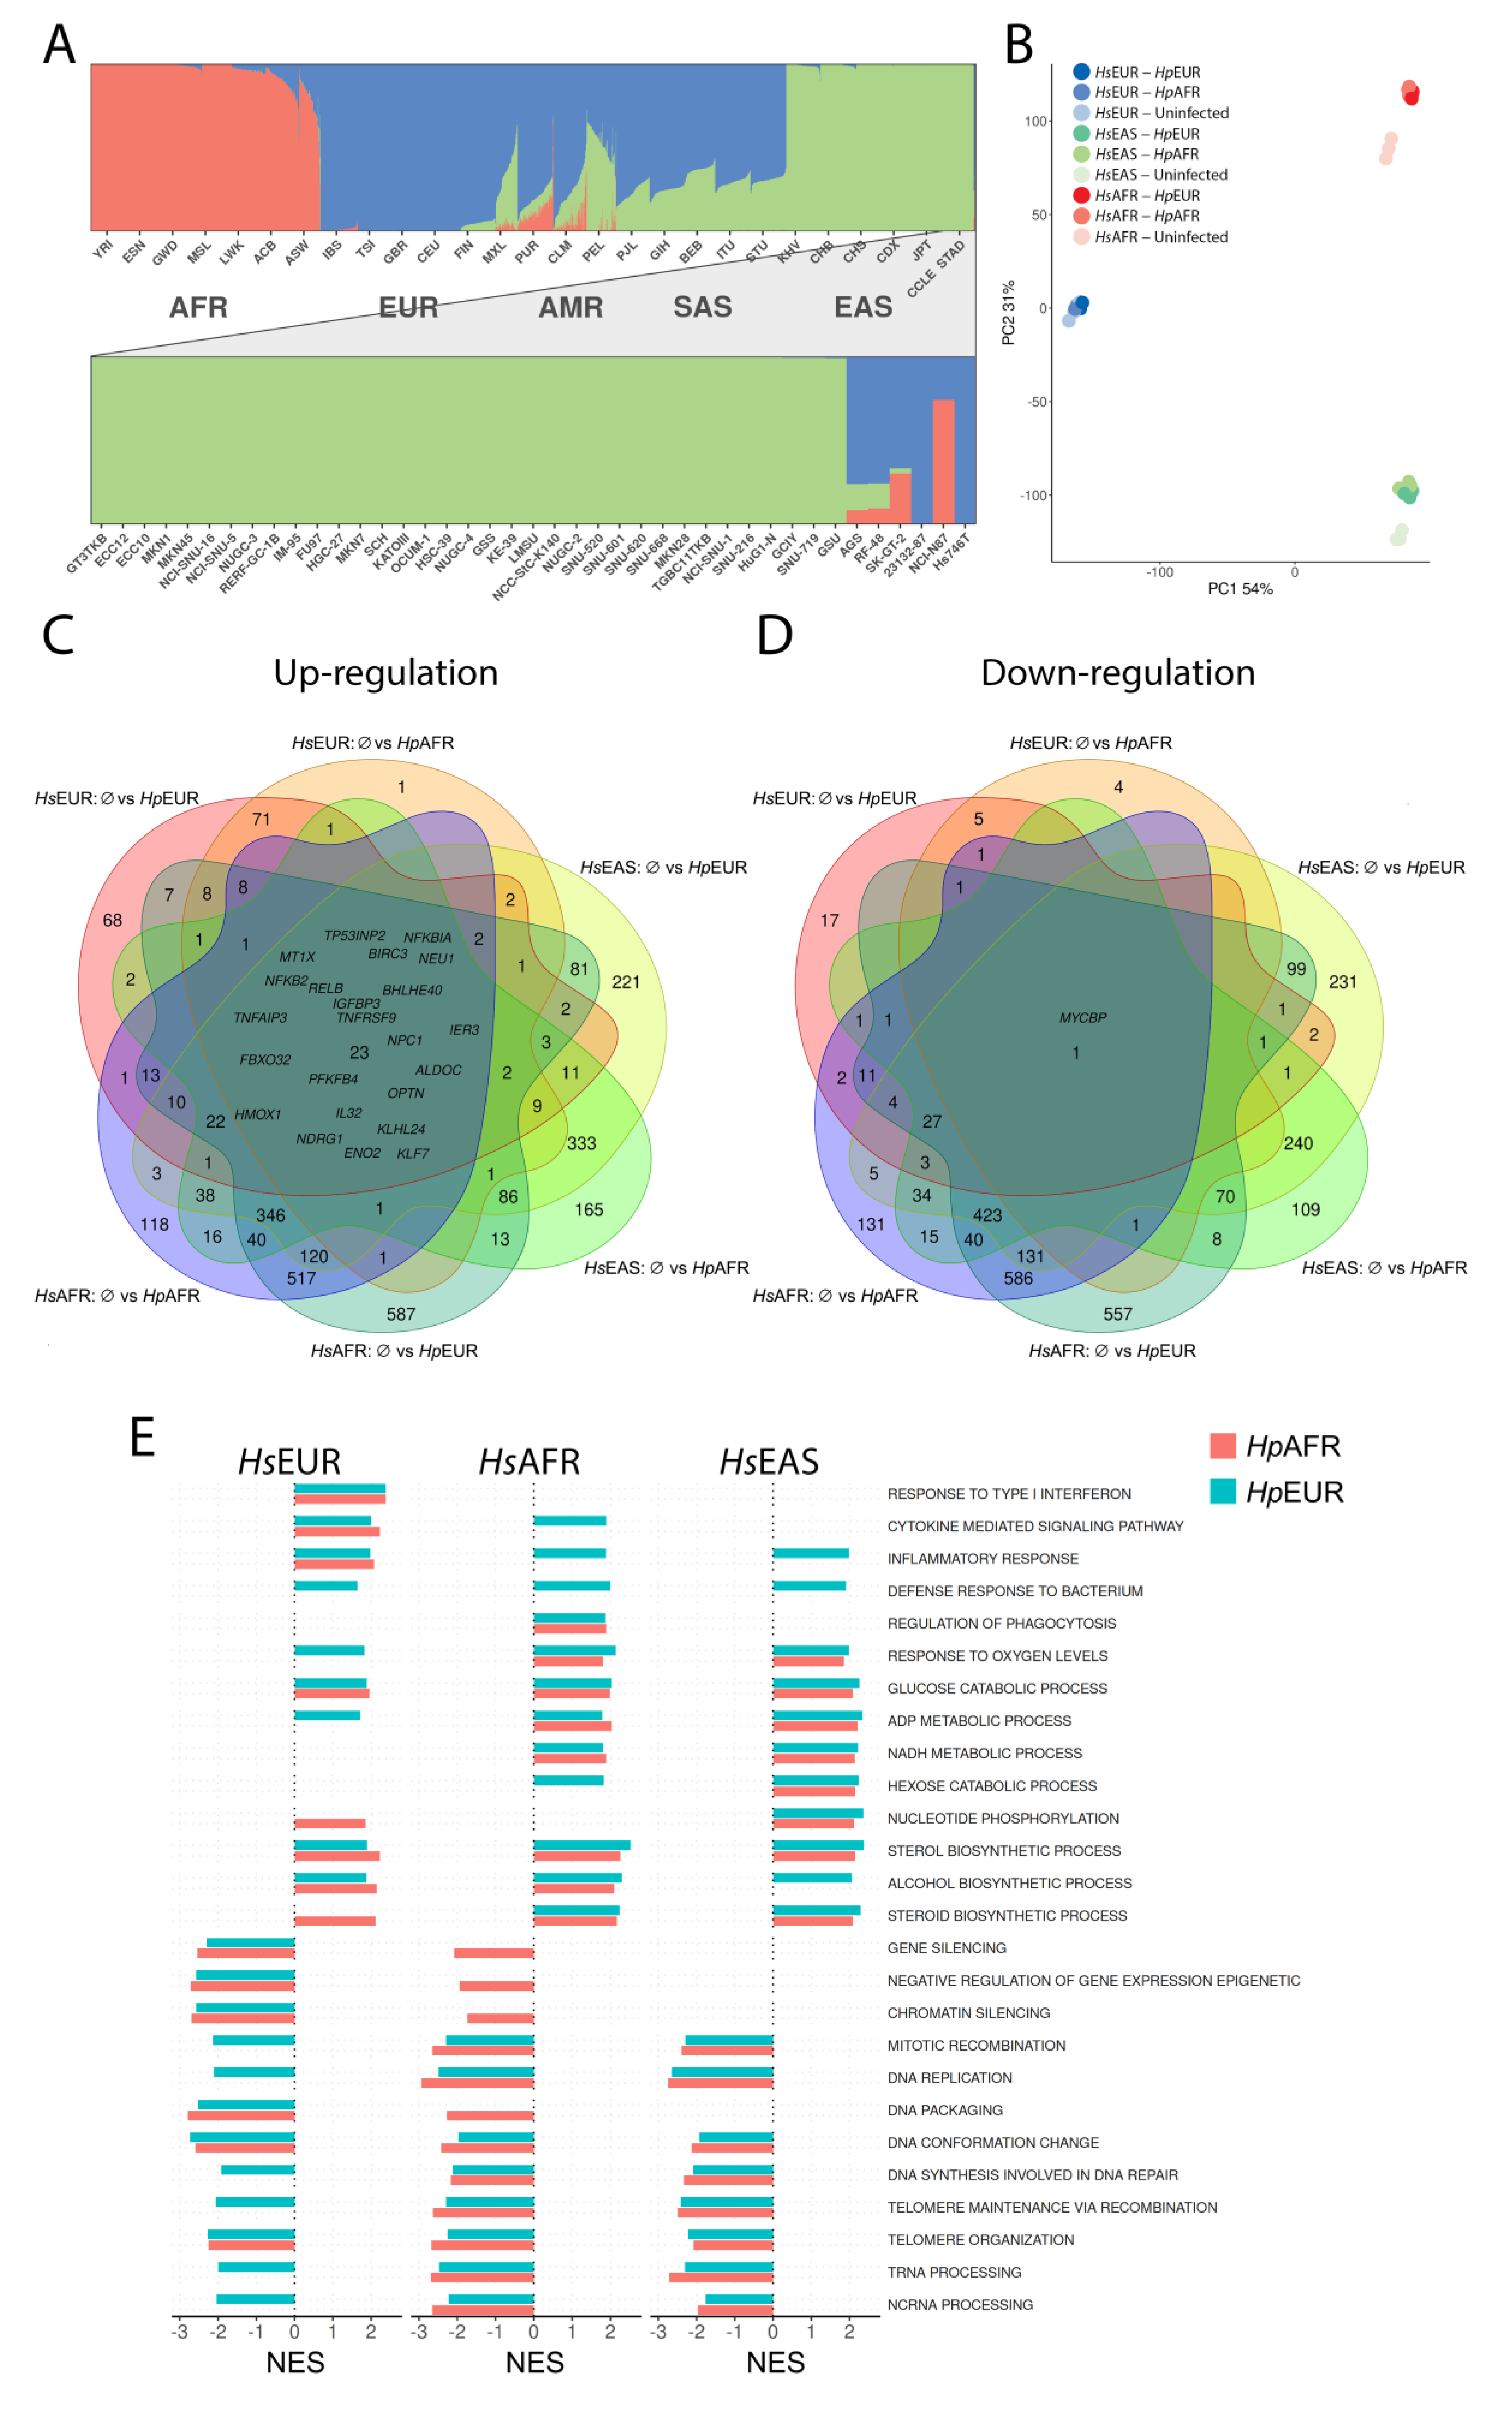
Abstract
:1. Introduction
2. Materials and Methods
2.1. Ancestry Inference of the Gastric Cell Lines
2.2. Gastric Cell Culture and Bacterial Growth Conditions
2.3. Infection of Gastric Cells
2.4. Human RNA Processing and AmpliSeq Expression Profiling
2.5. Cell Viability, Cytotoxicity and Apoptosis Assays
2.6. L-Lactate Concentration and Reactive Oxygen Species (ROS) Production Assays
2.7. Algorithms and Statistics Applied to Gene Expression and Functional Data
3. Results
3.1. Ancestry of the Gastric Cell Lines and H. pylori strains
3.2. Global Expression Profile Alterations
3.3. Detailed Analysis of Altered Molecular Pathways
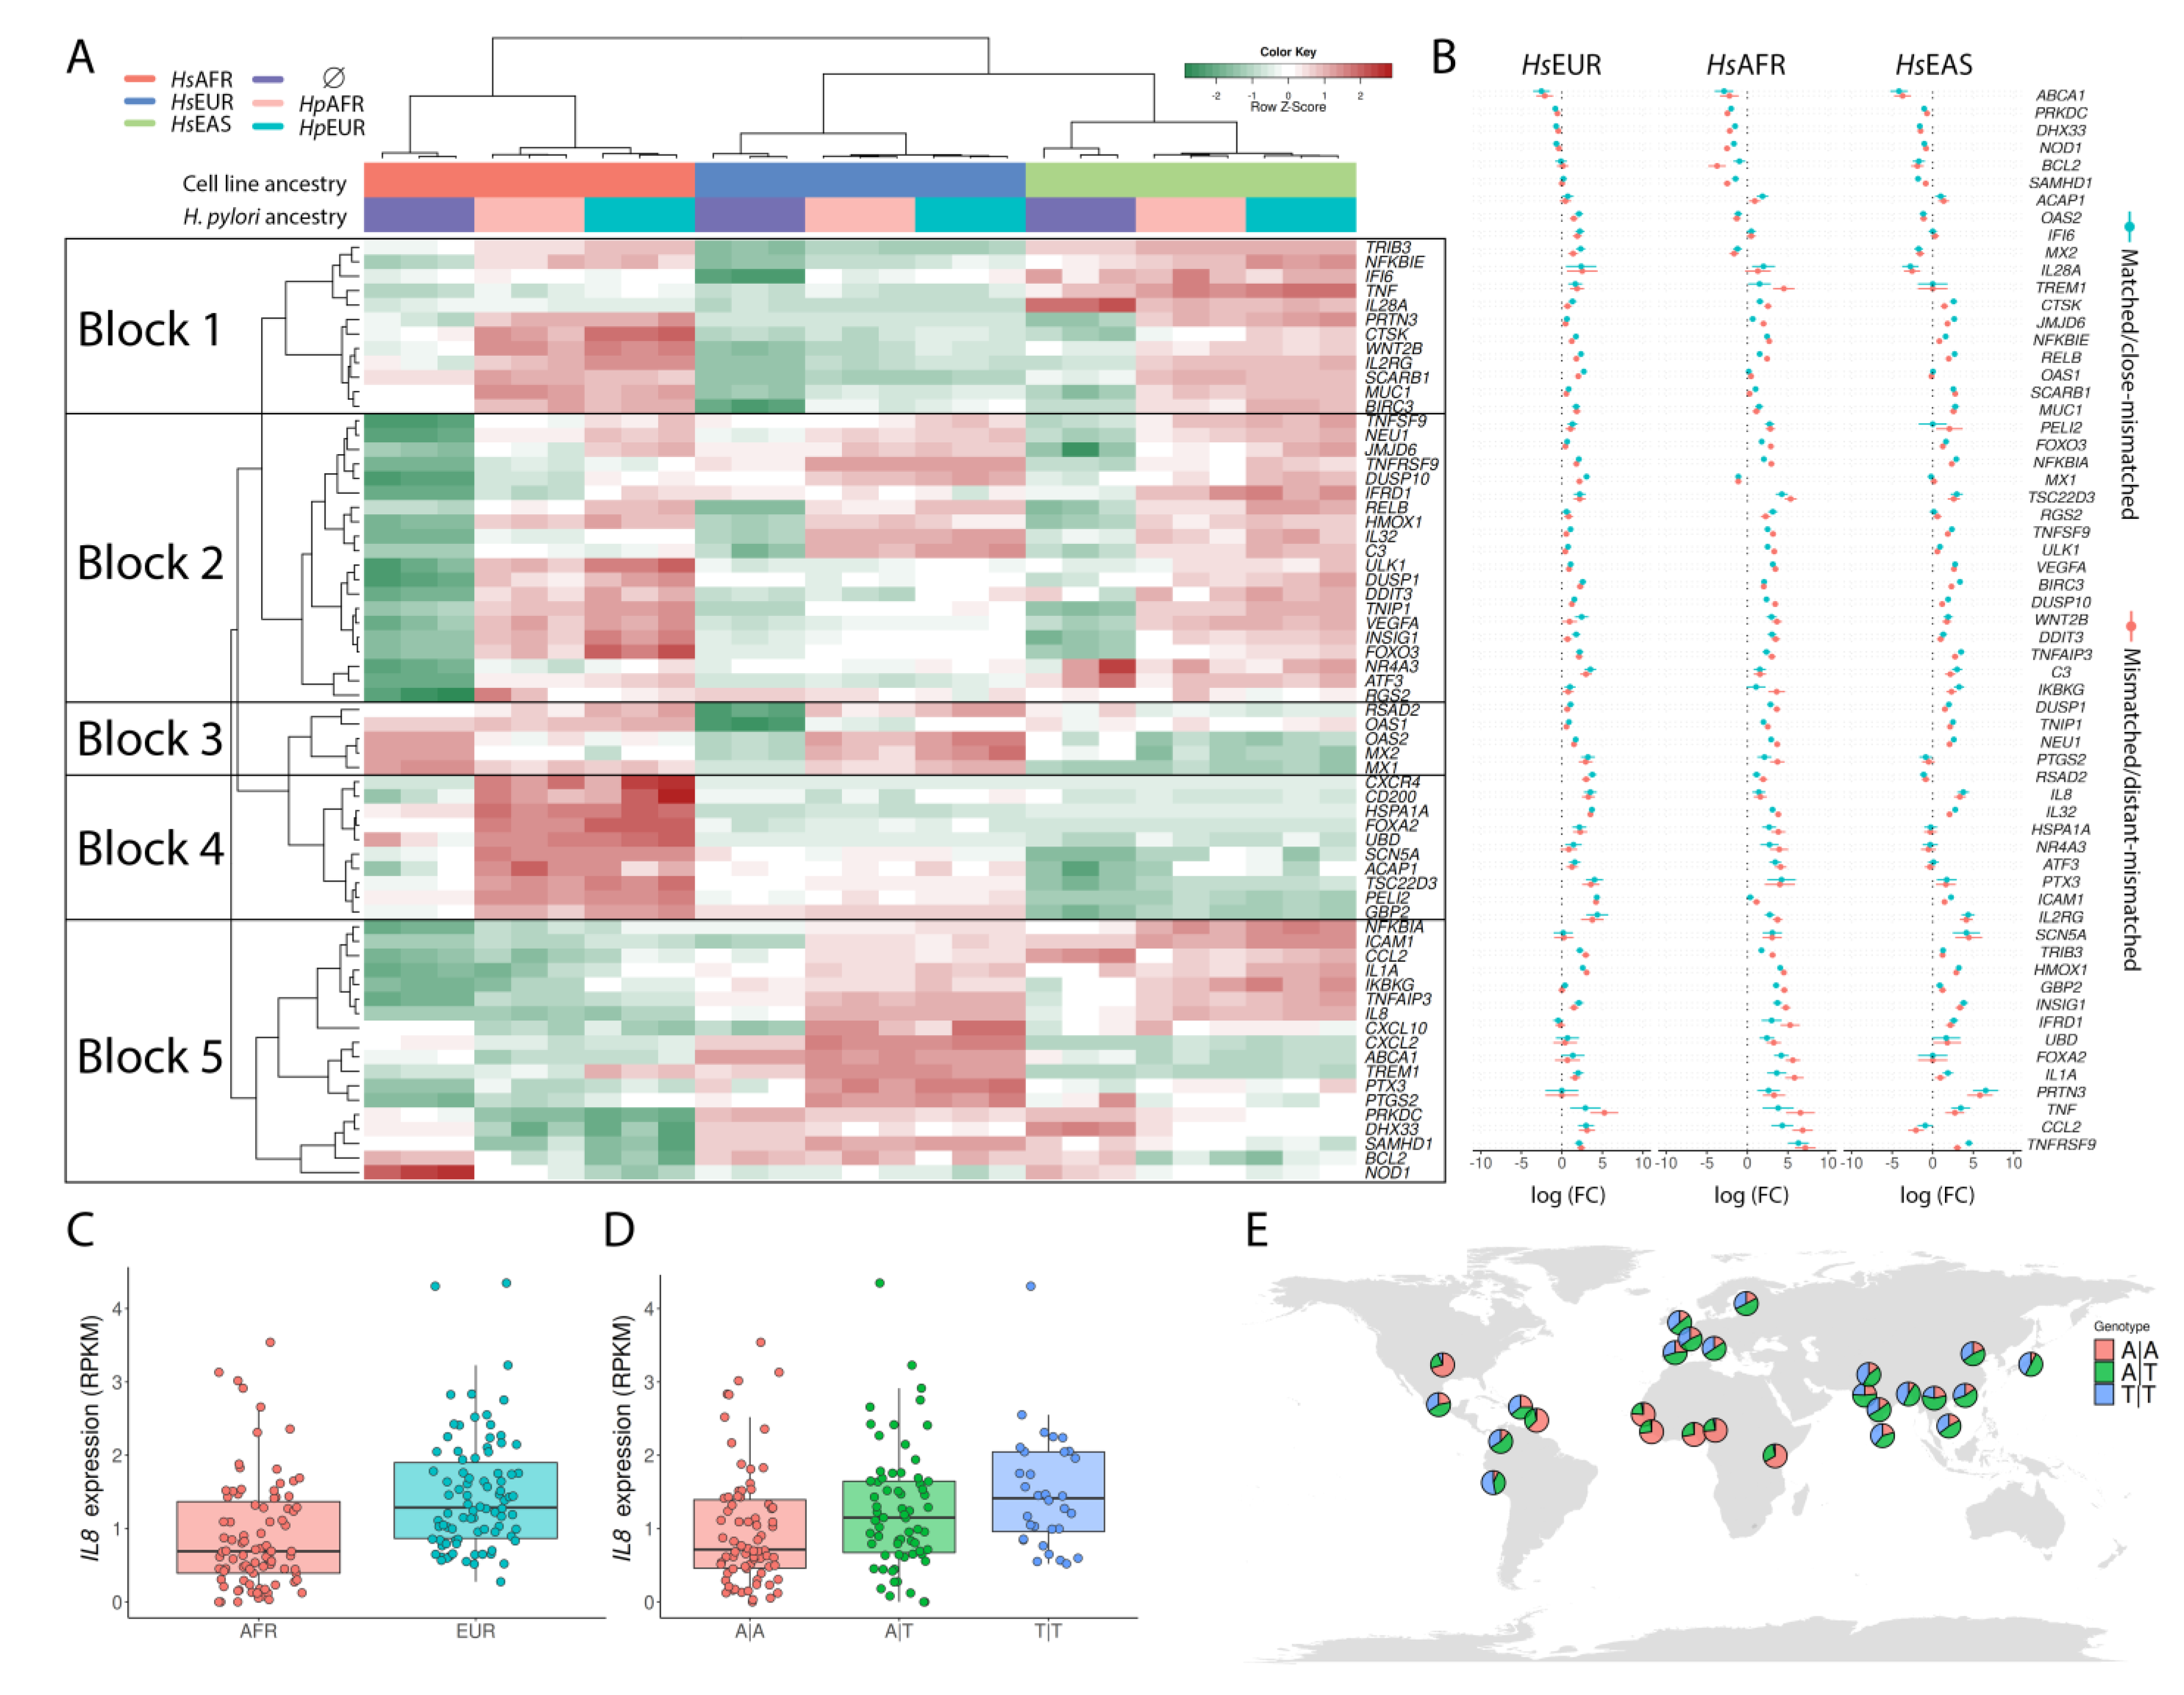
3.4. Exploring the Enriched Pathways—Innate Immune System
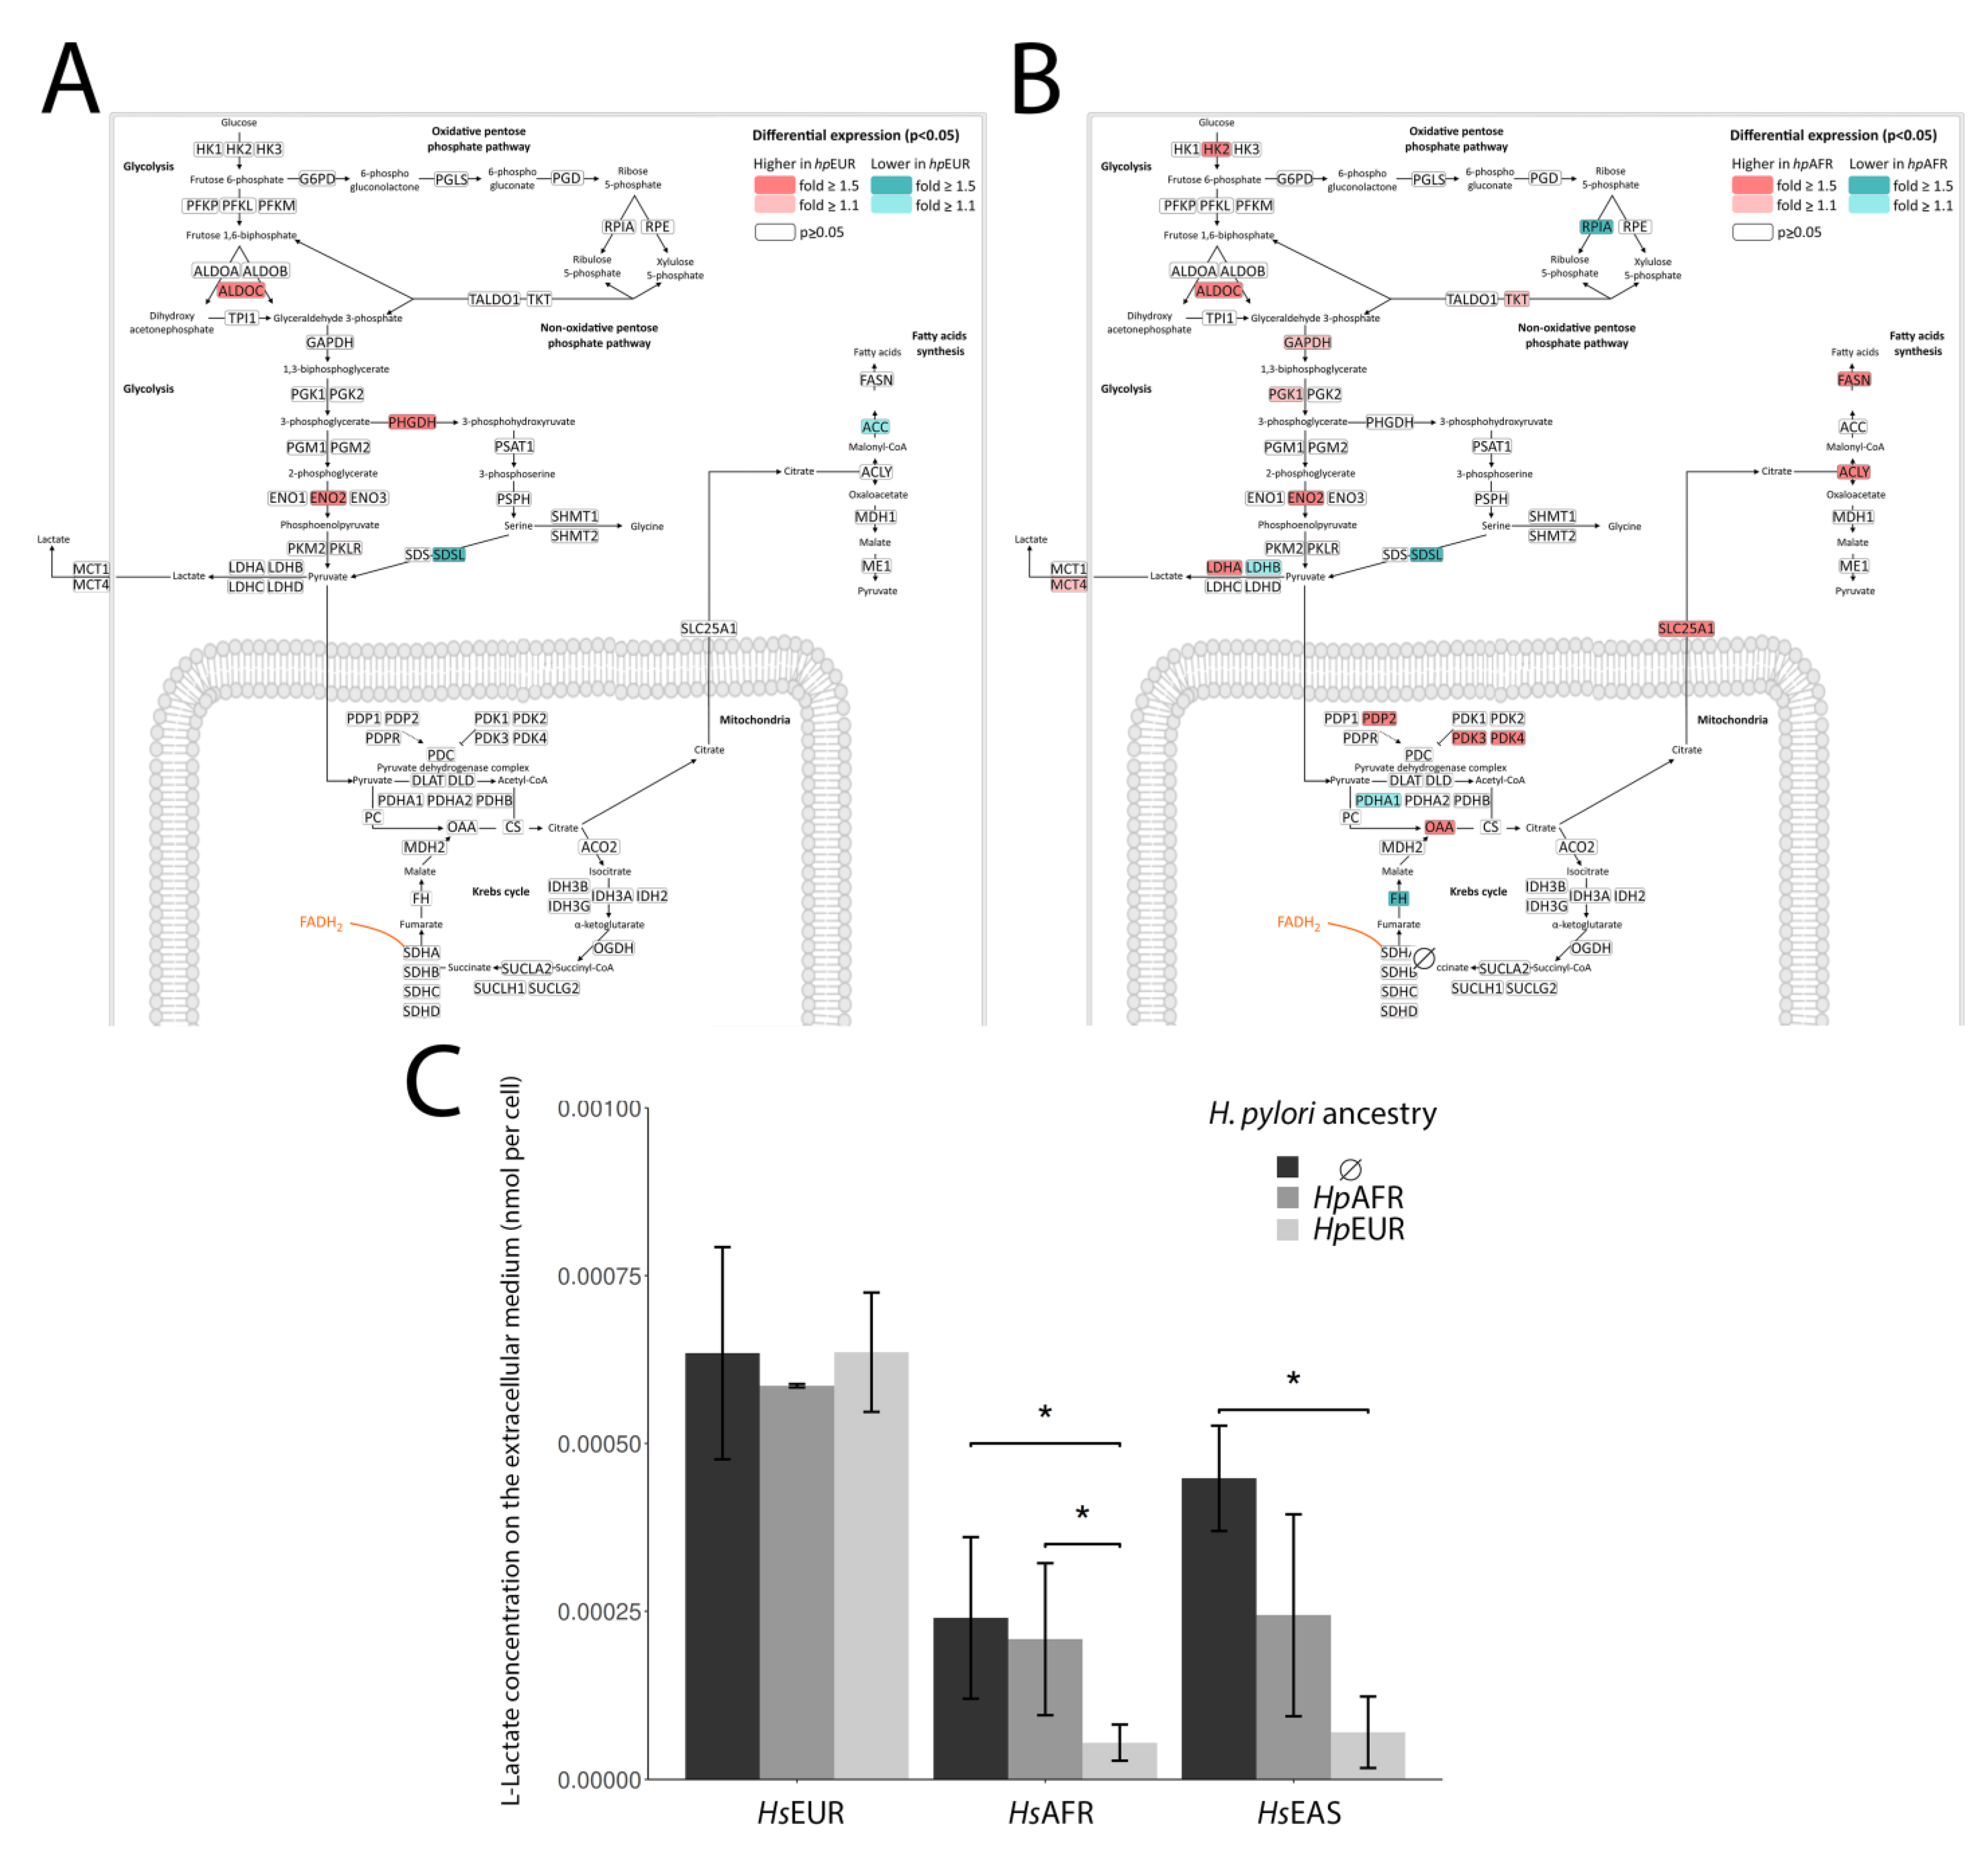
3.5. Exploring the Enriched Pathways—Lactate Metabolism
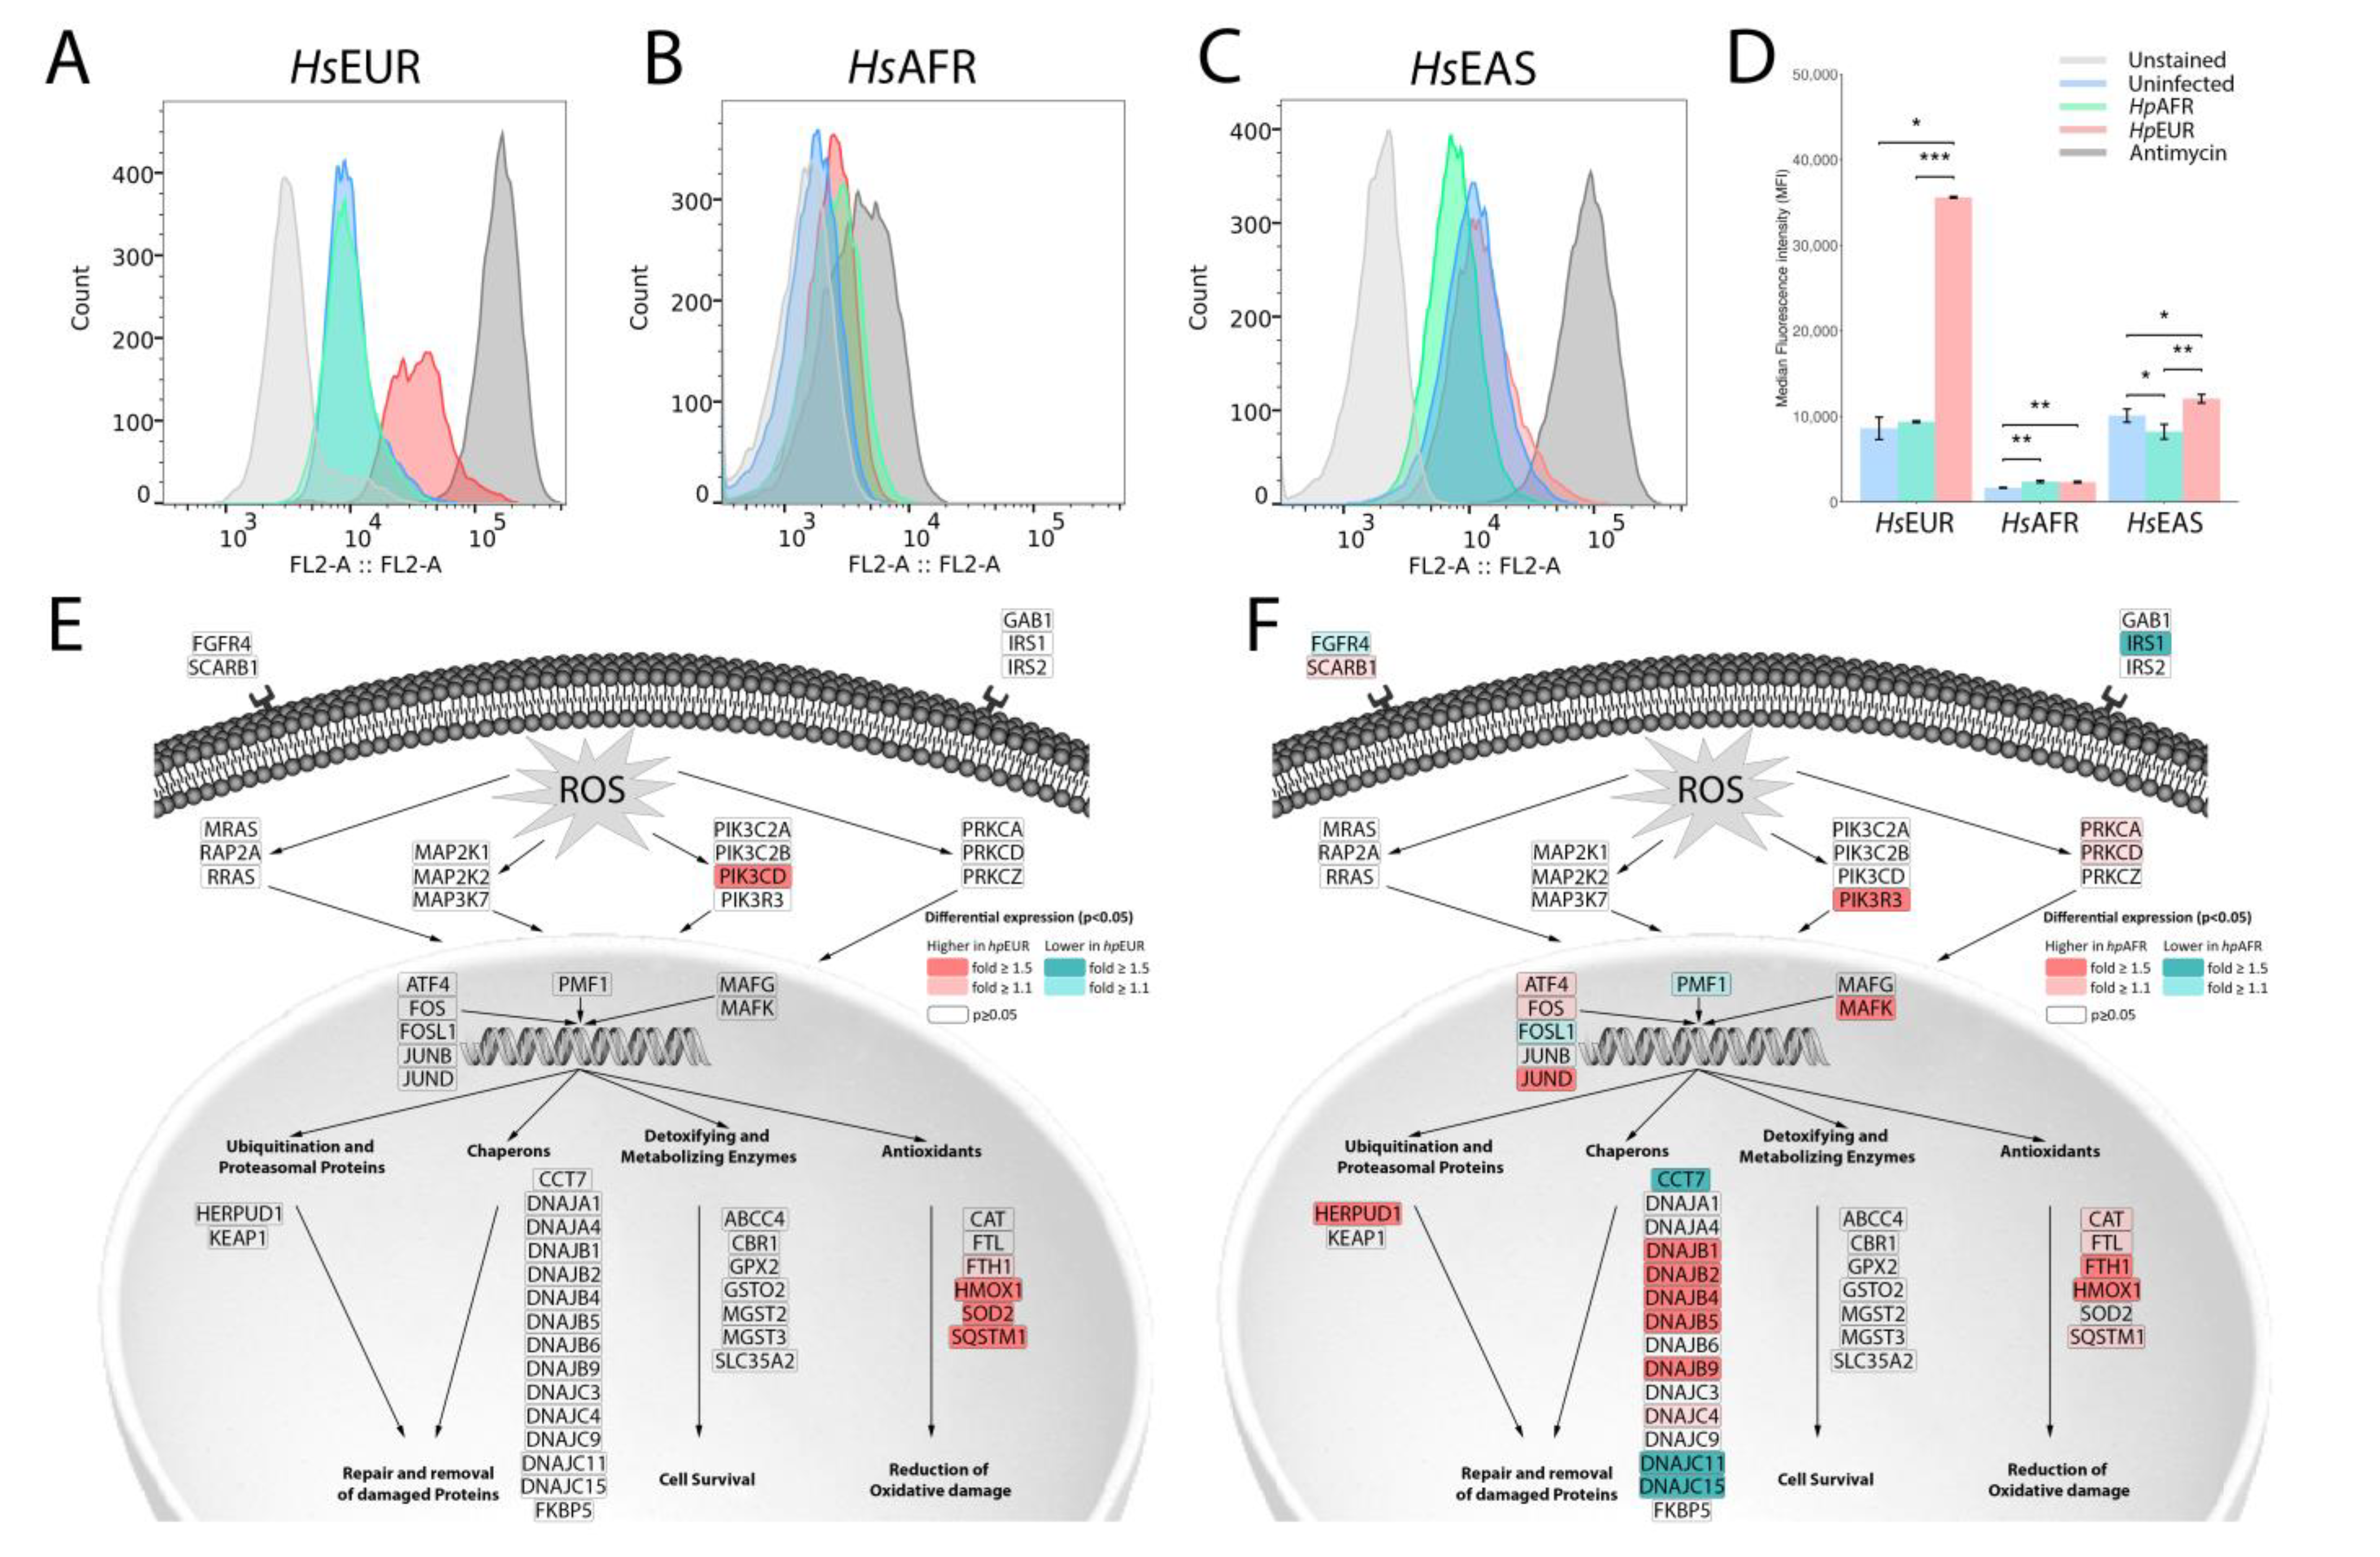
3.6. Exploring the Enriched Pathways—Mitochondrial Oxidative Stress
4. Discussion
Supplementary Materials
Author Contributions
Funding
Institutional Review Board Statement
Informed Consent Statement
Data Availability Statement
Acknowledgments
Conflicts of Interest
References
- Ehrlich, P.R.; Raven, P.H. Butterflies and Plants: A Study in Coevolution. Evolution 1964, 18, 586–608. [Google Scholar] [CrossRef]
- Rand, D.M.; Haney, R.A.; Fry, A.J. Cytonuclear coevolution: The genomics of cooperation. Trends Ecol. Evol. 2004, 19, 645–653. [Google Scholar] [CrossRef]
- Thompson, J.N.; Nuismer, S.L.; Gomulkiewicz, R. Coevolution and maladaptation. Integr. Comp. Biol. 2002, 42, 381–387. [Google Scholar] [CrossRef] [PubMed] [Green Version]
- Lambrechts, L.; Fellous, S.; Koella, J.C. Coevolutionary interactions between host and parasite genotypes. Trends Parasitol. 2006, 22, 12–16. [Google Scholar] [CrossRef]
- Kodaman, N.; Sobota, R.S.; Mera, R.; Schneider, B.G.; Williams, S.M. Disrupted human-pathogen co-evolution: A model for disease. Front. Genet. 2014, 5, 290. [Google Scholar] [CrossRef]
- Moodley, Y.; Linz, B.; Bond, R.P.; Nieuwoudt, M.; Soodyall, H.; Schlebusch, C.M.; Bernhöft, S.; Hale, J.; Suerbaum, S.; Mugisha, L.; et al. Age of the association between Helicobacter pylori and man. PLoS Pathog. 2012, 8, e1002693. [Google Scholar] [CrossRef] [Green Version]
- Comas, I.; Coscolla, M.; Luo, T.; Borrell, S.; Holt, K.E.; Kato-Maeda, M.; Parkhill, J.; Malla, B.; Berg, S.; Thwaites, G.; et al. Out-of-Africa migration and Neolithic coexpansion of Mycobacterium tuberculosis with modern humans. Nat. Genet. 2013, 45, 1176–1182. [Google Scholar] [CrossRef]
- Ong, C.K.; Chan, S.Y.; Campo, M.S.; Fujinaga, K.; Mavromara-Nazos, P.; Labropoulou, V.; Pfister, H.; Tay, S.K.; ter Meulen, J.; Villa, L.L.; et al. Evolution of human papillomavirus type 18: An ancient phylogenetic root in Africa and intratype diversity reflect coevolution with human ethnic groups. J. Virol. 1993, 67, 6424–6431. [Google Scholar] [CrossRef] [Green Version]
- Cavadas, B.; Camacho, R.; Ferreira, J.C.; Ferreira, R.M.; Figueiredo, C.; Brazma, A.; Fonseca, N.A.; Pereira, L. Gastric Microbiome Diversities in Gastric Cancer Patients from Europe and Asia Mimic the Human Population Structure and Are Partly Driven by Microbiome Quantitative Trait Loci. Microorganisms 2020, 8, 1196. [Google Scholar] [CrossRef]
- Hooi, J.K.Y.; Lai, W.Y.; Ng, W.K.; Suen, M.M.Y.; Underwood, F.E.; Tanyingoh, D.; Malfertheiner, P.; Graham, D.Y.; Wong, V.W.S.; Wu, J.C.Y.; et al. Global Prevalence of Helicobacter pylori Infection: Systematic Review and Meta-Analysis. Gastroenterology 2017, 153, 420–429. [Google Scholar] [CrossRef] [Green Version]
- Peek, R.M., Jr.; Blaser, M.J. Helicobacter pylori and gastrointestinal tract adenocarcinomas. Nat. Rev. Cancer 2002, 2, 28–37. [Google Scholar] [CrossRef] [PubMed]
- Koike, T.; Ohara, S.; Sekine, H.; Iijima, K.; Abe, Y.; Kato, K.; Toyota, T.; Shimosegawa, T. Helicobacter pylori infection prevents erosive reflux oesophagitis by decreasing gastric acid secretion. Gut 2001, 49, 330–334. [Google Scholar] [CrossRef] [PubMed] [Green Version]
- Whiteman, D.C.; Parmar, P.; Fahey, P.; Moore, S.P.; Stark, M.; Zhao, Z.Z.; Montgomery, G.W.; Green, A.C.; Hayward, N.K.; Webb, P.M. Association of Helicobacter pylori infection with reduced risk for esophageal cancer is independent of environmental and genetic modifiers. Gastroenterology 2010, 139, 73–83. [Google Scholar] [CrossRef] [PubMed]
- Come, J.; Pereira, J.B.; Pinto, R.; Carrilho, C.; Pereira, L.; Lara Santos, L. The Upper Digestive Tract Microbiome and Oesophageal Squamous Cell Carcinoma: Epidemiology, Pathogenesis, and Clinical Implications in Africa. Pathobiology 2020, 1–15. [Google Scholar] [CrossRef]
- Chen, Y.; Blaser, M.J. Inverse associations of Helicobacter pylori with asthma and allergy. Arch. Intern. Med. 2007, 167, 821–827. [Google Scholar] [CrossRef] [Green Version]
- Wroblewski, L.E.; Peek, R.M., Jr.; Wilson, K.T. Helicobacter pylori and gastric cancer: Factors that modulate disease risk. Clin. Microbiol. Rev. 2010, 23, 713–739. [Google Scholar] [CrossRef] [Green Version]
- Falush, D.; Wirth, T.; Linz, B.; Pritchard, J.K.; Stephens, M.; Kidd, M.; Blaser, M.J.; Graham, D.Y.; Vacher, S.; Perez-Perez, G.I.; et al. Traces of human migrations in Helicobacter pylori populations. Science 2003, 299, 1582–1585. [Google Scholar] [CrossRef] [Green Version]
- Moodley, Y.; Linz, B. Helicobacter pylori Sequences Reflect Past Human Migrations. Genome Dyn. 2009, 6, 62–74. [Google Scholar] [CrossRef]
- Bray, F.; Ferlay, J.; Soerjomataram, I.; Siegel, R.L.; Torre, L.A.; Jemal, A. Global cancer statistics 2018: GLOBOCAN estimates of incidence and mortality worldwide for 36 cancers in 185 countries. CA Cancer J. Clin. 2018, 68, 394–424. [Google Scholar] [CrossRef] [Green Version]
- Holcombe, C. Helicobacter pylori: The African enigma. Gut 1992, 33, 429–431. [Google Scholar] [CrossRef] [Green Version]
- Kodaman, N.; Pazos, A.; Schneider, B.G.; Piazuelo, M.B.; Mera, R.; Sobota, R.S.; Sicinschi, L.A.; Shaffer, C.L.; Romero-Gallo, J.; de Sablet, T.; et al. Human and Helicobacter pylori coevolution shapes the risk of gastric disease. Proc. Natl. Acad. Sci. USA 2014, 111, 1455–1460. [Google Scholar] [CrossRef] [PubMed] [Green Version]
- Sheh, A.; Chaturvedi, R.; Merrell, D.S.; Correa, P.; Wilson, K.T.; Fox, J.G. Phylogeographic origin of Helicobacter pylori determines host-adaptive responses upon coculture with gastric epithelial cells. Infect. Immun. 2013, 81, 2468–2477. [Google Scholar] [CrossRef] [PubMed] [Green Version]
- Barretina, J.; Caponigro, G.; Stransky, N.; Venkatesan, K.; Margolin, A.A.; Kim, S.; Wilson, C.J.; Lehár, J.; Kryukov, G.V.; Sonkin, D.; et al. The Cancer Cell Line Encyclopedia enables predictive modelling of anticancer drug sensitivity. Nature 2012, 483, 603–607. [Google Scholar] [CrossRef] [PubMed]
- Auton, A.; Brooks, L.D.; Durbin, R.M.; Garrison, E.P.; Kang, H.M.; Korbel, J.O.; Marchini, J.L.; McCarthy, S.; McVean, G.A.; Abecasis, G.R. A global reference for human genetic variation. Nature 2015, 526, 68–74. [Google Scholar] [CrossRef] [PubMed] [Green Version]
- Purcell, S.; Neale, B.; Todd-Brown, K.; Thomas, L.; Ferreira, M.A.; Bender, D.; Maller, J.; Sklar, P.; de Bakker, P.I.; Daly, M.J.; et al. PLINK: A tool set for whole-genome association and population-based linkage analyses. Am. J. Hum. Genet. 2007, 81, 559–575. [Google Scholar] [CrossRef] [Green Version]
- Alexander, D.H.; Novembre, J.; Lange, K. Fast model-based estimation of ancestry in unrelated individuals. Genome Res. 2009, 19, 1655–1664. [Google Scholar] [CrossRef] [Green Version]
- R: A Language and Environment for Statistical Computing; R Foundation for Statistical Computing: Vienna, Austria, 2014.
- Love, M.I.; Huber, W.; Anders, S. Moderated estimation of fold change and dispersion for RNA-seq data with DESeq2. Genome Biol. 2014, 15, 550. [Google Scholar] [CrossRef] [Green Version]
- Powers, R.K.; Goodspeed, A.; Pielke-Lombardo, H.; Tan, A.C.; Costello, J.C. GSEA-InContext: Identifying novel and common patterns in expression experiments. Bioinformatics 2018, 34, i555–i564. [Google Scholar] [CrossRef]
- Breuer, K.; Foroushani, A.K.; Laird, M.R.; Chen, C.; Sribnaia, A.; Lo, R.; Winsor, G.L.; Hancock, R.E.; Brinkman, F.S.; Lynn, D.J. InnateDB: Systems biology of innate immunity and beyond--recent updates and continuing curation. Nucleic Acids Res. 2013, 41, D1228–D1233. [Google Scholar] [CrossRef]
- Patin, E.; Lopez, M.; Grollemund, R.; Verdu, P.; Harmant, C.; Quach, H.; Laval, G.; Perry, G.H.; Barreiro, L.B.; Froment, A.; et al. Dispersals and genetic adaptation of Bantu-speaking populations in Africa and North America. Science 2017, 356, 543–546. [Google Scholar] [CrossRef] [Green Version]
- Dutil, J.; Chen, Z.; Monteiro, A.N.; Teer, J.K.; Eschrich, S.A. An Interactive Resource to Probe Genetic Diversity and Estimated Ancestry in Cancer Cell Lines. Cancer Res. 2019, 79, 1263–1273. [Google Scholar] [CrossRef] [PubMed] [Green Version]
- Kumar, N.; Mariappan, V.; Baddam, R.; Lankapalli, A.K.; Shaik, S.; Goh, K.L.; Loke, M.F.; Perkins, T.; Benghezal, M.; Hasnain, S.E.; et al. Comparative genomic analysis of Helicobacter pylori from Malaysia identifies three distinct lineages suggestive of differential evolution. Nucleic Acids Res. 2015, 43, 324–335. [Google Scholar] [CrossRef] [PubMed] [Green Version]
- Persson, C.; Canedo, P.; Machado, J.C.; El-Omar, E.M.; Forman, D. Polymorphisms in inflammatory response genes and their association with gastric cancer: A HuGE systematic review and meta-analyses. Am. J. Epidemiol. 2011, 173, 259–270. [Google Scholar] [CrossRef] [PubMed] [Green Version]
- Iwatani, S.; Nagashima, H.; Reddy, R.; Shiota, S.; Graham, D.Y.; Yamaoka, Y. Identification of the genes that contribute to lactate utilization in Helicobacter pylori. PLoS ONE 2014, 9, e103506. [Google Scholar] [CrossRef] [Green Version]
- Marais, A.; Mendz, G.L.; Hazell, S.L.; Mégraud, F. Metabolism and genetics of Helicobacter pylori: The genome era. Microbiol. Mol. Biol. Rev. 1999, 63, 642–674. [Google Scholar] [CrossRef] [Green Version]
- Takahashi, T.; Matsumoto, T.; Nakamura, M.; Matsui, H.; Tsuchimoto, K.; Yamada, H. L-lactic acid secreted from gastric mucosal cells enhances growth of Helicobacter pylori. Helicobacter 2007, 12, 532–540. [Google Scholar] [CrossRef]
- Li, H.; Ning, S.; Ghandi, M.; Kryukov, G.V.; Gopal, S.; Deik, A.; Souza, A.; Pierce, K.; Keskula, P.; Hernandez, D.; et al. The landscape of cancer cell line metabolism. Nat. Med. 2019, 25, 850–860. [Google Scholar] [CrossRef]
- Gong, M.; Ling, S.S.; Lui, S.Y.; Yeoh, K.G.; Ho, B. Helicobacter pylori gamma-glutamyl transpeptidase is a pathogenic factor in the development of peptic ulcer disease. Gastroenterology 2010, 139, 564–573. [Google Scholar] [CrossRef]
- Sierra, B.; Triska, P.; Soares, P.; Garcia, G.; Perez, A.B.; Aguirre, E.; Oliveira, M.; Cavadas, B.; Regnault, B.; Alvarez, M.; et al. OSBPL10, RXRA and lipid metabolism confer African-ancestry protection against dengue haemorrhagic fever in admixed Cubans. PLoS Pathog. 2017, 13, e1006220. [Google Scholar] [CrossRef] [Green Version]
- Morey, P.; Pfannkuch, L.; Pang, E.; Boccellato, F.; Sigal, M.; Imai-Matsushima, A.; Dyer, V.; Koch, M.; Mollenkopf, H.J.; Schlaermann, P.; et al. Helicobacter pylori Depletes Cholesterol in Gastric Glands to Prevent Interferon Gamma Signaling and Escape the Inflammatory Response. Gastroenterology 2018, 154, 1391–1404. [Google Scholar] [CrossRef] [Green Version]
- Schleimer, R.P.; Kato, A.; Kern, R.; Kuperman, D.; Avila, P.C. Epithelium: At the interface of innate and adaptive immune responses. J. Allergy Clin. Immunol. 2007, 120, 1279–1284. [Google Scholar] [CrossRef] [PubMed] [Green Version]
- Moyat, M.; Velin, D. Immune responses to Helicobacter pylori infection. World J. Gastroenterol. 2014, 20, 5583–5593. [Google Scholar] [CrossRef] [PubMed]
- Boxx, G.M.; Cheng, G. The Roles of Type I Interferon in Bacterial Infection. Cell Host Microbe 2016, 19, 760–769. [Google Scholar] [CrossRef] [Green Version]
- Watanabe, T.; Asano, N.; Fichtner-Feigl, S.; Gorelick, P.L.; Tsuji, Y.; Matsumoto, Y.; Chiba, T.; Fuss, I.J.; Kitani, A.; Strober, W. NOD1 contributes to mouse host defense against Helicobacter pylori via induction of type I IFN and activation of the ISGF3 signaling pathway. J. Clin. Investig. 2010, 120, 1645–1662. [Google Scholar] [CrossRef] [PubMed] [Green Version]
- Peek, R.M., Jr.; Fiske, C.; Wilson, K.T. Role of innate immunity in Helicobacter pylori-induced gastric malignancy. Physiol. Rev. 2010, 90, 831–858. [Google Scholar] [CrossRef] [Green Version]
- McGeachy, M.J.; Cua, D.J.; Gaffen, S.L. The IL-17 Family of Cytokines in Health and Disease. Immunity 2019, 50, 892–906. [Google Scholar] [CrossRef]
- Dominguez-Villar, M.; Hafler, D.A. Immunology. An innate role for IL-17. Science 2011, 332, 47–48. [Google Scholar] [CrossRef]
- Iwakura, Y.; Ishigame, H.; Saijo, S.; Nakae, S. Functional specialization of interleukin-17 family members. Immunity 2011, 34, 149–162. [Google Scholar] [CrossRef] [Green Version]


Publisher’s Note: MDPI stays neutral with regard to jurisdictional claims in published maps and institutional affiliations. |
© 2021 by the authors. Licensee MDPI, Basel, Switzerland. This article is an open access article distributed under the terms and conditions of the Creative Commons Attribution (CC BY) license (http://creativecommons.org/licenses/by/4.0/).
Share and Cite
Cavadas, B.; Leite, M.; Pedro, N.; Magalhães, A.C.; Melo, J.; Correia, M.; Máximo, V.; Camacho, R.; Fonseca, N.A.; Figueiredo, C.; et al. Shedding Light on the African Enigma: In Vitro Testing of Homo sapiens-Helicobacter pylori Coevolution. Microorganisms 2021, 9, 240. https://0-doi-org.brum.beds.ac.uk/10.3390/microorganisms9020240
Cavadas B, Leite M, Pedro N, Magalhães AC, Melo J, Correia M, Máximo V, Camacho R, Fonseca NA, Figueiredo C, et al. Shedding Light on the African Enigma: In Vitro Testing of Homo sapiens-Helicobacter pylori Coevolution. Microorganisms. 2021; 9(2):240. https://0-doi-org.brum.beds.ac.uk/10.3390/microorganisms9020240
Chicago/Turabian StyleCavadas, Bruno, Marina Leite, Nicole Pedro, Ana C. Magalhães, Joana Melo, Marcelo Correia, Valdemar Máximo, Rui Camacho, Nuno A. Fonseca, Ceu Figueiredo, and et al. 2021. "Shedding Light on the African Enigma: In Vitro Testing of Homo sapiens-Helicobacter pylori Coevolution" Microorganisms 9, no. 2: 240. https://0-doi-org.brum.beds.ac.uk/10.3390/microorganisms9020240