
Persulfate Oxidation Coupled with Biodegradation by Pseudomonas fluorescens Enhances Naphthenic Acid Remediation and Toxicity Reduction


Abstract
:1. Introduction
2. Materials and Methods
2.1. Source of NAs and Bacteria
2.2. Experimental Setup
2.3. Merichem NAs
2.4. Chemical Oxygen Demand
2.5. Carbon Dioxide
2.6. Persulfate
2.7. Bacterial Enumeration
2.8. Microtox Assay
2.9. Statistical Analysis
3. Results and Discussion
3.1. Degradation of Organics
3.1.1. Merichem NA and COD Removal
3.1.2. CO2 Production
3.1.3. Persulfate Persistence
3.2. Impact on Bacteria
3.2.1. Microbial Viability
3.2.2. Toxicity Reduction
4. Conclusions
Author Contributions
Funding
Institutional Review Board Statement
Informed Consent Statement
Data Availability Statement
Acknowledgments
Conflicts of Interest
References
- Finkel, M.L. The impact of oil sands on the environment and health. Curr. Opin. Environ. Sci. Health 2018, 3, 52–55. [Google Scholar] [CrossRef]
- Brown, L.D.; Ulrich, A.C. Oil sands naphthenic acids: A review of properties, measurement, and treatment. Chemosphere 2015, 127, 276–290. [Google Scholar] [CrossRef] [PubMed]
- Allen, E.W. Process water treatment in Canada’s oil sands industry: I. Target pollutants and treatment objectives. J. Environ. Eng. Sci. 2008, 7, 123–138. [Google Scholar] [CrossRef] [Green Version]
- Li, C.; Fu, L.; Stafford, J.; Belosevic, M.; Gamal El-Din, M. The toxicity of oil sands process-affected water (OSPW): A critical review. Sci. Total Environ. 2017, 601–602, 1785–1802. [Google Scholar] [CrossRef]
- Scott, A.C.; MacKinnon, M.D.; Fedorak, P.M. Naphthenic Acids in Athabasca Oil Sands Tailings Waters Are Less Biodegradable than Commercial Naphthenic Acids. Environ. Sci. Technol. 2005, 39, 8388–8394. [Google Scholar] [CrossRef]
- Morandi, G.D.; Wiseman, S.B.; Guan, M.; Zhang, X.W.; Martin, J.W.; Giesy, J.P. Elucidating mechanisms of toxic action of dissolved organic chemicals in oil sands process-affected water (OSPW). Chemosphere 2017, 186, 893–900. [Google Scholar] [CrossRef]
- Brient, J.; Wessner, P.; Doyle, M. Naphthenic Acids. In Kirk-Othmer Encyclopedia of Chemical Technology; John Wiley & Sons, Inc.: New York, NY, USA, 2008. [Google Scholar] [CrossRef]
- Bauer, A.E.; Frank, R.A.; Headley, J.V.; Peru, K.M.; Hewitt, L.M.; Dixon, D.G. Enhanced characterization of oil sands acid-extractable organics fractions using electrospray ionization-high-resolution mass spectrometry and synchronous fluorescence spectroscopy. Environ. Toxicol. Chem. 2015, 34, 1001–1008. [Google Scholar] [CrossRef] [PubMed]
- Allen, E.W. Process water treatment in Canada’s oil sands industry: II. A review of emerging technologies. J. Environ. Eng. Sci. 2008, 7, 499–524. [Google Scholar] [CrossRef]
- Quinlan, P.J.; Tam, K.C. Water treatment technologies for the remediation of naphthenic acids in oil sands process-affected water. Chem. Eng. J. 2015, 279, 696–714. [Google Scholar] [CrossRef]
- Gamal El-Din, M.; Fu, H.; Wang, N.; Chelme-Ayala, P.; Pérez-Estrada, L.; Drzewicz, P.; Martin, J.W.; Zubot, W.; Smith, D.W. Naphthenic acids speciation and removal during petroleum-coke adsorption and ozonation of oil sands process-affected water. Sci. Total Environ. 2011, 409, 5119–5125. [Google Scholar] [CrossRef]
- Pérez-Estrada, L.A.; Han, X.; Drzewicz, P.; Gamal El-Din, M.; Fedorak, P.M.; Martin, J.W. Structure–Reactivity of Naphthenic Acids in the Ozonation Process. Environ. Sci. Technol. 2011, 45, 7431–7437. [Google Scholar] [CrossRef] [PubMed]
- Wang, N.; Chelme-Ayala, P.; Pérez-Estrada, L.; Garcia-Garcia, E.; Pun, J.; Martin, J.W.; Belosevic, M.; Gamal El-Din, M. Impact of Ozonation on Naphthenic Acids Speciation and Toxicity of Oil Sands Process-Affected Water toVibrio fischeriand Mammalian Immune System. Environ. Sci. Technol. 2013, 47, 6518–6526. [Google Scholar] [CrossRef] [PubMed]
- Foght, J.M.; Gieg, L.M.; Siddique, T. The microbiology of oil sands tailings: Past, present, future. FEMS Microbiol. Ecol. 2017, 93, 1–23. [Google Scholar] [CrossRef] [PubMed] [Green Version]
- Quagraine, E.K.; Peterson, H.G.; Headley, J.V. In Situ Bioremediation of Naphthenic Acids Contaminated Tailing Pond Waters in the Athabasca Oil Sands Region—Demonstrated Field Studies and Plausible Options: A Review. J. Environ. Sci. Health Part A 2005, 40, 685–722. [Google Scholar] [CrossRef] [PubMed]
- Sutton, N.B.; Grotenhuis, J.T.C.; Langenhoff, A.A.M.; Rijnaarts, H.H.M. Efforts to improve coupled in situ chemical oxidation with bioremediation: A review of optimization strategies. J. Soils Sedim. 2011, 11, 129–140. [Google Scholar] [CrossRef] [Green Version]
- Munakata-Marr, J.; Sorenson, K.S.; Petri, B.G.; Cummings, J.B. Principles of Combining ISCO with Other In Situ Remedial Approaches. In In Situ Chemical Oxidation for Groundwater Remediation; Siegrist, R.L., Crimi, M., Simpkin, T.J., Eds.; Springer: New York, NY, USA, 2011; pp. 285–317. [Google Scholar] [CrossRef]
- Martin, J.W.; Barri, T.; Han, X.; Fedorak, P.M.; El-Din, M.G.; Perez, L.; Scott, A.C.; Jiang, J.T. Ozonation of Oil Sands Process-Affected Water Accelerates Microbial Bioremediation. Environ. Sci. Technol. 2010, 44, 8350–8356. [Google Scholar] [CrossRef] [PubMed]
- Hwang, G.; Dong, T.; Islam, M.S.; Sheng, Z.; Pérez-Estrada, L.A.; Liu, Y.; Gamal El-Din, M. The impacts of ozonation on oil sands process-affected water biodegradability and biofilm formation characteristics in bioreactors. Bioresour. Technol. 2013, 130, 269–277. [Google Scholar] [CrossRef] [PubMed]
- Islam, M.S.; Dong, T.; McPhedran, K.N.; Sheng, Z.; Zhang, Y.; Liu, Y.; Gamal El-Din, M. Impact of ozonation pre-treatment of oil sands process-affected water on the operational performance of a GAC-fluidized bed biofilm reactor. Biogeochemistry 2014, 25, 811–823. [Google Scholar] [CrossRef]
- Huang, C.; Shi, Y.; Gamal El-Din, M.; Liu, Y. Treatment of oil sands process-affected water (OSPW) using ozonation combined with integrated fixed-film activated sludge (IFAS). Water Res. 2015, 85, 167–176. [Google Scholar] [CrossRef]
- Shi, Y.; Huang, C.; Rocha, K.C.; El-Din, M.G.; Liu, Y. Treatment of oil sands process-affected water using moving bed biofilm reactors: With and without ozone pretreatment. Bioresour. Technol. 2015, 192, 219–227. [Google Scholar] [CrossRef]
- Zhang, Y.; Xue, J.; Liu, Y.; Gamal El-Din, M. Treatment of oil sands process-affected water using membrane bioreactor coupled with ozonation: A comparative study. Chem. Eng. J. 2016, 302, 485–497. [Google Scholar] [CrossRef]
- Zhang, Y.; Xue, J.; Liu, Y.; Gamal El-Din, M. The role of ozone pretreatment on optimization of membrane bioreactor for treatment of oil sands process-affected water. J. Hazard. Mater. 2018, 347, 470–477. [Google Scholar] [CrossRef]
- Zhang, L.; Zhang, Y.; Gamal El-Din, M. Degradation of recalcitrant naphthenic acids from raw and ozonated oil sands process-affected waters by a semi-passive biofiltration process. Water Res. 2018, 133, 310–318. [Google Scholar] [CrossRef]
- Zhang, L.; Zhang, Y.; Gamal El-Din, M. Integrated mild ozonation with biofiltration can effectively enhance the removal of naphthenic acids from hydrocarbon-contaminated water. Sci. Total Environ. 2019, 678, 197–206. [Google Scholar] [CrossRef]
- Vaiopoulou, E.; Misiti, T.M.; Pavlostathis, S.G. Removal and toxicity reduction of naphthenic acids by ozonation and combined ozonation-aerobic biodegradation. Bioresour. Technol. 2015, 179, 339–347. [Google Scholar] [CrossRef]
- Dong, T.; Zhang, Y.; Islam, M.S.; Liu, Y.; Gamal El-Din, M. The impact of various ozone pretreatment doses on the performance of endogenous microbial communities for the remediation of oil sands process-affected water. Int. Biodeterior. Biodegrad. 2015, 100, 17–28. [Google Scholar] [CrossRef]
- Xue, J.; Zhang, Y.; Liu, Y.; Gamal El-Din, M. Treatment of raw and ozonated oil sands process-affected water under decoupled denitrifying anoxic and nitrifying aerobic conditions: A comparative study. Biogeochemistry 2016, 27, 247–264. [Google Scholar] [CrossRef]
- Brown, L.D.; Pérez-Estrada, L.; Wang, N.; El-Din, M.G.; Martin, J.W.; Fedorak, P.M.; Ulrich, A.C. Indigenous microbes survive in situ ozonation improving biodegradation of dissolved organic matter in aged oil sands process-affected waters. Chemosphere 2013, 93, 2748–2755. [Google Scholar] [CrossRef] [PubMed]
- Valderrama, C.; Alessandri, R.; Aunola, T.; Cortina, J.L.; Gamisans, X.; Tuhkanen, T. Oxidation by Fenton’s reagent combined with biological treatment applied to a creosote-comtaminated soil. J. Hazard. Mater. 2009, 166, 594–602. [Google Scholar] [CrossRef] [PubMed]
- Xie, G.; Barcelona, M.J. Sequential Chemical Oxidation and Aerobic Biodegradation of Equivalent Carbon Number-Based Hydrocarbon Fractions in Jet Fuel. Environ. Sci. Technol. 2003, 37, 4751–4760. [Google Scholar] [CrossRef]
- Cassidy, D.; Northup, A.; Hampton, D. The effect of three chemical oxidants on subsequent biodegradation of 2,4-dinitrotoluene (DNT) in batch slurry reactors. J. Chem. Technol. Biotechnol. 2009, 84, 820–826. [Google Scholar] [CrossRef]
- Jung, H.; Ahn, Y.; Choi, H.; Kim, I.S. Effects of in-situ ozonation on indigenous microorganisms in diesel contaminated soil: Survival and regrowth. Chemosphere 2005, 61, 923–932. [Google Scholar] [CrossRef] [PubMed]
- Tsitonaki, A.; Petri, B.; Crimi, M.; Mosbæk, H.; Siegrist, R.L.; Bjerg, P.L. In Situ Chemical Oxidation of Contaminated Soil and Groundwater Using Persulfate: A Review. Crit. Rev. Environ. Sci. Technol. 2010, 40, 55–91. [Google Scholar] [CrossRef]
- Liao, X.; Wu, Z.; Li, Y.; Luo, J.; Su, C. Enhanced degradation of polycyclic aromatic hydrocarbons by indigenous microbes combined with chemical oxidation. Chemosphere 2018, 213, 551–558. [Google Scholar] [CrossRef]
- Wacławek, S.; Lutze, H.V.; Grübel, K.; Padil, V.V.T.; Černík, M.; Dionysiou, D.D. Chemistry of persulfates in water and wastewater treatment: A review. Chem. Eng. J. 2017, 330, 44–62. [Google Scholar] [CrossRef]
- Drzewicz, P.; Perez-Estrada, L.; Alpatova, A.; Martin, J.W.; Gamal El-Din, M. Impact of Peroxydisulfate in the Presence of Zero Valent Iron on the Oxidation of Cyclohexanoic Acid and Naphthenic Acids from Oil Sands Process-Affected Water. Environ. Sci. Technol. 2012, 46, 8984–8991. [Google Scholar] [CrossRef] [PubMed]
- Liang, C.; Wang, Z.-S.; Mohanty, N. Influences of carbonate and chloride ions on persulfate oxidation of trichloroethylene at 20 °C. Sci. Total Environ. 2006, 370, 271–277. [Google Scholar] [CrossRef]
- Matzek, L.W.; Carter, K.E. Activated persulfate for organic chemical degradation: A review. Chemosphere 2016, 151, 178–188. [Google Scholar] [CrossRef] [PubMed]
- Chen, K.-F.; Chang, Y.-C.; Chiou, W.-T. Remediation of diesel-contaminated soil using in situ chemical oxidation (ISCO) and the effects of common oxidants on the indigenous microbial community: A comparison study. J. Chem. Technol. Biotechnol. 2016, 91, 1877–1888. [Google Scholar] [CrossRef]
- Bajagain, R.; Lee, S.; Jeong, S.-W. Application of persulfate-oxidation foam spraying as a bioremediation pretreatment for diesel oil-contaminated soil. Chemosphere 2018, 207, 565–572. [Google Scholar] [CrossRef]
- Sutton, N.B.; Langenhoff, A.A.M.; Lasso, D.H.; van der Zaan, B.; van Gaans, P.; Maphosa, F.; Smidt, H.; Grotenhuis, T.; Rijnaarts, H.H.M. Recovery of microbial diversity and activity during bioremediation following chemical oxidation of diesel contaminated soils. Appl. Microbiol. Biotechnol. 2014, 98, 2751–2764. [Google Scholar] [CrossRef]
- Mora, V.C.; Madueño, L.; Peluffo, M.; Rosso, J.A.; Del Panno, M.T.; Morelli, I.S. Remediation of phenanthrene-contaminated soil by simultaneous persulfate chemical oxidation and biodegradation processes. Environ. Sci. Pollut. Res. 2014, 21, 7548–7556. [Google Scholar] [CrossRef]
- Liao, X.; Wu, Z.; Li, Y.; Cao, H.; Su, C. Effect of various chemical oxidation reagents on soil indigenous microbial diversity in remediation of soil contaminated by PAHs. Chemosphere 2019, 226, 483–491. [Google Scholar] [CrossRef]
- Medina, R.; Gara, P.M.D.; Fernández-González, A.J.; Rosso, J.A.; Del Panno, M.T. Remediation of a soil chronically contaminated with hydrocarbons through persulfate oxidation and bioremediation. Sci. Total Environ. 2018, 618, 518–530. [Google Scholar] [CrossRef]
- Xu, J.; Deng, X.; Cui, Y.; Kong, F. Impact of chemical oxidation on indigenous bacteria and mobilization of nutrients and subsequent bioremediation of crude oil-contaminated soil. J. Hazard. Mater. 2016, 320, 160–168. [Google Scholar] [CrossRef]
- Shayan, M.; Thomson, N.R.; Aravena, R.; Barker, J.F.; Madsen, E.L.; Marchesi, M.; DeRito, C.M.; Bouchard, D.; Buscheck, T.; Kolhatkar, R.; et al. Integrated Plume Treatment Using Persulfate Coupled with Microbial Sulfate Reduction. Groundw. Monit. Remediat. 2018, 38, 45–61. [Google Scholar] [CrossRef] [Green Version]
- Xiong, W.; Mathies, C.; Bradshaw, K.; Carlson, T.; Tang, K.; Wang, Y. Benzene removal by a novel modification of enhanced anaerobic biostimulation. Water Res. 2012, 46, 4721–4731. [Google Scholar] [CrossRef] [PubMed]
- Bartlett, C.K.; Slawson, R.M.; Thomson, N.R. Response of sulfate-reducing bacteria and supporting microbial community to persulfate exposure in a continuous flow system. Environ. Sci. Process. Impacts 2019, 21, 1193–1203. [Google Scholar] [CrossRef] [PubMed]
- Liang, X.; Zhu, X.; Butler, E.C. Comparison of four advanced oxidation processes for the removal of naphthenic acids from model oil sands process water. J. Hazard. Mater. 2011, 190, 168–176. [Google Scholar] [CrossRef]
- Fang, Z.; Chelme-Ayala, P.; Shi, Q.; Xu, C.; Gamal El-Din, M. Degradation of naphthenic acid model compounds in aqueous solution by UV activated persulfate: Influencing factors, kinetics and reaction mechanisms. Chemosphere 2018, 211, 271–277. [Google Scholar] [CrossRef] [PubMed]
- Fang, Z.; Huang, R.; Chelme-Ayala, P.; Shi, Q.; Xu, C.; Gamal El-Din, M. Comparison of UV/Persulfate and UV/H2O2 for the removal of naphthenic acids and acute toxicity towards Vibrio fischeri from petroleum production process water. Sci. Total Environ. 2019, 694, 133686. [Google Scholar] [CrossRef] [PubMed]
- Fang, Z.; Huang, R.; How, Z.T.; Jiang, B.; Chelme-Ayala, P.; Shi, Q.; Xu, C.; Gamal El-Din, M. Molecular transformation of dissolved organic matter in process water from oil and gas operation during UV/H2O2, UV/chlorine, and UV/persulfate processes. Sci. Total Environ. 2020, 730, 139072. [Google Scholar] [CrossRef] [PubMed]
- Xu, X.; Pliego, G.; Zazo, J.A.; Casas, J.A.; Rodriguez, J.J. Mineralization of naphtenic acids with thermally-activated persulfate: The important role of oxygen. J. Hazard. Mater. 2016, 318, 355–362. [Google Scholar] [CrossRef]
- Xu, X.; Pliego, G.; Zazo, J.A.; Liu, S.; Casas, J.A.; Rodriguez, J.J. Two-step persulfate and Fenton oxidation of naphthenic acids in water. J. Chem. Technol. Biotechnol. 2018, 93, 2262–2270. [Google Scholar] [CrossRef] [Green Version]
- Xu, X.; Pliego, G.; Alonso, C.; Liu, S.; Nozal, L.; Rodriguez, J.J. Reaction pathways of heat-activated persulfate oxidation of naphthenic acids in the presence and absence of dissolved oxygen in water. Chem. Eng. J. 2019, 370, 695–705. [Google Scholar] [CrossRef]
- Aher, A.; Papp, J.; Colburn, A.; Wan, H.; Hatakeyama, E.; Prakash, P.; Weaver, B.; Bhattacharyya, D. Naphthenic acids removal from high TDS produced water by persulfate mediated iron oxide functionalized catalytic membrane, and by nanofiltration. Chem. Eng. J. 2017, 327, 573–583. [Google Scholar] [CrossRef]
- Sohrabi, V.; Ross, M.S.; Martin, J.W.; Barker, J.F. Potential for in situ chemical oxidation of acid extractable organics in oil sands process affected groundwater. Chemosphere 2013, 93, 2698–2703. [Google Scholar] [CrossRef]
- Bartlett, A.J.; Frank, R.A.; Gillis, P.L.; Parrott, J.L.; Marentette, J.R.; Brown, L.R.; Hooey, T.; Vanderveen, R.; McInnis, R.; Brunswick, P.; et al. Toxicity of naphthenic acids to invertebrates: Extracts from oil sands process-affected water versus commercial mixtures. Environ. Pollut. 2017, 227, 271–279. [Google Scholar] [CrossRef]
- Herman, D.C.; Fedorak, P.M.; MacKinnon, M.D.; Costerton, J.W. Biodegradation of naphthenic acids by microbial populations indigenous to oil sands tailings. Can. J. Microbiol. 1994, 40, 467–477. [Google Scholar] [CrossRef] [PubMed]
- Del Rio, L.F.; Hadwin, A.K.M.; Pinto, L.J.; MacKinnon, M.D.; Moore, M.M. Degradation of naphthenic acids by sediment micro-organisms. J. Appl. Microbiol. 2006, 101, 1049–1061. [Google Scholar] [CrossRef] [PubMed]
- Foght, J.M.; Westlake, D.W.S. Transposon and spontaneous deletion mutants of plasmid-borne genes encoding polycyclic aromatic hydrocarbon degradation by a strain of Pseudomonas fluorescens. Biogeochemistry 1996, 7, 353–366. [Google Scholar] [CrossRef]
- Foght, J.M.; Westlake, D.W.S. Cross hybridization of plasmid and genomic DNA from aromatic and polycyclic aromatic hydrocarbon degrading bacteria. Can. J. Microbiol. 1991, 37, 924–932. [Google Scholar] [CrossRef]
- Jivraj, M.; Mackinnon, M.; Fung, B. Naphthenic Acid Extraction and Quantitative Analysis with FT-IR Spectroscopy; Syncrude Anallytical Methods Manual; Syncrude Research Department: Edmonton, AB, Canada, 1995. [Google Scholar]
- Scott, A.C.; Young, R.F.; Fedorak, P.M. Comparison of GC–MS and FTIR methods for quantifying naphthenic acids in water samples. Chemosphere 2008, 73, 1258–1264. [Google Scholar] [CrossRef]
- Liang, C.; Huang, C.-F.; Mohanty, N.; Kurakalva, R.M. A rapid spectrophotometric determination of persulfate anion in ISCO. Chemosphere 2008, 73, 1540–1543. [Google Scholar] [CrossRef]
- Zelver, N.; Hamilton, M.; Putts, B.; Goeres, D.; Walker, D.; Struman, P.; Heersink, J. Measuring Antimi-crobial Effects on Biofilm Bacteria: From Laboratory to Field. In Methods in Enzymology; Academic Press: New York, NY, USA, 1999; Volume 310, pp. 608–628. [Google Scholar]
- Hughes, S.A.; Mahaffey, A.; Shore, B.; Baker, J.; Kilgour, B.; Brown, C.; Peru, K.M.; Headley, J.V.; Bailey, H.C. Using ultrahigh-resolution mass spectrometry and toxicity identification techniques to characterize the toxicity of oil sands process-affected water: The case for classical naphthenic acids. Environ. Toxicol. Chem. 2017, 36, 3148–3157. [Google Scholar] [CrossRef]
- Miles, S.M.; Asiedu, E.; Balaberda, A.-L.; Ulrich, A.C. Oil sands process affected water sourced Trichoderma harzianum demonstrates capacity for mycoremediation of naphthenic acid fraction compounds. Chemosphere 2020, 258, 127281. [Google Scholar] [CrossRef] [PubMed]
- Ripmeester, M.J.; Duford, D.A. Method for routine “naphthenic acids fraction compounds” determination in oil sands process-affected water by liquid-liquid extraction in dichloromethane and Fourier-Transform Infrared Spectroscopy. Chemosphere 2019, 233, 687–696. [Google Scholar] [CrossRef] [PubMed]
- Demeter, M.A.; Lemire, J.A.; Eyue, G.; Eceri, H.; Turner, R.J. Culturing oil sands microbes as mixed species communities enhances ex situ model naphthenic acid degradation. Front. Microbiol. 2015, 6, 936. [Google Scholar] [CrossRef] [PubMed]
- Kinley, C.M.; Gaspari, D.P.; McQueen, A.D.; Rodgers, J.H.; Castle, J.W.; Friesen, V.; Haakensen, M. Effects of environmental conditions on aerobic degradation of a commercial naphthenic acid. Chemosphere 2016, 161, 491–500. [Google Scholar] [CrossRef]
- Lai, J.W.S.; Pinto, L.J.; Bendell-Young, L.I.; Moore, M.M.; Kiehlmann, E. Factors that affect the degradation of naphthenic acids in oil sands wastewater by indigenous microbial communities. Environ. Toxicol. Chem. 1996, 15, 1482–1491. [Google Scholar] [CrossRef]
- Herman, D.C.; Fedorak, P.M.; Costerton, J.W. Biodegradation of cycloalkane carboxylic acids in oil sand tailings. Can. J. Microbiol. 1993, 39, 576–580. [Google Scholar] [CrossRef] [PubMed]
- Han, X.; MacKinnon, M.D.; Martin, J.W. Estimating the in situ biodegradation of naphthenic acids in oil sands process waters by HPLC/HRMS. Chemosphere 2009, 76, 63–70. [Google Scholar] [CrossRef] [PubMed]
- Moore, E.R.B.; Tindall, B.J.; Martins Dos Santos, V.A.P.; Pieper, D.H.; Ramos, J.-L.; Palleroni, N.J. Nonmedical: Pseudomonas. In The Prokaryotes: A Handbook on the Biology of Bacteria Volume 6: Proteobacteria: Gamma Subclass; Dworkin, M., Falkow, S., Rosenberg, E., Schleifer, K.-H., Stackebrandt, E., Eds.; Springer: New York, NY, USA, 2006; pp. 646–703. [Google Scholar] [CrossRef]
- Petri, B.G.; Watts, R.J.; Tsitonaki, A.; Crimi, M.; Thomson, N.R.; Teel, A.L. Fundamentals of ISCO Using Persulfate. In In Situ Chemical Oxidation for Groundwater Remediation; Siegrist, R.L., Crimi, M., Simpkin, T.J., Eds.; Springer: New York, NY, USA, 2011; pp. 147–191. [Google Scholar] [CrossRef]
- Yen, C.-H.; Chen, K.-F.; Kao, C.-M.; Liang, S.-H.; Chen, T.-Y. Application of persulfate to remediate petroleum hydrocarbon-contaminated soil: Feasibility and comparison with common oxidants. J. Hazard. Mater. 2011, 186, 2097–2102. [Google Scholar] [CrossRef]
- Li, W.; Orozco, R.; Camargos, N.; Liu, H. Mechanisms on the Impacts of Alkalinity, pH, and Chloride on Persulfate-Based Groundwater Remediation. Environ. Sci. Technol. 2017, 51, 3948–3959. [Google Scholar] [CrossRef]
- Mahour, R. Chemical and Biological Oxidation of Naphthenic Acids—Where Stoichiometry, Kinetics and Thermodynamics Meet. Master’s Thesis, University of Alberta, Edmonton, AB, Canada, 2016. [Google Scholar]
- Glaze, W.H. Drinking-water treatment with ozone. Environ. Sci. Technol. 1987, 21, 224–230. [Google Scholar] [CrossRef]
- Paslawski, J.; Nemati, M.; Hill, G.; Headley, J. Biodegradation kinetics oftrans-4-methyl-1-cyclohexane carboxylic acid in continuously stirred tank and immobilized cell bioreactors. J. Chem. Technol. Biotechnol. 2009, 84, 992–1000. [Google Scholar] [CrossRef]
- Xu, S.; Wang, W.; Zhu, L. Enhanced microbial degradation of benzo[a]pyrene by chemical oxidation. Sci. Total Environ. 2019, 653, 1293–1300. [Google Scholar] [CrossRef]
- Tsitonaki, A.; Smets, B.F.; Bjerg, P.L. Effects of heat-activated persulfate oxidation on soil microorganisms. Water Res. 2008, 42, 1013–1022. [Google Scholar] [CrossRef]
- Vattanaviboon, P.; Praituan, W.; Mongkolsuk, S. Growth phase dependent resistance to oxidative stress in a phytopathogen Xanthomonas oryzae pv. oryzae. Can. J. Microbiol. 1995, 41, 1043–1047. [Google Scholar] [CrossRef]
- Izawa, S.; Inoue, Y.; Kimura, A. Importance of catalase in the adaptive response to hydrogen peroxide: Analysis of acatalasaemic Saccharomyces cerevisiae. Biochem. J. 1996, 320, 61–67. [Google Scholar] [CrossRef] [PubMed] [Green Version]
- Díaz-Acosta, A.; Sandoval, M.L.; Delgado-Olivares, L.; Membrillo-Hernández, J. Effect of anaerobic and stationary phase growth conditions on the heat shock and oxidative stress responses in Escherichia coli K-12. Arch. Microbiol. 2006, 185, 429–438. [Google Scholar] [CrossRef] [PubMed]
- Sutton, N.B.; Kalisz, M.; Krupanek, J.; Marek, J.; Grotenhuis, T.; Smidt, H.; De Weert, J.; Rijnaarts, H.H.M.; Van Gaans, P.; Keijzer, T. Geochemical and Microbiological Characteristics during in Situ Chemical Oxidation and in Situ Bioremediation at a Diesel Contaminated Site. Environ. Sci. Technol. 2014, 48, 2352–2360. [Google Scholar] [CrossRef]
- Sutton, N.B.; Atashgahi, S.; Van Der Wal, J.; Wijn, G.; Grotenhuis, T.; Smidt, H.; Rijnaarts, H.H.M. Microbial Dynamics During and After In Situ Chemical Oxidation of Chlorinated Solvents. Groundwater 2015, 53, 261–270. [Google Scholar] [CrossRef] [PubMed]
- Frank, R.A.; Kavanagh, R.; Kent Burnison, B.; Arsenault, G.; Headley, J.V.; Peru, K.M.; Van Der Kraak, G.; Solomon, K.R. Toxicity assessment of collected fractions from an extracted naphthenic acid mixture. Chemosphere 2008, 72, 1309–1314. [Google Scholar] [CrossRef]
- Klopman, G.; Saiakhov, R.; Rosenkranz, H.S.; Hermens, J.L.M. Multiple Computer-Automated structure evaluation program study of aquatic toxicity 1: Guppy. Environ. Toxicol. Chem. 1999, 18, 2497–2505. [Google Scholar] [CrossRef]
- Kannel, P.R.; Gan, T.Y. Naphthenic acids degradation and toxicity mitigation in tailings wastewater systems and aquatic environments: A review. J. Environ. Sci. Health Part A 2012, 47, 1–21. [Google Scholar] [CrossRef] [PubMed]
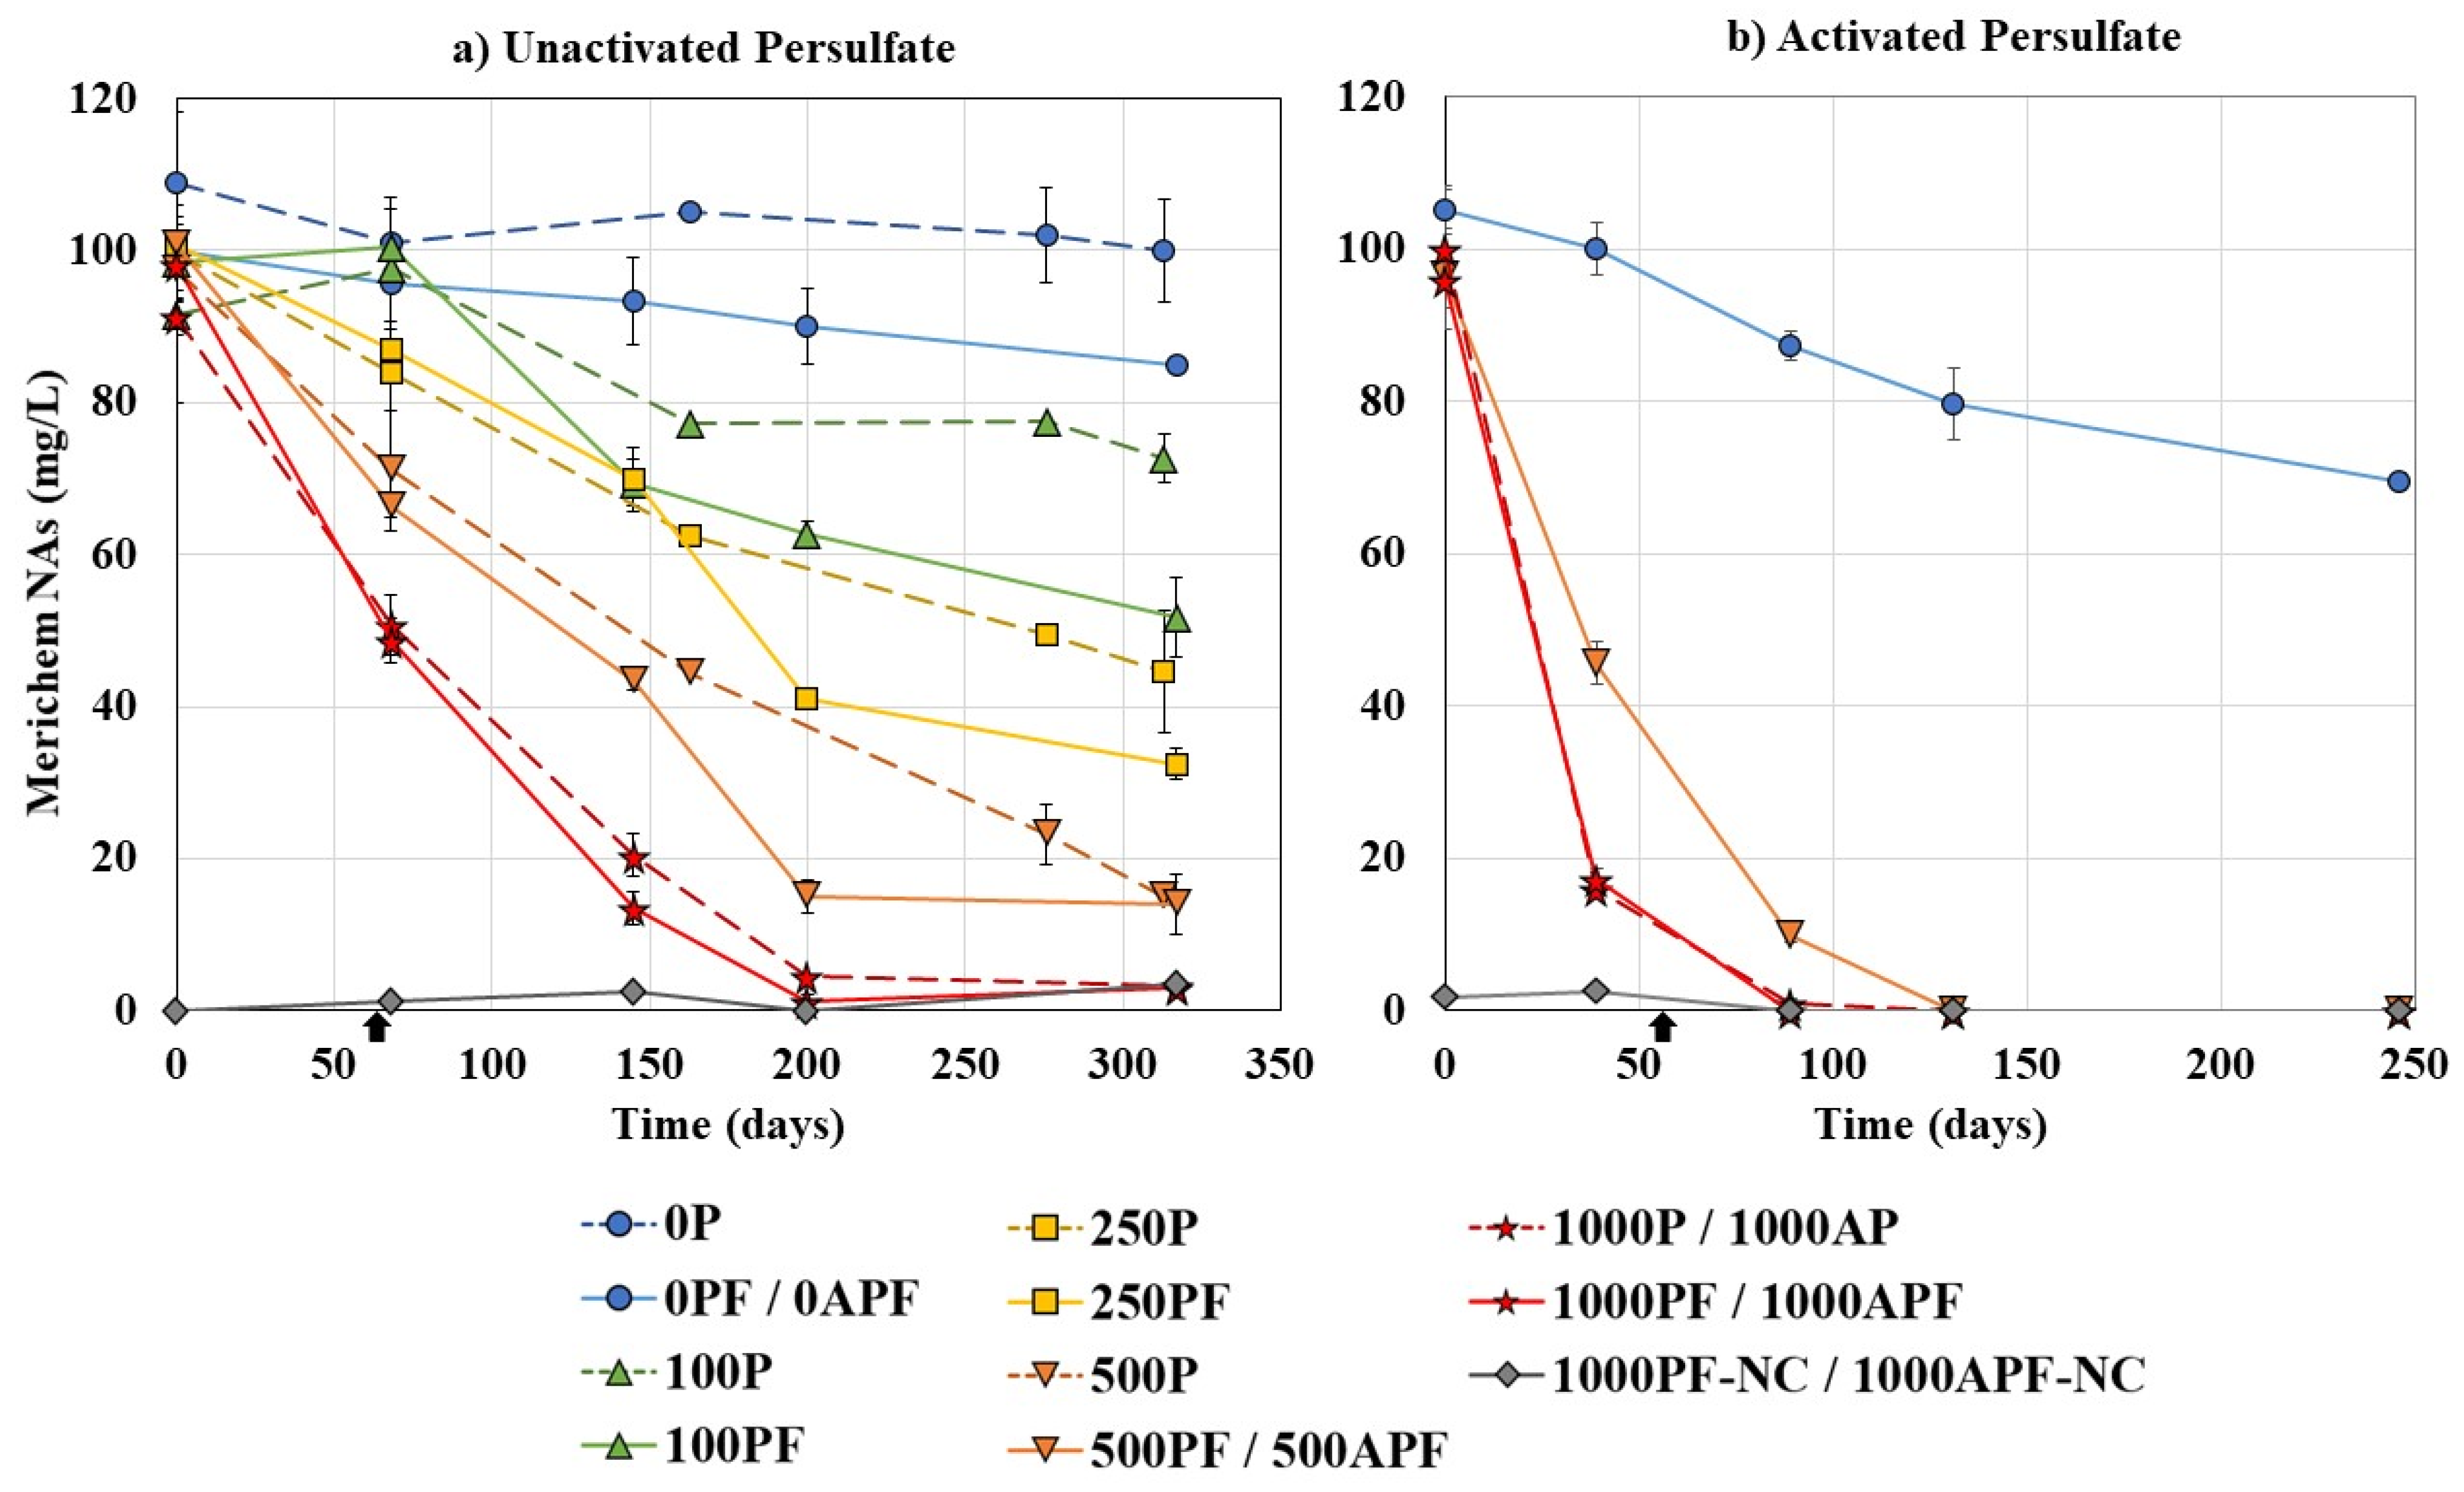
 ), dashed lines represent chemical control bottles. All data points are an average of duplicate or triplicate bottles (Table 1). Error bars represent ±2 standard errors of the averaged value.
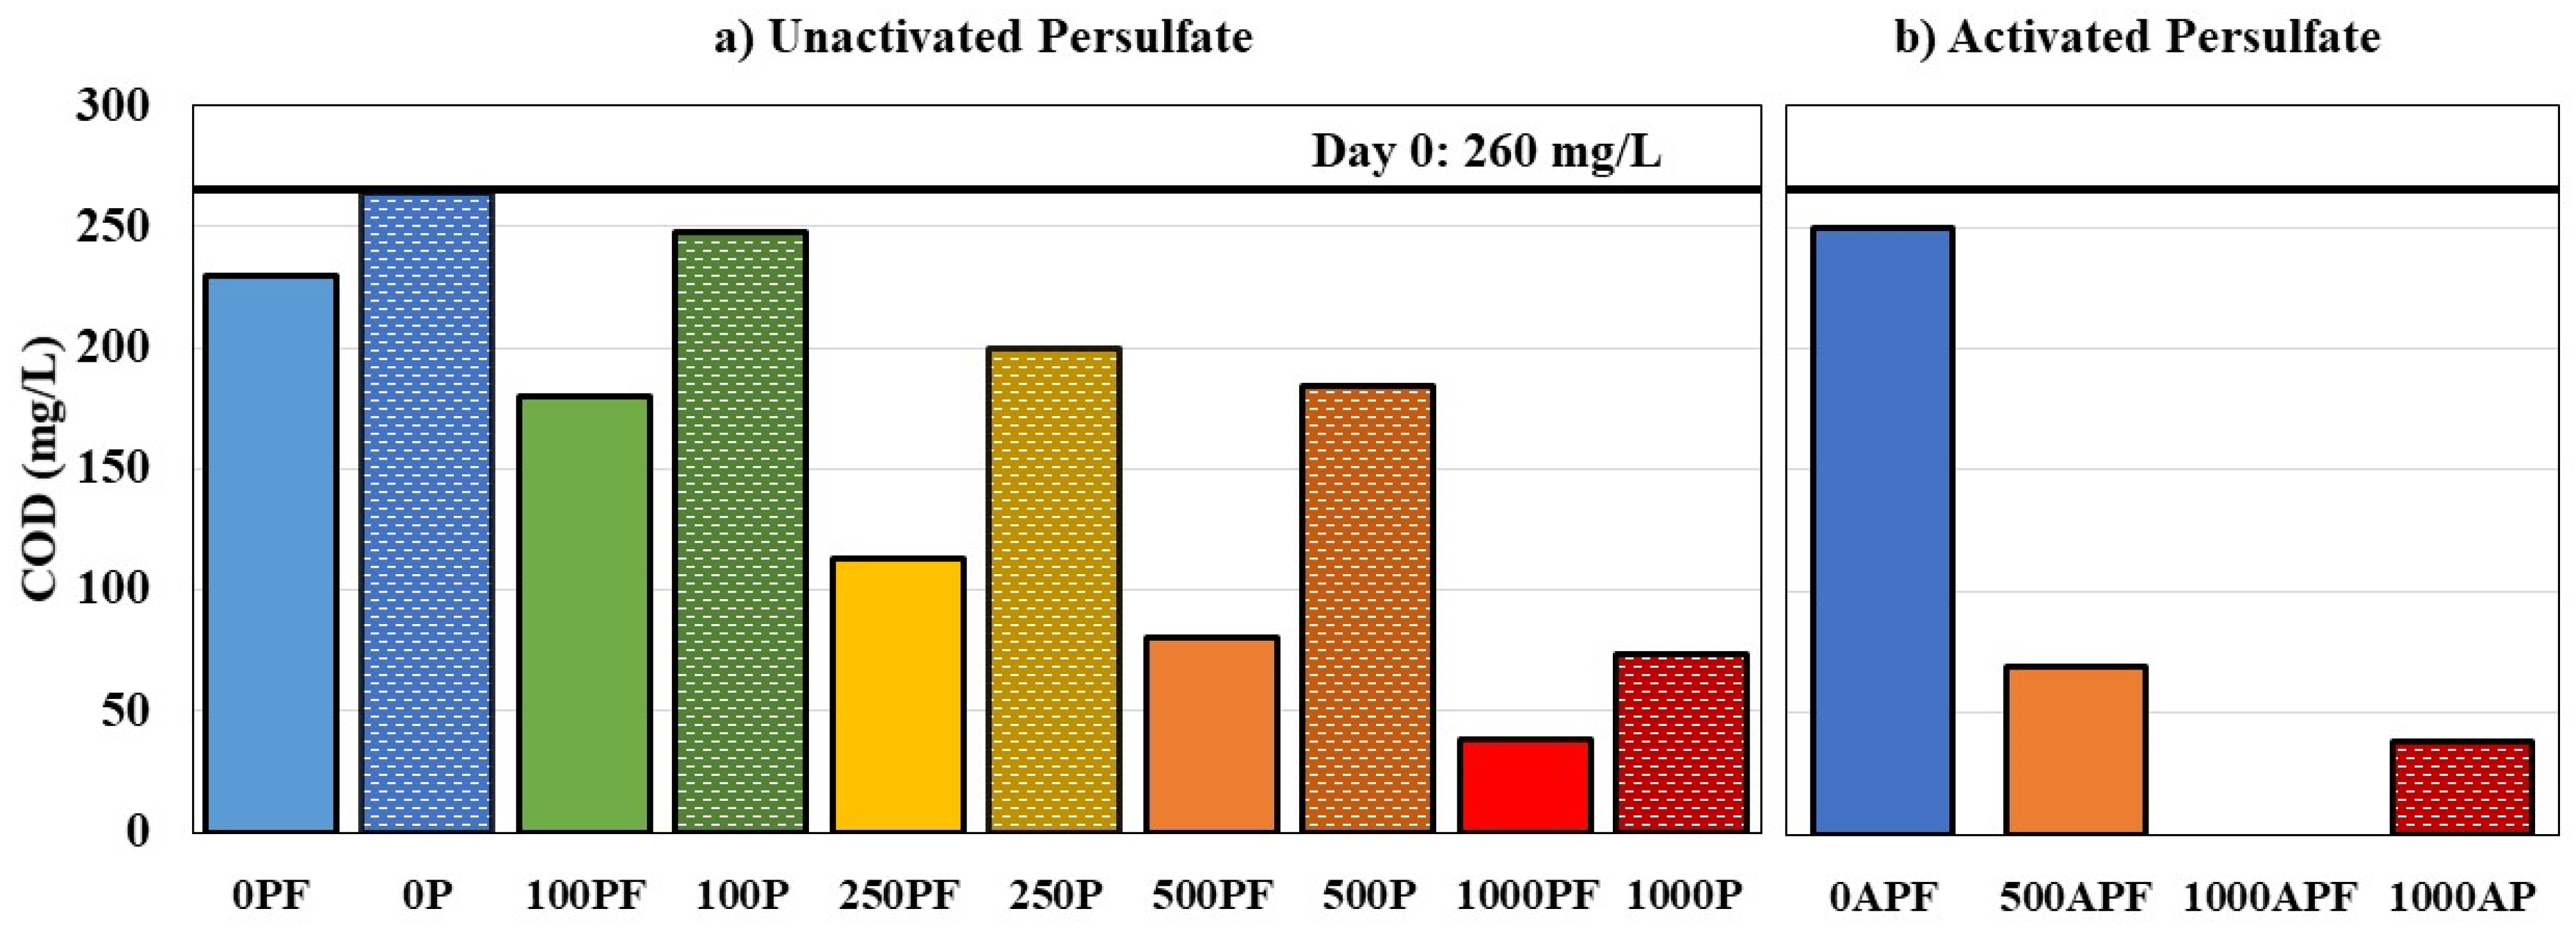
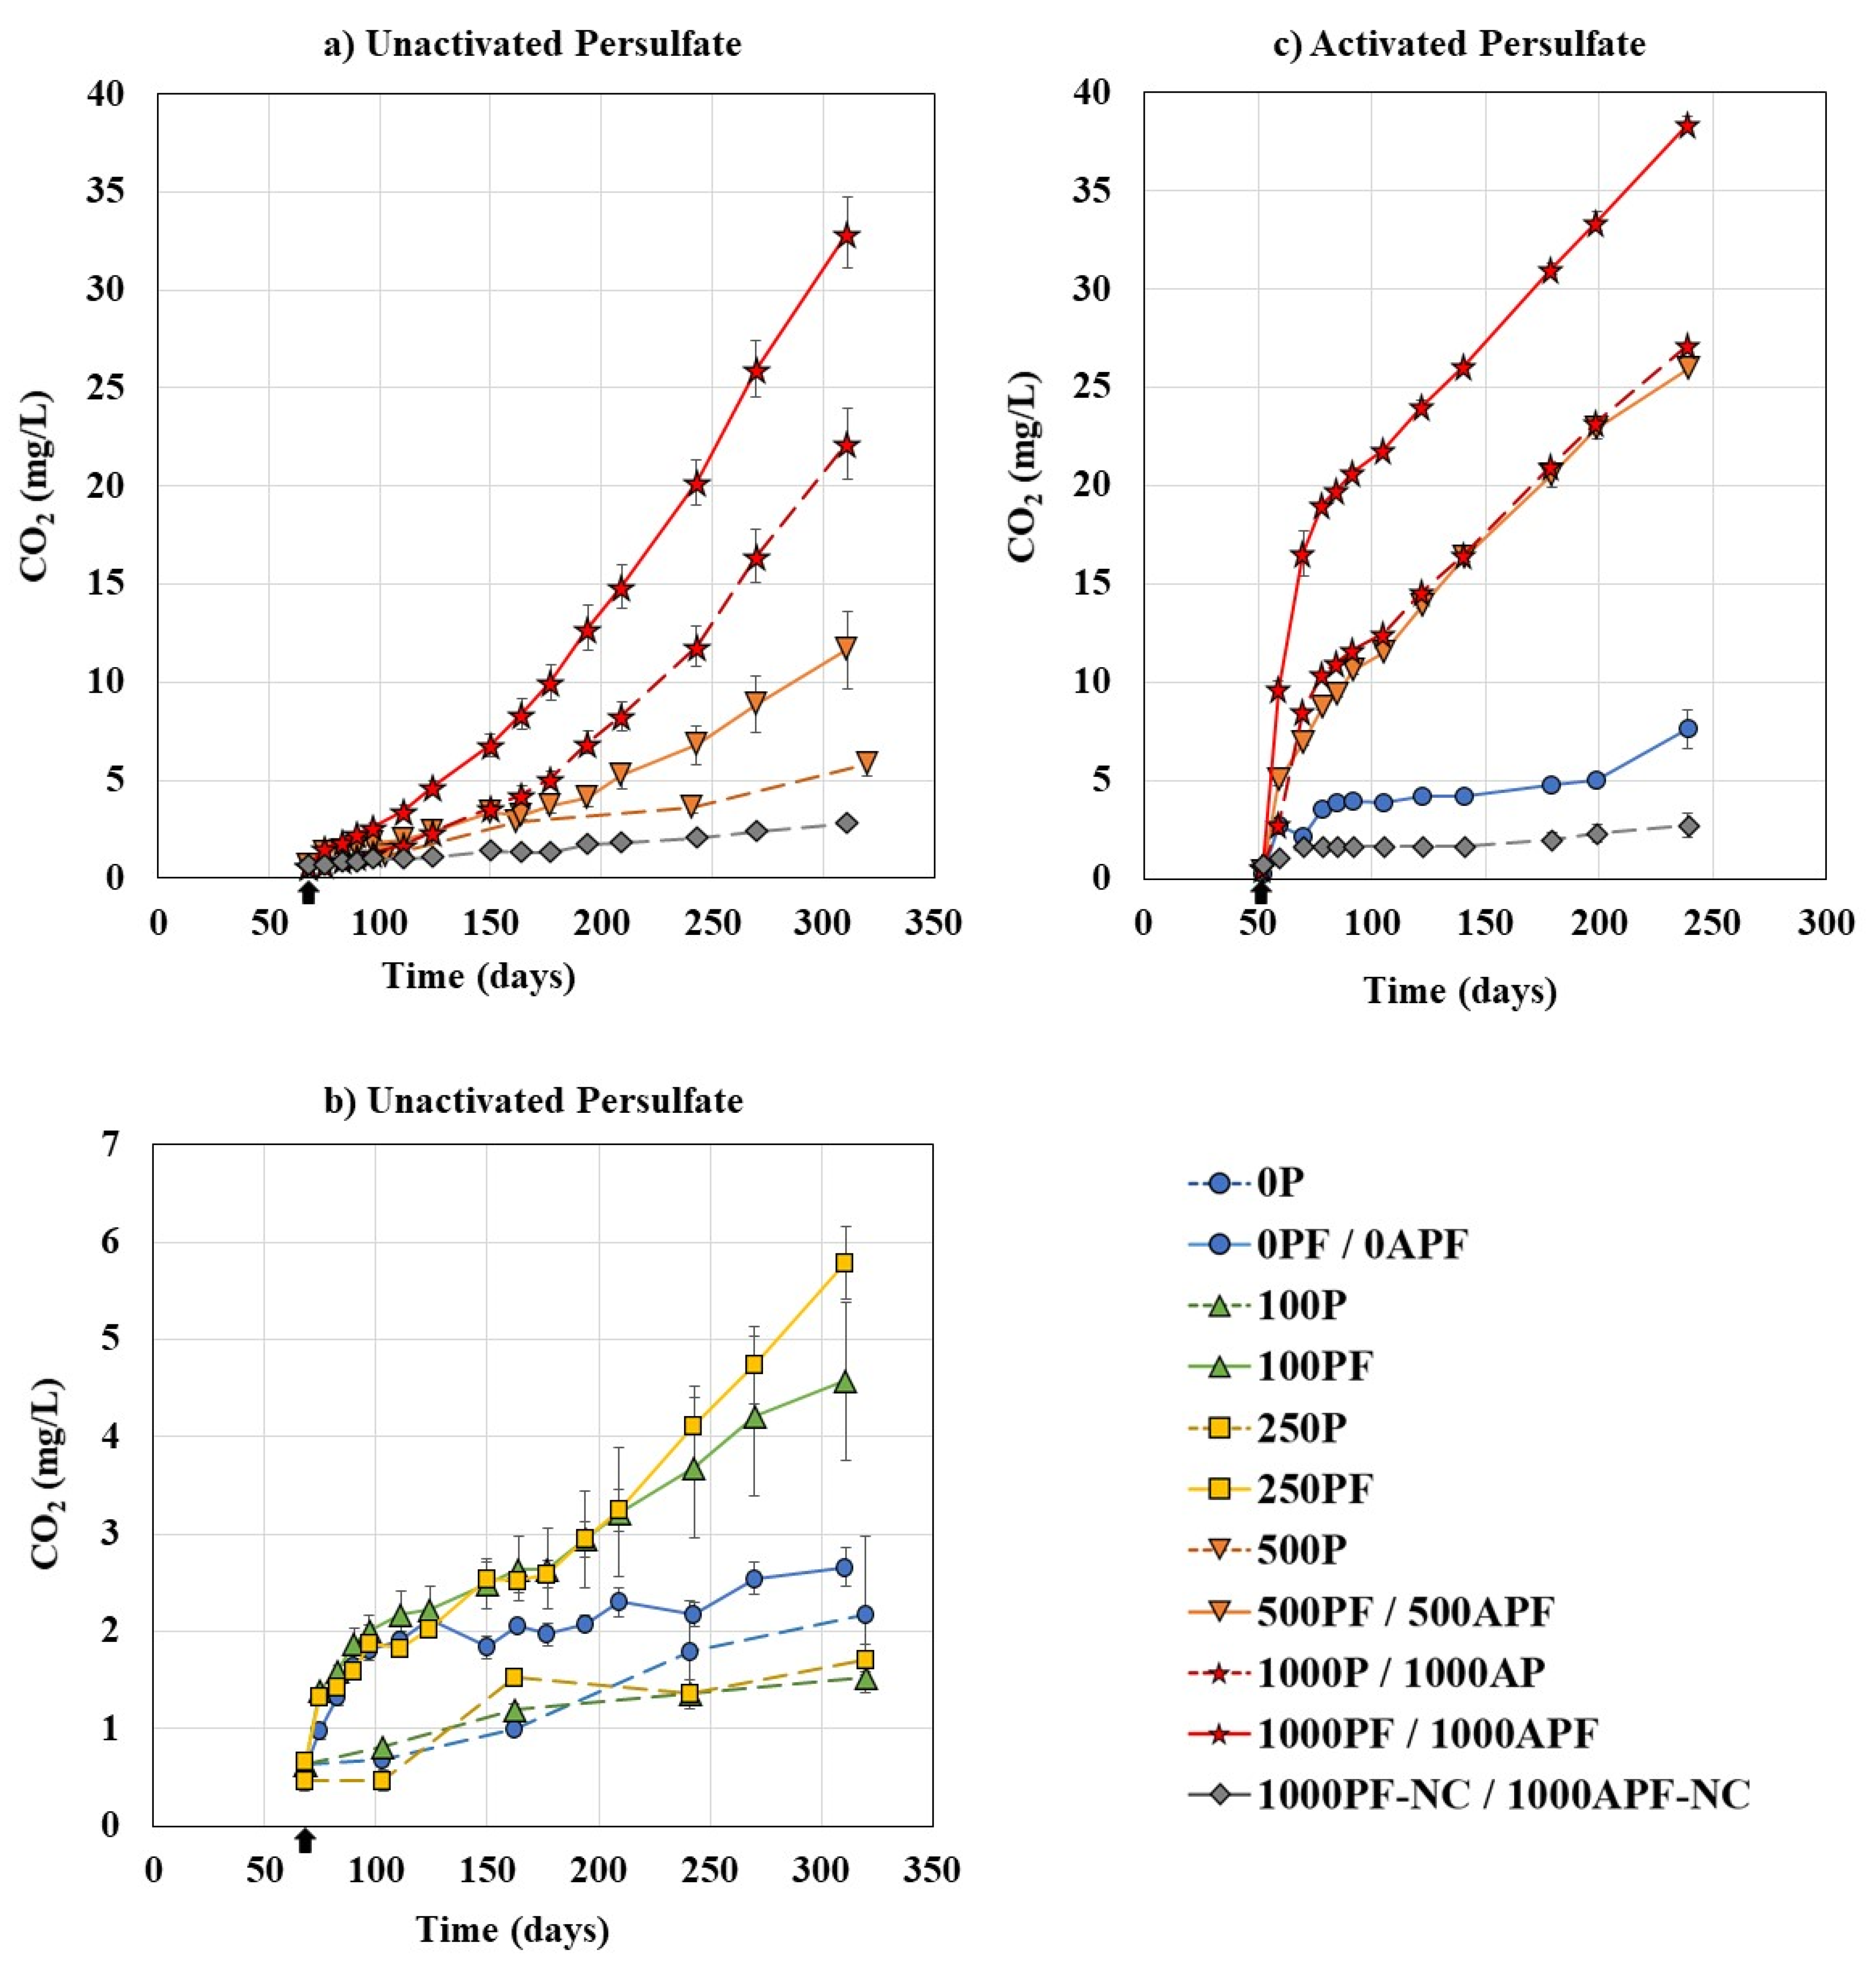
), dashed lines represent chemical control bottles. All data points are an average of duplicate or triplicate bottles (Table 1). Error bars represent ±2 standard errors of the averaged value.
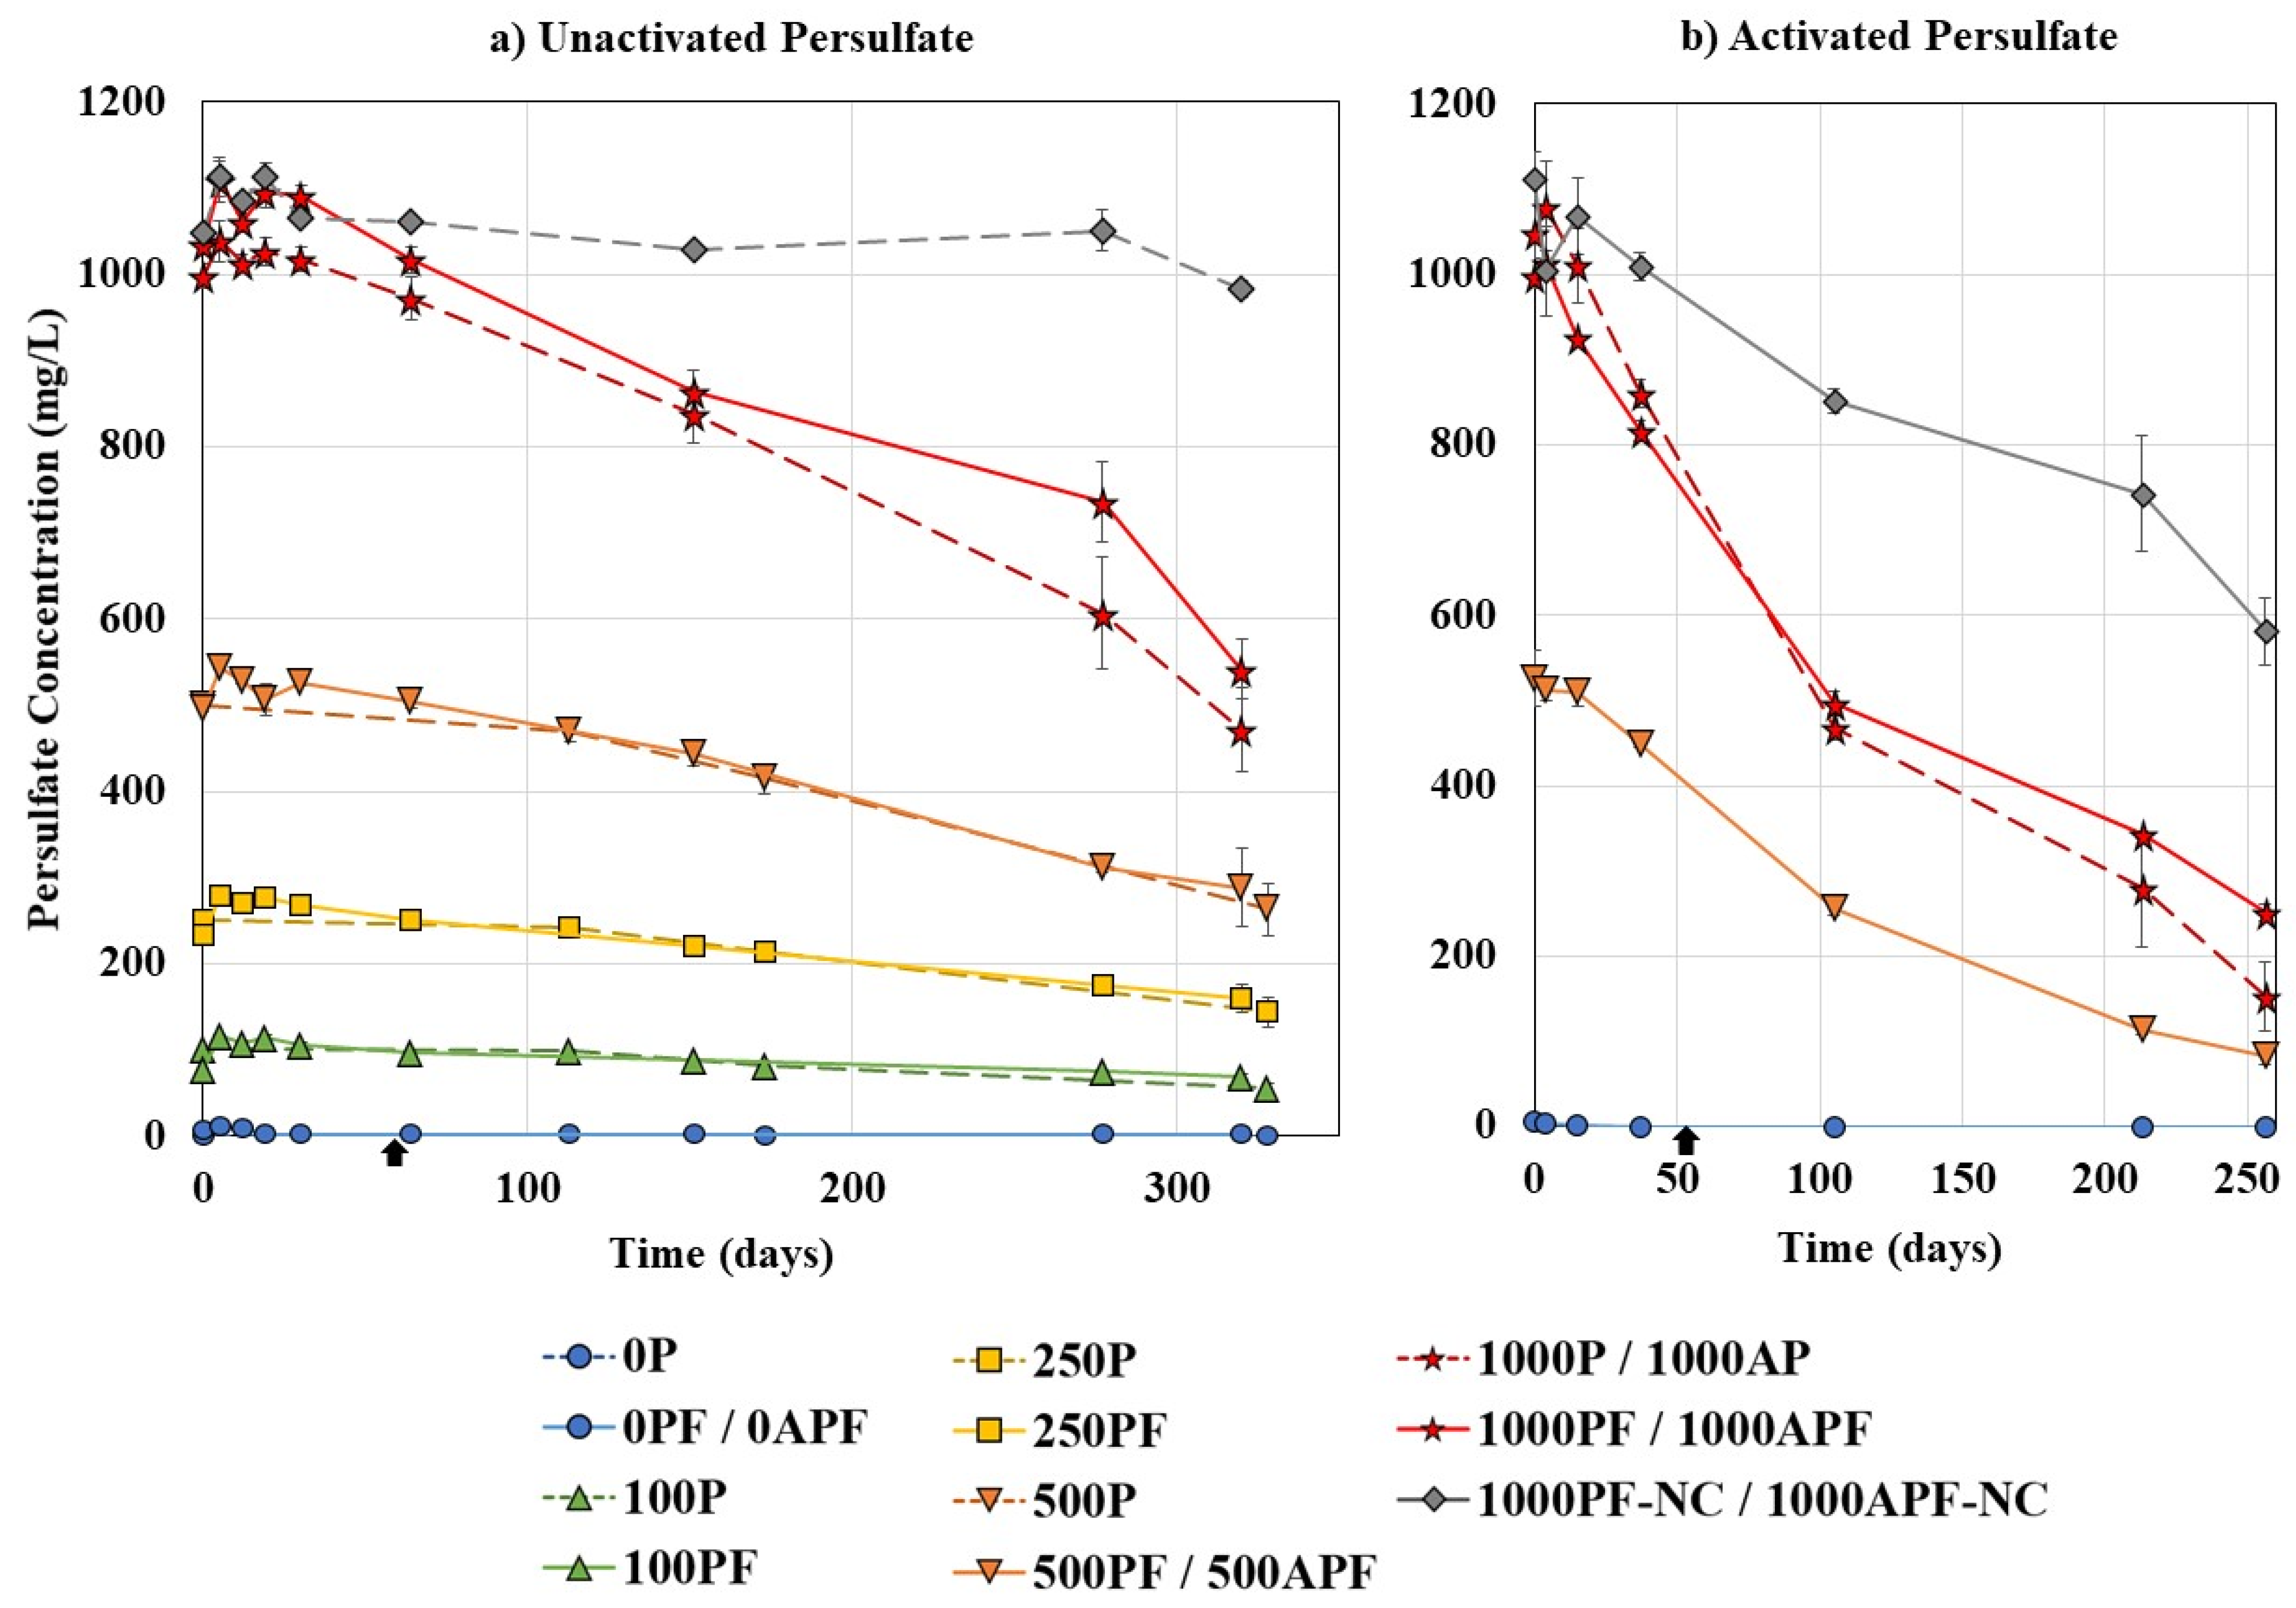
), dashed lines represent chemical control bottles. All data points are an average of duplicate or triplicate bottles (Table 1). Error bars represent ±2 standard errors of the averaged value.

 ), dashed lines represent chemical control bottles. All data points are an average of duplicate or triplicate bottles (Table 1). Error bars represent ±2 standard errors of the averaged value.
), dashed lines represent chemical control bottles. All data points are an average of duplicate or triplicate bottles (Table 1). Error bars represent ±2 standard errors of the averaged value.
), dashed lines represent chemical control bottles. All data points are an average of duplicate or triplicate bottles (Table 1). Error bars represent ±2 standard errors of the averaged value.


| Identification Label | Persulfate (mg/L) | Pseudomonas fluorescens * | Merichem NAs (mg/L) | Temperature (°C) | Replicates |
|---|---|---|---|---|---|
| Unactivated Persulfate | |||||
| 0P (0 mg/L P) | 0 | No | 100 | 21 | 2 |
| 0PF (0 mg/L P + P. fluorescens) | 0 | Yes | 100 | 21 | 3 |
| 100P (100 mg/L P) | 100 | No | 100 | 21 | 2 |
| 100PF (100 mg/L P + P. fluorescens) | 100 | Yes | 100 | 21 | 3 |
| 250P (250 mg/L P) | 250 | No | 100 | 21 | 2 |
| 250PF (250 mg/L P + P. fluorescens) | 250 | Yes | 100 | 21 | 3 |
| 500P (500 mg/L P) | 500 | No | 100 | 21 | 2 |
| 500PF (500 mg/L P + P. fluorescens) | 500 | Yes | 100 | 21 | 3 |
| 1000P (1000 mg/L P) | 1000 | No | 100 | 21 | 2 |
| 1000PF (1000 mg/L P + P. fluorescens) | 1000 | Yes | 100 | 21 | 3 |
| 1000PF-NC (1000 mg/L P + P. fluorescens − No Carbon) | 1000 | Yes | 0 | 21 | 3 |
| Activated Persulfate | |||||
| 0APF (0 mg/L AP + P. fluorescens) | 0 | Yes | 100 | 30 | 3 |
| 500APF (500 mg/L AP + P. fluorescens) | 500 | Yes | 100 | 30 | 3 |
| 1000AP (1000 mg/L AP) | 1000 | No | 100 | 30 | 3 |
| 1000APF (1000 mg/L AP + P. fluorescens) | 1000 | Yes | 100 | 30 | 3 |
| 1000APF-NC (1000 mg/L AP + P. fluorescens − No Carbon) | 1000 | Yes | 0 | 30 | 3 |
| Persulfate Concentration | Day 0 Experiment Start | Day 320 | Day 260 | ||
|---|---|---|---|---|---|
| P | PF | AP | APF | ||
| 0 mg/L | 11.30 | 14.16 | 7.81 | N/A | 6.98 |
| 100 mg/L | 15.01 | 3.83 | 1.99 | N/A | N/A |
| 250 mg/L | 16.13 | 0.97 | 0.40 | N/A | N/A |
| 500 mg/L | 24.81 | 0.66 | 0 | N/A | 0 |
| 1000 mg/L | Too Toxic | 0.02 | 0 | 0 | 0 |
| 1000 mg/L–NC | 0 | 0 | 0 | N/A | 0 |
Publisher’s Note: MDPI stays neutral with regard to jurisdictional claims in published maps and institutional affiliations. |
© 2021 by the authors. Licensee MDPI, Basel, Switzerland. This article is an open access article distributed under the terms and conditions of the Creative Commons Attribution (CC BY) license (https://creativecommons.org/licenses/by/4.0/).
Share and Cite
Balaberda, A.-l.; Ulrich, A.C. Persulfate Oxidation Coupled with Biodegradation by Pseudomonas fluorescens Enhances Naphthenic Acid Remediation and Toxicity Reduction. Microorganisms 2021, 9, 1502. https://0-doi-org.brum.beds.ac.uk/10.3390/microorganisms9071502
Balaberda A-l, Ulrich AC. Persulfate Oxidation Coupled with Biodegradation by Pseudomonas fluorescens Enhances Naphthenic Acid Remediation and Toxicity Reduction. Microorganisms. 2021; 9(7):1502. https://0-doi-org.brum.beds.ac.uk/10.3390/microorganisms9071502
Chicago/Turabian StyleBalaberda, Amy-lynne, and Ania C. Ulrich. 2021. "Persulfate Oxidation Coupled with Biodegradation by Pseudomonas fluorescens Enhances Naphthenic Acid Remediation and Toxicity Reduction" Microorganisms 9, no. 7: 1502. https://0-doi-org.brum.beds.ac.uk/10.3390/microorganisms9071502