
Mussel Mass Mortality and the Microbiome: Evidence for Shifts in the Bacterial Microbiome of a Declining Freshwater Bivalve

 , and
, and 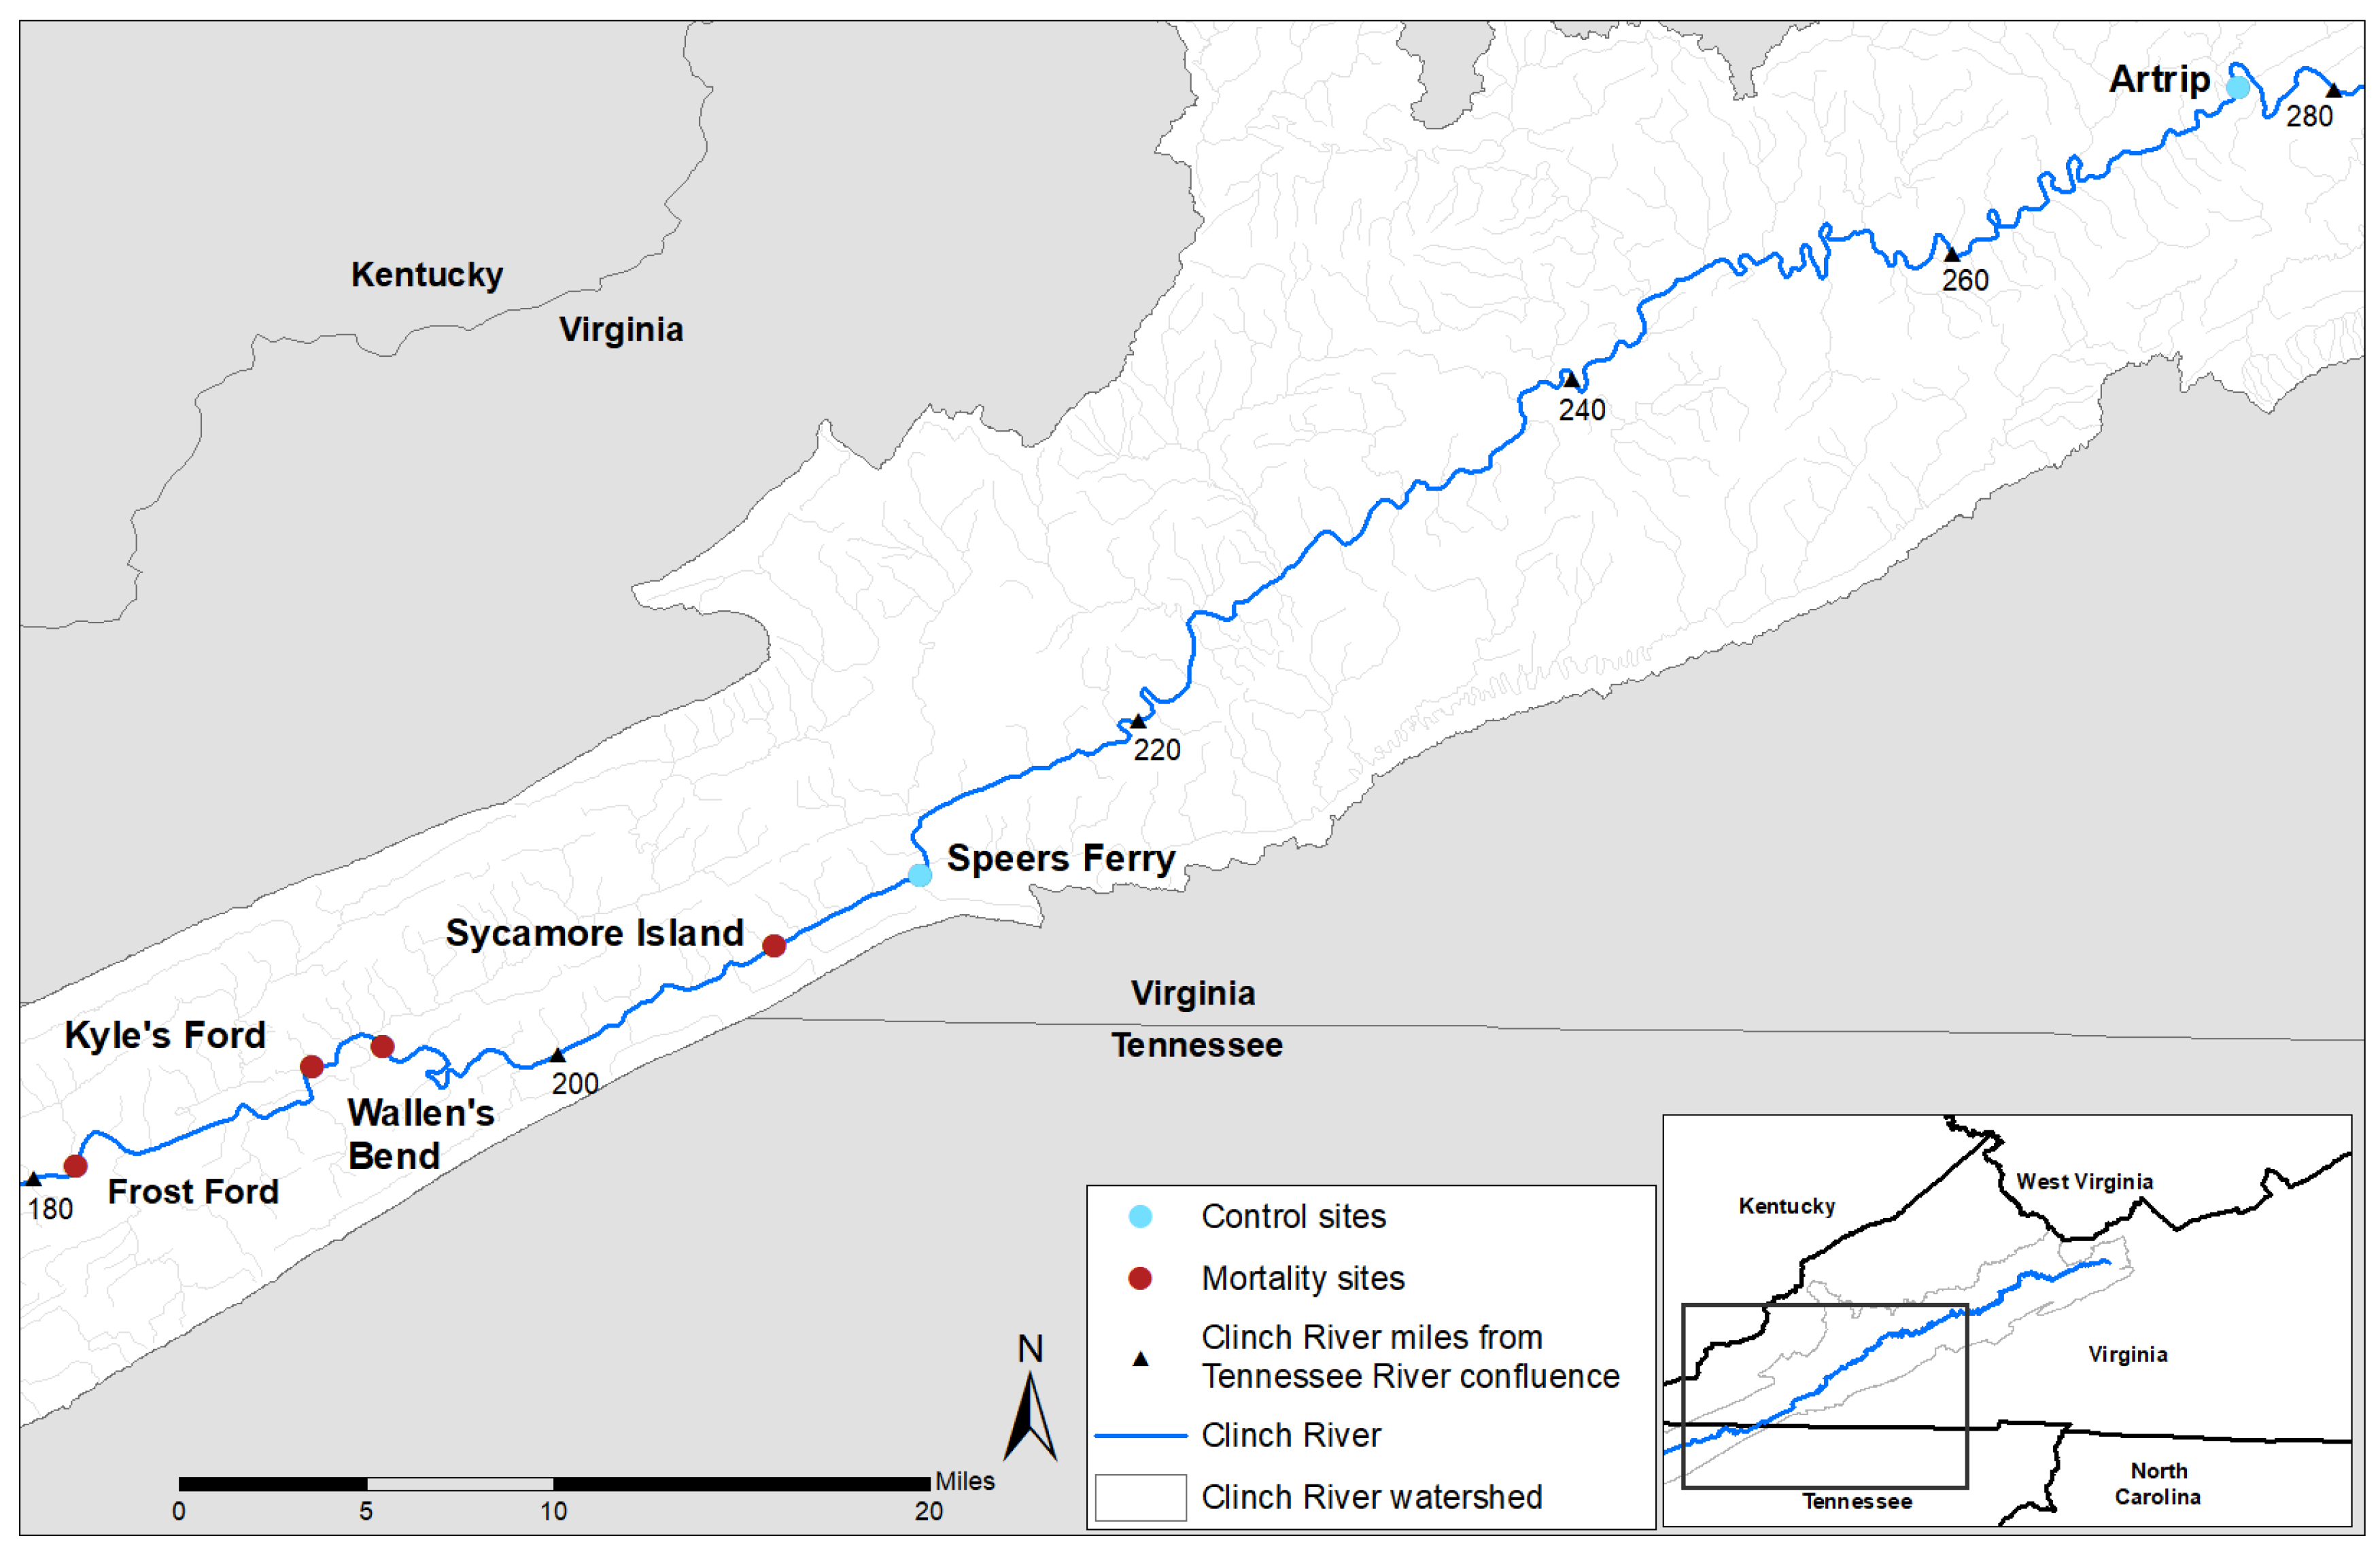
Abstract
:1. Introduction
2. Materials and Methods
2.1. Experimental Design and Field Sampling
2.2. DNA Extraction, PCR, and Sequencing
2.3. Bacterial DNA Quantification
2.4. Bacterial Community Assessment
2.5. Statistical Analysis
3. Results
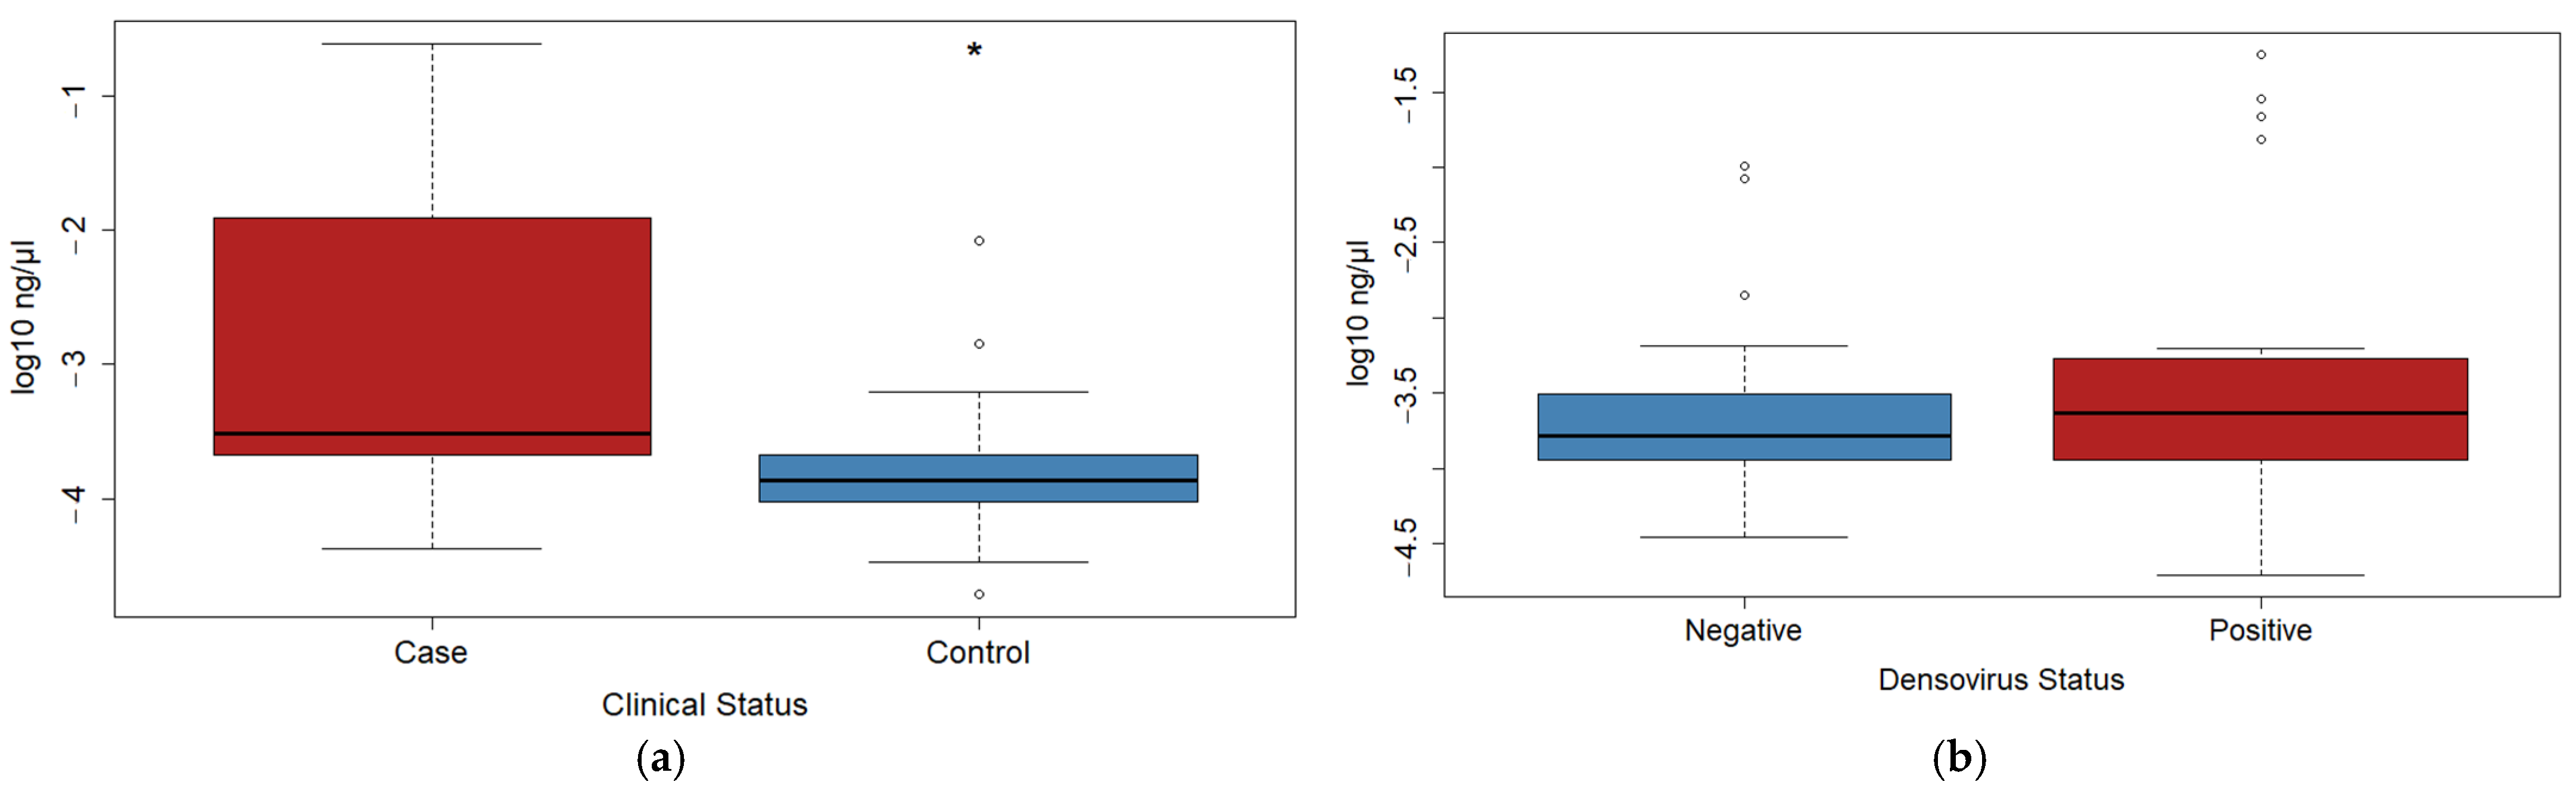
3.1. qPCR Data
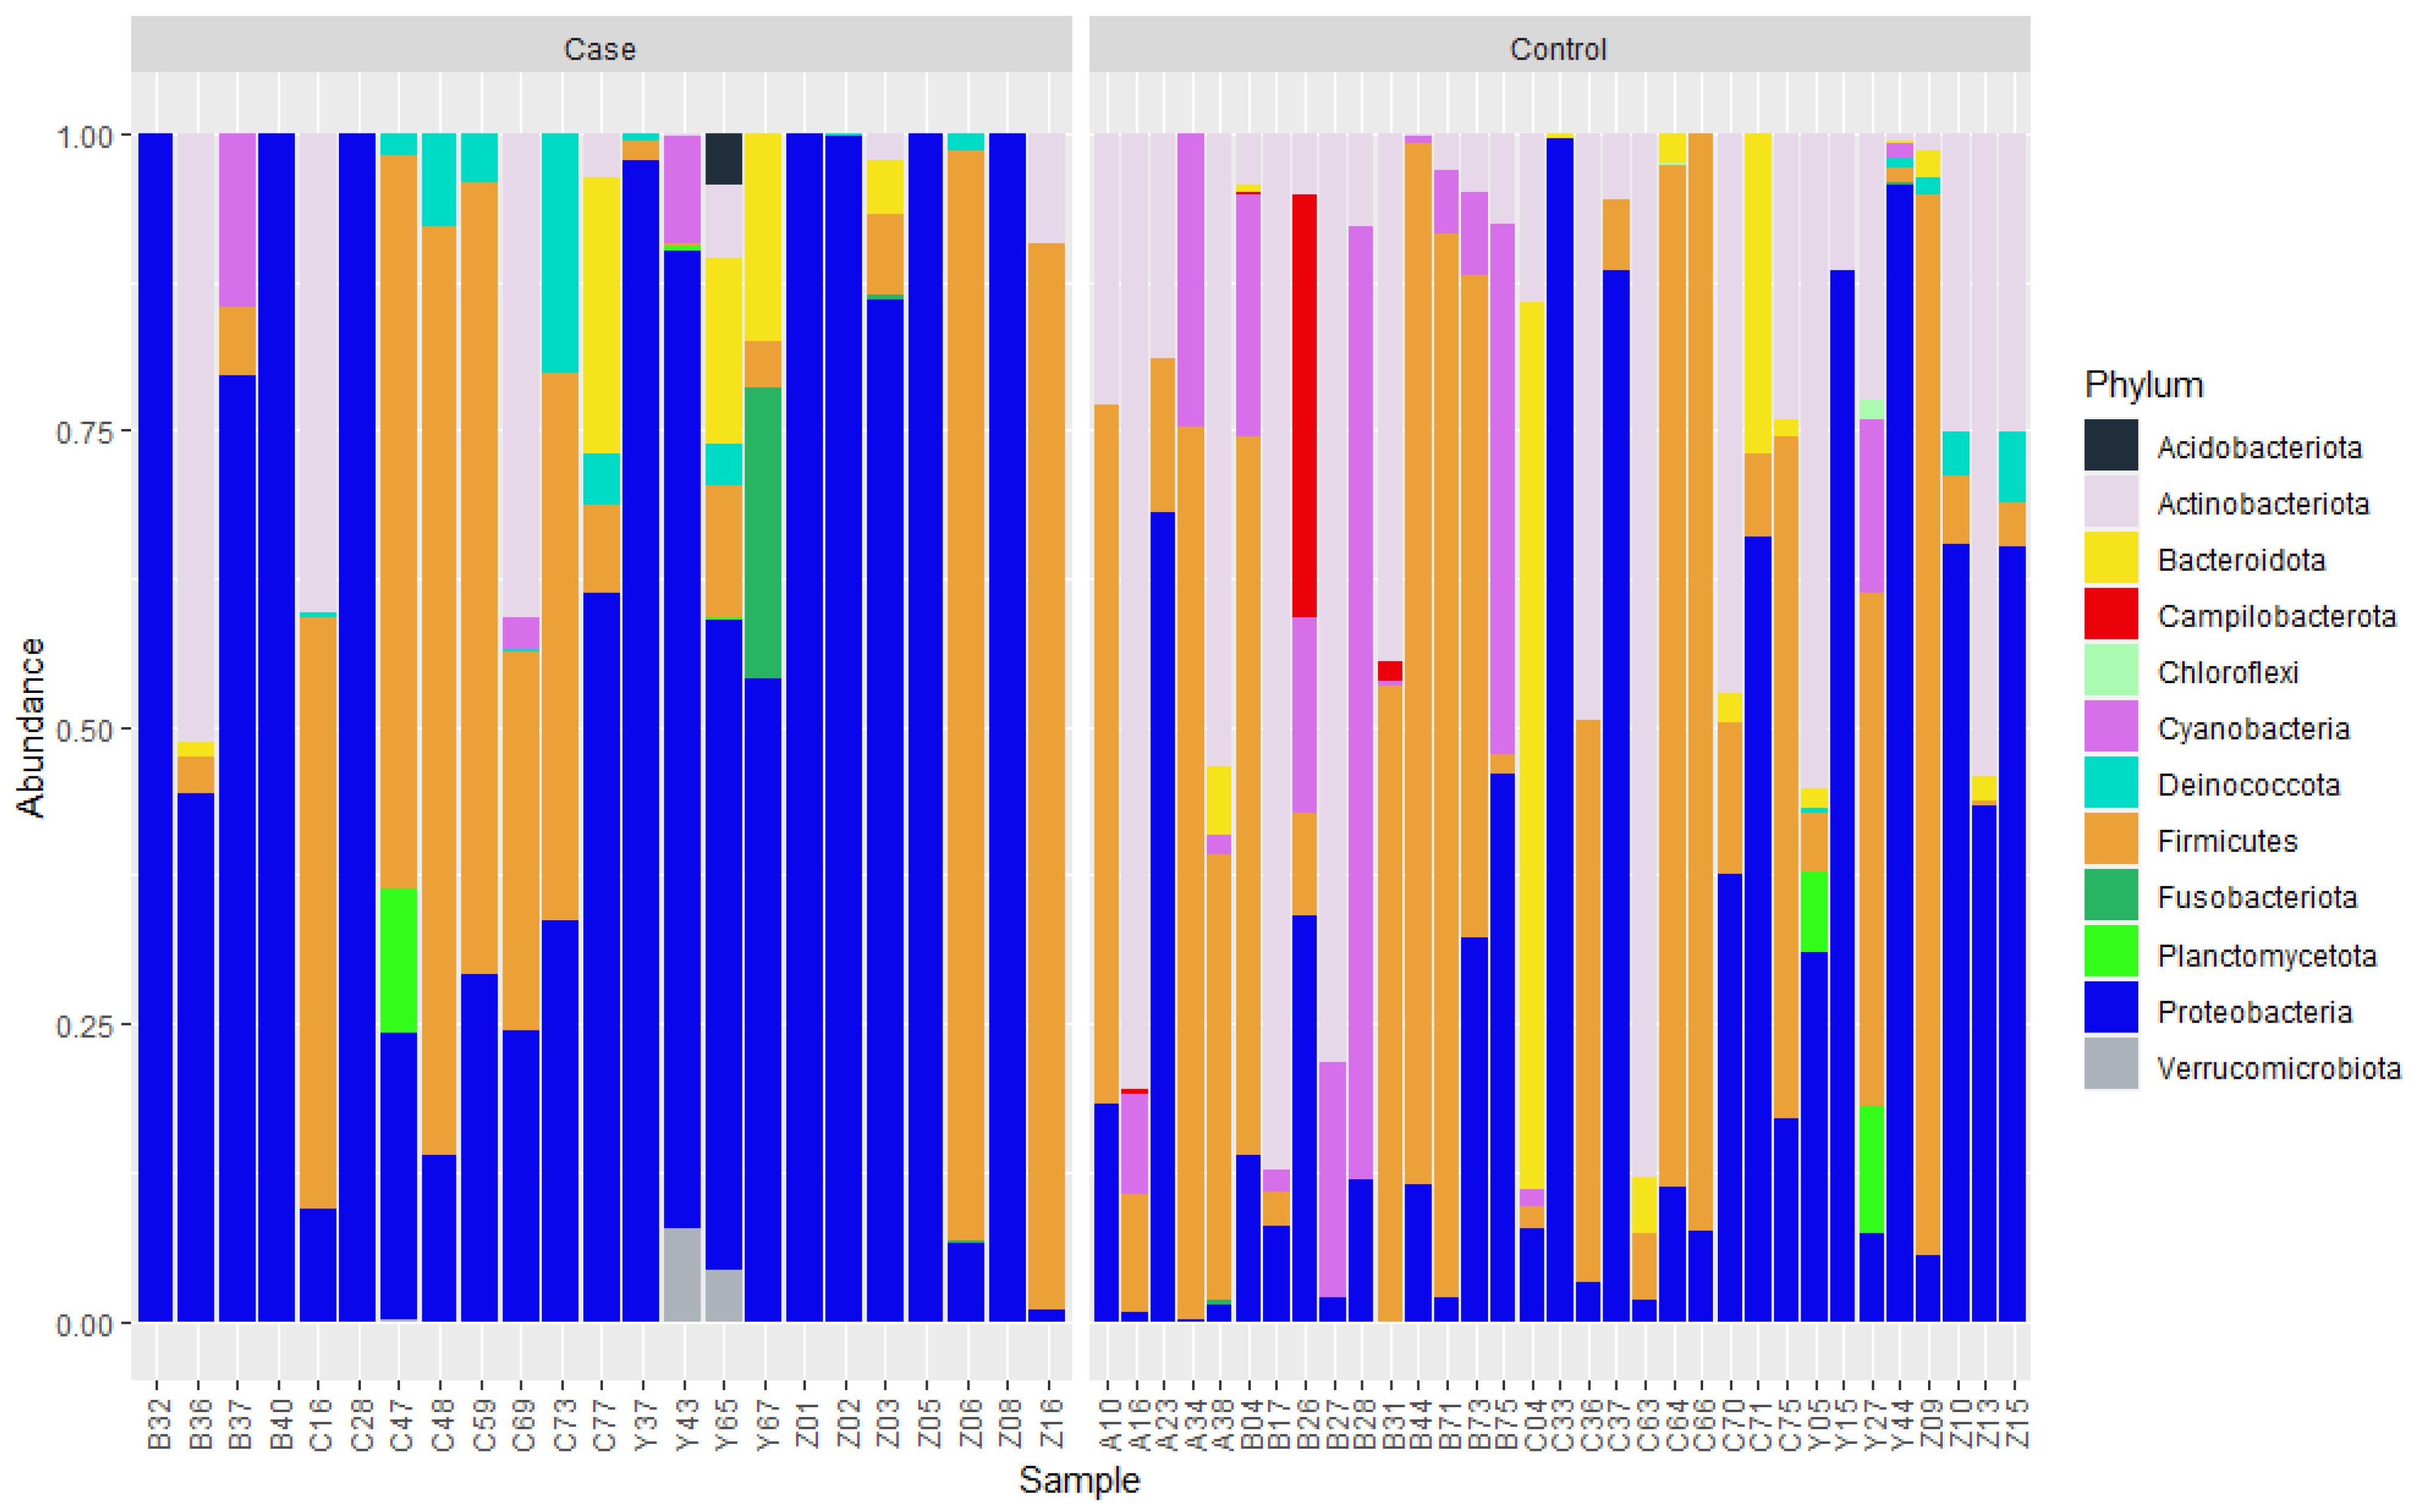
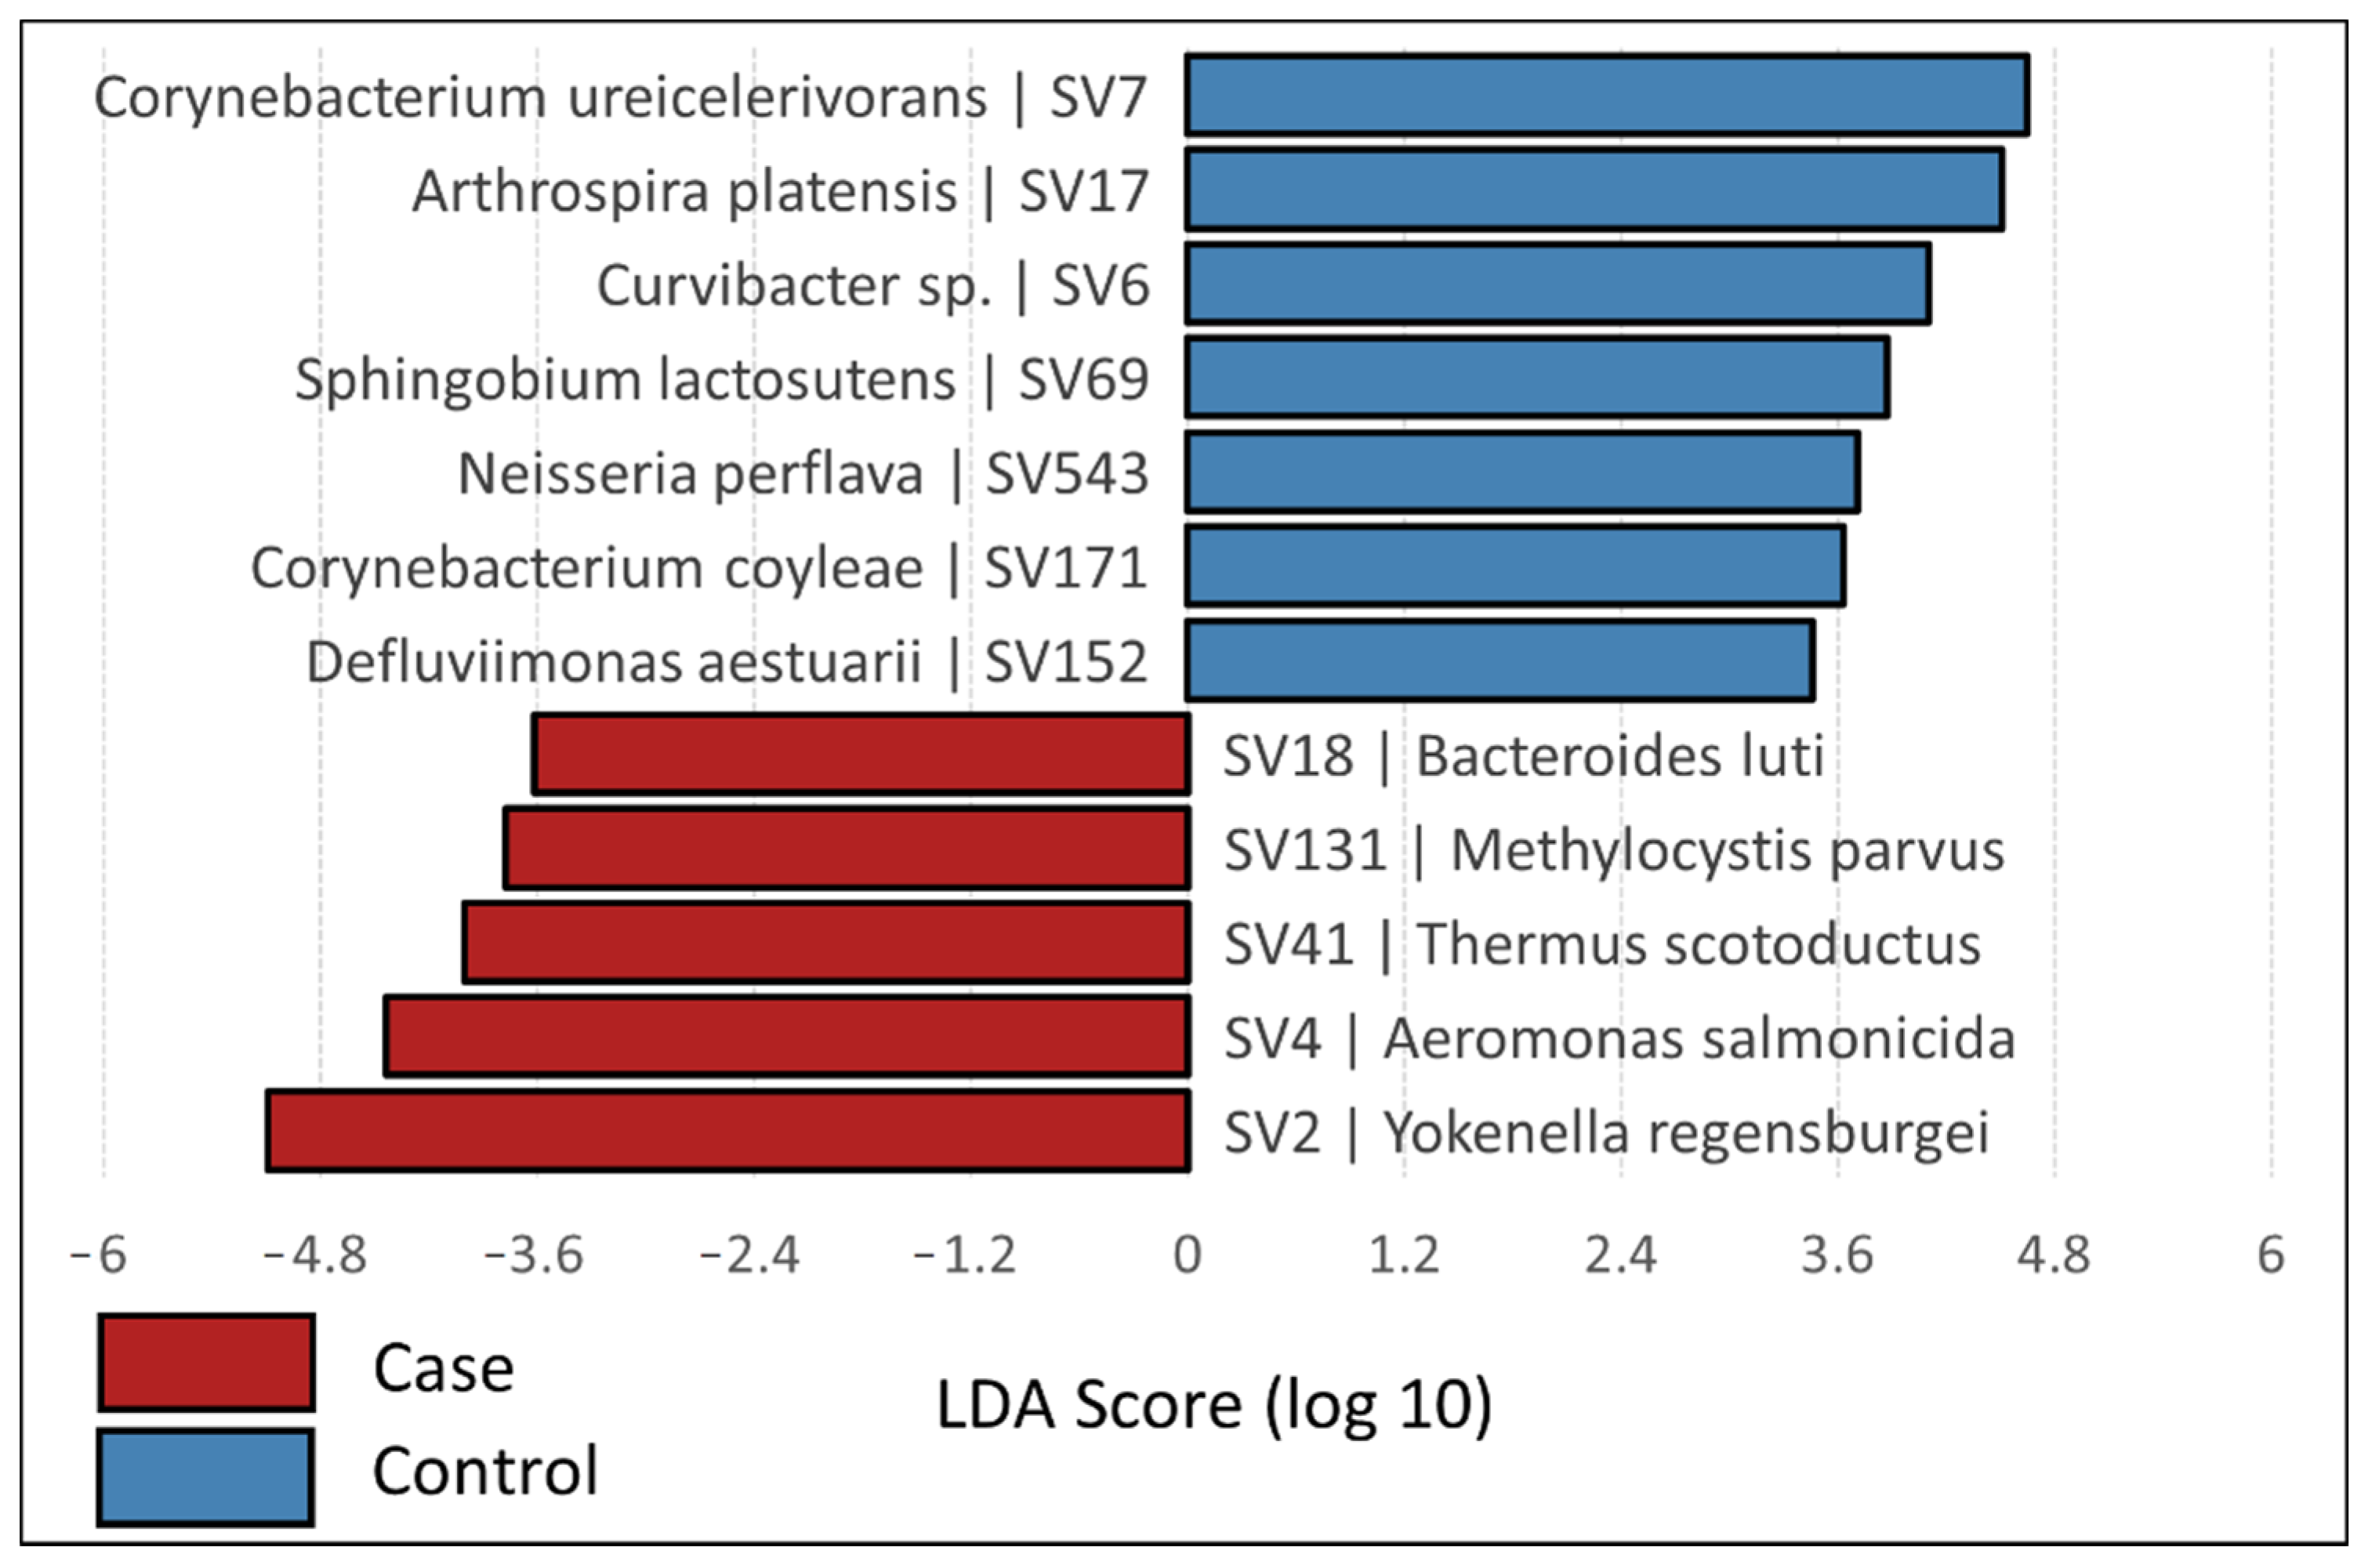
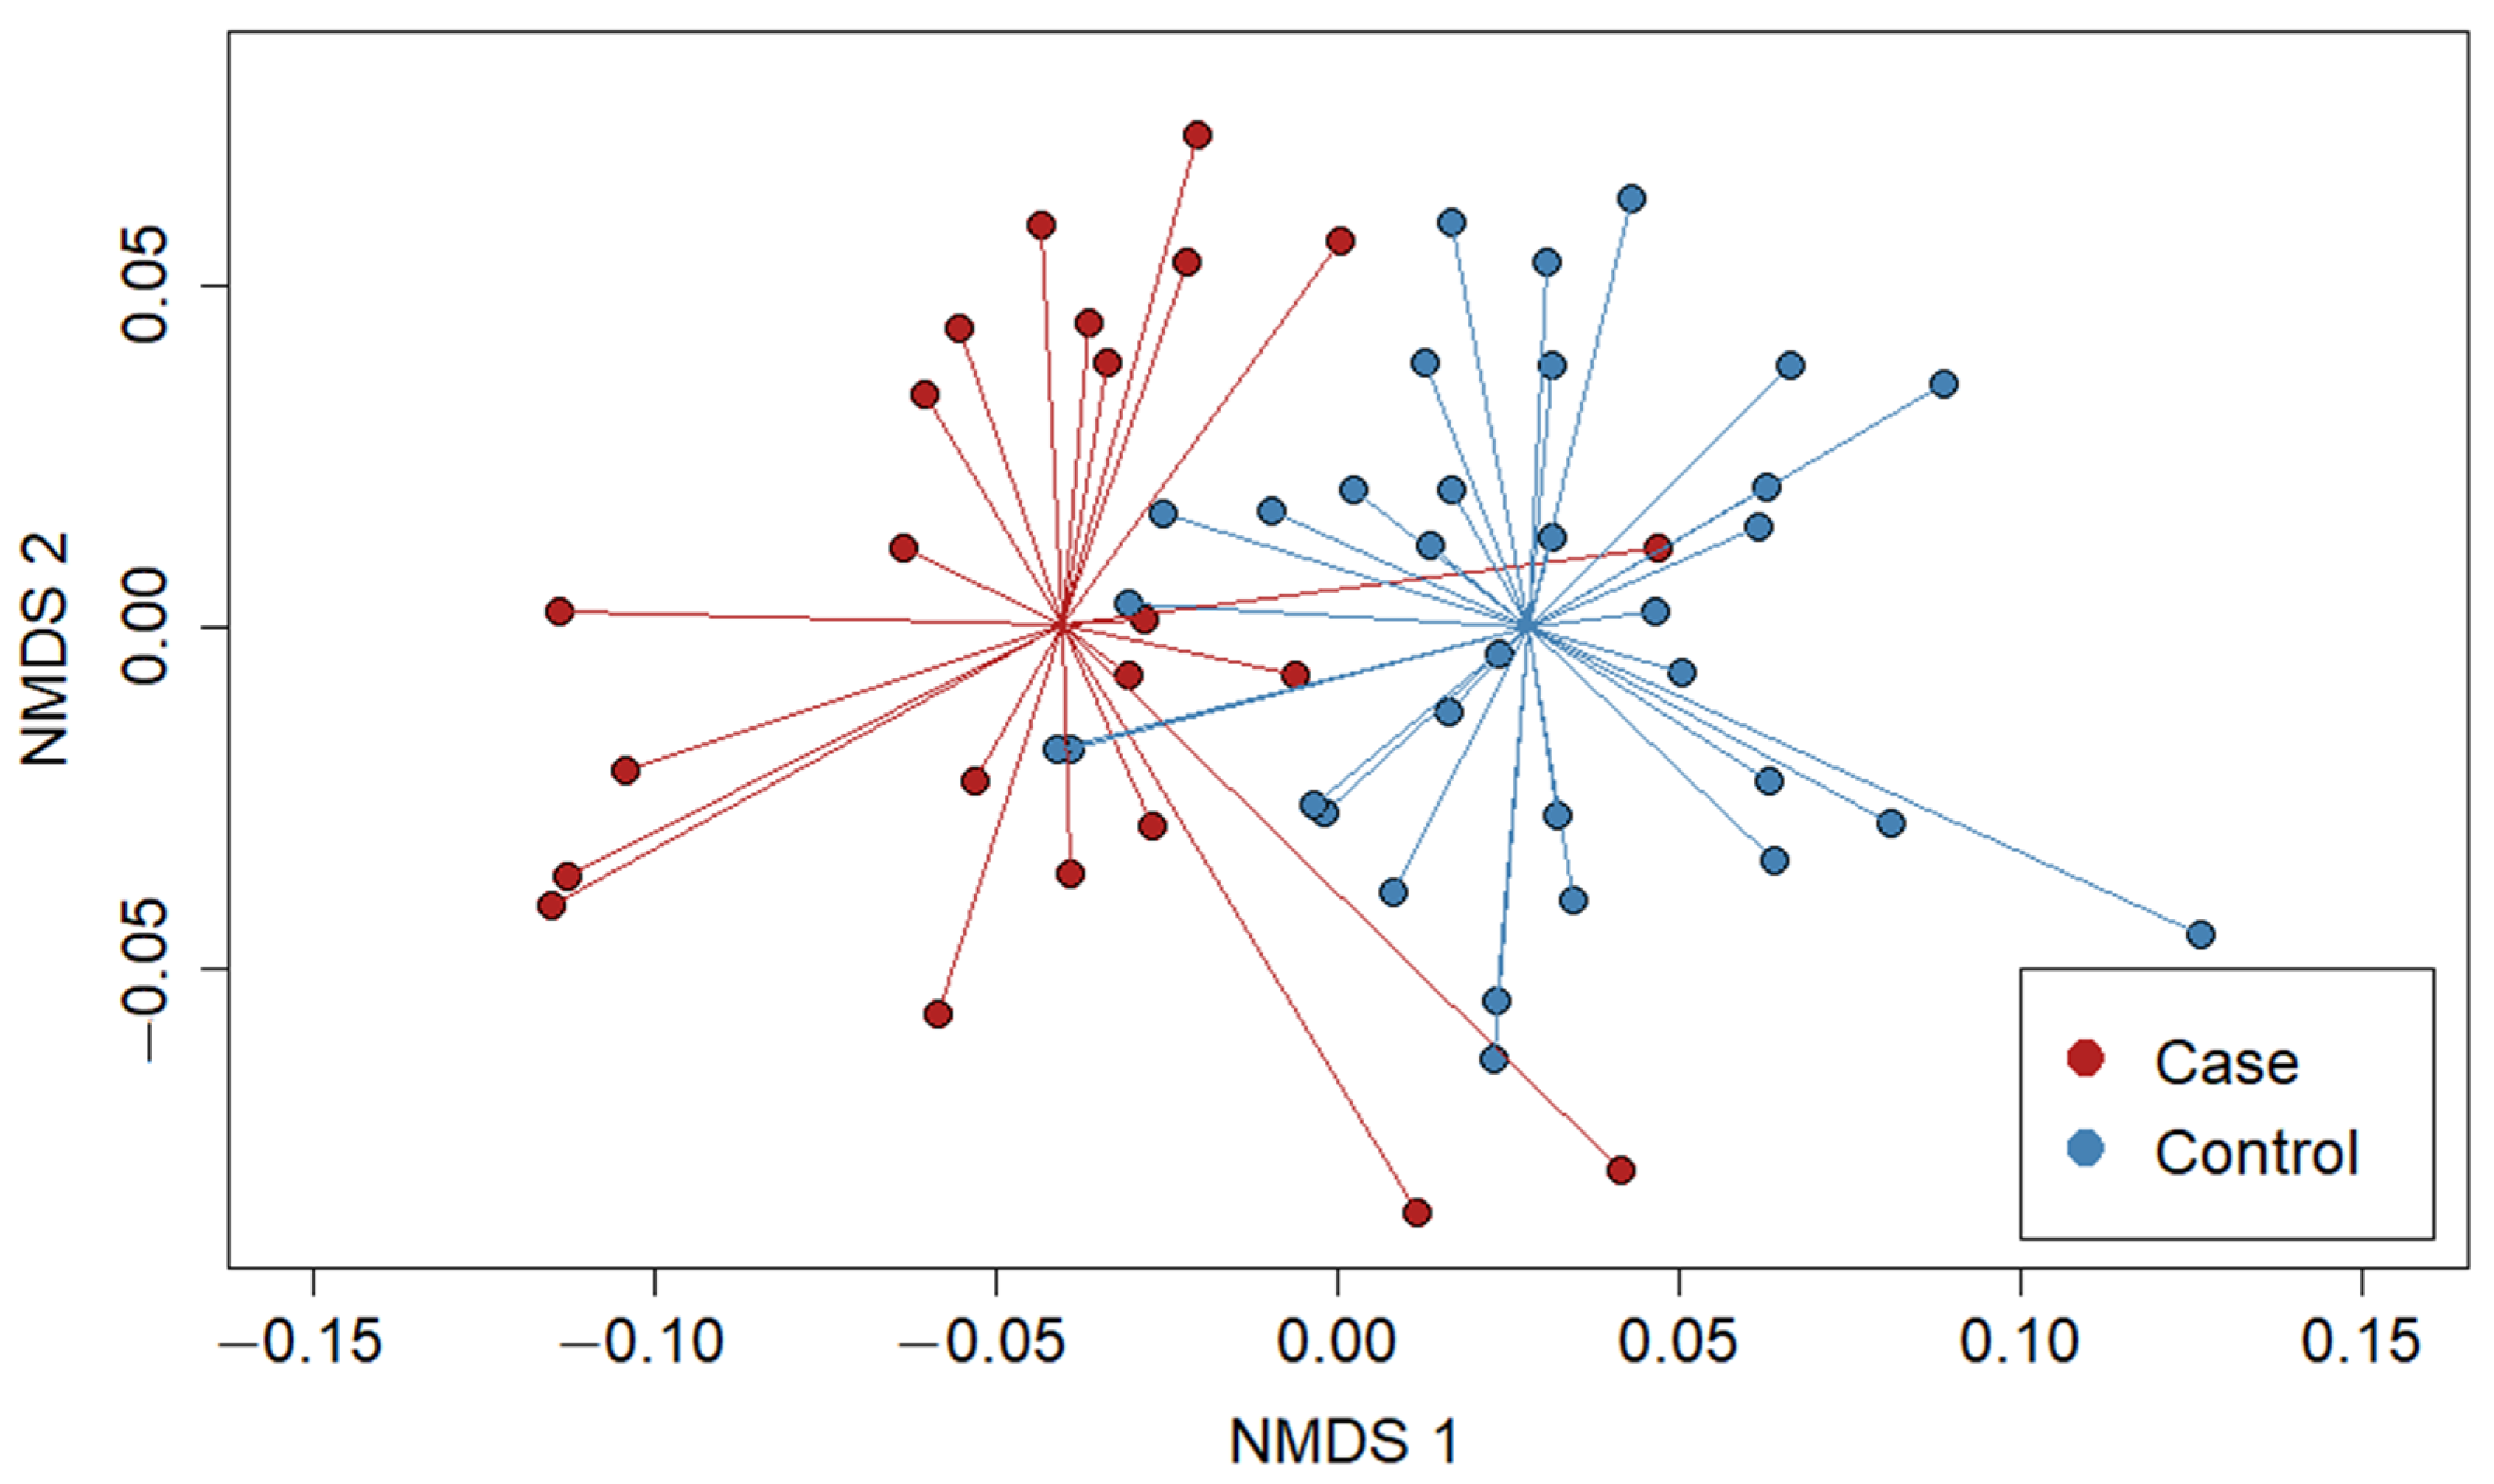
3.2. Bacterial Community Composition
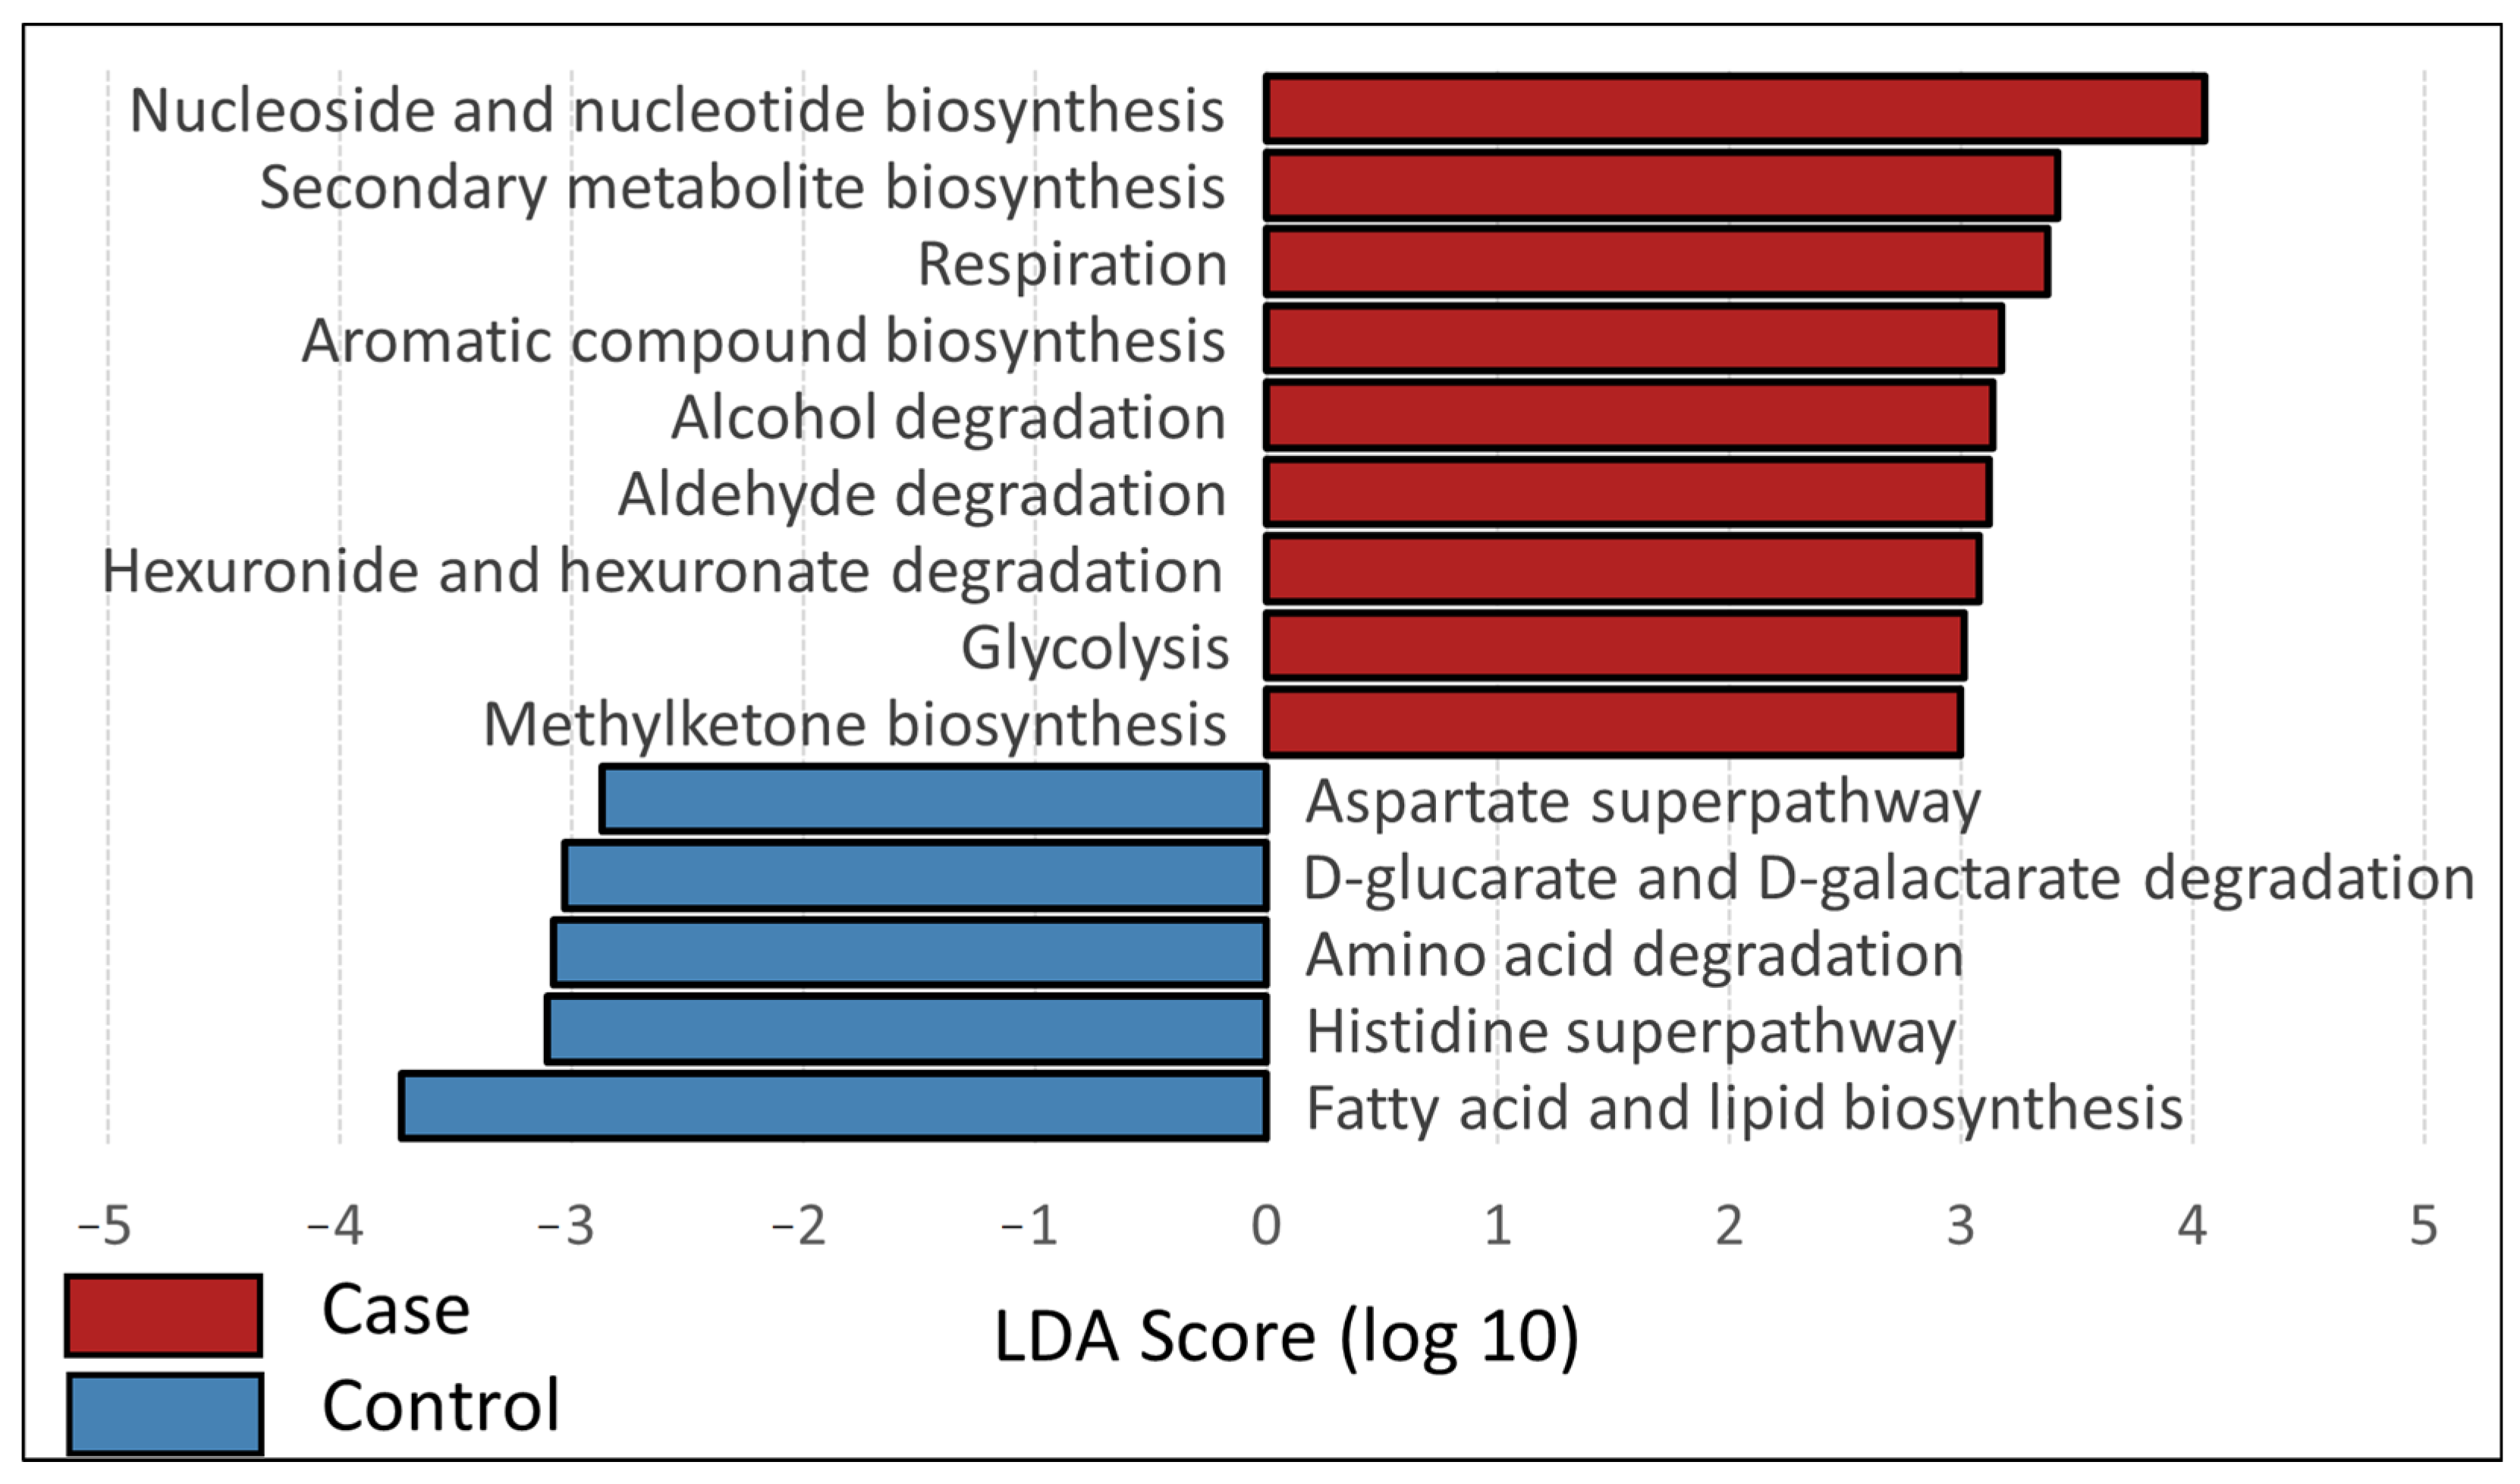
3.3. Inferred Functional Profiles
4. Discussion
Supplementary Materials
Author Contributions
Funding
Institutional Review Board Statement
Informed Consent Statement
Data Availability Statement
Acknowledgments
Conflicts of Interest
References
- Haag, W.R.; Williams, J.D. Biodiversity on the Brink: An Assessment of Conservation Strategies for North American Freshwater Mussels. Hydrobiologia 2014, 735, 45–60. [Google Scholar] [CrossRef]
- Williams, J.D.; Warren, M.L.; Cummings, K.S.; Harris, J.L.; Neves, R.J. Conservation Status of Freshwater Mussels of The United States and Canada. Fisheries 1993, 18, 6–22. [Google Scholar] [CrossRef]
- Bogan, A.E. Global Diversity of Freshwater Mussels (Mollusca, Bivalvia) in Freshwater. Hydrobiologia 2008, 595, 139–147. [Google Scholar] [CrossRef]
- Vaughn, C.C.; Hakenkamp, C.C. The Functional Role of Burrowing Bivalves in Freshwater Ecosystems. Freshw. Biol. 2001, 46, 1431–1446. [Google Scholar] [CrossRef] [Green Version]
- Atkinson, C.L.; Vaughn, C.C.; Forshay, K.J.; Cooper, J.T. Aggregated Filter-Feeding Consumers Alter Nutrient Limitation: Consequences for Ecosystem and Community Dynamics. Ecology 2013, 94, 1359–1369. [Google Scholar] [CrossRef] [PubMed] [Green Version]
- Howard, J.K.; Cuffey, K.M. The Functional Role of Native Freshwater Mussels in the Fluvial Benthic Environment. Freshw. Biol. 2006, 51, 460–474. [Google Scholar] [CrossRef]
- Vaughn, C.C.; Nichols, S.J.; Spooner, D.E. Community and Foodweb Ecology of Freshwater Mussels. J. North Am. Benthol. Soc. 2008, 27, 409–423. [Google Scholar] [CrossRef]
- Downing, J.A.; Van Meter, P.; Woolnough, D.A. Suspects and Evidence: A Review of the Causes of Extirpation and Decline in Freshwater Mussels. Anim. Biodivers. Conserv. 2010, 33, 151–185. [Google Scholar]
- Haag, W.R. North American Freshwater Mussels: Natural History, Ecology, and Conservation; Cambridge University Press: Cambridge, UK, 2012; ISBN 9781139048217. [Google Scholar]
- Strayer, D.L. Effects of Alien Species on Freshwater Mollusks in North America. J. North Am. Benthol. Soc. 1999, 18, 74–98. [Google Scholar] [CrossRef]
- Parmalee, P.W.; Klippel, W.E. Freshwater Mussels as a Prehistoric Food Resource. Am. Antiq. 1974, 39, 421–434. [Google Scholar] [CrossRef]
- Haag, W.R. Reassessing Enigmatic Mussel Declines in the United States. Freshw. Mollusk Biol. Conserv. 2019, 22, 43. [Google Scholar] [CrossRef]
- Haag, W.R.; Culp, J.J.; McGregor, M.A.; Bringolf, R.; Stoeckel, J.A. Growth and Survival of Juvenile Freshwater Mussels in Streams: Implications for Understanding Enigmatic Mussel Declines. Freshw. Sci. 2019, 38, 753–770. [Google Scholar] [CrossRef]
- Berger, L.; Speare, R.; Daszak, P.; Green, D.E.; Cunningham, A.A.; Goggin, C.L.; Slocombe, R.; Ragan, M.A.; Hyatt, A.D.; McDonald, K.R.; et al. Chytridiomycosis Causes Amphibian Mortality Associated with Population Declines in the Rain Forests of Australia and Central America. Proc. Natl. Acad. Sci. USA 1998, 95, 9031–9036. [Google Scholar] [CrossRef] [PubMed] [Green Version]
- Lips, K.R. Overview of Chytrid Emergence and Impacts on Amphibians. Philos. Trans. R. Soc. B Biol. Sci. 2016, 371, 20150465. [Google Scholar] [CrossRef] [Green Version]
- Blehert, D.S.; Hicks, A.C.; Behr, M.; Meteyer, C.U.; Berlowski-Zier, B.M.; Buckles, E.L.; Coleman, J.T.H.; Darling, S.R.; Gargas, A.; Niver, R.; et al. Bat White-Nose Syndrome: An Emerging Fungal Pathogen? Science 2009, 323, 227. [Google Scholar] [CrossRef]
- McCallum, H. Tasmanian Devil Facial Tumour Disease: Lessons for Conservation Biology. Trends Ecol. Evol. 2008, 23, 631–637. [Google Scholar] [CrossRef] [PubMed]
- Segarra, A.; Pépin, J.F.; Arzul, I.; Morga, B.; Faury, N.; Renault, T. Detection and Description of a Particular Ostreid Herpesvirus 1 Genotype Associated with Massive Mortality Outbreaks of Pacific Oysters, Crassostrea Gigas, in France in 2008. Virus Res. 2010, 153, 92–99. [Google Scholar] [CrossRef] [PubMed] [Green Version]
- Lacoste, A.; Jalabert, F.; Malham, S.; Cueff, A.; Gélébart, F.; Cordevant, C.; Lange, M.; Poulet, S.A. A Vibrio Splendidus Strain Is Associated with Summer Mortality of Juvenile Oysters Crassostrea Gigas in the Bay of Morlaix (North Brittany, France). Dis. Aquat. Organ. 2001, 46, 139–145. [Google Scholar] [CrossRef] [PubMed] [Green Version]
- Ford, S.E.; Haskin, H.H. History and Epizootiology of Haplosporidium Nelsoni (MSX), an Oyster Pathogen in Delaware Bay, 1957–1980. J. Invertebr. Pathol. 1982, 40, 118–141. [Google Scholar] [CrossRef]
- Burreson, E.M.; Ragone Calvo, L.M. Epizootiology of Perkinsus Marinus Disease of Oysters in Chesapeake Bay, with Emphasis on Data since 1985. J. Shellfish Res. 1996, 15, 17–34. [Google Scholar]
- Rabaoui, L.; Tlig-zouari, S.; Katsanevakis, S.; Kalthoum, O.U.M.; Hassine, B.E.N. Modelling Population Density of Pinna Nobilis (Bivalvia) on the Eastern and Southeastern Coast of Tunisia. J. Molluscan Stud. 2010, 76, 340–347. [Google Scholar] [CrossRef] [Green Version]
- Vázquez-luis, M.; Álvarez, E.; Barrajón, A.; García-March, J.R.; Grau, A.; Hendriks, I.E.; Jiménez, S.; Kersting, D.; Moreno, D.; Pérez, M.; et al. S.O.S. Pinna Nobilis: A Mass Mortality Event in Western Mediterranean Sea. Front. Mar. Sci. 2017, 4, 1–6. [Google Scholar] [CrossRef] [Green Version]
- Katsanevakis, S.; Tsirintanis, K.; Tsaparis, D.; Doukas, D.; Sini, M.; Athanassopoulou, F.; Kolygas, M.N.; Tontis, D.; Koutsoubas, D.; Bakopoulos, V. The Cryptogenic Parasite Haplosporidium Pinnae Invades the Aegean Sea and Causes the Collapse of Pinna Nobilis Populations. Aquat. Invasions 2019, 14, 150–164. [Google Scholar] [CrossRef]
- Carella, F.; Aceto, S.; Pollaro, F.; Miccio, A.; Iaria, C.; Carrasco, N.; Prado, P.; De Vico, G. A Mycobacterial Disease Is Associated with the Silent Mass Mortality of the Pen Shell Pinna Nobilis along the Tyrrhenian Coastline of Italy. Sci. Rep. 2019, 9, 2725. [Google Scholar] [CrossRef]
- Lattos, A.; Giantsis, I.A.; Karagiannis, D.; Theodorou, J.A.; Michaelidis, B. Gut Symbiotic Microbial Communities in the IUCN Critically Endangered Pinna Nobilis Su Ff Ering from Mass Mortalities, Revealed by 16S RRNA Amplicon NGS. Pathogens 2020, 9, 1002. [Google Scholar] [CrossRef]
- Alfaro, A.C.; Nguyen, T.V.; Merien, F. The Complex Interactions of Ostreid Herpesvirus 1, Vibrio Bacteria, Environment and Host Factors in Mass Mortality Outbreaks of Crassostrea Gigas. Rev. Aquac. 2019, 11, 1148–1168. [Google Scholar] [CrossRef]
- Wendling, C.C.; Wegner, K.M. Relative Contribution of Reproductive Investment, Thermal Stress and Vibrio Infection to Summer Mortality Phenomena in Pacific Oysters. Aquaculture 2013, 412–413, 88–96. [Google Scholar] [CrossRef]
- Grizzle, J.M.; Brunner, C.J. Infectious Diseases of Freshwater Mussels and Other Freshwater Bivalve Mollusks. Rev. Fish. Sci. 2009, 17, 425–467. [Google Scholar] [CrossRef]
- Carella, F.; Villari, G.; Maio, N.; De Vico, G.D. Disease and Disorders of Freshwater Unionid Mussels: A Brief Overview of Recent Studies. Front. Physiol. 2016, 7, 489. [Google Scholar] [CrossRef] [PubMed] [Green Version]
- Scholla, M.H.; Hinman, M.L.; Klaine, S.J.; Conder, J. Evaluation of a Mussel Die-off in the Tennessee River, Tennessee, in 1985. In Proceedings of the Workshop on Die-offs of Freshwater Mussels in the United States; Neves, R.J., Ed.; Upper Mississippi River Conservation Committee: Rock Island, IL, USA, 1986; pp. 144–151. [Google Scholar]
- Starliper, C.E.; Powell, J.; Garner, J.T.; Schill, W.B. Predominant Bacteria Isolated from Moribund Fusconaia Ebena Ebonyshells Experiencing Die-Offs in Pickwick Reservoir, Tennessee River, Alabama. J. Shellfish. Res. 2011, 30, 359–366. [Google Scholar] [CrossRef]
- Aceves, A.K.; Johnson, P.; Bullard, S.A.; Lafrentz, S.; Arias, C.R. Description and Characterization of the Digestive Gland Microbiome in the Freshwater Mussel Villosa Nebulosa (Bivalvia: Unionidae). J. Molluscan Stud. 2018, 84, 240–246. [Google Scholar] [CrossRef] [Green Version]
- Aceves, A.K.; Johnson, P.D.; Atkinson, C.L.; van Ee, B.C.; Bullard, S.A.; Arias, C.R. Digestive Gland Microbiome of Pleurobema Cordatum: Mesocosms Induce Dysbiosis. J. Molluscan Stud. 2020, 86, 280–289. [Google Scholar] [CrossRef]
- McCauley, M.; Chiarello, M.; Atkinson, C.L.; Jackson, C.R. Gut Microbiomes of Freshwater Mussels (Unionidae) Are Taxonomically and Phylogenetically Variable across Years but Remain Functionally Stable. Microorganisms 2021, 9, 411. [Google Scholar] [CrossRef]
- Weingarten, E.A.; Atkinson, C.L.; Jackson, C.R. The Gut Microbiome of Freshwater Unionidae Mussels Is Determined by Host Species and Is Selectively Retained from Filtered Seston. PLoS ONE 2019, 14, e0224796. [Google Scholar] [CrossRef]
- Richard, J.C. Clinch River Mussel Die-Off. Ellipsaria 2019, 20, 1–3. [Google Scholar]
- Leis, E.; Waller, D.L.; Knowles, S.; Goldberg, T.; Putnam, J.G.; Richard, J.; Erickson, S.; Blevins, E.; Weinzinger, J. Building a Response Network to Investigate Potential Pathogens Associated with Unionid Mortality Events. Ellipsaria 2018, 20, 44–45. [Google Scholar]
- Richard, J.C.; Leis, E.; Dunn, C.D.; Agbalog, R.; Waller, D.; Knowles, S.; Putnam, J.; Goldberg, T.L. Mass Mortality in Freshwater Mussels (Actinonaias Pectorosa) in the Clinch River, USA, Linked to a Novel Densovirus. Sci. Rep. 2020, 10, 14498. [Google Scholar] [CrossRef]
- Leis, E.; Erickson, S.; Waller, D.; Richard, J.; Goldberg, T. A Comparison of Bacteria Cultured from Unionid Mussel Hemolymph between Stable Populations in the Upper Mississippi River Basin and Populations Affected by a Mortality Event in the Clinch River. Freshw. Mollusk Biol. Conserv. 2019, 22, 70–80. [Google Scholar] [CrossRef]
- Gustafson, L.L.; Stoskopf, M.K.; Bogan, A.E.; Showers, W.; Kwak, T.J.; Hanlon, S.D.; Levine, J.F. Evaluation of a Nonlethal Technique for Hemolymph Collection in Elliptio Complanata, a Freshwater Bivalve (Mollusca: Unionidae). Dis. Aquat. Organ. 2005, 65, 159–165. [Google Scholar] [CrossRef]
- Dunn, C.D.; Campbell, L.J.; Wallace, E.M.; Danylchuk, A.J.; Cooke, S.J.; Shultz, A.D.; Black, B.D.; Brownscombe, J.W.; Griffin, L.P.; Philipp, D.P.; et al. Bacterial Communities on the Gills of Bonefish (Albula Vulpes) in the Florida Keys and The Bahamas Show Spatial Structure and Differential Abundance of Disease-Associated Bacteria. Mar. Biol. 2020, 167, 85. [Google Scholar] [CrossRef]
- Gilbert, J.A.; Jansson, J.K.; Knight, R. The Earth Microbiome Project: Successes and Aspirations. BMC Biol. 2014, 12, 69. [Google Scholar] [CrossRef] [PubMed] [Green Version]
- Caporaso, J.G.; Lauber, C.L.; Costello, E.K.; Berg-Lyons, D.; Gonzalez, A.; Stombaugh, J.; Knights, D.; Gajer, P.; Ravel, J.; Fierer, N.; et al. Moving Pictures of the Human Microbiome. Genome Biol. 2011, 12, R50. [Google Scholar] [CrossRef] [Green Version]
- Walters, W.; Hyde, E.R.; Berg-lyons, D.; Ackermann, G.; Humphrey, G.; Parada, A.; Gilbert, J.A.; Jansson, J.K. Improved Bacterial 16S RRNA Gene (V4 and V4-5) and Fungal Internal Transcribed Spacer Marker Gene Primers for Microbial Community Surveys. mSystems 2015, 1, e0009-15. [Google Scholar] [CrossRef] [Green Version]
- Davis, N.M.; Proctor, D.M.; Holmes, S.P.; Relman, D.A.; Callahan, B.J. Simple Statistical Identification and Removal of Contaminant Sequences in Marker-Gene and Metagenomics Data. Mirobiome 2018, 6, 226. [Google Scholar] [CrossRef] [Green Version]
- R Core Team. R: A Language and Environment for Statistical Computing. 2020. Available online: https://www.R-project.org/ (accessed on 15 September 2021).
- Callahan, B.J.; McMurdie, P.J.; Rosen, M.J.; Han, A.W.; Johnson, A.J.A.; Holmes, S.P. DADA2: High-Resolution Sample Inference from Illumina Amplicon Data. Nat. Methods 2016, 13, 581–583. [Google Scholar] [CrossRef] [Green Version]
- Eisenhofer, R.; Minich, J.J.; Marotz, C.; Cooper, A.; Knight, R.; Weyrich, L.S. Contamination in Low Microbial Biomass Microbiome Studies: Issues and Recommendations. Trends Microbiol. 2019, 27, 105–117. [Google Scholar] [CrossRef]
- Quast, C.; Pruesse, E.; Yilmaz, P.; Gerken, J.; Schweer, T.; Yarza, P.; Peplies, J.; Glöckner, F.O. The SILVA Ribosomal RNA Gene Database Project: Improved Data Processing and Web-Based Tools. Nucleic Acids Res. 2013, 41, 590–596. [Google Scholar] [CrossRef] [PubMed]
- McMurdie, P.J.; Holmes, S. Phyloseq: An R Package for Reproducible Interactive Analysis and Graphics of Microbiome Census Data. PLoS ONE 2013, 8, e61217. [Google Scholar] [CrossRef] [Green Version]
- Oksanen, J.; Guillaume Blanchet, F.; Friendly, M.; Kindt, R.; Legendre, P.; McGlinn, D.; Minchin, P.R.; O’Hara, R.B.; Simpson, G.L.; Solymos, P.; et al. Vegan: Community Ecology Package. 2020. Available online: https://cran.r-project.org/web/packages/vegan/vegan.pdf (accessed on 15 September 2021).
- Segata, N.; Izard, J.; Waldron, L.; Gevers, D.; Miropolsky, L.; Garrett, W.S.; Huttenhower, C. Metagenomic Biomarker Discovery and Explanation. Genome Biol. 2011, 12, R60. [Google Scholar] [CrossRef] [Green Version]
- Altschul, S.F.; Gish, W.; Miller, W.; Myers, E.W.; Lipman, D.J. Basic Local Alignment Search Tool. J. Mol. Biol. 1990, 215, 403–410. [Google Scholar] [CrossRef]
- Douglas, G.M.; Maffei, V.J.; Zaneveld, J.R.; Yurgel, S.N.; Brown, J.R.; Taylor, C.M.; Huttenhower, C.; Langille, M.G.I. PICRUSt2 for Prediction of Metagenome Functions. Nat. Biotechnol. 2020, 38, 669–688. [Google Scholar] [CrossRef]
- McMurdie, P.J.; Paulson, J.N. Biomformat: An Interface Package for the BIOM File Format. Available online: https://Github.Com/Joey711/Biomformat/ (accessed on 10 September 2021).
- Caspi, R.; Billington, R.; Fulcher, C.A.; Keseler, I.M.; Kothari, A.; Krummenacker, M.; Latendresse, M.; Midford, P.E.; Ong, Q.; Ong, W.K.; et al. The MetaCyc Database of Metabolic Pathways and Enzymes. Nucleic Acids Res. 2018, 46, D633–D639. [Google Scholar] [CrossRef] [Green Version]
- Langille, M.G.I.; Zaneveld, J.; Caporaso, J.G.; McDonald, D.; Knights, D.; Reyes, J.A.; Clemente, J.C.; Burkepile, D.E.; Vega Thurber, R.L.; Knight, R.; et al. Predictive Functional Profiling of Microbial Communities Using 16S RRNA Marker Gene Sequences. Nat. Biotechnol. 2013, 31, 814–821. [Google Scholar] [CrossRef]
- Sparks, R.E.; Blodgett, K.D.; Durham, L.; Horner, R. Determination Whether the Causal Agent for Mussel Die-Offs in the Mississippi River Is of Chemical or Biological Origin; Illinois Department of Energy and Natural Resources: Springfield, IL, USA, 1990. [Google Scholar]
- Allam, B.; Raftos, D. Immune Responses to Infectious Diseases in Bivalves. J. Invertebr. Pathol. 2015, 131, 121–136. [Google Scholar] [CrossRef] [Green Version]
- Allam, B.; Pales Espinosa, E. Bivalve Immunity and Response to Infections: Are We Looking at the Right Place? Fish Shellfish Immunol. 2016, 53, 4–12. [Google Scholar] [CrossRef] [Green Version]
- Abbot, S.L.; Janda, J.M. Isolation of Yokenella Regensburgei (“Koserella Trabulsii”) from a Patient with Transient Bacteremia and from a Patient with a Septic Knee. J. Clin. Microbiol. 1994, 32, 2854–2855. [Google Scholar] [CrossRef] [Green Version]
- Stock, I.; Sherwood, K.J.; Wiedemann, B. Antimicrobial Susceptibility Patterns, β-Lactamases, and Biochemical Identification of Yokenella Regensburgei Strains. Diagn. Microbiol. Infect. Dis. 2004, 48, 5–15. [Google Scholar] [CrossRef] [PubMed]
- Huisman, J.; Codd, G.A.; Paerl, H.W.; Ibelings, B.W.; Verspagen, J.M.H.; Visser, P.M. Cyanobacterial Blooms. Nat. Rev. Microbiol. 2018, 16, 471–483. [Google Scholar] [CrossRef]
- Dubé, C.E.; Ky, C.L.; Planes, S. Microbiome of the Black-Lipped Pearl Oyster Pinctada Margaritifera, a Multi-Tissue Description with Functional Profiling. Front. Microbiol. 2019, 10, 1548. [Google Scholar] [CrossRef] [PubMed]
- de Lorgeril, J.; Lucasson, A.; Petton, B.; Toulza, E.; Montagnani, C.; Clerissi, C.; Vidal-Dupiol, J.; Chaparro, C.; Galinier, R.; Escoubas, J.M.; et al. Immune-Suppression by OsHV-1 Viral Infection Causes Fatal Bacteraemia in Pacific Oysters. Nat. Commun. 2018, 9, 4215. [Google Scholar] [CrossRef] [PubMed] [Green Version]
- Cope, W.G.; Bergeron, C.M.; Archambault, J.M.; Jones, J.W.; Beaty, B.; Lazaro, P.R.; Shea, D.; Callihan, J.L.; Rogers, J.J. Understanding the Influence of Multiple Pollutant Stressors on the Decline of Freshwater Mussels in a Biodiversity Hotspot. Sci. Total Environ. 2021, 773, 144757. [Google Scholar] [CrossRef] [PubMed]


Publisher’s Note: MDPI stays neutral with regard to jurisdictional claims in published maps and institutional affiliations. |
© 2021 by the authors. Licensee MDPI, Basel, Switzerland. This article is an open access article distributed under the terms and conditions of the Creative Commons Attribution (CC BY) license (https://creativecommons.org/licenses/by/4.0/).
Share and Cite
Richard, J.C.; Campbell, L.J.; Leis, E.M.; Agbalog, R.E.; Dunn, C.D.; Waller, D.L.; Knowles, S.; Putnam, J.G.; Goldberg, T.L. Mussel Mass Mortality and the Microbiome: Evidence for Shifts in the Bacterial Microbiome of a Declining Freshwater Bivalve. Microorganisms 2021, 9, 1976. https://0-doi-org.brum.beds.ac.uk/10.3390/microorganisms9091976
Richard JC, Campbell LJ, Leis EM, Agbalog RE, Dunn CD, Waller DL, Knowles S, Putnam JG, Goldberg TL. Mussel Mass Mortality and the Microbiome: Evidence for Shifts in the Bacterial Microbiome of a Declining Freshwater Bivalve. Microorganisms. 2021; 9(9):1976. https://0-doi-org.brum.beds.ac.uk/10.3390/microorganisms9091976
Chicago/Turabian StyleRichard, Jordan C., Lewis J. Campbell, Eric M. Leis, Rose E. Agbalog, Chris D. Dunn, Diane L. Waller, Susan Knowles, Joel G. Putnam, and Tony L. Goldberg. 2021. "Mussel Mass Mortality and the Microbiome: Evidence for Shifts in the Bacterial Microbiome of a Declining Freshwater Bivalve" Microorganisms 9, no. 9: 1976. https://0-doi-org.brum.beds.ac.uk/10.3390/microorganisms9091976