Article

Microfiber Contamination in Potable Water: Detection and Mitigation Using a Filtering Device

1
Institute for Polymers, Composites and Biomaterials, National Research Council of Italy, Via Campi Flegrei, 34, 80078 Pozzuoli, NA, Italy
2
TF LAB d.o.o., Verdijeva 1, 6000 Koper, Slovenia
*
Author to whom correspondence should be addressed.
Submission received: 20 May 2022 / Revised: 15 June 2022 / Accepted: 17 June 2022 / Published: 22 June 2022
(This article belongs to the Special Issue Microplastics in Marine Environment)

Abstract

:
In recent years, microfibers released from synthetic fabrics have been identified as the main contributor to primary microplastic pollution. These pollutants have been detected in several products for human consumption. This work aims to evaluate the efficiency of a specific device used with the purpose to monitor and reduce this anthropogenic pollution in potable water. The device was tested using potable water from several cities in Slovenia by mounting the device containing the porous membrane directly to the faucet in private and public buildings. The results highlight the effectiveness of the applied device in removing natural and synthetic microfibers from tap water and confirm the abundance of microfibers as a contaminant of potable water.

Graphical Abstract

1. Introduction

Microplastic pollution in aquatic environments is widely reported in literature [1,2,3,4,5], but only recently has the microplastic contamination of tap water gained attention, as has emerged from several studies focused on this threat [6,7,8]. In the last years, micro-debris has been found in the human food chain in several food and drink items. As a matter of fact, microplastics were detected in German beer in 2014 [9], whereas several studies reported microplastic contamination in commercial table salt [10,11,12]. The occurrence of microplastics (MPs) in drinking water was reported for the first time in 2017 and was followed by several publications in 2018 [13]. Moreover, a recent study reported anthropogenic micro-debris in commercial seafood, such as bivalves and anchovies sold for human consumption [14]. This last work reported that a major percentage of contamination was represented from potentially synthetic and natural microfibers. Microfibers were also found in products meant for human consumption like honey and sugar [15]. Microfibers released from the synthetic fabrics have been widely reported as the main contributor to primary microplastic pollution [16]. These microplastics originated directly throughout the washing process, during which the textiles undergo chemical and mechanical stress as a consequence of detergent type, laundry additive, washing conditions, parameters, and washing load, in this last case [17,18,19]. Pros and cons of different identification methods for microplastic detection in aquatic environments were resumed in recent reviews [20,21]. However, in addition to some advantages of spectroscopic and morphological techniques, some limitations in microplastic identification were reported. To date, no standard procedures have been developed to identify and characterize synthetic and natural microfibers, and different approaches and techniques are used to this aim. The identification and characterization of microfibers could be performed through chemical, thermal, and morphological techniques. Morphological analysis of the microfiber represents a fundamental tool for the identification of the family of textiles fibers. In fact, the analysis of microfibers under an optical or electronic microscope allows the identification of the typical morphological features of the fibers, on the basis of which it is possible to identify their typical properties [22]. Textile fibers are classified in natural and man-made fibers. Natural fibers may be of animal, vegetable, or mineral source, whereas the man-made ones are divided in artificial and synthetic fibers [23,24,25]. Artificial fibers are produced by physical and chemical treatments from natural products, such as cellulose. Viscose and acetate are among the most common artificial textile fibers. On the other hand, synthetic fibers are produced from synthetic polymers and are classified on the basis of polymer type. This last category represents almost 60% of the annual global consumption of fibers, which was estimated to be 69.7 Mt, used in the apparel industry [23]. In 2019, global fiber production grew by 42 Mt, with an amount around 111 Mt [26]. Synthetic fibers have dominated the fiber market since the mid-1990s with around 70 Mt of synthetic fibers, and this fiber category made up approximately 63% of the global fiber production, where the polyester had a market share of around 51.5%. A first morphological distinction can be easily made between natural and synthetic fibers [24]. In fact, while natural fibers have more irregular characteristics, varying in thickness, the synthetic fibers obtained from the extrusion processes have a regular morphology, often approximated to a cylinder. Over the last two decades, the global amount of fibers used for apparel increased to more than double, mainly due to the massive consumption of synthetic fibers. Polyester-based materials (mainly polyethylene terephthalate, PET), being the main material employed for synthetic fabrics, are therefore a source of microplastics pollution that requires adequate measures in production and in the use of clothes and other textile products. It was recently reported that a washing process carried out with a single 100% polyester T-shirt could release almost 5 million microfibers per kg of washed fabric as a consequence of a synergistic effect between water-volume to fabric ratio and mechanical stress during washing [17]. Although the sea microfiber pollution, including synthetic and natural microfibers, gained the greatest attention of the researchers, the occurrence of microfibers as air contaminants in private and public buildings was also investigated in several studies. Dris et al. [27] reported the presence of microfibers in atmospheric fallout, pointing out the pollution in urban environment, estimating that an amount between 3 and 10 tons of natural and synthetic microfibers are deposited by atmospheric fallout every year. Meanwhile, in another work they reported the presence of microfibers pollution indoor and outdoor [28]. The presence of fibers was investigated in three sites for the indoor environment, two private apartments and one office, and the roof of the office building as outdoor sites. In the case of the indoor sampling, concentration was found to be in the range 1.0-60.0 fibers/m3, whereas lower values ranging from 0.3 to 1.5 fibers/m3 were reported for outdoor sampling.
As often occurs in microplastic issues, the differences in the used methodology to test and quantify microplastics make the comparison of the results obtained by the different research groups difficult, thus hindering the evaluation of a whole level of contamination. In literature, different papers deal with the occurrence and the quantification of microplastics in tap water. In a recent study [29] the presence of plastic particles, such as polyethylene, polyamide, polyester, polyvinylchloride, and other contaminants, was investigated, sampling 300 L of raw water and 2500 L of tap water, through 2 μm filter units. They found a concentration of microparticles between 0 and 7 microplastics per m3 of water. Mason et al. [8] analyzed 11 brands of bottled water purchased globally by filtering 500–600 mL per bottle, while for two brands 750–2000 mL per bottle, through a glass fiber filter with a pore size dimension of 1.5 μm; a microplastic contamination ranging from 0 to 10,000 particles per liter was determined. Finally, Kosuth et al. [6] evaluated the presence of microplastics in tap water, filtering about 500 mL of water through a 2.5 μm pore size filter, and determined a microplastic contamination of 0 to 61 particles/L. These studies highlighted the need to clarify the real risk of exposure to microplastics for humans and to determine the type and the concentration of these pollutants to be considered a real risk. In this scenario, the necessity emerges to design filtration systems able to prevent microplastic pollution in tap water to quantify and reduce this threat. The first filters to prevent the microfiber pollution were employed in washing machines in order to capture microfibers in the washing machine drum or by an external filter [30,31,32,33]. The aim of this work was to test the effectiveness of a filtering device for tap water composed by a porous membrane, directly applied to the faucets with the purpose to monitor and reduce this anthropogenic pollution in potable water. The used system was a prototype useful for the detection and sampling of microfibers, including synthetic and natural ones. The system may be implemented to realize a durable and reusable domestic device. The prototype represents a useful tool to improve the quality of the tap water by removing undesirable fragments. The applied prototype was made with a concentration head with a diameter of 30 mm and a membrane with a diameter of 5 mm and a porosity of 50 µm. The membrane porosity allows the water flow, so taking into consideration that microfibers have two dimensions, the diameter and the length, the size pore of 50 µm represents a good balance among the water flow and contamination retention. This prototype was used for natural and synthetic microfiber detection, but it could be scaled up for water filtration directly on the faucet. The device was tested using potable water of several cities in Slovenia. Sampling was performed in three indoor private houses and one public office to gain a representative water sample of different Slovenian locations. The results highlight the effectiveness of the applied device into removing microfibers from tap water and confirm the abundance of microfiber, both natural and synthetic, as a contaminant of potable water.

2. Materials and Methods

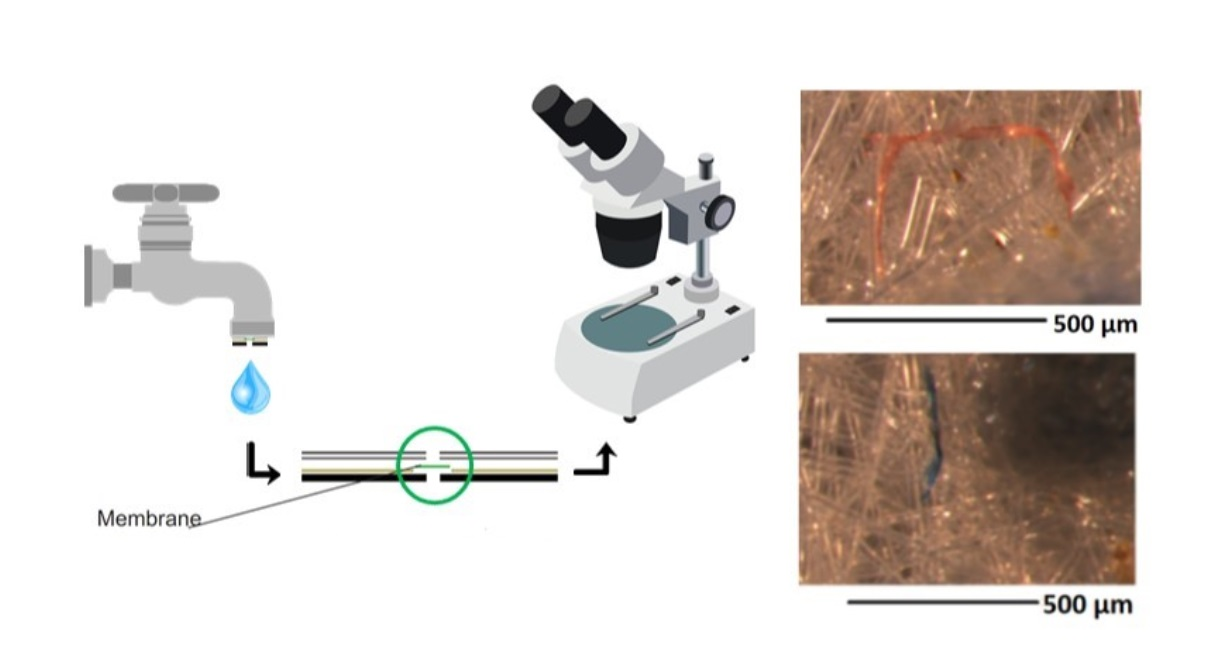
2.1. Filtration Device

The tested device was developed by the Slovenian company TF Lab. A drawing of the prototype is reported in Figure 1a.
The concentration head was mounted directly on the faucet, where water entered through a silicone seal. The concentration head is a filter housing that is adapted to insert a disc that has a 5 mm hole on which the membrane is located. The membrane acts as a sieve on which fragments and fibers of microplastics are stopped. Because all the fibers are concentrated within a radius of 5 mm, this is called a concentration head. The filtering membrane was made with thermosetting polyesters, and membrane shape was obtained using a laser cutting system. The membrane was stable under pressure between 1 to 5 bars with different temperatures from 10 °C to 60 °C. The filtering membrane presents an average porosity close to 50 µm. The replicable membrane costs about 1 euro and needs to be replaced approximately every month, depending on the water quality. The used filter could be disposed following local waste management.
Water flew through the disk into a measuring vessel. The pressure from the water network pushed water through a 5 mm point where the membrane was located. Plastic fibers and eventually fragments were retained on the membrane. The filter appearance under light microscope is reported in Figure 1b. Membranes before and after filtration were observed using LEICA M205C light microscope, and the obtained micrographs are reported in Figure S1. As expected, no microfibers or other fragments were detected on their surface before filtration.

2.2. Sampling Method

An amount of 20 L of potable water recovered in different locations in Slovenia (Obalno-kraška) was filtered using the device reported in Figure 1. Four samples were recovered from four different Slovenian locations: Location N. 1 Pot na brido, N. 2 Bosamarin 21, N. 3 Bosamarin 13, and finally location N. 4 Prisoje. Samples from 1 to 3 were filtered water obtained from a private house kitchen, whereas the fourth sample was obtained after filtration of water in a public building. The selected locations were served from the same water supplier, in particular from the Capodistria municipal system. The filtration system used for the sample recovered was a close system which allows the reduction of contamination. In fact, the device was tested by being mounting directly to the faucet in private and public buildings.
Microscopical observation
Filter surfaces were analyzed using a LEICA M205C light microscope with a magnification of 0.78–16×, with the purpose to evaluate the presence of fragments and microfibers. Microfibers were classified on the basis of their morphological features, color, and length. For sample analysis and micrograph acquisition, the following procedure was employed: (1) each filter was considered divided in four frames, as described in Figure S2 in SI; (2) each frame was captured with a magnification of 0.78×; (3) different magnifications were used in order to capture the details. All the frames acquired were placed in Table S1.
In order to assess the surrounding environment contamination, 3 filter papers were placed into petri dishes near the microscope board during observation timing of all the samples. The filter papers were observed using a LEICA M205C light microscope to check for the presence of contaminants. The results showed the presence of cellulosic fibers in very low quantity, in fact 1 fiber in only one petri dish was observed with the LEICA M205C light microscope (Figure S3). As a result, the contamination due to the surrounding environment was considered negligible.
To evaluate the presence of smaller particles, filter surfaces were analyzed using a Scanning electron microscope, SEM, Quanta 200 FEG (FEI, The Netherlands). SEM observations were performed in low vacuum mode (PH2O ¼ 0.7 torr) using an accelerating voltage of 10 kV and a large field detector (LFD). The observations were conducted on filters without any modification, pretreatment, or coating with metal layer.
QA/QC
Cross-contamination of microfibers from the environment on the membrane was prevented by closing the membrane in petri dishes soon after the sampling. Filter papers were placed near a microscope to evaluate the environmental contamination during membrane observation. Results showed a negligible contamination effect, and no correction of the data was performed. Furthermore, cotton lab coats and nitrile gloves were worn during all the experimental work.

3. Results

In the present study the occurrence of microfibers contamination in kitchen tap water was investigated, as well as the effectiveness of a device to capture microfiber pollutants. The optical observation of the filter surfaces allowed us to determine the number of microfibers (natural and synthetic microfibers) per L of filtered water and their classification in natural and synthetic ones. Microfibers that did not show a uniform diameter, twisted upon themselves like flat ribbons, were classified as natural microfibers (Figure 2a), while microfibers with a smooth and shiny surface that showed a cylindrical shape were identified as synthetic microfibers (Figure 2b), as described in the introduction. Cotton fibers were distinguished from other types of fibers by the presence of convolutions along the longitudinal axis, both clockwise and anti-clockwise. They are, in fact, like flat ribbons characterized by a central channel along the fiber length. Flax fibers were characterized by a polygonal structure in the section perpendicular to the fiber axis that appears transparent under the microscope, similar to a striated glass tube, with numerous marked striations. The structure of the wool, as well as all the fibers obtained from animal’s hairs, had a complex structure that consisted of scales over the entire fiber surface. Finally, concerning the natural fibers, the raw silk had a slightly flattened cylindrical section with a non-homogeneous thickness. The synthetic fibers, like polyester and polyamide, consisted of single filaments with smooth and regular surfaces, with a cylindrical longitudinal section that was present on the surface having a low number of striations that was sometimes not observable.
Chemical identification of microfibers using vibrational spectroscopies such as Fourier transform infrared spectroscopy and Raman spectroscopy was not applicable on the analyzed samples. In fact, the used membrane is not transparent and absorbs IR radiation, leading to absorption bands in the FTIR spectrum that cause strong spectral interference, hindering spectra acquisition in both transmission, reflection, and ATR mode. Spectral interference, e.g., fluorescence, occurred using Raman spectroscopy. The presence of the spectral interference from the substrate compromises the ability to obtain compositional information of the microfibers.
The optical observation of the filter surfaces allows the detection of the presence of 57 microfibers, including natural and synthetic microfibers, analyzing all the samples, with a mean value of 14 fibers/sample (Figure 3a), corresponding to 0.71 microfiber/L of filtered water (n = 4). Among all the detected microfibers, about 61% were classified as natural microfibers and 39% were classified as synthetic microfibers (Figure 3b). In particular, the microfibers, both natural and synthetic, detected filtering private tap kitchen water were between 0.15 and 1.4 microfiber/L, with an average of 0.78 microfiber/L, while the public tap water reported a contamination of 0.5 microfiber/L. No fragments were observed in the analyzed membrane.
The microfibers found were classified on the basis of typical morphological features in natural and synthetic fibers.
The found natural and synthetic microfibers were further divided by the color (Figure 4). The most common colors of microfibers detected were black (44%) and blue (21%), followed by brown (19%) and pink (10%), corresponding to 25 black fibers, 12 blue fibers, 11 brown fibers, and finally 5 pink fibers. The remaining fibers recovered from the filtration devices were orange and light blue. A small aliquot of microfibers detected was orange and light blue (both represented 3% of the whole amount). It is to be highlighted that, given the fibrous nature of the filtering membrane, some white or uncolored microfibers could be difficult to detect, and in this respect, it is reasonable that there is an underestimation of the detected microfibers.
The lengths of the natural and synthetic microfibers were determined by using the light microscope and analyzing the acquired micrographs by ImageJ (release 1.43u) (Figure 5).
To reveal the presence of smaller particles and fibers not detectable using optical microscopy, SEM micrographs of the filter surfaces were acquired [34]. In particular, as reported in Figure S4, in addition to long microfibers already evidenced by optical microscopy, SEM analysis further detected on filter surface different particles that their morphological features, with typical sharp edges and flat surfaces, were recognized as salts and inorganic particles. Therefore, SEM analysis confirmed that in this work the analysis by optical microscopy was sufficient to evidence the presence of natural and synthetic microfibers without the need for higher magnification observations.

4. Discussion

The microscopic observation allowed us to identify 57 microfibers, including natural and synthetic microfibers, in the analyzed filters. The detected microfibers were classified on the basis of their morphological features, highlighting that 61% of the recovered microfibers were potential natural fibers, and 39% were potential synthetic ones. Likewise, in both private and public tap water samples, the microfibers recovered with the filtration system were mainly of natural origin. This result is in accordance with other works in literature which reported that the greatest textile shedding was estimated in case of natural microfibers compared to synthetic ones [18,35,36]. This result is also in line with Dris et al. [28], who found in indoor monitoring that the fibers collected for the 67% were potential natural fibers, mainly cellulosic, and the rest were potentially of synthetic nature. Overall, the amount of natural and synthetic microfibers found in the present work was lower compared with the number of microplastics detected in bottled water, probably due to the different sampling method and the different contamination exposure. Manson et al. [8] found an average of 325 microplastic particles per L of bottled, while Kosuth et al. [6] highlighted a contamination in tap water that ranged from 0 to 61 particles/L, corresponding to a mean value of 5.45 particles/L, of which the 98.3% of micro-debris detected was fibers, in accordance with the present work. In fact, in this study no microfiber with another shape than a fibrous one was observed on the filter surface.
A large part of detected natural and synthetic microfibers were black (66%) and blue (23%). The length of the recovered microfibers was in agreement with that determined in another work focused on tap water [6] and in several works that investigated the presence of microfiber contamination in seawater and sediments [37,38,39,40]. In particular, the length of the microfibers, both natural and synthetic, detected in a private house was found to range from to 120 to 4908 μm, while the microfibers recovered from the tap water of a public building were characterized by a length ranging from 124 to 1311 μm. The mean length of the analyzed microfiber was 999 ± 897 μm, close to the length determined for microfibers detected in tap water of several nations [6], ranged from 100 to 5000 μm, with a mean value of about 960 μm. The obtained results were summarized in Table 1. In the private houses the amount of natural and synthetic microfibers found in three different location allows to report a microfiber contamination ranged from 3 to 28 items/sample (n = 3), including natural and synthetic microfibers. As regard the sampling in public space, a number of microfibers were found in 10 items/sample (n = 1) (Figure 6). It is necessary to consider that further analysis is needed in order to enhance the reliability of the results, in particular in public spaces. Finally, the mean value of diameter recorded for natural microfibers was 20 ± 6 μm and 10 ± 3 μm for synthetic microfibers. All the data, including diameter, length, and color, are reported in Table S2.
The risk associated with the microplastics contamination is mainly due to the small dimensions of these fragments, which could be not blocked from the Wastewater Treatments plants (WWTs) [18] and from the Drinking Water Treatment plants (DWTPs) [41,42], entering in drinking water lines [43]. Microfibers can act as carriers of various pollutants, so if people drink contaminated water, they may be exposed to several toxins [44,45], such as colorants, and compounds with heavy metals such as chromium, cadmium, and other components used in the production process [46,47,48,49]. Moreover, natural textile fibers, such as cotton fibers, notwithstanding their natural origin, could represent a problem for the environment due the large volumes of water used for cotton culture, pesticides and herbicides [50], and chemicals and finishing treatments used in the textile industry to confer to cellulosic fabric specific color and properties. Monitoring of microplastics in drinking-water is not recommended at this time, however on January 2021 the European Union has issued a new Directive on drinking water, updating the previous one (98/83/EC), to include MPs on ‘the watch list’ of emerging compounds by 2024 [51]. Drinking water may be not the main source of microplastic uptake for human in comparison with food or inhalation, but the continuous exposure to low amount of microplastics through drinking water may induce accumulation and a potential risk. In the present work, contamination values, as a number of natural and synthetic microfibers, were found to be lower than those reported in literature. This could be due to the porosity of the used membrane (50 µm) that does not allow to capture small microfibers. However, such membrane porosity is required to allow the water flow and to avoid clogging phenomena. In order to evaluate the potential human exposure to microfibers, both of synthetic and natural origin, the obtained results were scaled up to get an estimation of the possible number of microfibers that a single person could ingest per year by assuming tap water. For the scale up it was assumed that one person consumes 2 L of water per day, as recommended. This leads to determine that one person, by drinking tap water, may ingest a number of microfibers per year, ranging from 109 to 1022. The application of the membrane could reduce the humane exposure. The used device could have the great advantages of being economical, reusable, easy to use and to assemble to the faucet. In addition, it could be an easy sampling system for water analysis, to reduce transport of large quantities of water, and to carry out on-site tests.

5. Conclusions

In this work 57 microfibers, including natural and synthetic, in 80 L of potable water in Slovenian were found. The detected microfibers were classified on the basis of their morphological features, highlighting that the 61% were natural fibers, and the rest of the microfibers were of synthetic nature. This result was in agreement with several works reported in literature, which described that the greatest textile shedding was obtained in the case of cellulosic fibers compared to the synthetic ones. For these reasons, this work could provide the basis for the development of specific filters to reduce microfiber contamination in drinking water. Currently, the monitoring of microplastic in water is not regulated from the European Water Framework Directive, but it is expected that they will be included in the future European Drinking Water Directive. The goal of this work is to report preliminary results about the efficiency of the filtration system to eliminate microfiber contamination, including natural and synthetic microfibers, from the water. In order to improve tap water quality for human consumption, removing undesirable fragments, a durable and reusable device based on this prototype system should be developed. The realization of a device based on this prototype could represent a useful tool to improve the quality of the tap water by removing undesirable fragments.
The knowledge and information gathered in this work could be fundamental to enable future actions to prevent microfiber contamination and developed specific tap filters.

Supplementary Materials

The following supporting information can be downloaded at: https://0-www-mdpi-com.brum.beds.ac.uk/article/10.3390/microplastics1030024/s1, FigureS1: Appearance of the membrane (a) before and (b) after filtration, Figure S2: Description of the method used to count microfibers on the filters surface, Figure S3: Microfibers recovered from the Petri dishes placed on the (a) balance and (b) microscopy table in the laboratory during the handle of the samples, Figure S4: SEM micrographs of filter surface, Table S1: Acquisitions of microfibres recovered from the filter divided in the four ideal frames, Table S2: Summery of microfiber characteristics.

Author Contributions

Conceptualization, M.V., M.C. and H.E.K.; methodology, all authors contributed to the development of methodology.; investigation, M.V.; writing—original draft preparation, M.V. and M.C.; writing—review and editing, all authors contributed to the review and editing of the manuscript; supervision, M.C. and H.E.K. All authors have read and agreed to the published version of the manuscript.

Funding

This study was supported by the research project “SIstemi di Rilevamento dell’Inquinamento Marino da Plastiche e successivo recupero-riciclo. SIRIMAP PON-Project” from the Ministry of Education, Italy and by Bilateral Agreement CNR/CNRST 2022–2023 “Microplastic assessment originated from sea-salt and bottled water in the Mediterranean and Atlantic region”.

Institutional Review Board Statement

Not applicable.

Data Availability Statement

Not applicable.

Conflicts of Interest

The authors declare no conflict of interest. The funders had no role in the design of the study; in the collection, analyses, or interpretation of data; in the writing of the manuscript, or in the decision to publish the results.

References

  1. Browne, M.A.; Crump, P.; Niven, S.J.; Teuten, E.; Tonkin, A.; Galloway, T.; Thompson, R. Accumulation of Microplastic on Shorelines Woldwide: Sources and Sinks. Environ. Sci. Technol. 2011, 45, 9175–9179. [Google Scholar] [CrossRef] [PubMed]
  2. Sanchez-Vidal, A.; Thompson, R.C.; Canals, M.; de Haan, W.P. The imprint of microfibres in southern European deep seas. PLoS ONE 2018, 13, e0207033. [Google Scholar] [CrossRef] [PubMed]
  3. de Villiers, S. Microfibre pollution hotspots in river sediments adjacent to South Africa’s coastline. Water SA 2019, 45, 97–102. [Google Scholar] [CrossRef] [Green Version]
  4. Dris, R.; Gasperi, J.; Rocher, V.; Tassin, B. Synthetic and non-synthetic anthropogenic fibers in a river under the impact of Paris Megacity: Sampling methodological aspects and flux estimations. Sci. Total Environ. 2018, 618, 157–164. [Google Scholar] [CrossRef] [PubMed] [Green Version]
  5. Palazzo, L.; Coppa, S.; Camedda, A.; Cocca, M.; De Falco, F.; Vianello, A.; Massaro, G.; de Lucia, G.A. A novel approach based on multiple fish species and water column compartments in assessing vertical microlitter distribution and composition. Environ. Pollut. 2021, 272, 116419. [Google Scholar] [CrossRef]
  6. Kosuth, M.; Mason, S.A.; Wattenberg, E.V. Anthropogenic contamination of tap water, beer, and sea salt. PLoS ONE 2018, 13, e0194970. [Google Scholar] [CrossRef]
  7. Kniggendorf, A.K.; Wetzel, C.; Roth, B. Microplastics detection in streaming tap water with raman spectroscopy. Sensors 2019, 19, 1839. [Google Scholar] [CrossRef] [Green Version]
  8. Mason, S.A.; Welch, V.G.; Neratko, J. Synthetic Polymer Contamination in Bottled Water. Front. Chem. 2018, 6, 407. [Google Scholar] [CrossRef] [Green Version]
  9. Liebezeit, G.; Liebezeit, E. Synthetic particles as contaminants in German beers. Food Addit. Contam. Part A 2014, 31, 1574–1578. [Google Scholar] [CrossRef]
  10. Iñiguez, M.E.; Conesa, J.A.; Fullana, A. Microplastics in Spanish Table Salt. Sci. Rep. 2017, 7, 1–7. [Google Scholar] [CrossRef]
  11. Yang, D.; Shi, H.; Li, L.; Li, J.; Jabeen, K.; Kolandhasamy, P. Microplastic Pollution in Table Salts from China. Environ. Sci. Technol. 2015, 49, 13622–13627. [Google Scholar] [CrossRef] [PubMed]
  12. Karami, A.; Golieskardi, A.; Keong Choo, C.; Larat, V.; Galloway, T.S.; Salamatinia, B. The presence of microplastics in commercial salts from different countries. Sci. Rep. 2017, 7, 1–11. [Google Scholar] [CrossRef] [PubMed] [Green Version]
  13. Eerkes-Medrano, D.; Leslie, H.A.; Quinn, B. Microplastics in drinking water: A review and assessment. Curr. Opin. Environ. Sci. Heal. 2019, 7, 69–75. [Google Scholar] [CrossRef] [Green Version]
  14. Santonicola, S.; Volgare, M.; Di Pace, E.; Cocca, M.; Mercogliano, R.; Colavita, G. Occurrence of potential plastic microfibers in mussels and anchovies sold for human consumption: Preliminary results. Ital. J. Food Saf. 2021, 10, 9962. [Google Scholar] [CrossRef]
  15. Liebezeit, G.; Liebezeit, E. Non-pollen particulates in honey and sugar. Food Addit. Contam. Part A 2013, 30, 2136–2140. [Google Scholar] [CrossRef]
  16. Boucher, J.; Friot, D. Primary Microplastics in the Oceans: A Global Evaluation of Sources; IUCN: Gland, Switzerland, 2017; p. 43. [Google Scholar]
  17. Volgare, M.; De Falco, F.; Avolio, R.; Castaldo, R.; Errico, M.E.; Gentile, G.; Ambrogi, V.; Cocca, M. Washing load influences the microplastic release from polyester fabrics by affecting wettability and mechanical stress. Sci. Rep. 2021, 11, 1–12. [Google Scholar] [CrossRef]
  18. De Falco, F.; Pace, E.; Cocca, M.; Avella, M. The contribution of washing processes of synthetic clothes to microplastic pollution. Sci. Rep. 2019, 9, 6633. [Google Scholar] [CrossRef]
  19. De Falco, F.; Gullo, M.P.; Gentile, G.; Di Pace, E.; Cocca, M.; Gelabert, L.; Brouta-Agnésa, M.; Rovira, A.; Escudero, R.; Villalba, R.; et al. Evaluation of microplastic release caused by textile washing processes of synthetic fabrics. Environ. Pollut. 2018, 236, 916–925. [Google Scholar] [CrossRef]
  20. Zarfl, C. Promising techniques and open challenges for microplastic identification and quantification in environmental matrices. Anal. Bioanal. Chem. 2019, 411, 3743–3756. [Google Scholar] [CrossRef]
  21. Mariano, S.; Tacconi, S.; Fidaleo, M.; Rossi, M.; Dini, L. Micro and Nanoplastics Identification: Classic Methods and Innovative Detection Techniques. Front. Toxicol. 2021, 3, 1–17. [Google Scholar] [CrossRef]
  22. Hidalgo-Ruz, V.; Gutow, L.; Thompson, R.C.; Thiel, M. Microplastics in the Marine Environment: A Review of the Methods Used for Identification and Quantification. Environ. Sci. Technol. 2012, 46, 3060–3075. [Google Scholar] [CrossRef] [PubMed]
  23. Wilson, J. Handbook of Textile Design; Woodhead Publishing: Sawston, UK, 2001. [Google Scholar] [CrossRef]
  24. Allievo, T. Le Fibre Tessili Di Applicazione Industriale; Degli, A.T., Ed.; Tipografia degli Artigianelli: Torino, Italy, 1908. [Google Scholar]
  25. Quaglierini, C. Chimica Delle Fibre Tessili; Zanichelli: Bologna, Italy, 1989. [Google Scholar]
  26. Preferred Fiber & Materials Market Report 2020 Welcome to the 2020 Preferred Fiber & Materials Market Report. Available online: https://textileexchange.org/2020-preferred-fiber-and-materials-market-report-pfmr-released-2/ (accessed on 15 May 2022).
  27. Dris, R.; Gasperi, J.; Rocher, V.; Mohamed, S.; Tassin, B. Microplastic contamination in an urban area: A case study in Greater Paris. Environ. Chem. 2015, 12, 592–599. [Google Scholar] [CrossRef]
  28. Dris, R.; Gasperi, J.; Mirande, C.; Mandin, C.; Guerrouache, M.; Langlois, V.; Tassin, B. A first overview of textile fibers, including microplastics, in indoor and outdoor environments. Environ. Pollut. 2017, 221, 453–458. [Google Scholar] [CrossRef] [PubMed] [Green Version]
  29. Mintenig, S.M.; Löder, M.G.J.; Primpke, S.; Gerdts, G. Low numbers of microplastics detected in drinking water from ground water sources. Sci. Total Environ. 2019, 648, 631–635. [Google Scholar] [CrossRef] [PubMed]
  30. McIlwraith, H.; Lin, J.; Erdle, L.; Mallos, N.; Diamond, M.; Rochman, C. Capturing microfibers—marketed technologies reduce microfiber emissions from washing machines. Mar. Pollut. Bull. 2019, 139, 40–45. [Google Scholar] [CrossRef]
  31. Browne, M.A.; Ros, M.; Johnston, E.L. Pore-size and polymer affect the ability of filters for washing-machines to reduce domestic emissions of fibres to sewage. PLoS ONE 2020, 15, 1–17. [Google Scholar] [CrossRef]
  32. Napper, I.E.; Barrett, A.C.; Thompson, R.C. The efficiency of devices intended to reduce microfibre release during clothes washing. Sci. Total Environ. 2020, 738, 140412. [Google Scholar] [CrossRef]
  33. De Falco, F.; Di Pace, E.; Avella, M.; Gentile, G.; Errico, M.E.; Krzan, A.; ElKhiar, H.; Zupan, M.; Cocca, M. Development and Performance Evaluation of a Filtration System for Washing Machines to Reduce Microfiber Release in Wastewater. Water Air Soil Pollut. 2021, 232, 1–8. [Google Scholar] [CrossRef]
  34. Pivokonsky, M.; Cermakova, L.; Novotna, K.; Peer, P.; Cajthaml, T.; Janda, V. Occurrence of microplastics in raw and treated drinking water. Sci. Total Environ. 2018, 643, 1644–1651. [Google Scholar] [CrossRef]
  35. Cesa, F.S.; Turra, A.; Checon, H.H.; Leonardi, B.; Baruque-Ramos, J. Laundering and textile parameters influence fibers release in household washings. Environ. Pollut. 2020, 257, 113553. [Google Scholar] [CrossRef]
  36. Zambrano, M.C.; Pawlak, J.J.; Daystar, J.; Ankeny, M.; Cheng, J.J.; Venditti, R.A. Microfibers generated from the laundering of cotton, rayon and polyester based fabrics and their aquatic biodegradation. Mar. Pollut. Bull. 2019, 142, 394–407. [Google Scholar] [CrossRef] [PubMed]
  37. Cole, M.; Webb, H.; Lindeque, P.K.; Fileman, E.S.; Halsband, C.; Galloway, T.S. Isolation of microplastics in biota-rich seawater samples and marine organisms. Sci. Rep. 2014, 4, 1–8. [Google Scholar] [CrossRef] [PubMed] [Green Version]
  38. Cózar, A.; Echevarría, F.; González-Gordillo, J.I.; Irigoien, X.; Úbeda, B.; Hernández-León, S.; Palma, Á.T.; Navarro, S.; García-de-Lomas, J.; Ruiz, A.; et al. Plastic debris in the open ocean. Proc. Natl. Acad. Sci. USA 2014, 111, 10239–10244. [Google Scholar] [CrossRef] [PubMed] [Green Version]
  39. Faure, F.; Saini, C.; Potter, G.; Galgani, F.; de Alencastro, L.F.; Hagmann, P. An evaluation of surface micro- and mesoplastic pollution in pelagic ecosystems of the Western Mediterranean Sea. Environ. Sci. Pollut. Res. 2015, 22, 12190–12197. [Google Scholar] [CrossRef] [PubMed]
  40. Sutton, R.; Mason, S.A.; Stanek, S.K.; Willis-Norton, E.; Wren, I.F.; Box, C. Microplastic contamination in the San Francisco Bay, California, USA. Mar. Pollut. Bull. 2016, 109, 230–235. [Google Scholar] [CrossRef] [PubMed]
  41. Dalmau-Soler, J.; Ballesteros-Cano, R.; Boleda, M.R.; Paraira, M.; Ferrer, N.; Lacorte, S. Microplastics from headwaters to tap water: Occurrence and removal in a drinking water treatment plant in Barcelona Metropolitan area (Catalonia, NE Spain). Environ. Sci. Pollut. Res. 2021, 28, 59462–59472. [Google Scholar] [CrossRef]
  42. Adib, D.; Mafigholami, R.; Tabeshkia, H.; Walker, T.R. Optimization of polypropylene microplastics removal using conventional coagulants in drinking water treatment plants via response surface methodology. J Environ Heal Sci Eng. 2022, 20, 565–577. [Google Scholar] [CrossRef]
  43. Sol, D.; Laca, A.; Laca, A.; Díaz, M. Microplastics in wastewater and drinking water treatment plants: Occurrence and removal of microfibres. Appl. Sci. 2021, 11, 10109. [Google Scholar] [CrossRef]
  44. Li, J.; Liu, H.; Paul Chen, J. Microplastics in freshwater systems: A review on occurrence, environmental effects, and methods for microplastics detection. Water Res. 2018, 137, 362–374. [Google Scholar] [CrossRef]
  45. Andrady, A.L. The plastic in microplastics: A review. Mar. Pollut. Bull. 2017, 119, 12–22. [Google Scholar] [CrossRef]
  46. Murphy, J. Additives for Plastics Handbook, 2nd ed.; Elsevier B.V.: Oxford, UK; New York, NY, USA; Tokyo, Japan, 2001; pp. 30–60. [Google Scholar]
  47. Lambert, S.; Sinclair, C.; Boxall, A. Occurrence, degradation, and effect of polymer-based materials in the environment. In Reviews of Environmental Contamination and Toxicology; Whitacre, D.M., Ed.; Springer: Berlin/Heidelberg, Germany, 2014; Volume 227, pp. 1–53. [Google Scholar] [CrossRef]
  48. Talsness, C.E.; Andrade, A.J.M.; Kuriyama, S.N.; Taylor, J.A.; Saal, F.S.V. Components of plastic: Experimental studies in animals and relevance for human health. Philos. Trans. R Soc. B Biol. Sci. 2009, 364, 2079–2096. [Google Scholar] [CrossRef] [Green Version]
  49. Triebskorn, R.; Braunbeck, T.; Grummt, T.; Hanslik, L.; Huppertsberg, S.; Jekel, M.; Knepper, T.P.; Krais, S.; Müller, Y.K.; Pittroff, M.; et al. Relevance of nano- and microplastics for freshwater ecosystems: A critical review. TrAC Trends Anal. Chem. 2019, 110, 375–392. [Google Scholar] [CrossRef]
  50. Ferrigno, S.; Guadagnini, R.; Tyrell, K. Is Cotton Conquering Its Chemical Addiction; Pesticide Action Network: Berkeley, CA, USA, 2017. [Google Scholar]
  51. European Commission. Directive (EU) 2020/2184 of the European Parlliament and of the Council of 16 December 2020 on the Quality of Water Intended for Human Consumption; Official Journal of the European Union: Brussels, Belgium, 2020; pp. 1–62. [Google Scholar]
Figure 1. (a) Schematic illustration of the filtration system, (b) Micrograph at LEICA M205C light microscope of the entire filter membrane used for the filtration system.
Microplastics 01 00024 g001aMicroplastics 01 00024 g001b
Figure 2. (a) Natural microfiber and (b) synthetic microfiber recovered from the filter surface at a magnification of 16×.
Microplastics 01 00024 g002
Figure 3. (a) Total number of microfibers recovered from the analyzed filters surface in private locations (1, 2, and 3) and in a public building (4); (b) Discrimination into synthetic and natural microfibers of the total number recovered from the four locations.
Microplastics 01 00024 g003aMicroplastics 01 00024 g003b
Figure 4. Percentage distribution of microfibers colors in the samples.
Microplastics 01 00024 g004
Figure 5. Distribution of mean lengths of microfibers recovered from the analyzed filters in private locations (1, 2, and 3) and public building (4).
Microplastics 01 00024 g005
Figure 6. Distribution of microfibers contamination, as the number of microfibers reported in spot, in tap water of three private house (blue) and a single public building (orange) in Obalno-kraška, Slovenia.
Microplastics 01 00024 g006
Table 1. Summary of the results.
SampleLocationMicrofibers (N)Microfibers (N/L)Min. Length (μm)Max. Length (μm)Mean Length (μm)
1Pot na Brido, Ankaran, Slovenia160.82421576638
2Bosamarin 21, Koper30.1535649082033
3Bosamarin 12, Koper281.412040211208
4Prisoje, Koper100.51241311646
Publisher’s Note: MDPI stays neutral with regard to jurisdictional claims in published maps and institutional affiliations.

