Article

Study on the High-Pressure Behavior of Goethite up to 32 GPa Using X-Ray Diffraction, Raman, and Electrical Impedance Spectroscopy

1
Center for High Pressure Science and Technology Advanced Research, Changchun 130012, China
2
School of Materials Science and Engineering, Changchun University of Science and Technology, Changchun 130022, China
3
Center for the Study of Matter at Extreme Conditions, Department of Mechanical and Materials Engineering, Florida International University, Miami, FL 33199, USA
4
State Key Laboratory of Superhard Materials, College of Physics, Jilin University, Changchun 130012, China
5
State Key Laboratory of Inorganic Synthesis and Preparative Chemistry, College of Chemistry, Jilin University, Changchun 130012, China
*
Author to whom correspondence should be addressed.
Submission received: 2 January 2020 / Revised: 16 January 2020 / Accepted: 20 January 2020 / Published: 23 January 2020
(This article belongs to the Special Issue Mineral Physics—In Memory of Orson Anderson)

Abstract

:
Goethite is a major iron-bearing sedimentary mineral on Earth. In this study, we conducted in situ high-pressure x-ray diffraction, Raman, and electrical impedance spectroscopy measurements of goethite using a diamond anvil cell (DAC) at room temperature and high pressures up to 32 GPa. We observed feature changes in both the Raman spectra and electrical resistance at about 5 and 11 GPa. However, the x-ray diffraction patterns show no structural phase transition in the entire pressure range of the study. The derived pressure-volume (P-V) data show a smooth compression curve with no clear evidence of any second-order phase transition. Fitting the volumetric data to the second-order Birch–Murnaghan equation of state yields V0 = 138.9 ± 0.5 Å3 and K0 = 126 ± 5 GPa.

1. Introduction

Although both goethite (α-FeOOH) and hematite (Fe2O3) are major iron-bearing sedimentary minerals, goethite has received less attention in the research of Earth’s deep interior due to its instability at high temperatures. Upon heating, goethite decomposes into hematite and water [1,2]. The recent discovery of a pyrite-structure phase in FeOOH at lower mantle pressure and temperature conditions has led to more research on goethite [3,4,5,6]. There have been a few studies on its behavior at high pressures. In addition to its three other naturally occurring forms (akaganeite (β-FeOOH), lepidocrocite (γ-FeOOH), and feroxyhyte (δ-FeOOH)), two high-pressure phases (ε-FeOOH and pyrite-FeOOH) have been reported experimentally through heating at high pressures above 5 GPa [1,2,7] and 90 GPa [4,5,6,8], respectively. Before transforming to pyrite-FeOOH, ε-FeOOH experiences a second-order transition at 43 GPa with symmetry change from P21nm to Pnnm, accompanied by a sluggish high-spin to low-spin transition [9]. The spin transition also occurs in goethite at 45 GPa as an isostructural first-order phase transition [10,11]. Infrared and Raman spectroscopy indicate a few changes in the pressure range up to 45 GPa [10,12,13]. In a recent study, Liu et al. [12] reported two pressure-induced phase transitions at 7 and 20 GPa through Raman spectroscopy and electrical conductivity studies and attributed these two transitions to the structural transformation to ε-FeOOH (at 7 GPa) and an isostructural second-order transition (at 20 GPa). P-V equation of state (EOS) studies of goethite at room temperature are also very diverse; the measured bulk modulus (K0) of ambient pressure and temperature ranges from 86 to 148 GPa [1,10,14,15,16,17,18]. Here, we report our high-pressure experimental studies of goethite using x-ray diffraction, Raman spectroscopy, and electrical impedance spectroscopy (EIS) up to 32 GPa in order to comprehend the discrepancies among observations of the high-pressure behavior of goethite from different studies in this pressure range. While we found similar phenomena in Raman spectroscopy and electrical impedance experiments to those reported by Liu et al. [12], the x-ray diffraction shows no structural phase transition in the pressure range studied. The analysis of the volumetric data as a function of pressure indicates that there is unlikely to be any second-order transition with a discontinuity of compressibility. The origin of the change in Raman spectra and electric conductivity remains unclear, although a sluggish magnetic state transition from antiferromagnetic (AFM) to ferromagnetic (FM) may be an explanation.

2. Materials and Methods

The starting material in our experiments was goethite (α-FeOOH) from Alfa Aesar with ≥99% purity. All measurements of x-ray diffraction (XRD), Raman, and electrical impedance spectroscopy (EIS) were conducted using a diamond anvil cell (DAC) (manufacture, city, country) with a 400 μm anvil culet and rhenium metal gasket for high-pressure generation. Inert neon gas and a mixture of 16:3:1 methanol-ethanol-water was used for pressure transmission in the XRD and Raman experiments, respectively, and no pressure transmission medium was used in EIS experiments. The goethite sample was loaded into a chamber 200 μm in diameter, together with small ruby spheres. The sample pressure was determined through in situ fluorescence measurement and the ruby pressure scale [19]. In situ x-ray diffraction was conducted at HPCAT of Advanced Photon Source (APS) (Lemont, IL, USA) with a wavelength of 0.4066 Å. The collected x-ray diffraction patterns were processed using the General Structure Analysis System (GSAS) software (manufacture, city, country) [20]. The P-V equations of state (EOS) were derived using EosFit7-GUI [21]. Raman spectroscopy was performed using a Micro-Raman Spectroscopy (inVia Reflex, Renishaw, KWotton-under-Edge, United Kingdom) System. A 532 nm diode-pumped solid-state laser was used to excite the sample, and Raman spectra were collected using a charge-coupled device (CCD)-spectrograph in the 150–5000 cm−1 range.
In the EIS measurement, a time (t)-dependent sinusoidal voltage was applied to the sample inside the DAC (Figure 1):
E(t) = E0 sin (ωt),
where ω is the angular frequency (ω = 2πf, where f is the frequency). For a linear (or pseudolinear) sample, the current response to a sinusoidal voltage is a sinusoid at the same frequency, but shifted in phase by ϕ(ω), which is a function of frequency:
I(t) = I0(ω) sin (ωt + ϕ(ω)).
The impedance of the sample is defined by the ratio of E(t)/I(t):
Z(ω) = E(t)/I(t) = (E0/I0(ω)) sin (ωt)/sin (ωt + ϕ(ω)).
when the applied voltage and its current response are expressed as a complex number,
E(t) = E0 exp(jωt) and I(t) = I0(ω) exp[j(ωt + ϕ(ω))],
the impedance is expressed by
Z(ω) = [E0 exp(jωt)]/[I0(ω) exp(jωt + jϕ(ω))]
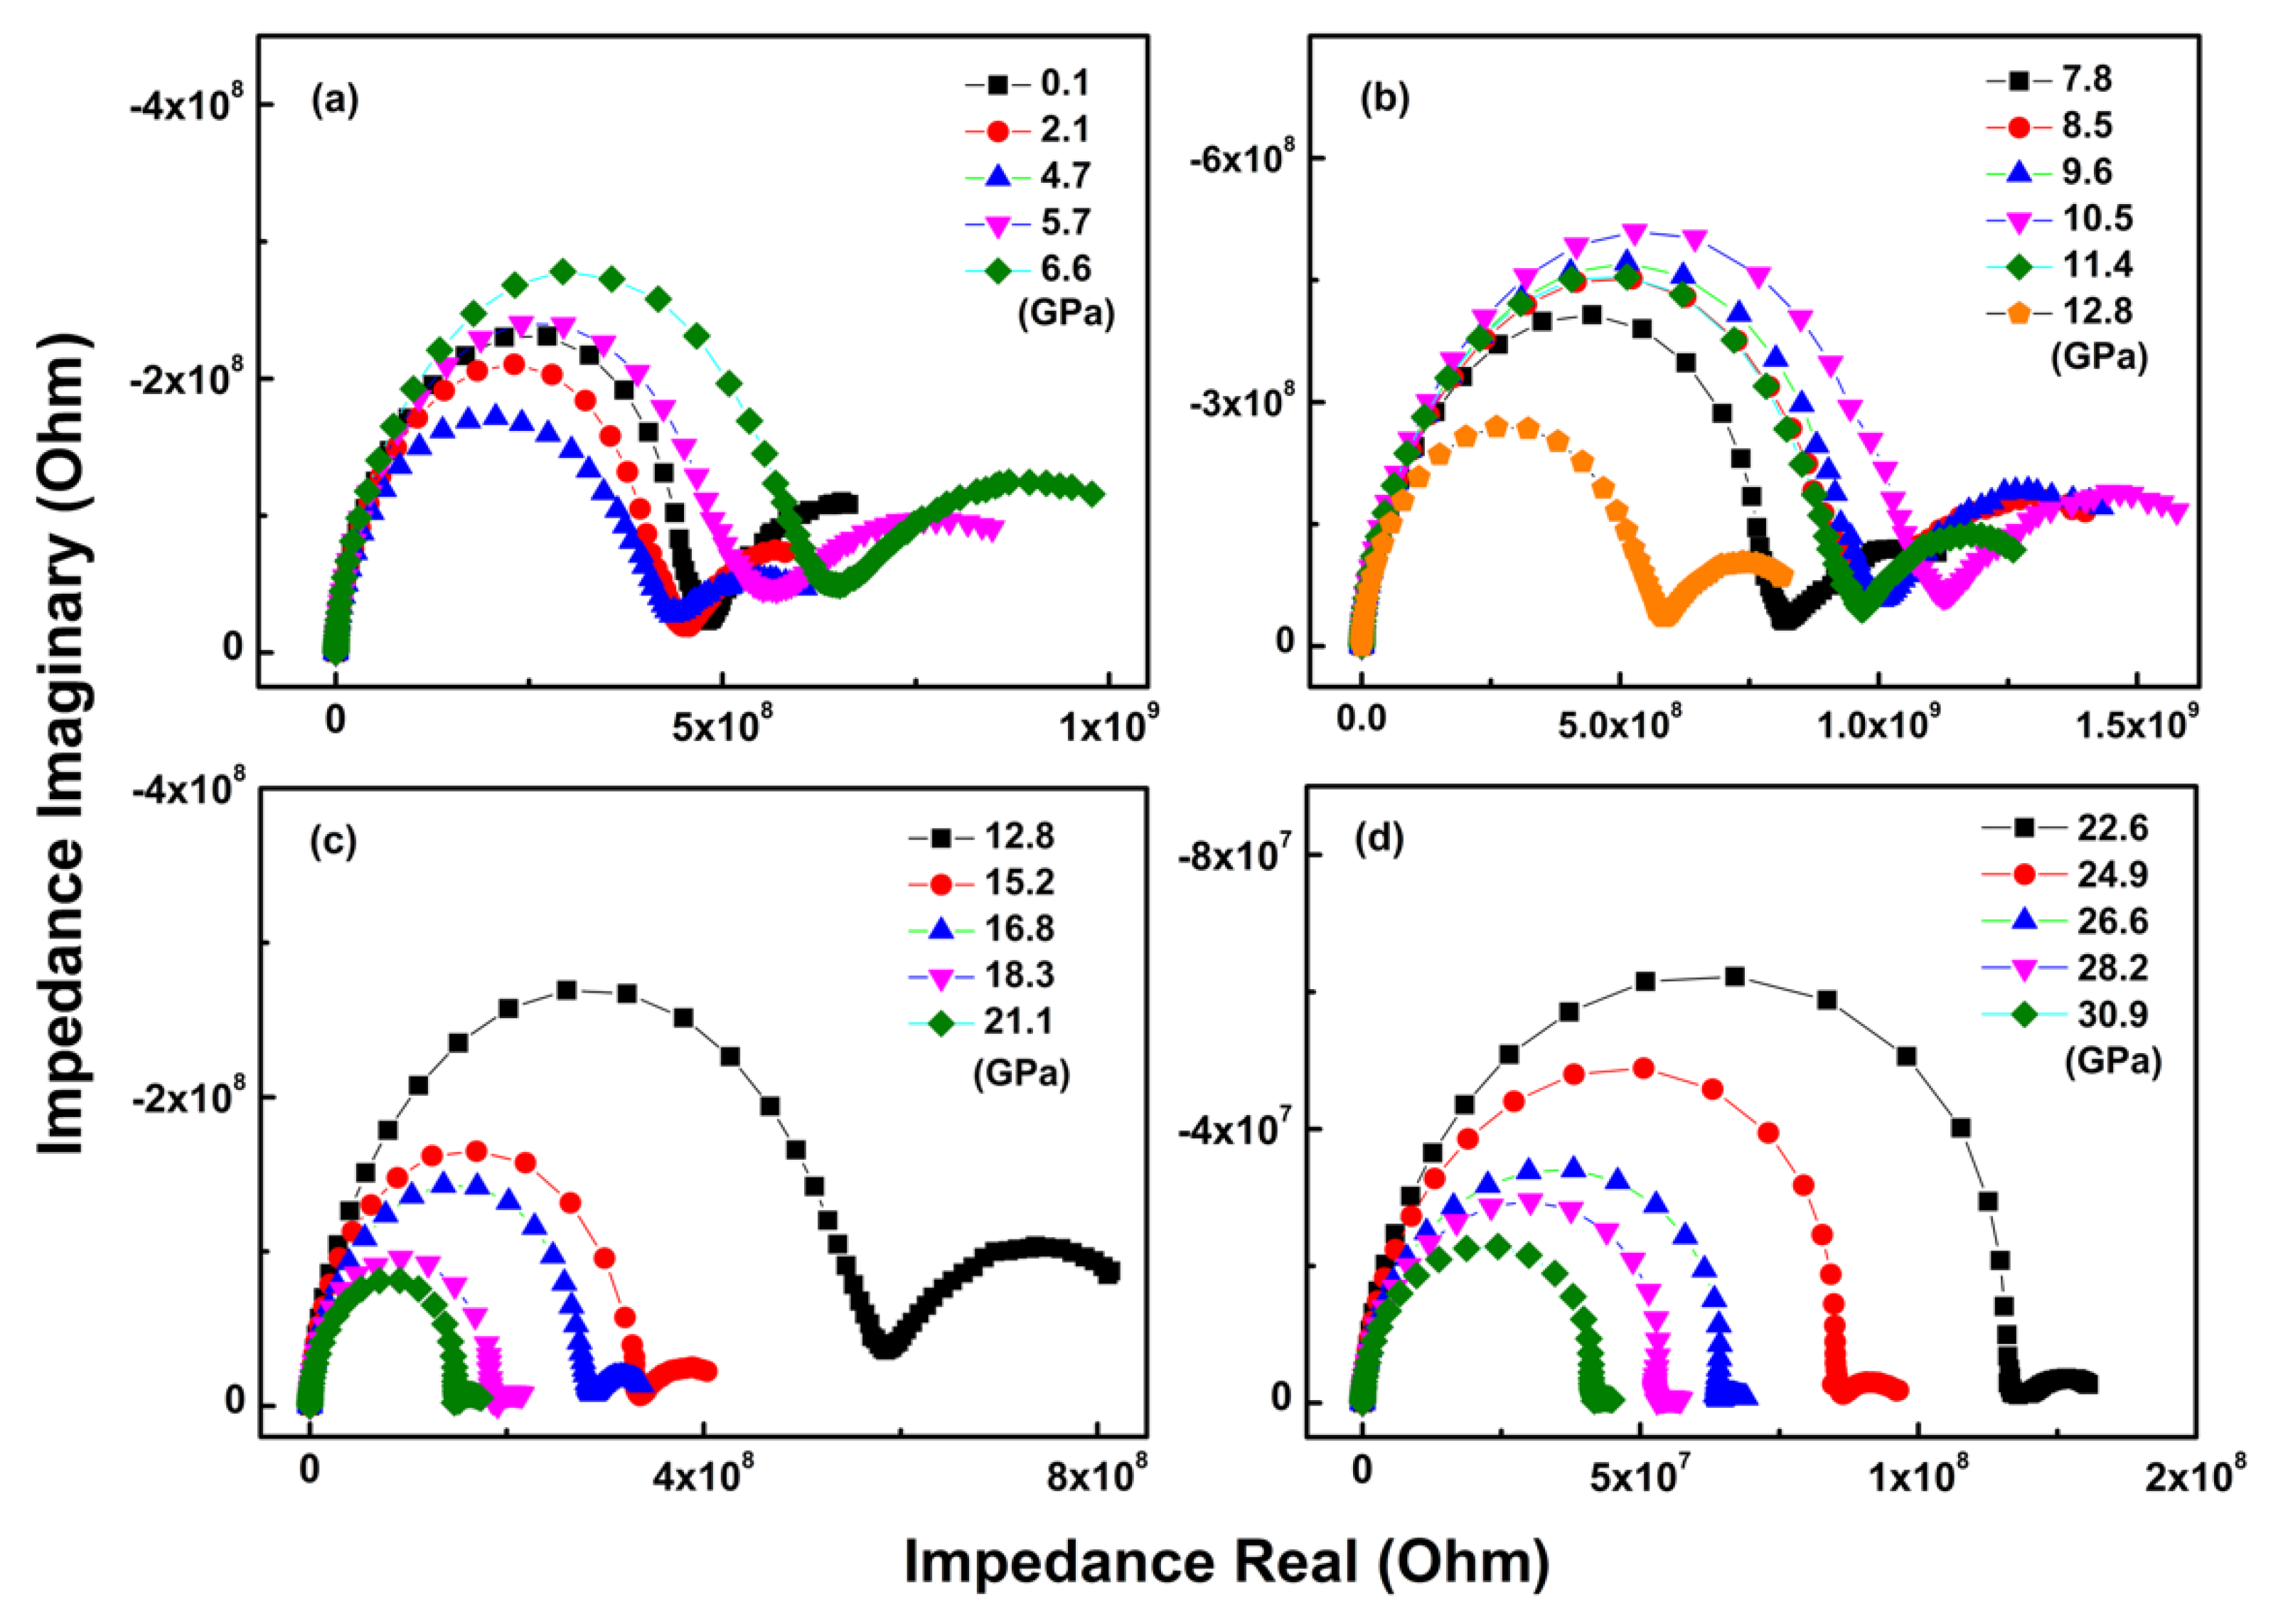
= (E0/I0(ω)) exp(−jϕ(ω)) = Z0(ω) [cos (ϕ(ω)) − (j)sinϕ(ω)]
= ZR(ω) − ZI(ω) j
where Z0(ω) = E0/I0(ω) is the magnitude of impedance and Z(ω) is composed of a real part (ZR(ω) = Z0(ω) cos(ϕ(ω)) and an imaginary part (−ZI(ω) = −Z0(ω) sin (ϕ(ω)).
A simple sample system can be considered as an R-C circuit, i.e., a bulk resistance (R) and bulk capacitance (C) in parallel (Figure 2a). The impedance (Z) of this circuit follows
1 Z ( ω ) = 1 R + 1 1 / ( j ω C )
therefore,
  Z ( ω ) = R 1 + j ω C R = R 1 + ( ω C ) 2 j ω C R 2 1 + ( ω C ) 2 .
let
Z R ( ω ) =   R 1 + ( ω C ) 2   and   Z I ( ω ) = ω C R 2 1 + ( ω C ) 2 ,
and eliminating ω from ZR and ZI, we get the relation between ZR and ZI:
( Z R ( ω ) R 2 ) 2 + Z I ( ω ) 2 = ( R 2 ) 2 .
Hence, the bulk resistance R can be obtained from the radius of the ZI(ω) vs. ZR(ω) semicircle (i.e., Nyquist plot [22]) of the EIS experiment with Z(ω) = ZR(ω) − ZI(ω)j (Figure 2b). In the Nyquist plot, the frequency (ω) does not appear in the equation, but the ZR axis is the direction of decreasing ω. When ω = 0 (i.e., direct current), the impedance only has the real part with Z = R. As ω increases, ZR(ω) decreases from R and ZI(ω) increases from 0, following the semicircle. At the maximum point of the semicircle, ZRm) = ZIm) = R/2. Incorporating this into Equation (7), we get ωmRC = 1. Therefore, ωm = 1/(RC) = 1/τ (τ = RC is the time constant or relaxation time of the system).
In a polycrystalline sample, an equivalent circuit can be composed through a simplified series two-phase model [23], taking the grain interior (intra-grain) as phase 1 and the grain boundary (inter-grain) as phase 2 (Figure 2c). In reality, the bulk capacitance (C) is replaced by the constant phase element (CPE) with ZCPE = ZC/(jω)n, where 0 ≤ n ≤ 1. When n = 0, ZC = R (pure resistance); when n = 1, ZC = 1/C (pure capacitance). The Nyquist plot for the polycrystalline sample consists of two semicircles (Figure 2d). For porous polycrystals, the resistance of the grain boundary is larger and, therefore, its ZI(ω) vs. ZR(ω) semicircle has a larger radius than that of the grain interior, according to Equation (8).
The EIS measurements were conducted using a Solartron 1260 Phase-Gain-Analyzer equipped with a Solartron 1296 dielectric interface. A sinusoidal voltage signal with a 1.0 V magnitude was applied to the sample in a DAC (Figure 1). The signal frequency ranged from 0.1 Hz to 10 MHz.

3. Results

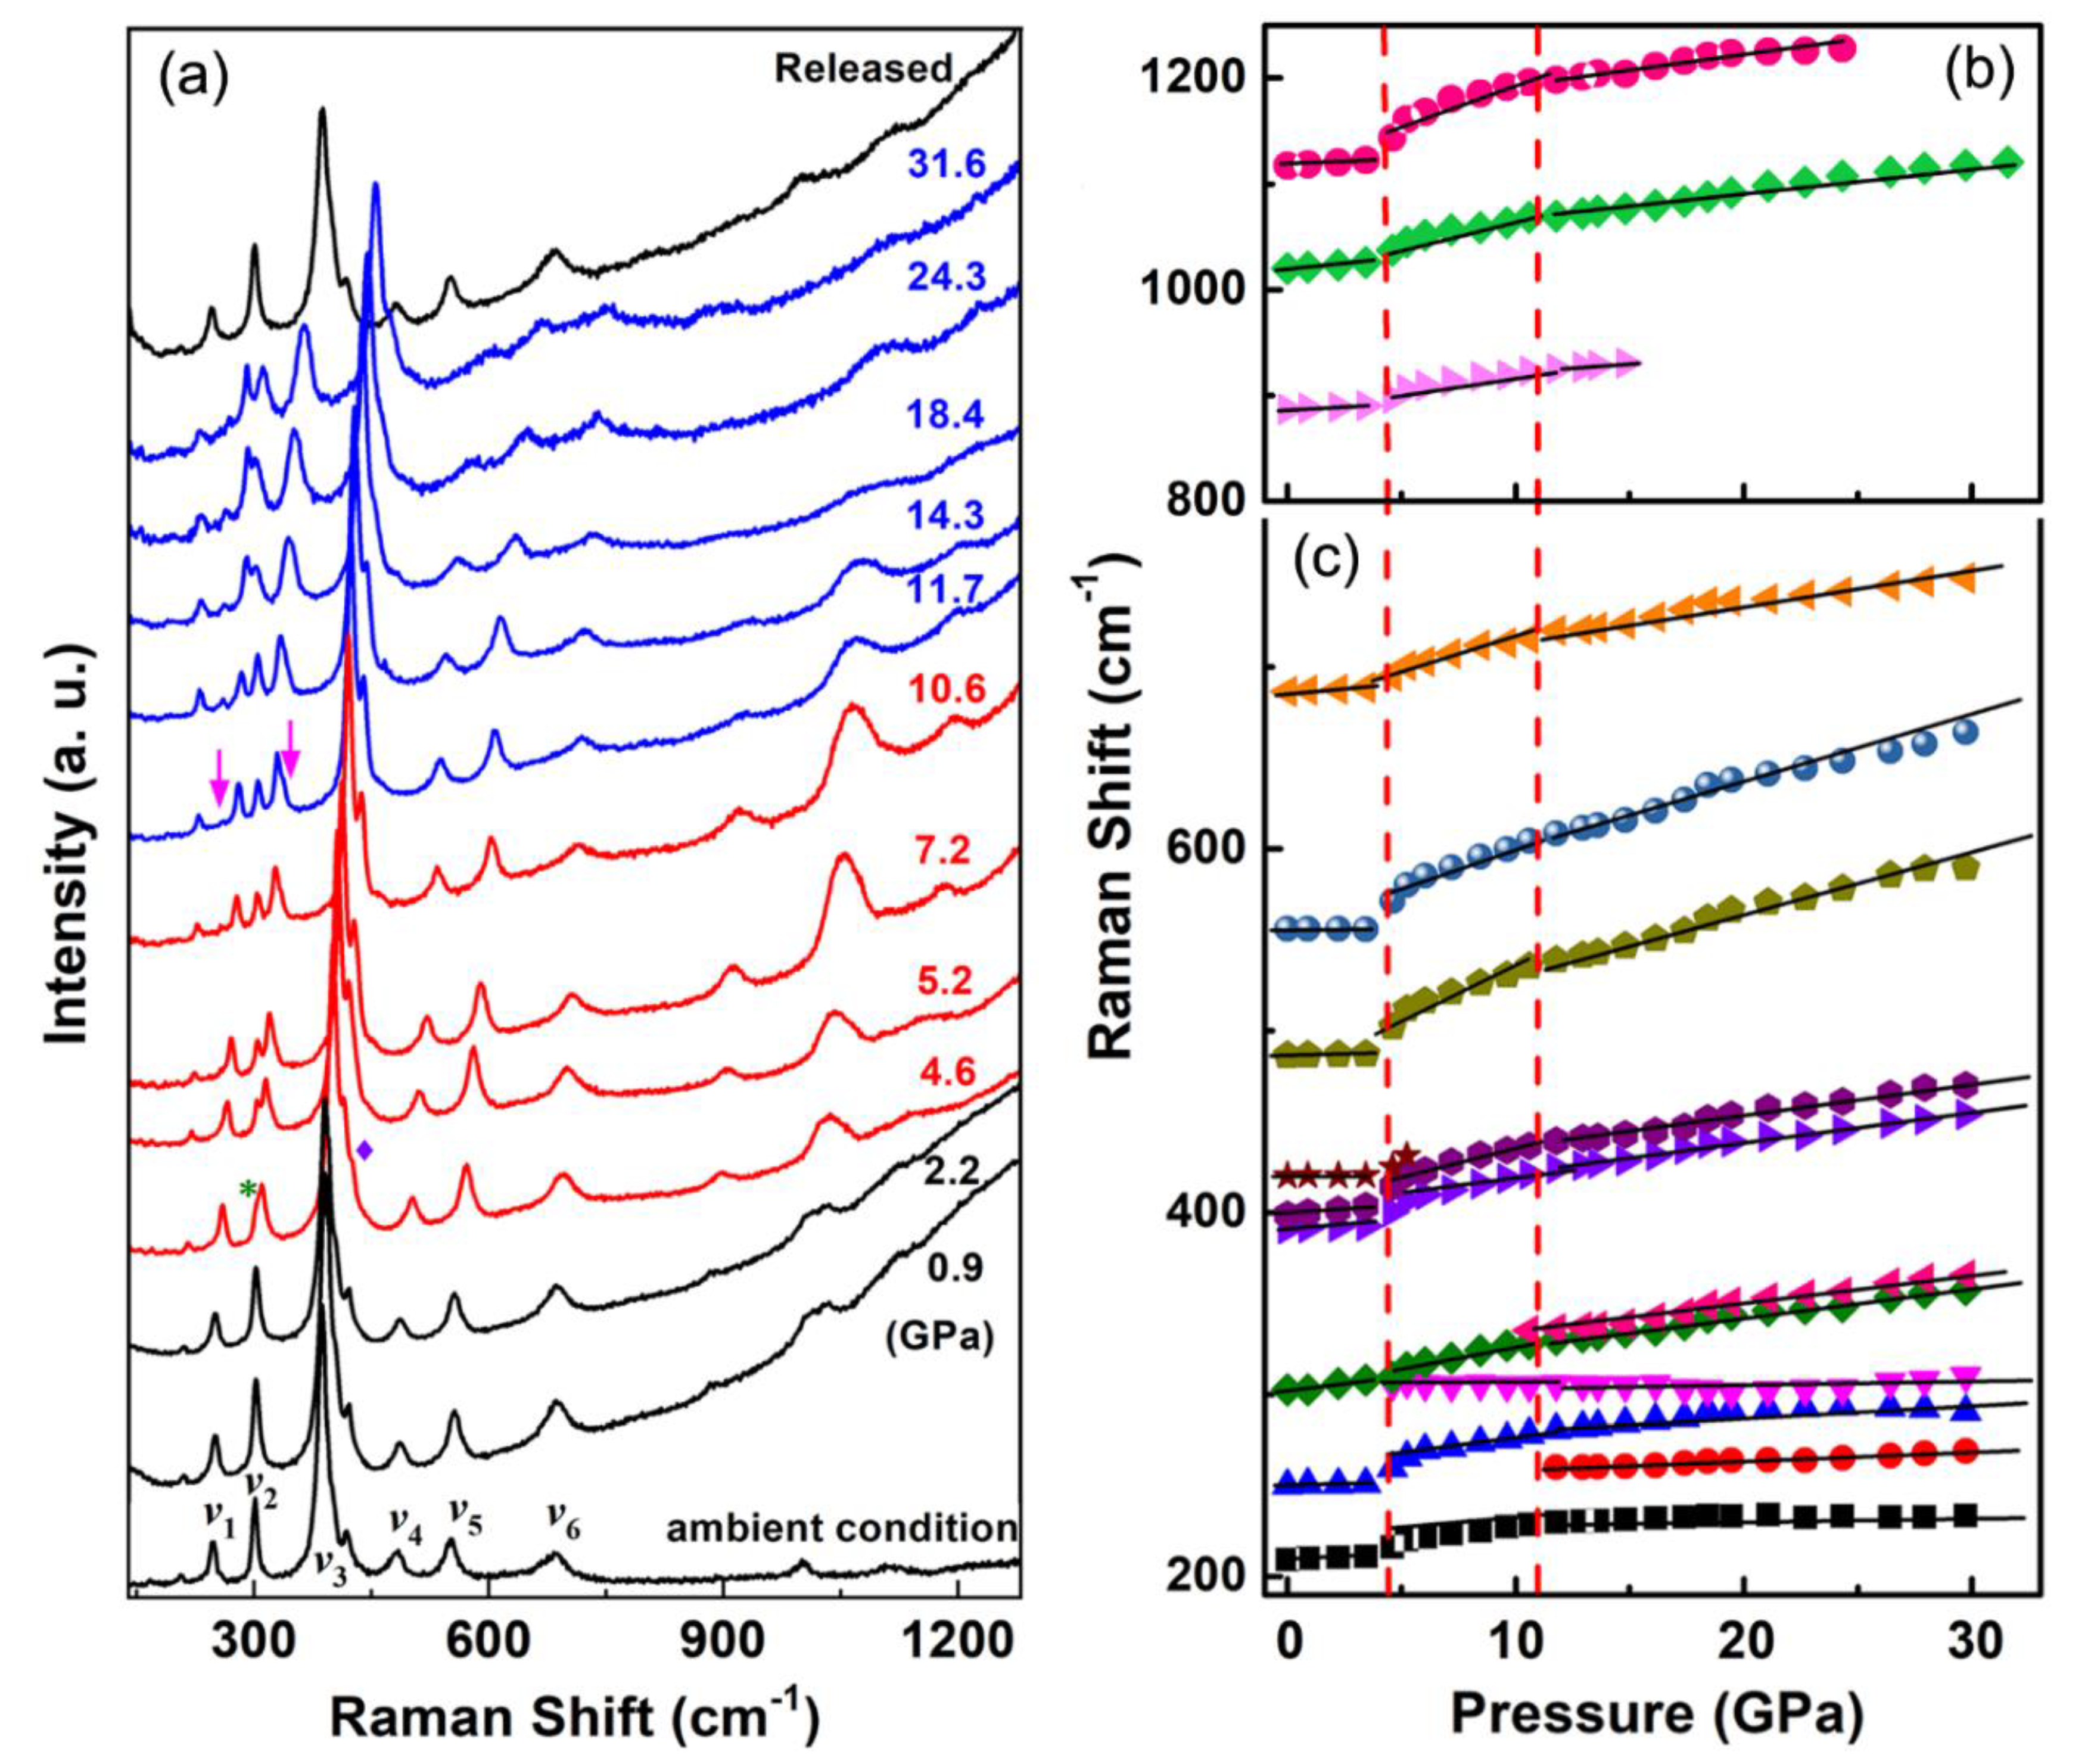
3.1. Raman Spectroscopy

Figure 3a shows the in situ Raman spectra of goethite in the wavenumber range 150–1300 cm−1 during compression up to 32 GPa at room temperature. The spectra above 1300 cm−1 up to 5000 cm−1 are not shown as there is no significant feature detected in this wavenumber range. The spectrum near ambient pressure is consistent with data previously reported. The assignments of the observed Raman peaks are listed in Table 1. There are some unassigned weak peaks, i.e., 209, 399, 420, 887, 1020, and 1117 cm−1 (at ambient conditions). These peaks were also present in previously reported Raman spectra [10,12,24,25,26]. Peaks above 800 cm−1 are associated with OH bonding, and, therefore, are difficult to observe in some Raman experiments. The total number of Raman active modes calculated using the SMODES module of ISOTROPY Software Suite (Version 1.2.4, Brigham Young University, Provo, USA) [27] is 24, which is consistent with that of diaspore (α-AlOOH), an isostructural mineral of goethite with the space group Pbnm [28]. Upon compression, the Raman peak at 302 cm−1 shows an obvious splitting at 5.2 GPa, and the main peak at about 391 cm−1 loses one of its two shoulder peaks on the high wavenumber side at about the same pressure. These shoulder peaks are theoretically predicted by the density functional theory (DFT) calculation for goethite [29]. A new peak at about 260 cm−1 appears when the pressure is increased from 10.6 to 11.7 GPa, and the peak at 302 cm−1 further yields a small shoulder peak. Both of these new peaks are very weak. When the positions of all the observed peaks are plotted as a function of pressure (Figure 3b,c), more features become visible. As the pressure increases, all peaks show smooth blueshifts as a function of pressure due to shortening of the bond distances. At about 5 GPa, where the peak at 302 cm−1 splits, discontinuities in the peak shift as a function of pressure occurring at most peaks, and the slopes of the shifts also change across this pressure. Distinctly, the new peak split at 302 cm−1 shows a redshift in contrast to all other peaks. At 11.7 GPa, where two weak peaks appear (at 260 and 302 cm−1), only subtle changes in the slopes of the shifts are observed. Such a subtle change appears to occur at 20 GPa for the ν4 and ν5 peaks. Upon decompression to ambient pressure, the original Raman spectrum of the starting sample is recovered, indicating that all the changes during compression are reversible.

3.2. Electrical Impedance Spectroscopy

In situ EIS measurements were conducted up to 31 GPa at room temperature. Figure 4 shows the Nyquist plots of the EIS data collected at different pressures. Resistances of grain-interior and grain-boundary contributions were derived from the first and second semicircles of the Nyquist plots and are shown in Figure 5, together with some of the previously reported results [10,12]. Since the starting sample was pre-pressed into a pallet to minimize the void space in the grain boundaries, the resistance contribution from the grain boundary started at a value comparable to that from the grain interior. Upon compression, the grain boundaries were further reduced, and, therefore, the grain-boundary resistance became much smaller than the grain-interior resistance (about one order of magnitude smaller at the peak pressure, 31 GPa). The pressure influences on the grain-interior resistance and grain-boundary resistance are well-correlated. Two significant changes can be recognized in the total resistance as a function of pressure. Upon compression, the total resistance initially decreases with pressure. At about 5 GPa, the resistance begins to increase with pressure and then decreases with pressure again at 11 GPa. These changes are also well-correlated with those observed in Raman spectroscopy.

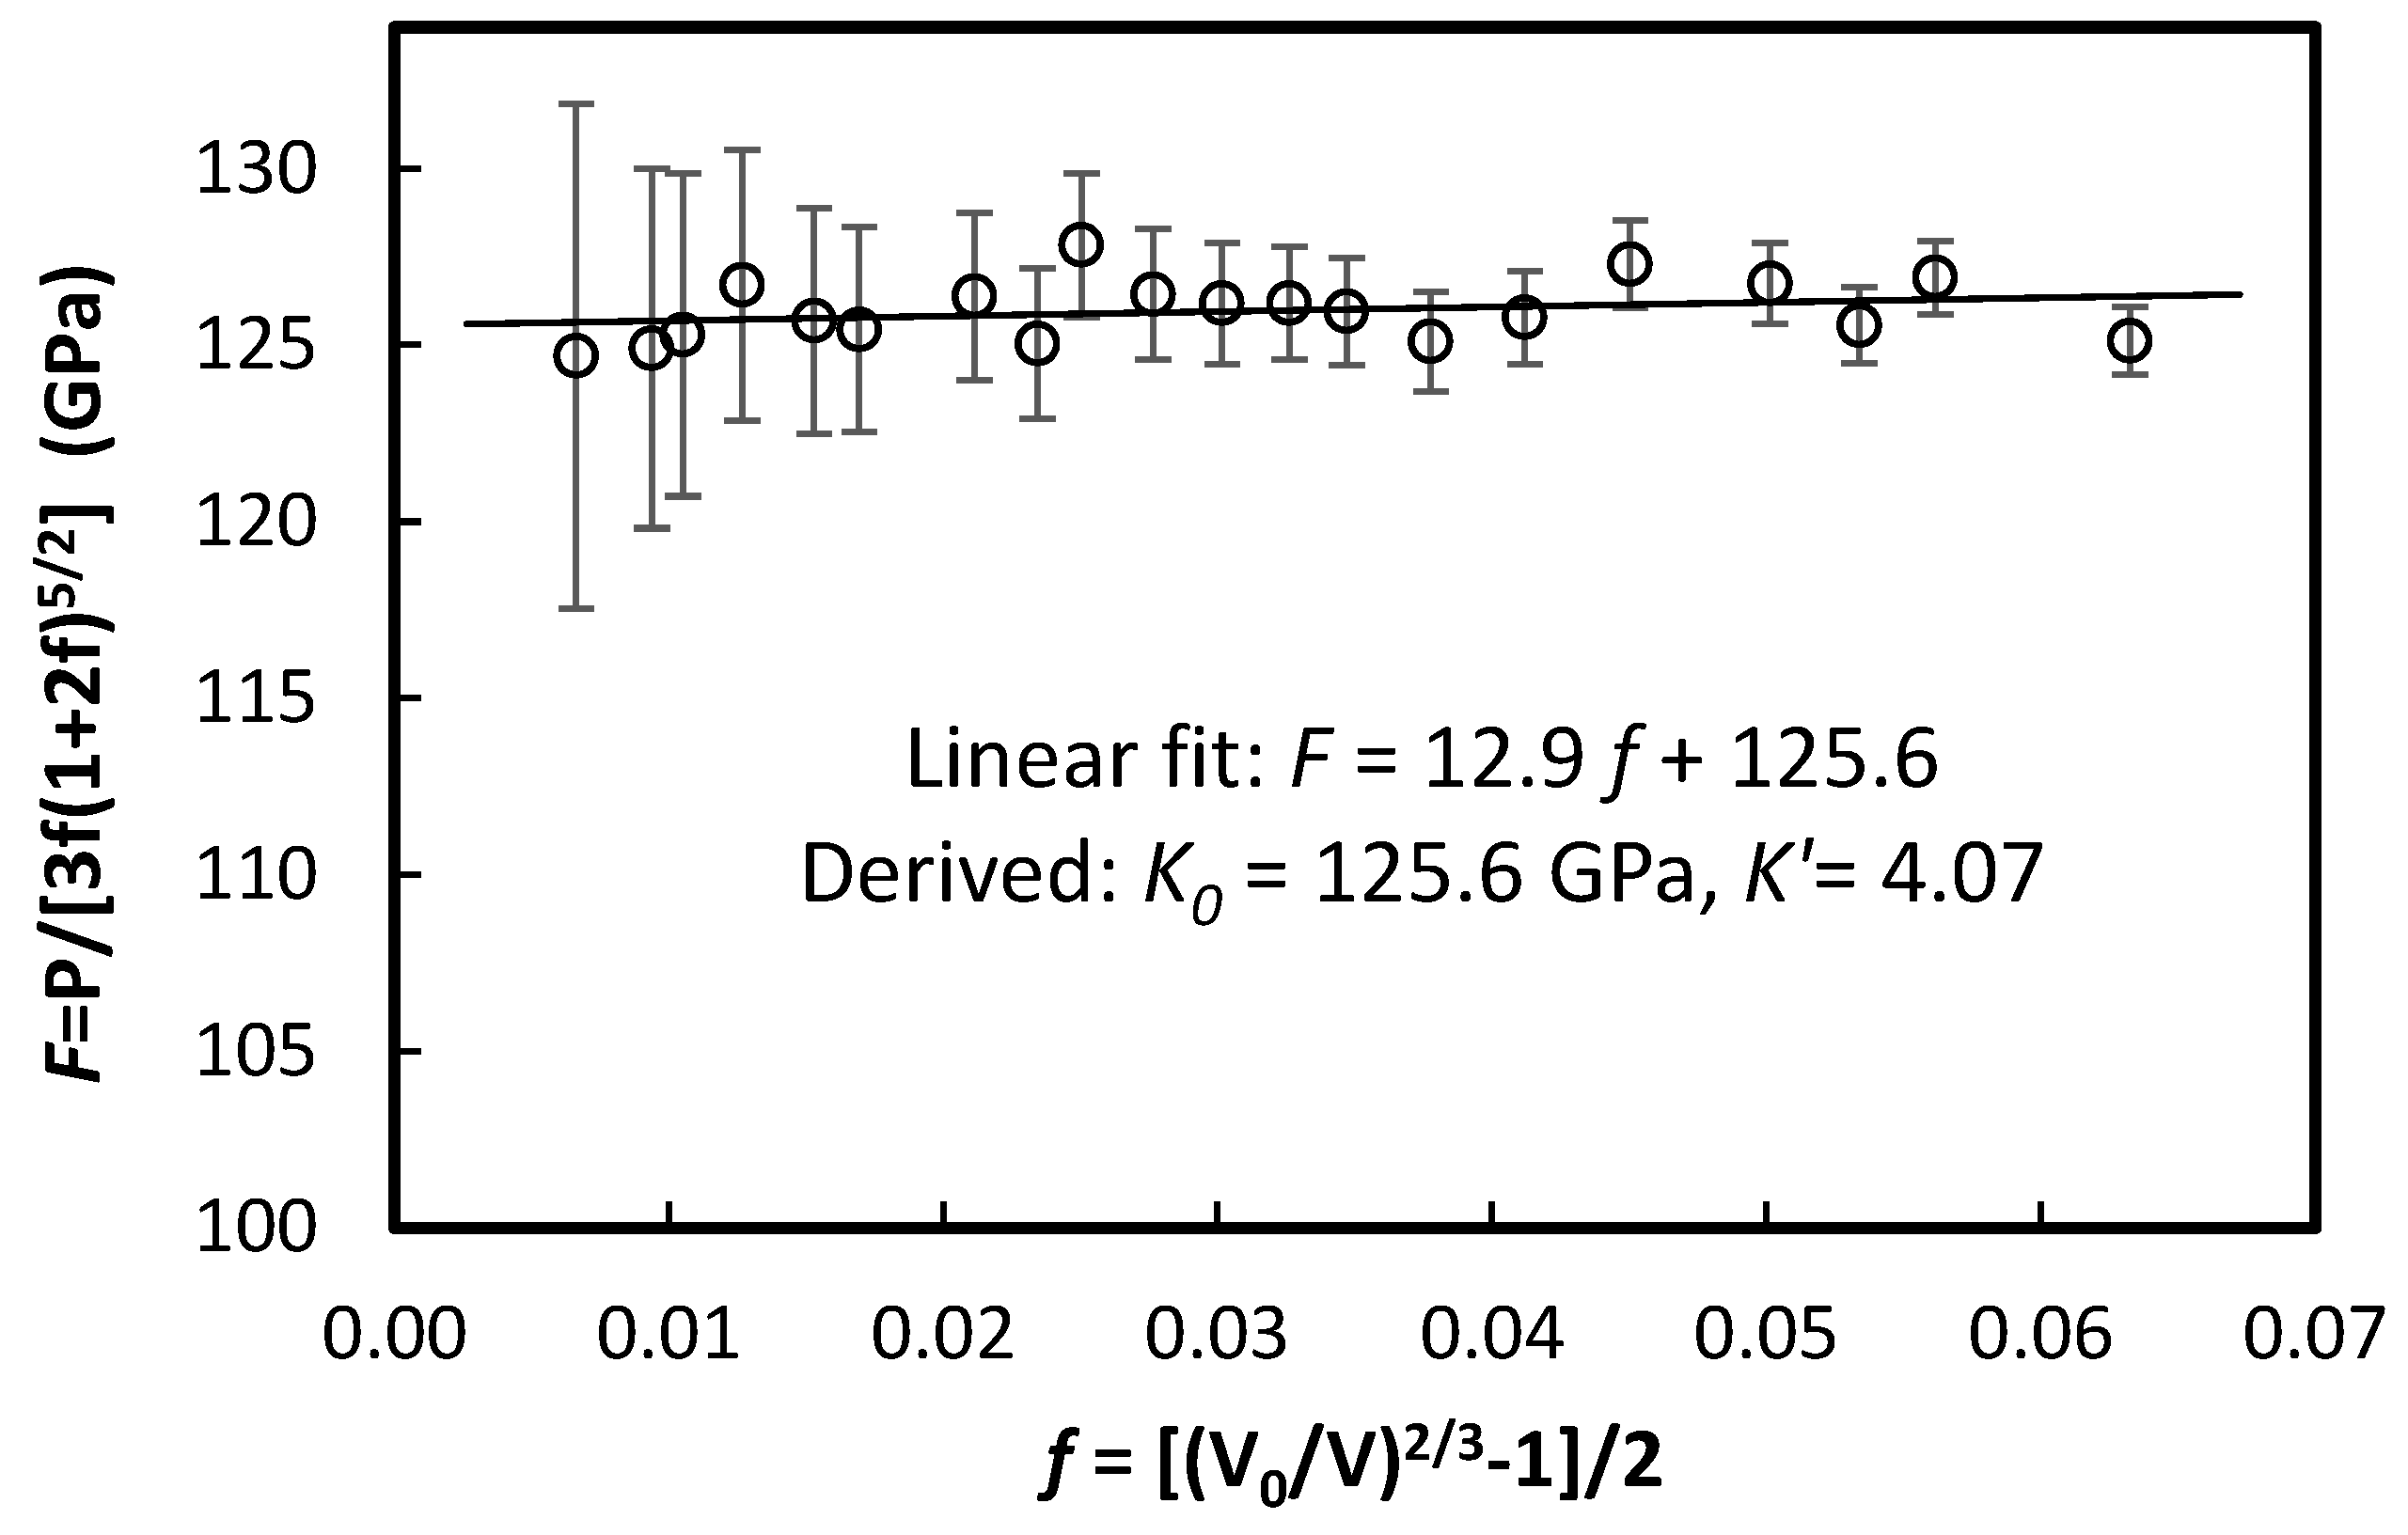
3.3. In Situ X-Ray Diffraction

Figure 6 shows the sequence of in situ synchrotron x-ray diffraction patterns at high pressures up to 32 GPa at room temperature. No diffraction feature change was observed in the entire pressure range, except for the peak shift due to compression. A peak showing a dramatic shift in contrast to the rest of the diffraction pattern was obtained from the solidified neon pressure transmission medium. The volumetric data (Figure 7) derived from the diffraction patterns were fitted to the third-order Birch–Murnaghan equation of state (BM EOS):
P = 3K0f(1 + 2f)5/2(1 + (3/2)(K’ − 4)f),
where K0 and K’ are the bulk modulus at ambient pressure and its pressure derivative, respectively, and f = ((V0/V)2/3 − 1)/2 is the Eulerian strain. The EOS fitting yields V0 = 138.8 ± 0.8 Å3, K0 = 129 ± 19 GPa, and K‘ = 3.8 ± 1.2.

4. Discussion

Although solidification of the pressure medium (mixture of 16:3:1 methanol-ethanol-water) at about 11 GPa in the Raman experiments may give rise to the change in the slope of peak-shift as a function of pressure, the change in the EIS experiment at the same pressure is independent of the solidification because no pressure medium was used in the EIS measurement. Similar phenomena have been observed in other in situ high-pressure Raman spectroscopy studies [10,12]. Xu et al. [10] resolved the peak at 300 cm−1 as three peaks at ambient pressure, whereas we recognized only one peak initially, a splitting at about 5 GPa, and a second splitting at about 11 GPa. On the other hand, they did not observe the shoulder peak on the high wavenumber side of the main peak at 400 cm−1 at ambient pressure. Instead, they observed a splitting of the peak at 5 GPa and changes in the slope of peak-shift with pressure at 16 GPa in some of the peaks (i.e., at 250 and 300 cm−1). No discontinuity of peak-shift with pressure was reported throughout the entire pressure range (up to 40 GPa) they studied. In their Raman study, Liu et al. [12] did not focus their attention on weak peaks, such as the shoulder peak from the second splitting of the peak at 300 cm−1 and the shoulder peaks on the high wavenumber side of the main peak at 400 cm−1. Their observation of the peak-shift discontinuities with pressure at 7 GPa is approximately consistent with our current study (5 GPa). The second slope-change they reported is at a higher pressure (20 GPa) compared to what we observed in this study (11 GPa), except for the ν4 and ν5 peak, which change their slopes at 20 GPa. Discrepancies among these in situ high-pressure Raman spectroscopy results seem to originate from the instrumental resolution, stress environment, and experimentalist’s attention.
A comparison of our EIS data with the resistance data from Xu et al. [10] and the resistivity (reciprocal of conductivity) data from Liu et al. [12] in the same pressure range is shown in Figure 5. Since the resistance value highly depends on the geometries of the sample and electrodes, the data from Xu et al. [10] are about one order of magnitude lower than the result of this study. However, the trend of reducing resistance with pressure is consistent with the current study, and a notable discontinuity of resistance as a function of pressure can be recognized in their data (dashed lines), although the pressure step in their experiment is too large to unveil any details due to their primary interest in the higher pressure range. The resistivity data as a function of pressure from Liu et al. [12] show two changes at pressures similar to those observed in this study. Nevertheless, we did not observe the resistance increase at a higher pressure (20 GPa) reported by Liu et al. [12], and neither did Xu et al. [10].
Although both Raman spectroscopy (Figure 3) and EIS (Figure 5) indicate feature changes at about 5 and 11 GPa in this study, the observation of in situ x-ray diffraction (Figure 6) rules out the possibility of any first-order structural transition at these pressures. Xu et al. [10] reported a change in the bulk modulus at 16 GPa, based on their x-ray diffraction data, from 120 to 197 GPa. When we break our volumetric data into two groups at 16 GPa and fit the two datasets separately to the third-order BM EOS, we get V0 = 138.8 Å3, K0 = 129 GPa, and K‘ = 3.7 for data below 16 GPa, and V0 = 136.1 Å3, K0 = 175 GPa, and K‘ = 2.1 for data above 16 GPa. An increase in bulk modulus appears to be present across the breaking pressure. However, the confidence ellipses (at a 1σ level) in K0 and K′ (Figure 8) of the two datasets indicate that the fitting results of K0 and K′ in each dataset are highly correlated and both datasets can be fitted almost equally well with K0 and K′ located in the intersection area of the two ellipses [31], e.g., K’ = 4. In addition, fitting the entire data with single EOS yields a much smaller confidence ellipse lying within the intersection area of the two ellipses, indicating an improvement in the quality of fitting. Therefore, we fitted the two datasets using the second-order BM EOS, and got V0 = 138.8 Å3 and K0 = 127 GPa, and V0 = 139.0 Å3 and K0 = 125 GPa for the data below and above 16 GPa, respectively. The difference between the results of the two datasets is negligible. Therefore, the current volumetric data from x-ray diffraction indicates no second-order phase transition. The final fitting of the entire data into the second-order BM EOS yields V0 = 138.9 ± 0.5 Å3 and K0 = 126 ± 5 GPa. To validate the final choice of the entire data for the EOS fitting, we made a plot of normalized stress F = P/[3f(1+2f)5/2] vs. Eulerian strain f, i.e., f-F plot (Figure 9). Substituting P in Equation. (9) with F, the third-order BM EOS is expressed as
F = K0 + (3/2)K0(K’ − 4)f.
A linear fit of the f-F plot (Figure 9) yields K0 = 125.6 GPa and K’= 4.07, which indicates that the second-order BM EOS is an appropriate estimate. A comparison of the EOS parameters for goethite from published reports is given in Table 2.
Ruling out the possibilities of a first-order structural transition and a second-order compressibility transition, the origin for the changes observed in Raman spectroscopy and EIS remains unjustified [11]. A theoretical calculation [34] once predicted a pressure-induced structural phase transformation to the high-pressure ε-FeOOH at 6–7 GPa, followed by a high-spin to low-spin transition at 7.7 GPa, using first-principle generalized gradient approximation (GGA). However, experimental studies have indicated that the ε-FeOOH phase only forms at an elevated temperature [1,2], and the predicted spin transition is shifted to a much higher pressure (56 GPa) if the on-site Coulomb repulsion term (U) is included in the GGA calculation [34]. Xu et al. [10] experimentally observed high-spin to low-spin transition in goethite at 45 GPa. Therefore, the transformation to ε-FeOOH phase and the spin transition cannot be responsible for the changes observed in Raman spectroscopy and EIS at 5 and 11 GPa. The theoretical calculation using spDFT by Tunega [32] indicates that a high-spin ferromagnetic (FM) state of goethite may become energetically favorable at about 15 GPa, whereas the high-spin antiferromagnetic (AFM) state is stable at ambient pressure. The GGA+U calculation [34] shows that the FM state at high pressure has a wider bandgap over the AFM state, and, therefore, is expected to have a higher resistance. If we follow these theoretical results, we may speculate that the FM state (higher resistance phase) becomes stable at 5 GPa, and the transition from an AFM to FM state is a sluggish process. Following this speculation, the electrical resistance behavior of goethite from EIS (Figure 5) can be illustrated as a pure AFM state (lower resistance phase) before 5 GPa, a pure FM state (higher resistance phase) above 11 GPa, and a transition stage from AFM to FM between 5 and 11 GPa, resulting in a slow increase of resistance. The pressure-induced AFM to FM transition has been experimentally observed in many other materials, e.g., Au2Mn [35], EuTe [36], USb2 [37], SrFeO3, and CaFeO3 [38]. The electrical resistance behavior observed in USb2 is very similar to what we observed here in goethite. Upon compression, the resistance decreases within the AFM phase, increases during the AFM-FM transition, and finally decreases again in the FM phase [37]. The AFM-FM transition pressure assumed here (5 GPa) in goethite is lower than that of the spDFT prediction (15 GPa). Since the major changes in Raman spectra at 11 GPa (delayed to 20 GPa for ν4 and ν5 peaks) are exhibited on the slope of the peak shifts with pressure, they are consistent with the AFM-FM transition assumption as well. Further theoretical simulation of the influence of AFM-FM transition on phonon vibrations will be interesting. No apparent crystallographic signature is observed to accompany this transition in our x-ray diffraction data. Suzuki [16] reported an anomaly in the compression behavior along the unit-cell axes at about 5 GPa, but this was not observed in either our compression data (Figure 10) or other published data (except for the effect of pressure-medium solidification) [1,3,10,14,15].
FeOOH was recently found to be stable in a pyrite-type structure in deep mantle conditions [5,6]. If the mineral presents at shallower depths where goethite (a-FeOOH) is stable, its influence on the magnetic properties of Earth’s mantle needs to be considered when understanding the magnetism of Earth’s interior, which is a matter still the subject of much debate [39,40]. Further studies on this may be worthwhile.

Author Contributions

R.T., conceptualization, methodology, formal analysis, investigation, data curation, writing-original draft preparation, visualization; J.C., conceptualization, methodology, formal analysis, investigation, writing-original draft preparation, review and editing, visualization, supervision; Q.Z., formal analysis, investigation, resources, data curation, writing-review and editing; Y.L., investigation, resources, data curation, writing- review and editing; X.L., investigation, resources, data curation, writing-review and editing; B.Y., investigation, resources, data curation, writing-review and editing; Y.W., investigation, resources, writing-review and editing. All authors have read and agreed to the published version of the manuscript.

Funding

A portion of this work was performed at HPCAT (Sector 16), Advanced Photon Source (APS), Argonne National Laboratory. HPCAT operations were supported by DOE-NNSA’s Office of Experimental Sciences. The Advanced Photon Source is a U.S. Department of Energy (DOE) Office of Science User Facility operated for the DOE Office of Science by Argonne National Laboratory under Contract No. DE-AC02-06CH11357. This research was supported in part by the NSAF Grant No. U1530402; the Youth science foundation of Changchun University of Science and Technology (Grant No. XQNJJ-2018-15); and the Jilin Province Science and Technology Development Program, China (20170520119JH). J.C acknowledges the support from NSF (EAR-1723185).

Acknowledgments

The authors thank Yue Meng for her technical support of the synchrotron beamline, Vadym Drozd and Jin Zhang for their insightful discussions on the project.

Conflicts of Interest

The authors declare no conflict of interest.

References

  1. Gleason, A.E.; Jeanloz, R.; Kunz, M. Pressure-Temperature Stability Studies of Feooh Using X-Ray Diffraction. Am. Mineral. 2008, 93, 1882–1885. [Google Scholar] [CrossRef] [Green Version]
  2. Voigt, R.; Will, G. The System Fe2o3-H2o under High Pressures. Neues Jahrb. Fur Mineral. 1981, 2, 89–96. [Google Scholar]
  3. Hu, Q.; Kim, D.Y.; Yang, W.; Yang, L.; Meng, Y.; Zhang, L.; Mao, H.K. Feo2 and Feooh under Deep Lower-Mantle Conditions and Earth’s Oxygen-Hydrogen Cycles. Nature 2016, 534, 241–244. [Google Scholar] [CrossRef]
  4. Hu, Q.; Kim, D.Y.; Liu, J.; Meng, Y.; Yang, L.; Zhang, D.; Mao, W.L.; Mao, H.K. Dehydrogenation of Goethite in Earth’s Deep Lower Mantle. Proc. Natl. Acad. Sci. USA 2017, 114, 1498–1501. [Google Scholar] [CrossRef] [Green Version]
  5. Liu, J.; Hu, Q.; Kim, D.Y.; Wu, Z.; Wang, W.; Xiao, Y.; Chow, P.; Meng, Y.; Prakapenka, V.B.; Mao, H.-K.; et al. Hydrogen-Bearing Iron Peroxide and the Origin of Ultralow-Velocity Zones. Nature 2017, 551, 494–497. [Google Scholar] [CrossRef]
  6. Nishi, M.; Kuwayama, Y.; Tsuchiya, J.; Tsuchiya, T. The Pyrite-Type High-Pressure Form of Feooh. Nature 2017, 547, 205–208. [Google Scholar] [CrossRef]
  7. Suzuki, A. High-Pressure X-Ray Diffraction Study of E-Feooh. Phys. Chem. Miner. 2010, 37, 153–157. [Google Scholar] [CrossRef]
  8. Mao, H.-K.; Hu, Q.; Yang, L.; Liu, J.; Kim, D.Y.; Meng, Y.; Zhang, L.; Prakapenka, V.B.; Yang, W.; Mao, W.L. When Water Meets Iron at Earth’s Core–Mantle Boundary. Natl. Sci. Rev. 2017, 4, 870–878. [Google Scholar] [CrossRef]
  9. Gleason, A.E.; Quiroga, C.E.; Suzuki, A.; Pentcheva, R.; Mao, W.L. Symmetrization Driven Spin Transition in E-Feooh at High Pressure. Earth Planet. Sci. Lett. 2013, 379, 49–55. [Google Scholar] [CrossRef]
  10. Xu, W.; Greenberg, E.; Rozenberg, G.K.; Pasternak, M.P.; Bykova, E.; Boffa-Ballaran, T.; Dubrovinsky, L.; Prakapenka, V.; Hanfland, M.; Vekilova, O.Y.; et al. Pressure-Induced Hydrogen Bond Symmetrization in Iron Oxyhydroxide (Supplementary Materials). Phys. Rev. Lett. 2013, 111, 175501. [Google Scholar] [CrossRef] [PubMed] [Green Version]
  11. Reagan, M.M.; Gleason, A.E.; Daemen, L.; Xiao, Y.; Mao, W.L. High-Pressure Behavior of the Polymorphs of Feooh. Am. Mineral. 2016, 101, 1483–1488. [Google Scholar] [CrossRef]
  12. Liu, K.; Dai, L.; Li, H.; Hu, H.; Zhuang, Y.; Yang, L.; Pu, C.; Hong, M. Pressure-Induced Phase Transitions for Goethite Investigated by Raman Spectroscopy and Electrical Conductivity. High Press. Res. 2019, 39, 106–116. [Google Scholar] [CrossRef]
  13. Williams, Q.; Guenther, L. Pressure-Induced Changes in the Bonding and Orientation of Hydrogen in Feooh-Goethite. Solid State Commun. 1996, 100, 105–109. [Google Scholar] [CrossRef]
  14. Kim, Y.; Hwang, G.; Do, J. Compression Study of Goethite at Room Temperature. J. Mineral. Soc. Korea 2007, 20, 261–266. [Google Scholar]
  15. Nagai, T.; Kagi, H.; Yamanaka, T. Variation of Hydrogen Bonded O… O Distances in Goethite at High Pressure. Am. Mineral. 2003, 88, 1423–1427. [Google Scholar] [CrossRef]
  16. Suzuki, A. Thermal Equation of State of Goethite (A-Feooh). High Press. Res. 2017, 37, 193–199. [Google Scholar] [CrossRef]
  17. Suzuki, A. Pressure–Volume–Temperature Equation of State of E–Feooh to 11 Gpa and 700 K. J. Mineral. Petrol. Sci. 2016, 111, 420–424. [Google Scholar] [CrossRef] [Green Version]
  18. Kim, Y.; Yi, Z. High Pressure X-Ray Diffraction Study on a Goethite Using Synchrotron Radiation. J. Min. Soc. Korea 1997, 10, 75–81. [Google Scholar]
  19. Mao, H.K.; Xu, J.; Bell, P.M. Calibration of the Ruby Pressure Gauge to 800 Kbar under Quasi-Hydrostatic Conditions. J. Geophys. Res. 1986, 91, 4673–4676. [Google Scholar] [CrossRef]
  20. Toby, B.H.; Von Dreele, R.B. Gsas-Ii: The Genesis of a Modern Open-Source All Purpose Crystallography Software Package. J. Appl. Crystallogr. 2013, 46, 544–549. [Google Scholar] [CrossRef]
  21. Gonzalez-Platas, J.; Alvaro, M.; Nestola, F.; Angel, R. Eosfit7-Gui: A New Graphical User Interface for Equation of State Calculations, Analyses and Teaching. J. Appl. Crystallogr. 2016, 49, 1377–1382. [Google Scholar] [CrossRef]
  22. Barsoukov, E.; Macdonald, J.R. Impedance Spectroscopy: Theory, Experiment, and Applications, 3rd ed.; John Wiley & Sons, Inc.: New Jersey, NJ, USA, 2018. [Google Scholar]
  23. Bonanos, N.; Steele, B.C.H.; Butler, E.P. Applications of Impedance Spectroscopy: Characterization of Materials. In Impedance Spectroscopy: Theory, Experiment, and Applications, 3rd ed.; Barsoukov, E., Macdonald, J.R., Eds.; John Wiley & Sons, Inc.: New Jersey, NJ, USA, 2018; pp. 175–224. [Google Scholar]
  24. Lafuente, B.; Downs, R.T.; Yang, H.; Stone, N. The Rruff Project. Available online: http://rruff.info/goethite/display=default/R120086 (accessed on 30 December 2019).
  25. Dünnwald, J.; Otto, A. An Investigation of Phase Transitions in Rust Layers Using Raman Spectroscopy. Corros. Sci. 1989, 29, 1167–1176. [Google Scholar] [CrossRef]
  26. De Faria, D.L.A.; Venâncio Silva, S.; de Oliveira, M.T. Raman Microspectroscopy of Some Iron Oxides and Oxyhydroxides. J. Raman Spectrosc. 1997, 28, 873–878. [Google Scholar] [CrossRef]
  27. Stokes, H.T.; Hatch, D.M.; Campbell, B.J. Smodes, Isotropy Software Suite. Available online: http://stokes.byu.edu/iso/isotropy.php (accessed on 30 December 2019).
  28. Delattre, S.; Balan, E.; Lazzeri, M.; Blanchard, M.; Guillaumet, M.; Beyssac, O.; Haussühl, E.; Winkler, B.; Salje, E.K.H.; Calas, G. Experimental and Theoretical Study of the Vibrational Properties of Diaspore (A-Alooh). Phys. Chem. Miner. 2012, 39, 93–102. [Google Scholar] [CrossRef]
  29. Kubicki, J.D.; Paul, K.W.; Sparks, D.L. Periodic Density Functional Theory Calculations of Bulk and the (010) Surface of Goethite. Geochem. Trans. 2008, 9, 4. [Google Scholar] [CrossRef] [Green Version]
  30. Legodi, M.A.; de Waal, D. The Preparation of Magnetite, Goethite, Hematite and Maghemite of Pigment Quality from Mill Scale Iron Waste. Dyes Pigments 2007, 74, 161–168. [Google Scholar] [CrossRef]
  31. Angel, R.J. Equations of State. In High-Temperature and High-Pressure Crystal Chemistry; Hazen, R.M., Downs, R.T., Eds.; Mineralogical Society of America: Chantilly, VA, USA, 2000; Volume 41, pp. 35–60. [Google Scholar]
  32. Tunega, D. Theoretical Study of Properties of Goethite (A-Feooh) at Ambient and High-Pressure Conditions. J. Phys. Chem. C 2012, 116, 6703–6713. [Google Scholar] [CrossRef]
  33. Guo, H.; Barnard, A.S. Modeling the Iron Oxides and Oxyhydroxides for the Prediction of Environmentally Sensitive Phase Transformations. Phys. Rev. B 2011, 83, 094112. [Google Scholar] [CrossRef] [Green Version]
  34. Otte, K.; Pentcheva, R.; Schmahl, W.W.; Rustad, J.R. Pressure-Induced Structural and Electronic Transitions in Feooh from First Principles. Phys. Rev. B 2009, 80, 205116. [Google Scholar] [CrossRef]
  35. Wayne, R.C.; Smith, F.A. The Pressure Induced Metamagnetic Transition in Au2mn and the Pressure Depen- Dence of the Ferromagnetic Curie Temperature. J. Phys. Chem. Solids 1969, 30, 183–185. [Google Scholar] [CrossRef]
  36. Ishizuka, M.; Kai, Y.; Akimoto, R.; Kobayashi, M.; Amaya, K.; Endo, S. Pressure-Induced Ferromagnetism in Eute. J. Magn. Magn. Mater. 1997, 166, 211–215. [Google Scholar] [CrossRef]
  37. Jeffries, J.R.; Stillwell, R.L.; Weir, S.T.; Vohra, Y.K.; Butch, N.P. Emergent Ferromagnetism and T-Linear Scattering in Usb2 at High Pressure. Phys. Rev. B 2016, 93, 184406. [Google Scholar] [CrossRef] [Green Version]
  38. Kawakami, T.; Nasu, S. High-Pressure Mössbauer Spectroscopy of Perovskite High Valence Iron Oxides under External Magnetic Field. J. Phys. Condens. Matter 2005, 17, S789–S793. [Google Scholar] [CrossRef]
  39. Wasilewski, P.J.; Thomas, H.H.; Mayhew, M.A. The Moho as a Magnetic Boundary. Geophys. Res. Lett. 1979, 6, 541–544. [Google Scholar] [CrossRef] [Green Version]
  40. Kupenko, I.; Aprilis, G.; Vasiukov, D.M.; McCammon, C.; Chariton, S.; Cerantola, V.; Kantor, I.; Chumakov, A.I.; Rffer, R.; Dubrovinsky, L.; et al. Magnetism in Cold Subducting Slabs at Mantle Transition Zone Depths. Nature 2019, 570, 102–106. [Google Scholar] [CrossRef] [PubMed]
Figure 1. Sketch of the sample inside a diamond anvil cell (DAC) for electrical impedance spectroscopy. E: electrode, I: electrical insulation layer, M: metal gasket, S: sample chamber, and R: ruby sphere for pressure calibration. (a) Side view of the cell sketch; (b) top view of the gasket ring and electrodes; (c) sample in the cell under a microscope.
Minerals 10 00099 g001
Figure 2. Equivalent circuits for (a) single crystal and (c) polycrystal samples, and their corresponding Nyquist plots (b,d), respectively. Impedance Z(ω) = ZR(ω) − ZI(ω) j, where ZI(ω): negative of R: bulk resistance, CPE: constant phase element, subscript gi: grain interior contribution, and subscript gb: grain boundary contribution.
Minerals 10 00099 g002
Figure 3. (a) Selected Raman spectra of goethite during compression (pressures as labeled) and decompressed back to 0.2 GPa. Assignments for peaks labeled with νi are listed in Table 1. The star and arrows indicate where a new peak emerges, and the diamond indicates peak disappearance. (b,c) are positions of the Raman peak as a function of pressure. Vertical lines indicate where some major feature changes occur.
Minerals 10 00099 g003
Figure 4. The ZI vs. ZR Nyquist plots of electrical impedance spectroscopy for the goethite sample inside a diamond anvil cell at different pressures, as labeled. The first semicircle of each data is the contribution from the grains (Rg), and the second semicircle is that from the grain boundaries (Rgb). The total resistance of the sample R = Rg + Rgb.
Minerals 10 00099 g004
Figure 5. Measured grain-interior resistance (Rgi: solid diamonds), grain-boundary resistance (Rgb: pluses), and total resistance (R = Rg + Rgb: crosses) of the goethite sample at different pressures using electrical impedance spectroscopy. Triangles and open circles are the resistivity and resistance from Liu et al. [12] and Xu et al. [10], respectively.
Minerals 10 00099 g005
Figure 6. In situ synchrotron x-ray diffraction patterns of goethite at high pressures, as labeled, up to 32 GPa, during compression. The x-ray wavelength is 0.4066 Å. The Miller index of goethite structure is given at each peak. The red line indicates the track of the diffraction peak from the neon pressure transmission medium.
Minerals 10 00099 g006
Figure 7. Volumetric data (triangles and squares) of goethite as a function of pressure derived from the x-ray diffraction. Errors are smaller than the size of the symbols. The red dot-dashed line, blue dashed line, and thin solid line represent the equation of state (EOS) fitting of the data from 0 to 16 GPa (triangles), 16 to 32 GPa (squares), and 0 to 32 GPa.
Minerals 10 00099 g007
Figure 8. Confidence ellipses in K0 and K′ for the fitting of volume-pressure data below 16 GPa (dot-dashed red line), above 16 GPa (dashed blue line), and the entire pressure range up to 32 GPa (solid black line). Crosses indicate the center of each ellipse.
Minerals 10 00099 g008
Figure 9. f-F plot based on the volume-pressure data of goethite. The solid line is a linear fit of the data.
Minerals 10 00099 g009
Figure 10. Normalized unit-cell parameters of goethite as a function of pressure with a0 = 4.602 Å, b0 = 9.961 Å, and c0 = 3.026 Å. Open symbols are from Suzuki [16].
Minerals 10 00099 g010
Table 1. Assignments of the observed Raman peak of goethite at ambient conditions.
Labelν1ν2ν3ν4ν5ν6
Wavenumber250302391486556687
Assignment [30]Fe–O
stretching
symmetric
Fe–O
Hbending
symmetric
Fe–O–Fe/–OH
stretching
symmetric
Fe–OH
stretching
asymmetric
Fe–OH
stretching
asymmetric
Fe–O
stretching
symmetric
Table 2. Comparison of EOS parameters for goethite.
ReferenceV0K0K’*Method**Pressure Medium***Pressure CalibrantPressure Range (GPa)
This study138.9(5)126(5)4DAC, ADNeRuby0–32
Suzuki [16]138.96(7)85.9(15)12.6(8)LVP, EDNaClNaCl0–7.55
Xu et al. [10]138.4(3)120(3)4DAC, ADHe, NeAu0–16
Gleason et al. [1]138.75(2)140.3(37)4.6(4)DAC, ADME(4:1)Au0–29.4
Kim et al. [14]138.8131.1(58)4LVP, EDME(4:1)NaCl0–9.54
Nagai et al. [15]140.45(1)111(2)4DAC, ADME(4:1)Ruby0–24.5
Kim et al. [18]139.3147.94DAC, EDMEW(16:3:1)MgO0–27.6
Tunega [32]138.7093.54spDFT---
140.86118.74spDFT+U---
Guo et al. [33]141.49114.1-PW-GGA+U---
Otte et al. [34]144.4108.85.9GGA+U---
* K’ = 4 indicates a fitting with the second-order Birch–Murnaghan equation of state (BM EOS). ** DAC: diamond anvil cell experiment; LVP: large volume press experiment; AD/ED: angle/energy dispersive x-ray diffraction; spDFT: spin-polarized density functional theory; U: the on-site Coulomb repulsion parameter in density functional theory (DFT); PW: plane-wave basis; GGA: generalized gradient approximation in DFT. *** ME: mixture of methanol and ethanol; MEW: mixture of methanol, ethanol, and water.

