High-Pressure Raman and Infrared Spectroscopic Study of Prehnite


1
Department of Geosciences, Virginia Polytechnic Institute and State University, Blacksburg, VA 24061, USA
2
Trinity Industries, Inc., Dallas, TX 752017, USA
3
Department of Physics, University of Illinois at Chicago, Chicago, IL 60607, USA
*
Author to whom correspondence should be addressed.
Minerals 2020, 10(4), 312; https://0-doi-org.brum.beds.ac.uk/10.3390/min10040312
Submission received: 20 January 2020
/
Revised: 26 March 2020
/
Accepted: 27 March 2020
/
Published: 31 March 2020
(This article belongs to the Special Issue Mineral Physics—In Memory of Orson Anderson)
Abstract
:High-pressure Raman and infrared spectra of a natural sample of prehnite, with a chemical composition of Ca2(Al0.74,Fe0.26)2Si3O10(OH)2, are presented. Analyses of the spectra indicate that prehnite undergoes a reversible structural change between 6 and 8 GPa that is most likely associated with a subtle alteration in the orientation and/or deformation of the polyhedra comprising the framework of the structure. At pressures in excess of ~11 GPa, the high-pressure spectra indicate that prehnite undergoes a reversible phase transition involving the collapse of the framework structure.
1. Introduction
Prehnite is a hydrous calcium aluminosilicate mineral and a member of the prehnite-pumpellyite metamorphic facies, and is commonly associated with oceanic plate subduction zones, where hydrogen incorporation into mineral structures occurs [1]. The presence of prehnite is indicative of environmental conditions of 0.2–0.6 GPa and 473–623 K [2,3,4]. Prehnite and its associated minerals therefore provide valuable information pertaining to important geological processes, such as rock formation and water transportation, and for this reason, the evaluation of their physical and structural properties as a function of pressure and temperature is of importance.
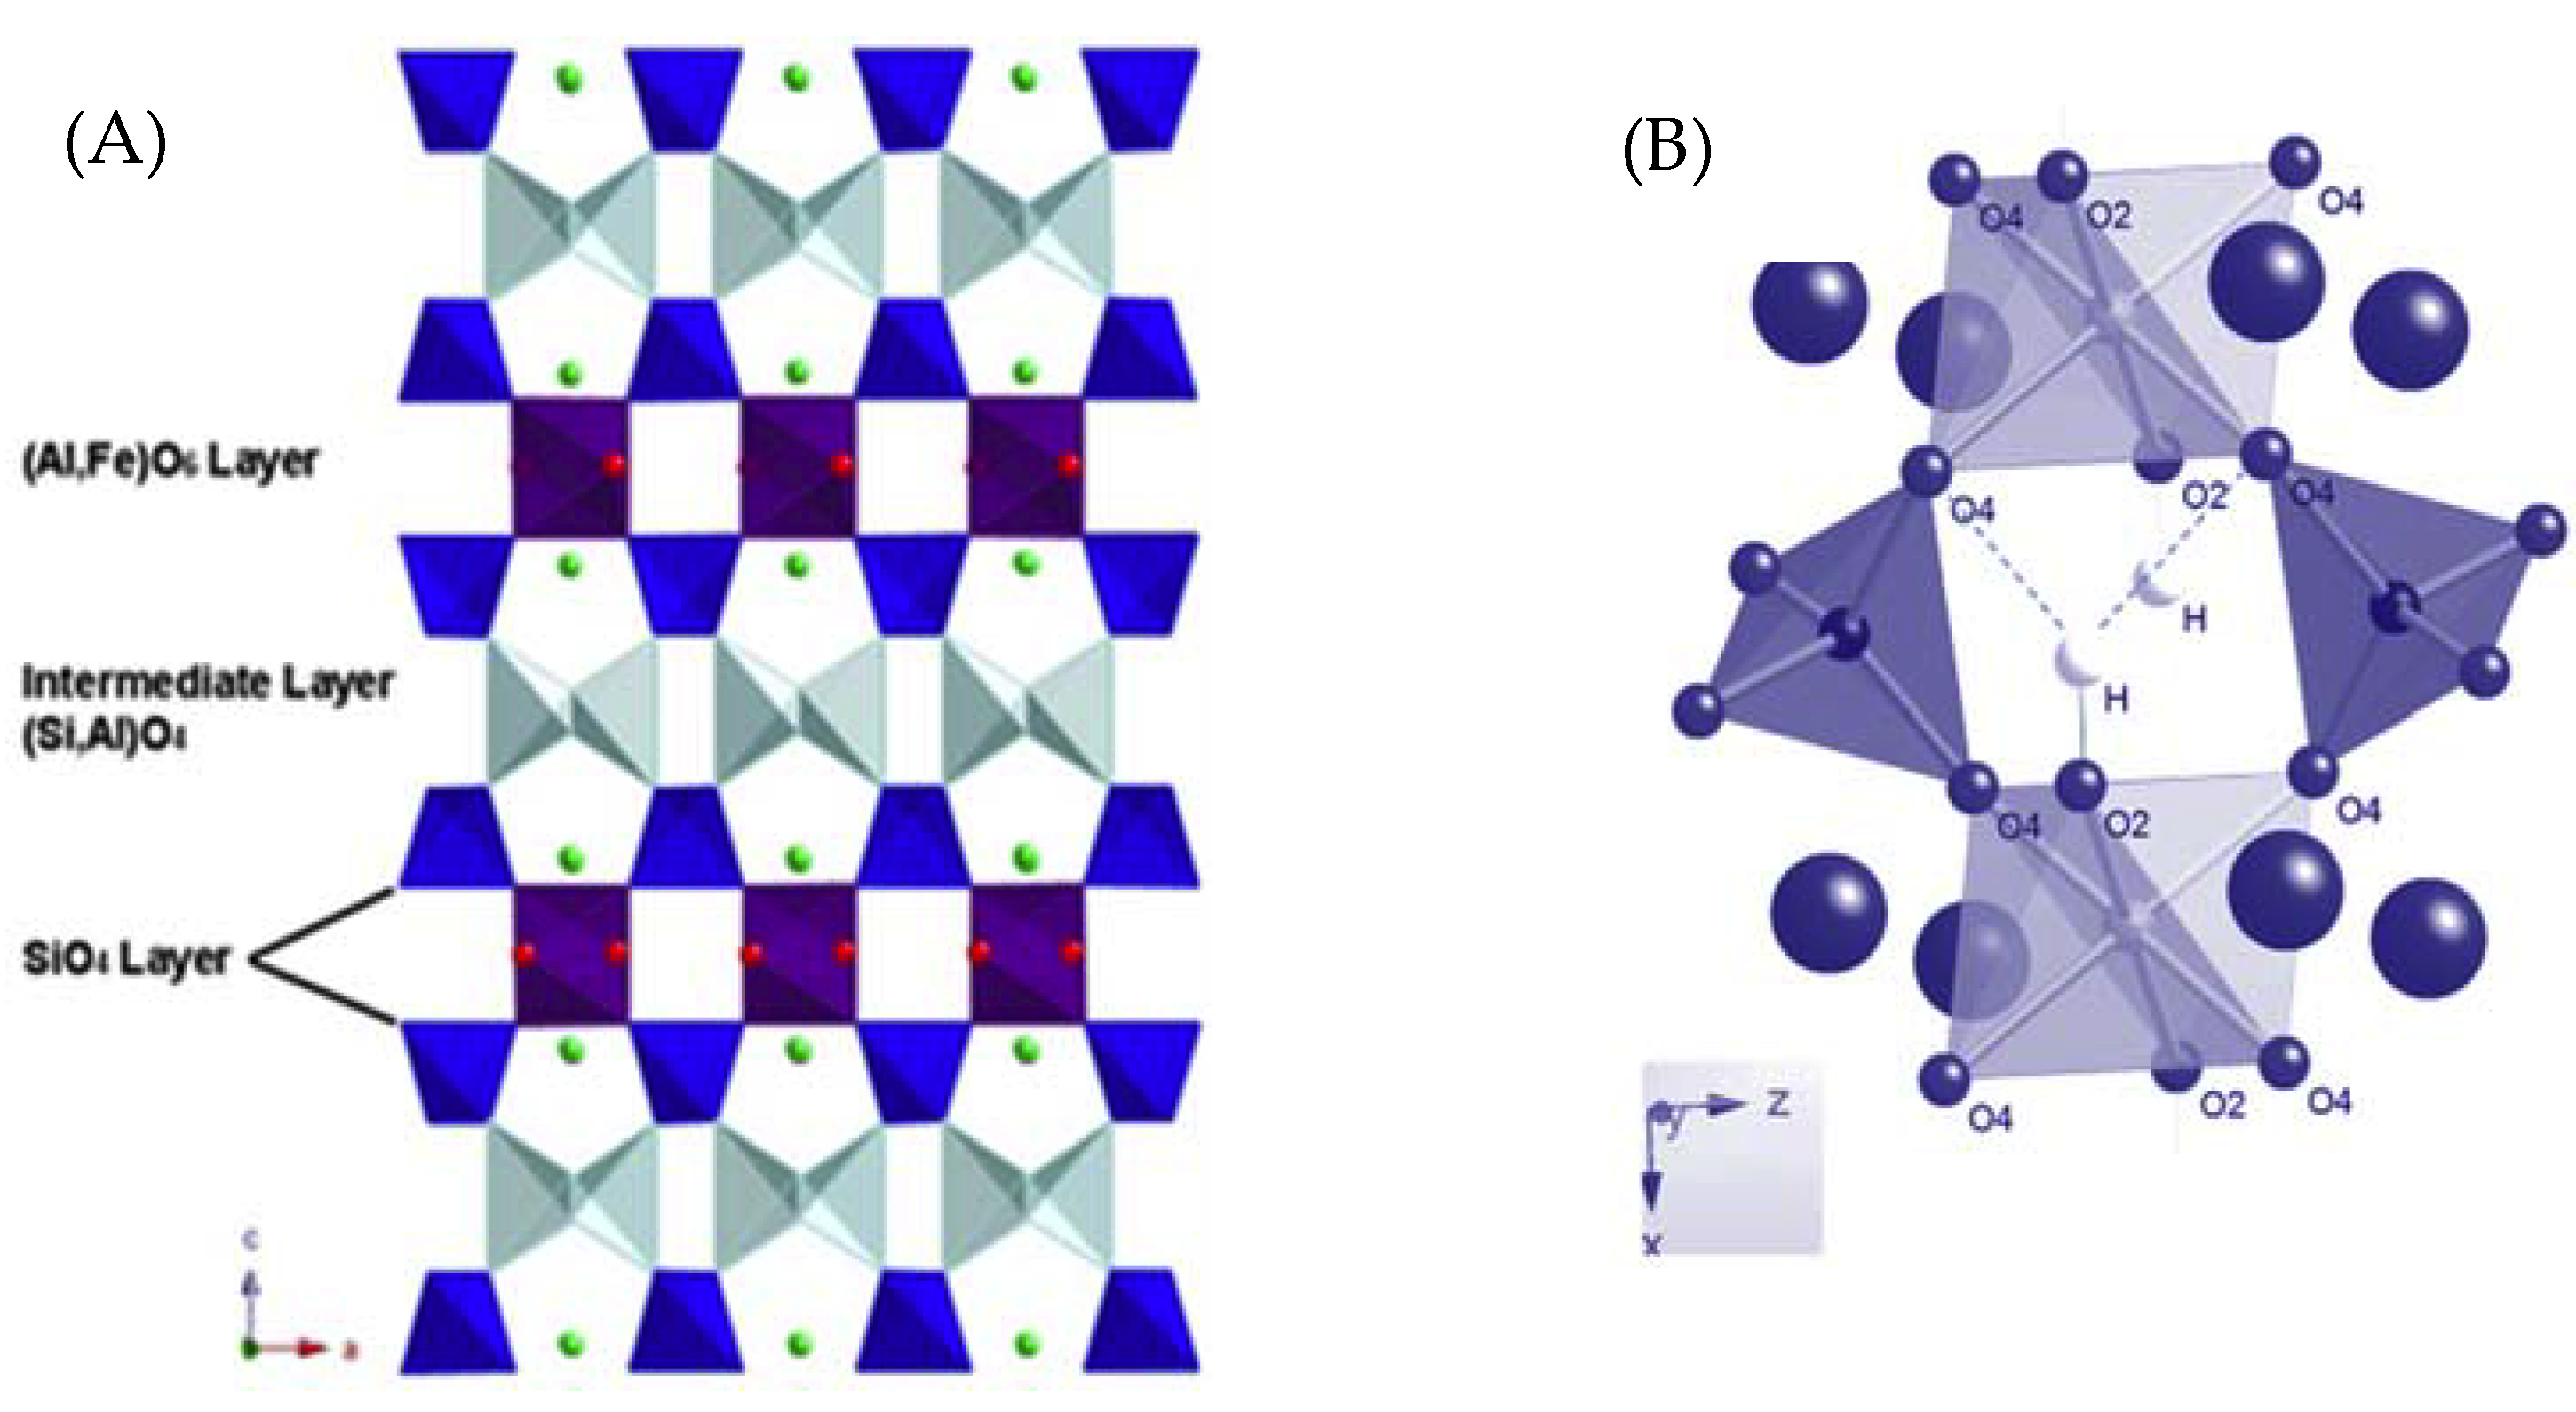
The crystal structure of prehnite has been extensively investigated, including the location of the hydrogen positions with neutron diffraction [5,6,7,8,9]. The structure is comprised of corner-sharing (Si,Al)O4 tetrahedra and AlO6 octahedra, with any Fe3+ present substituting for Al3+. When viewed along the [010] direction, the prehnite framework appears to consist of layers of octahedra, connected by three layers of tetrahedra (Figure 1). These (Si,Al)O4 tetrahedra form a corkscrew arrangement that extends parallel to [010]. The tetrahedra that are directly bound to the octahedra are all SiO4 units, however the intermediate layer of double tetrahedra is composed of both AlO4 and SiO4. The exact arrangement of these double tetrahedra is dependent on the space group to which the structure is assigned. If the structure is described in orthorhombic space group Pncm, then the average structure that is obtained is disordered, and the central atoms of the tetrahedra comprising the intermediate layer must be modelled as Si and Al in a 1:1 ratio (Figure 1). However, if the structure is refined in the acentric monoclinc space group, P2cm, then an ordered arrangement is obtained, in which half of these tetrahedra are AlO4 and the remaining half are SiO4 units. The apices of the octahedra are protonated, leading to possible hydrogen bonding between octahedral units that lie adjacent to each other in the [010] direction, as shown in Figure 1 where the bifurcated environment of the H and its next nearest oxygen atoms is indicated by dashed lines. The anionic charge on the framework is compensated for by Ca2+ ions, located within the channels of the framework that run parallel to [010].
In a high-pressure single-crystal X-ray diffraction study (HP-XRD) of prehnite, Detrie et al. [10] completed structure refinements up 9.8 GPa, that shed light on the compression mechanisms of prehnite. Above 8.7 GPa, they observed a change in the structure involving softening of the volume and b unit cell parameter, although the average structure was maintained across the transition. The driving force for the structural change in prehnite above 9 GPa was attributed to the reduction of the shear of the T2 tetrahedron, while the Si tetrahedron, the Al octahedron and the remainder of the Ca environment all remained essentially the same. The aim of this study was to elucidate the nature of this transition, by completing a high-pressure infrared and Raman study of prehnite. As described below, these data provide new insights into the phase transition and high-pressure behavior of prehnite.
2. Materials and Methods
The data were collected on a sample of prehnite from Mali, Africa, with a formula of Ca2(Al0.74,Fe0.26)2Si3O10(OH)2. All infrared (IR) spectra were recorded at the National Synchrotron Light Source (NSLS), Brookhaven National Laboratory, on beamline U2A. Mid-IR spectra were collected with a Bruker IFS 66v/S vacuum Fourier transform interferometer (Bruker Optics, Karlsruhe, Germany). The instrument was equipped with a KBr beamsplitter (Bruker Optics, Karlsruhe, Germany), globular source, and a N2 cooled mercury cadmium telluride (MCT) detector (Infrared Laboratories Inc., Tucson, AZ, USA). Far-IR measurements were performed with a modified Bruker IRscope II microscope (Bruker Optics, Karlsruhe, Germany), fitted with a mylar beamsplitter and SiB/Si bolometer (Infrared Laboratories Inc., Tucson, AZ, USA). Infrared spectra were first collected in air under ambient conditions and then the sample was loaded in a standard symmetric type diamond anvil cell (DAC), and compressed into a thin film of powder. A KBr or petroleum jelly was used as the pressure-transmitting medium during the high-pressure mid- or far-infrared experiment separately. These pressure media were used because it is transparent in the mid- or far-infrared region accordingly. The exact hydrostatic limit for this particular pressure medium is unknown, but it is assumed to be low based on studies of similar media, such as silicon oil (0.9 GPa) and glycerol (1.4 GPa) [11]. A fragment of ruby was included in the DAC as a pressure calibrant [12]. High pressure Raman spectra were also collected at the NSLS at beamline U2A. Ambient condition spectra were collected from a single crystal in air. For the high-pressure data collections, the crystal was loaded into a standard symmetric type DAC with the dominant (001) crystal face parallel to the diamond culets. Two ruby spheres were included in the DAC for pressure calibration [12]. The DAC was filled with a 4:1 methanol:ethanol solvent mixture, that acted as the pressure-transmitting medium; this mixture was chosen as it is known to remain hydrostatic up to 10 GPa [11].
3. Results and Discussion
3.1. IR and Raman Spectra of Prehnite Measured under Ambient Conditions
Table 1 summarizes the peaks derived from the ambient infrared spectra obtained by smoothing the spectra with a Savitsky–Golay function and then deconvoluting and fitting peaks with multiple Gaussian functions (using PeakFit [13]). There is acontinuous band of modes extending from 128 to 574 cm−1, followed by a gap, then a band of peaks between 755 to 1150 cm−1, followed by another gap before peaks between 3450 to 3500 cm−1 (O-H strecthing modes). The peak at 475(1) cm−1 is largely associated with the internal vibrational modes of the MO6 octahedra, and the bands between 3453–3490 cm−1 are associated with O–H stretching vibrations. The peaks within the 976–1152 cm−1 range of the spectra reflect the internal vibrational modes of the SiO4 tetrahedra. These assignments are based on the analyses of the infrared and Raman spectra of relevant silicate minerals [14,15,16,17,18]. However, the remainder of the vibrational bands in the spectra are complex and is comprised of multiple peaks that cannot be assigned unambiguously without a full lattice dynamical study, which is beyond the scope of the current contribution.
Table 1 also includes the peaks obtained from fitting the Raman spectra. There is a continuous band of modes extending from 112 to 605 cm−1, then a gap before modes between 940 to 1100 cm−1 (Si–O stretching modes), and then another gap before the modes between 3450 to 3500 cm−1 (O–H stretching modes).
3.2. High Pressure Infrared Spectra of Prehnite
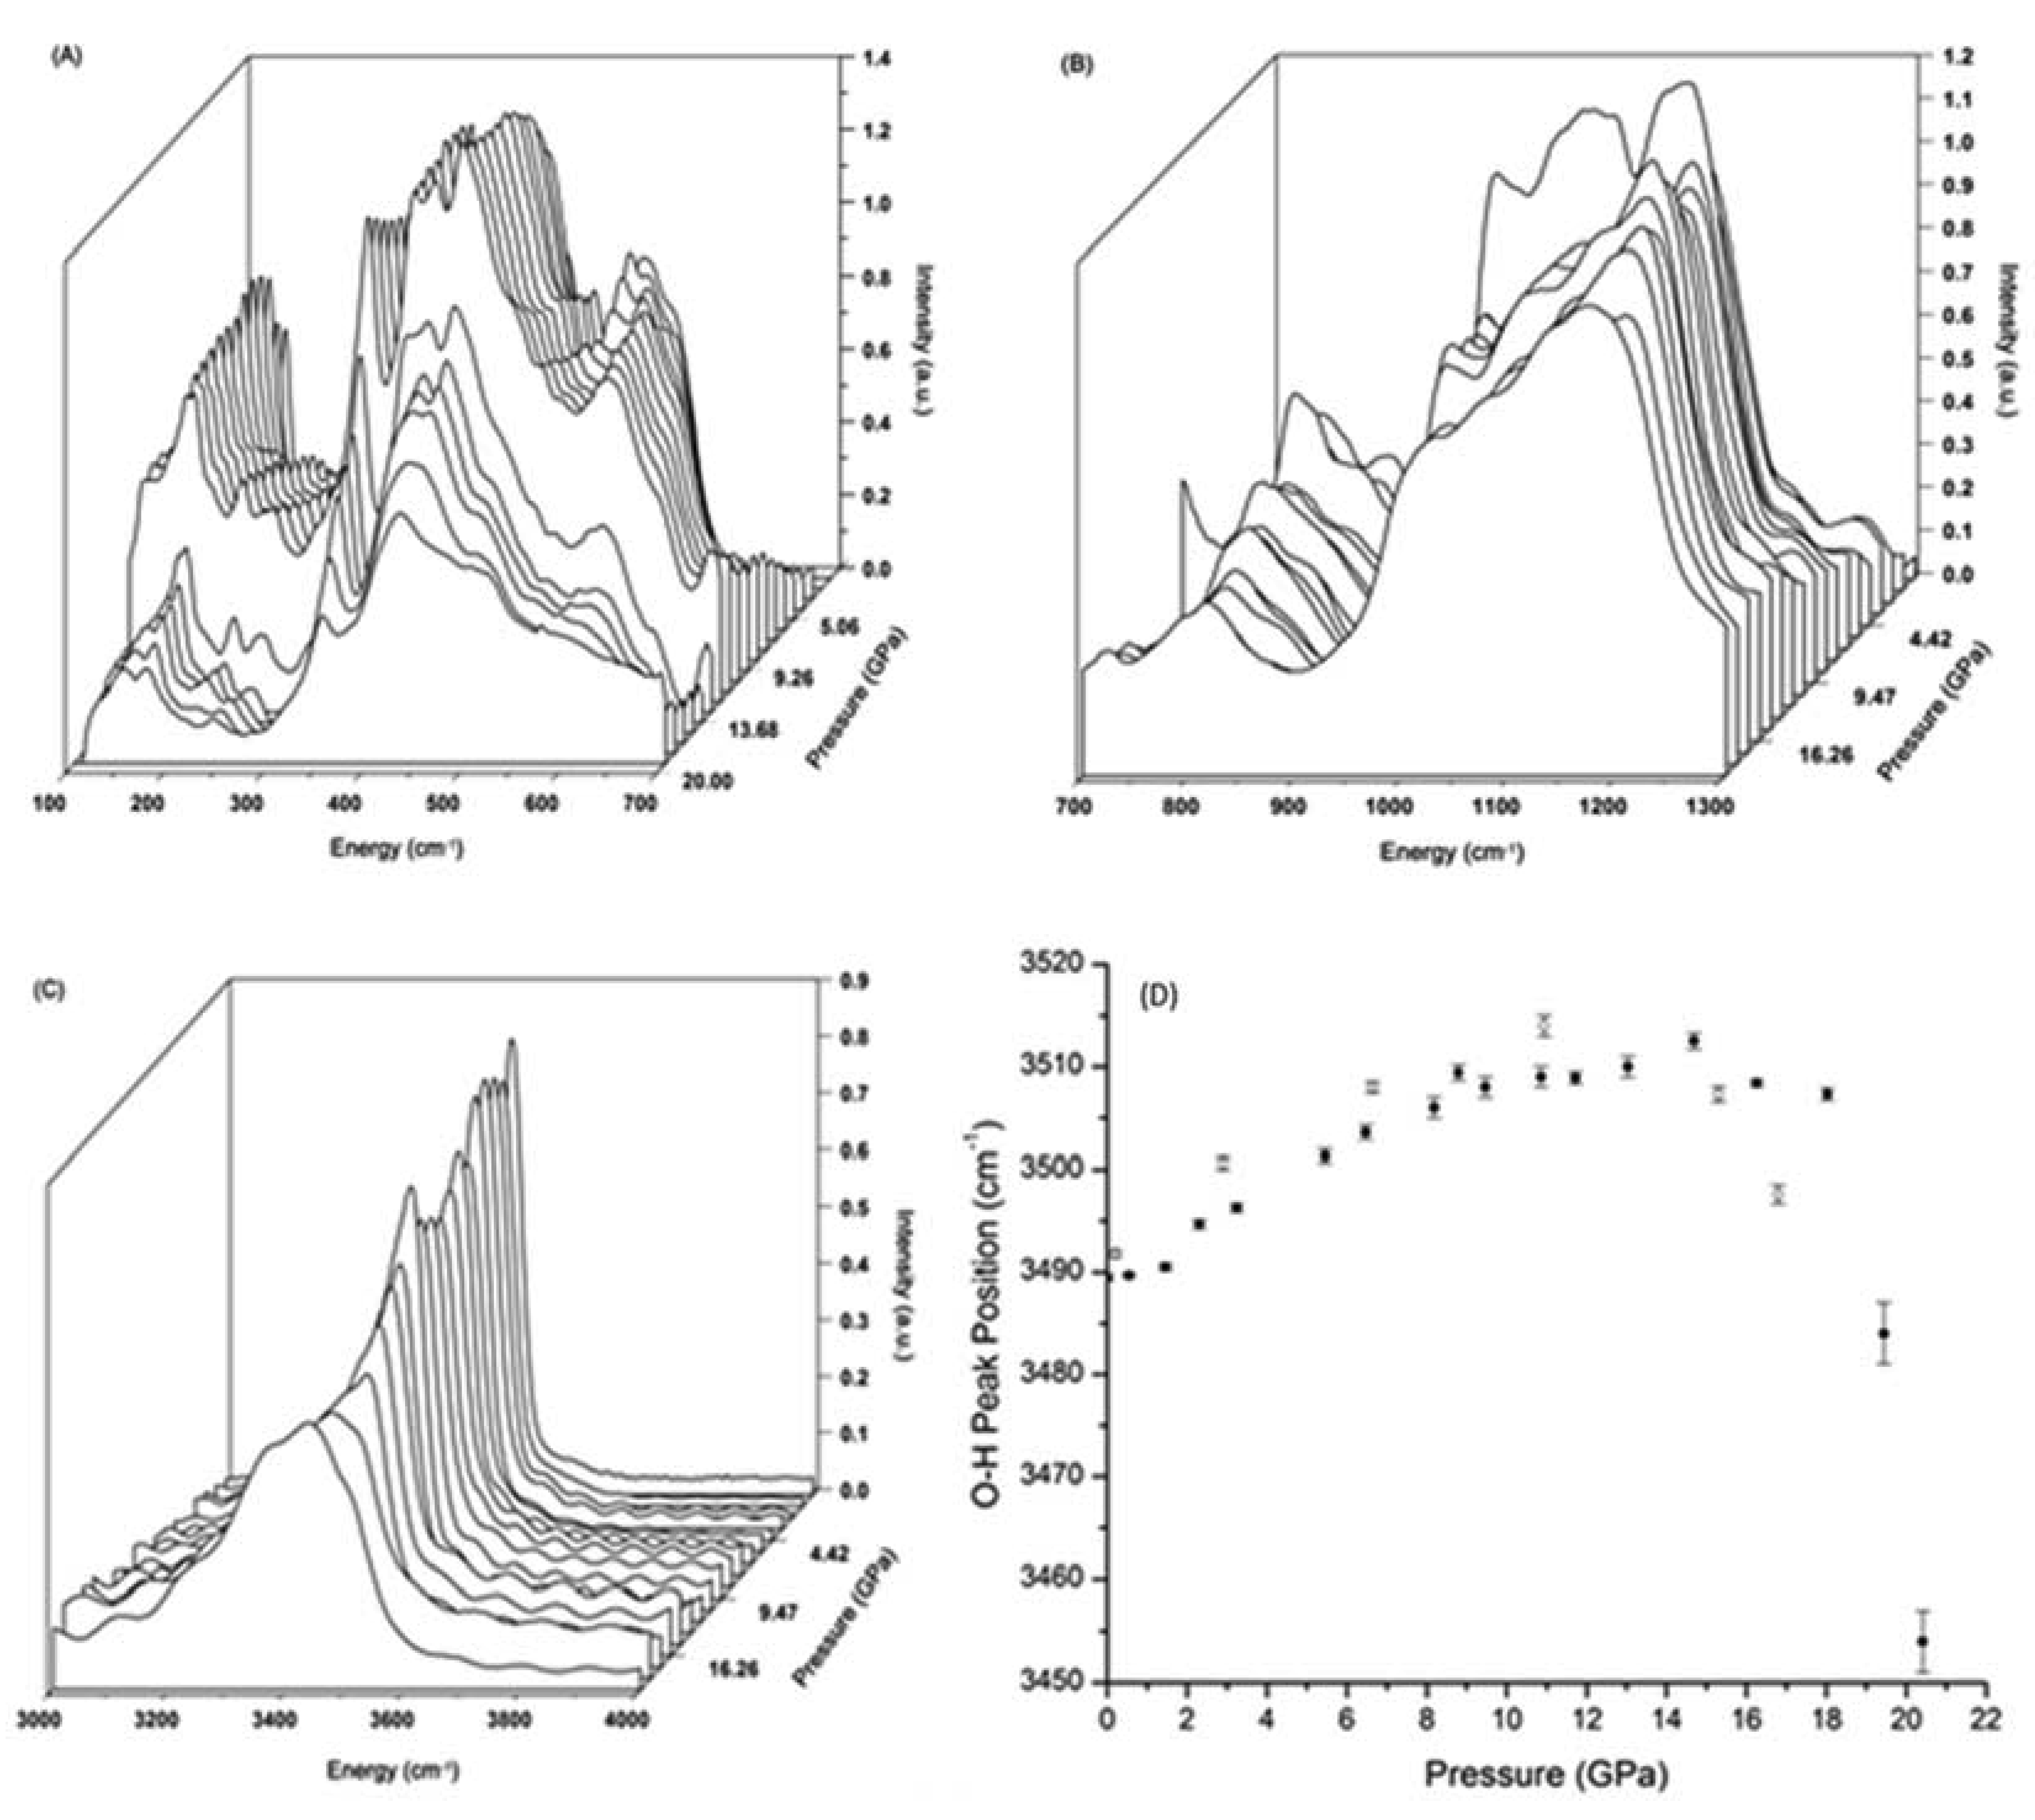
The far- and mid-IR spectra of prehnite recorded over the 1 bar to 20 GPa range are shown in Figure 2. These plots show the evolution with pressure of the Ca and lattice vibrational modes, as well as modes associated with the translational motions of the octahedral and tetrahedra [14,15,16]. Examination of the spectra reveals a red-shift of the peak at ca. 540 cm−1, accompanied by suppression of the peak intensity. The changes in this peak are gradual, but appear to commence at ca. 6.0 GPa and be completed by 8.2 GPa. A comparison of the high pressure far-IR spectra of prehnite with those of layered silicates, such as chrysotile, antigorite, talc, clinochlore, and montmorillonite [14,15,16] suggest that the peaks within the 400–700 cm−1 range are associated with the translational motions of the polyhedra, the bending/stretching of the P–O–P (P = polyhedron) links, and the M–OH vibrations.
Consequently, the changes observed between 6.0 and 8.2 GPa in the far-IR spectra, as evidenced by the red-shift of the 540 cm–1 peak, are likely to involve a subtle change in the relative orientations of the polyhedra that is insufficient to break the average crystal symmetry (Pncm) of the structure [9]. However, the mid-IR region of the high-pressure spectra associated with the O–H stretching modes (Figure 2C) do not exhibit any significant changes in the 6–8 GPa pressure range. This is further emphasized in Figure 2D, where the positions of the primary O–H vibration peaks are plotted as a function of pressure. No deviation of the curve is observable within this pressure range. Above 16 GPa, however, there is sudden red-shift, which is discussed below. In contrast to the IR data, examination of the corresponding peaks in the high-pressure Raman spectra between 6–8 GPa (Section 3.3) indicate that there is a change in the chemical environment of the O–H group associated with this phase transition.
The far-IR results are consistent with the HP-XRD results, that indicate the prehnite structure begins to soften above 8.7 GPa, in which subtle but significant structural changes occur [10]. The broad pressure range, and shift to lower pressure, reflected in the IR data relative to the HP-XRD data, may be due to the non-hydrostatic conditions under which these spectroscopic data were collected (e.g., [11]). Furthermore, the HP-XRD experiments indicated that the transition involves movement/distortion of the tetrahedra, as evidenced by alterations in the O–T–O and T–O–T (T = Si or Al) angles. The far-IR data concur with this finding.
The infrared spectra of prehnite over the 700–1300 cm−1 energy range are displayed in Figure 2B. These spectra contain information pertaining to the internal vibrational modes of both the octahedra and the tetrahedra, as well as complex interactive polyhedral modes. It is immediately apparent that the evolution of these spectra with pressure is more intricate than observed for the spectra recorded below 700 cm−1 (Figure 2A). This may be indicative of the internal vibrational modes of the polyhedra, and the complex coupled motions of these units, being more sensitive to pressure than the lattice modes and Ca–O vibrations. No abrupt changes are observed in the peaks from 900–1300 cm−1 over the 6–8 GPa pressure range. This may further suggest that the structural transition that occurs within this pressure range does not necessitate a change in the lengths, and hence strength, of the bonds within the polyhedra, a finding that is also consistent with the HP-XRD study [10].
A more dramatic change in the far-IR spectra is observed above 11 GPa (Figure 2A). The peaks in the high-pressure far-IR spectra display a dramatic change in shape (predominately broadening) and reduction in the intensity between 11.5 and 12.4 GPa. As these bands are principally associated with the lattice modes and polyhedral motions, these significant changes in the spectra are believed to be associated with the onset of the collapse of the prehnite framework. This framework collapse is fully reversible. Similar effects are seen in the IR spectra, shown in Figure 2B. At ca. 11 GPa, the bands begin to lose structure, broaden and weaken in intensity, coinciding with the onset of the framework collapse. In contrast, the O–H vibrational modes seem insensitive to the initial stages of this major structural change, as the peaks associated with these modes do not exhibit any notable changes until ca. 16 GPa, at which point there is a noticeable red-shift of the principle peak associated with the O–H vibrations (Figure 2D).
3.3. High Pressure Raman Spectra of Prehnite
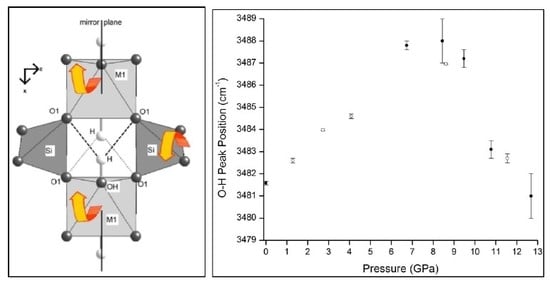
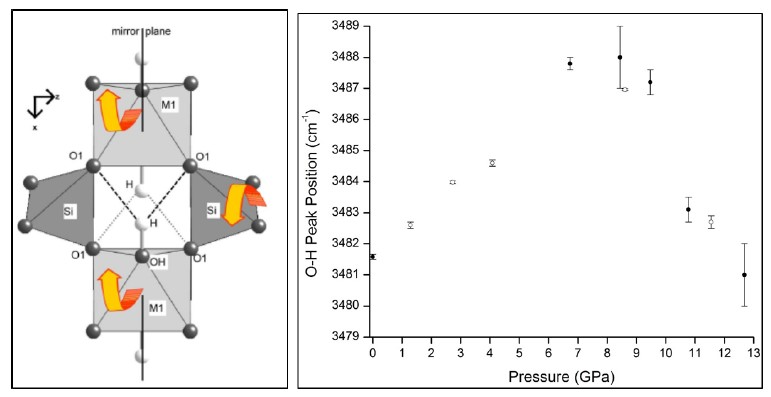
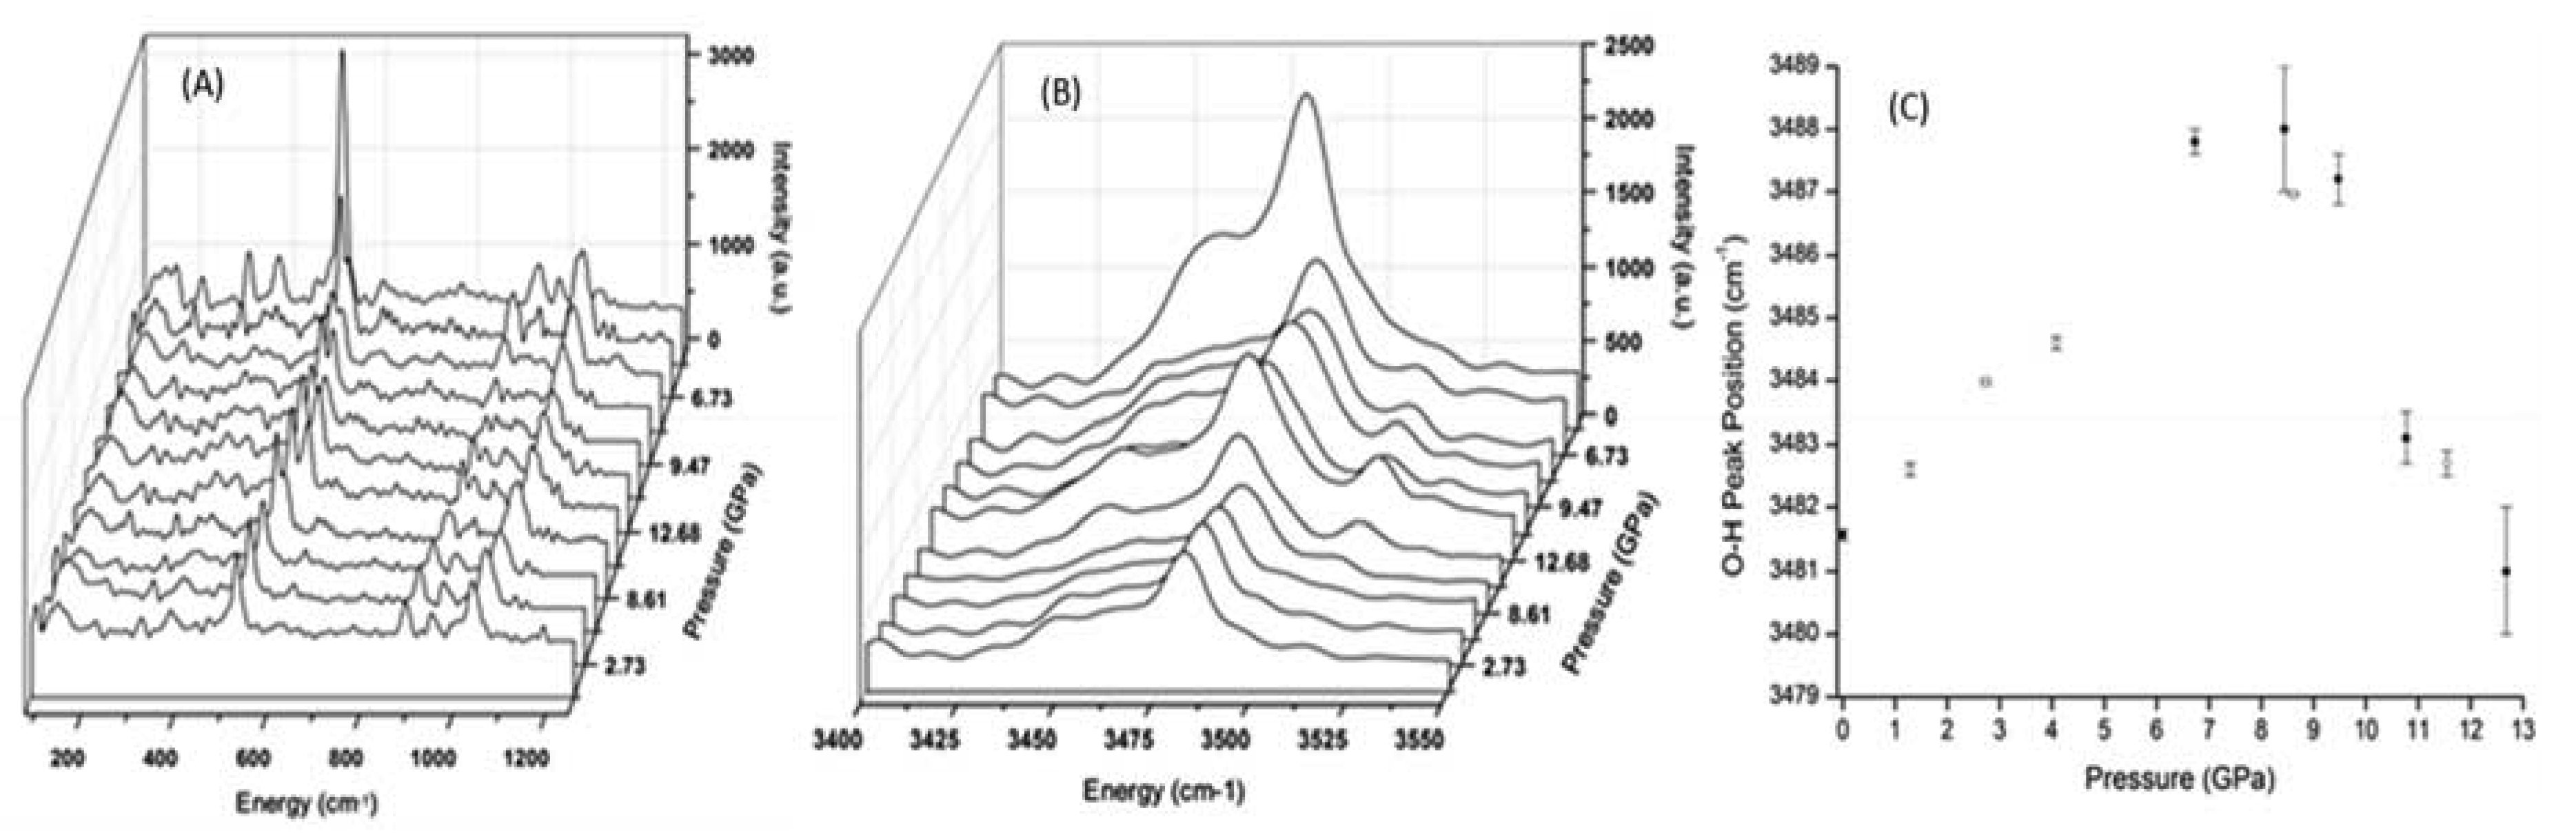
The high-pressure Raman spectra for prehnite are presented in Figure 3. Many of the features that are apparent in the spectra measured under ambient conditions (Table 1) are obscured by the high background in the high-pressure spectra. Nonetheless, valuable information can still be gleaned, in particular from the evolution of the peak at ca. 520 cm−1 with pressure. This peak either arises from the internal vibrations of the MO6 polyhedra, or from the T–O–T bending modes. As the pressure is increased from 6.73 GPa to 12.68 GPa, the splitting of this peak is amplified, yet as the pressure is decreased, the degree of splitting reduces, and below ca. 8.6 GPa, the peak becomes a single entity. This is strongly suggestive of an alteration of the prehnite structure with pressure. Furthermore, the merging of the split peak into a single peak below ca. 8.6 GPa coincides with the phase transition that is known to occur in prehnite at this pressure, as evidenced by the high-pressure IR spectra described above and the HP-XRD study [6]. As discussed above, the HP-XRD study of prehnite indicated that the structural phase transition at ca. 8.7 GPa is related to a distortion of the tetrahedra. Consequently, it is probable that the peak at ca. 520 cm–1 is due to T–O–T bending motions, and that in the prehnite phase that exists above 8.6 GPa, there is an increase in the number of tetrahedra in symmetrically distinct environments, that results in the splitting of this peak in the high pressure spectra. The peaks in the 850–950 cm−1 range of the spectra (Figure 3A) involve the internal vibrations, predominately T–O–T stretching, of the SiO4 and AlO4 tetrahedra. Unfortunately, the low resolution of the data and the interference of the methanol/ethanol solvent peak at ca. 1050 cm−1 prevent a conclusive evaluation of the peaks in this energy range.
Figure 3B,C show the evolution of the O–H vibration band with pressure and the position of the principle peak of this band, respectively. As the pressure increases, the position of the O–H vibration peak is, as expected, blue-shifted. However, at ca. 8.6 GPa, there is a noticeable red-shift, as evidenced by the sudden downturn in the data plotted in Figure 3C (closed circles); this provides further verification of a phase change occurring in the prehnite structure at ca. 8.6 GPa. Moreover, this phase transition is clearly accompanied by an alteration in the environment and weakening of the O–H bond. Such a change was not observed in the high-pressure mid-IR spectra of the sample (Figure 2), and this is presumably due to the different selection rules associated with the two techniques. The shift to lower energy of the O–H bond vibration is indicative of the weakening of this bond, which may suggest that the hydrogen bonding in which this bond participates is strengthened by the structural alterations that occur during the phase transition. This is not altogether surprising, as this electrostatic interaction is between the –OH group situated at the apex of the MO6 octahedra and the T–O–M bridging oxygen located on the opposite side of the cavity [2,3]. Therefore, it is feasible that the deformation of the tetratahedra that is believed to drive the phase transition results in the distance between the bridging oxygen atom and the hydrogen atom being shortened, and consequently the O–H··O hydrogen bond is strengthened. The phase transition at observed 8.6 GPa is reversible. This is indicated by the return of the O–H peak to its low-pressure position, as the pressure on the structure is alleviated (Figure 3C, open circles), and by the recombination below 8.6 GPa of the split peak at ca. 520 cm–1 (Figure 3B).
4. Conclusions
The infrared and Raman spectra of prehnite, collected under ambient and high-pressure conditions, have allowed for an in-depth assessment of the evolution of the prehnite structure as a function of pressure. The vibrational data, combined with the previous HP-XRD study [10], indicate that the polyhedra comprising the prehnite framework undergo deformation/reorientation in response to pressure. Prehnite exhibits a reversible phase transition between 6–8 GPa, and the prehnite framework undergoes reversible collapse at pressures in excess of 11 GPa. It is expected that subtle reversible structural changes occur in other complex silicates, that are important as they will affect the elastic and thermodynamic properties of the material. The study also shows how high-pressure vibrational spectroscopic experiments complement HP-XRD studies, as they show details about changes in the local atomic environments and in the bonding of the structure with pressure.
Author Contributions
Conceptualization, N.L.R.; methodology, Z.L.; analysis, T.A.D.; experiments; T.A.D. and Z.L.; resources, N.L.R.; writing N.L.R.; writing draft, T.A.D.; review and editing, N.L.R.; supervision, N.L.R.; project administration, N.L.R.; funding acquisition, N.L.R. All authors have read and agreed to the published version of the manuscript.
Funding
This research was funded by the National Science Foundation (NSF), EAR-073892 and EAR-1118691. This research was also partially supported by COMPRES, the Consortium for Materials Properties Research in Earth Sciences, under NSF Cooperative Agreement EAR 01-35554.
Conflicts of Interest
The authors declare no conflict of interest.
References
- Artioli, G.; Quartieri, S.; Deriu, A. Spectroscopic data on coexisting prehnite-pumpellyite and epidote-pumpellyite. Can. Mineral. 1995, 33, 67–75. [Google Scholar]
- Liou, J.G. Synthesis and stability relations of prehnite, Ca2Al2Si3O10(OH)2. Amer. Mineral. 1971, 56, 507–531. [Google Scholar]
- Perkin, D., III; Westrum, E.F., Jr.; Essene, E.J. thermodynamic properties and phase relations of some minerals in the system CaO–Al2O3–SiO2–H2O. Geochim. Cosmochim. Acta 1980, 44, 61–84. [Google Scholar] [CrossRef] [Green Version]
- Gottschalk, M. Internally consistent thermodynamic data for rock-forming minerals in the system SiO2–TiO2–Al2O3–Fe2O3–CaO–MgO–FeO–K2O–Na2O–H2O–CO2. Eur. J. Miner. 1997, 9, 175–223. [Google Scholar] [CrossRef]
- Peng, S.-T.; Chou, K.-D.; Tang, Y.-C. The structure of prehnite. Acta Chem. Sin. 1959, 25, 56–63. [Google Scholar]
- Papike, J.J.; Zoltai, T. Ordering of tetrahedral aluminium in prehnite. Am. Miner. 1967, 52, 974–984. [Google Scholar]
- Akizuki, M. Al, Si order and the internal texture of prehnite. Can. Miner. 1987, 25, 707–716. [Google Scholar]
- Balić-Žunić, T.; Šćavničar, S.; Molin, G. Crystal structure of prehnite from Komiža. Eur. J. Miner. 1990, 2, 731–734. [Google Scholar] [CrossRef]
- Detrie, T.A.; Ross, N.L.; Angel, R.J.; Welch, M.D. Crystal chemistry and location of hydrogen atoms in prehnite. Miner. Mag. 2008, 72, 1163–1179. [Google Scholar] [CrossRef]
- Detrie, T.A.; Ross, N.L.; Angel, R.J.; Diego Gatta, G. Equation of state and structure of prehnite to 9.8 GPa. Eur. J. Miner. 2009, 21, 561–570. [Google Scholar] [CrossRef]
- Angel, R.J.; Bujak, M.; Zhao, J.; Gatta, D.; Jacobsen, S.D. Effective hydrostatic limits of pressure media for high-pressure crystallographic studies. J. Appl. Cryst. 2007, 40, 26–32. [Google Scholar] [CrossRef]
- Mao, H.; Xu, J.; Bell, P.M. Calibration of the ruby pressure gauge to 800 kbar under quasi-hydrostatic conditions. J. Geophys. Res. 1986, 91, 4673–4676. [Google Scholar] [CrossRef]
- SeaSolve Software Inc. PeakFit v4.12 (1999–2003); SeaSolve Software Inc.: San Jose, CA, USA, 2000. [Google Scholar]
- Šontevska, V.; Jovanovski, G.; Makreski, P. Minerals from Macedonia. Part XIX. Vibrational spectroscopy as identificational tool for some silicate minerals. J. Mol. Struct. 2007, 834–836, 318–327. [Google Scholar] [CrossRef]
- Boev, B.; Jovanovski, G.; Makreski, P. Minerals from Macedonia. Part XX. Geological Setting, Lithologies, and Identification of the Minerals from Ržanovo Fe Ni deposit. Turkish J. Earth Sci. 2009, 18, 631–652. [Google Scholar]
- McKeown, D.A.; Bell, M.I.; Etz, E.S. Raman spectra and vibrational analysis of the trioctahedral mica phlogopite. Am. Miner. 1999, 84, 970–976. [Google Scholar] [CrossRef]
- Saniger, J.M. Al–O infrared vibrational frequencies of γ alumina. Mater. Lett. 1995, 22, 109–113. [Google Scholar] [CrossRef]
- White, A.J.R.; Laukamp, C.; Stokes, M.A.; Legras, M.; Pejcic, B. Vibrational spectroscopy of epidote, pumpellyite and prehnite applied to low-grade regional metabasites. Geochem. Expl. Env. Analy. (GEEA) 2017, 17, 315–333. [Google Scholar] [CrossRef]
Figure 1.
(A) The average structure of prehnite (Pncm), as viewed along [010] with (Al,Fe)O6 (purple); SiO4 (dark blue); (Si0.5,Al0.5)O4 (light blue); Ca2+ (green spheres). (B) Hydrogen positions viewed down [010]. Both figures were generated from crystallographic data reported in [9].
Figure 1.
(A) The average structure of prehnite (Pncm), as viewed along [010] with (Al,Fe)O6 (purple); SiO4 (dark blue); (Si0.5,Al0.5)O4 (light blue); Ca2+ (green spheres). (B) Hydrogen positions viewed down [010]. Both figures were generated from crystallographic data reported in [9].

Figure 2.
(A) Evolution with pressure of the far-IR spectra of prehnite over the 0–700 cm–1 range; (B) Over the 700–1300 cm–1 range; (C) Over the 3000–4000 cm–1 range. (D) Central position of the primary O–H vibrational peak, plotted as a function of pressure. Closed circles: data points measured during pressure increase; open circles: data points recorded during decompression.

Figure 3.
(A) Evolution with pressure of the Raman spectra of prehnite between 150–1250 cm−1; (B) between 3400–3550 cm−1; (C) central position of the primary O–H vibrational peak as a function of pressure. Closed circles: data points measured during pressure increase; open circles: data points recorded during decompression. All spectra have been corrected for background and smoothed by application of the Savitzty–Golay algorithm, to enable the spectral features to be observed.


Table 1.
Central energy values and frequency half width maximum (FHWM) values for principle Gaussian functions, comprising the fitted infrared and Raman data.
Table 1.
Central energy values and frequency half width maximum (FHWM) values for principle Gaussian functions, comprising the fitted infrared and Raman data.
| Infrared Peaks (cm−1) | Peak FHWM (cm−1) | Raman Peaks (cm−1) | Peak FHWM (cm−1) |
|---|---|---|---|
| 128 (3) | 27 | 112 (1) | 21 |
| 146 (2) | 21 | 138 (1) | 27 |
| 213 (1) | 26 | 161 (1) | 16 |
| 243 (1) | 16 | 216 (1) | 17 |
| 296 (1) | 27 | 317 (1) | 18 |
| 343 (1) | 33 | 350 (1) | 27 |
| 377 (1) | 21 | 381 (1) | 25 |
| 423 (2) | 55 | 464 (1) | 21 |
| 475 (1) | 35 | 492 (1) | 22 |
| 505 (1) | 36 | 518 (1) | 20 |
| 542 (1) | 38 | 541 (1) | 14 |
| 574 (5) | 44 | 606 (1) | 26 |
| 755 (2) | 47 | ||
| 812 (1) | 36 | ||
| 876 (1) | 33 | ||
| 931 (9) | 44 | ||
| 976 (9) | 40 | 940 (1) | 30 |
| 998 (25) | 62 | 985 (1) | 16 |
| 1033 (19) | 33 | ||
| 1080 (13) | 52 | 1074 (1) | 28 |
| 1118 (16) | 48 | ||
| 1152 (24) | 47 | ||
| 3453 (1) | 41 | 3456 (1) | 26 |
| 3475 (6) | 18 | ||
| 3490 (1) | 35 | 3419 (1) | 13 |
| 3494 (1) | 13 |
© 2020 by the authors. Licensee MDPI, Basel, Switzerland. This article is an open access article distributed under the terms and conditions of the Creative Commons Attribution (CC BY) license (http://creativecommons.org/licenses/by/4.0/).
Share and Cite
MDPI and ACS Style
Ross, N.L.; Detrie, T.A.; Liu, Z. High-Pressure Raman and Infrared Spectroscopic Study of Prehnite. Minerals 2020, 10, 312. https://0-doi-org.brum.beds.ac.uk/10.3390/min10040312
AMA Style
Ross NL, Detrie TA, Liu Z. High-Pressure Raman and Infrared Spectroscopic Study of Prehnite. Minerals. 2020; 10(4):312. https://0-doi-org.brum.beds.ac.uk/10.3390/min10040312
Chicago/Turabian StyleRoss, Nancy L., Theresa A. Detrie, and Zhenxian Liu. 2020. "High-Pressure Raman and Infrared Spectroscopic Study of Prehnite" Minerals 10, no. 4: 312. https://0-doi-org.brum.beds.ac.uk/10.3390/min10040312
Note that from the first issue of 2016, this journal uses article numbers instead of page numbers. See further details here.