Article

Trace-Element and Pb Isotope Evidence on Extracting Sulfides from Potassic Melts beneath Longmenshan and Molabushan Volcanoes, Wudalianchi, Northeast China

1
Institute of the Earth’s Crust, Siberian Branch of Russian Academy of Sciences, 664033 Irkutsk, Russia
2
Geological Department, Irkutsk State University, 664003 Irkutsk, Russia
3
Institute of Volcano and Mineral Spring, Heilongjiang Academy of Sciences, Wudalianchi 164155, China
4
Vinogradov Institute of Geochemistry, Siberian Branch of Russian Academy of Sciences, 664033 Irkutsk, Russia
*
Author to whom correspondence should be addressed.
Submission received: 26 February 2020 / Revised: 30 March 2020 / Accepted: 31 March 2020 / Published: 31 March 2020

Abstract

:
In the Wudalianchi volcanic field, eruptions started with low-Mg potassic lava flows 2.5–2.0 Ma ago and later changed to both low- and moderate-Mg potassic compositions. Volcanic rocks from the Molabushan and Longmenshan volcanoes record an unusually wide range of Pb abundances (from 3.7 ppm to 21 ppm relative to predominant range of 10–15 ppm). To determine the cause of these, we performed a comparative trace-element and Pb isotope study of rocks from these volcanoes and older lava flows. On a uranogenic lead diagram, older low-Mg lavas from lithospheric mantle sources plot on a secondary isochron with a slope corresponding to an age of 1.88 Ga. This contrasts with moderate-Mg volcanic rocks from the Molabushan cone, interpreted to have been derived from a recent convective mantle source, which define a flat linear pattern. Low-Mg rocks from the Molabushan flow have lead isotopic compositions that indicate mixed Gelaqiu and Molabu sources. Relative to rocks from the Molabushan cone, moderate-Mg lavas and slags from the East Longmenshan volcano have modified compositions characterized by Pb, S, and Ni abundances, Ni/Co, Ni/MgO ratios as well as 206Pb/204Pb, 207Pb/204Pb, 208Pb/204Pb, Ce/Pb, Th/Pb, and U/Pb ratios. We infer that the older Wudalianchi magmas were likely derived from a Paleoproterozoic lithospheric fragment, related to the evolved primordial mantle, and that later magmas were generated in the convecting mantle. These were influenced by segregation of small amounts of sulfides.

Graphical Abstract

1. Introduction

In the northern part of the Songliao Basin, potassic volcanic rocks define a chain of volcanic fields (from south to north: Erkeshan, Wudalianchi, Keluo) known as “the WEK zone” [1,2] and “the Wudalianchi zone” [3]. The potassic rocks have been related to an enriched post-Archean continental lithospheric mantle comparable to the OIB (ocean island basalt) end-member EM1 (Enriched Mantle 1). This contrasts with potassic–sodic basalts from other parts of East Asia interpreted to be derived from the depleted sub-lithospheric mantle comparable to the OIB end-member DMM (Depleted MORB Mantle) [1,2,4,5]. Both potassic and potassic–sodic rocks have been regarded as a single continuum, the former being an end-member with enriched signatures of strontium and neodymium isotopes (87Sr/86Sr > 0.7055, 143Nd/144Nd < 0.5123) and low lead isotope ratios (206Pb/204Pb < 16.55, 208Pb/204Pb ~36.5) [6]. In most studies, K-rich magmas have been referred to the uppermost part of the asthenosphere and lithosphere [7,8,9,10].
The Wudalianchi volcanic field is of particular interest due to the historical 1720 to 1776 AD eruptions of the Laoheishan and Huoshaoshan volcanoes. Wide compositional variations of rocks from these volcanoes indicate that they were derived by the melting of different source materials, although such interpretations remain highly controversial [11,12,13,14,15,16,17]. New data on rocks from the Molabushan and East Longmenshan volcanoes of the Wudalianchi area reveal an unusually wide range of Pb abundances from 3.7 ppm to 21 ppm with respect to a predominant range of 10–15 ppm (Table S1). These data provide new insights on magma source heterogeneities in the Wudalianchi area.
A decrease in lead concentration in a suite of volcanic rocks may indicate the efficient extraction of lead from magmas by small amounts of segregated sulfide droplets. Lead is an incompatible lithophile element, but it can be extracted from magmas due its chalcophility [18,19,20,21,22]. Above the peridotite solidus, transitional silicate melts will likely be sulfide under-saturated, thereby promoting the assimilation of sulfides (and their Pb). Model calculations indicate that the significant chalcophile metal depletion of the Nadezhdinsky Formation in the Noril’sk area of the Siberian craton might have resulted from segregation of as little as 0.1 wt.% sulfide [23]. These effects are associated with Ni–Cu sulfide deposits thought to have formed by the assimilation of a sulfur-bearing component by primitive mafic magmas [18,20]. The sulfur content of basaltic magmas is strongly dependent on bulk composition and temperature as well as both oxygen and sulfur fugacities [24]. Sulfur solubility in Fe-bearing silicate melts decreases with increasing pressure [25].
It is well known that most magmatic Ni–Cu sulfide deposits are located within sedimentary platform sequences that provided potential interactions between basic magmas and sulfate-bearing sedimentary rocks, while basic rocks located in areas without a sedimentary cover (for example, Deccan traps) do not contain Ni–Cu sulfide mineralization [26,27]. In Siberian gabbro-dolerite intrusions that host Ni–Cu ore deposits, the source of sulfur is considered to be the gypsum and anhydrite beds of the Paleozoic sedimentary sequence. The magma sulfidization process is inferred from a strong correlation between sulfur contents and δ34S. The highest δ34S value in the intrusions (16‰) is comparable with the average δ34S value of sedimentary anhydrite and gypsum (20‰) [23]. Similarly, selective assimilation of country rocks by mantle-derived magmas is proposed to explain the origin of magmatic sulfide mineralization in the Duluth Complex, Minnesota, USA. Elemental and Pb isotopic mass balance calculations suggest that up to 50 wt.% of the Pb in the sulfides have been derived from external sources in crustal staging chambers, during ascent to shallower levels, or in situ as a result of devolatilization reactions [28].
The aim of this paper was to determine how sulfides were extracted from magmas beneath the Molabushan and Longmenshan volcanoes using trace elements and Pb isotopic compositions of volcanic rocks. To emphasize their anomalous Pb abundances, we compared analyses of samples collected from the Molabushan and Longmenshan volcanoes with those of rocks from the Laoshantou and Old Gelaqiushan lava flows that we consider to have been derived from local lithospheric sources. A possible candidate for the introduction of sulfur into basic magma is from Cretaceous sulfur-bearing sediments that occur in the Wood Farm region of the Wudalianchi area [29]. Pb–S isotope studies of these rocks that provide evidence for their role in sulfide extraction from the magmas of Molabushan and Longmenshan volcanoes will be presented elsewhere.

2. Geological Background

The historical activities of the Laoheishan and Huoshaoshan volcanoes belong to the Central Group of volcanoes that exhibit a successive northeastern shift of eruptions from Laoshantou flow along a line of volcanoes: Wohushan, Bijiashan, Laoheishan, and Huoshaoshan. Other (background) eruptions took place irregularly in volcanoes of the Western Group (Old Gelaqiushan flow, South and North Gelaqiushan, Lianhuashan, Jianshan, Jianshanzi volcanoes) and the Eastern Group (Weishan, West and East Jiaodebushan, Yaoquanshan, Xiaogushan, West and East Longmenshan, Molabushan volcanoes) [30] (Figure 1).
Volcanic events of the Wudalianchi field, dated by the potassium–argon method, have been subdivided into seven phases [3,12,13,31,32,33]. Eruption of the Old Gelaqiushan flow occurred in the northern margin of the field at ca. 2.0 Ma, whereas the ca. 2.5 Ma eruption of the Laoshantou flow started a sequence of eruptions that migrated along the central volcanic line through Wohushan (1.33–0.42 Ma), Bijiashan (0.45–0.28 Ma), Laoheishan (97 Ka, 1720–1721 and 1776 AD) to Huoshaoshan (1721 AD). The West Longmenshan volcano began activities simultaneously with the initial phase of Wohushan volcano and continued in the last 0.6 Ma, while the East Longmenshan volcano revealed only activities in the last 0.6 Ma. The Molabushan volcano was active at the beginning of the latest (<0.6 Ma) time interval (Figure 2).
Pyroclastic cones of the volcanoes (Figure 3) erect on lava shields with diameters up to 18 km. The West and East Longmenshan edifices are as high as 135 m (altitude of 557 m) and 800 m at its base. On top of the western cone, there is a chain of three small craters stretching northwest–southeast; on top of the eastern one, there is a single crater elongated in the same direction. The Molabushan volcano is a 100-m high cone with a diameter of 700–800 m at its base. Its top has two connected, elongated northeast–southwest craters with diameters as wide as 250 m each.
Cretaceous sulfur-bearing sediments are exposed in the Wood Farm quarry. A 10-m thick stratum of uniform sulfur-bearing argillite (4 wt.% sulfur) is cut by water-saturated fracture zones. Study of the argillite using a scanning electron microscope (SEM) Quanta–200 [29] showed its enrichment with fine-grained pyrite aggregates accumulated by bacterial sulfur-redaction communities. The sediments are compositionally comparable to the present-day silt sulfide-type peloids. In the water-saturated fracture zones, affected by various secondary sulfide and sulfate mineralization (marcasite, gypsum, alunogen, etc.), the sulfur content increases up to 25 wt.%.

3. Methods and Materials

3.1. Analytical Techniques

Major oxides of rock samples were determined by “wet analytical methods” and trace elements by inductively coupled plasma mass spectrometry (ICP–MS) using an Agilent 7500ce quadrupole mass spectrometer (Agilent Technologies, Santa Clara, CA, USA). The methods applied have been described previously by Rasskazov et al. [34] and Yasnygina et al. [35]. Sulfur was determined by x-ray fluorescence (XRF) using a wave dispersive Bruker S8 TIGER X-Ray spectrometer (Bruker, Germany). The method used was described by Khudonogova et al. [36]. Sulfide particles were identified in volcanic rocks using a SEM Quanta–200 [29].
Analysis of lead isotopes was performed on a Neptune Plus’ multiple-collector inductively coupled plasma mass spectrometer (MC-ICP-MS) (Thermo Fisher Scientific Inc., Waltham, MA, USA). The reagents used were H2O, purified by de-ionizer Simplicity, HBr and HClO4 Suprapure from Merck, and HCl, HF, and HNO3 purified by a PFA Savillex system. The procedure for sample decomposition and lead separation was modified after Kuritani and Nakamura [37]. Samples of 50–100 mg (1.0–1.5 µg of a Pb in a sample) were weighed in Teflon vials and filled with a mixture of acids (HF:HNO3:HClO4 = 3:1:0.3). The closed vials were placed in an ultrasonic bath for 1.0–1.5 h and then in a thermostatic cupboard for three days. To remove fluorides and residual liquid phases, the samples were heated on a hot plate at a temperature of 120 °C. A mixture of acids (HCl:HNO3 = 3:1) of 1 or 2 mL (depending on the amount of the sample) was added to the samples that were left overnight at room temperature. Afterward, 2 mL of 6N HCl were added to the dried samples that were left overnight at room temperature and dried on a hot plate at 120 °C. The precipitated salts were converted to bromine form (i.e., they were evaporated 2–3 times with HBr:H2O = 1:1 and dissolved in 1 mL of 0.5 N HBr solution). The resulting solutions were placed into ion exchange columns made of Pasteur polyethylene pipettes 10–12 mm long with an inner diameter of 4 mm. Before infilling the columns, the resin was washed repeatedly by a large volume of 8 N HCl solution (10 mL of resin, −200–250 mL of acid). For lead separation, the 0.5 N HBr solution was passed through a standard Bio-Rad column filled with 0.1 mL of AG1–X8 200 −400 mesh (1.0–1.5 mL) resin. For the first treatment, the sample was introduced into a column from 1 mL of 0.5 N HBr and washed twice with 1 mL of this solution. The lead was removed from the column with 1–2 mL of deionized water. The solution was evaporated, dissolved in 0.5 mL 0.5 N HBr, and again introduced into the same thoroughly rinsed column (2 mL 8 N HCl; 1 mL of water and 1 mL 0.5 N HBr). The separated sample was dried and then dissolved in 1 mL of a 3% solution of HNO3. An aliquot was taken from the resulting solution to prepare a solution with a lead concentration of 50–100 ng/mL. The yield of lead from the column was not less than 70%. For the isotopic analysis, the separated sample was divided into two parts, to one of which a tracer was added.
Isotope analysis of lead was performed in static mode. Samples were analyzed twice: in a mixture with the tracer and without it. The analysis included 10 blocks of 10 scans each. The integration time for one scan took four seconds. The superposition of the isobar mass of 204Hg to 204Pb was monitored by measuring the ion current of 202Hg. The procedural blank was 40 ppt. To normalize the isotopic ratios, the double isotopic dilution method of 207Pb + 204Pb was used. The tracer with the isotopic ratios 207Pb/204Pb = 1.0738, 206Pb/204Pb = 0.0565, 208Pb/204Pb = 0.0806 was optimized after Rudge et al. [38]. For the period from January to May 2018, measurements of lead isotope ratios of the SRM NBS-981 reference material yielded the results 206Pb/204Pb = 16.9377 ± 14; 207Pb/204Pb = 15.4922 ± 25; 208Pb/204Pb = 36.6941 ± 35 (2SD) comparable with the published data obtained on MC-ICP-MS by the method of double isotope dilution (ID) and thallium normalization (Tl) as well as with the results obtained with thermal ionization mass spectrometry (TIMS) by the double isotopic dilution method including using the artificial isotopes 202Pb and 205Pb (Table 1).

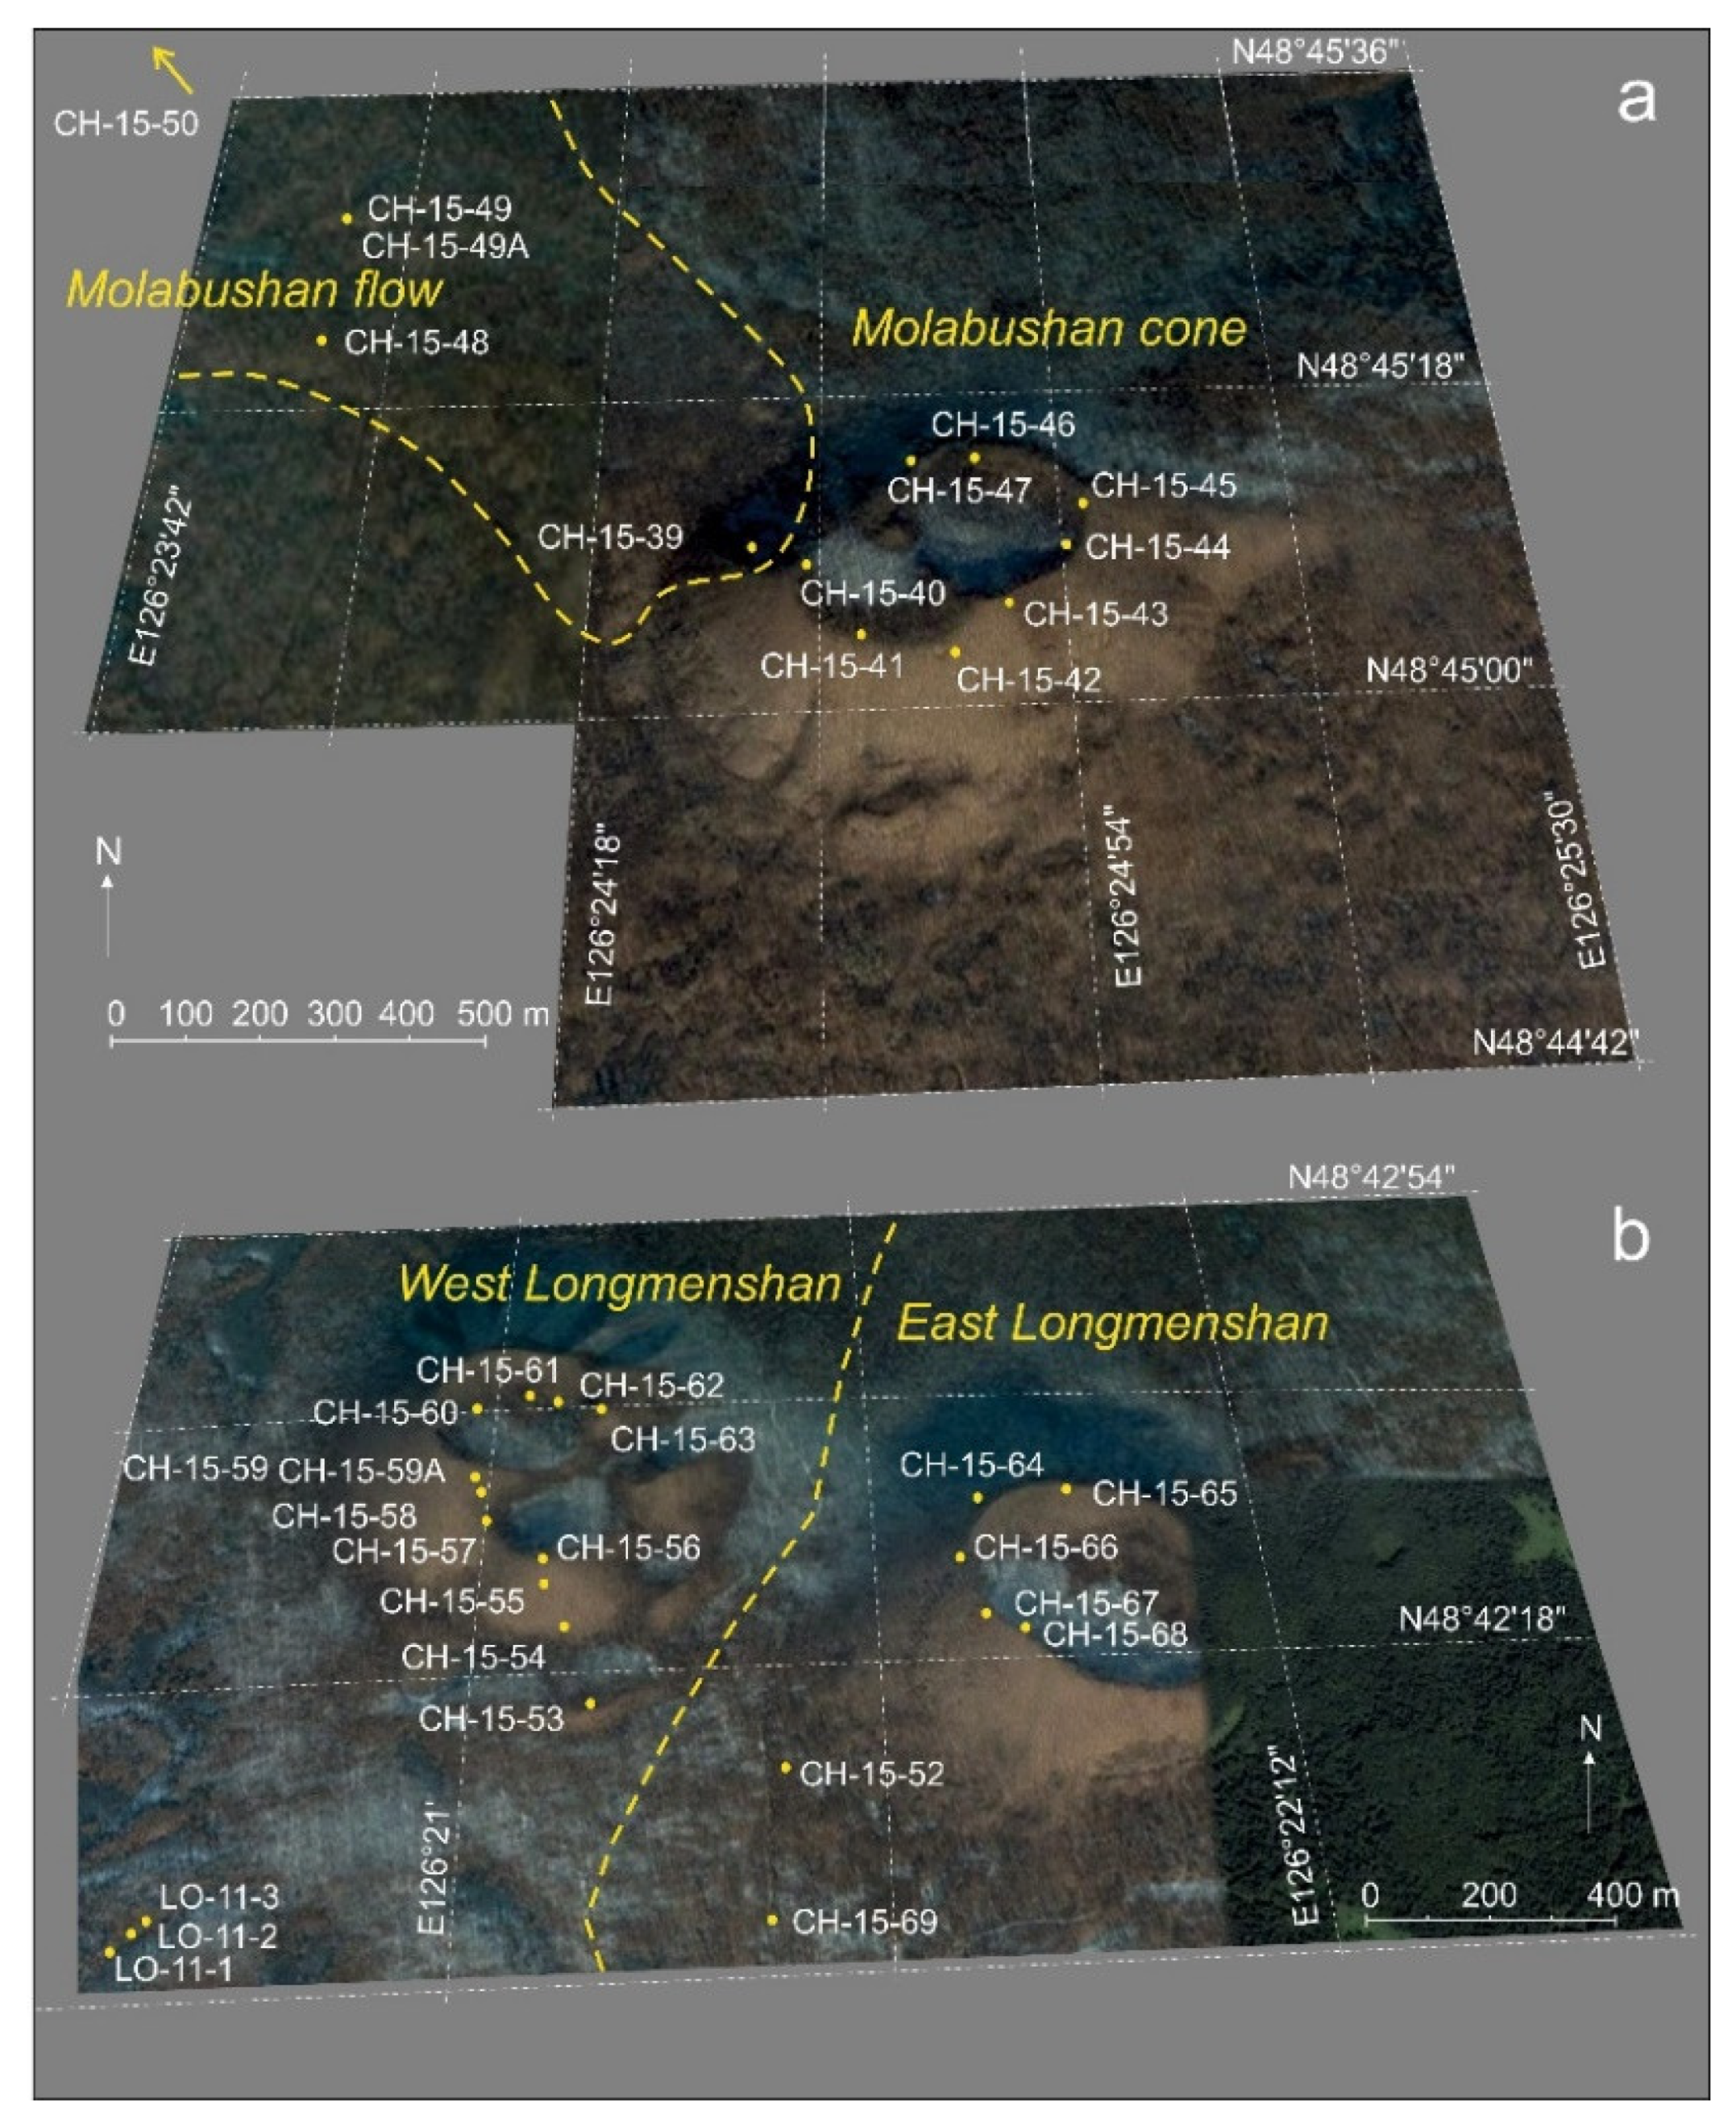
3.2. Sampling Strategy

From a detail sampling [30], volcanic units of cones and related lava flows in the Central group of volcanoes were distinguished in terms of MgO content. The most compositionally variable rocks of the latest eruptions in the Laoheishan volcano were divided into (1) basaltic trachyandesites and phonotephrites (MgO = 7.1–8.2 wt.%), (2) trachyandesites (MgO 5.3–6.3 wt.%), and (3) phonotephrites (MgO = 6.4–6.9 wt.%). The first group was sampled in pyroclastic material from the late volcanic cone and lavas from the northern bocca, the second group in pyroclastic material from the northwestern edge of the crater, and the third group in bombs from its southwestern edge. The first group was compared with moderate-Mg basaltic trachyandesites and phonotephrites from a cone of the Huoshaoshan volcano (MgO = 6.8–8.1 wt.%). The Central group of volcanoes was characterized with stepwise change of rock compositions from low-Mg rocks of the Wohushan volcano through low- and moderate-Mg rocks of the Bijiashan and Laoheishan volcanoes to moderate-Mg rocks of the Huoshaoshan cone. In contrast, rocks of background volcanoes were presented as a single low-Mg group of trachyandesites, tephriphonolites, and phonothephrites (MgO = 5.3–6.8 wt.%).
Taking into account the obtained wide compositional variation of rocks in the Central group of volcanoes, we have performed additional sampling of cones and lava flows in all background volcanoes, among which the Molabushan and Longmenshan revealed both low- and moderate-Mg rocks. Some background volcanoes (for instance, East Jiaodebushan and Xiaogushan) also show low- and moderate-Mg rock compositions, others (for instance, Weishan and West Jiaodebushan) present only low-Mg ones.
In the Molabushan and Longmenshan volcanoes, we sampled both edifices and spatially related to them lava flows (Figure 4a,b, Table S1). In the Molabushan volcano, we took four samples from a lava flow to the northwest and eight samples from a crater rim to identify low-Mg rocks in the former and moderate-Mg rocks in the latter. The cone samples represent porous slag, massive central parts of volcanic bombs, and fragments of lava flows preserved at the top of the crater rim. In the West Longmenshan volcano, we took three samples from a lava flow to the southwest and 11 samples from different fragments of the edifice composed of slag, volcanic bombs, agglutinates, and small bodies of massive rocks exposed due to explosions. All analyzed rocks were of the low-Mg group. Slags showed compositions similar to those of massive rocks. In the East Longmenshan volcano, we took five samples from a crater rim and two samples from a lava flow near the base of a volcanic cone. All these samples were of the moderate-Mg group. For comparison, we picked up trachyandesites in the Laoshantou flow (seven samples) and basaltic trachyandesites in the Old Gelaqiushan flow (five samples) that are representative for the low-Mg group of volcanic rocks.

4. Results

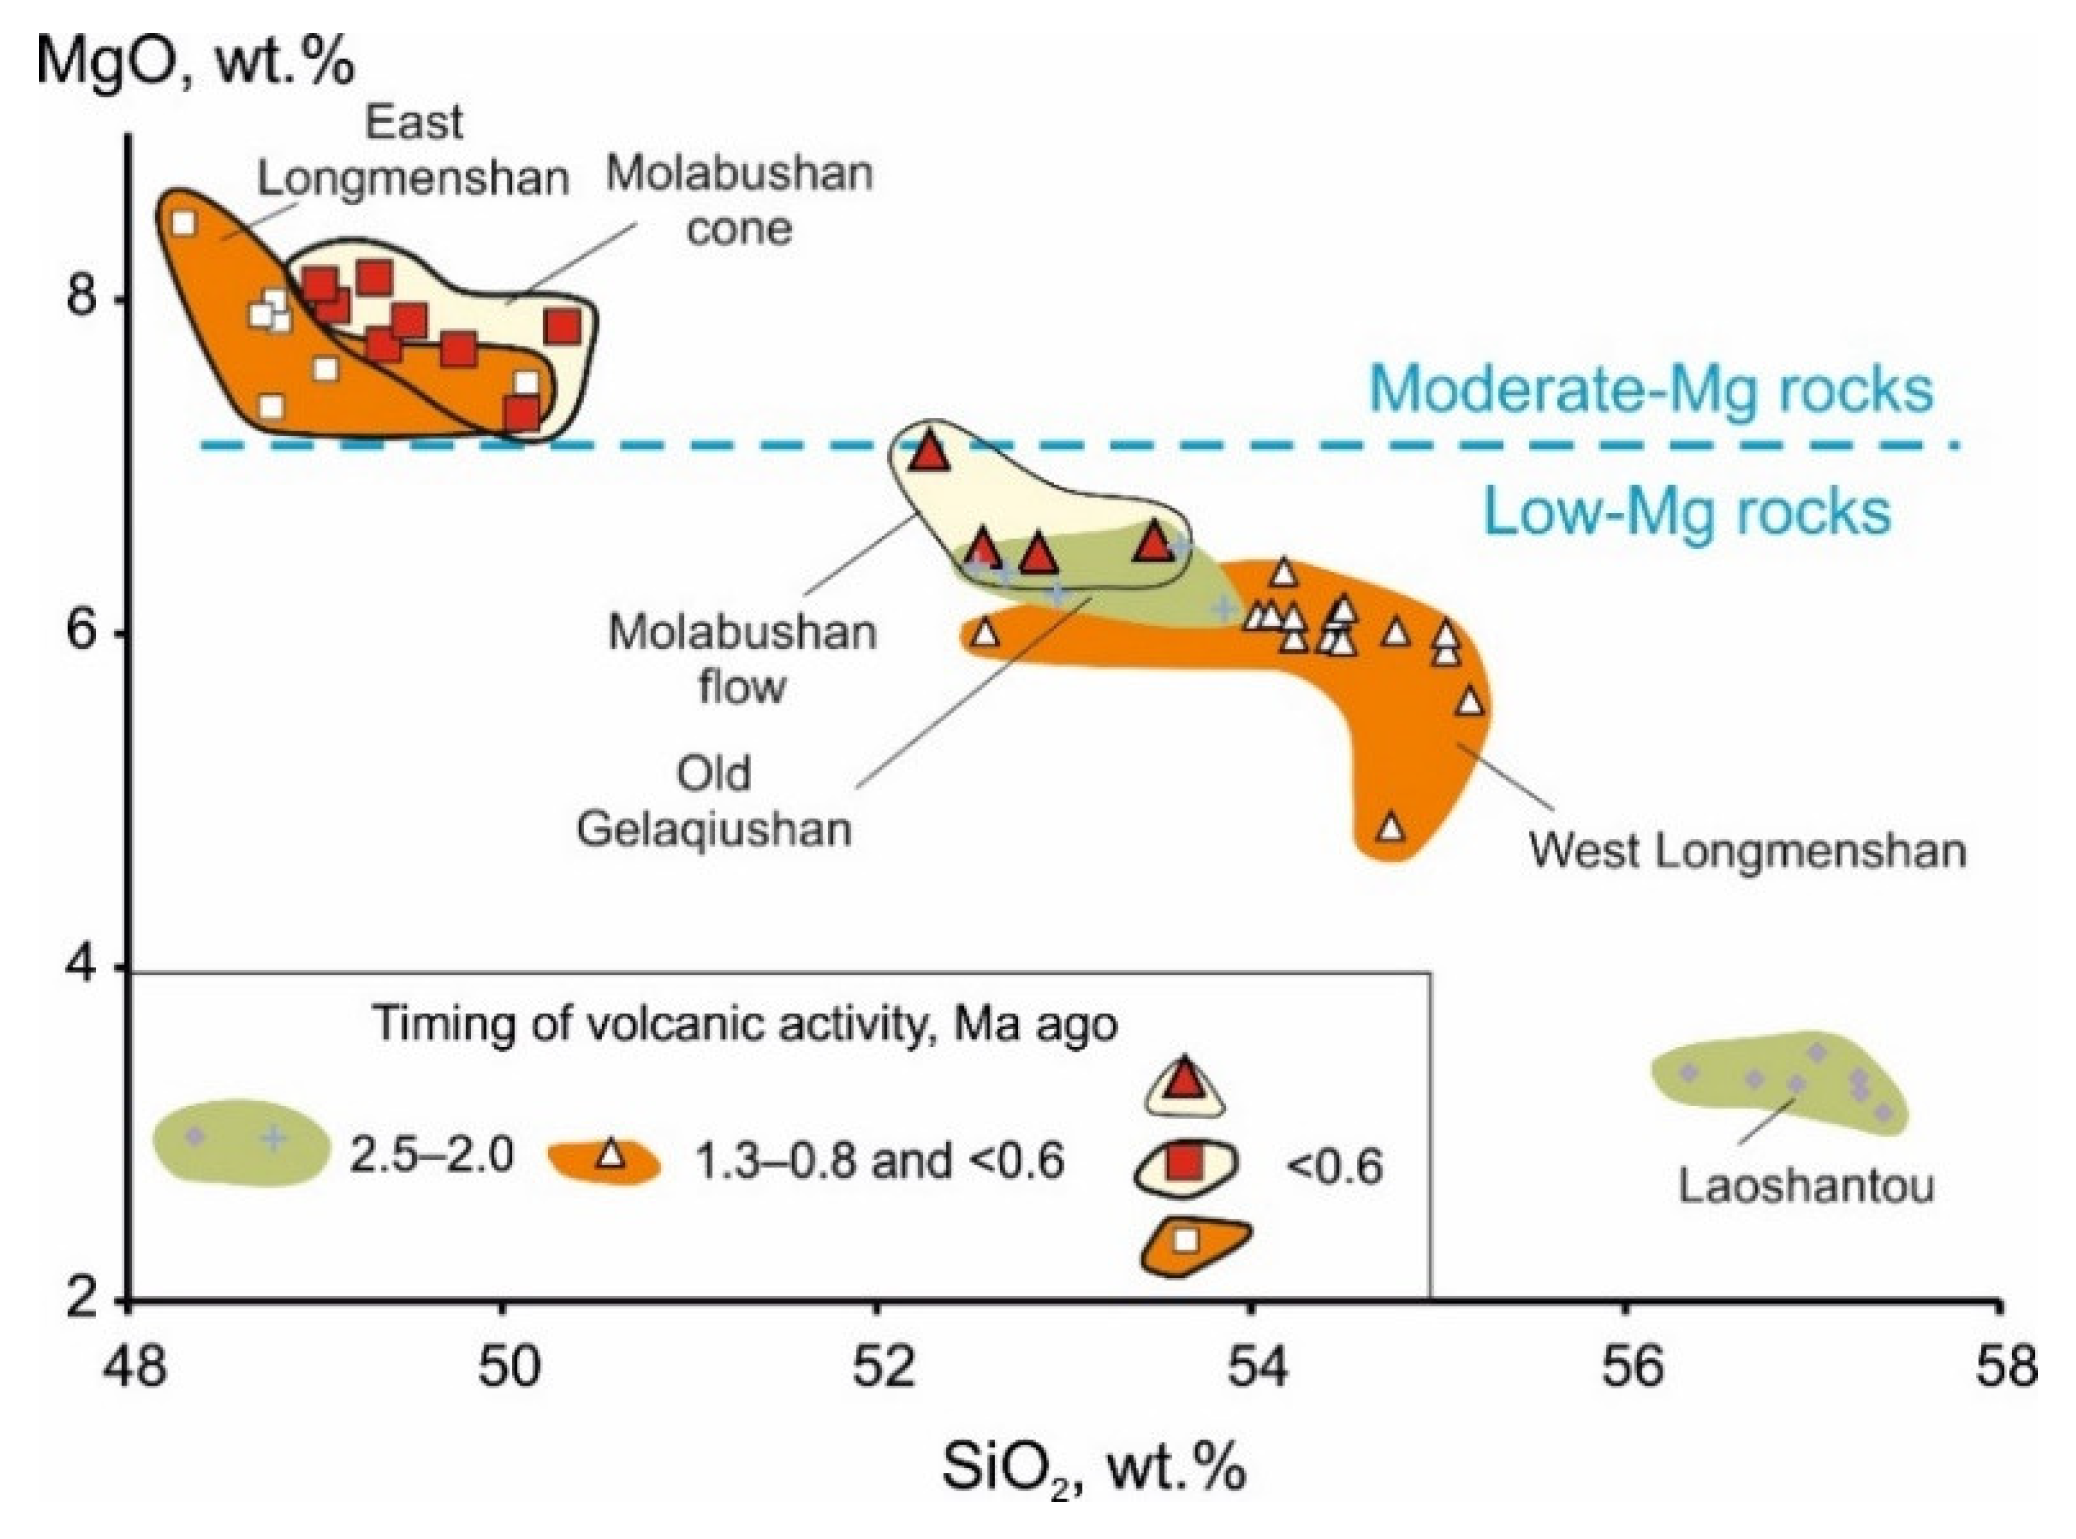
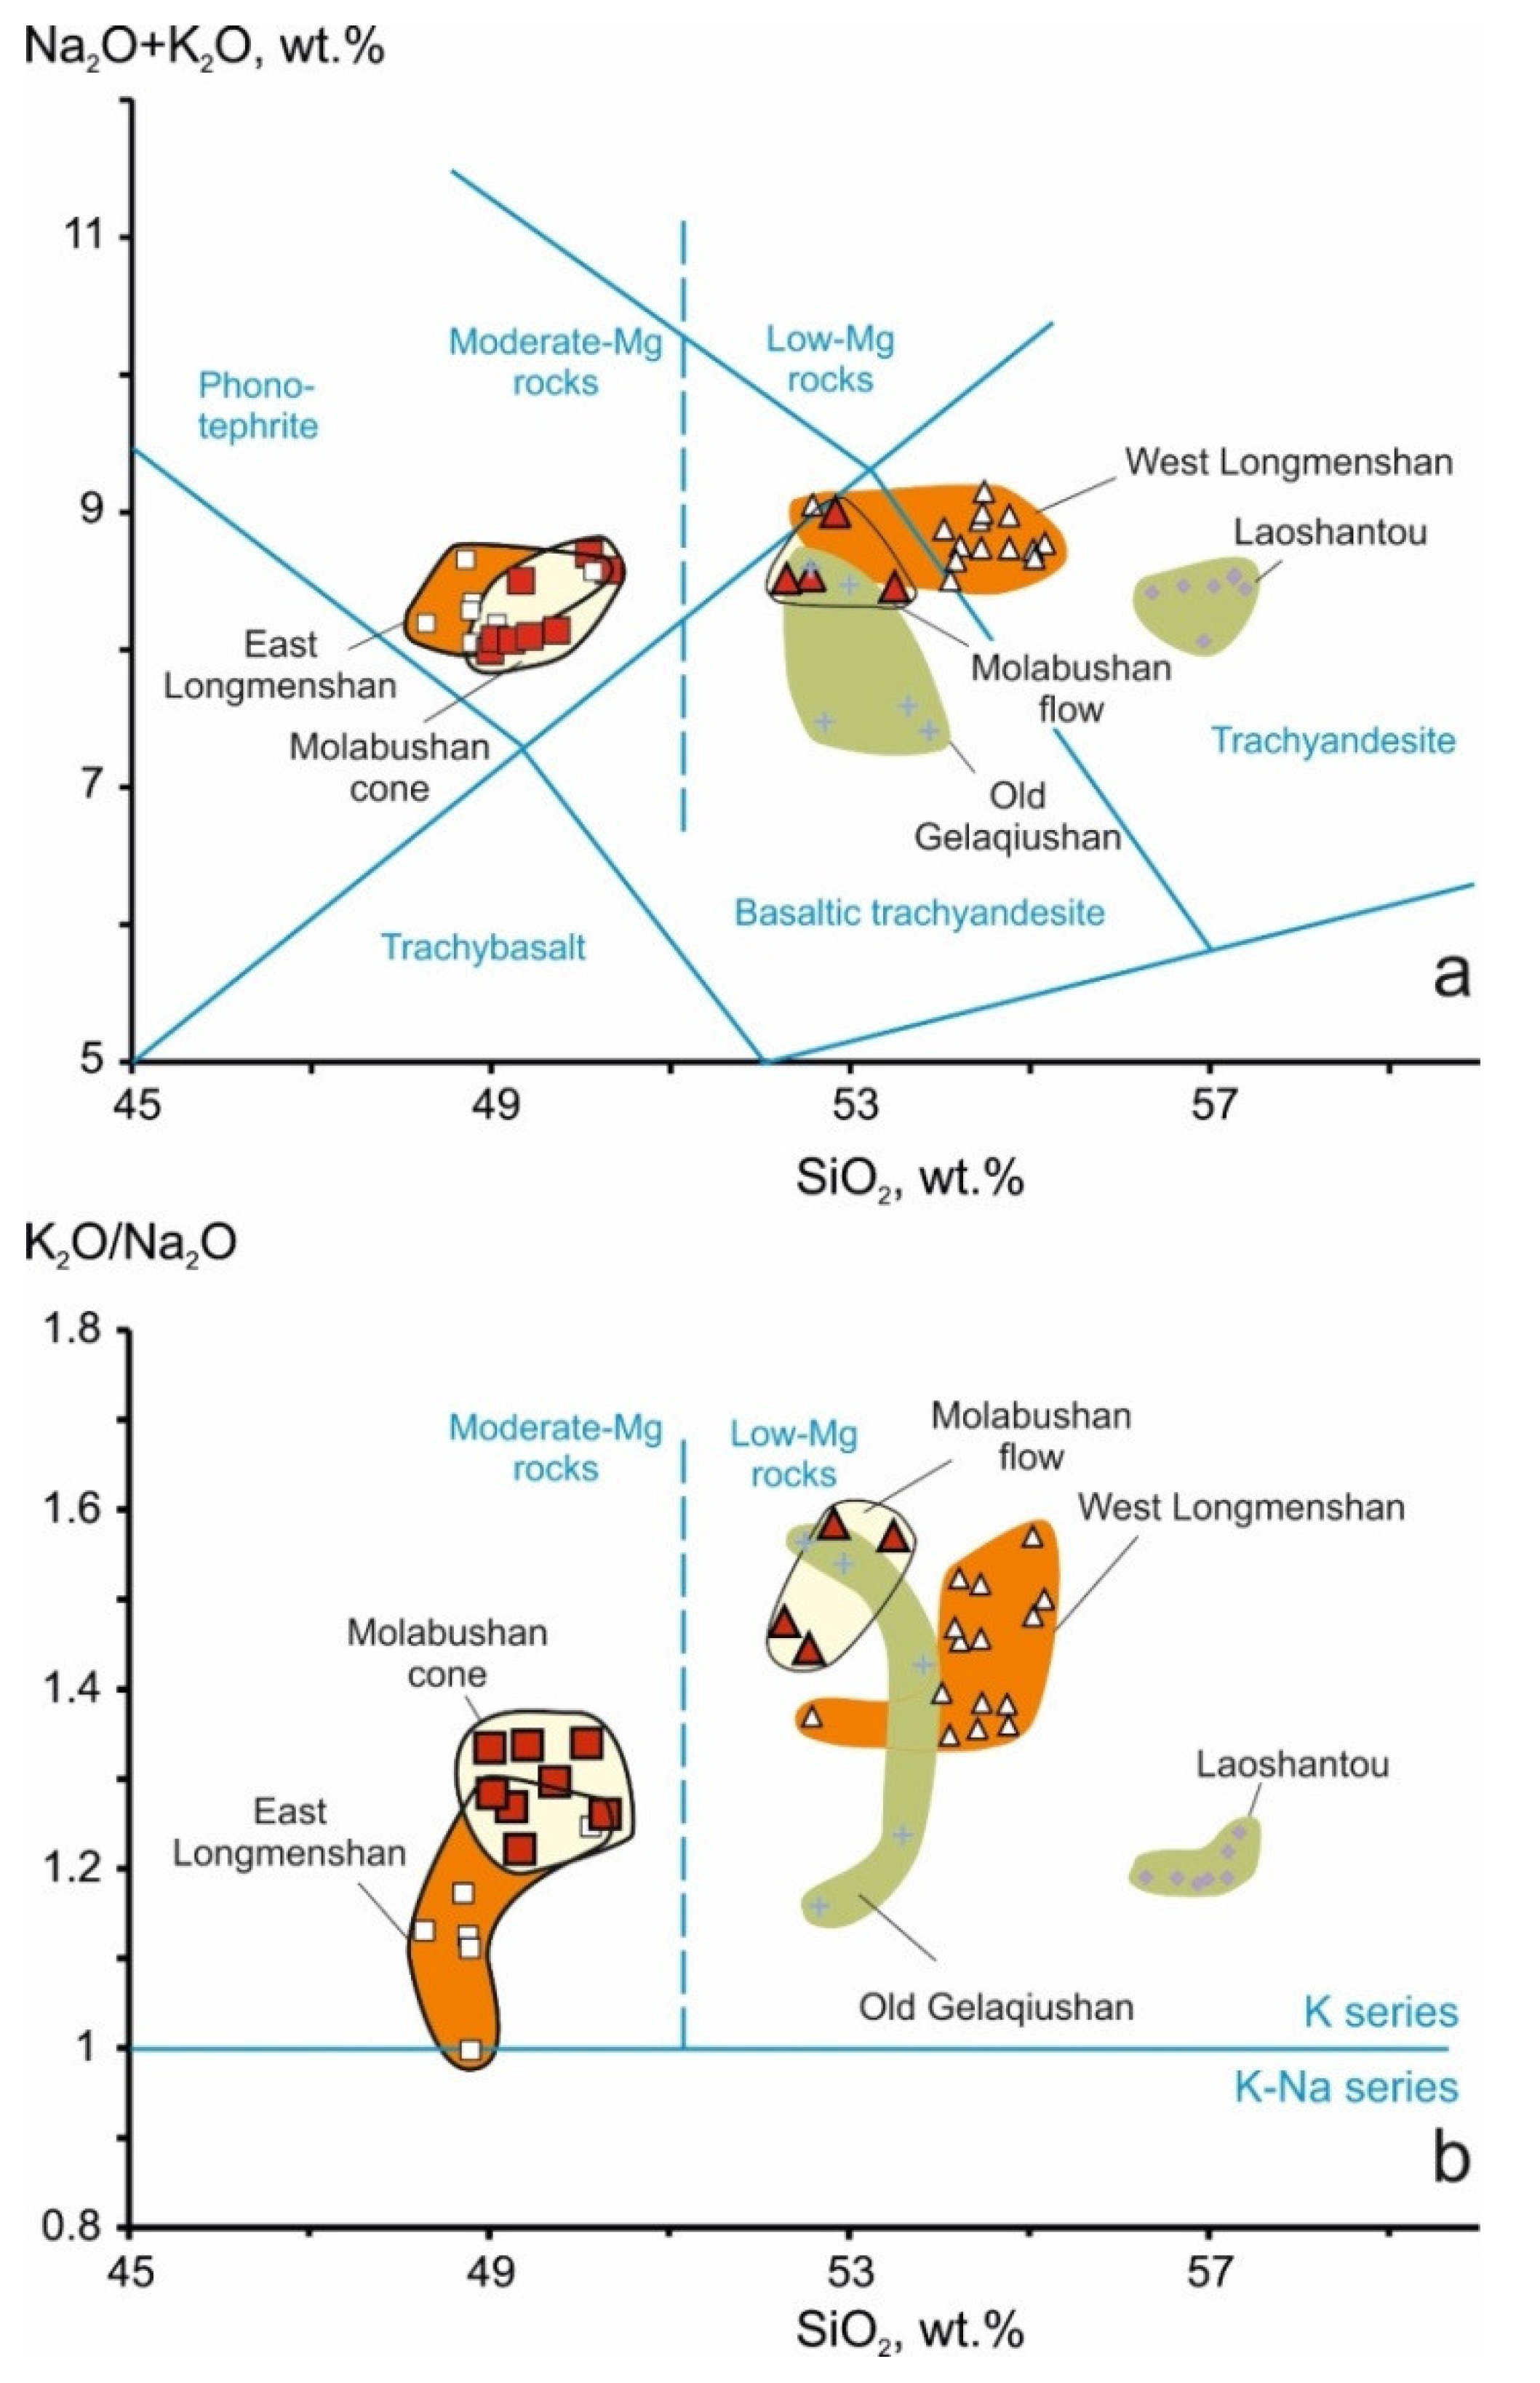
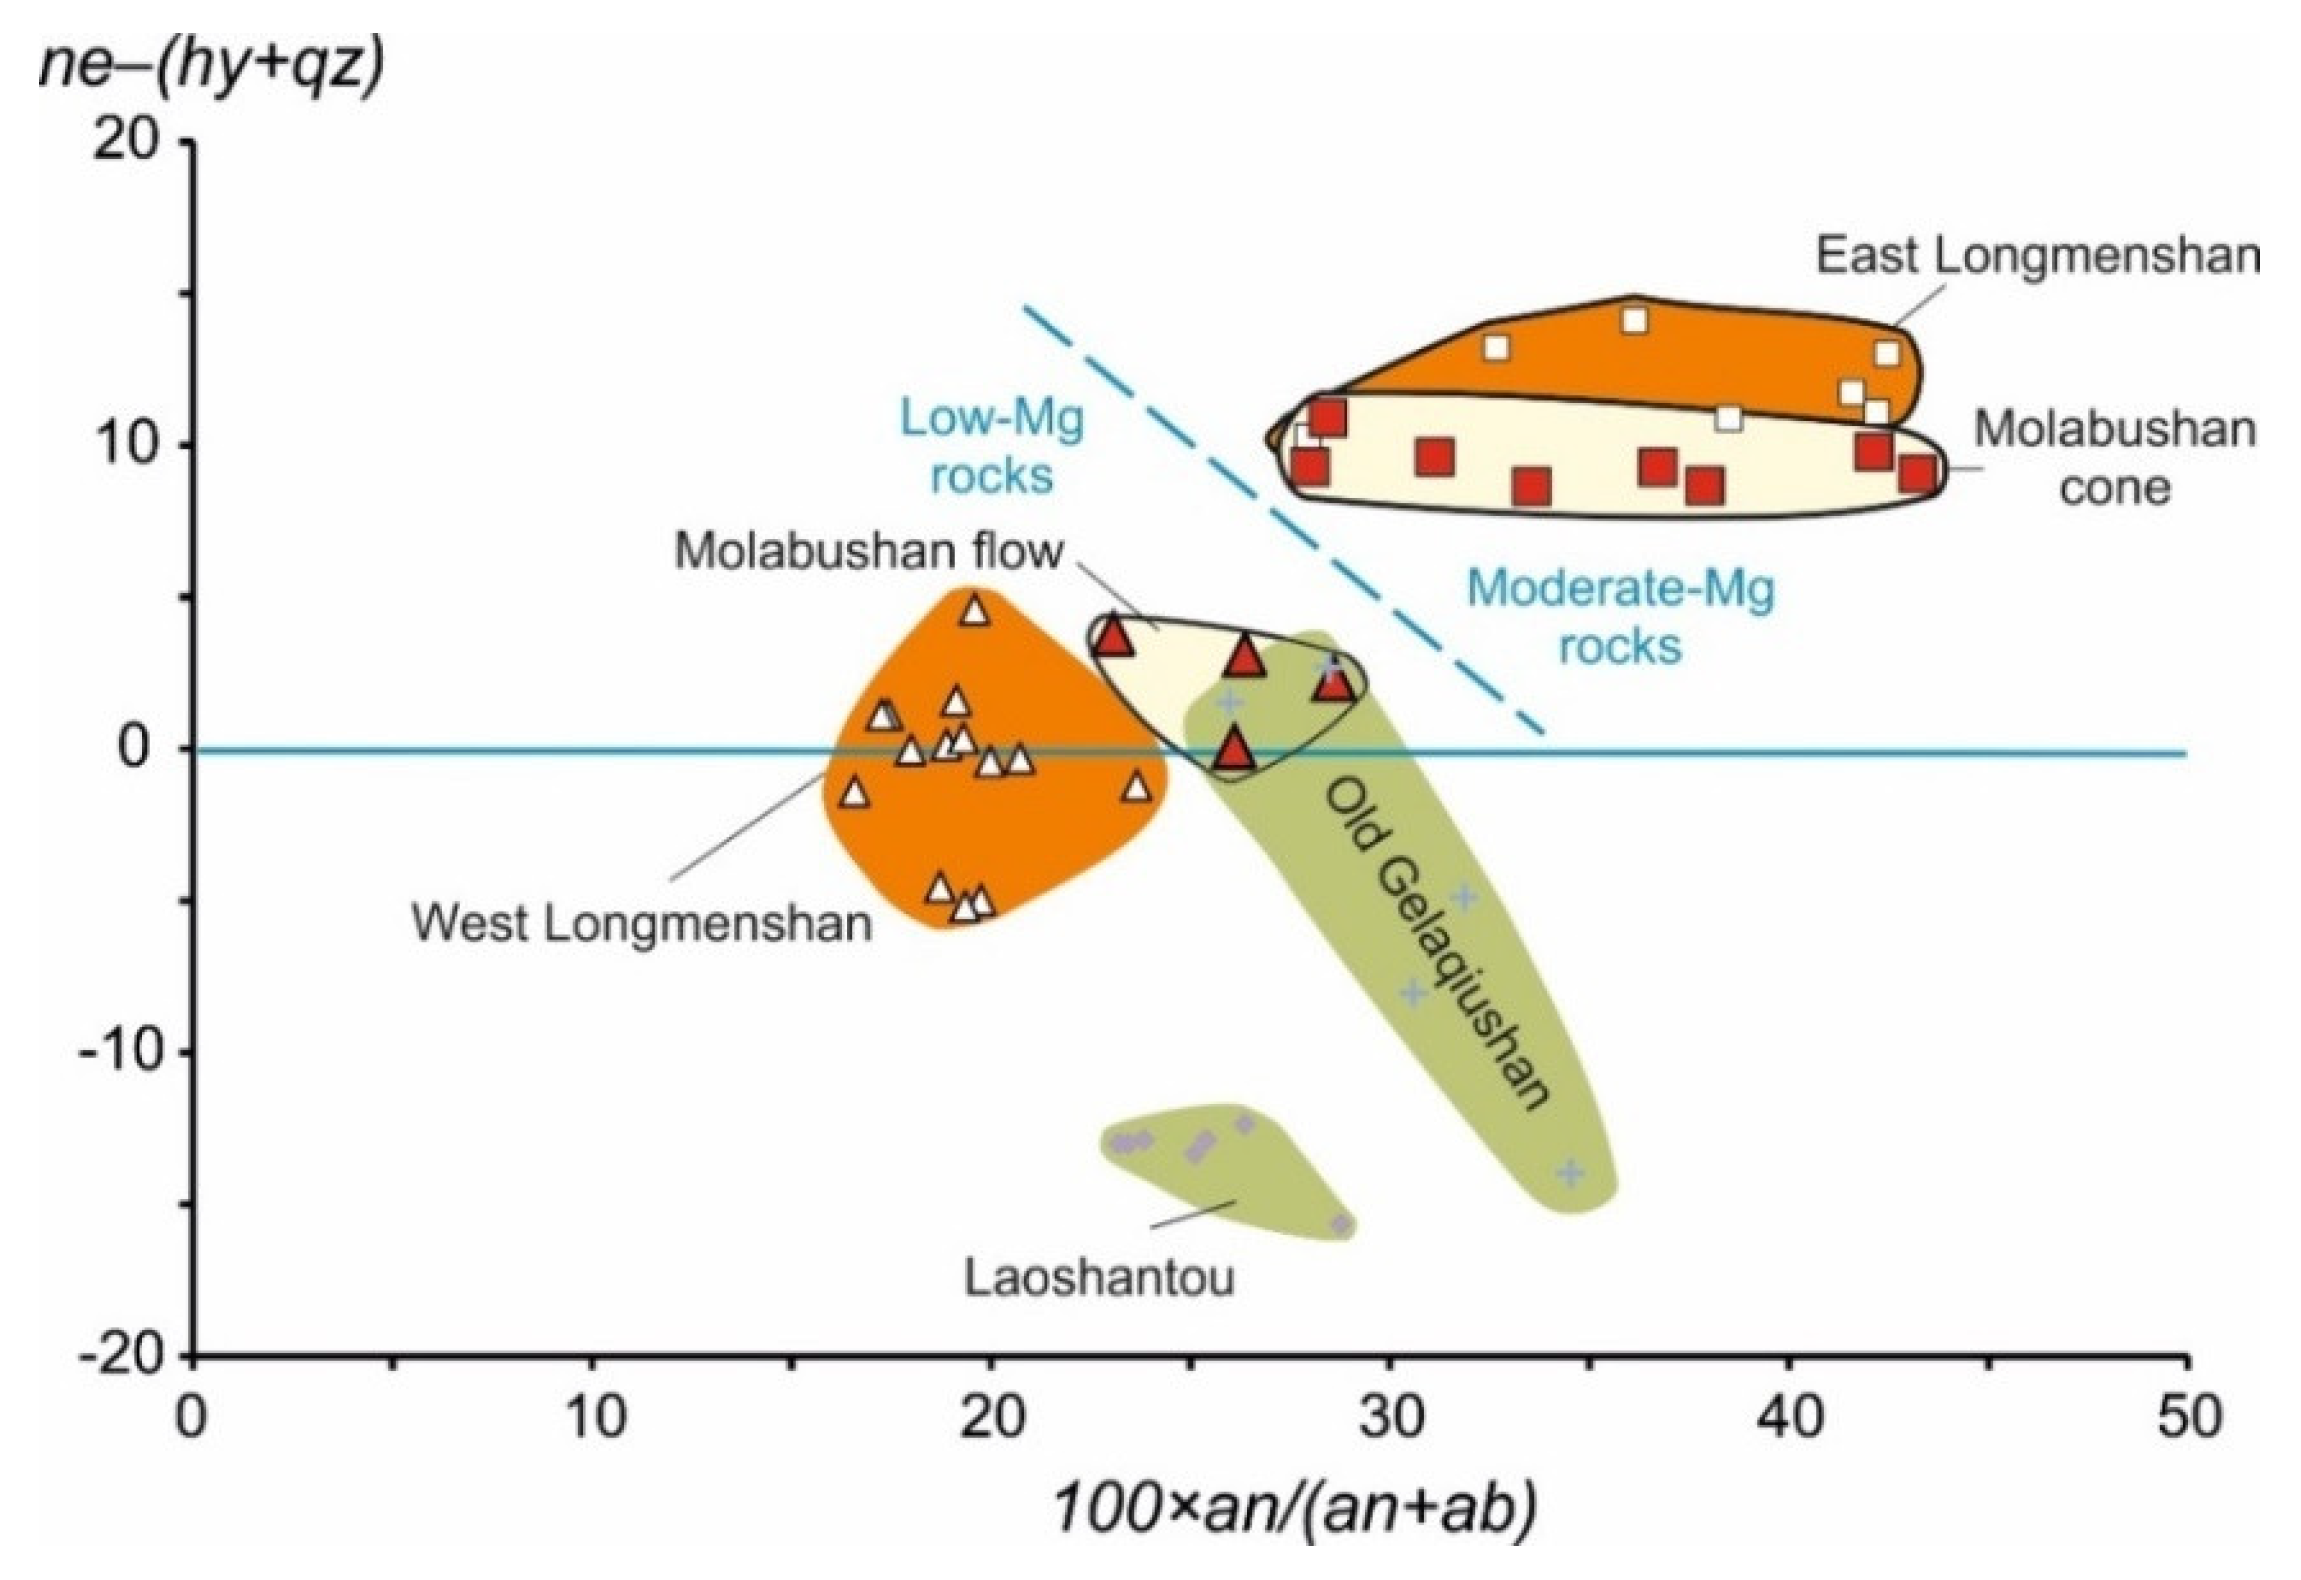
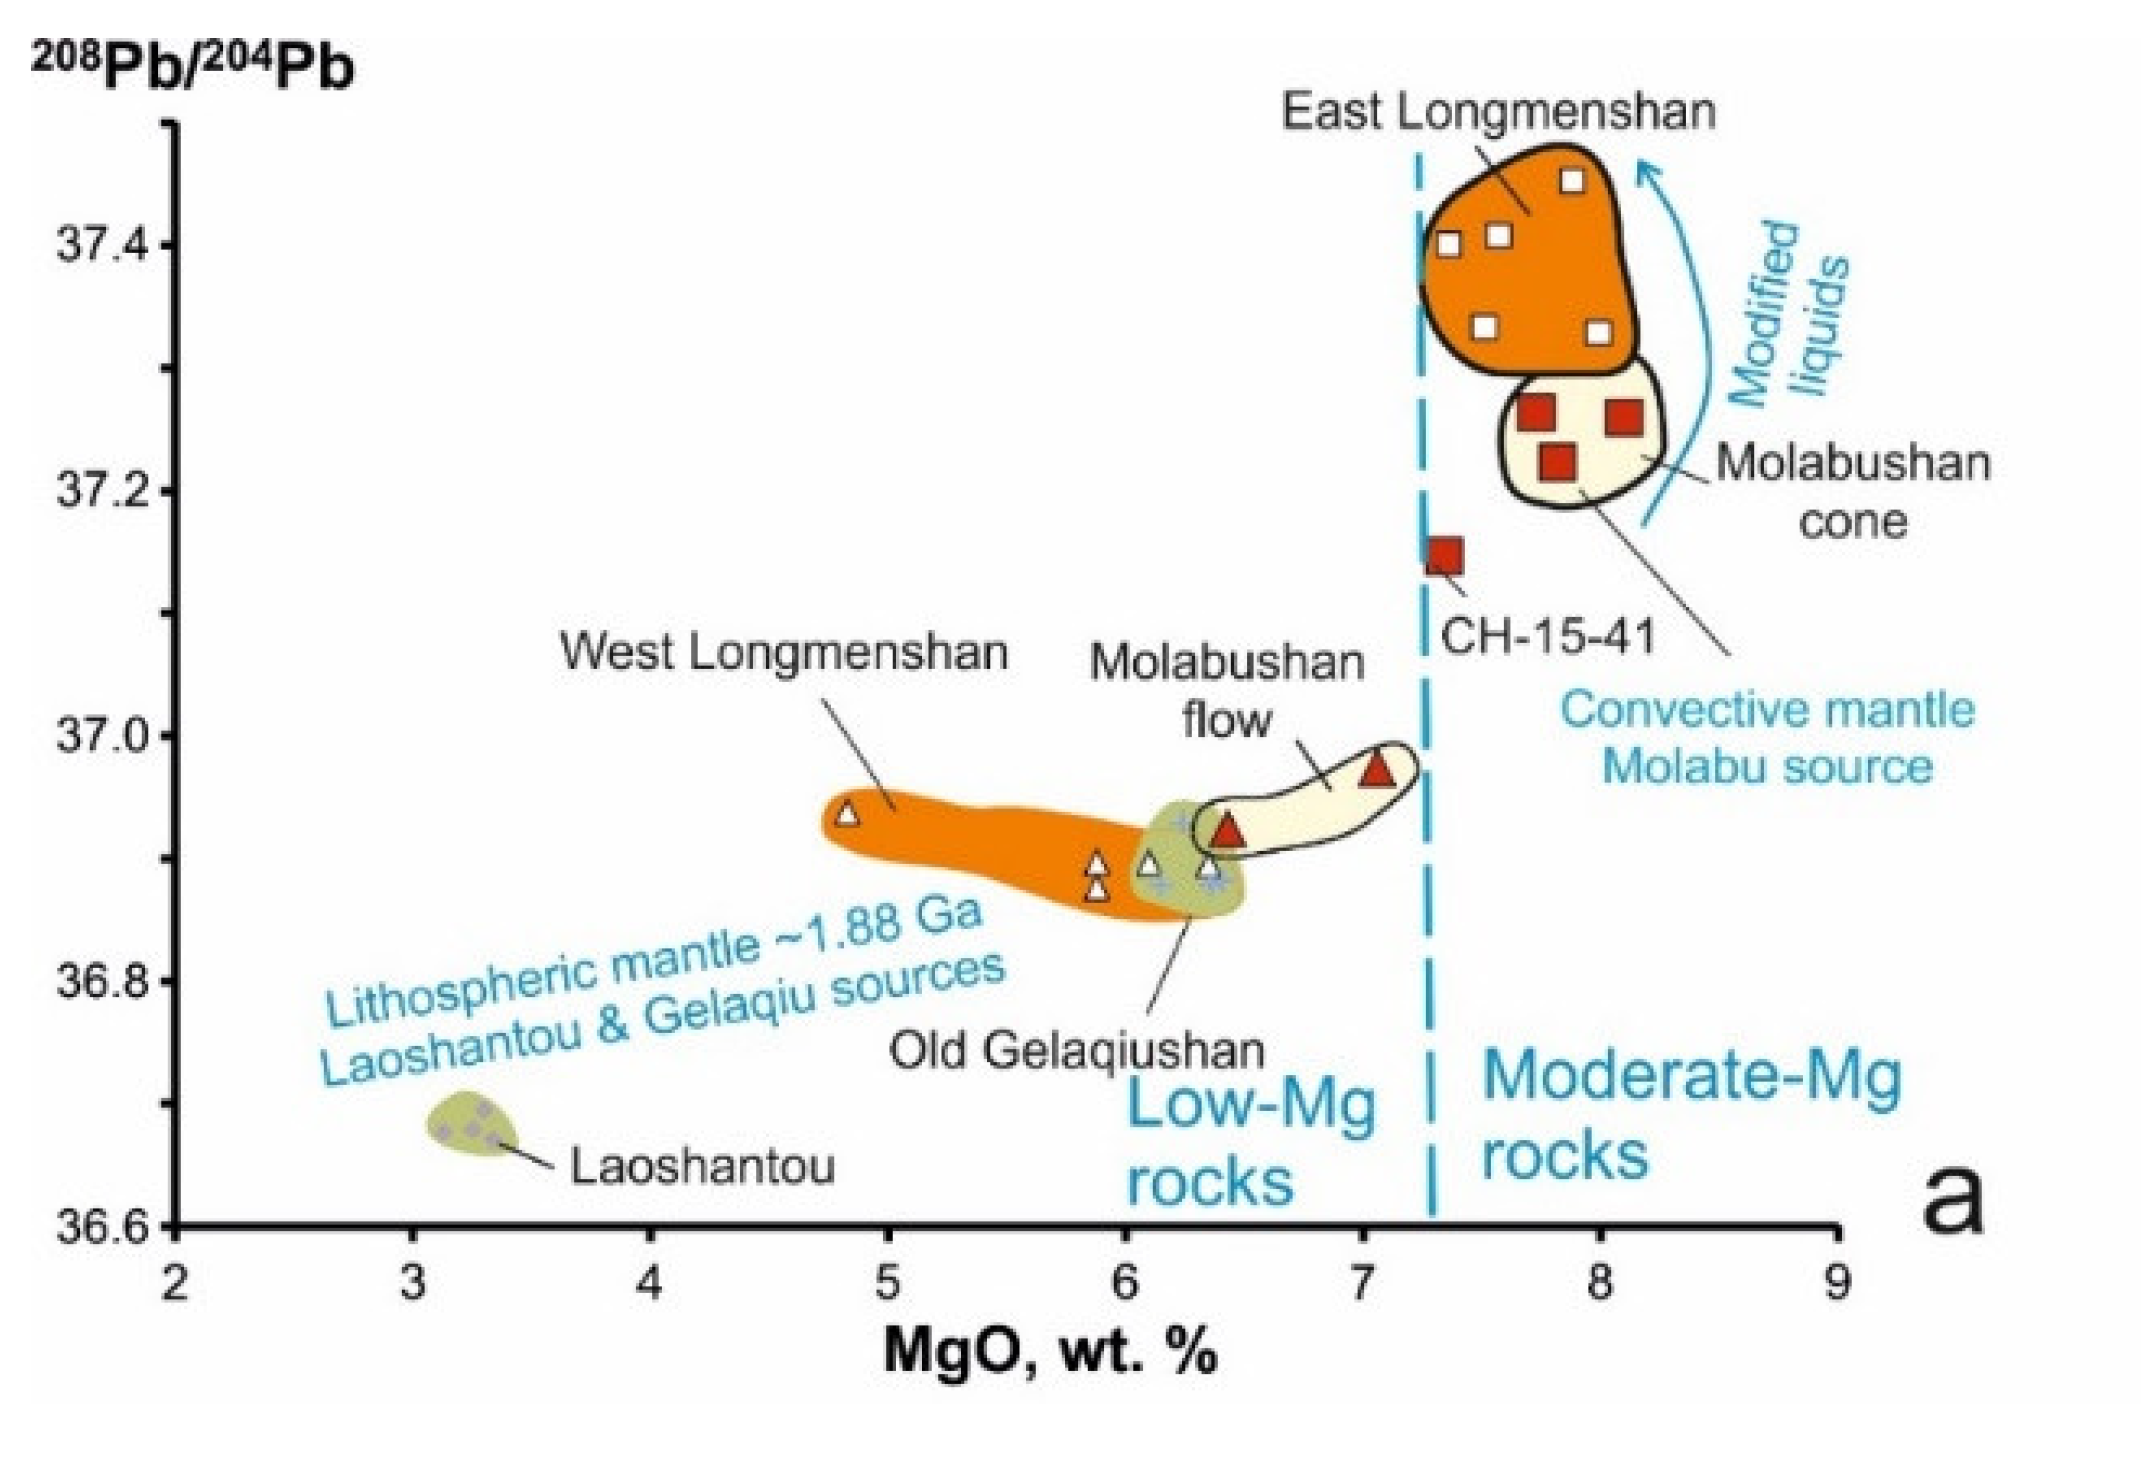
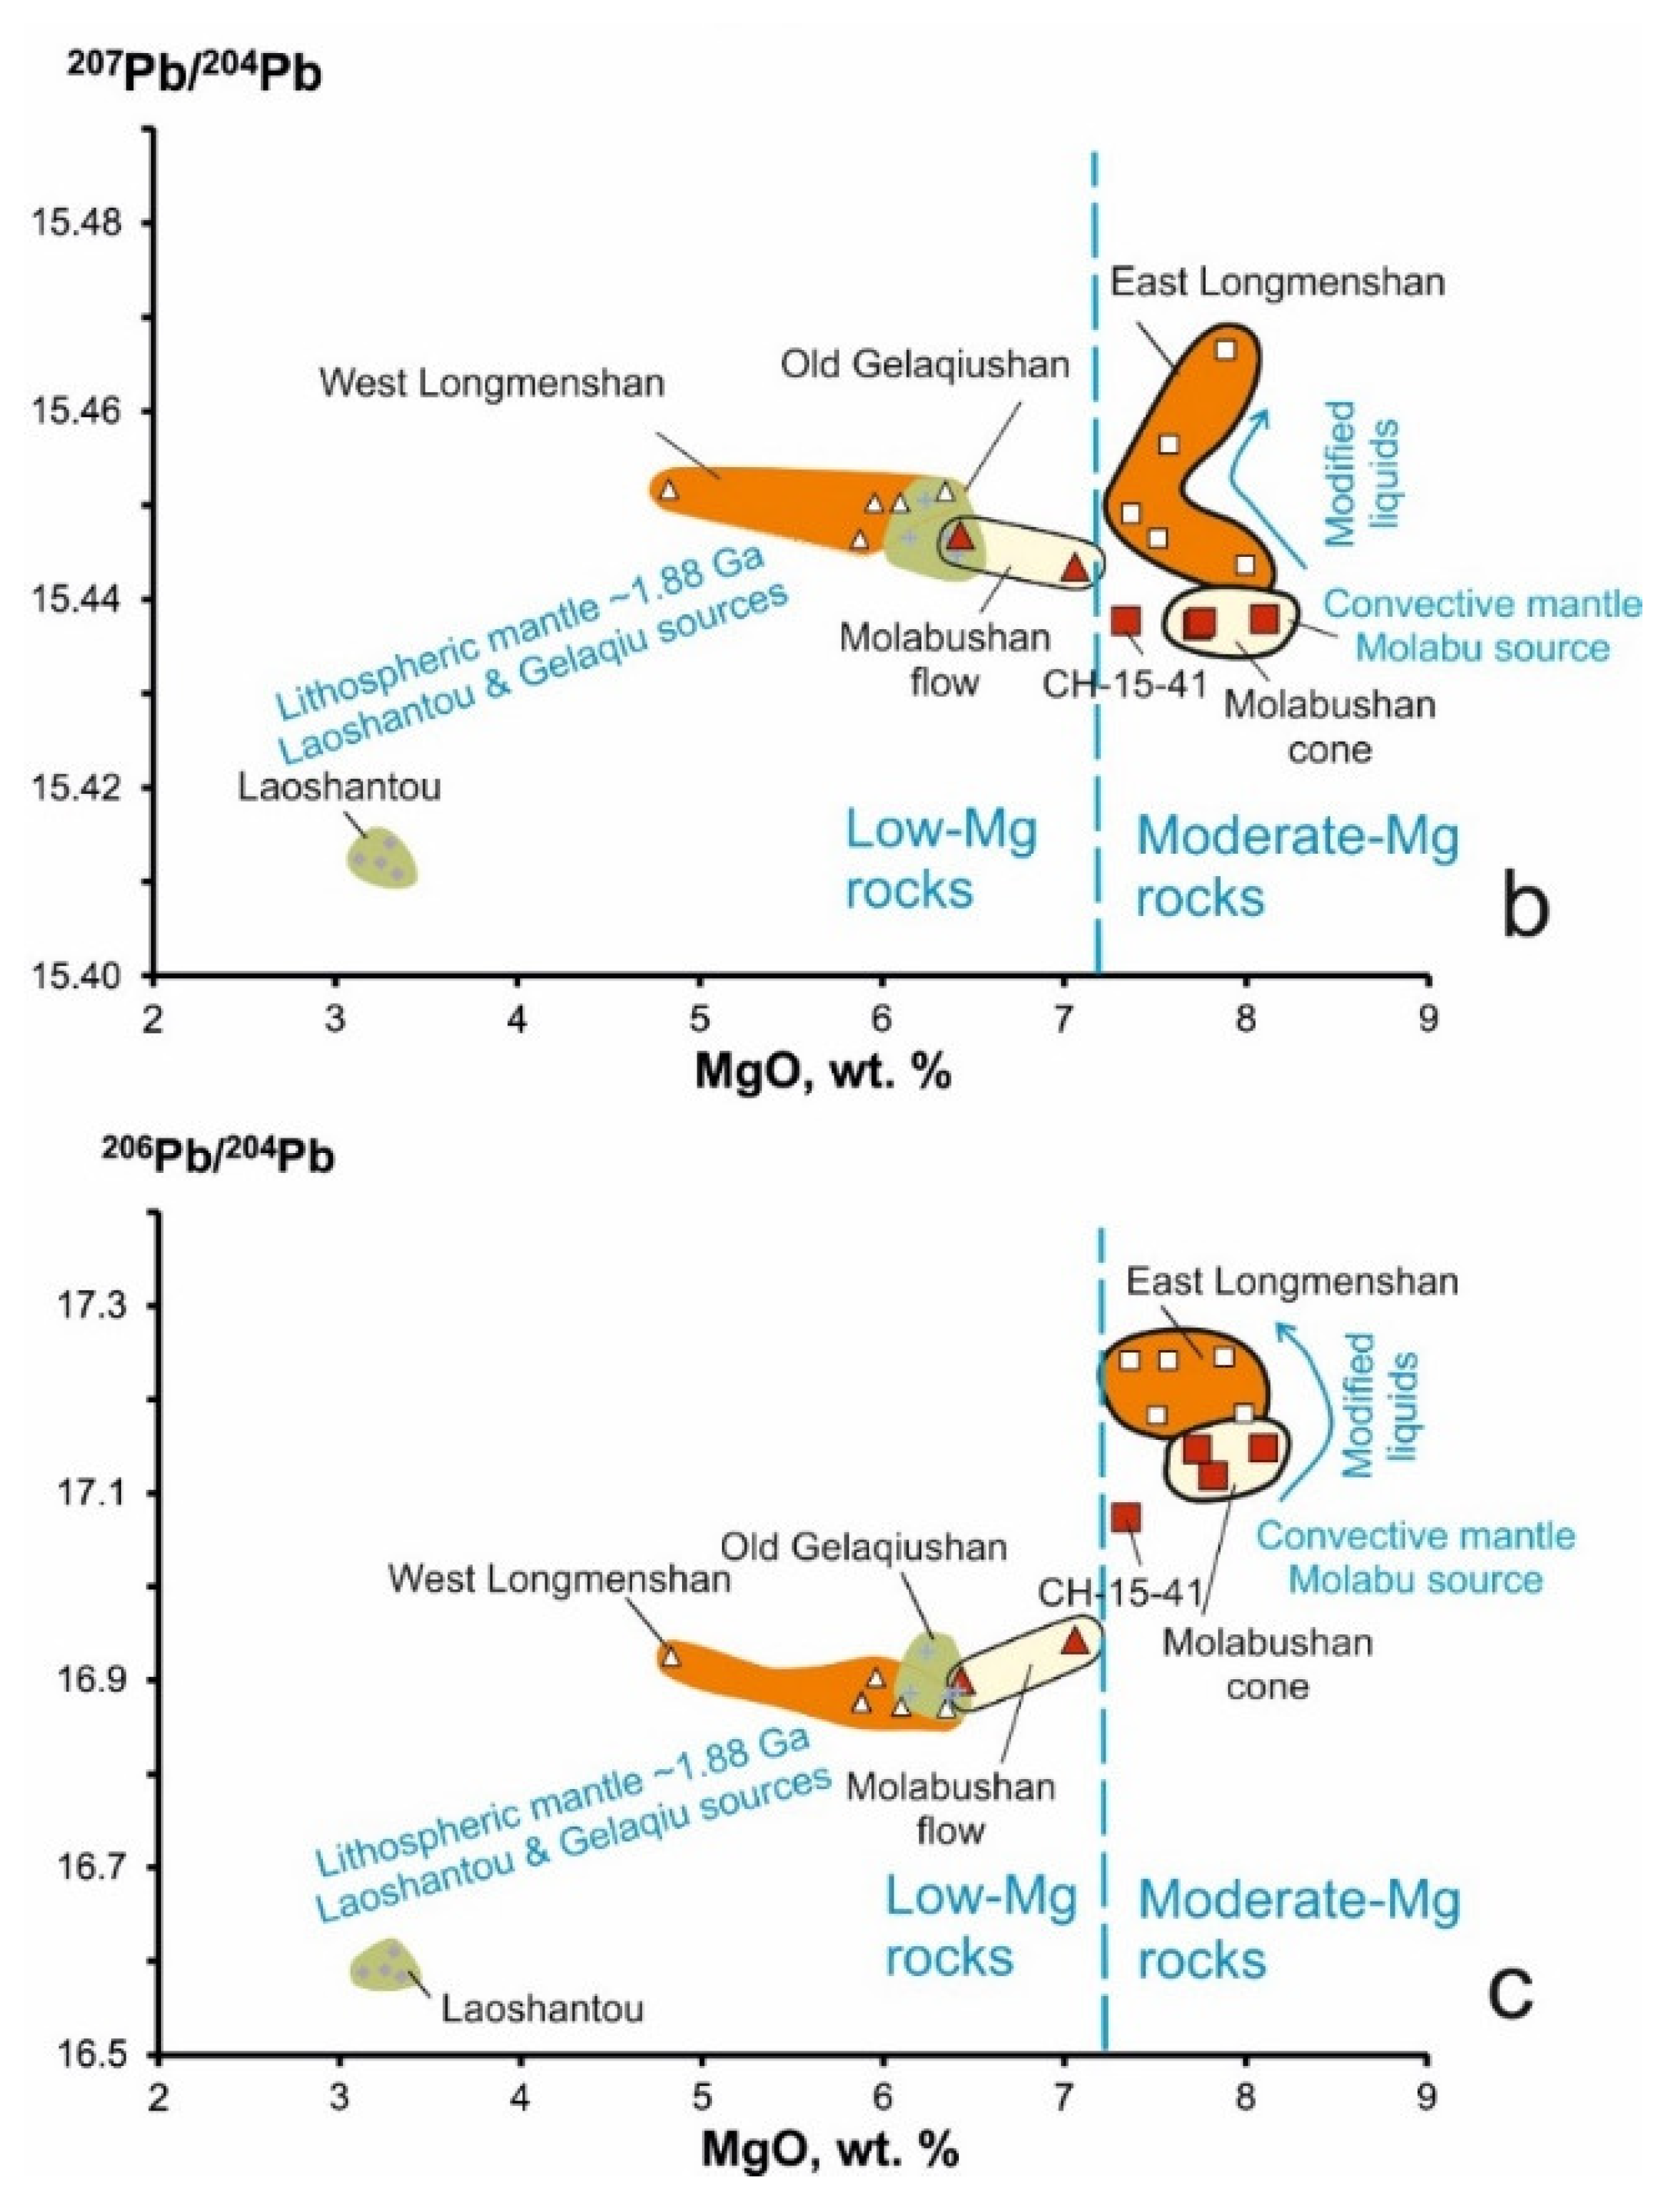
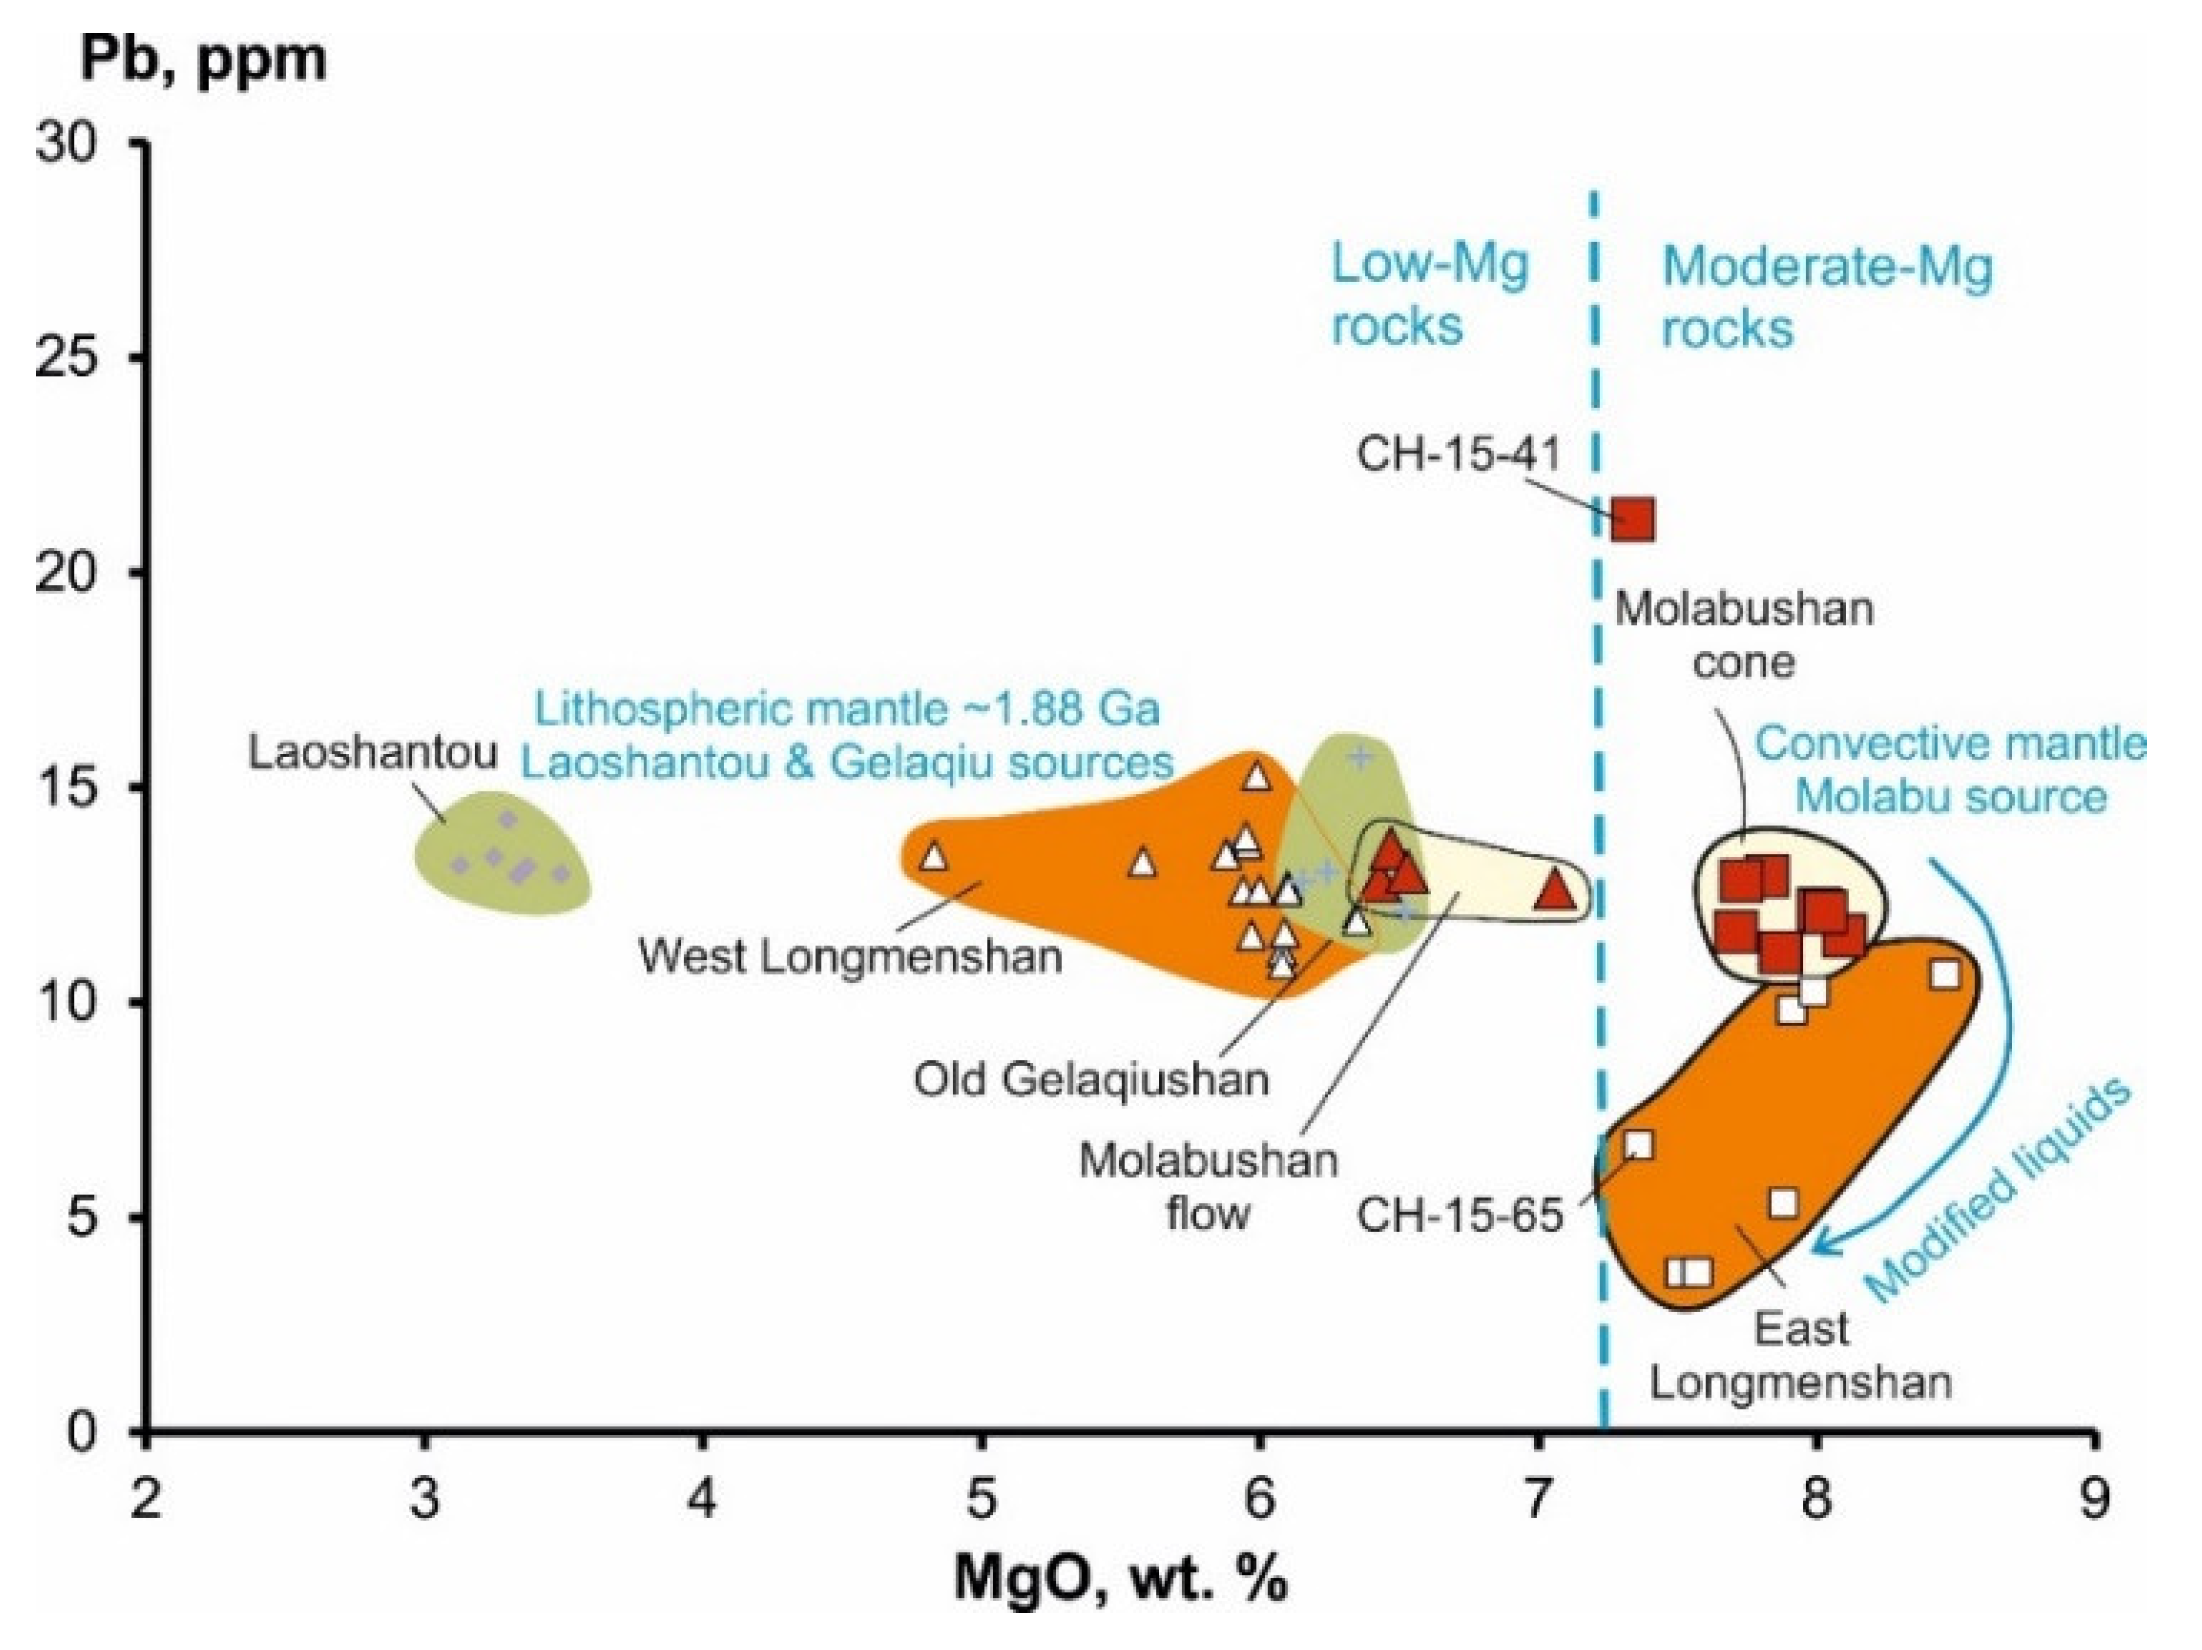
4.1. Low- and Moderate-Mg Volcanic Units

The low- and moderate-Mg volcanic units are identified on the diagrams of MgO versus SiO2, Na2O + K2O versus SiO2, and K2O/Na2O versus SiO2 (Figure 5 and Figure 6). The former units are of trachyandesite and basaltic trachyandesite compositions with MgO contents of 4.8–7.0 wt.% and SiO2 contents of 52–55 wt.%. The latter showed phonotephrite compositions with elevated MgO contents of 7.3–8.5 wt.% and lower SiO2 contents of 48–51 wt.%. Trachyandesite of Laoshantou flow had MgO contents as low as 3.1–3.5 wt.% and SiO2 contents as high as 56.0–56.9 wt.% (Table 2, Table S1). Moderate-Mg rocks and Laoshantou trachyandesite had relatively low K2O/Na2O ratios, while low-Mg rocks presented elevated values.
Moderate-Mg lavas erupted in the last 0.6 Ma. The compositional contrast between the Laoshantou trachyandesite and moderate-Mg rocks from the Molabushan and Longmenshan volcanos is clearly observed in the diagram of CIPW normative minerals (Figure 7). The older Laoshantou trachyandesite is silica-saturated (i.e., it contains normative hypersthene and quartz), the younger moderate-Mg rocks are strongly silica-undersaturated (i.e., they show 9–14 % of normative nepheline with elevated contents of normative anorthite).

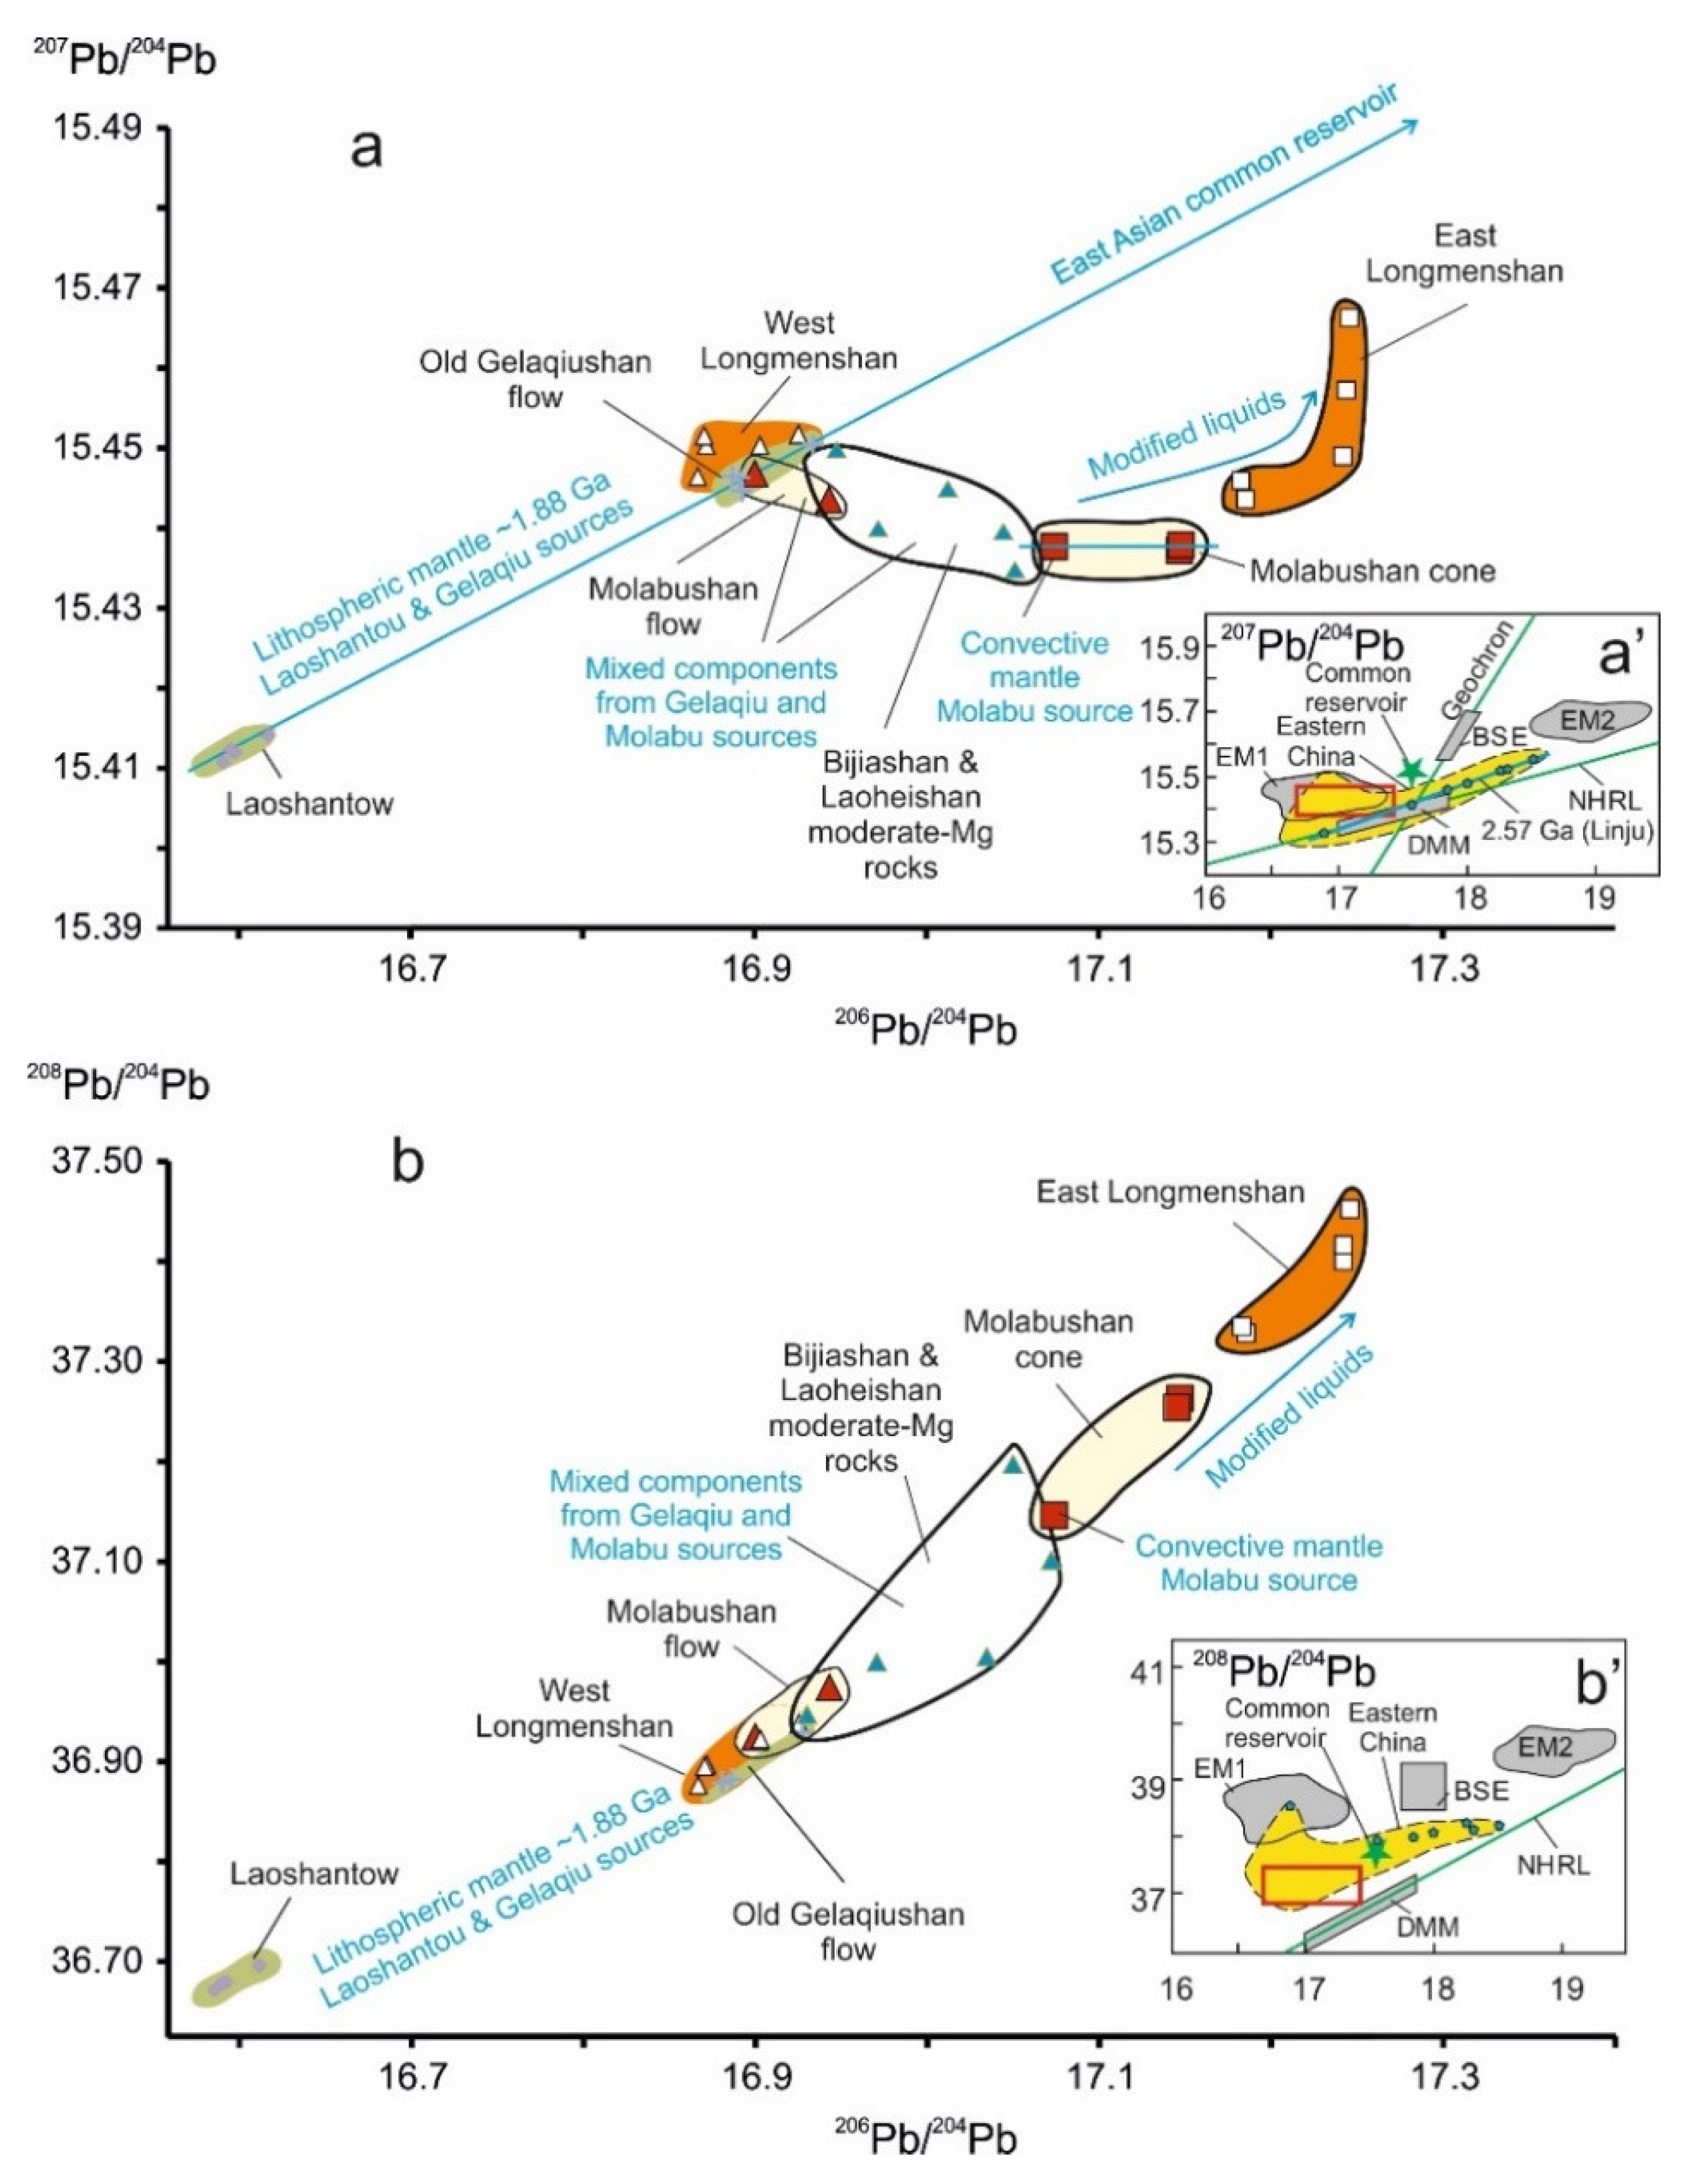
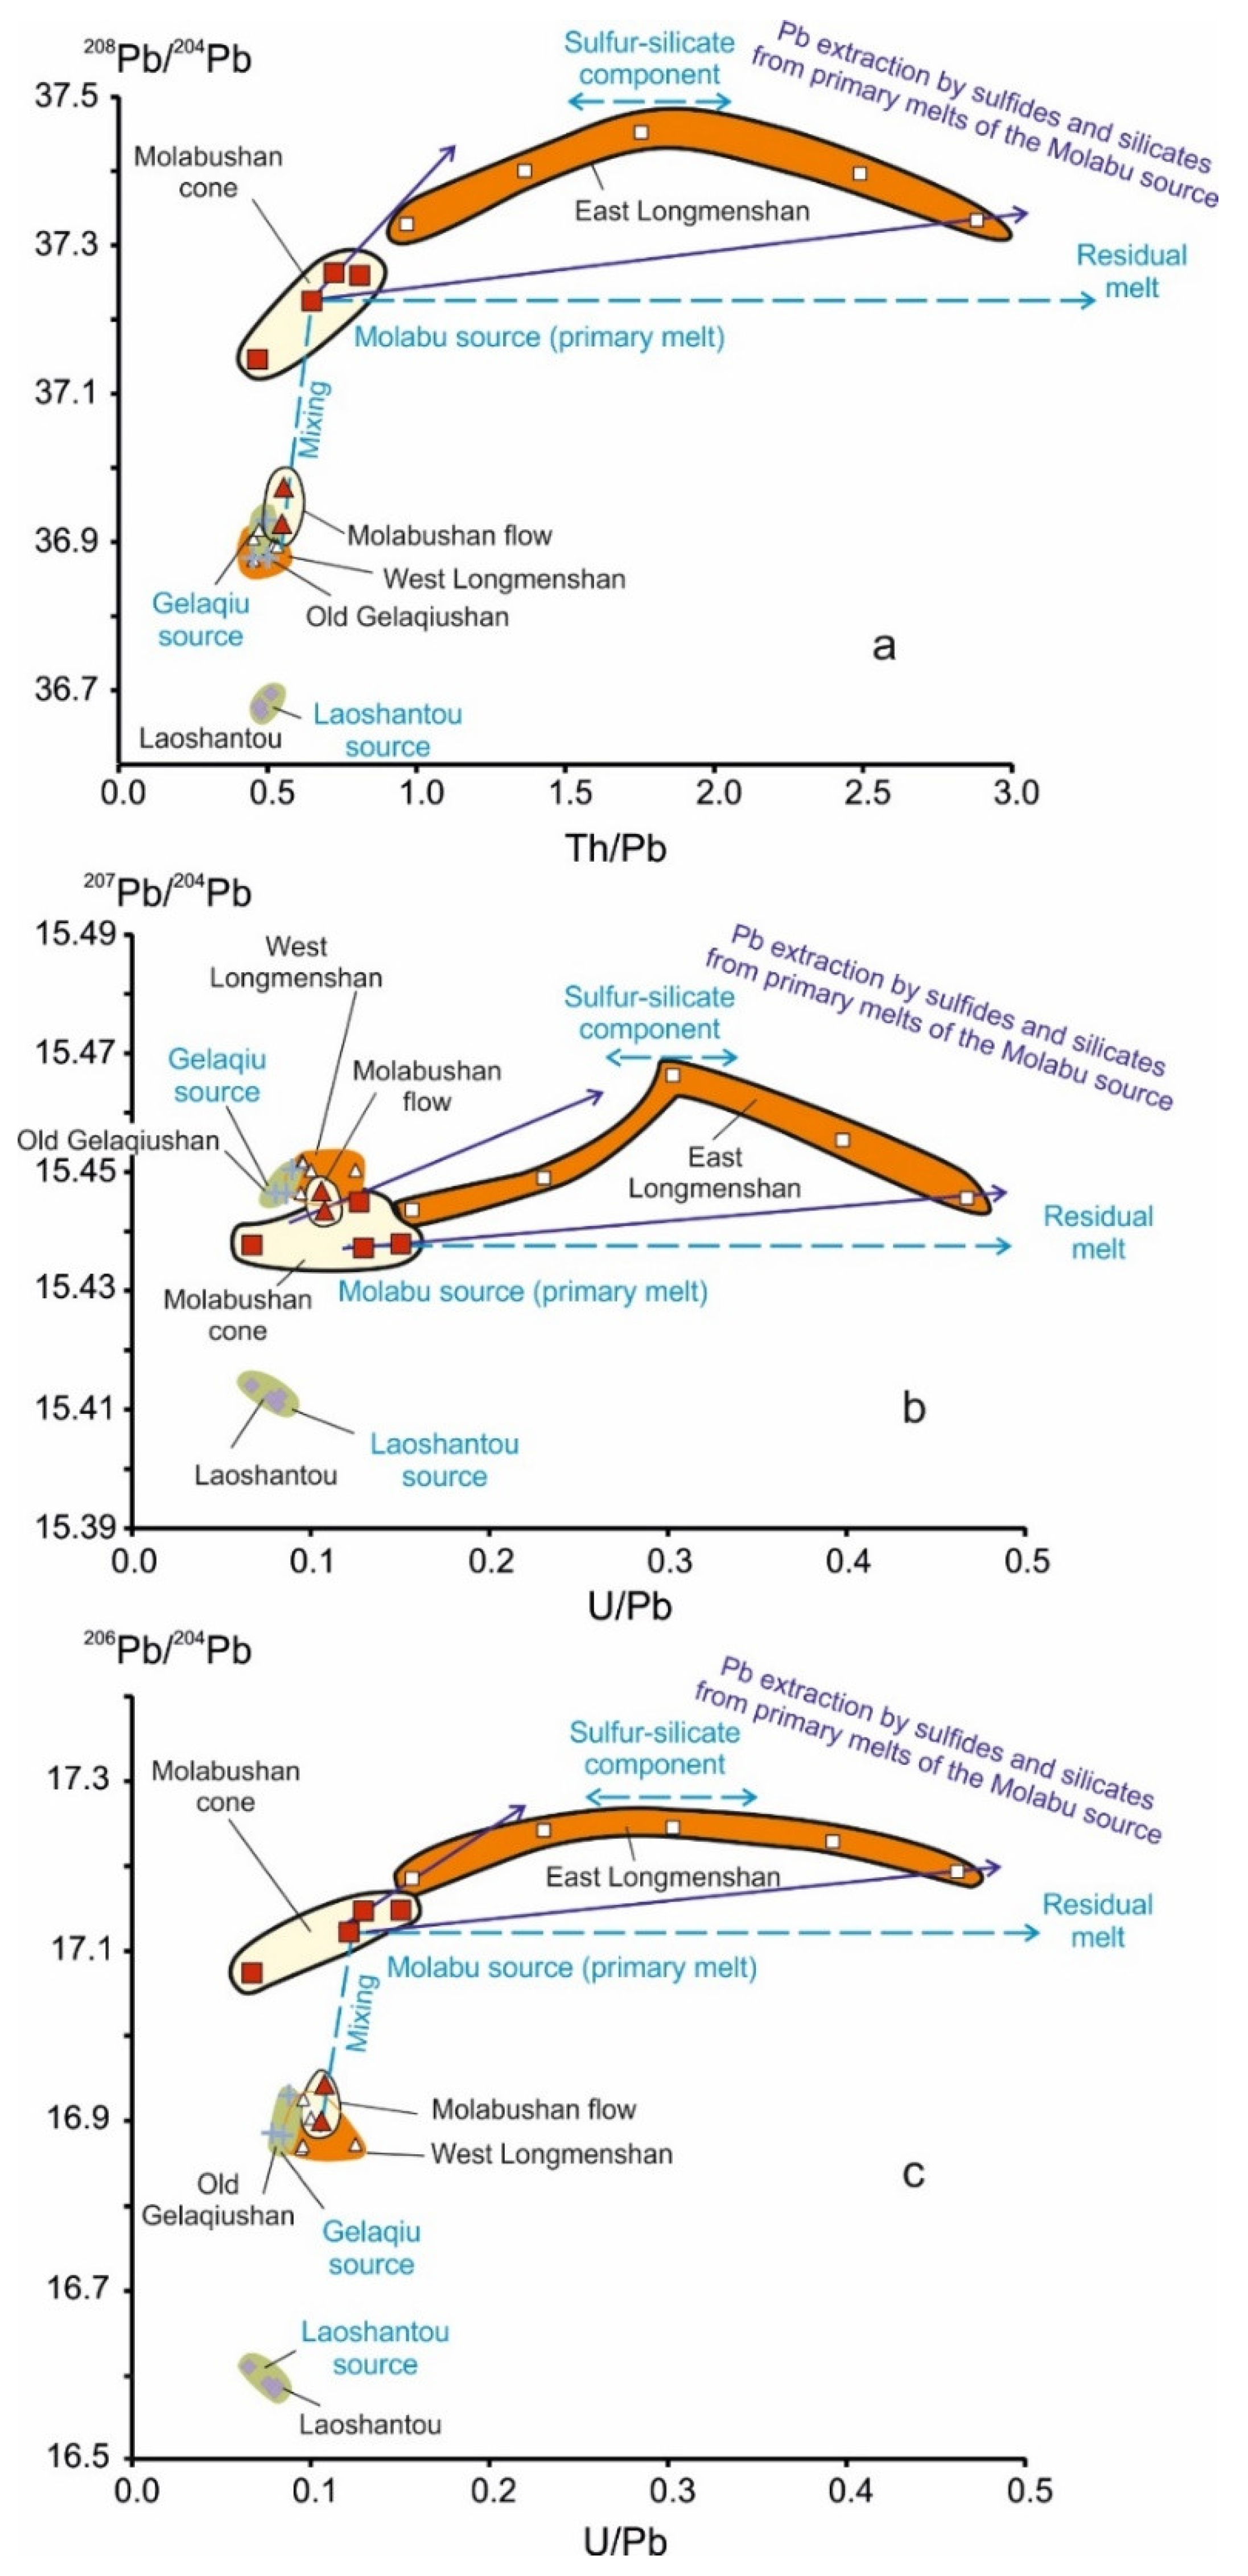
4.2. Old Lithospheric, Recent Homogeneous, and Modified Pb Isotopic Signatures

Important information on magma sources of viscous (lithospheric) mantle may be inferred from the linearity of data points on the uranogenic lead-isotope diagram due to the different half-lives of the parent isotopes 238U and 235U that are kinetically inseparable from each other in any geological environment. Zartman et al. [47] reported Pb isotopic compositions of Linju basalts (Shandong Peninsula) that covered the entire range of volcanic rocks from East China yielding a linear distribution of points with a slope that corresponds to an age of 2.57 Ga. Such a distribution of data points was interpreted as a secondary isochron indicative of the lithospheric source age. Basu et al. [4] approximated Pb isotopic ratios of volcanic rocks from the Wudalianchi, Changbaishan, Hannooba, Minxi, Datong, and Kuandian fields by the NHRL (Northern Hemisphere Reference Line) with a slope of 1.77 Ga. Afterward, Tatsumoto et al. [5] used Pb isotopic data from volcanic rocks of the Kuandian and Hannuoba fields to assess metasomatic enrichment events at 3.38 and 2.65 Ga, respectively, in the subcontinental lithosphere.
The linearity of data points on the uranogenic lead-isotope diagram is indicative for estimating the ages of lithospheric sources for volcanic rocks from Wudalianchi. Data from the Laoshantou and Old Gelaqiushan flows yielded a secondary isochron, whose slope corresponds to an age of 1.88 ± 0.06 Ga (MSWD = 0.67). The East Asian common reservoir composition also falls on this isochron line (Figure 8a), which is indicative of incubation time for this reservoir as viscous (lithospheric) material. However, no trends connect the East Asian common reservoir with data points of moderate-Mg rocks from the Molabushan cone and East Longmenshan volcano. These are shifted relative to the 1.88 Ga secondary isochron to the right and below, likely due to a later generation of their sources. Moderate-Mg rocks from the Molabushan cone revealed 207Pb/204Pb values within the range of analytical error (i.e., in terms of 207Pb/204Pb, these rocks are derivatives of a recent homogeneous source). An appreciable range of 206Pb/204Pb values is indicative of some period of time resulting in accumulation of the 206Pb isotope in a closed Molabu source and in rocks of the cone after their crystallization.
Unlike the 207Pb/204Pb–206Pb/204Pb plot, which reveals deviation of data points of rocks from the Molabushan cone and East Longmenshan below the Laoshantou-Gelaqiu reference line 1.88 Ga, the 208Pb/204Pb–206Pb/204Pb plot shows a single trend for all Wudalianchi rocks (Figure 8a,b). Obviously, processing of the mantle material led to the homogenization of low 207Pb abundances in the Molabu source and derivative (modified) melts of the East Longmenshan volcano, but did not provide time-dependent variations of uranogenic (206Pb) and thorogenic (208Pb) isotopes. In the recently homogenized Molabu source and derivative melts, these radionuclides represent more than 99% of uranogenic lead and 100% of thorogenic lead. As a result, only the 207Pb/204Pb–206Pb/204Pb plot yielded information on the younger events.
In contrast to moderate-Mg rocks of the Molabushan cone, low-Mg compositions of the Molabushan flow showed Pb isotopic ratios similar to values of the Gelaqiu source and a mixing trend directed toward the Molabu one. Similar mixing trends are defined between the Gelaqiu and Molabu sources for rocks from other Wudalianchi volcanoes. The same trend is designated, for instance, by data points of moderate-Mg rocks from the Bijiashan and Laoheishan (Figure 8). 206Pb/204Pb, 207Pb/204Pb, and 208Pb/204Pb ratios of moderate-Mg rocks from the East Longmenshan volcano were elevated relative to those from the Molabushan cone, while the Pb isotopic ratios of low-Mg rocks from the West Longmenshan were close to the values of the Gelaqiu source. Unlike rocks from the Molabushan volcano, those from the East Longmenshan provide no adequate age information for a source region.
The division of rocks in terms of MgO contents is consistent with specific variations of Pb isotopic ratios (Figure 9). Compared to lithosphere-derived low-Mg rocks from the Molabushan flow and West Longmenshan, those from the recent homogeneous Molabu source (i.e., from the Molabushan cone and East Longmenshan) showed elevated 206Pb/204Pb and 208Pb/204Pb ratios. Moderate-Mg rocks of the East Longmenshan revealed increasing 206Pb/204Pb, 207Pb/204Pb, and 208Pb/204Pb ratios relative to those of the Molabushan cone (Figure 9). Obviously, some kind of process modified Molabu liquids result in the relative increase of Pb isotopic ratios in moderate-Mg rocks of the East Longmenshan. The difference between Pb isotopic compositions of low- and moderate-Mg rocks emphasizes a non-lithospheric (i.e., convectively homogenized) mantle origin of the Molabu source.

4.3. Anomalous Pb Range in Moderate-Mg Rocks

Pyrolite-normalized incompatible trace-element patterns of rocks from Wudalianchi demonstrate relatively uniform spectra that differ from oceanic basalt signatures [2,30,49]. The rocks showed negative anomalies of Cs, Th–U, Nb–Ta, and peaks of Ba, K, La. Laoshantou trachyandesites and partly Old Gelaqiushan basaltic trachyandesites exhibited slightly decreased abundances of these elements relative to moderate-Mg compositions. From Pr to Yb, the normalized patterns showed smoothly decreasing values. The only exception was a strongly variable Pb concentration from a trough in sample CH-15-65 (3.7 ppm Pb) to a peak in sample CH-15-41 (21.2 ppm Pb) (Figure 10).
All but one moderate-Mg sample from the Molabushan cone had 11–13 ppm Pb and 7.7–8.1 wt.% MgO. The elevated Pb concentration (21 ppm) in sample CH-15-41 corresponded to the lowest MgO content of this group (7.34 wt.%). Pb concentrations in moderate-Mg rocks from the East Longmenshan volcano decreased from 10.6 to 3.7 ppm with a relative decrease of MgO content from 8.46 to 7.36 wt.%. Taking into account such an unusual Pb variation, moderate-Mg rocks from the East Longmenshan are considered here as modified liquids from the homogeneous Molabu source. In contrast, the Laoshantou trachyandesite and Old Gelaqiushan basaltic trachyandesite showed a narrow Pb range (13–14 ppm). Almost the same narrow Pb range is characteristic of low-Mg rocks from the Molabushan and West Longmenshan volcanoes (Figure 11).

5. Discussion

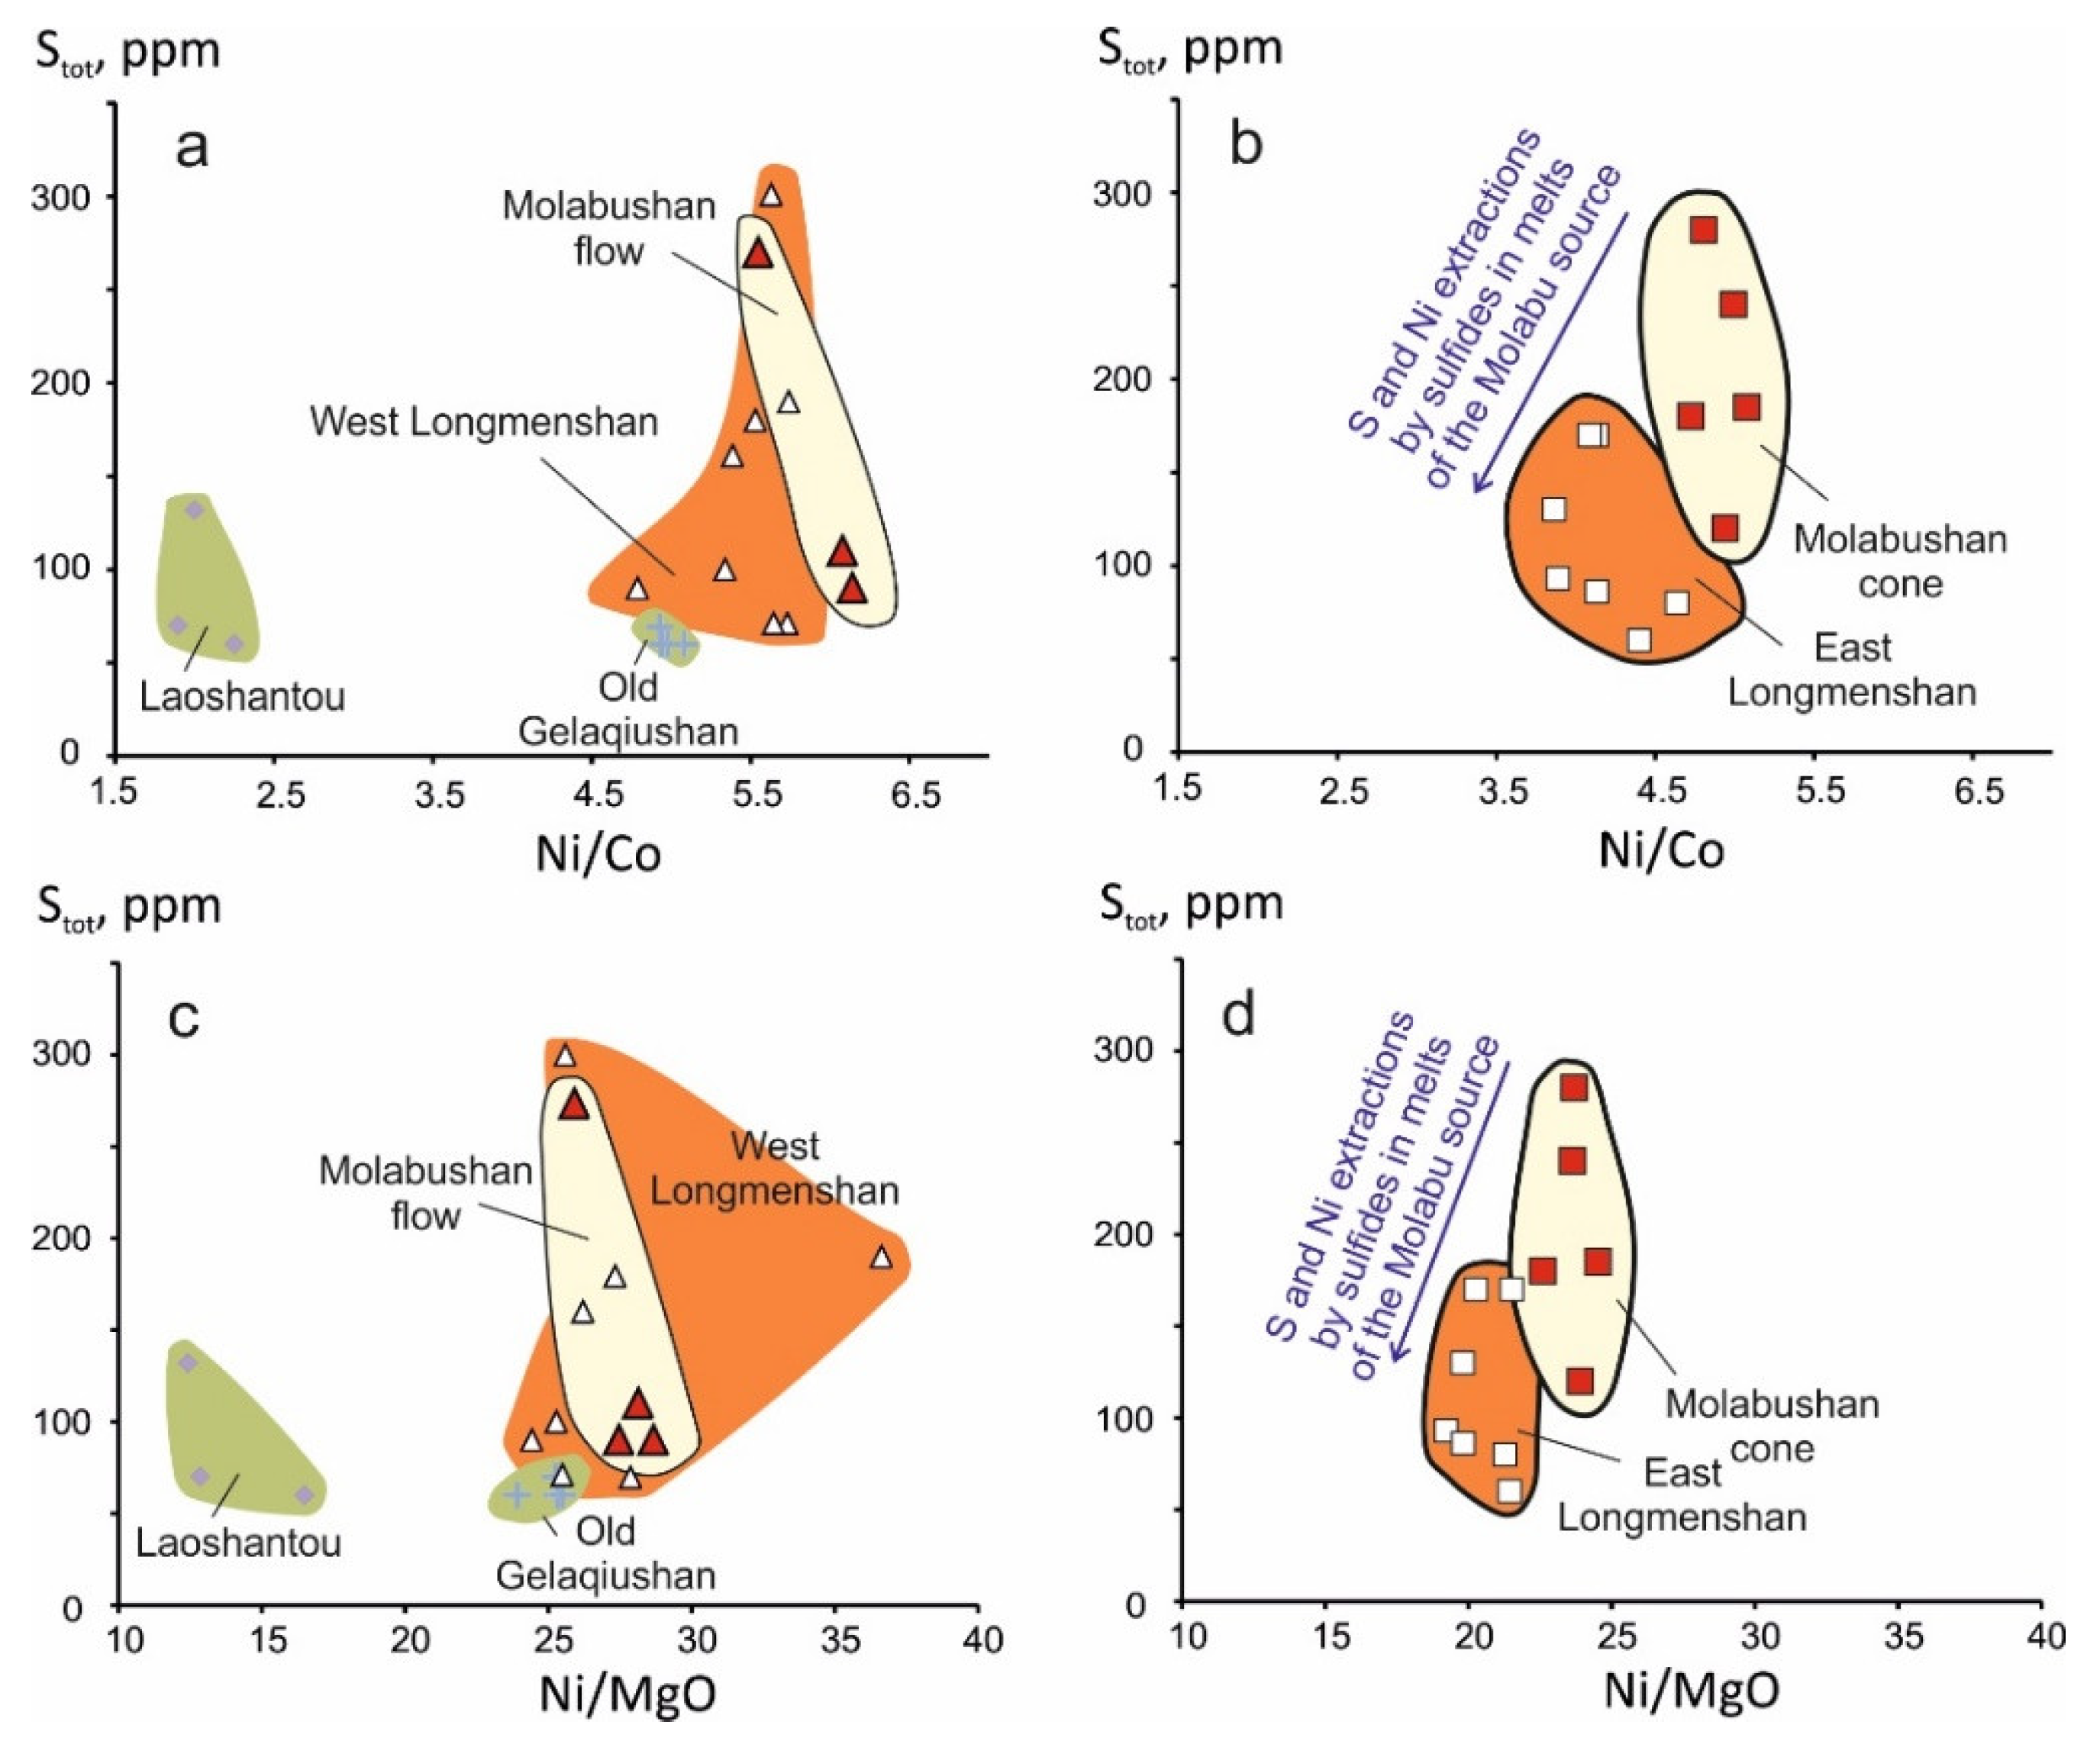
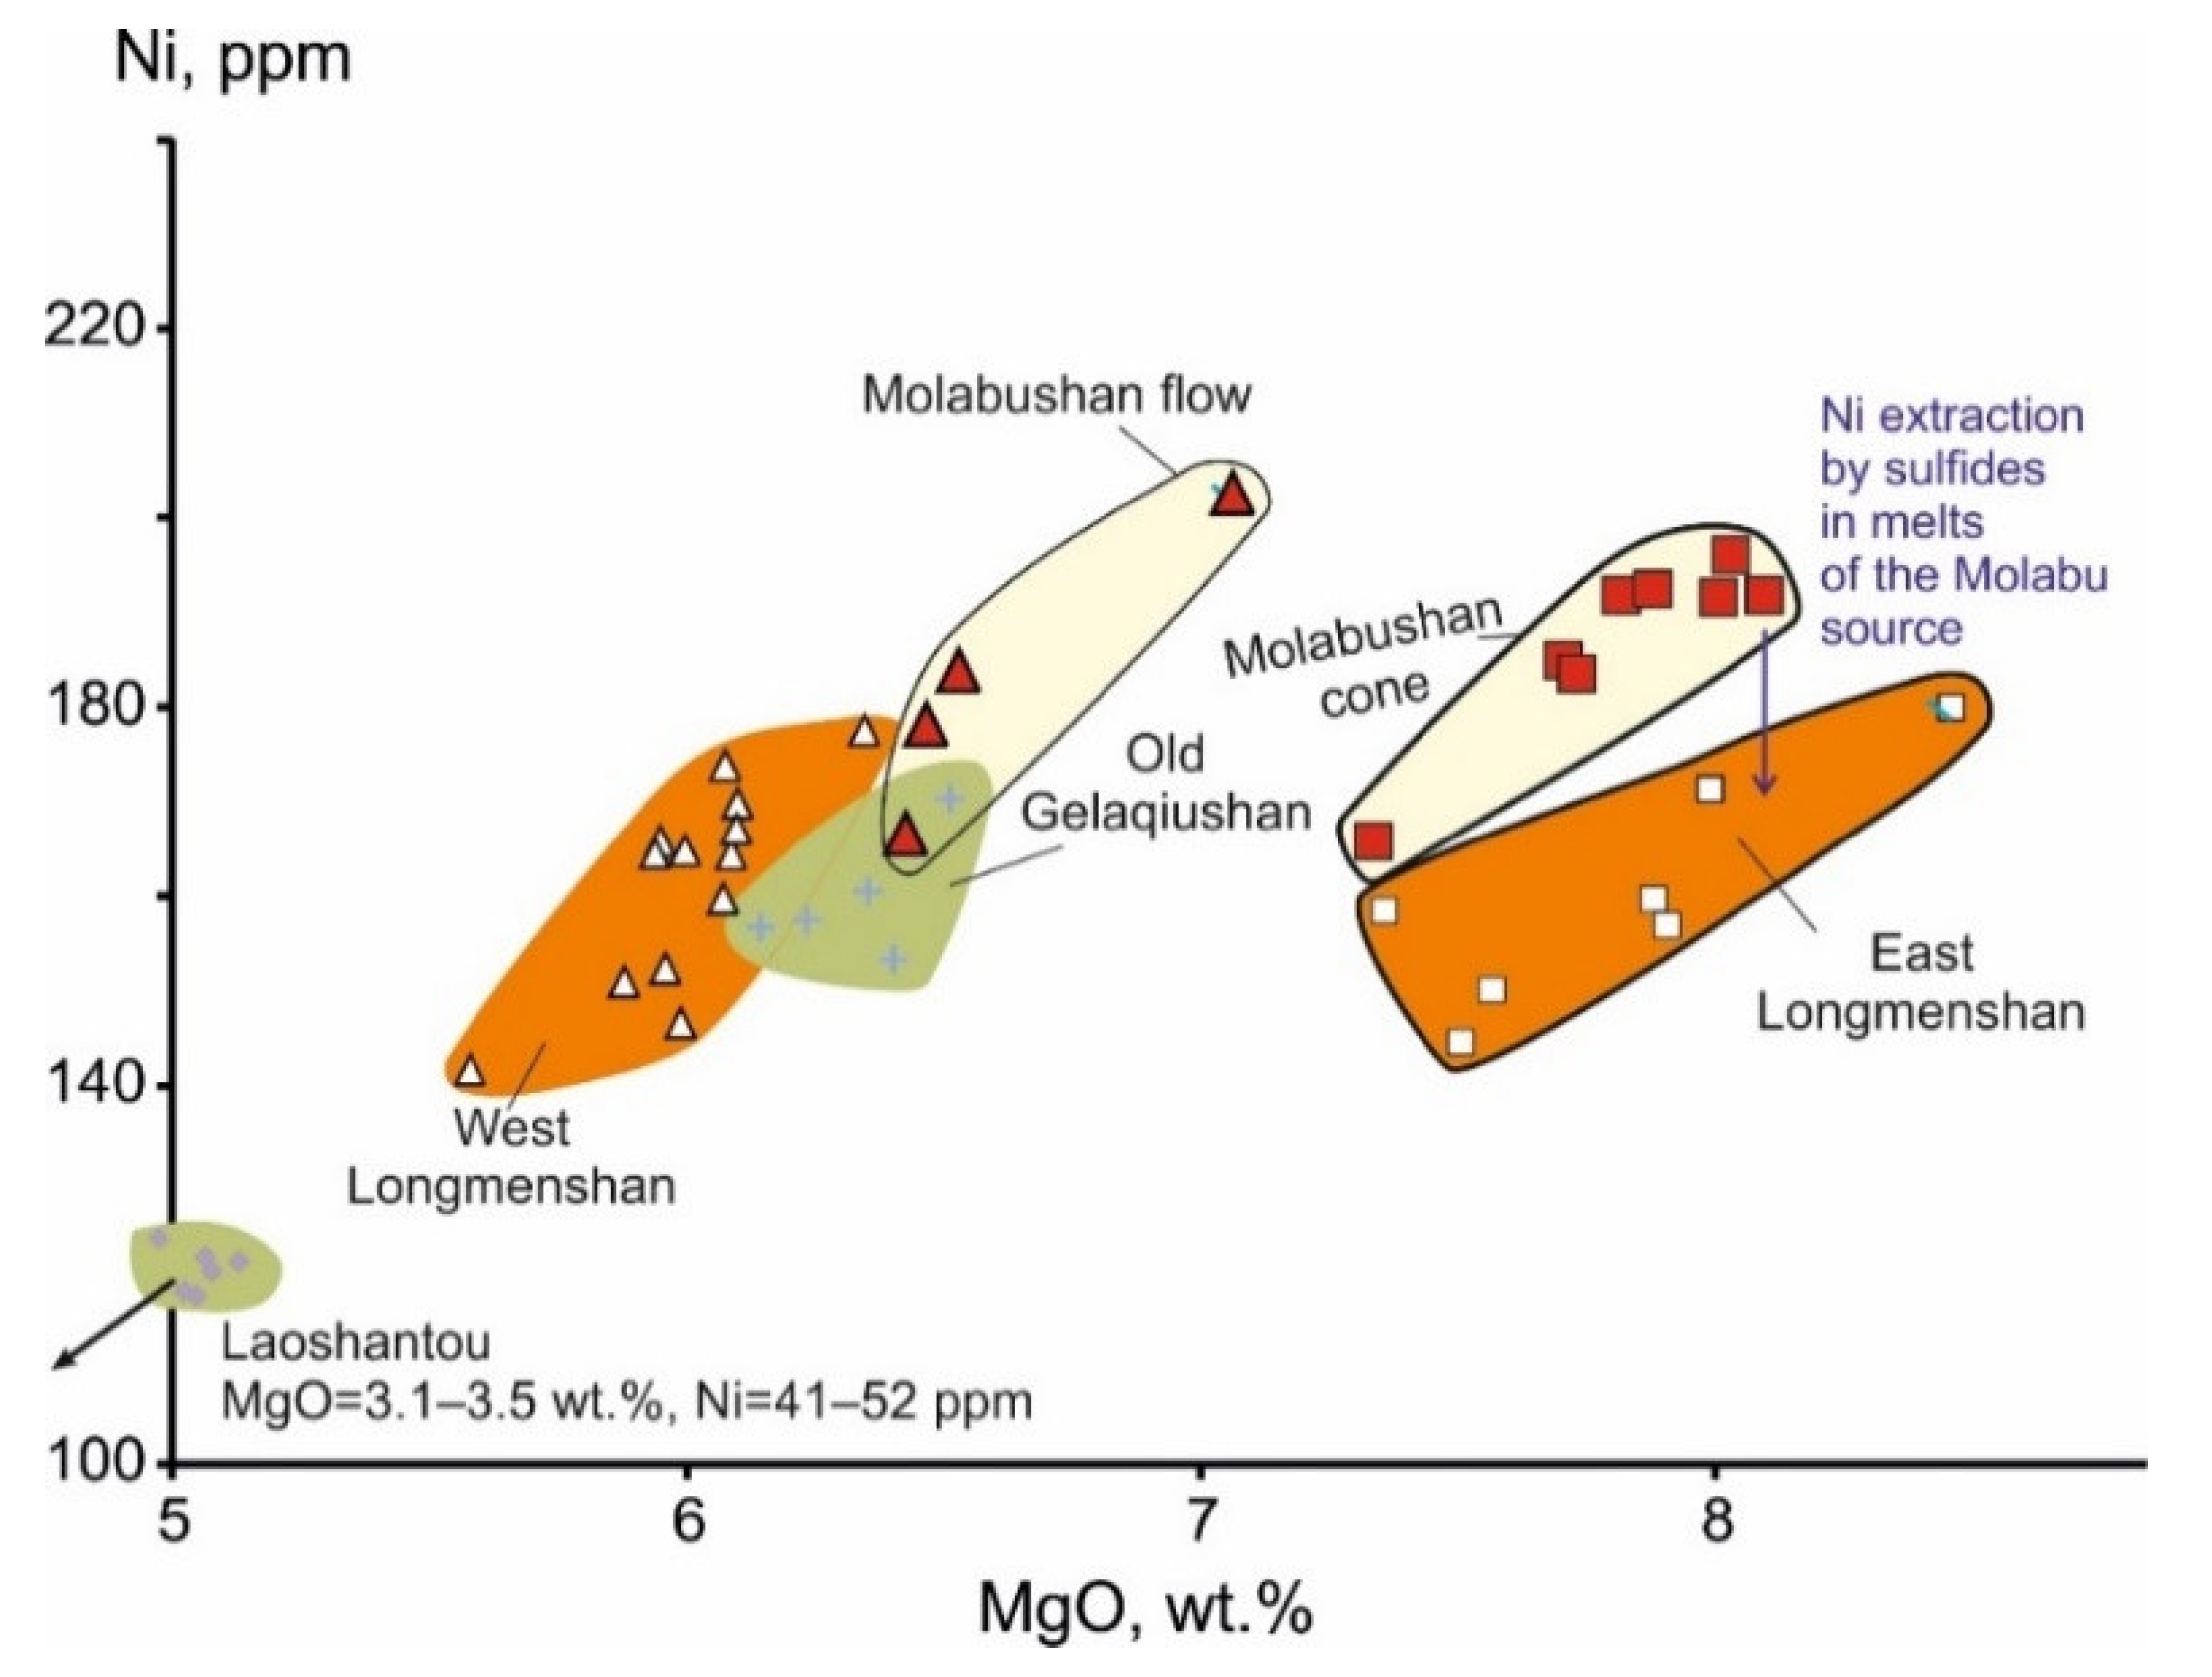
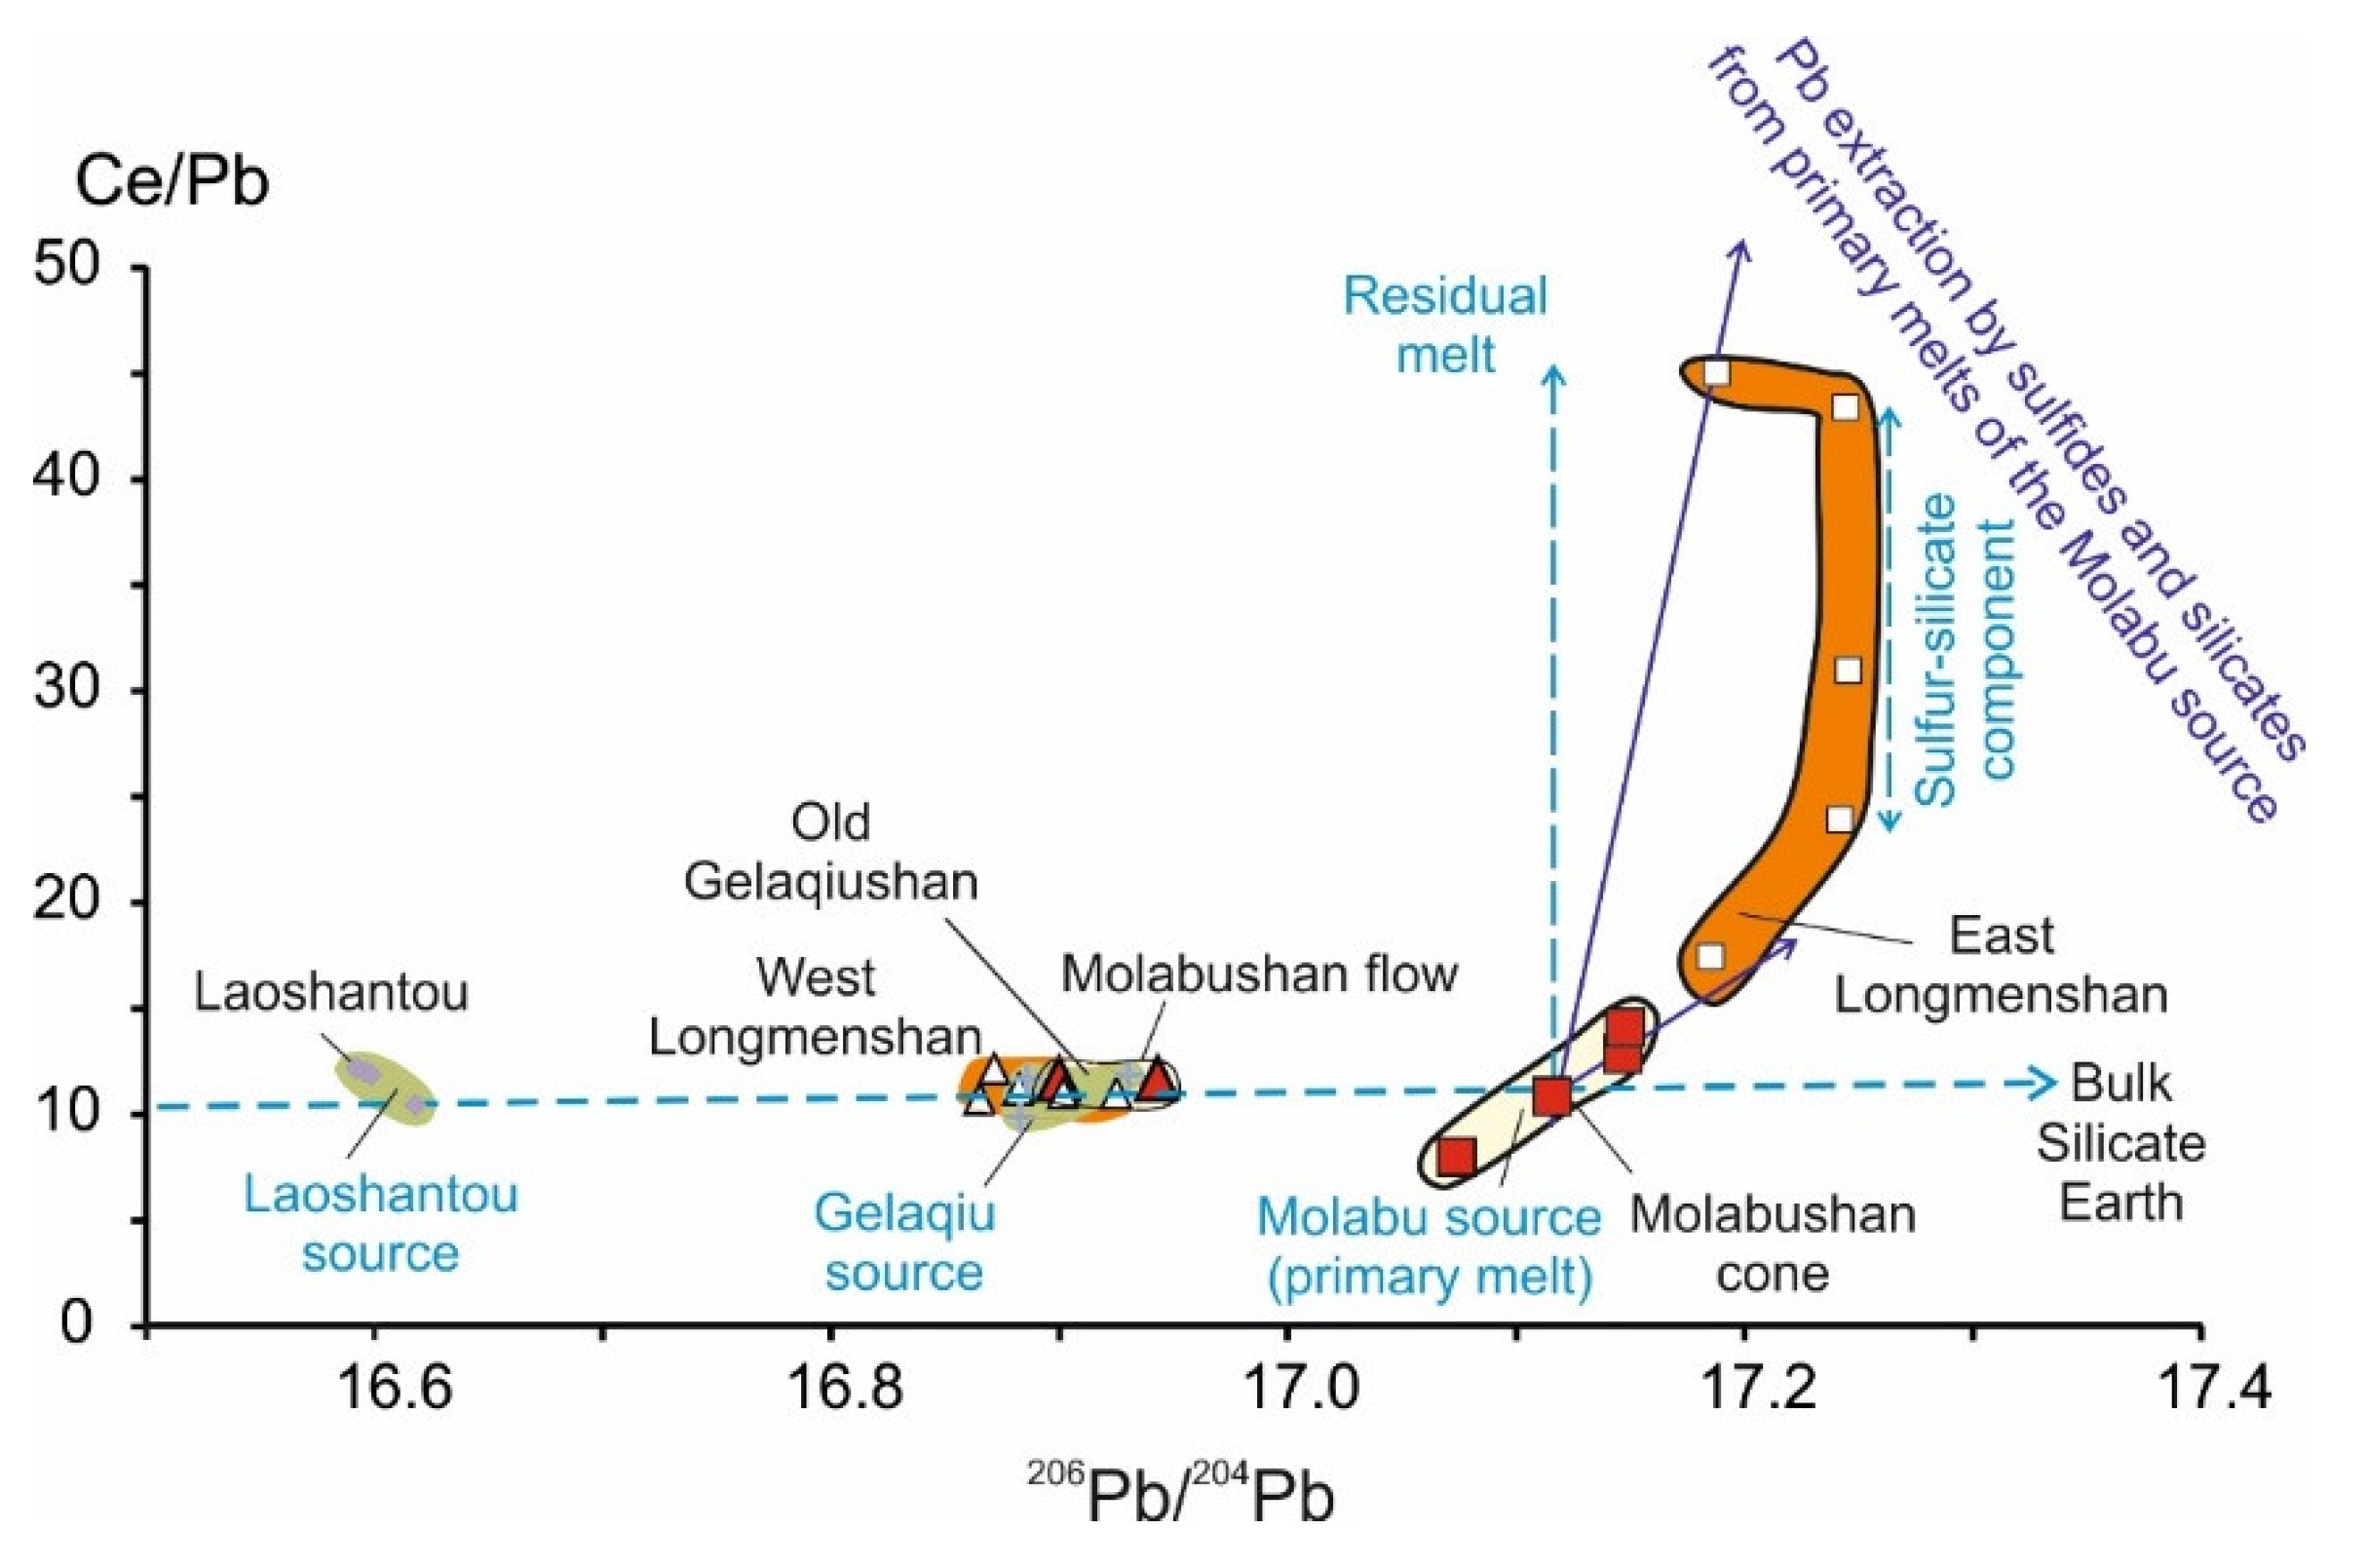
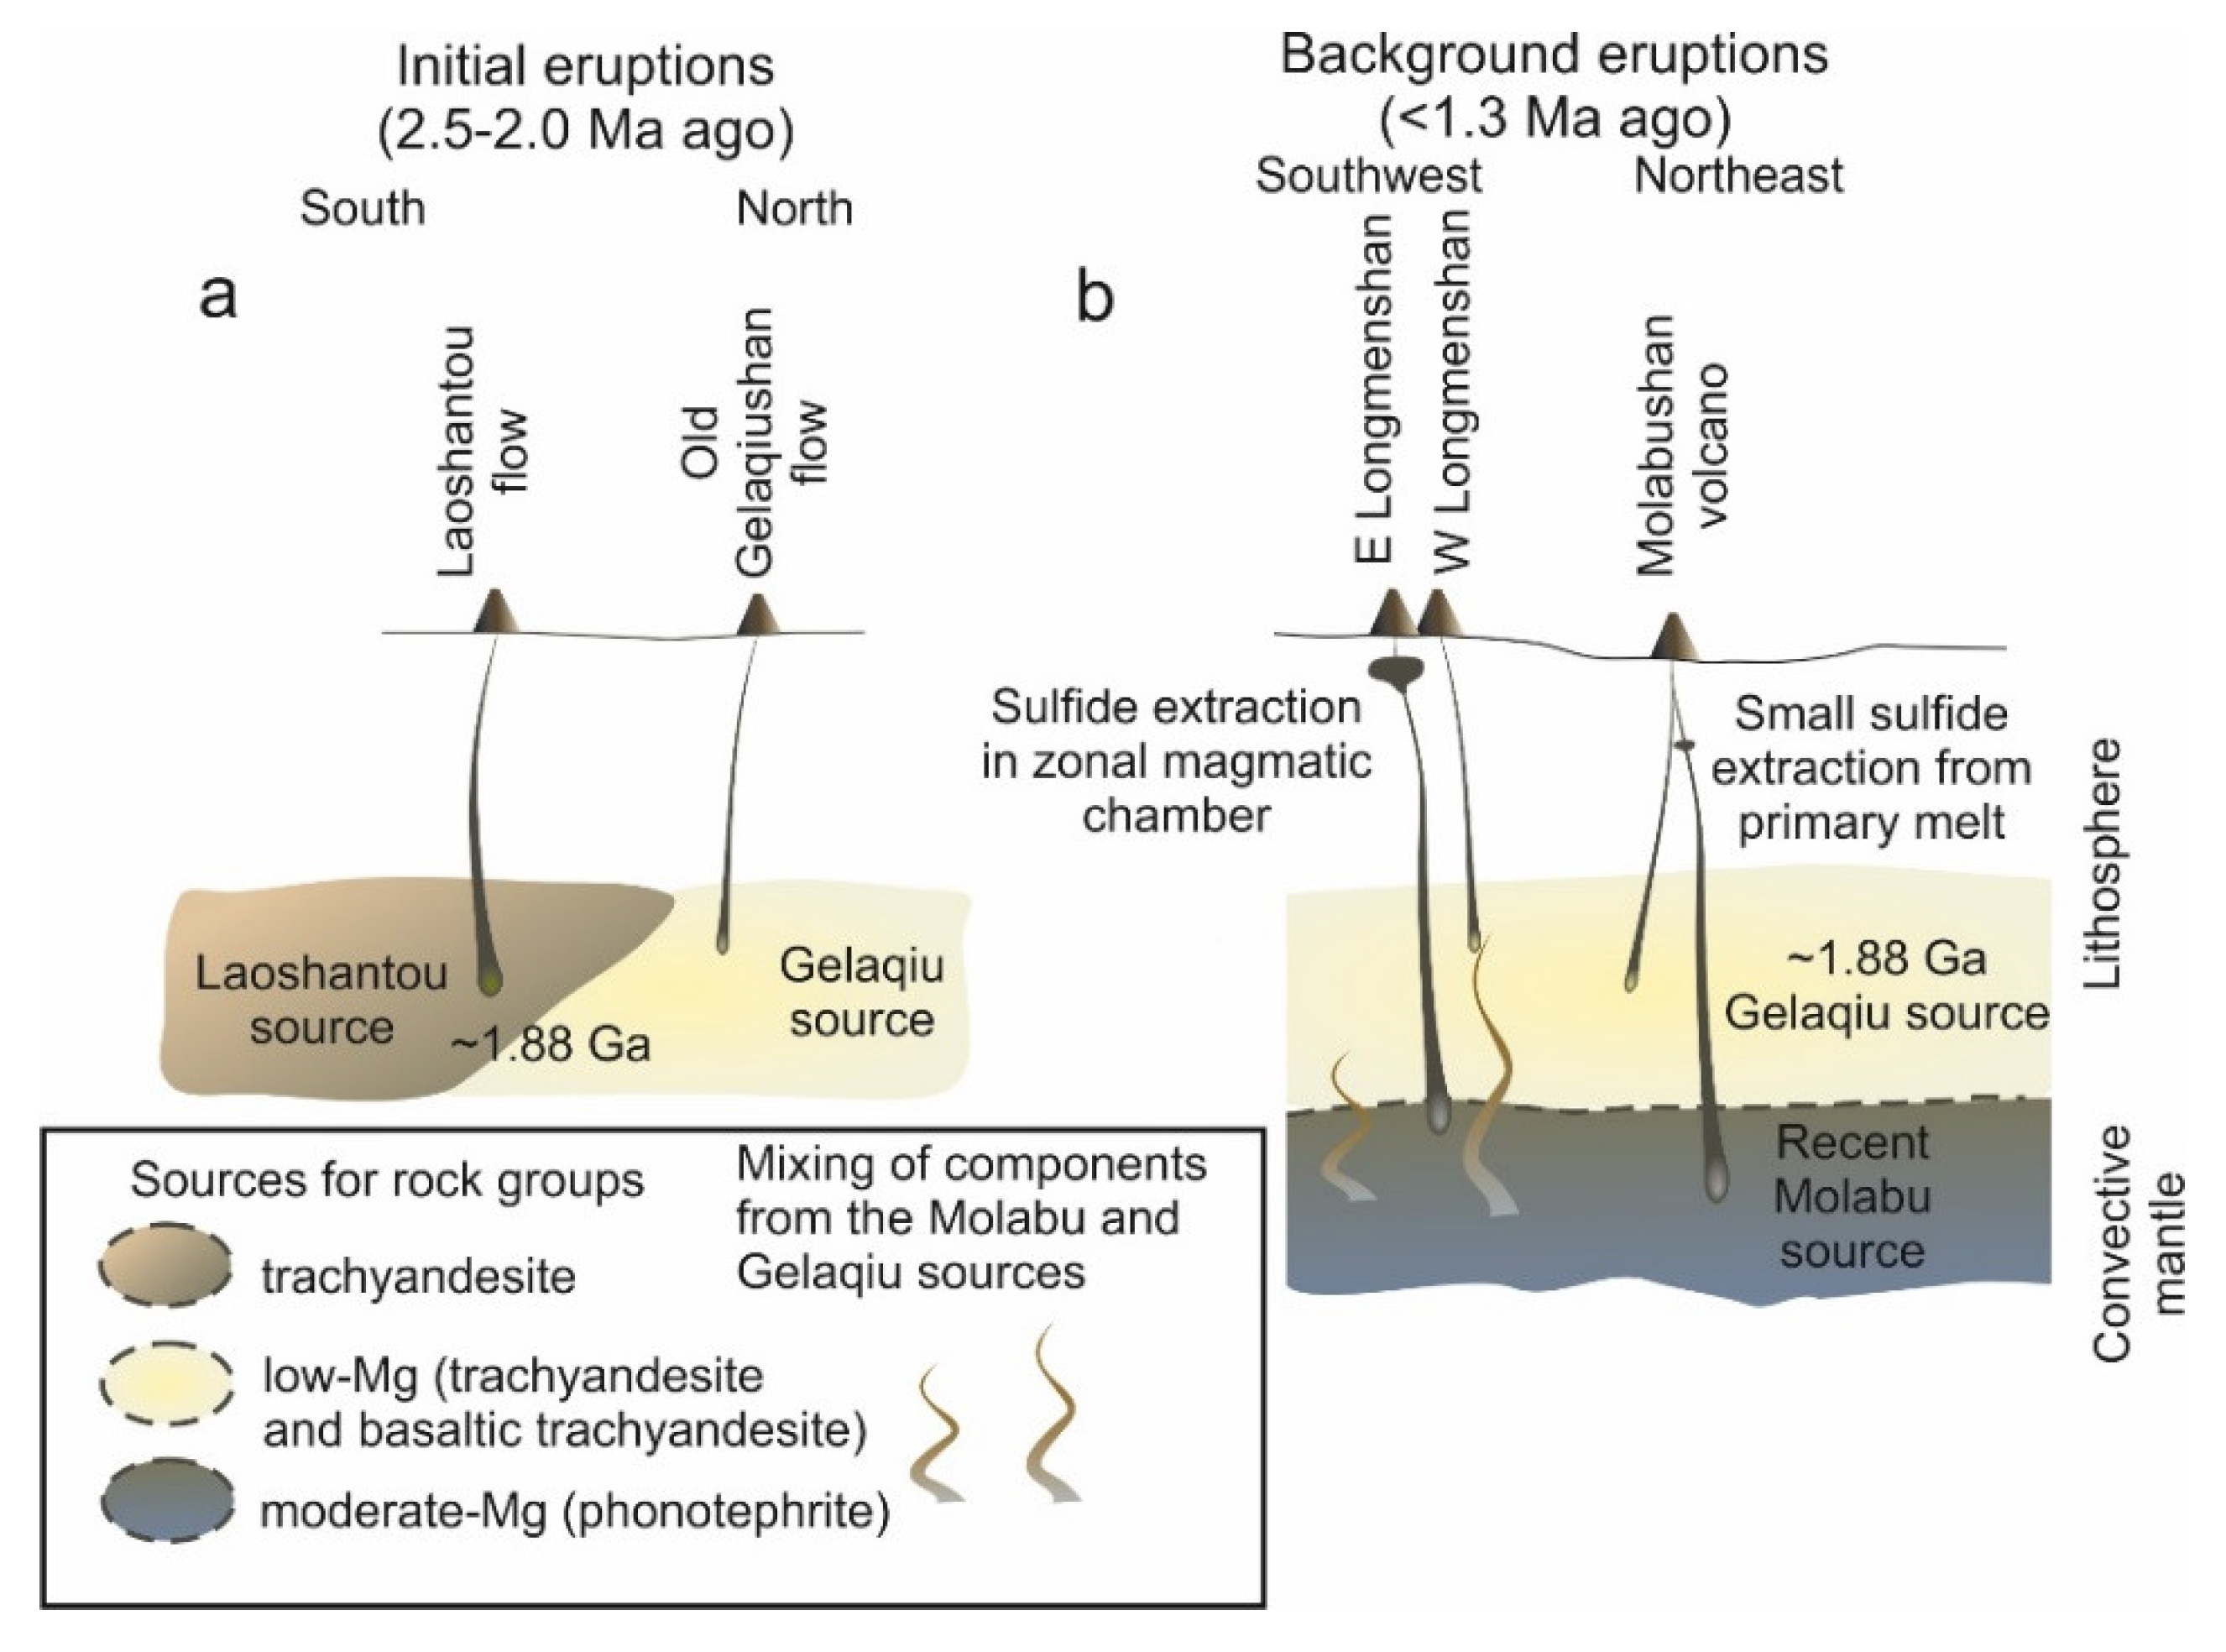
5.1. Hypothesis on Extraction of Sulfides from Melts of the Molabu Source

The difference between moderate-Mg rocks from the Molabushan cone and East Longmenshan volcano in terms of Pb isotopic ratios and Pb abundances is likely due to sulfide extraction resulting from the addition of a sulfur-bearing component to moderate-Mg melts of the Molabu source. If sulfides had been extracted from melts of the Molabu source without introduction of an external component, moderate-Mg rocks would have yielded trends of increasing Th/Pb and U/Pb ratios without variations of Pb isotope ratios (i.e., the expected trends would have extended parallel to the abscissa axes in the graphs in Figure 12). Such trends, however, are not characteristic of moderate-Mg rocks. Instead, the graphs showed curvilinear trends, starting by data points of rocks from the Molabushan cone and ending by ones from the East Longmenshan volcano.
The trends appeared to display the common evolution of the Molabu source melts affected by the addition of sulfur-bearing material with the progressive extraction of sulfides from melts of the Molabushan and East Longmenshan volcanoes. Separation of only sulfides that have Th/Pb and U/Pb ratios equal to 0 would have resulted in direct trends from the Molabu source. The observed bends of the paths in the graphs of Figure 12 show the signature of an external component displayed in the highest Pb isotope ratios that distinguish the material of the sulfur-bearing material from the Molabu source magma. We defined Pb isotopic ratios of (1) magmatic component of the Molabu source—206Pb/204Pb = 17.074, 207Pb/204Pb = 15.438, 208Pb/204Pb = 37.146 and (2) external sulfur-silicate component—206Pb/204Pb = 17.246, 207Pb/204Pb = 15.466, 208Pb/204Pb = 37.453. The silicate contribution is reflected in the erupted residual melts with the Th/Pb, U/Pb, and Th/U ratios close to 1.5–2, 0.3, and 5.0–6.6, respectively. In the ore-forming magmatic process, the external sulfur-silicate component is combined, on the one hand, directly with the magma of the Molabu source (Th/Pb = 0.47, U/Pb = 0.067, Th/U = 7), and on the other hand, with the final residual melt generated after sulfide extraction (Th/Pb > 3.0, U/Pb > 0.5).
Separation of an immiscible sulfide liquid from a silicate medium affects not only S and Pb, but also Ni, Co, Cu, and Fe [18,19,20,21,22,52,53,54]. Geochemical effects of sulfide extraction were confirmed on the S versus Ni/Co, S versus Ni/Mg, and Ni versus MgO diagrams (Figure 13 and Figure 14).
In igneous rocks, Ni and Co enter into both sulfides and silicates, while S enters only into sulfides. Study of sample CH-15-43, which shows the maximal S abundance 280 ppm among rocks from the Molabushan cone, confirmed sulfur residence in pyrite particles determined using a scanning electron microscope. The decrease in sulfur from rocks of the Molabushan cone to those of East Longmenshan clearly marks a process of sulfide extraction. As sulfur content falls from 120–280 ppm in rocks of the Molabushan cone to 60–170 ppm in those of East Longmenshan, Ni/Co and Ni/Mg ratios decrease from 4.8–5.3 and 23–26 to 3.7–4.7 and 20–22, respectively.
Low- and moderate-Mg rock groups have comparable Ni concentrations. Low-Mg rocks from the Molabushan volcano showed elevated Ni abundances relative to those from the West Longmenshan volcano. Moderate-Mg rocks of the Molabushan cone denote an individual trend that also presents control of Ni by silicates. Concentration of Ni in rocks of the Molabushan cone (166–196 ppm) decreases to 144–180 ppm in rocks of the East Longmenshan. This shift might indicate additional control of Ni in liquids of the latter volcano by sulfide extraction.

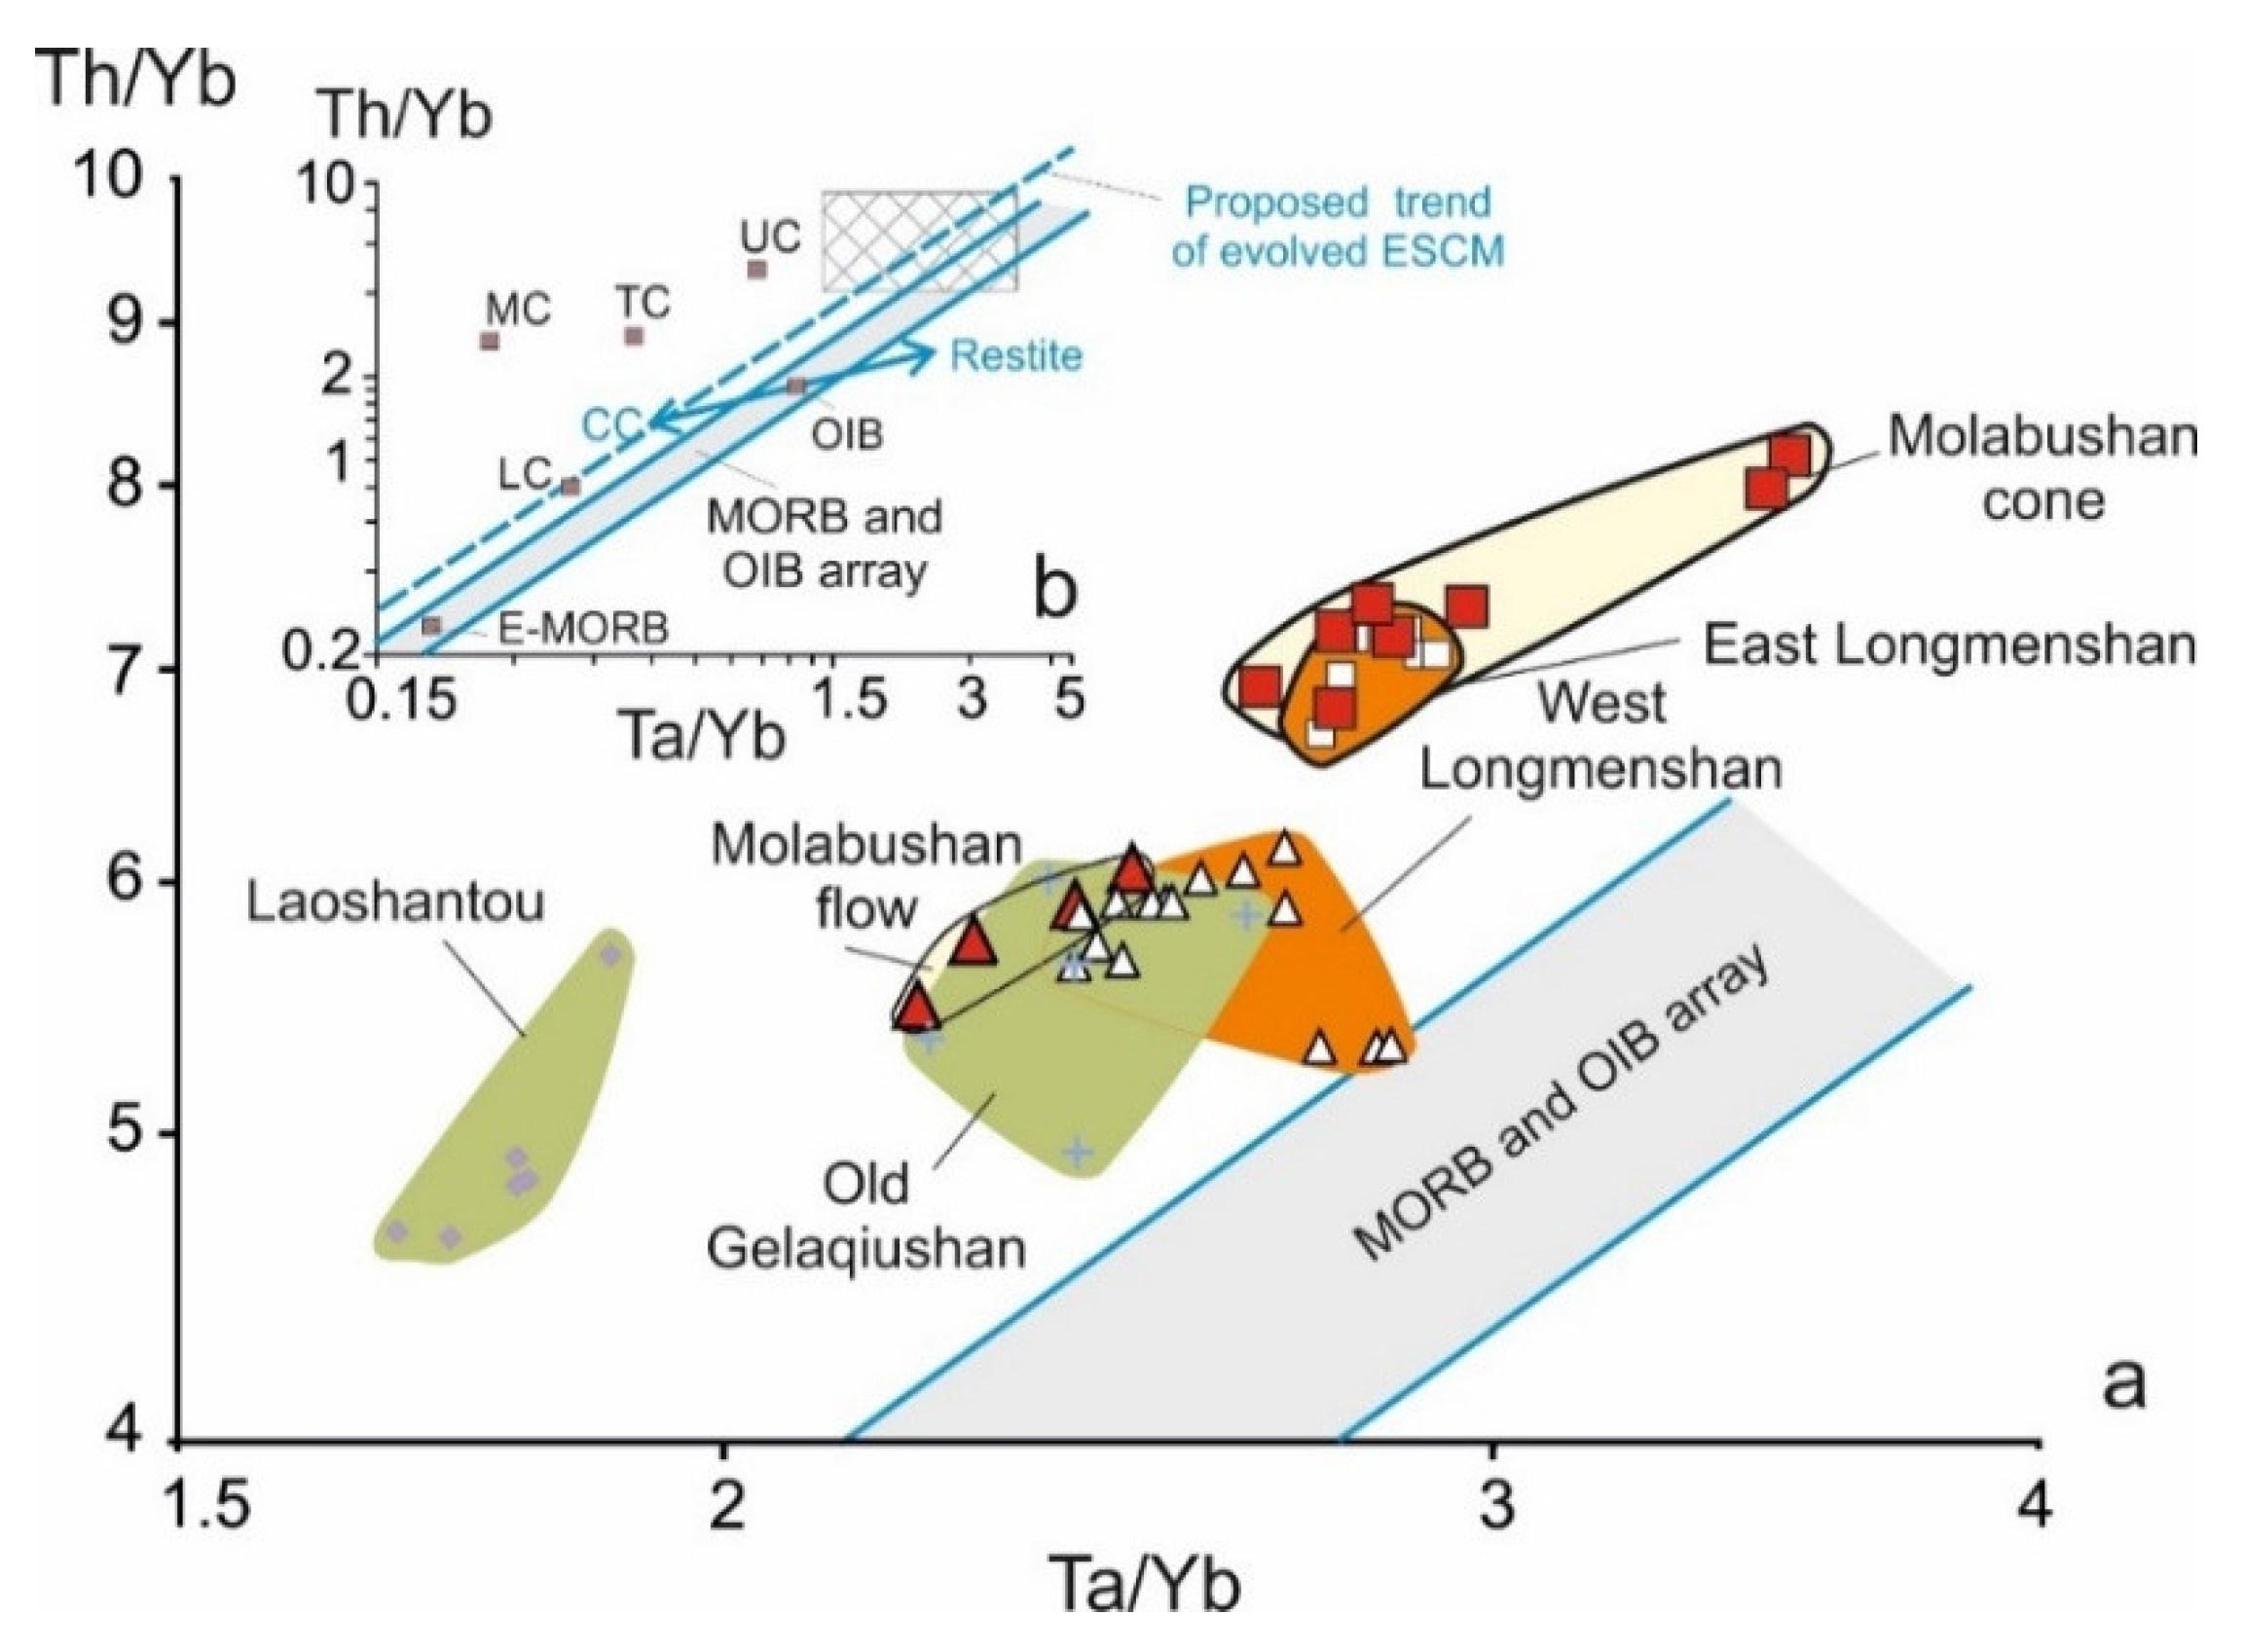
5.2. Hypothesis on Generation of Wudalianchi Magmas in Sources of Enriched Sub-Continental Mantle (ESCM) Related to the Primordial Mantle (PM) Evolution

A Ce/Pb value ~25 is characteristic of OIB and MORB [19,55]. Ce/Pb and Nd/Pb ratios of N-MORB (normal mid-ocean ridge basalts) are essentially constant at ~25 and ~20, respectively. So, it is assumed that lead behaves in a similar manner to these rare earth elements during partial melting and fractional crystallization. Measurements of mineral–melt partition coefficients show, however, that Pb is much more incompatible than Ce and Nd in silicates, but has a high sulfide melt/silicate melt distribution coefficient. This means a major control on the behavior of Pb by its partitioning into sulfide during melting and differentiation [19,21]. Unlike oceanic basalts, both the continental crust and magmas, generated in convergent tectonic settings, are enriched in Pb with a Ce/Pb as low as 2.5 that is explained by a fluid phase transfer of lead from the subducted oceanic crust [56].
Both low- and moderate-Mg rocks from Wudalianchi revealed no Ce/Pb signatures specific for oceanic or convergent continental margin sources (~25 or 2.5, respectively), but showed Ce/Pb typical of the primordial mantle (PM = 10.7 ± 0.5). Therefore, the Wudalianchi source material represents the ESCM that never passed the oceanic stage, but could originate through processing of the evolved PM material, which was likely retained in the East Asian common reservoir [9]. Therefore, there is no reason to refer to Wudalianchi rocks as EM1 OIB end-member as was previously thought [1,2,4,5].
Similar to 208Pb/204Pb–Th/U, 207Pb/204Pb–U/Pb, and 206Pb/204Pb–U/Pb variations (Figure 12), in the Ce/Pb versus 206Pb/204Pb diagram (Figure 15), an anomalous Pb behavior in moderate-Mg rocks from the Molabushan cone and East Longmenshan volcano is displayed by a non-linear trend. Data points of rocks from the Molabushan cone yielded strongly correlated Ce/Pb and 206Pb/204Pb ratios, whereas those of rocks from the East Longmenshan volcano showed remarkably increased Ce/Pb and narrow 206Pb/204Pb. The sulfur-silicate component of the East Longmenshan showed trends toward primary melt of the Molabu source (Ce/Pb ~10) and residual melt (Ce/Pb ~50). A primary magmatic 206Pb/204Pb value corresponded to Ce/Pb typical of the PM.
The ESCM signature is also likely retained by Wudalianchi rocks on the Th/Yb versus Ta/Yb diagram, in which rocks of the continental crust are plotted above the mantle array displayed by OIB and MORB [57]. On one hand, advanced separation of a crustal component from the OIB source results in a restite-type source signature with elevated Th/Yb and Ta/Yb ratios (i.e., restite source shifts below the MORB and OIB array), as it was inferred in the study of Cenozoic volcanic rocks from Central Mongolia [34]. On the other hand, the specific array of the ESCM rocks might be a result of a separation of continental crust from the upper mantle reservoir. In Figure 16, the evolved trend of rocks from the ESCM is placed above the MORB and OIB array (Figure 16).
The trace-element set of the undifferentiated mantle (pyrolite) [50] is characteristic of the Bulk Silicate Earth (BSE) composition that corresponds to the Geochron. The Wudalianchi mantle lithospheric sources belong to viscous mantle displayed in the common reservoir of East Asia that was differentiated at ca. 1.88 Ga (Figure 8). This event designated the possible ascend of undifferentiated mantle material, resulting in the generation of the enriched continental lithospheric mantle.

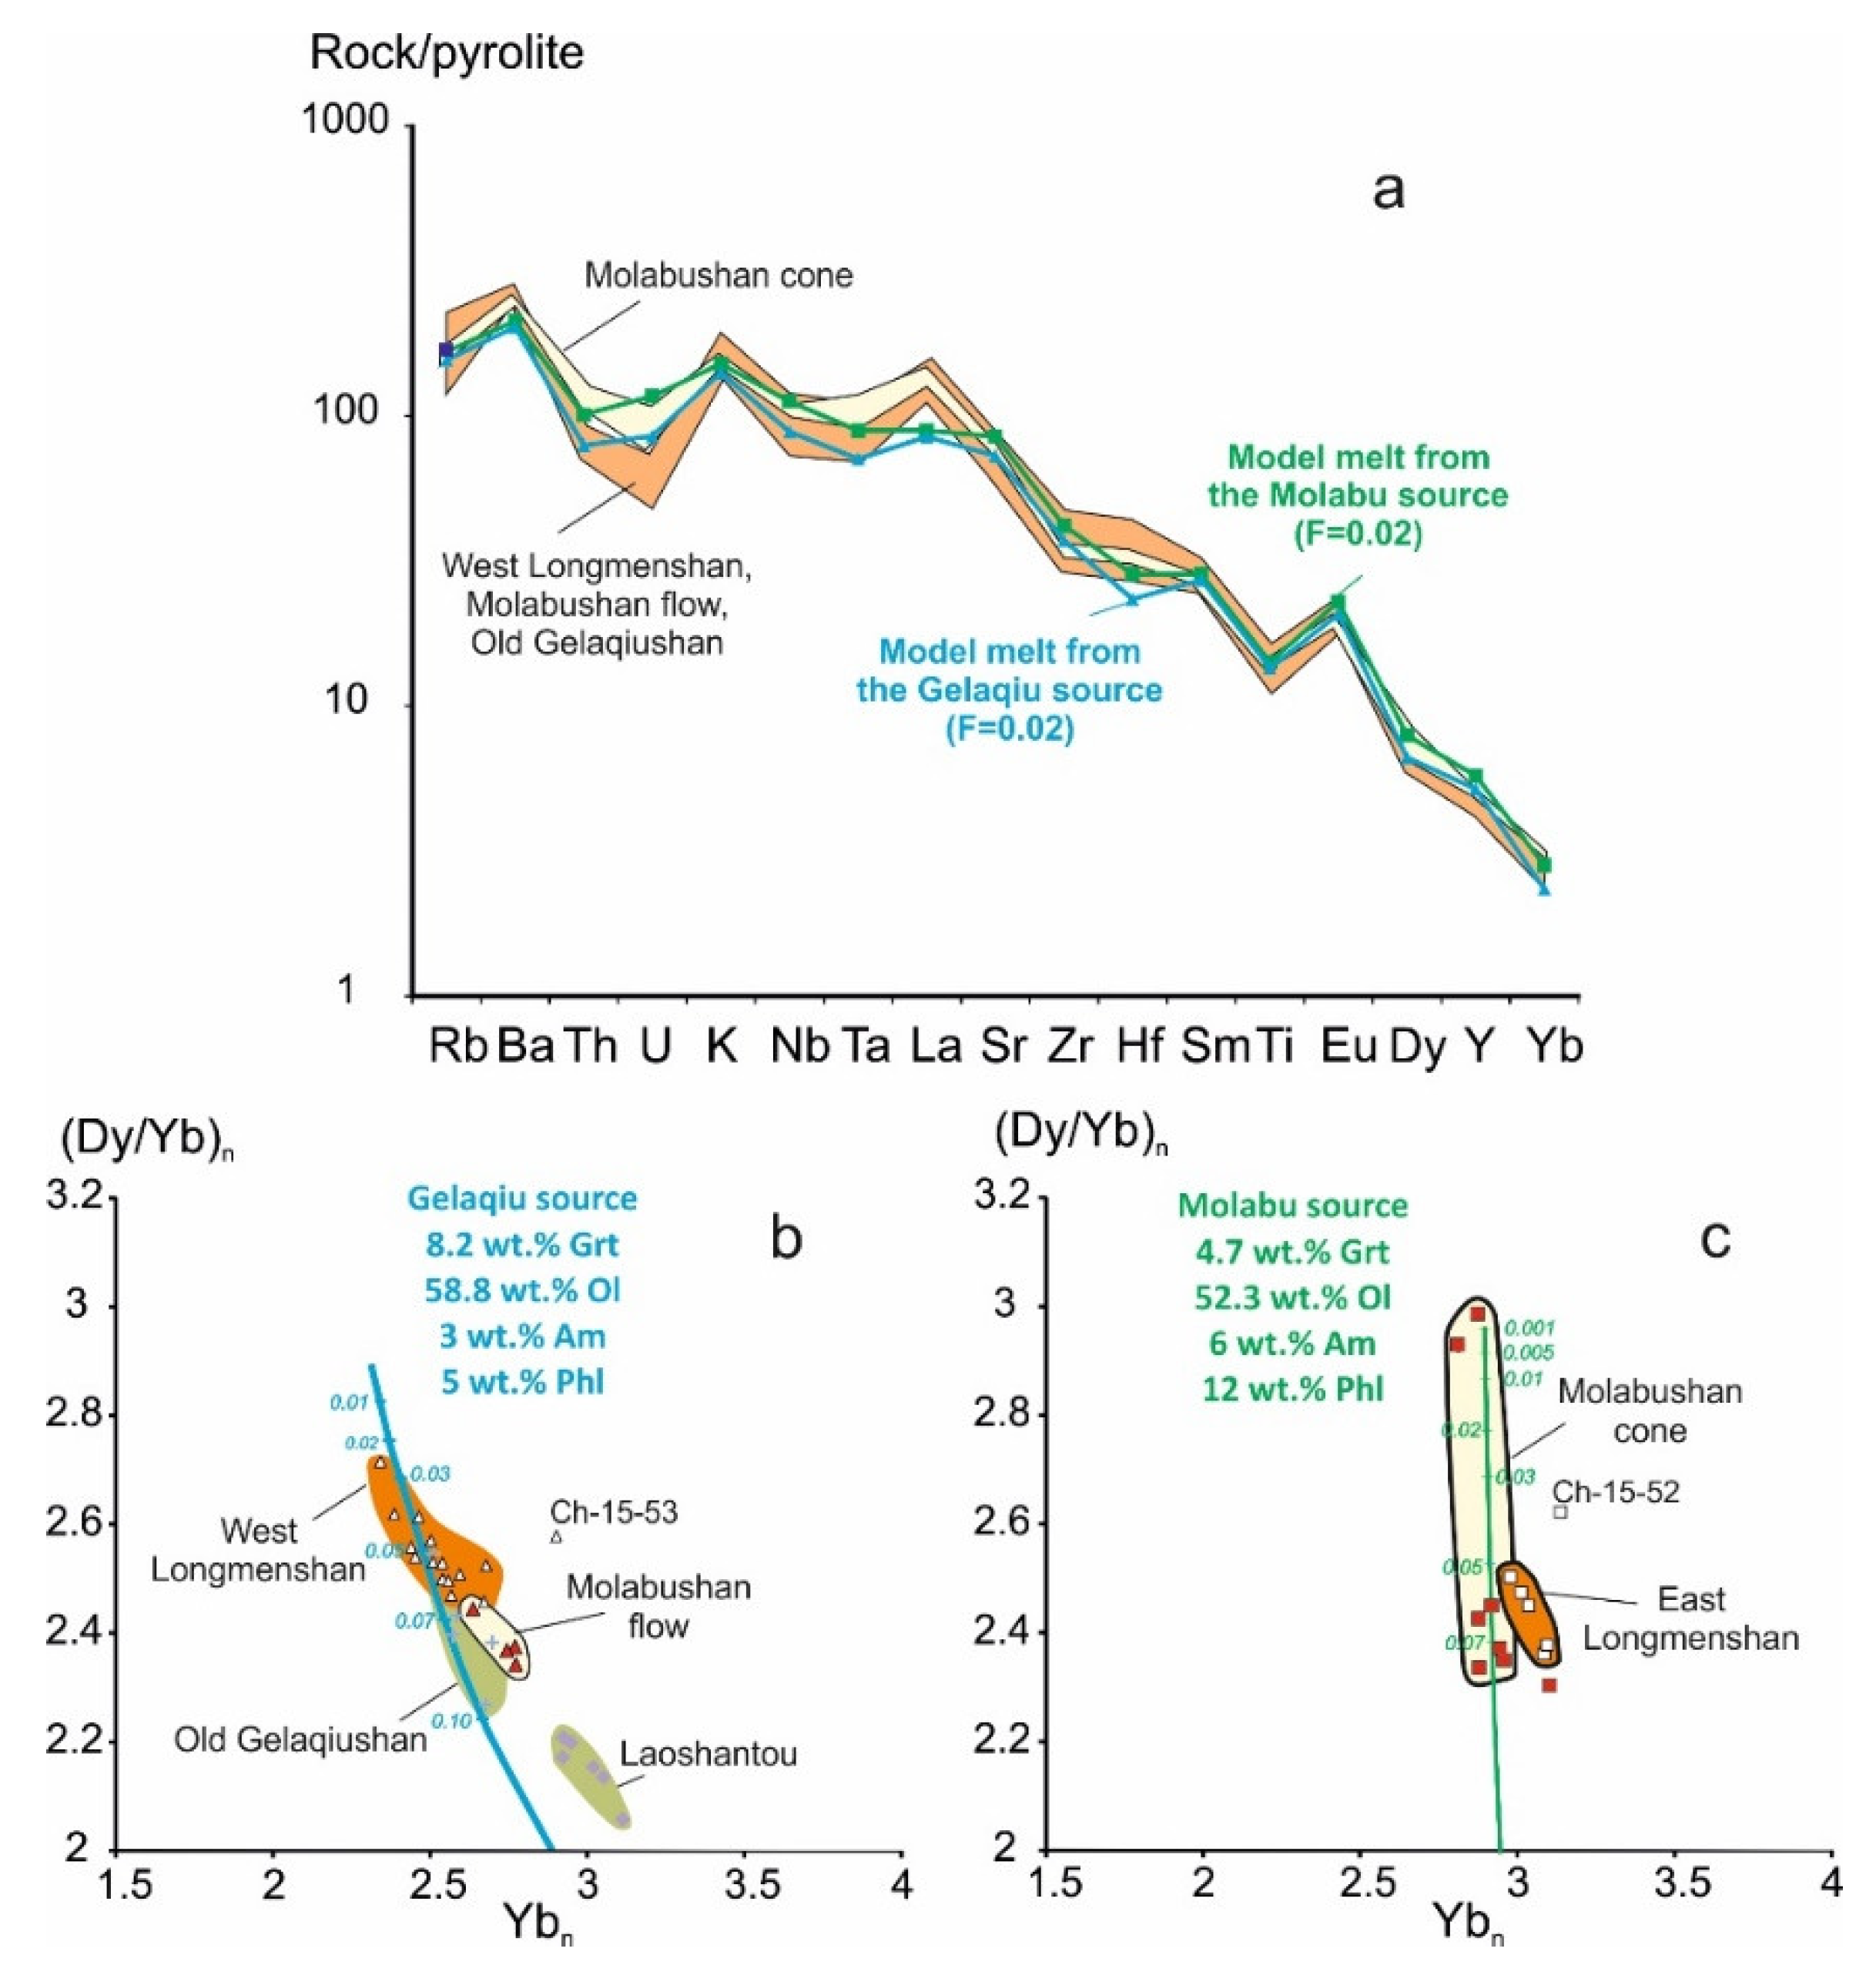
5.3. Trace-Element Modeling of Batch Partial Melting

Compositional difference between sources of the convective and lithospheric mantle reservoirs beneath Wudalianchi is estimated through simulation of the equilibrium partial melting using the Shaw equation [58] for trace elements: Rb, Ba, Th, U, K, Nb, Ta, La, Sr, Zr, Hf, Sm, Ti, Eu, Dy, Y, and Yb (Figure 17a). The equation solution yielded trace-element concentrations in a source. The source was assumed to consist of: (1) the undifferentiated mantle (pyrolite) [50] that satisfies the distribution of incompatible trace elements (Rb, Ba, K, La, etc.) in olivine, orthopyroxene, clinopyroxene, garnet, and (2) components of amphibole-phlogopite-apatite veins provided an additional budget of incompatible trace elements. The used trace-element concentrations in minerals were recalculated as average values from [59,60,61,62,63,64,65].
A set of mineral/melt distribution coefficients (D) was mostly from a previous compilation reported by Table 3 in [66]. Distribution coefficients and trace-element abundances for apatite, amphibole, and phlogopite were used after [66], except of the DCpx/melt for La (0.044) and DPhl/melt for Rb (2.48) were taken from [67] and [63], respectively. In a garnet-bearing source, La/Yb, Gd/Yb, and Dy/Yb in melts increased with the decreasing of the melt fraction. Using the (La/Yb)n ratio might yield confusing results due to one order variations of La concentration in mica and amphibole of the same type of rock [62,64]. To avoid this uncertainty, the degrees of partial melting in sources were estimated from relations between (Dy/Yb)n and Ybn (Figure 17b,c).
The diagrams of Figure 17 clearly trace the compositions of the Gelaqiu and Molabu model sources (melting of the lithospheric and convective mantle, respectively). The melting trend of the Gelaqiu model source shows a reverse slope (i.e., decrease of Yb with increase of the Dy/Yb ratio) that is governed by predominant melting of clinopyroxene and garnet (Table 3). In such a source, the proportions of minerals were: 8.2 wt.% Grt, 58.8 wt.% Ol, 3 wt.% Am, 5 wt.% Phl, 10 wt.% Opx, 15 wt.% Cpx, and 0.03 wt.% Ap. The melting trend of the Molabu model source is characterized by wide variations in the (Dy/Yb)n at a sustained content of Ybn. In such a source, the proportion of garnet decreases and those of phlogopite and amphibole increase (4.7 wt.% Grt, 52 wt.% Ol, 6 wt.% Am, and 12 wt.% Phl).

6. Conclusions

In this paper, we have intended to explain anomalously wide variations of Pb abundances in rocks from the Molabushan cone and East Longmenshan volcano using trace-element and Pb isotopic data. We defined lithospheric components in the Laoshantou and Old Gelaqiushan lava flows due to common secondary isochron of their rocks with a slope corresponding to an age of 1.88 Ga. The Laoshantou and Gelaqiu sources produced low-Mg liquids at the time interval of initial volcanic activity in Wudalianchi at ca. 2.5 and 2.0 Ma ago. The younger Molabushan and Longmenshan volcanoes also had low-Mg units derived through melting of the Gelaqiu-like source material. The West Longmenshan volcano, which produced material from this kind of source, began erupting since 1.3 Ma ago. The Molabushan and East Longmenshan volcanoes, which exhibited moderate-Mg liquids, were active only in the past 0.6 Ma. Rocks from the Molabushan cone yielded a secondary isochron with a flat slope that designates liquids from the recent convectively-homogenized Molabu source (Figure 18).
We infer that the Laoshantou and Gelaqiu lithospheric mantle sources are associated with the common reservoir that is defined in the Cenozoic volcanic rocks of East Asia. From the Ce/Pb, Th/Yb, and Ta/Yb ratios of low- and moderate-Mg rock groups, we suggest that the old lithospheric Laoshantou and Gelaqiu sources formed due to differentiation of the enriched sub-continental mantle and that the recent Molabu source likely derived from similar mantle material.
We assessed peculiar geochemical signatures of moderate-Mg rocks such as an increase of Ce/Pb from 8 to 47, Th/Pb from 0.5 to 2.6, U/Pb from 0.07 to 0.46, 206Pb/204Pb from 16.900 to 17.246, 207Pb/204Pb from 15.437 to 15.466, and 208Pb/204Pb from 37.146 to 37.453. Furthermore, we demonstrate a change of rock compositions from the Molabushan cone to East Longmenshan in terms of decreasing S, Ni concentrations, Ni/Co, and Ni/MgO ratios. All these variations provide evidence for modification of liquids from the recent homogeneous Molabu source by the efficient extraction of sulfides.

Supplementary Materials

The following are available online at https://0-www-mdpi-com.brum.beds.ac.uk/2075-163X/10/4/319/s1, Table S1: Analytical results on volcanic rocks from initial flows and Molabushan, Longmenshan volcanoes.

Author Contributions

Conceptualization, S.R.; Methodology, Software, I.C., T.Y., and Y.-M.S.; Validation, S.R., Y.-M.S., I.C., T.Y., C.Y., Z.X., E.S., N.G., and T.V.; Formal Analysis, S.R., Y.-M.S., I.C., and T.Y.; Investigation, S.R., Y.-M.S., I.C., C.Y., and Z.X.; Resources, S.R., C.Y., and Z.X.; Data Curation, S.R., T.Y., E.S., N.G., T.V.; Writing—Original Draft Preparation, S.R., T.Y., Y.-M.S., I.C., N.G., E.S., and T.V.; Writing—Review & Editing, S.R., Y.-M.S., I.C., and T.Y.; Visualization, S.R., Y.-M.S., I.C., and T.Y.; Supervision, S.R. and I.C.; Project Administration, I.C.; Funding Acquisition, I.C., S.R. (Russia), Z.X., C.Y., Y.-M.S. (China). All authors have read and agreed to the published version of the manuscript.

Funding

This work was funded by the RSF grant 18-77-10027 (I. Chuvashova, S. Rasskazov) and grants D201800026 and DWHE2018SH01, D201800026, P192011009 from Heilongjiang Administration of Foreign Experts Affairs, DWHE2018SH01, DWHE2019SH01 from Heilongjiang Academy of Sciences (Zhenhua Xie, Yi-Min Sun).

Acknowledgments

Field studies of volcanoes were organized by the Chinese-Russian Wudalianchi-Baikal Research Center on recent volcanism and environment. Analyses were performed using equipment from collective centers in Irkutsk: “Ultramicroanalysis” (Agilent 7500 ce mass spectrometer and scanning electron microscope Quanta–200, Limnological institute of SB RAS, assistant analysts: M.E. Markova, A.P. Chebykin, K. Arsentev) and “Isotope-geochemical studies” (MC-ICP-MS Neptune Plus, Vinogradov Institute of Geochemistry SB RAS), and “Geodynamics and geochronology” (wave dispersive Bruker S8 TIGER X-ray spectrometer, Institute of the Earth’s Crust, analyst S.I. Shtelmakh). Major oxides were determined by “wet analytical methods” by analysts G.V. Bondareva and M.M. Samoilenko (Institute of the Earth’s Crust). We are grateful to all of the analysts who assisted in this work as well as to the Academic Editor and anonymous reviewers for their constructive discussion of the manuscript.

Conflicts of Interest

The authors declare no conflicts of interest.

References

  1. Zhang, M.; Menzies, M.A.; Suddaby, P.; Thirlwall, M.F. EM1 signature from the post-Archaean subcontinental lithospheric mantle: Isotopic evidence from the potassic volcanic rocks in NE China. Geochem. J. 1991, 25, 387–398. [Google Scholar] [CrossRef]
  2. Zhang, M.; Suddaby, P.; Thompson, R.N.; Thirlwall, M.F.; Menzies, M.A. Potassic rocks in NE China: Geochemical constraints on mantle source and magma genesis. J. Petrol. 1995, 36, 1275–1303. [Google Scholar] [CrossRef] [Green Version]
  3. Wang, Y.; Chen, H. Tectonic controls on the Pleistocene-Holocene Wudalianchi volcanic field (northeastern China). J. Asian Earth Sci. 2005, 24, 419–431. [Google Scholar] [CrossRef]
  4. Basu, A.R.; Junwen, W.; Wankang, H.; Guanghong, X.; Tatsumoto, M. Major element, REE, and Pb, Nd and Sr isotopic geochemistry of Cenozoic volcanic rocks of eastern China: Implications for their origin from suboceanic-type mantle reservoirs. Earth Planet. Sci. Lett. 1991, 105, 149–169. [Google Scholar] [CrossRef]
  5. Tatsumoto, M.; Basu, A.R.; Wankang, H.; Junwen, W.; Guanghong, X. Sr, Nd, and Pb isotopes of ultramafic xenoliths in volcanic rocks of east China: Enriched components EMI and EMII in subcontinental lithosphere. Earth Planet. Sci. Lett. 1992, 113, 107–128. [Google Scholar] [CrossRef]
  6. Zou, H.; Zindler, A.; Xu, X.; Qi, Q. Major, trace element, and Nd, Sr, and Pb isotope studies of Cenozoic basalts in SE China: Mantle sources, regional variations, and tectonic significance. Chem. Geol. 2000, 171, 33–47. [Google Scholar] [CrossRef] [Green Version]
  7. Choi, S.H.; Mukasa, S.B.; Kwon, S.-T.; Andronikov, A.V. Sr, Nd, Pb and Hf isotopic compositions of late Cenozoic alkali basalts in South Korea: Evidence for mixing between the two dominant asthenospheric mantle domains beneath East Asia. Chem. Geol. 2006, 232, 134–151. [Google Scholar] [CrossRef]
  8. Chen, Y.; Zhang, Y.; Graham, D.; Su, S.; Deng, J. Geochemistry of Cenozoic basalts and mantle xenoliths in Northeast China. Lithos 2007, 96, 108–126. [Google Scholar] [CrossRef]
  9. Rasskazov, S.V.; Yasnygina, T.A.; Chuvashova, I.S. Mantle sources of the Cenozoic volcanic rocks of East Asia: Derivatives of slabs, the sub-lithospheric convection, and the lithosphere. Russ. J. Pac. Geol. 2014, 8, 360–378. [Google Scholar] [CrossRef]
  10. Liu, J.-Q.; Chen, L.-H.; Wang, X.-J.; Zhong, Y.; Yu, X.; Zeng, G.; Erdmann, S. The role of melt-rock interaction in the formation of Quaternary high-MgO potassic basalt from the Greater Khingan Range, northeast China. J. Geophys. Res. Solid Earth 2017, 122, 1–19. [Google Scholar] [CrossRef]
  11. Zhou, X.-H.; Zhu, B.-Q.; Liu, R.-X.; Chen, W.-J. Cenozoic basaltic rocks in Eastern China. Continental flood basalts. Kluwer Acad. Publ. 1988, 311–330. [Google Scholar]
  12. Wang, Y.; Mu, L.; Liu, W. Regularity and characteristic of volcanic activity at Wudalianchi, Heilongjiang. In Proceedings of the 30th International Geological Congress, Beijing, China, 4–14 August 1996. [Google Scholar]
  13. Liu, J.; Taniguchi, H. Active volcanoes in China. Northeast Asian Stud. 2001, 6, 173–189. [Google Scholar]
  14. Wei, H.; Sparks, R.S.J.; Liu, R.; Fan, Q.; Wang, Y.; Hong, H.; Zhang, H.; Chen, H.; Jiang, C.; Dong, J.; et al. Three active volcanoes in China and their hazards. J. Asian Earth Sci. 2003, 21, 515–526. [Google Scholar] [CrossRef]
  15. Chuvashova, I.S.; Rasskazov, S.V.; Yasnygina, T.A.; Saranina, E.V.; Fefelov, N.N. Holocene volcanism in Central Mongolia and Northeast China: Asynchronous decompression and fluid melting of the mantle. Volcanol. Seismol. 2007, 1, 19–45. [Google Scholar] [CrossRef]
  16. McGee, L.E.; McLeod, C.; Davidson, J.P. A spectrum of disequilibrium melting preserved in lava-hosted, partially melted crustal xenoliths from the Wudalianchi volcanic field, NE China. Chem. Geol. 2015, 417, 184–199. [Google Scholar] [CrossRef]
  17. Sun, C.; Németh, K.; Zhan, T.; You, H.; Chu, G.; Liu, J. Tephra evidence for the most recent eruption of Laoheishan volcano, Wudalianchi volcanic field, northeast China. J. Volcanol. Geotherm. Res. 2019, 383, 103–111. [Google Scholar] [CrossRef]
  18. Lightfoot, P.C.; Keays, R.R. Siderophile and chalcophile metal variations in flood basalts from the Siberian Trap, Noril’sk region: Implication for the origin of the Ni–Cu–PGE sulfide ores. Econ. Geol. 2005, 100, 439–462. [Google Scholar] [CrossRef]
  19. Hart, S.R.; Gaetani, G.A. Mantle paradoxes: The sulfide solution. Contrib. Mineral. Petrol. 2006, 152, 295–308. [Google Scholar] [CrossRef]
  20. Song, X.-Y.; Zhou, M.-F.; Keays, R.R.; Cao, Z.-M.; Sun, M.; Qi, L. Geochemistry of the Emeishan flood basalts at Yangliuping, Sichuan, SW China: Implications for sulfide segregation. Contrib. Mineral. Petrol. 2006, 152, 53–74. [Google Scholar] [CrossRef]
  21. Kiseeva, E.S.; Wood, B.J. A simple model for chalcophile element partitioning between sulphide and silicate liquids with geochemical applications. Earth Planet. Sci. Lett. 2013, 383, 68–81. [Google Scholar] [CrossRef]
  22. Mao, Y.J.; Qin, K.Z.; Barnes, S.J.; Ferraina, C.; Iacono-Marziano, G.; Verrall, M.; Tang, D.; Xue, S. A revised oxygen barometry in sulfide-saturated magmas and application to the Permian magmatic Ni–Cu deposits in the southern Central Asian Orogenic Belt. Miner. Depos. 2018, 53, 731–755. [Google Scholar] [CrossRef]
  23. Grinenko, L.N. Sources of sulfur of the nickeliferous and barren gabbrodolerite intrusions of the northwest Siberian platform. Int. Geol. Rev. 1985, 27, 695–708. [Google Scholar] [CrossRef]
  24. Wallace, P.; Carmichael, I.S.E. Sulfur in basaltic magmas. Geochim. Cosmochim. Acta 1992, 56, 1863–1874. [Google Scholar] [CrossRef]
  25. Holzheid, A.; Grove, T.L. Sulfur saturation limits in silicate melts and their implications for core formation scenarios for terrestrial planets. Am. Mineral. 2002, 87, 227–237. [Google Scholar] [CrossRef]
  26. Almukhamedov, A.I.; Medvedev, A.Y. Sulfur Geochemistry in the Processes of Evolution of Basic Magmas; Nauka Publisher: Moscow, Russia, 1982. (In Russian) [Google Scholar]
  27. Zhang, M.; O’Reilly, S.Y.; Wang, K.-L.; Hronsky, J.; Griffin, W.L. Flood basalts and metallogeny: The lithospheric mantle connection. Earth-Sci. Rev. 2008, 86, 145–174. [Google Scholar] [CrossRef]
  28. Fleet, M.E.; MacRae, N.D. Partition of Ni between olivine and sulfide: Equilibria with sulfide-oxide liquids. Contrib. Mineral. Petrol. 1988, 100, 462–469. [Google Scholar] [CrossRef]
  29. Rasskazov, S.; Xie, Z.; Yasnygina, T.; Chuvashova, I.; Wang, X.; Arsentev, K.; Sun, Y.-M.; Fang, Z.; Zeng, Y. Geochemical and clay-mineral study of healing mud from Wudalianchi, NE China. Geodyn. Tectonophys. 2017, 8, 539–544. [Google Scholar] [CrossRef] [Green Version]
  30. Rasskazov, S.V.; Chuvashova, I.S.; Sun, Y.-M.; Yang, C.; Xie, Z.; Yasnygina, T.A.; Saranina, E.V.; Zhengxing, F. Sources of Quaternary potassic volcanic rocks from Wudalianchi, China: Control by transtension at the lithosphere–asthenosphere boundary layer. Geodyn. Tectonophys. 2016, 7, 495–532. [Google Scholar] [CrossRef] [Green Version]
  31. Liu, J.; Han, J.; Fyfe, W.S. Cenozoic episodic volcanism and continental rifting in northeast China and possible link to Japan Sea development as revealed from K–Ar geochronology. Tectonophysics 2001, 339, 385–401. [Google Scholar] [CrossRef]
  32. Ma, K.; Zhou, Z.; Li, X.; Liu, J.; Li, J.; Wood, C.; Xu, H.; Yang, R.; Zhuang, Y.; Xiao, S.; et al. Guide Book for Field Mission to Wudalianchi National Park, China; Wudalianchi National Park; Nature Management Committee Heilongjiang Province: Wudalianchi, China, 2010. [Google Scholar]
  33. Zhao, Y.-W.; Li, N.; Fan, Q.-C.; Zou, H.; Xu, Y.-G. Two episodes of volcanism in the Wudalianchi volcanic belt, NE China: Evidence for tectonic controls on volcanic activities. J. Volcanol. Geotherm. Res. 2014, 285, 170–179. [Google Scholar] [CrossRef]
  34. Rasskazov, S.V.; Chuvashova, I.S.; Yasnygina, T.A.; Fefelov, N.N.; Saranina, E.V. Potassic and Potassic-Sodic Volcanic Series in the Cenozoic of Asia; Academic Publishing House “GEO”: Novosibirsk, Russia, 2012. (In Russian) [Google Scholar]
  35. Yasnygina, T.A.; Markova, M.E.; Rasskazov, S.V.; Pakhomova, N.N. Determination of rare earth elements, Y, Zr, Nb, Hf, Ta, and Th in geological reference materials of the DV series by ICP-MS. Zavod. Lab. Diagn. Mater. 2015, 81, 10–20. (In Russian) [Google Scholar]
  36. Khudonogova, E.V.; Revenko, A.G.; Akulova, V.V.; Shtelmakh, S.I. The development of a method for determination of phosphorus oxide, sulfur and chlorine in soils and sedimentary rocks by the X-ray fluorescence analysis. In The Structure, Functioning, and Evolution OF Mountain Landscapes of the Western Baikal Region; IG; SB; RAS: Irkutsk, Russia, 2005; pp. 105–111. (In Russian) [Google Scholar]
  37. Kuritani, T.; Nakamura, E. Precise isotope analysis of nanogram-level Pb of natural rock samples without use of double spikes. Chem. Geol. 2002, 186, 31–43. [Google Scholar] [CrossRef]
  38. Rudge, J.; Reynolds, B.; Bourdon, B. The double spike toolbox. Chem. Geol. 2009, 265, 420–431. [Google Scholar] [CrossRef]
  39. Todt, W.; Cliff, R.A.; Hanser, A.; Hofmann, A.W. Evaluation of a 202Pb–205Pb double spike for high-precision lead isotope analysis. In Earth Processes; Reading the Isotope Code; Hart, S.R., Basu, A., Eds.; American Geophysical Union: Washington, DC, USA, 1996; Volume 95, pp. 429–437. [Google Scholar]
  40. Kamenov, G.D.; Perfit, M.R.; Jonasson, I.R.; Mueller, P.A. High precision Pb isotope measurements reveal magma recharge as a mechanism for ore deposit formation: Examples from Lihir Island and Conical seamount, Papua New Guinea. Chem. Geol. 2005, 219, 131–148. [Google Scholar] [CrossRef]
  41. Thirwall, M.F. Multicollector ICP-MS analysis of Pb isotopes using a 207Pb/204Pb double spike demonstrates up to 400 ppm/amu systematic errors in Tl-normalization. Chem. Geol. 2002, 184, 255–271. [Google Scholar] [CrossRef]
  42. Makishima, A.; Nath, B.N.; Nakamura, E. Precise determination of Pb isotope ratios by simple double spike MC-ICP-MS technique without Tl addition. J. Anal. At. Spectrom. 2007, 22, 407–410. [Google Scholar] [CrossRef]
  43. Tanimizu, M.; Ishikawa, T. Development of rapid and precise Pb isotope analytical techniques using MC-ICP-MS and new results for GSJ rock reference samples. Geochem. J. 2006, 40, 121–133. [Google Scholar] [CrossRef] [Green Version]
  44. Gomez-Tuena, A.; La Gatta, A.B.; Langmuir, C.H.; Goldstein, S.L.; Ortega-Gutierrez, F.; Carrasco-Núñez, G. Temporal control of subduction magmatism in the eastern Trans-Mexican Volcanic Belt: Mantle sources, slab contributions, and crustal contamination. Geochem. Geophys. Geosyst. 2003, 4, 1–33. [Google Scholar] [CrossRef]
  45. Woodhead, J.D.; Volkes, F.; McCulloch, M.T. Routine lead isotope determinations using a Lead–204—Lead–207 double spike: A long-term assessment of analytical precision and accuracy. Analyst 1995, 120, 35–39. [Google Scholar] [CrossRef]
  46. Le Bas, M.J.; Streckeisen, A.L. The IUGS systematics of igneous rocks. J. Geol. Soc. Lond. 1991, 148, 825–833. [Google Scholar] [CrossRef] [Green Version]
  47. Zartman, R.E.; Futa, K.; Peng, Z.C. A comparison of Sr–Nd–Pb isotopes in young and old continental lithospheric mantle: Patagonia and Eastern China. Aust. J. Earth Sci. 1991, 38, 545–557. [Google Scholar] [CrossRef]
  48. Ludwig, K.R. Using Isoplot/Ex, Version 2.01: A geochronological toolkit for Microsoft Excel. Berkeley Geochronol. Cent. Spec. Publ. 1999, 1, 47. [Google Scholar]
  49. Chu, Z.-Y.; Harvey, J.; Liu, C.-Z.; Guo, J.-H.; Wu, F.-Y.; Tian, W.; Zhang, Y.-L.; Yang, Y.-H. Source of highly potassic basalts in northeast China: Evidence from Re–Os, Sr–Nd–Hf isotopes and PGE geochemistry. Chem. Geol. 2013, 357, 52–66. [Google Scholar] [CrossRef]
  50. McDonough, W.F.; Sun, S.-S. The composition of the Earth. Chem. Geol. 1995, 120, 223–253. [Google Scholar] [CrossRef]
  51. Rudnick, R.L.; Fountain, D.M. Nature and composition of the continental crust: A lower crustal perspective. Rev. Geophys. 1995, 33, 267–309. [Google Scholar] [CrossRef] [Green Version]
  52. Brenan, J.M.; Caciagli, N.C. Fe–Ni exchange between olivine and sulphide liquid: Implications for oxygen barometry in sulphidesaturated magmas. Geochim. Cosmochim. Acta 2000, 64, 307–320. [Google Scholar] [CrossRef]
  53. Li, Y.; Audétat, A. Partitioning of V, Mn, Co, Ni, Cu, Zn, As, Mo, Ag, Sn, Sb, W, Au, Pb, and Bi between sulfide phases and hydrous basanite melt at upper mantle conditions. Earth Planet. Sci. Lett. 2012, 355–356, 327–340. [Google Scholar] [CrossRef]
  54. Koerber, A.J.; Thakurta, J. PGE-enrichment in magnetite-bearing olivine gabbro: New observations from the midcontinent rift-related Echo Lake intrusion in Northern Michigan, USA. Minerals 2019, 9, 21. [Google Scholar] [CrossRef] [Green Version]
  55. Hofmann, A.W.; Jochum, K.P.; Seufert, M.; White, W.M. Nb and Pb in oceanic basalts: New constraints on mantle evolution. Earth Planet. Sci. Lett. 1986, 79, 33–45. [Google Scholar] [CrossRef]
  56. Miller, D.M.; Goldstein, S.L.; Langmuir, C.H. Cerium/lead and lead isotope ratios in arc magmas and the enrichment of lead in the continents. Nature 1994, 368, 514–519. [Google Scholar] [CrossRef]
  57. Pearce, J.A. Role of the sub-continental lithosphere in magma genesis at active continental margins. In Continental Basalts and Mantle Xenoliths; Hawkesworth, C.L., Norry, M.J., Eds.; Shiva: Nantwich, UK, 1983; pp. 230–249. [Google Scholar]
  58. Shaw, D.M. Trace element fractionation during anatexis. Geochim. Cosmochim. Acta 1970, 34, 237–243. [Google Scholar] [CrossRef]
  59. Ashchepkov, I.V.; Travin, A.V.; Saprykin, A.I.; Andre, L.; Gerasimov, P.A.; Khmelnikova, O.S. Age of xenolith-bearing basalts and mantle evolution in the Baikal rift zone. Russ. Geol. Geophys. 2003, 44, 1121–1149. [Google Scholar]
  60. Ashchepkov, I.V.; Andre, L.; Downes, H.; Belyatsky, B.A. Pyroxenites and megacrysts from Vitim picrite–basalts (Russia): Polybaric fractionation of rising melts in the mantle? J. Asian Earth Sci. 2011, 42, 14–37. [Google Scholar] [CrossRef]
  61. Glaser, S.M.; Foley, S.F.; Günter, D. Trace element compositions of minerals in garnet and spinel peridotite xenoliths from the Vitim volcanic field, Transbaikalia, eastern Siberia. Lithos 1999, 48, 263–285. [Google Scholar] [CrossRef]
  62. Ionov, D.A.; Griffin, W.L.; O’Reilly, S.Y. Volatile-bearing minerals and lithophile trace elements in the upper mantle. Chem. Geol. 1997, 141, 153–184. [Google Scholar] [CrossRef]
  63. La Tourrette, T.; Hervig, R.L.; Holloway, J.R. Trace element partitioning between amphibole, phlogopite and basanite melt. Earth Planet. Sci. Lett. 1995, 135, 13–30. [Google Scholar] [CrossRef]
  64. Litasov, K.D.; Foley, S.F.; Litasov, Y.D. Magmatic modification and metasomatism of the subcontinental mantle beneath the Vitim volcanic field (East Siberia): Evidence from trace element data on pyroxenite and peridotite xenoliths from Miocene picrobasalt. Lithos 2000, 54, 83–114. [Google Scholar] [CrossRef]
  65. O’Reilly, S.Y.; Griffin, W.L. Apatite in the mantle: Implications for metasomatic processes and high heat production in Phanerozoic mantle. Lithos 2000, 53, 217–232. [Google Scholar]
  66. Chuvashova, I.; Rasskazov, S.; Yasnygina, T. Mid-Miocene thermal impact on the lithosphere by sub-lithospheric convective mantle material: Transition from high- to moderate-Mg magmatism beneath Vitim Plateau, Siberia. Geosci. Front. 2017, 8, 753–774. [Google Scholar] [CrossRef] [Green Version]
  67. Foley, S.F.; Jackson, S.E.; Fryer, B.J.; Greenough, I.D.; Jenner, G.A. Trace element partition coefficients for clinopyroxene and phlogopite in an alkaline lamprophyre from Newfoundland by LAM-ICP-MS. Geochim. Cosmochim. Acta. 1996, 60, 629–638. [Google Scholar] [CrossRef]
Figure 1. Location of the Wudalianchi volcanic field on the active continental margin of Eurasia (a), spatial position of Molabushan and Longmenshan volcanoes relative to the older Laoshantou and Old Gelaqiushan flows (b), and grouping of volcanoes (c).
Minerals 10 00319 g001
Figure 2. Activities of the Molabushan and Longmenshan volcanoes relative to a sequence of eruptions in the Central Group of volcanoes and older lava flows. A time range of the initial flows is highlighted by the green color. Propagated eruptions are designated with a blue stripe and red arrows. The scheme is modified after [32] using additional data [33] and references therein.
Minerals 10 00319 g002
Figure 3. Photos of the volcanoes: (a) Longmenshan (view from the north), (b) Molabushan (view from the west).
Minerals 10 00319 g003
Figure 4. Location of sampling sites in the Molabushan (a) and Longmenshan (b) volcanoes.
Minerals 10 00319 g004
Figure 5. Variations of MgO versus SiO2 in low- and moderate-Mg rocks from the Molabushan and Longmenshan volcanoes compared to those from older lava flows. The data used were from Table 2 and Table S1. Anhydrous compositions were recalculated to 100%.
Minerals 10 00319 g005
Figure 6. Division of low- and moderate-Mg rocks on Na2O + K2O versus SiO2 (a) and K2O/Na2O versus SiO2 (b) diagrams. Symbols are as in Figure 5. In diagram (b), the classification fields of the International Union of Geological Sciences (IUGS) are shown after [46]. Anhydrous compositions were recalculated to 100%.
Minerals 10 00319 g006
Figure 7. Division of low- and moderate-Mg rocks on a diagram of CIPW normative minerals. Symbols are as in Figure 5. Normative minerals: ne—nepheline, hy—hypersthene, qz—quartz, an—anorthite, ab—albite.
Minerals 10 00319 g007
Figure 8. Diagrams of 207Pb/204Pb versus 206Pb/204Pb ratios (a,a’) and 208Pb/204Pb versus 206Pb/204Pb ratios (b,b’). Symbols are as in Figure 5. Calculation of the secondary isochron was performed using the Isoplot program [48]. To demonstrate mixing relations between the Gelaqiu and Molabu sources, additional data for moderate-Mg rocks from the Bijiashan and Laoheishan volcanoes [2,6] are plotted by blue triangles. Insets (a’) and (b’) indicate positions of diagrams (a) and (b) (red rectangles) relative to the whole range of East China volcanic rocks and end members of ocean basalts: DMM (Depleted MORB Mantle), EM1, EM2 (Enriched Mantle 1, 2) as well as relative to the BSE (Bulk Silicate Earth), Geochron, and NHRL [48]. The field of East China basalts and data of Pb isotopic ratios of rocks from Linju, Shandong Province are shown after [47]. The East Asian common reservoir (206Pb/204Pb = 17.55; 207Pb/204Pb = 15.52; 208Pb/204Pb = 37.76) is indicated after [9]. Slopes of reference lines, which approximate data points of sources, are explained in the text.
Minerals 10 00319 g008
Figure 9. Pb isotopic ratios versus MgO diagrams, (a) 208Pb/204Pb ratios; (b) 207Pb/204Pb ratios; (c) 206Pb/204Pb ratios. Symbols are as in Figure 5.
Minerals 10 00319 g009aMinerals 10 00319 g009b
Figure 10. Pyrolite-normalized trace-element patterns of rocks from older flows and key samples of moderate-Mg rocks from the Molabushan cone and East Longmenshan volcano. Samples CH-15-65 and CH-15-41 showed the lowest and highest Pb concentrations, respectively. Typical continental crust compositions are shown for comparison. Normalizing values are after [50] (Pb = 150 ppb), continental crust compositions are after [51].
Minerals 10 00319 g010
Figure 11. Pb versus MgO diagram. Symbols are as in Figure 5.
Minerals 10 00319 g011
Figure 12. 208Pb/204Pb versus Th/U (a) and 206Pb/204Pb, 207Pb/204Pb versus U/Pb (b,c). Symbols are as in Figure 5. The two purple arrows in each graph indicate an array of modified compositions resulting from the introduction of the sulfur-silicate component with elevated Pb isotopic ratios into the primary melt of the Molabu source.
Minerals 10 00319 g012
Figure 13. S versus Ni/Co (a,c) and Ni/MgO (b,d) diagrams. Symbols are as in Figure 5.
Minerals 10 00319 g013
Figure 14. Ni versus MgO diagram. Symbols are as in Figure 5. East Longmenshan data points show a shift relative to the Molabushan ones that might be due to the effective extraction of sulfides from melts of the Molabu source.
Minerals 10 00319 g014
Figure 15. Ce/Pb versus 206Pb/204Pb diagram. Symbols are as in Figure 5 and Figure 12.
Minerals 10 00319 g015
Figure 16. Th/Yb versus Ta/Yb diagrams that demonstrate deviations of Wudalianchi rocks from the MORB and OIB array (a) and the continental crust compositions (LC—lower, MC—middle, UC—upper, TC—total) (b). Symbols are as in Figure 5. The bi-directional dark-blue arrow on (b) shows the advanced generation of a restite signature from the OIB source due to separation of a complementary component (CC) after [30].
Minerals 10 00319 g016
Figure 17. Results of trace-element modeling of equilibrium melting on the diagrams of normalized trace-element patterns (a) and (Dy/Yb)n versus Ybn (b,c). Symbols are as in Figure 5. Abbreviations: Ol—olivine, Opx—orthopyroxene, Cpx—clinopyroxene, Phl—phlogopite, Am—amphibole, Ap—apatite. In the Gelaqiu and Molabu model sources, variable proportions of minerals, indicated on the diagrams (b,c), are complemented by a constant proportion of minerals: Opx 10 wt.%, Cpx 15 wt.%, Ap 0.03 wt.%. Numbers in italics indicate the degree of partial melting (F). Melting of moderate-Mg rocks from East Longmenshan and Laoshantou trachyandesites are not modeled because of later modifications. Pyrolite normalization is after [50].
Minerals 10 00319 g017
Figure 18. Initial eruptions of liquids from the individual lithospheric Laoshantou and Gelaqiu sources generated beneath Wudalianchi at ca. 1.88 Ga ago (a) and subsequent eruptions of mixed liquids from the mantle lithospheric Gelaqiu and sub-lithospheric Molabu sources accompanied by extraction of sulfides from liquids of the latter (b). The position of the Molabu source below the Gelaqiu one is shown conventionally. This source might be a chamber within the lithospheric mantle.
Minerals 10 00319 g018
Table 1. Measured results for the SRM NBS-981 reference material obtained in different laboratories.
Method of Normalizing206Pb/204Pb207Pb/204Pb208Pb/204PbReferences
ID (TIMS)16.9356 ± 715.4891 ± 936.7006 ± 34[39]
ID (MC-ICP-MS)16.9377 ± 1415.4922 ± 2536.6941± 35This work
Tl (MC-ICP-MS)16.9369 ± 3915.4904 ± 3436.6949 ± 87[40]
ID (MC-ICP-MS)16.9376 ± 4615.4917 ± 3536.6986 ± 90MACQUARIE University,
GEMOC ANKC
ID (MC-ICP-MS)
Tl (MC-ICP-MS)
16.9417 ± 29
16.9356 ± 55
15.4996 ± 31
15.4911 ± 74
36.724 ± 9
36.697 ± 23
[41]
ID (MC-ICP-MS)16.9413 ± 1715.4983 ± 2736.7182 ± 38[42]
Tl (MC-ICP-MS)16.9308 ± 1015.4839 ± 1136.6743 ± 30[43]
ID (TIMS)16.9356 ± 4815.4912 ± 4736.702 ± 14[44]
ID (TIMS)16.936 ± 115.492 ± 236.705 ± 5[45]
Table 2. Representative data of volcanic rocks.
123456
SampleCH-15-43CH-15-39CH-15-66CH-15-58CH-15-19CH-16-135
PTBTAPTTABTATA
SiO2, wt.%48.4552.3147.8353.9852.7756.70
TiO22.592.592.352.472.242.08
Al2O312.8714.0113.1213.9514.4515.03
Fe2O39.993.179.722.713.283.09
FeO0.624.800.415.115.274.46
MnO0.150.130.130.100.090.10
MgO7.736.437.576.356.153.25
CaO7.305.908.195.565.765.23
Na2O3.753.443.483.482.993.81
K2O4.585.454.495.114.274.65
P2O50.970.961.010.940.880.79
H2O0.110.060.120.070.310.10
H2O+0.810.661.430.531.540.73
Total99.9299.9199.85100.36100.01100.03
Be, ppm3.13.12.82.73.03.6
Stot28027013070<6070
Sc13.111.214.810.816.513.2
V144119158127118102
Co383039313122
Ni18316715017715742
Cu303035422726
Zn857711622676128
Rb88.697.9105.895.968.386.7
Sr145514311467144615191111
Y22.620.423.318.919.620.4
Zr359394322371409402
Nb75.356.668.149.756.440.1
Cs0.940.811.190.470.700.52
Ba167117141708175317841176
La94.183.191.977.780.985.4
Ce164149166144146159
Pr18.4716.6818.616.416.417.2
Nd69.363.568.961.062.462.0
Sm11.3910.5711.6710.5110.3410.16
Eu3.132.913.222.842.882.70
Gd9.008.059.147.997.877.49
Tb1.111.051.141.021.001.02
Dy4.704.385.024.304.174.38
Ho0.820.750.870.730.740.76
Er1.891.742.041.611.671.76
Yb1.271.221.311.131.141.30
Lu0.160.160.190.170.140.18
Hf9.249.898.229.3910.319.96
Ta3.752.793.822.712.742.34
Pb12.812.83.711.912.713.3
Th9.287.049.316.346.446.39
U1.661.361.471.141.021.04
206Pb/204Pb17.1469 ± 1116.9000 ± 1317.2420 ± 2116.8707 ± 1716.8860 ± 1316.5903 ± 24
207Pb/204Pb15.4372 ± 1015.4468 ± 1315.4563 ± 1915.4515 ± 1615.4465 ± 1415.4120 ± 22
208Pb/204Pb37.2631 ± 2736.9245 ± 3437.4077 ± 4936.8949 ± 3936.8779 ± 3636.6785 ± 53
1–2, Molabushan volcano: 1—cone, 2—flow; 3—East Longmenshan volcano; 4—West Longmenshan volcano; 5—Old Gelaqiushan flow; 6—Laoshantou flow. PT—phonotephrite, BTA—basaltic trachyandesite, TA—trachyandesite. The whole dataset is shown in the Table S1. LOI (loss on ignition) is composed of a fraction extracted by drying of a sample under the temperature of 100 °C (H2O) and another one by heating of a sample under the temperature of 900 °C (H2O+).
Table 3. Compositions of model sources for Wudalianchi liquids (batch partial melting).
SourceGelaqiuMolabu Source
WiXiWiXi
Ol0.58770.09970.52270.3297
Opx0.10.10.10.1
Cpx0.150.470.150.25
Grt0.0820.250.0470.14
Phl0.050.050.120.12
Am0.030.030.060.06
Ap0.00030.00030.00030.0003
F0.02–0.06 (West Longmenshan)
0.05–0.10 (Old Gelaqiushan)
0.001–0.08 (Molabushan cone)
Wi—proportions of minerals in model source material, Xi—proportions of minerals consumed by the melt. The melting trends are shown in the (Dy/Yb)n versus Ybn diagrams (Figure 17b,c). F—melt fraction calculated using the (Dy/Yb)n—Ybn relation.

