Article

Tectonic Evolution of the West Bogeda: Evidences from Zircon U-Pb Geochronology and Geochemistry Proxies, NW China

1
State Key Laboratory of Marine Geology, Tongji University, Shanghai 200092, China
2
School of Geography, Geomatics and Planning, Jiangsu Normal University, Xuzhou 221116, China
3
School of geological and mining engineering, Xinjiang University, Urumqi 830047, China
4
The First Institute of Oceanography, Soa, Qingdao 266000, China
5
School of Energy Resource, China University of Geosciences (Beijing), Beijing 100083, China
*
Author to whom correspondence should be addressed.
Submission received: 2 March 2020 / Revised: 8 April 2020 / Accepted: 8 April 2020 / Published: 10 April 2020

Abstract

:
The Bogeda Shan (Mountain) is in southern part of the Central Asian Orogenic Belt (CAOB) and well preserved Paleozoic stratigraphy, making it an ideal region to study the tectonic evolution of the CAOB. However, there is a long-standing debate on the tectonic setting and onset uplift of the Bogeda Shan. In this study, we report detrital zircon U-Pb geochronology and whole-rock geochemistry of the Permian sandstone samples, to decipher the provenance and tectonic evolution of the West Bogeda Shan. The Lower-Middle Permian sandstone is characterized by a dominant zircon peak age at 300–400 Ma, similar to the Carboniferous samples, suggesting their provenance inheritance and from North Tian Shan (NTS) and Yili-Central Tian Shan (YCTS). While the zircon record of the Upper Permian sandstone is characterized by two major age peaks at ca. 335 Ma and ca. 455 Ma, indicating the change of provenance after the Middle Permian and indicating the uplift of Bogeda Shan. The initial uplift of Bogeda Shan was also demonstrated by structural deformations and unconformity occurring at the end of Middle Permian. The bulk elemental geochemistry of sedimentary rocks in the West Bogeda Shan suggests the Lower-Middle Permian is mostly greywacke with mafic source dominance, and tectonic setting changed from the continental rift in the Early Permian to post rift in the Middle Permian. The Upper Permian mainly consists of litharenite and sublitharenite with mafic-intermediate provenances formed in continental island arcs. The combined evidences suggest the initial uplift of the Bogeda Shan occurred in the Late Permian, and three stages of mountain building include the continental rift, post-rift extensional depression, and continental arc from the Early, Middle, to Late Permian, respectively.

1. Introduction

The Central Asian Orogenic Belt (CAOB) is located between the Siberia Craton to the north and the Tarim and North China Craton to the south. It is regarded as the largest (extending 7000 km from west to east) accretionary orogenic belt on Earth. It was formed by a series of amalgamation events of several micro-continents and island arcs during the Late Carboniferous to Permian periods (Figure 1a) [1,2,3]. The Tian Shan forms the southern part of the CAOB, with an average elevation of ca. 2000 m and summits >7000 m. It is the key orogenic belt to study the tectonic evolution of the CAOB due to its well-preserved stratigraphic units of ophiolites, volcanic rocks, granitoids, high-grade metamorphic rocks, and sedimentary sequences [4,5,6,7]. The Chinese Tian Shan can be further divided into three different tectonic units, including the North Tian Shan (NTS), Yili-Central Tian Shan (YCTS), and South Tian Shan (STS) from north to south [8,9]. Among them, the NTS, especially the Bogeda Shan in the northeast, are considered as the essential part and an ideal region to examine the evolution of the CAOB due to its well-preserved and exposed Late Paleozoic to Mesozoic strata.
The Late Paleozoic witnessed significant climate and tectonic changes in Northwest China, including the Bogeda region. Despite previous research on the tectonic evolution of Bogeda Shan, the timing of initial uplift and its tectonic setting are still enigmatic. Some authors first suggested that a small-scale orogeny occurred in the Bogeda area during the Carboniferous [10], based on zircon U-Pb geochronology, while the initial uplift of the West Bogeda Shan occurred in the Late Permian [11,12]. However, other researchers suggested that the first significant uplift of Bogeda Shan occurred during the Early to Middle Jurassic, according to the configuration of sedimentary units [13,14,15]. Besides, the Late Jurassic has been considered as the most critical stage for the Bogeda Shan uplift [16,17,18]. As to the tectonic setting, two contrasting viewpoints exist, i.e., a continental rift or an island arc, and are still highly debated [19].
It is widely accepted that the Bogeda Shan was uplifted during the Mesozoic, but the onset time remains largely controversial. Therefore, this study aims to illustrate the provenances, tectonic setting, and evolution of the West Bogeda Shan during the Permian based on the integrated analyses of petrology, detrital zircon U-Pb geochronology, and bulk geochemistry of sedimentary rocks from the Lower to Upper Permian. The timing of the initial uplift of the Bogeda Shan will be revealed with all these analyses.

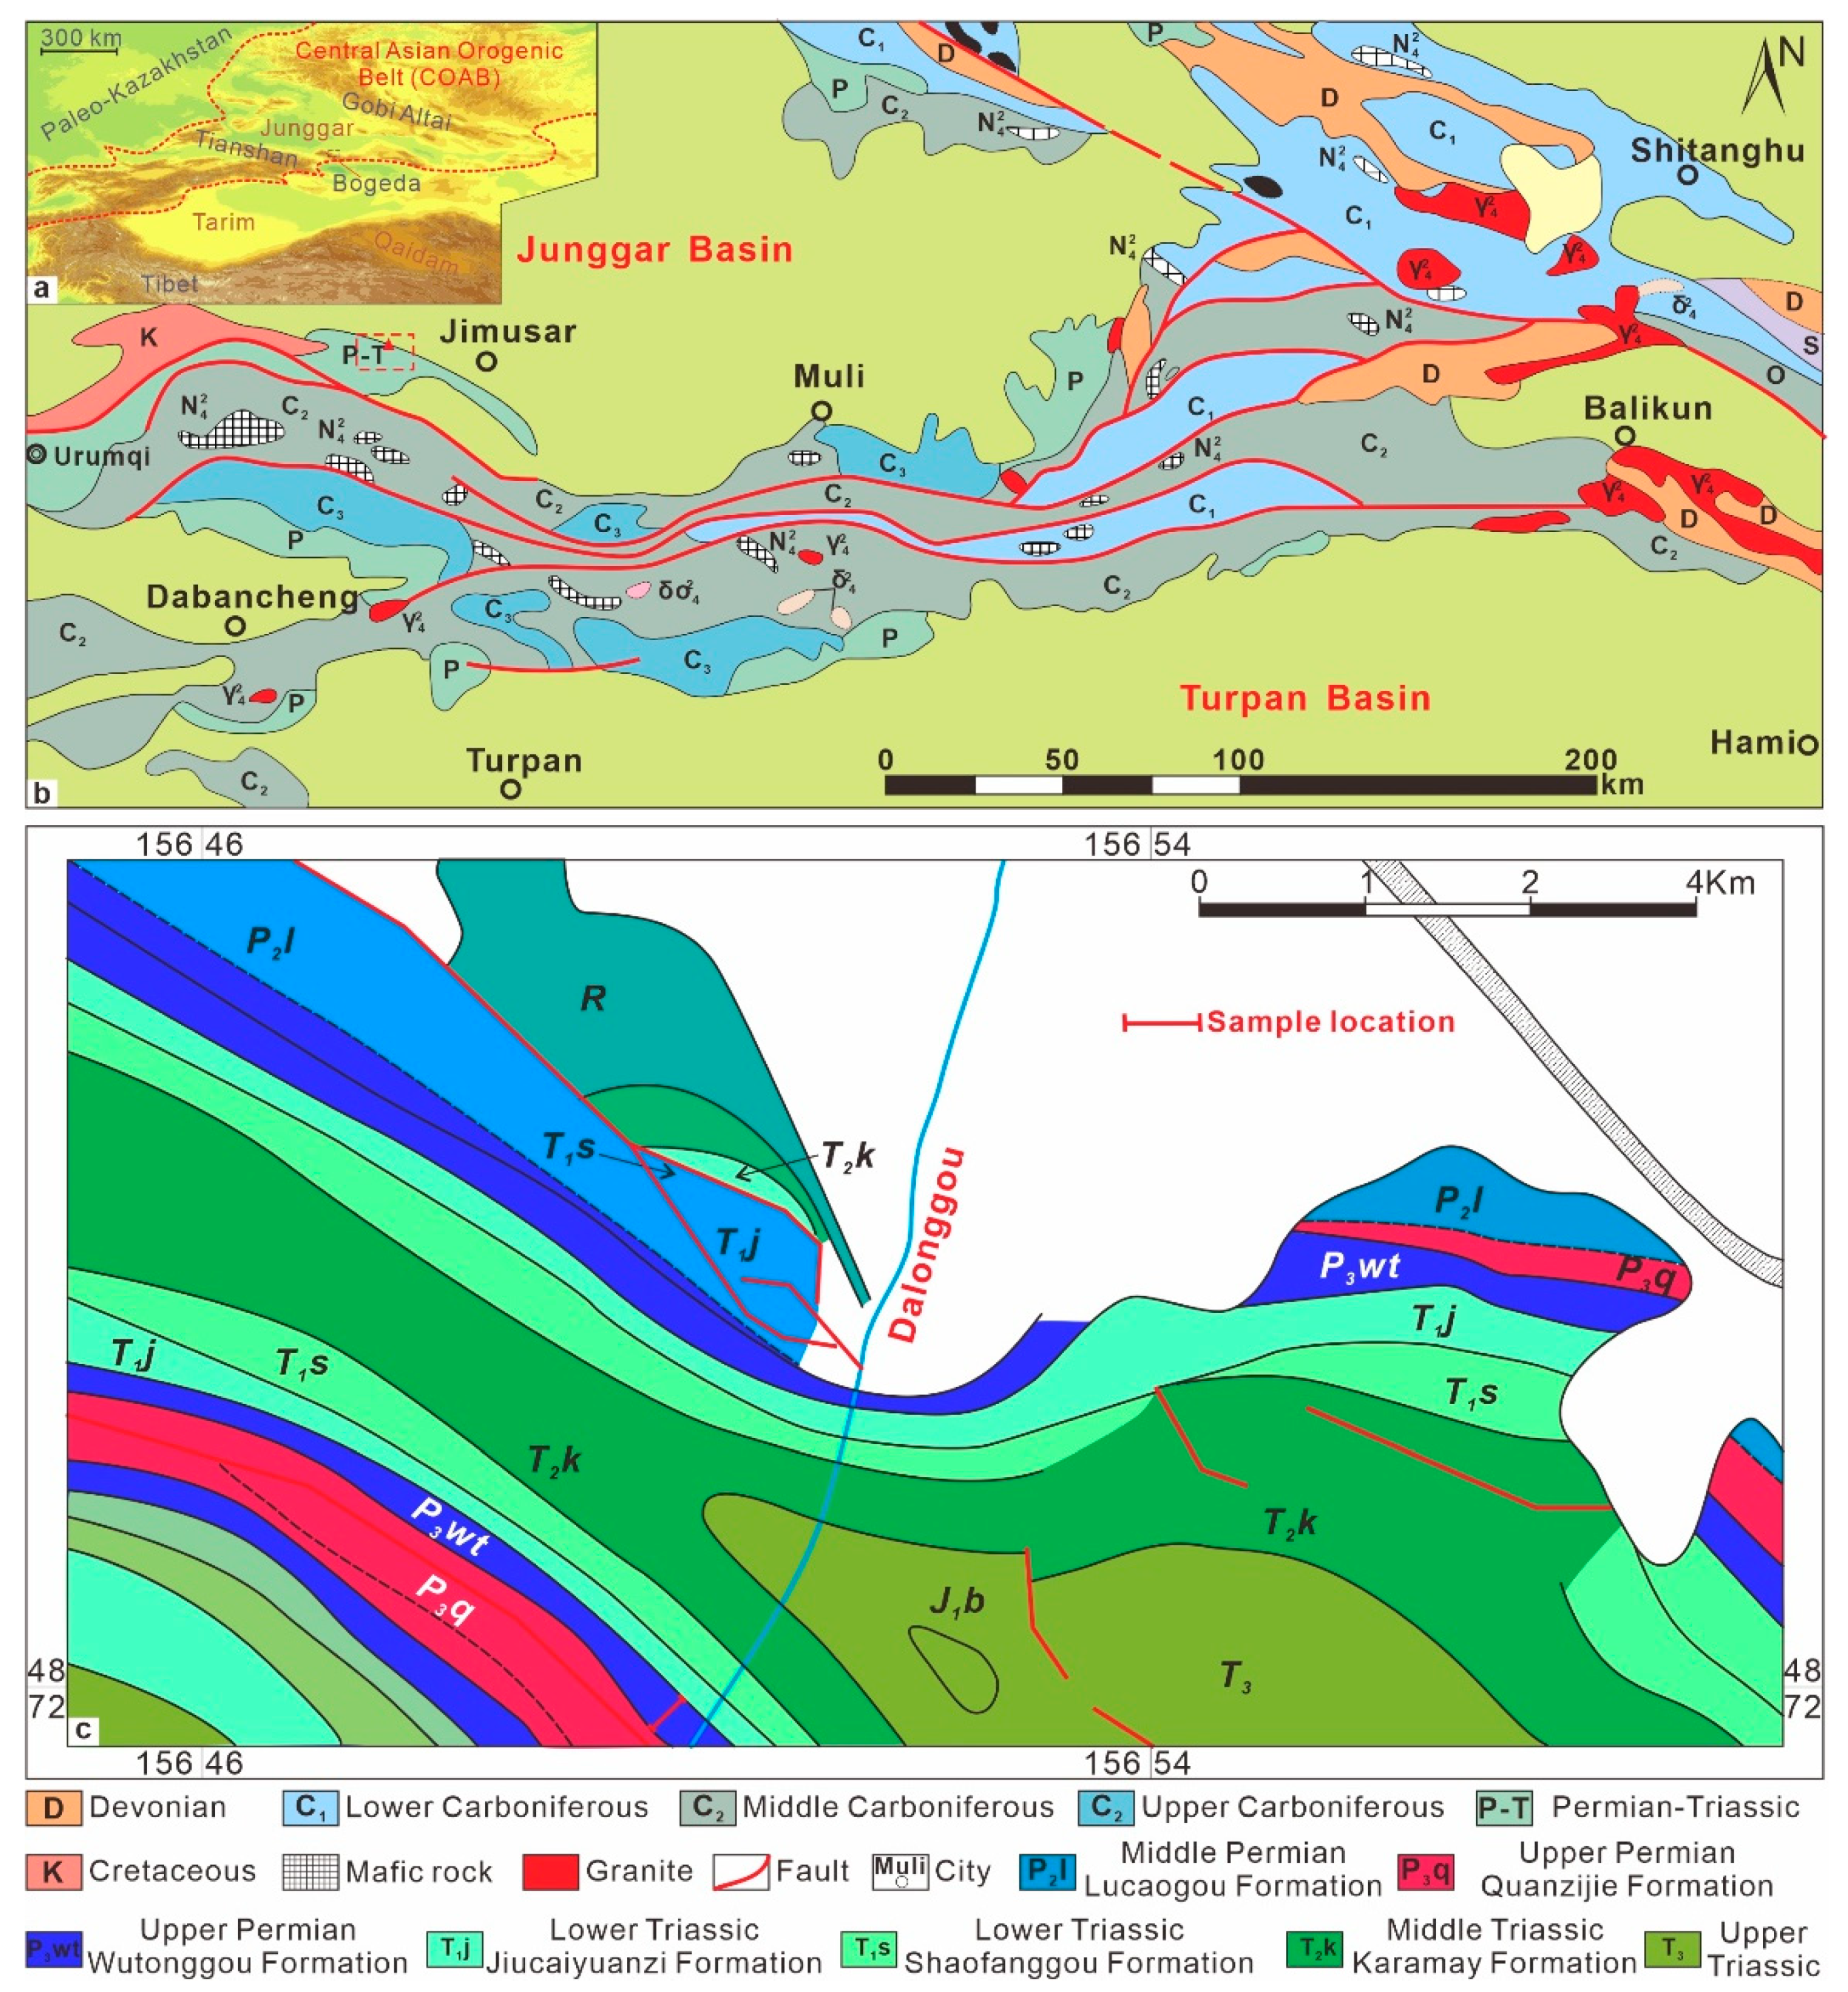
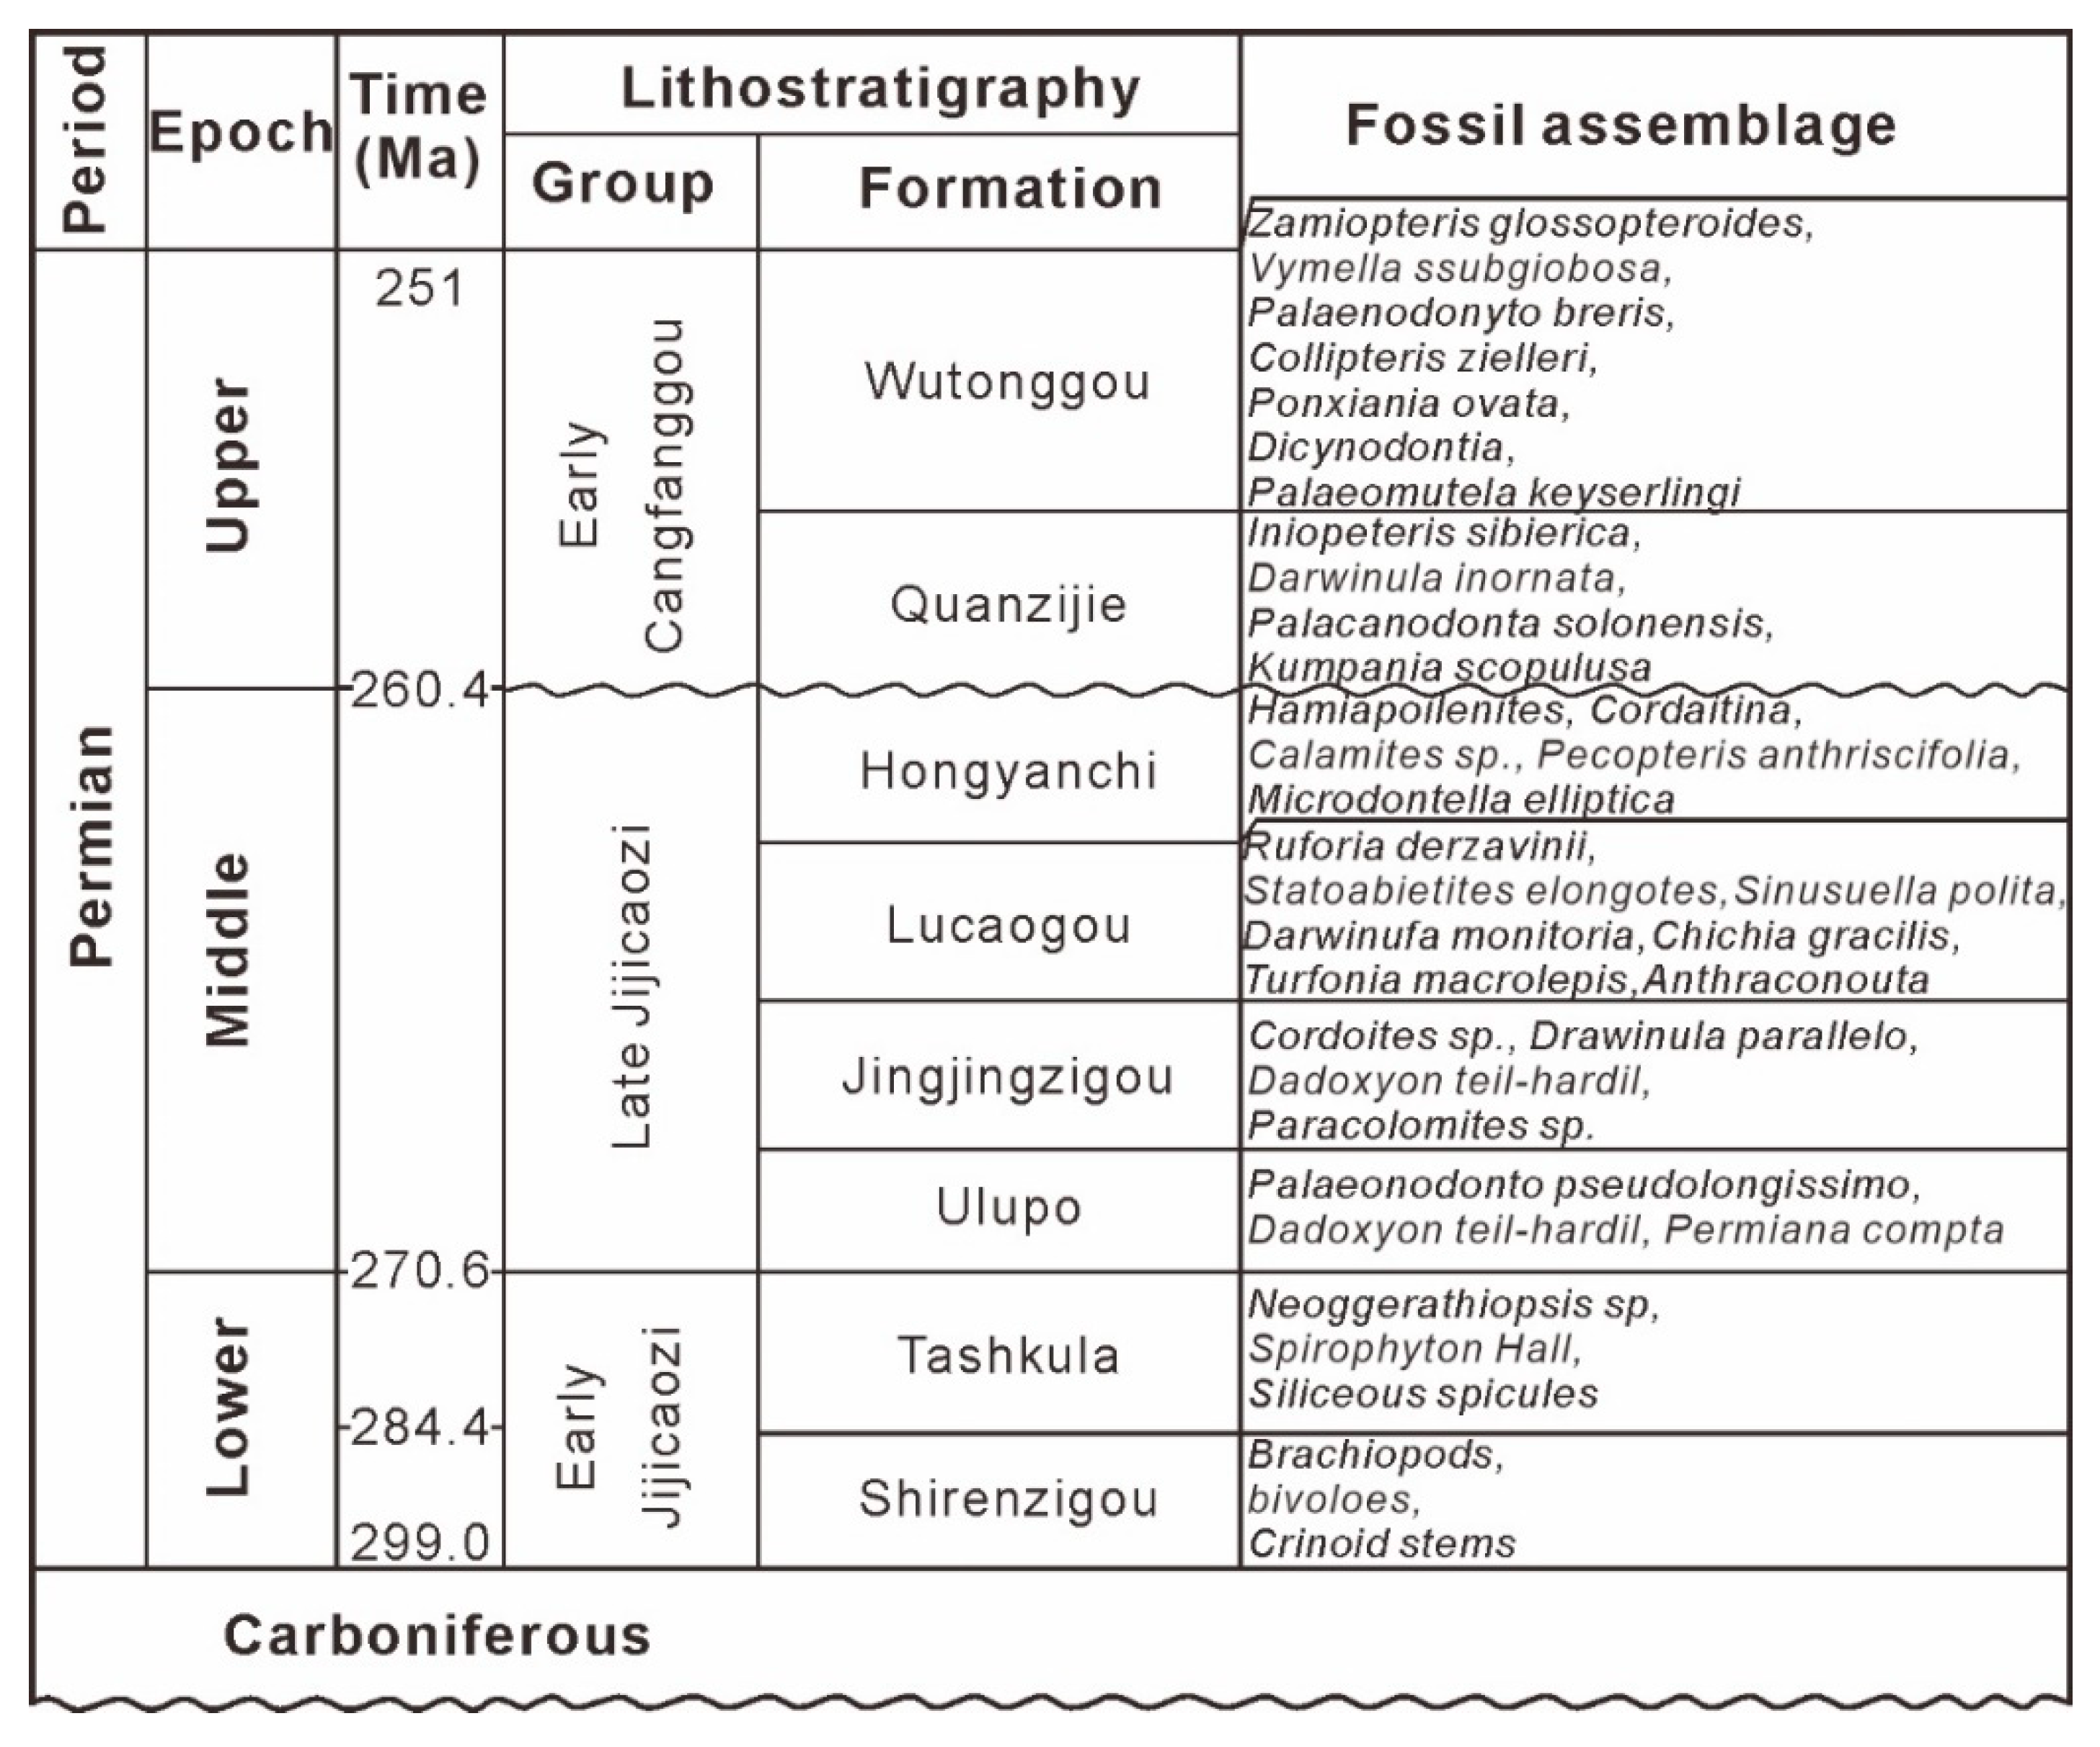
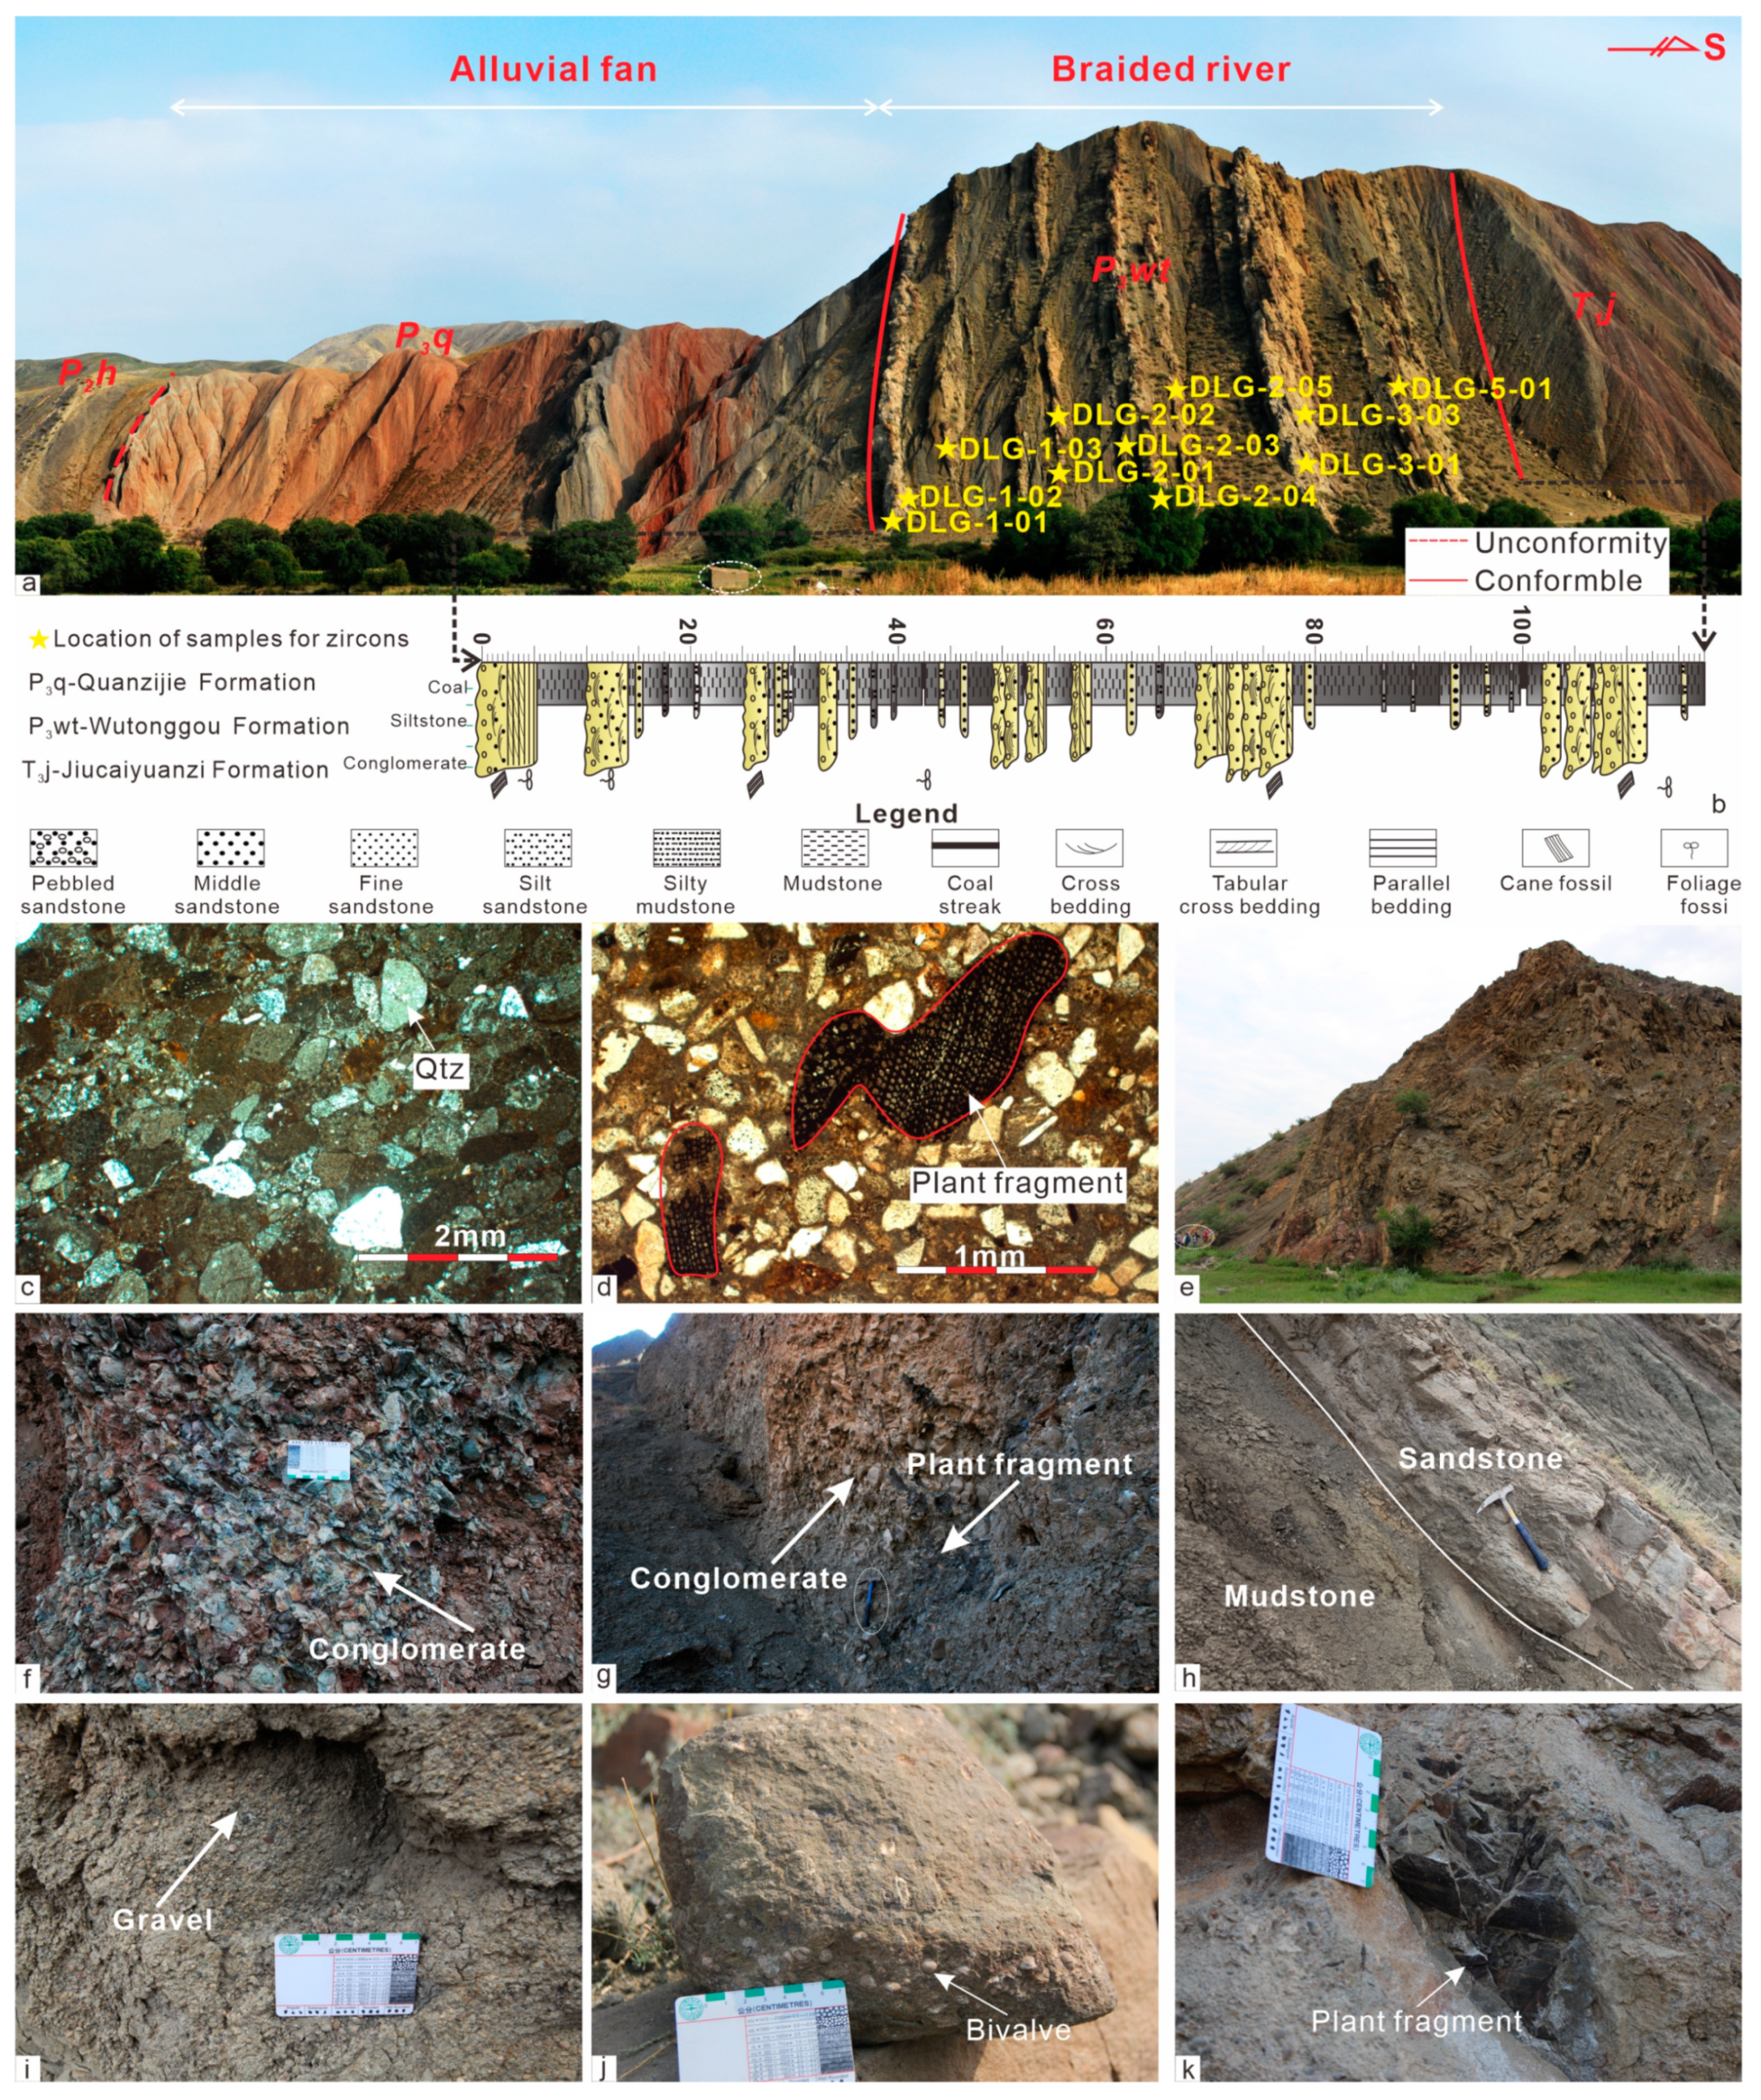
2. Geological Setting and Stratigraphy

The study area of Bogeda Shan belongs to the NTS Belt which is composed of volcanic arcs, intra-arc basin, and accretionary complex in relation to the final closure of the Northern Tianshan Ocean [20]. The NTS Belt can be further divided into the Bogeda-Harlik Belt in the north and Juelotage Belt in the south. The Bogeda Shan is a part of the Bogeda-Harlik Belt and extends >250 km in the east–west direction (Figure 1b). It is the geographical boundary of the two largest basins in northwest China, with the Junggar Basin in the north and Turpan-Hami Basin in the south. The Paleozoic orogenic movements formed the high topography of Bogeda Shan due to India–Asia collision during the early Cenozoic [21,22,23]. The central part of the Bogeda Shan consists of Carboniferous sedimentary rocks (Lower Carboniferous composed by marine volcanic ignimbrite and bimodal volcanic lava, while Upper Carboniferous is dominated by felsic ignimbrite and marine basaltic lava), while the north and south parts are composed mainly by Mesozoic and Cenozoic sediments. The lithology of the East Bogeda Shan is more variable than in the western part, and the latter was formed during the Early Carboniferous (Mississippian) [24,25,26,27]. The Dalongkou section investigated in this study is distributed in the Fukang Depression in the West Bogeda Shan, with the clear exposure of the Permian and Triassic strata for field work (Figure 1c).
The Permian strata at the anterior of West Bogeda Shan are made up of the following eight central units: the Shirenzigou Formation (P1s), Tashkula Formation (P1t) in the Lower Permian, Ulupo Formation (P2w), Jingjingzigou Formation (P2j), Lucaogou Formation (P2l) and Hongyanchi Formation (P2h) in the Middle Permian, as well as Quanzijie Formation (P3q) and Wutonggou Formation (P3wt) in the Upper Permian (Figure 2). The paleontologic record suggest the depositional environments in the anterior region of the West Bogeda Shan were normal marine and shelf depositions during the Carboniferous to Early Permian (Figure 2), with sandstone and siltstone representing the primary lithologies. In the Middle Permian, the depositional environment changed to terrestrial and lacustrine facies, resulting in a variable lithology of sandstone, siltstone, mudstone, and oil-bearing mudstone. The Upper Permian strata is composed of conglomerate and sandstone deposited in alluvial fan and braided river environment [28,29,30,31,32,33].

3. Sampling and Analytical Methods

This study collected new data on the samples from the Upper Permian, and a total of eleven sandstone samples were collected from the Dalongkou section (43°57′21″ N, 88°51′44″ E) with the thickness of 117.53 m (Figure 3a,b). Among them, seven sandstone samples were chosen for zircon U-Pb dating, and eleven samples for whole-rock geochemistry analyses. The samples are mainly from quartz-rich medium to fine grained sandstone (Figure 3h,i), with poor to moderate sorting and roundness (Figure 3c,d).

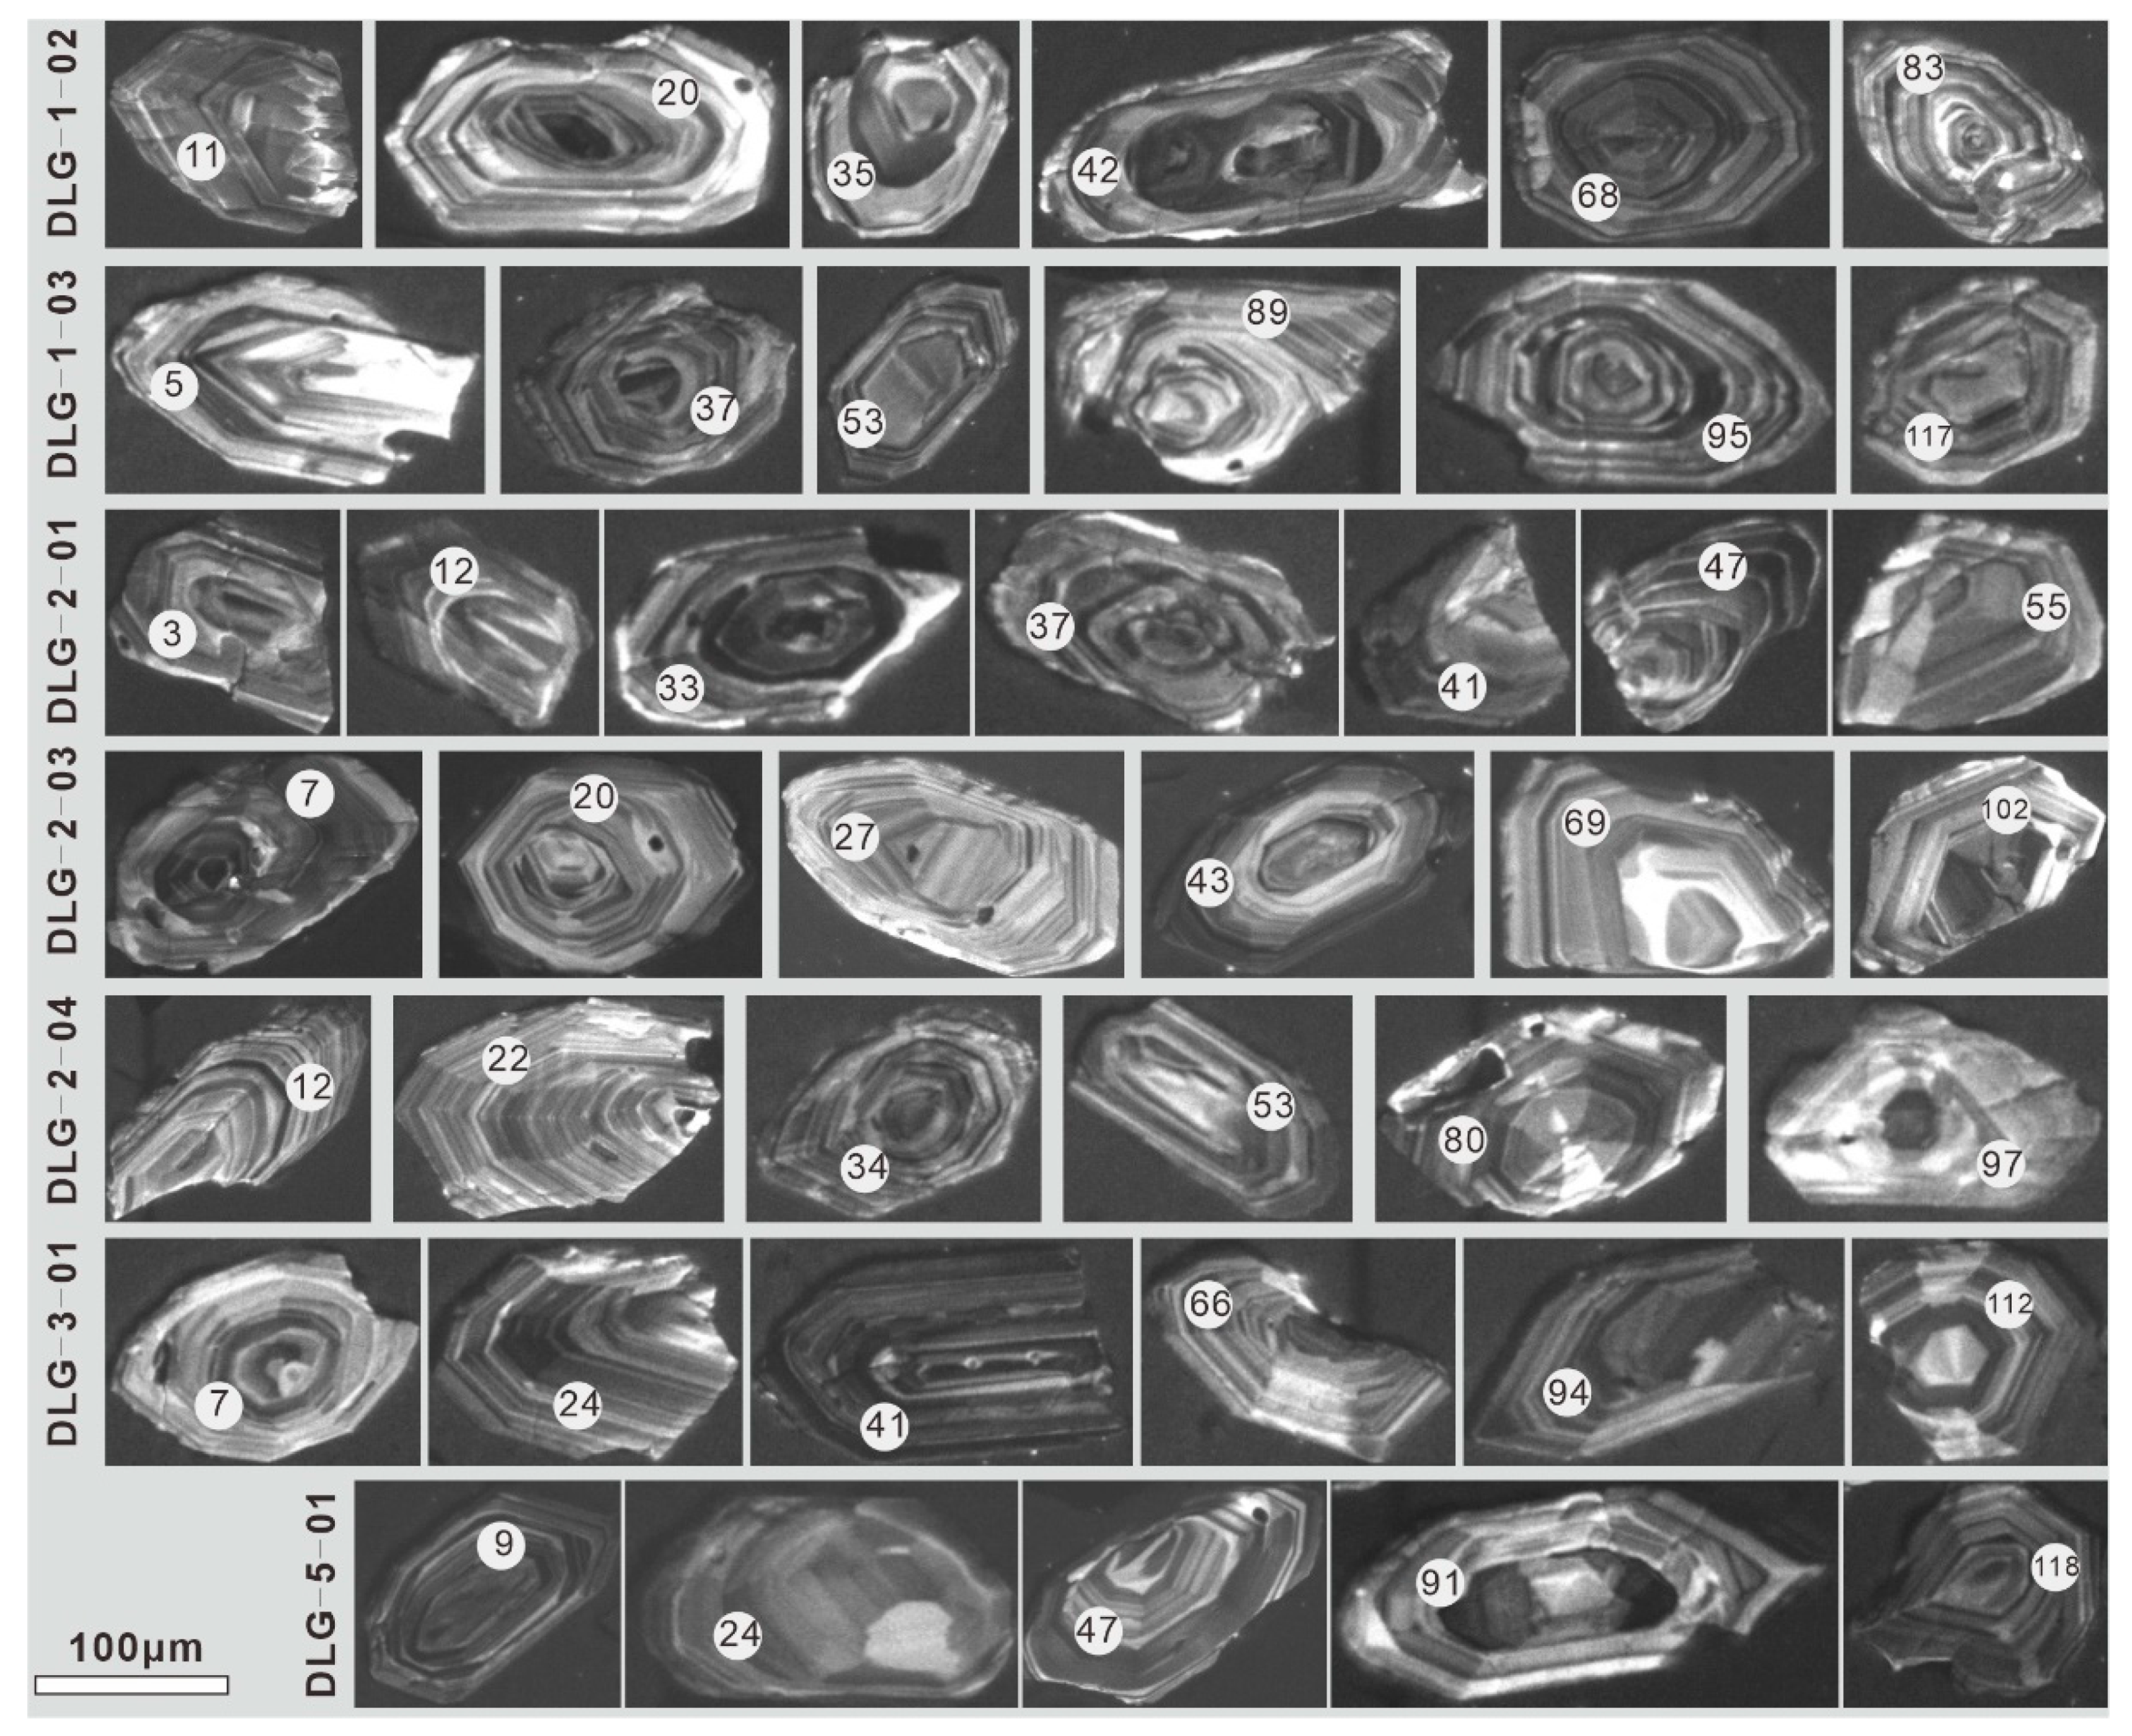
3.1. Zircon U-Pb Geochronology

The samples for detrital zircon U-Pb dating were prepared following the previous procedures [34,35]. The sandstone samples were first crushed with the agate mortar. Then, the grain size fraction of 63–125 μm was separated by the wet-sieving method. After wet sieving, tribromomethane liquid (CHBr3) was used to separate heavy minerals, followed by magnetic separation. Later, detrital zircon grains were then identified and picked out from non-magnetic or weak magnetic minerals under a binocular microscope. About 200–300 grains of zircon were randomly selected, pasted on adhesive tapes, and enclosed in epoxy resin followed by polishing to yield a smooth flat surface. Before being ablated by a laser, cathodoluminescence (CL) images were used to check the internal structures of zircons by the electron microprobe of JEOL JXA-8230 (JEOL, Tokyo, Japan).
The measurements of zircon U-Pb ratios were performed at Tong University using a 193 nm excimer laser (Resonetics M50L) (Resonetics, Nashua, NH, USA) coupled with a quadrupole inductively coupled plasma mass spectrometry (ICP-MS, Agilent 7900, Agilent, Santa Clara, CA, USA). The zircon grains were ablated with a laser spot size of 26 μm at the repetition of 6 Hz and the fluence of 4 J cm−2. Masses 206, 207, 208, 232, 235, and 232 were acquired by the ICP-MS. Reference zircon materials 91500 and Plešovice were measured periodically to carry out U-Pb age external calibration and monitor the measurements. The U-Pb isotope ratios and the corresponding ages were calibrated using UranOS software [36]. The brief calibration procedure included blank subtraction, calculation of ratio of means, instrumental drift correction, and normalization by primary reference material (91500). The uncertainties of U-Pb isotopes ratios and ages were propagated in the calibration and results were reported with 2σ uncertainties [36]. As we did not acquired mass 204, the common Pb correction was performed using the Stacey-Kramers method on the basis of the measured 206Pb/238U ages [37]. To minimize the uncertainty due to some poor-quality ages, U-Pb ages with discordance larger than 10% were excluded from the following discussion. The discordance of 206Pb/238U age less than 1.4 Ga is defined as 100*(1-206Pb/238 U/207Pb/235U) and the discordance of 206Pb/U238 age greater than 1.4 Ga is defined as 100*(1-206Pb/238U/207Pb/206Pb) [38]. The weighted mean ages of reference zircons 91500 and Plešovice are 1062.8 ± 9.9 Ma and 336.1 ± 3.1 Ma, respectively (Figure 6a), which are consistent with the reference ages within the uncertainties [39,40,41].

3.2. Major and Trace Elemental Analysis

For the measurements of major and trace elemental compositions in the bulk samples, eleven samples were first ground by an agate mortar, and then organic matter was removed in a muffle furnace at the temperature of 600 °C. A mixture of 1:1 HF and HNO3 acids was added to the samples and kept in dissolution bombs in an oven of 190 °C for 48 h for digestion. After the digestion, 30% HNO3 was added to the samples before putting into the oven for at least 12 h at 190 °C. The completely digested samples were measured for major and trace elements by ICP-OES (IRIS Advantage) and ICP-MS (Agilent 7900), respectively. Four kinds of geo-standards (BCR-2, BHVO-2, AGV-2, and GSP-2) [42] were used for the analytic quality control, which yields the analytical uncertainties less than 5%. The Si concentration was calculated by assuming the total content of major oxides and trace elements is 100% according to previous research [43]. All of the above sample preparations and measurements were conducted at the State Key Laboratory of Marine Geology, Tongji University, Shanghai, China.

4. Results

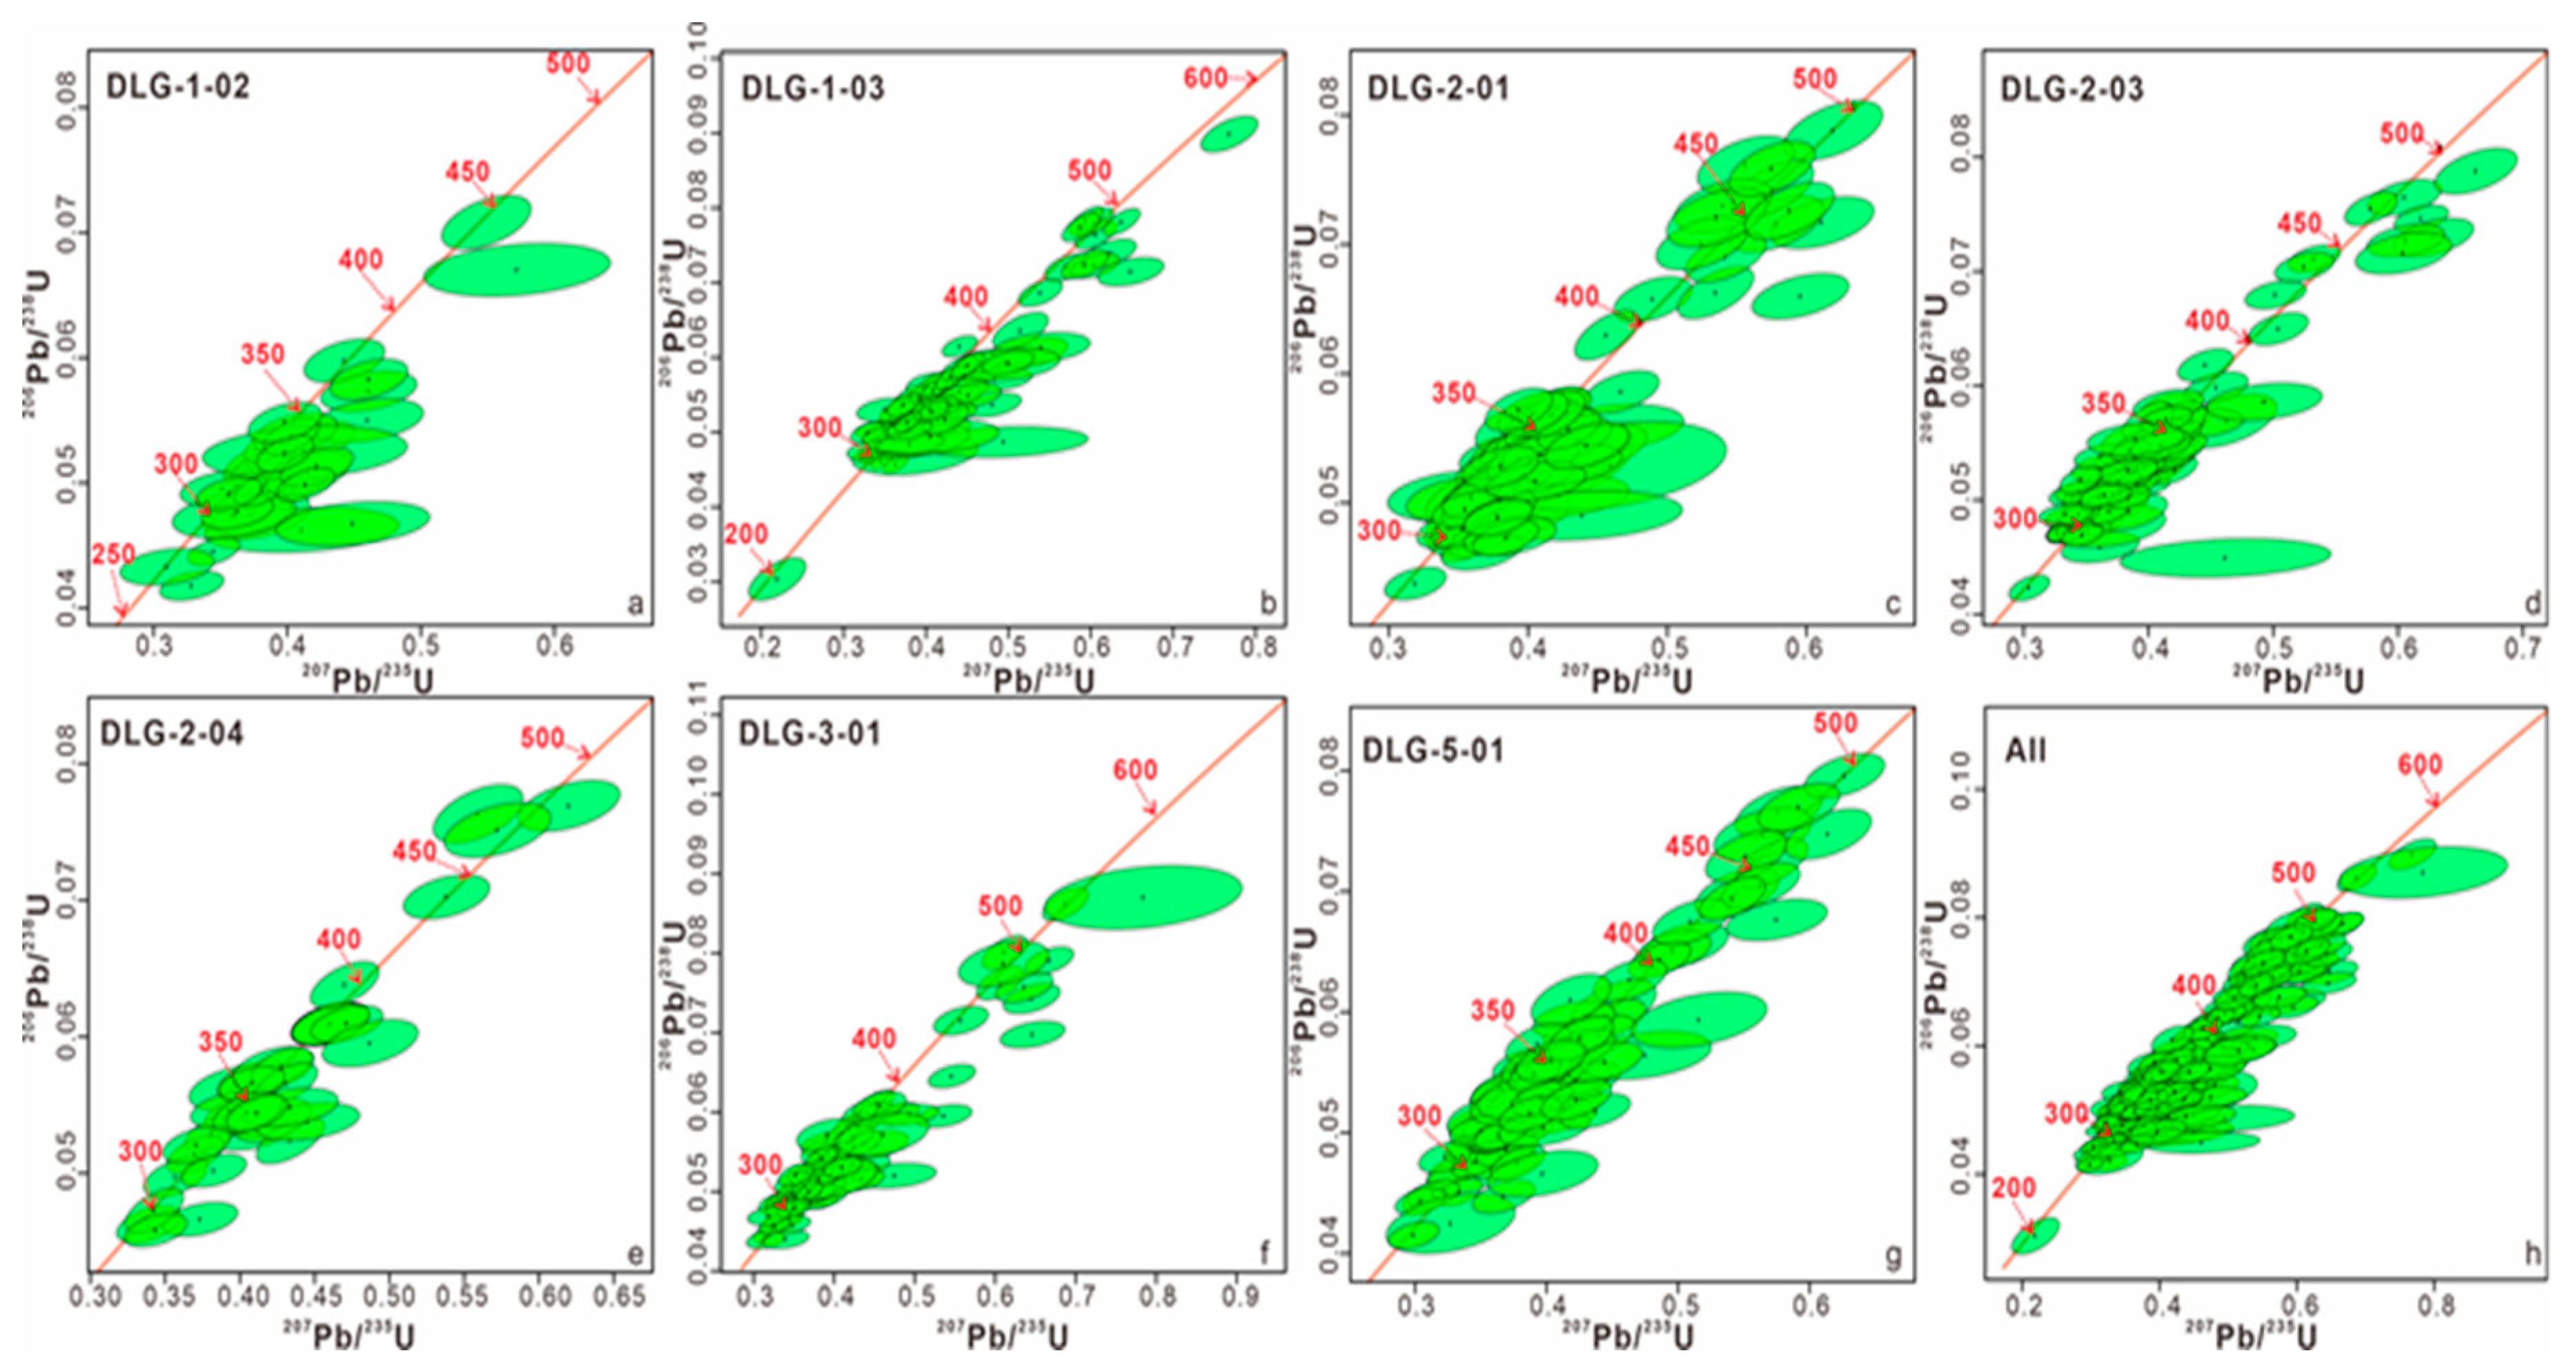
4.1. Detrital Zircon U-Pb Geochronology

To examine the sediment provenances of the West Bogeda Shan from the Carboniferous to Triassic periods, all available detrital zircon U-Pb ages from previous studies are compiled and presented in Table S1 [24,32,44,45,46,47]. The U-Pb ages of the Upper Permian detrital zircons from seven sandstone samples were measured in the present study. Most of the zircon grains have oscillatory zoning and are generally euhedral to subhedral on the CL images (Figure 4), suggesting that these zircons from the Upper Permian originated mostly from acidic magmatic rocks. The Th/U ratios of these zircons are mostly >0.1, further diagnostic of their magmatic origin (Figure 5) [48]. Results of all samples within 90–110% concordance (or less than 10% discordance) are plotted in the U-Pb concordia diagrams (Appendix A), and the data with concordance <90% and >110% are excluded during subsequent analysis.
The U-Pb age populations of detrital zircon grains of Carboniferous and Lower-Middle Permian are similar, mostly in the range of 300–541 Ma [8,47,49]. While, the zircons from the Upper Permian in the west Bogeda yield the U-Pb ages varying from ca. 262 Ma to ca. 558 Ma, with the oldest zircon from the Cambrian, and the youngest from the Permian. Most zircon grains are older than Carboniferous (>295 Ma), which account for 94.3%. To all of the zircon U-Pb ages, the Carboniferous zircons with U-Pb ages of 295–354 Ma have a mean proportion of 69.4%, bracketing the dominant period of zircon generation. Devonian zircons with U-Pb ages of 354–410 Ma are the second highest population, accounting for 13.7%. In comparison, zircon ages younger than the Carboniferous (<295 Ma) only account for 5.7%. Overall, the peak ages of zircon from the Upper Permian sedimentary rocks are ca. 335 Ma and ca. 455 Ma (Figure 6b).

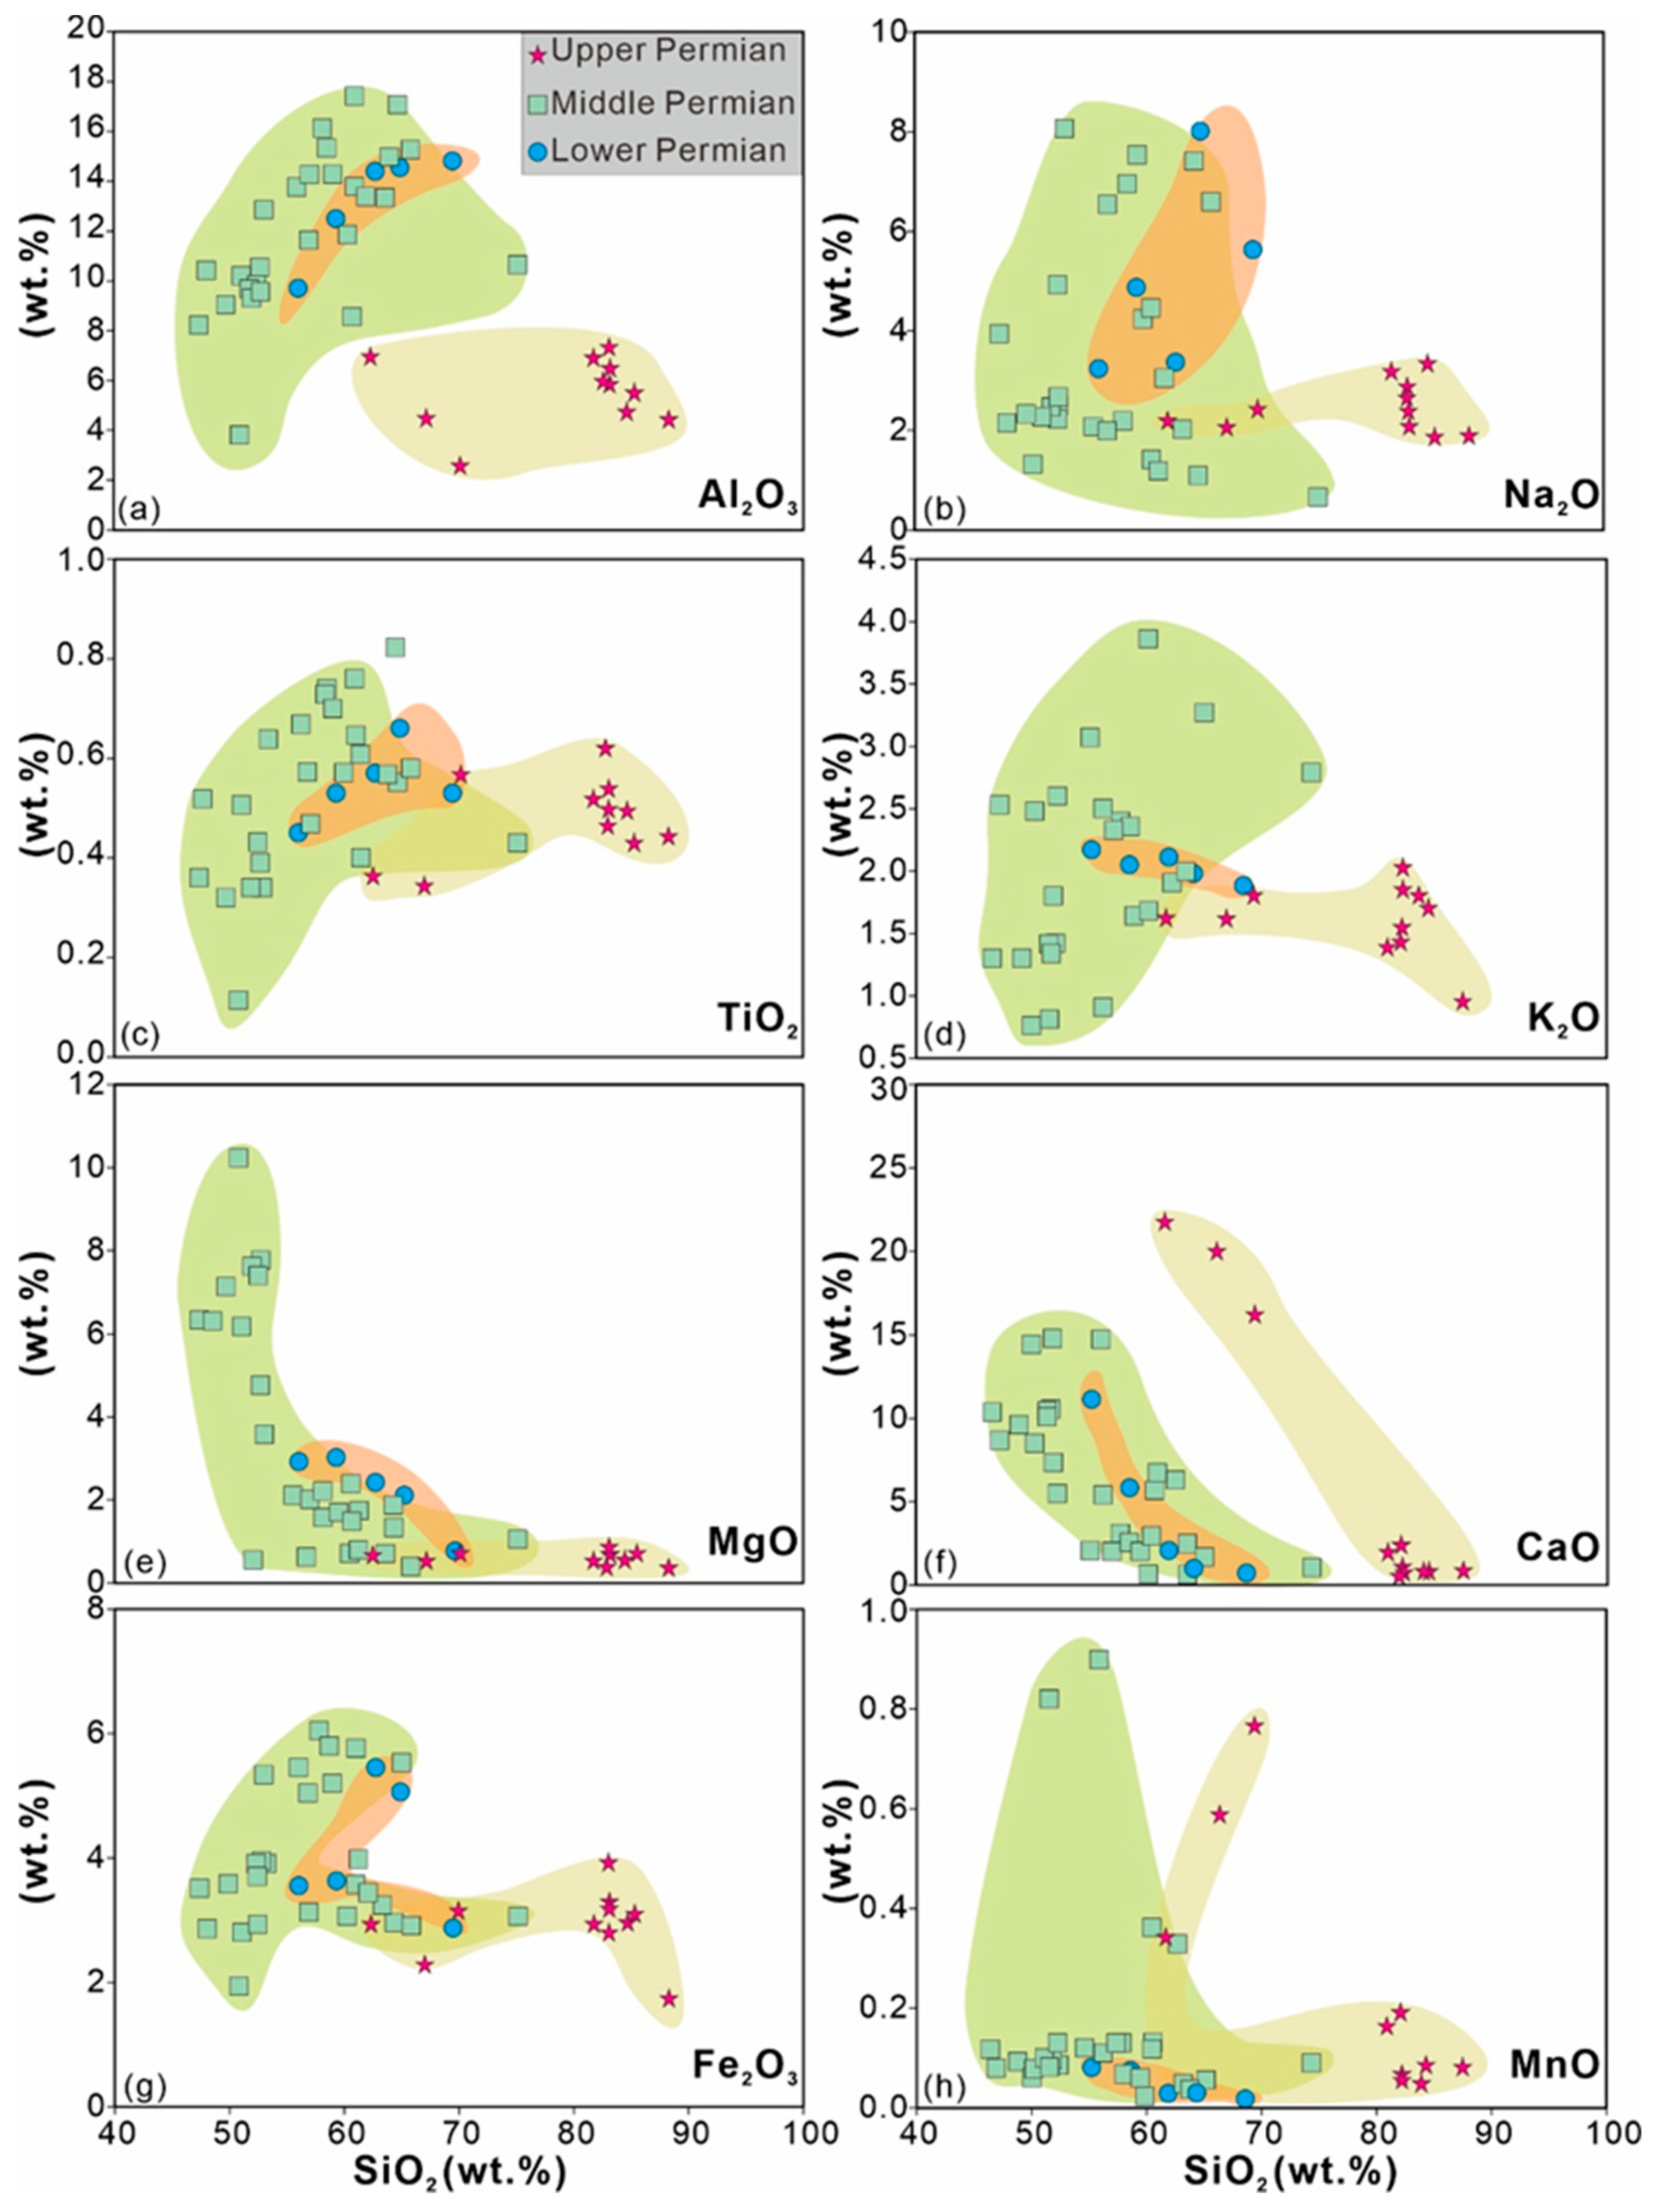
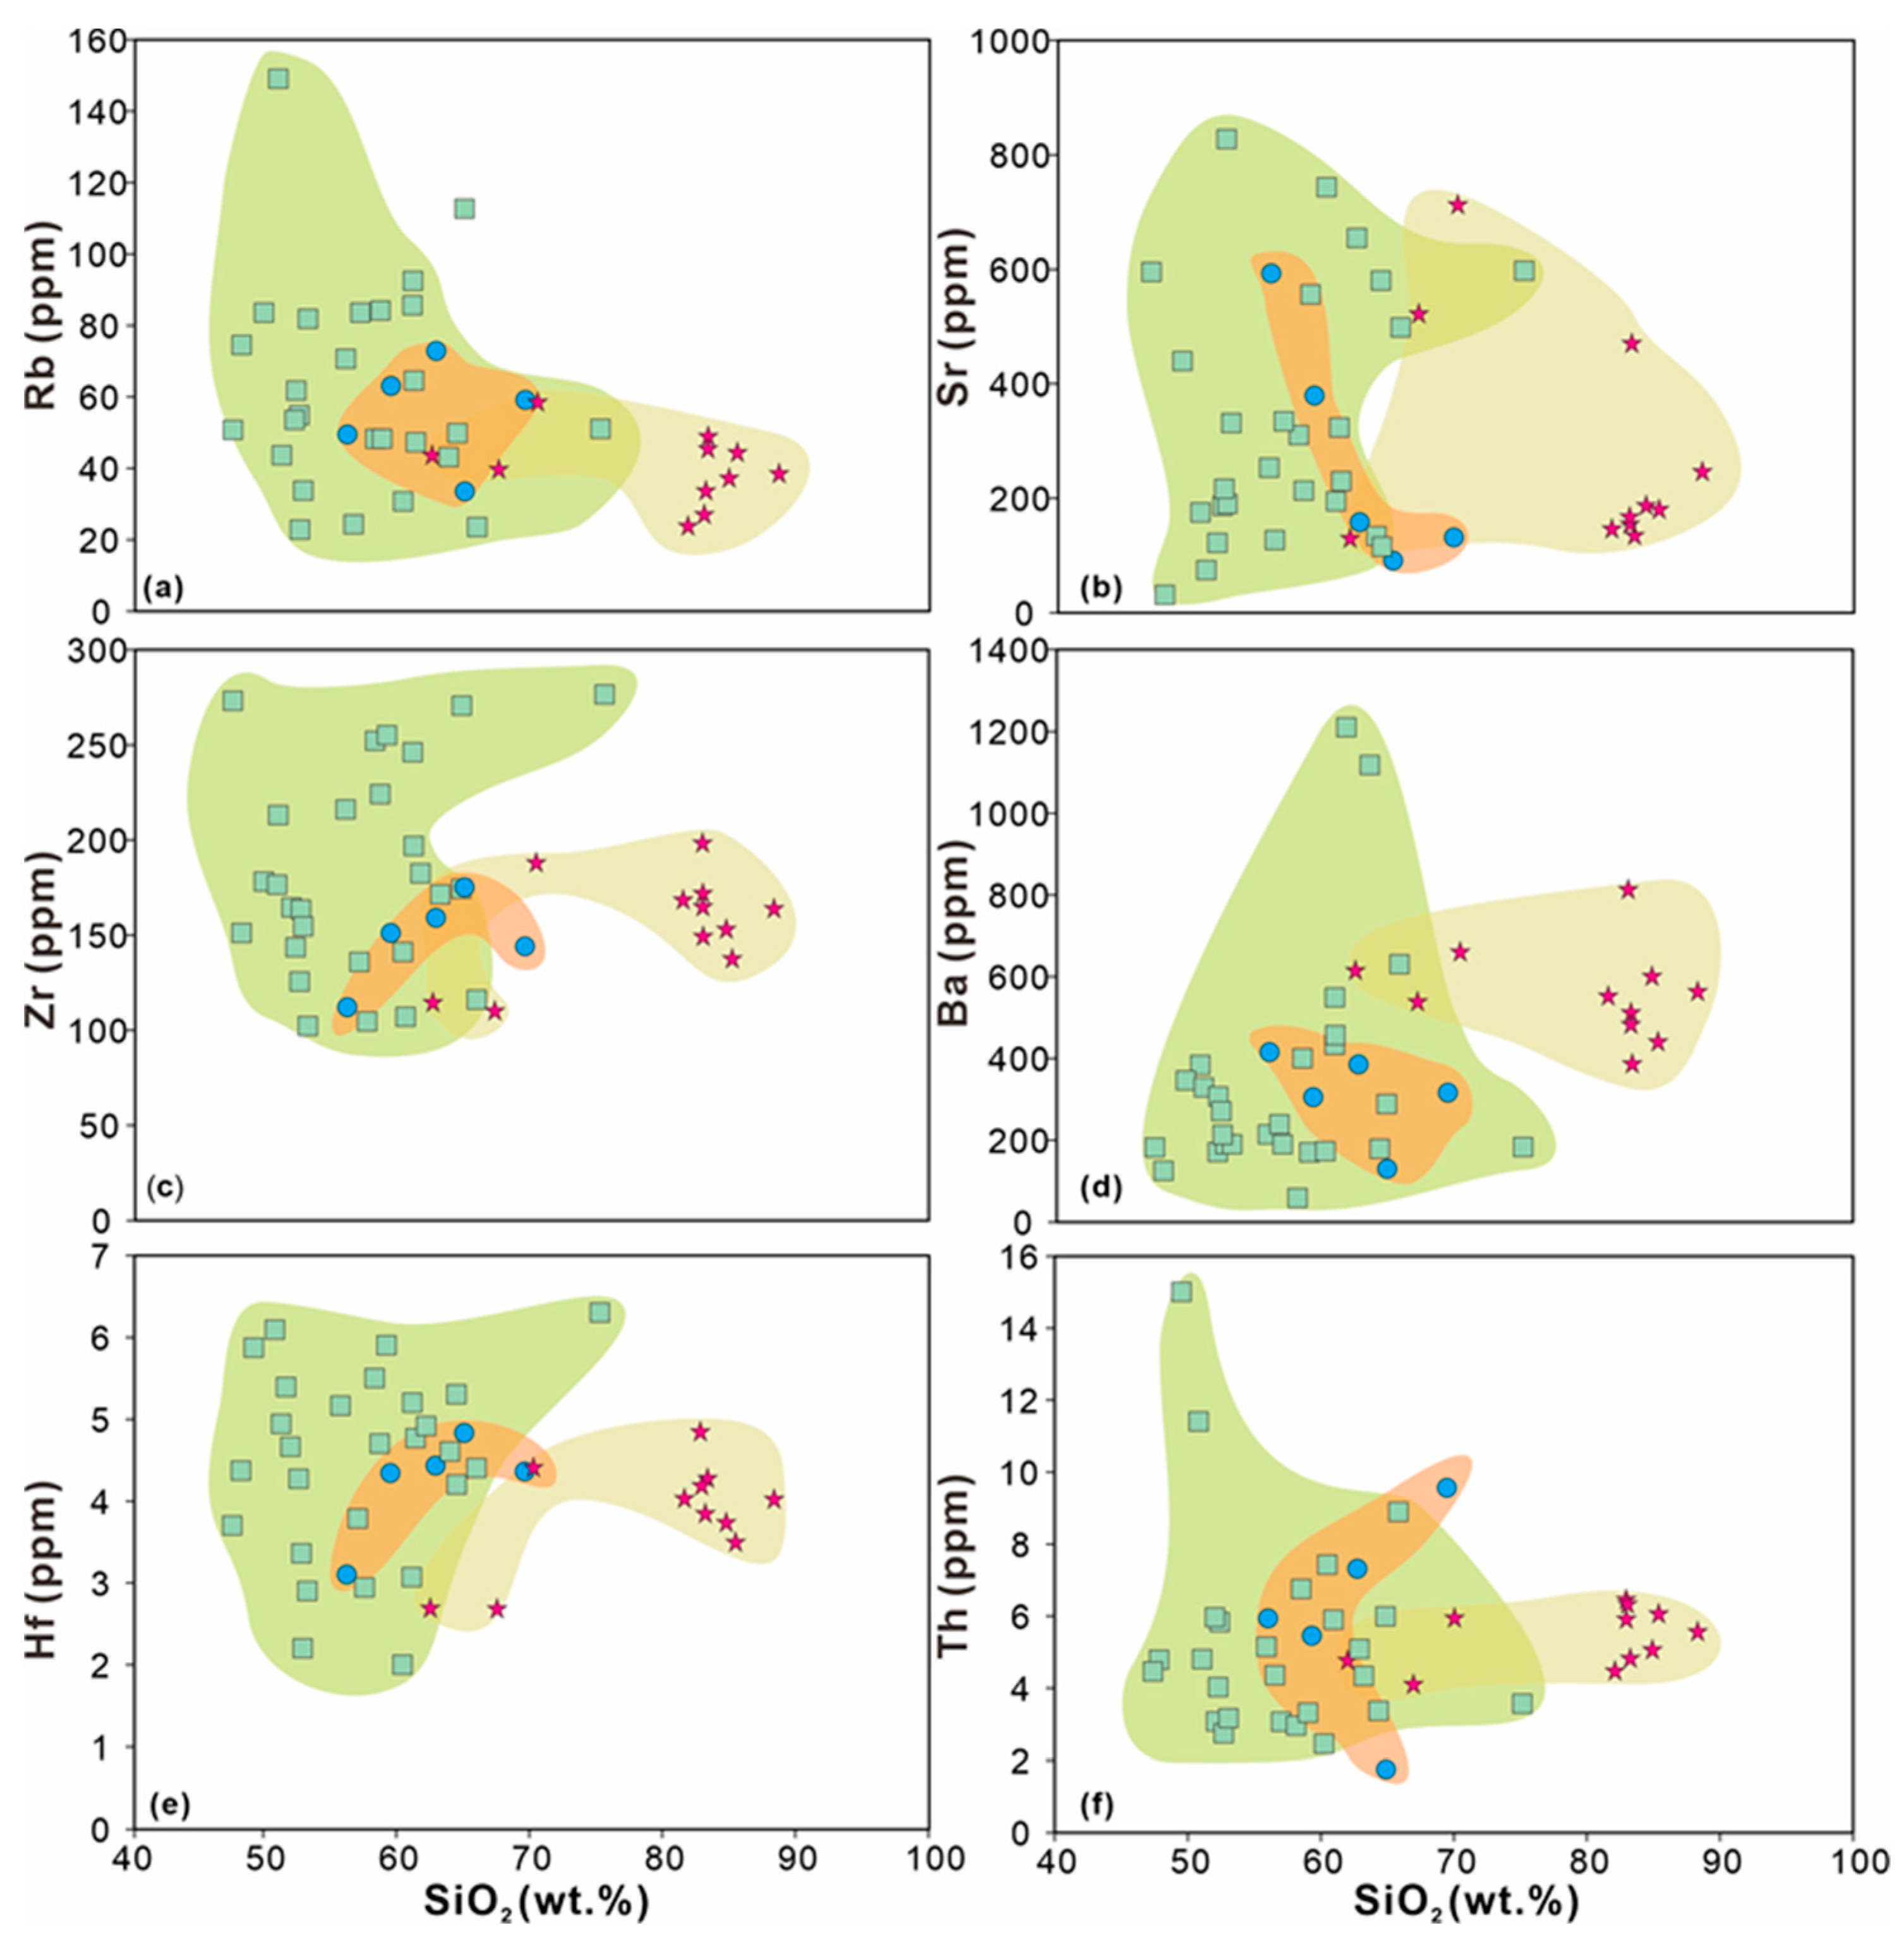
4.2. Major and Trace Elements

The compositions of major and trace elements of eleven sandstone samples from the West Bogeda Shan are given in Table 1. Geochemical data of samples from the Lower-Middle Permian were collected from previous studies [8,50,51] and presented in Table S2.
The contents of SiO2 exhibit a wide range from 42.9% to 89.2% with a notable increase from the Lower to Upper Permian. Al2O3 contents, however, yield lower values in the Upper Permian samples and high in the Middle Permian. No apparent linear relationships exist between Na2O, K2O, Fe2O3, and SiO2, while both MgO and CaO are negatively correlated with SiO2. TiO2 contents increase with SiO2 in the Lower-Middle Permian samples, but decrease in the Upper Permian. MnO contents have no linear relationship with SiO2 in the Lower-Middle Permian, and a negative correlation in the Upper Permian. Trace element compositions of rock samples in West Bogeda Shan are shown in Table 1. Elements including Th, Zr Hf, Sr, and Ba have positive correlations with SiO2, showing increasing trends towards the Upper Permian, while Rb and Sr have lower concentrations in the Upper Permian samples. The Harker Variation Diagram of major and trace elements are shown in Appendix A.

5. Discussion

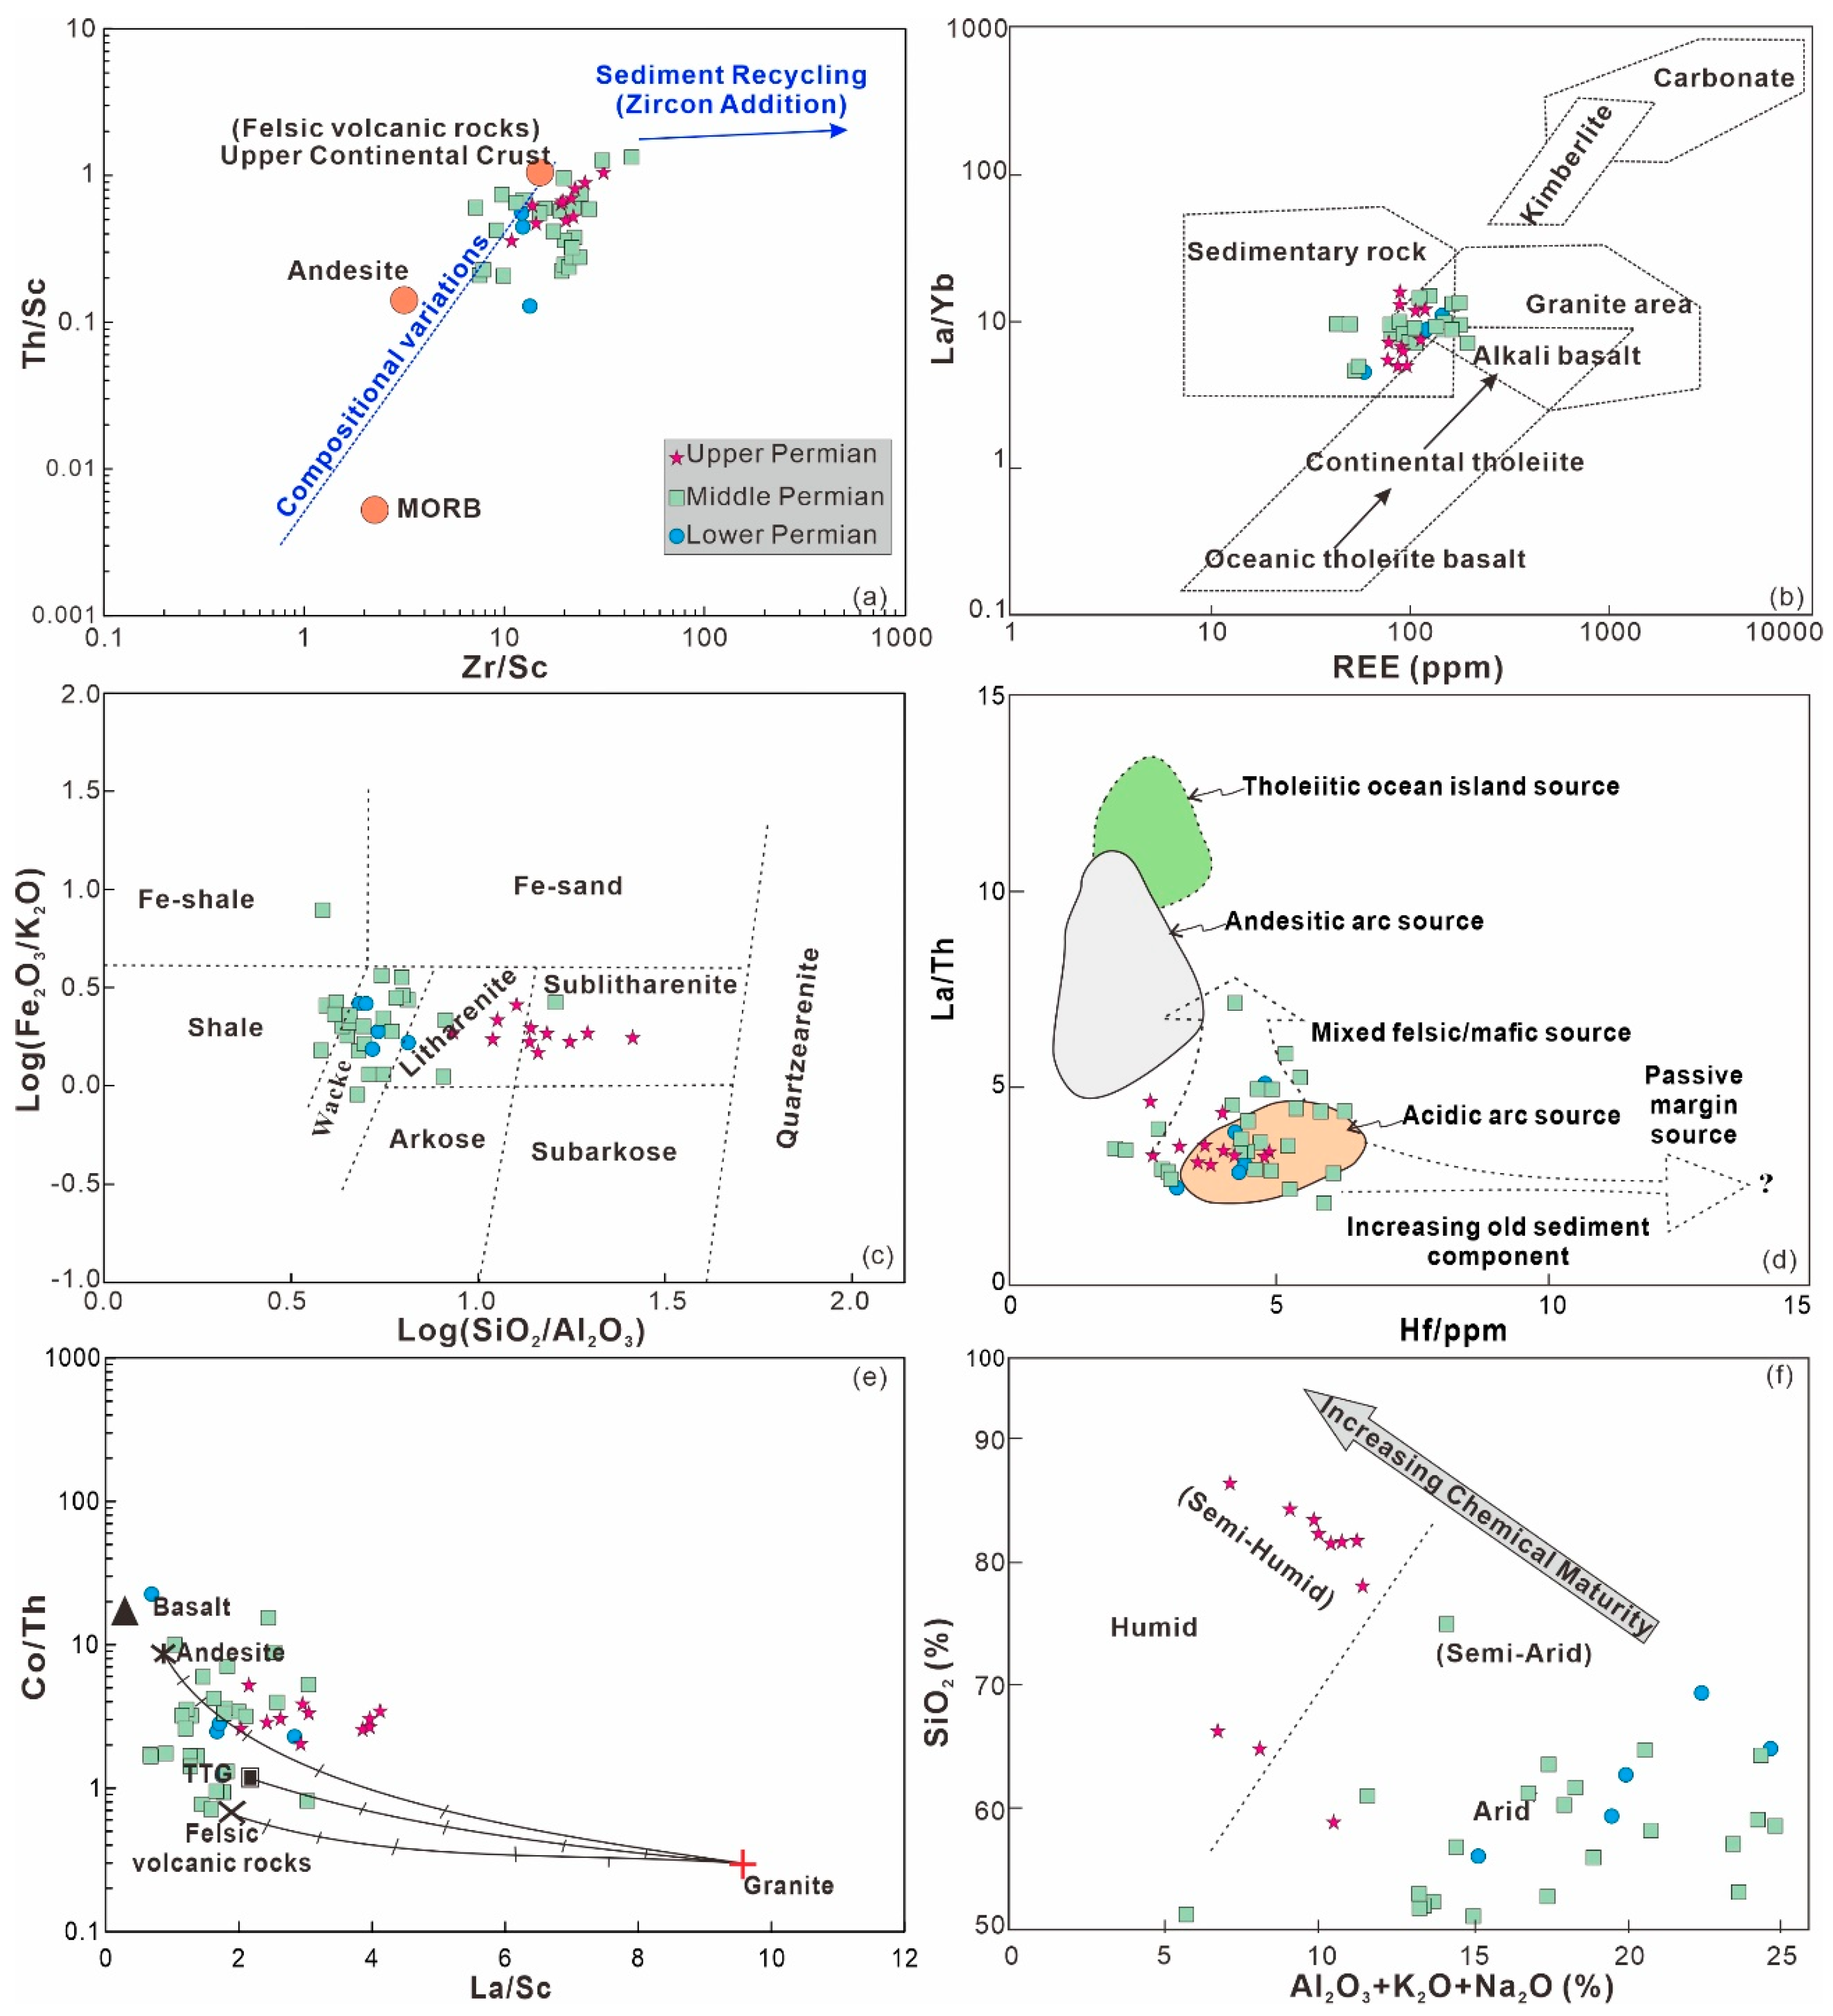
5.1. Provenance Variation of Sedimentary Rocks in the West Bogeda Shan

Detrital zircon geochronology has been used as a proxy for sedimentary provenance analysis due to zircon’s stability during weathering and transporting [52,53]. Detrital zircon U-Pb ages of the Upper Permian samples have two notable age peaks at ca. 335 Ma and ca. 455 Ma (Figure 7a), whereas only one main age population was observed for the Carboniferous to Middle Permian samples (Figure 7b). Therefore, we infer that the sediment provenances in the West Bogeda Shan were derived from relatively homogeneous sources with a narrow zircon age population in the Carboniferous to Middle Permian periods, but obviously changed to multiple sources during the Late Permian and Triassic. Detrital zircons collected from the Upper Carboniferous to Middle Permian with major peaks at ca. 342.0 Ma, ca. 310.2 Ma and ca. 311.7 Ma, respectively (Figure 7b). Detrital zircons with ages of 360–320 Ma and 320–300 Ma may source from the magmatic belts of the YCTS and NTS, respectively [8]. The paleocurrents in the Permian and Triassic were mainly north directed, implying that the source of the detrital zircon grains was suited to the south in the Tian Shan area (Figure 7c) [8,15,51,54]. Therefore, the Carboniferous volcanic rocks in the NTS and magmatic belt of YCTS are considered as the sources of deposits in the Upper Carboniferous to Middle Permian [55]. Two major age peaks at ca. 330.2 Ma and ca. 448.0 Ma could be identified for Upper Permian deposits and three major age peaks for Lower Triassic deposits at ca. 245.9 Ma, ca. 314.7 Ma and ca. 458.1 Ma, which may indicate the initial uplift of Bogeda Shan and could be the source of the Junggar Basin [55]. This could also be demonstrated by poorly-sorted and rounded conglomerate and pebbly sandstone of Late Permian age, suggesting that the deposits were near the source area without long distance of transporting (Figure 3f).
Moreover, as shown in the Dickinson diagram (Figure 8), the Permian sedimentary rocks in the West Bogeda Shan are mostly composed of lithic arkose, feldspathic litharenite, and litharenite. Besides, the tectonic setting in which the sedimentary rocks formed is significantly different for the Lower-Middle to Upper Permian. The Lower-Middle Permian sedimentary rocks were developed on magmatic arcs, while the data for the Upper Permian rocks indicate a recycled orogenic setting. These observations further indicate the provenance and tectonic setting variation from Lower-Middle Permian to Upper Permian.
Rare earth elements (REEs) and high-field-strength elements (HFSEs) such as Nb, Ta, Zr, and Hf are relatively conservative during sediment weathering, transport, and post-depositional processes, and thus are treated as reliable tracers for sediment provenances [60,61]. Even though the REE could be affected by grain size and chemical weathering, provenance composition plays a key role on the REE geochemistry of sediments [62]. Chondrite-normalized REE patterns of Permian samples (Figure 9), show the enrichment of light REE (LREE) relative to the heavy REE (HREE) [63]. The LREE/HREE ratios of the Lower, Middle, and Upper Permian samples have ranges of 5.0–10.0, 4.5–5.7, and 5.8–8.9, respectively. Relatively negative Eu anomalies (Eu/Eu* generally <0.7) are observed in the samples from the Lower-Middle Permian (Figure 9a,b), while the Upper Permian samples have weak or no Eu anomalies (Eu/Eu* around 0.9) (Figure 9c). This could further indicate the provenance variation occurred from Lower-Middle Permian to Upper Permian [60].
All these observations of bulk geochemistry suggest a provenance change from the Early-Middle to Late Permian. We therefore argue that the Middle Permian could be the crucial period for the variations of sediment provenance and tectonic setting in the West Bogeda Shan, which is synchronous with the tectonic evolutions of Bogeda Shan during the Late Carboniferous (Pennsylvanian) and Early Permian periods [64], corresponding to the tectonic setting of the Harlik-Dananhu arc [65]. Sediments deposited in the basins where the West Bogeda Shan is currently located during the Late Carboniferous and Early Permian witnessed the tectonic evolution at that time.

5.2. Source Rock Composition and Paleoclimate

In sedimentary rocks, accessory minerals such as zircon, monazite, and apatite are rich in REEs. Generally, felsic rocks have higher LREE/HREE ratios and strong Eu depletions, whereas mafic rocks display relatively low LREE/HREE ratios and moderate Eu anomalies [63]. The Lower-Middle Permian sandstone samples have higher LREE/HREE ratios and weak negative Eu anomalies, while the Upper Permian samples have weak or no Eu anomalies (Figure 9). This observation apparently suggests that the Permian sedimentary rocks in the West Bogeda Shan might have been were derived from the multiple sources, albeit with the dominance of mafic components.
Ratios of Zr/Sc and Th/Sc are useful proxies for identifying the effects of sedimentary recycling and source compositions of sedimentary rocks [60,66]. The large variations but overall positive correlations of Zr/Sc and Th/Sc ratios suggest the variable provenance rock compositions of the West of Bogeda Shan, rather than sedimentary recycling (Figure 10a). The plot of REE versus La/Yb suggests that the Permian samples in the West Bogeda Shan are dominated by sedimentary rocks (Figure 10b). Meanwhile, the lithology of sedimentary rock in the Lower-Middle Permian is different from that of the Upper Permian. The Lower-Middle Permian was mostly composed of greywacke, while shale was subordinate. The Upper Permian was dominated by sublitharenite (Figure 10c). Based on the plot of Hf versus La/Th, the sedimentary rocks in the West Bogeda originated from mixed mafic sources during the Early-Middle Permian but changed to a mixture of mafic and acidic arc sources in the Upper Permian (Figure 10d) [67]. Similarly, the discrimination plot of Co/Th versus La/Sc [19,45,63] suggests that most of the Permian sandstones are classified into mafic volcanic and andesitic sources, although some of the Lower-Middle Permian samples are of felsic volcanic origins (Figure 10e). The combined analyses all demonstrate that most of the Permian sedimentary rocks inherit mafic detritus in the West Bogeda Shan. Besides, the sedimentary rocks in the Early-Middle Permian formed in an arid climate, and then were transferred to a humid climate zones along with the increasing chemical maturity in the Upper Permian (Figure 10f). This could be demonstrated by widely distributed bivalve and plant fragments in the Upper Permian sandstones (Figure 3d,j,k).

5.3. Rapid Change in Lithology and Depositional Environment

The lithology and depositional environment of West Bogeda area experienced a multiphase evolution during the Permian. During the Late Carboniferous and Early Permian, the depositional environment of West Bogeda area was dominated by semi-deep to deep marine environment, and gravity flow deposits was the main lithology [33,57]. At the end of the Early Permian, the shallow water deposited sandstone directly overlying on the mudstone. The depositional environment transitioned from deep water environment to shallow water environment [73,74]. Further, the depositional environment was transferred from marine to nonmarine environment in the Middle Permian with the main lithology of fine sandstone, mudstone and oil-bearing mudstone. Meanwhile, deformation during the Middle Permian and unconformity contact of Middle and Upper Permian could be found in the area (Figure 3e), which may relate to the uplift of West Bogeda Shan. The deposits of Late Permian age are mainly composed of purplish-reddish conglomerate in P3q (Figure 3f,g) and pebbly sandstone in P3wt (Figure 3h,i) with poorly-sorted and rounded pebbles. They are typical molasse formations and close to the source area. Combined with our field works and previous studies [31,57], the depositional environment of Upper Permian was alluvial fan and braided river, which was significantly different from Lower-Middle Permian. The rapid change of lithology and environment also suggest the initial uplift of the West Bogeda Shan during the Late Permian.

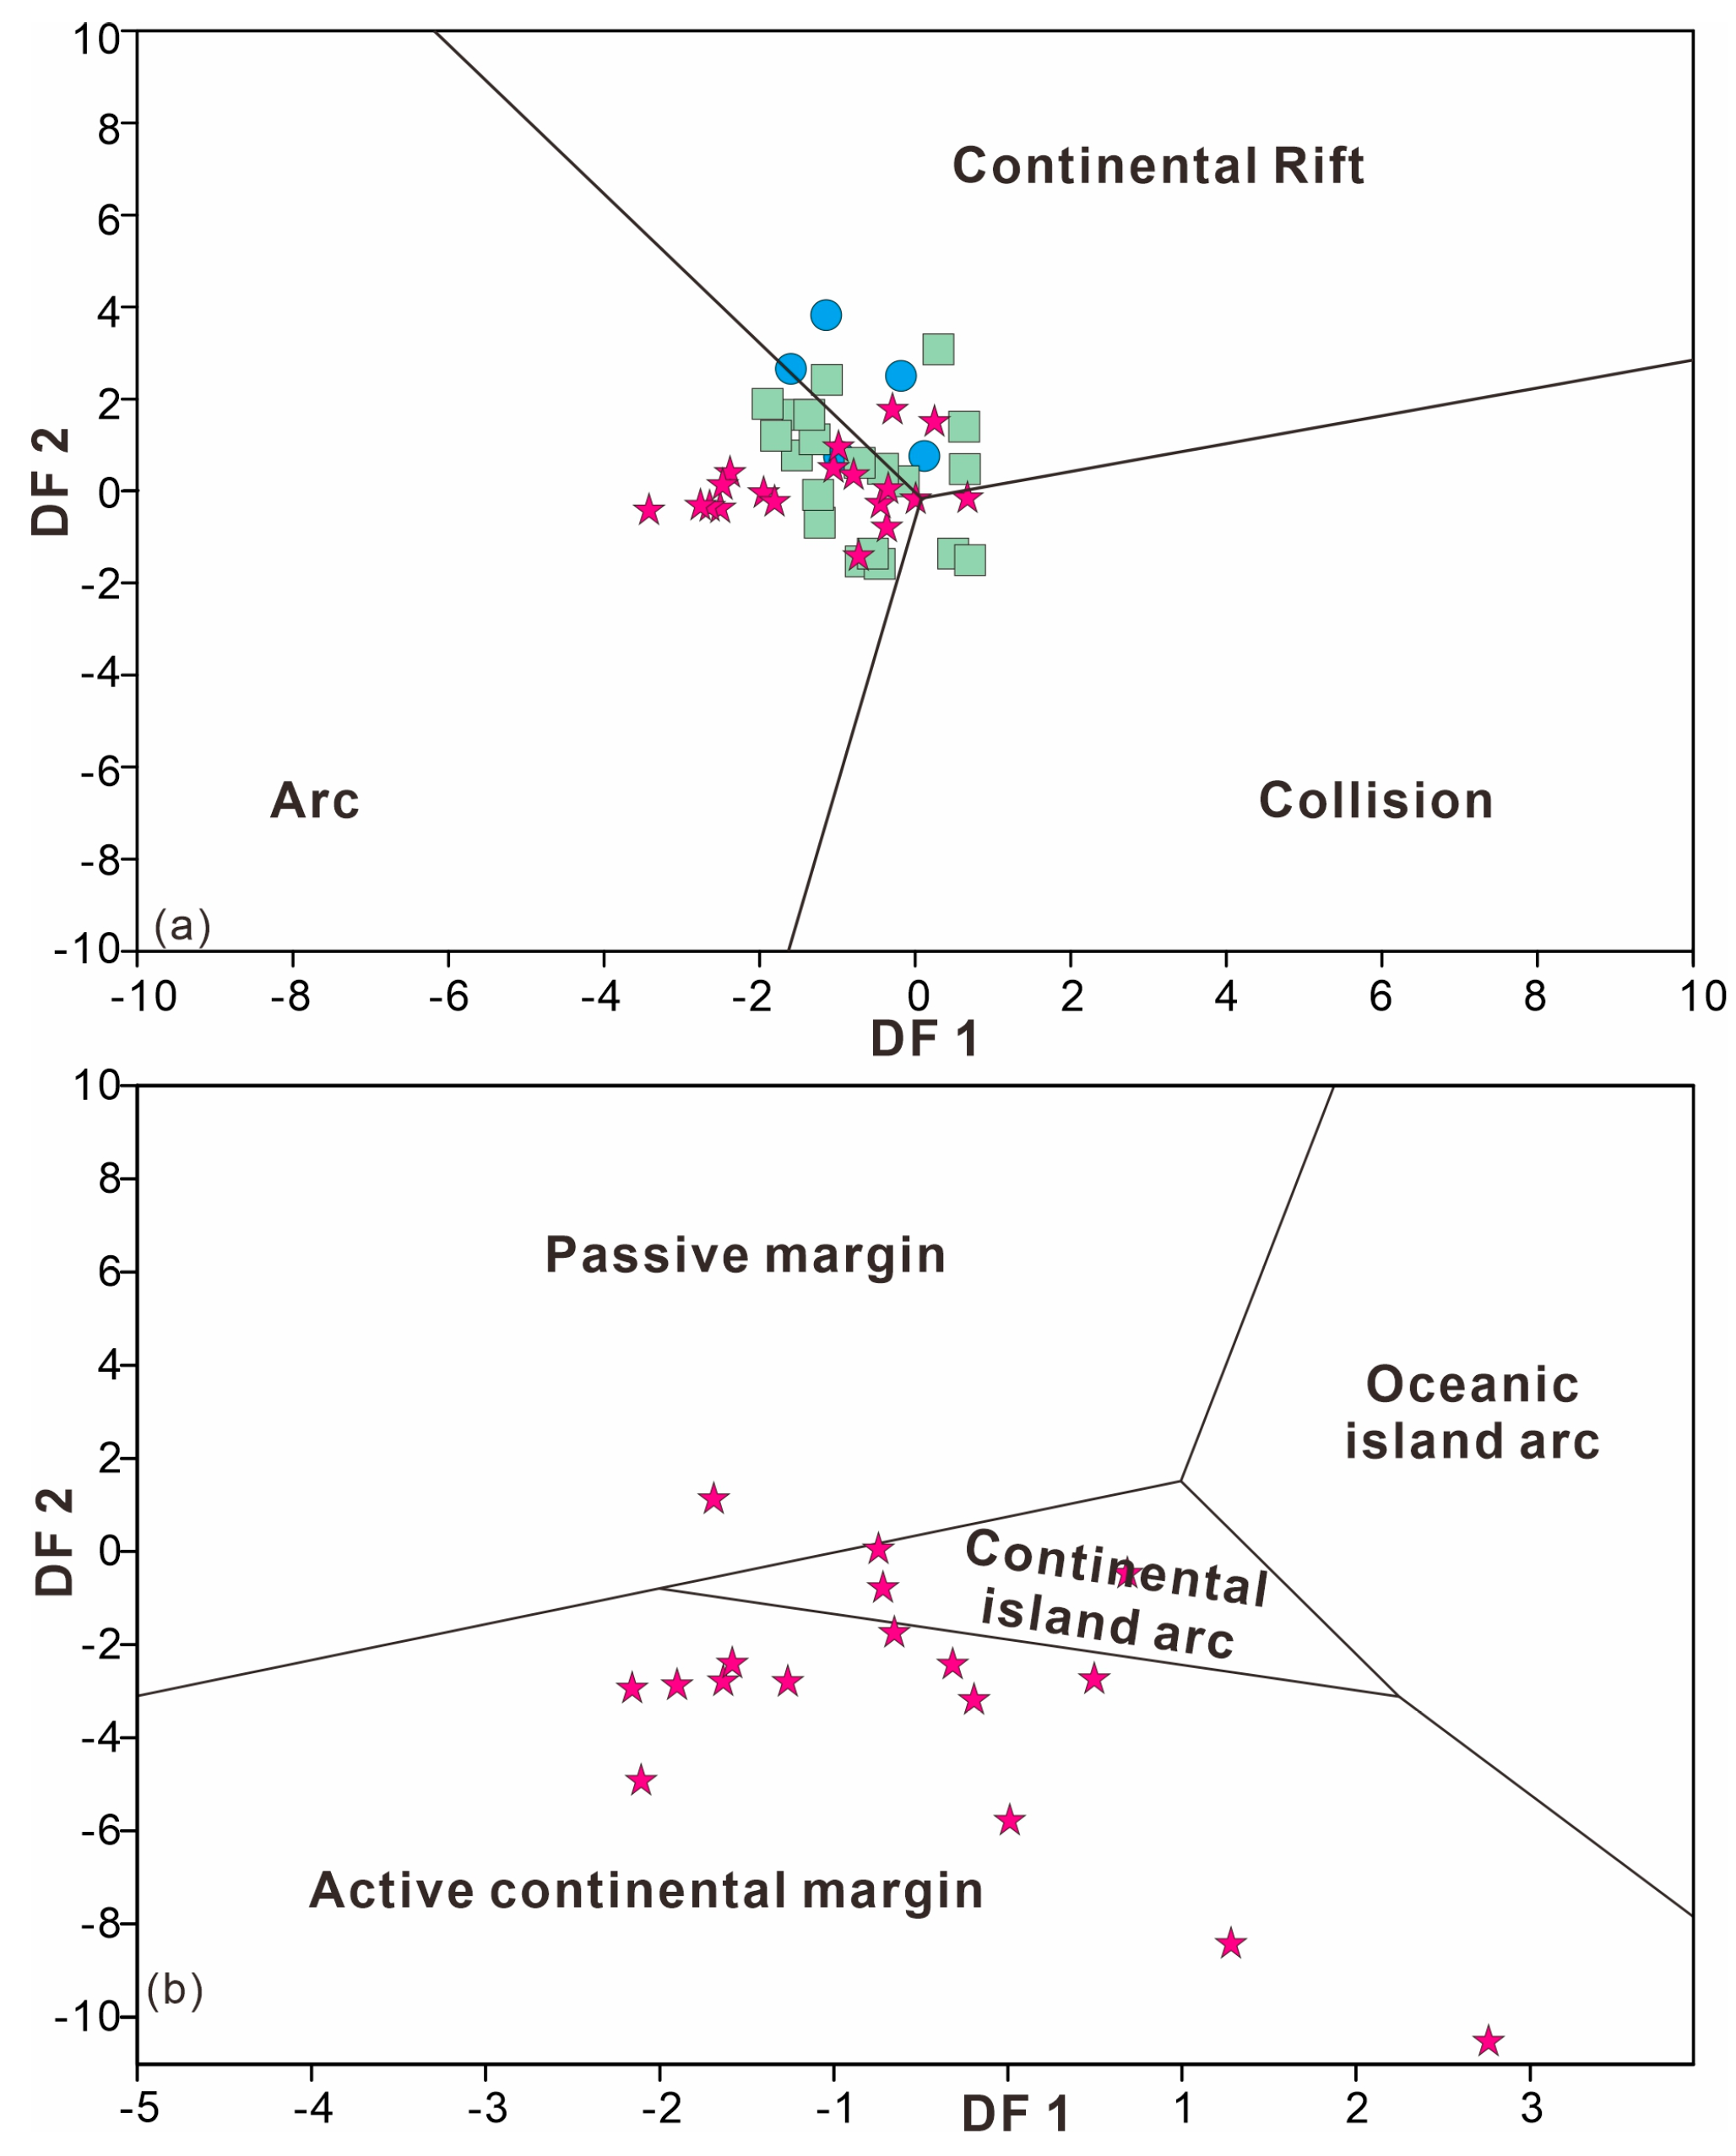
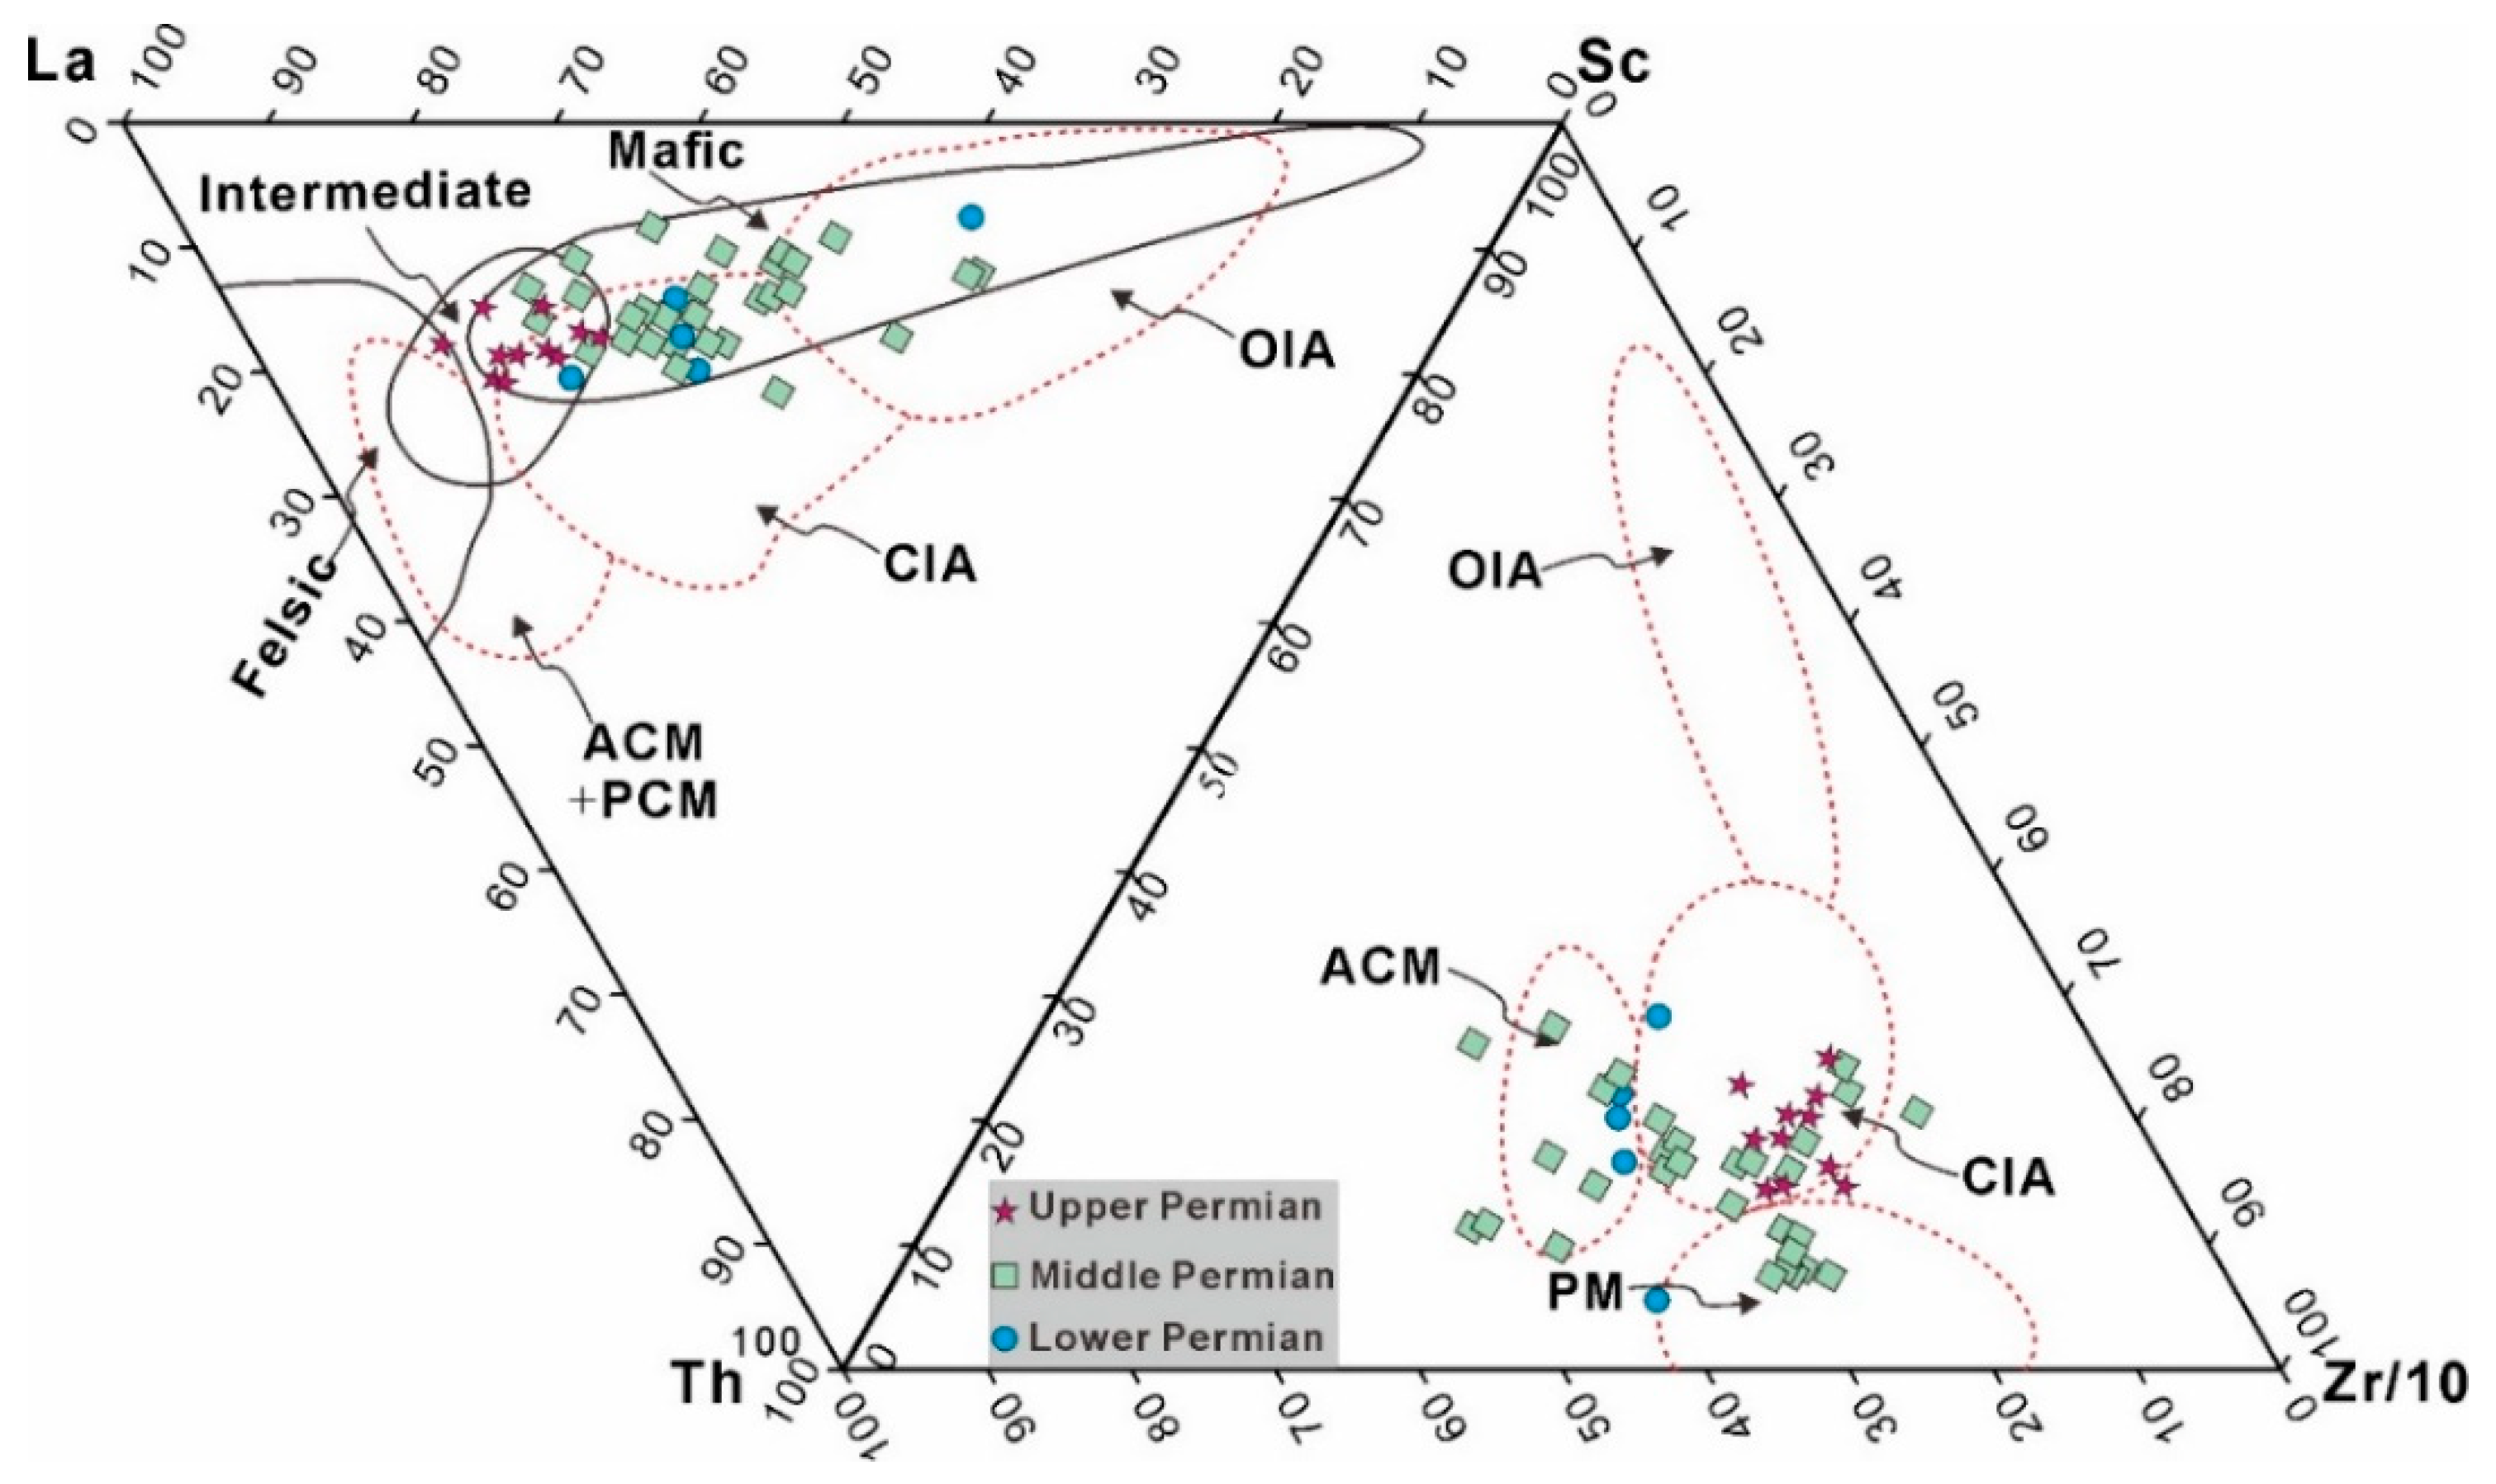
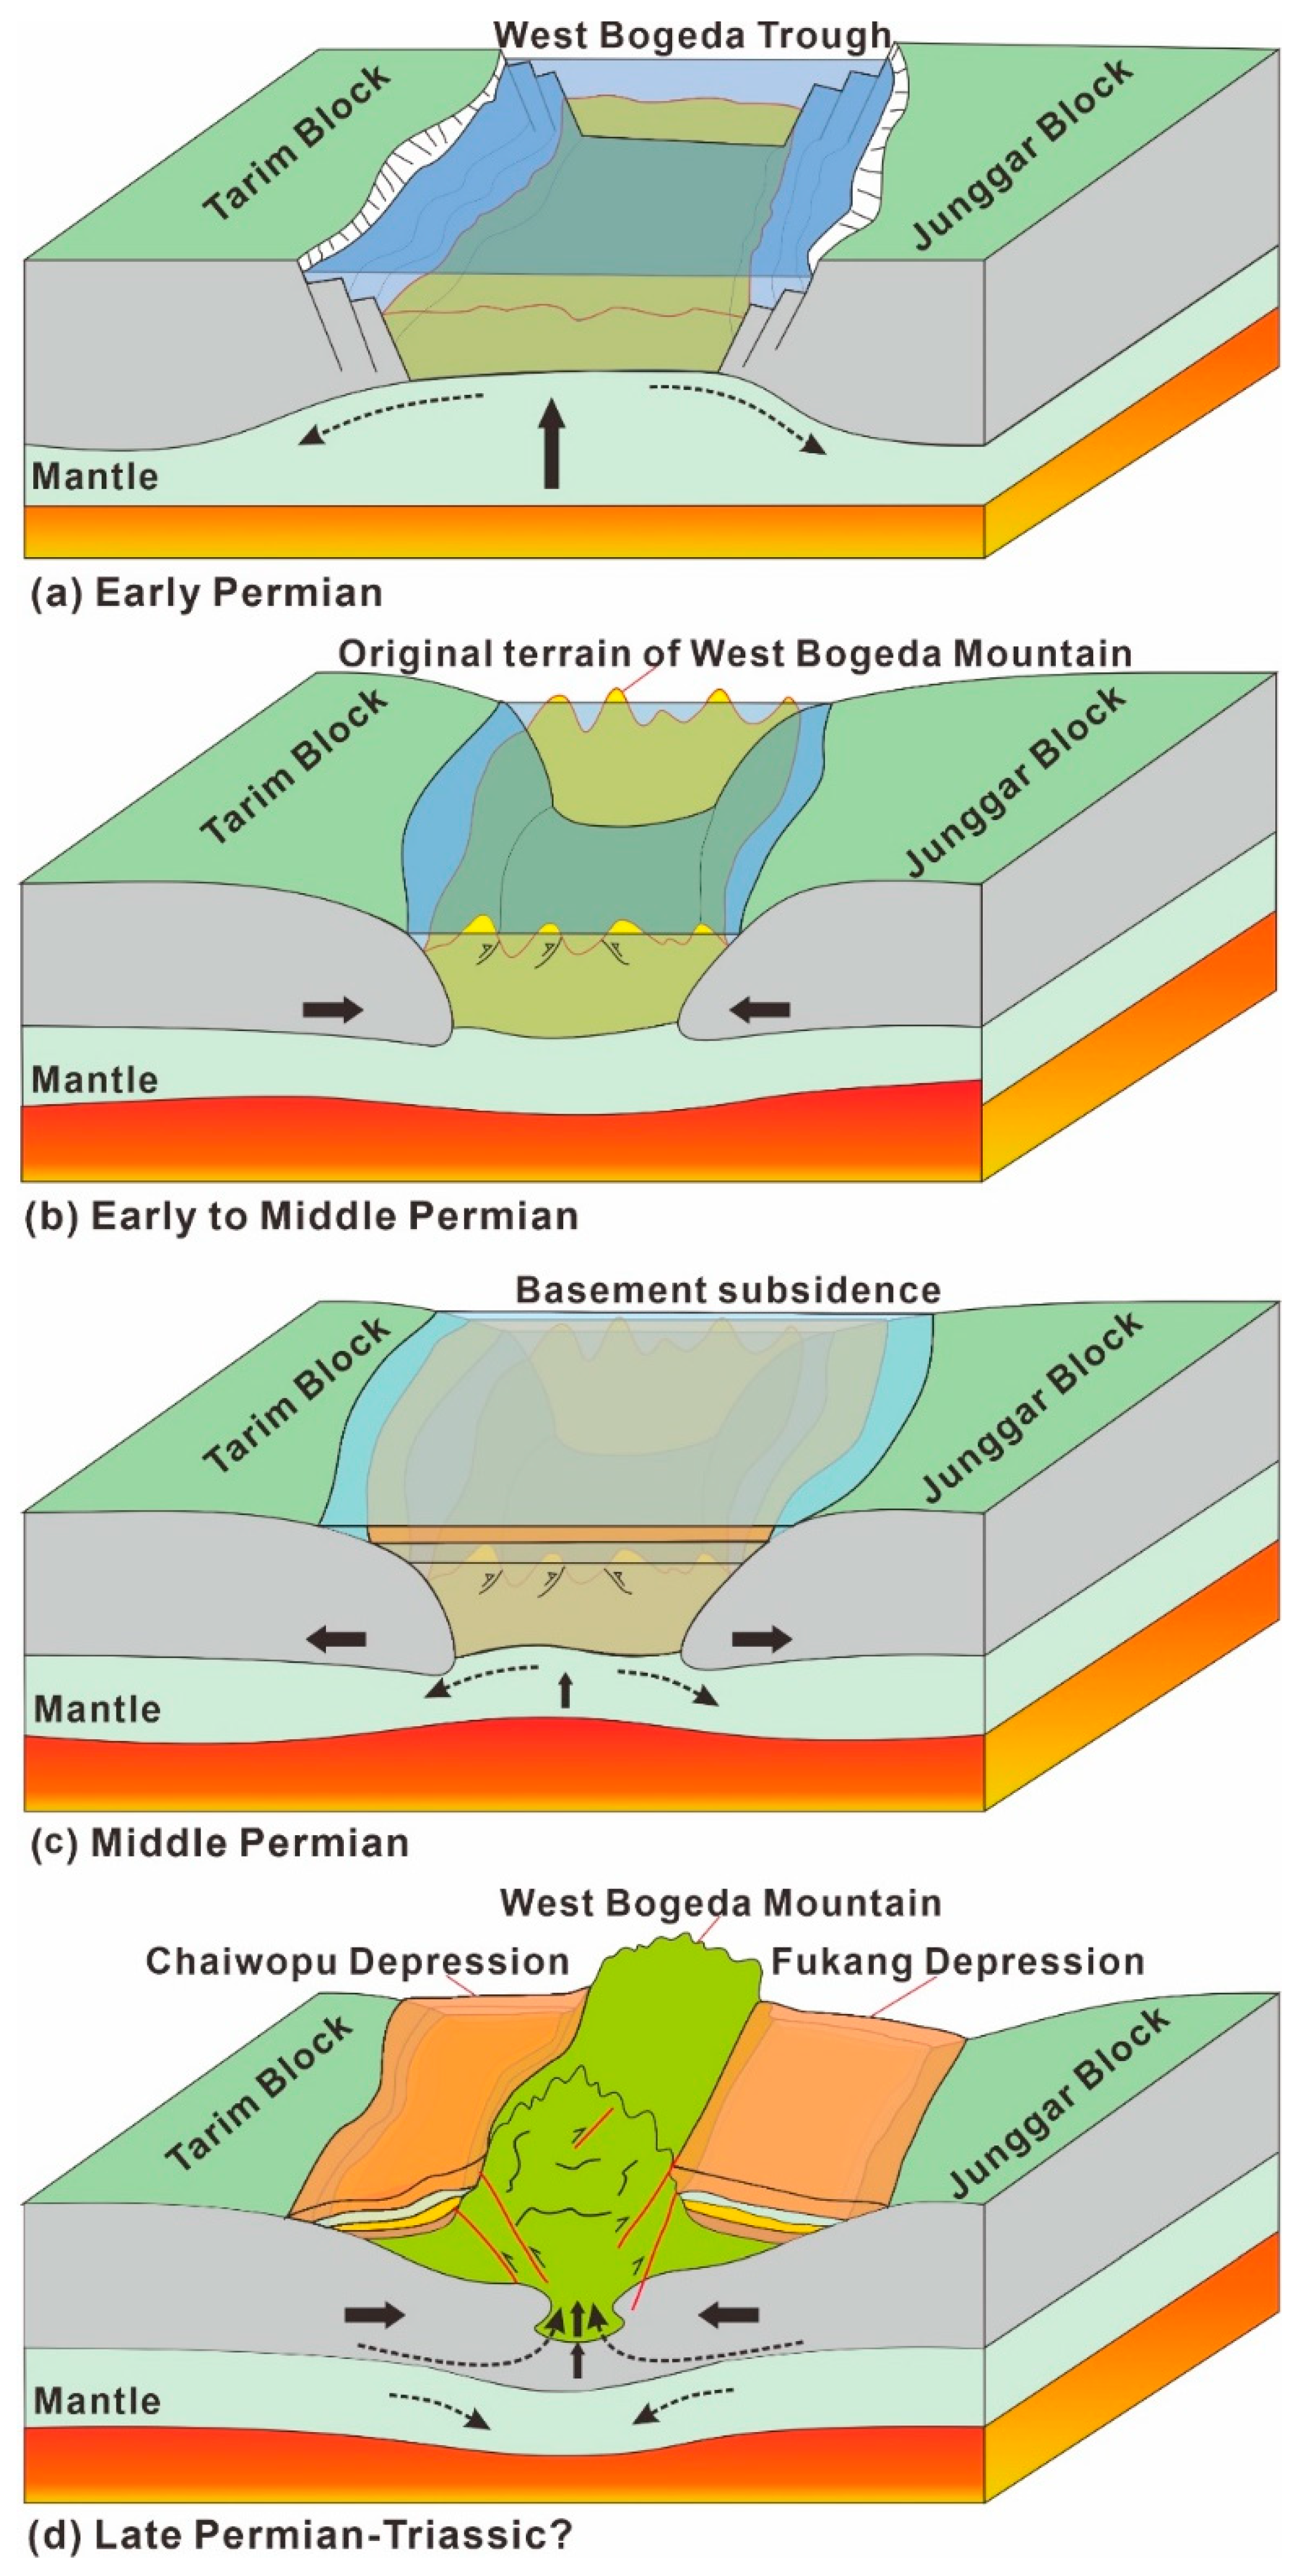
5.4. Tectonic Setting and Basin Evolution in the West Bogeda Shan

Discrimination diagrams for tectonic setting of siliciclastic sediments and sedimentary rocks are mostly based on geochemical compositions such as the contents of major and trace elements and their ratios [75,76,77]. To analyze the tectonic settings of the West Bogeda Shan, proxies of DF1 and DF2 are defined based on major elements components according to previous researches [78,79]. The discrimination diagram of DF1 versus DF2 suggests that the tectonic setting of the West Bogeda Shan in the Early Permian was dominated by a continental rift, and partly changed to island arc in the Middle Permian (Figure 11a) towards an active continental margin and continental island arc in the Late Permian (Figure 11b).
Abundant evidences of abrupt changes of depositional environments, provenance area and source rock composition and development of bimodal volcanic-sedimentary rock series corroborate to the hypothesized rift setting during the Early Permian [27,30]. The discrimination results based on the trace element compositions, such as La–Th–Sc and Th–Sc–Zr/10 ternary diagrams also suggest that almost all sedimentary rocks in the West Bogeda Shan were derived from mafic sources in the Permian. Meanwhile, a continental island arc is the preferred tectonic setting at the epoch of the Late Permian (Figure 12; Table 2).
In summary, the combination of detrital zircon geochronology, whole-rock geochemical and sedimentary characters suggest that the initial uplift of Bogeda Shan occurred in the Late Permian. Combined with previous studies, three tectonic phases characterized the basin evolution from a continental rift, post-rift extensional depression to continental arc (initial uplift).

5.4.1. Inheritance from Upper Carboniferous (Lower Permian)

The tectonic setting of Bogeda Shan during the Carboniferous has been long debated [80]. Geochemical data suggests that it was not an island arc as proposed by Sébastien Laurent-Charvet et al. [81] but could have been a continental rift during the Carboniferous and Early Permian. Geochemical investigations of volcanic rocks and turbiditic deposits as well as gravimetric and magnetic data suggest that Turpan Block and Junggar Block were separated in the end of the Early Permian due to extension and rift of the Bogeda area [56,58,82]. The rift setting was also demonstrated by a series of coarse clastic rocks with intercalations of pillow lava-vesicular basalt [57]. Then, the extension of the belt started to rollback, which formed the Paleo-Bogeda Shan. The combined evidences shown above indicate that the tectonic setting of continental rift in the Early Permian is similar to the Late Carboniferous setting (Figure 13a) [27,30]. The tectonic setting transformed from continental rift to inland arc was a result of the collision of the Junggar and Tarim Blocks at the end of the Early Permian. From this collision, the tectonic setting of West Bogeda Shan changed to intracontinental tectonic evolution stage, and the original terrain of West Bogeda formed (Figure 13b). At the end of the Early Permian, most parts of the terrain were still a submarine environment, while only small parts were lifted up [32,74,83,84,85].

5.4.2. Transitional Period (Middle Permian)

During early Middle Permian, depositional environment and tectonic setting were relatively stable, without intensive deformation and only some small scale of tectonic activities in the West Bogeda Shan [32,86]. Due to the relaxation of the compression and rebound of crust deformation, the island arc in the West Bogeda area received a large volume of sediments [54]. With a large sediment supply and incessant basement subsidence, the West Bogeda Shan basin closed during the Middle Permian (Figure 13c) [15,87]. Hence, the tectonic setting was post-rift extensional depression in the Middle Permian. This observation is consistent with some previous studies that reported the wide distribution of bimodal volcanic rocks in the Bogeda Shan [73] and some submarine olistostrome in the West Bogeda Shan [30]. Deformation and unconformity at the end of the Middle Permian also implies the onset tectonic evolution of the West Bogeda Shan.

5.4.3. Initial Uplift of West Bogeda (Upper Permian)

The integrated data from lithological observation and sedimentary geochemical analyses indicates that the provenance characteristics, geochemical composition, and tectonic setting of rocks in the Permian obviously changed from the Early-Middle to Late Permian. Meanwhile, according to previous studies, the powerful intracontinental collision occurred between the Junggar and Tarim Blocks occurred and initiated West Bogeda Shan uplift in the Late Permian (Figure 13d) [32,88]. Thus, this study confirms the previous recognition that the initial uplift of the Bogeda Shan happened in the Late Permian. Meanwhile, the depositional environment, sediment provenance and depositional center greatly changed as a response to the uplift of the Bogeda Shan.

6. Conclusions

This study presents the data of detailed zircon U-Pb geochronology and whole-rock geochemical compositions of Permian sandstones from the West Bogeda Shan, and discusses the provenances, source rock compositions, tectonic settings and basin evolution history. Several conclusions are summarized here.
(1) Detrital zircon U-Pb chronology suggests the sediments in the Lower-Middle Permian were inherited from the Carboniferous, showing one dominant age population with NTS and YCTS as the main source. However, two or three age populations are notable in the West Bogeda Shan during the periods of Middle Permian to Triassic, suggesting changing sediment provenances. REE series, especially Eu anomalies, also indicate the changes of sediment provenance in the Upper Permian.
(2) The sedimentary rocks in the West Bogeda originated from the mafic-dominant sources during the Early-Middle Permian but changed to lithologies are mixture of mafic and acidic arc sources in the Upper Permian. Besides, the Lower-Middle Permian dominated by wacke and the Upper Permian by litharenite and sublitharenite. The different source rock compositions between the Lower-Middle Permian and the Upper Permian resulted from the complex tectonic evolution of the Bogeda Shan in the Upper Permian.
(3) The provenance, lithology, and depositional environment were significantly changed from the Late Carboniferous to Late Permian. Strata deformation and unconformity also occurred at the end of Middle Permian, which was closely related to the uplift of West Bogeda Shan. Three stages characterized the tectonic evolution of the West Bogeda Shan, showing the continental rift in the Early Permian (inherited from the Upper Carboniferous), post-rift extensional depression in the Middle Permian, and continental arc in the Late Permian. With the initial uplift of Bogeda Shan in the Upper Permian, the depositional environment and sediment provenance changed significantly.

Supplementary Materials

The following are available online at https://0-www-mdpi-com.brum.beds.ac.uk/2075-163X/10/4/341/s1, Table S1: Carboniferous, Permian, Jurassic, and Standard sample, Table S2: major and trace elements.

Author Contributions

Writing—Original Draft Preparation by Y.L., Writing—Review and Editing by S.Y., X.H., W.Y., X.Y. and X.S., Data analysis and Figures by Y.L. and J.S., Sampling and Experiments by Y.L., X.Y. and Z.Y. All authors have read and agreed to the published version of the manuscript.

Funding

This work was partly supported by the National Natural Science Foundation of China (Grant No. 41730531, 41991324) and the National Programme on Global Change and Air-Sea Interaction (GASI-GEOGE-03).

Acknowledgments

The authors would like to thank S.L., Z.Y. and L.J. for their help during the field work.

Conflicts of Interest

The authors declare no conflict of interest.

Appendix A

Figure A1. U-Pb Concordia diagrams for zircon grains of the 7 sandstone samples. All of these data are excluded out of discordance >10%.
Minerals 10 00341 g0a1
Figure A2. Harker Variation Diagram of major elements for rock samples in the West of Bogeda Mountain, South Junggar. Data of Early and Middle Permian from Liu et al. [51]; Liu et al. [50].
Minerals 10 00341 g0a2
Figure A3. Selected Harker Variation Diagram of trace elements for rock samples in the West of Bogeda Mountain, South Junggar. Symbols are the same with Figure A2.
Minerals 10 00341 g0a3

References

  1. Charvet, J.; Shu, L.S.; Laurent-Charvet, S.; Wang, B.; Faure, M.; Cluzel, D.; Chen, Y.; De Jong, K. Palaeozoic tectonic evolution of the Tianshan belt, NW China. Sci. China Earth Sci. 2011, 54, 166–184. [Google Scholar] [CrossRef] [Green Version]
  2. Kröner, A.; Kovach, V.; Belousova, E.; Hegner, E.; Armstrong, R.; Dolgopolova, A.; Seltmann, R.; Alexeiev, D.V.; Hoffmann, J.E.; Wong, J.; et al. Reassessment of continental growth during the accretionary history of the Central Asian Orogenic Belt. Gondwana Res. 2014, 25, 103–125. [Google Scholar] [CrossRef]
  3. Xiao, W.J.; Windley, B.F.; Allen, M.B.; Han, C.M. Paleozoic multiple accretionary and collisional tectonics of the Chinese Tianshan orogenic collage. Gondwana Res. 2013, 23, 1316–1341. [Google Scholar] [CrossRef]
  4. Gao, J.; Long, L.L.; Klemd, R.; Qian, Q.; Liu, D.Y.; Xiong, X.M.; Wei, W.S.; Liu, Y.T.; Yang, W.F. Tectonic evolution of the South Tianshan orogen and adjacent regions, NW China: Geochemical and age constraints of granitoid rocks. Int. J. Earth Sci. 2009, 98, 1221–1238. [Google Scholar] [CrossRef]
  5. Hu, A.Q.; Jahn, B.; Zhang, G.X.; Chen, Y.B.; Zhang, Q.F. Crustal evolution and Phanerozoic crustal growth in northern Xinjiang: Nd isotopic evidence. Part I. Isotopic characterization of basement rocks. Tectonophysics 2000, 328, 15–51. [Google Scholar] [CrossRef]
  6. Jahn, B.; Wu, F.Y.; Chen, B. Granitoids of the Central Asian Orogenic Belt and continental growth in the Phanerozoic. Earth Environ. Sci. Trans. R. So. 2000, 91, 181–193. [Google Scholar]
  7. Wong, K.; Sun, M.; Zhao, G.C.; Yuan, C.; Xiao, W.J. Geochemical and geochronological studies of the Alegedayi Ophiolitic Complex and its implication for the evolution of the Chinese Altai. Gondwana Res. 2010, 18, 438–454. [Google Scholar] [CrossRef]
  8. Zhang, Y.; Li, Z.S.; Nie, F.; Tian, X.L.; Shi, Y.H. Age, provenance and tectonic evolution of Late Paleozoic strata in Bogda Mountain, Xinjiang: Evidence from detrital zircon U-Pb geochronology. China J. Geol. 2015, 50, 155–181, (In Chinese with English Abstract). [Google Scholar]
  9. Jolivet, M.; Gloria, H.; Robin, C.; Barrier, L.; Bourquin, S.; Guo, Z.; Jia, Y.; Guerit, L.; Yang, W.; Fu, B. Reconstructing the Late Palaeozoic-Mesozoic topographic evolution of the Chinese Tian Shan: Available data and remaining uncertainties. Adv. Geosci. 2013, 37, 7–18. [Google Scholar] [CrossRef] [Green Version]
  10. Wang, Z.X.; Li, T.; Zhou, G.Z.; Lu, M.A.; Liu, Y.Q.; Li, Y. Geological record of the late-carboniferous orogeny in Bogedashan, Northern Tianshan Mountains, Northwest China. Earth Sci. Front. 2003, 10, 63–70, (In Chinese with English Abstract). [Google Scholar]
  11. Choulet, F.; Chen, Y.; Wang, B.; Faure, M.; Cluzel, D.; Charvet, J.; Lin, W.; Xu, B. Late Paleozoic paleogeographic reconstruction of Western Central Asia based upon paleomagnetic data and its geodynamic implications. J. Asian Earth Sci. 2011, 42, 867–884. [Google Scholar] [CrossRef] [Green Version]
  12. Gao, J.; Li, M.S.; Xiao, X.C.; Tang, Y.Q.; He, G.Q. Paleozoic tectonic evolution of the Tianshan Orogen, northwestern China. Tectonophysics 1998, 287, 213–231. [Google Scholar] [CrossRef]
  13. Yu, C.H.; Jiang, Y.Q.; Liu, S.H. Jurassic sedimentary boundary between the Junggar and Turpan-Hami basins in Xinjiang. Sediment. Facies Palaeogeogr 1996, 16, 48–54, (In Chinese with English Abstract). [Google Scholar]
  14. Greene, T.J.; Carroll, A.R.; Hendrix, M.S.; Graham, S.A.; Wartes, M.A.; Abbink, O.A. Sedimentary Record of Mesozoic Deformation and Inception of the Turpan-Hami Basin, Northwest China; Geological Society of America: Boulder, CO, USA, 2001; pp. 317–340. [Google Scholar]
  15. Hendrix, M.S.; Graham, S.A.; Carroll, A.R.; Sobel, E.R.; Mcknight, C.L.; Schulein, B.J.; Wang, Z.X. Sedimentary record and climatic implications of recurrent deformation in the Tian Shan: Evidence from Mesozoic strata of the north Tarim, south Junggar, and Turpan basins, northwest China. Geol. Soc. Am. Bull. 1992, 104, 53–79. [Google Scholar] [CrossRef]
  16. Chen, K.; Wei, L.; Wang, Q. The Bogeda Shan uplifting: Evidence from multiple phases of deformation. J. Asian Earth Sci. 2015, 99, 1–12. [Google Scholar] [CrossRef]
  17. Fang, S.H.; Song, Y.; Jia, C.Z.; Wang, X.L.; Yuan, Q.D. The Mesozoic–Cenozoic clastic composition of Bogda area, Xinjiang: Implications on the evolution of basin–range pattern. Acta Geol. Sin. 2007, 81, 1229–1237, (In Chinese with English Abstract). [Google Scholar]
  18. Zhang, C.H.; Liu, D.B.; Zhang, C.L.; Wang, Z.Q.; Wang, Q.X. Stratigraphic constraints on the initial uplift age of Bogda Shan, Xinjiang, northwest China. Earth Sci. Front. 2005, 12, 294–302, (In Chinese with English Abstract). [Google Scholar]
  19. Guo, W.; Zhou, D.W.; Ouyang, Z.J.; Zhou, X.H. Structure features of olistostrome under Permian extension environment in Bogda Mountain Region. J. Northwest Univ. (Natural Sci.) 2011, 41, 658–675, (In Chinese with English Abstract). [Google Scholar]
  20. Xiao, W.J.; Zhang, L.C.; Qin, K.Z.; Sun, S.; Li, J.L. Paleozoic accretionary and collisional tectonics of the Eastern Tianshan (China): Implications for the continental growth of central Asia. Am. J. Sci. 2004, 304, 370–395. [Google Scholar] [CrossRef] [Green Version]
  21. Burtman, V.S. Structural geology of variscan Tien Shan, USSR. Am. J. Sci. 1975, 275, 157–186. [Google Scholar]
  22. Tapponnier, P.; Peltzer, G.; Armijo, R. On the mechanics of the collision between India and Asia. Geol. Soc. Lond. Spec. Publ. 1986, 19, 113–157. [Google Scholar] [CrossRef]
  23. Windley, B.F.; Allen, M.B.; Zhang, C.; Zhao, Z.Y.; Wang, G.R. Paleozoic accretion and Cenozoic redeformation of the Chinese Tien Shan range, central Asia. Geology 1990, 18, 128–131. [Google Scholar] [CrossRef]
  24. Chen, D.C.; Zhao, X.M.; Deng, J. U-Pb dating of Carboniferous sandstone detrital zircon from the north of the Bogda Mountains, eastern Xingjiang, and its geological significances. Acta Geol. Sin. 2010, 84, 1770–1780. [Google Scholar]
  25. XBGMR. Regional Geology of Xinjiang Uygur Autonomy Region; Geological Publishing House: Beijing, China, 1993. [Google Scholar]
  26. Wang, J.L.; Wu, C.D.; Li, Z.; Zhou, T.Q.; Wu, J.; Wang, J. The tectonic evolution of the Bogda region from Late Carboniferous to Triassic time: Evidence from detrital zircon U–Pb geochronology and sandstone petrography. Geol. Mag. 2018, 155, 1063–1088. [Google Scholar] [CrossRef]
  27. Yang, X.F.; He, D.F.; Wang, Q.C.; Tang, Y. Tectonostratigraphic evolution of the Carboniferous arc-related basin in the East Junggar Basin, northwest China: Insights into its link with the subduction process. Gondwana Res. 2012, 22, 1030–1046. [Google Scholar] [CrossRef]
  28. Lei, W.S.; Guo, J.F.; Chen, D.L.; Chu, J.P.; Li, Y. Ductile shearing and LA-ICP MS zircon U–Pb dating of S a’erqiaoke ductile shear belt in the B ogda orogen: Constraints on the process of mountain building of eastern Tianshan. Geol. J. 2018, 53, 206–222. [Google Scholar] [CrossRef]
  29. Obrist-Farner, J.; Yang, W.; Hu, X. Nonmarine time-stratigraphy in a rift setting: An example from the Mid-Permian lower Quanzijie low-order cycle Bogda Mountains, NW China. J. Palaeogeogr. 2015, 4, 27–51. [Google Scholar] [CrossRef] [Green Version]
  30. Shu, L.S.; Wang, B.; Zhu, W.B.; Guo, Z.J.; Charvet, J.; Zhang, Y. Timing of initiation of extension in the Tianshan, based on structural, geochemical and geochronological analyses of bimodal volcanism and olistostrome in the Bogda Shan (NW China). Int. J. Earth Sci. 2011, 100, 1647–1663. [Google Scholar] [CrossRef] [Green Version]
  31. Thomas, S.G.; Tabor, N.J.; Yang, W.; Myers, T.S.; Yang, Y.; Wang, D. Palaeosol stratigraphy across the Permian–Triassic boundary, Bogda Mountains, NW China: Implications for palaeoenvironmental transition through earth’s largest mass extinction. Palaeogeogr. Palaeoclimatol. Palaeoecol. 2011, 308, 41–64. [Google Scholar] [CrossRef]
  32. Wang, J.L.; Wu, C.D.; Li, Z.; Zhou, T.Q.; Wu, J.; Wang, J. Whole-rock geochemistry and zircon Hf isotope of L ate C arboniferous–T riassic sediments in the Bogda region, NW C hina: Clues for provenance and tectonic setting. Geol. J. 2018, 54, 1853–1877. [Google Scholar] [CrossRef]
  33. Wartes, M.A.; Carroll, A.R.; Greene, T.J. Permian sedimentary record of the Turpan-Hami basin and adjacent regions, northwest China: Constraints on postamalgamation tectonic evolution. Geol. Soc. Am. Bull. 2002, 114, 131–152. [Google Scholar] [CrossRef] [Green Version]
  34. Yue, W.; Jin, B.F.; Zhao, B.C. Transparent heavy minerals and magnetite geochemical composition of the Yangtze River sediments: Implication for provenance evolution of the Yangtze Delta. Sediment. Geol. 2018, 364, 42–52. [Google Scholar] [CrossRef]
  35. Guo, L.; Zhang, H.F.; Harris, N.; Xu, W.C.; Pan, F.B. Detrital zircon U–Pb geochronology, trace-element and Hf isotope geochemistry of the metasedimentary rocks in the Eastern Himalayan syntaxis: Tectonic and paleogeographic implications. Gondwana Res. 2017, 41, 207–221. [Google Scholar] [CrossRef]
  36. Dunkl, I.; Mikes, D.; Frei, D.; Gerdes, A.; Tolosana-Delgado, R.; Von Eynatten, H. UranOS: Data Reduction Program for Time-resolved U/Pb Analyses. Available online: http://www.sediment.uni-goettingen.de/staff/dunkl/software/uranos.html (accessed on 10 April 2020).
  37. Stacey, J.S.; Kramers, J.D. Approximation of terrestrial lead isotope evolution by a two-stage model. Earth Planet. Sci. Lett. 1975, 26, 207–221. [Google Scholar] [CrossRef]
  38. Gehrels, G. Detrital zircon U-Pb geochronology applied to tectonics. Annu. Rev. Earth Planet. Sci. 2014, 42, 127–149. [Google Scholar] [CrossRef]
  39. Page, F.Z.; Fu, B.; Kita, N.T.; Fournelle, J.; Spicuzza, M.J.; Schulze, D.J.; Viljoen, F.; Basei, M.A.S.; Valley, J.W. Zircons from kimberlite: New insights from oxygen isotopes, trace elements, and Ti in zircon thermometry. Geochim. Cosmochim. Acta 2007, 71, 3887–3903. [Google Scholar] [CrossRef]
  40. Wiedenbeck, M.P.; Corfu, A.F.; Griffin, W.L.; Meier, M.; Oberli, F.; Von, Q.A.; Roddick, J.C.; Spiegel, W. Three natural zircon standards for U-Th-Pb, Lu-Hf, trace element and REE analyses. Geostand. Newsl. 1995, 19, 1–23. [Google Scholar] [CrossRef]
  41. Sláma, J.; Košler, J.; Condon, D.J.; Crowley, J.L.; Gerdes, A.; Hanchar, J.M.; Horstwood, M.S.A.; Morris, G.A.; Nasdala, L.; Norberg, N.; et al. Plešovice zircon—A new natural reference material for U–Pb and Hf isotopic microanalysis. Chem. Geol. 2008, 249, 1–35. [Google Scholar] [CrossRef]
  42. Raczek, I.; Stoll, B.; Hofmann, A.W.; Peter Jochum, K. High-Precision Trace Element Data for the USGS Reference Materials BCR-1, BCR-2, BHVO-1, BHVO-2, AGV-1, AGV-2, DTS-1, DTS-2, GSP-1 and GSP-2 by ID-TIMS and MIC-SSMS. Geostand. Newsl. 2001, 25, 77–86. [Google Scholar] [CrossRef]
  43. Guo, Y.L.; Yang, S.Y.; Su, N.; Li, C.; Yin, P.; Wang, Z.B. Revisiting the effects of hydrodynamic sorting and sedimentary recycling on chemical weathering indices. Geochim. Cosmochim. Acta 2018, 227, 48–63. [Google Scholar] [CrossRef]
  44. Liu, D.D.; Marc, J.; Yang, W.; Zhang, Z.Y.; Cheng, F.; Zhu, B.; Guo, Z.J. Latest Paleozoic–Early Mesozoic basin–range interactions in South Tian Shan (northwest China) and their tectonic significance: Constraints from detrital zircon U–Pb ages. Tectonophysics 2013, 599, 197–213. [Google Scholar] [CrossRef]
  45. Hou, T.; Zhang, Z.C.; Santosh, M.; Encarnacion, J.; Zhu, J.; Luo, W.J. Geochronology and geochemistry of submarine volcanic rocks in the Yamansu iron deposit, Eastern Tianshan Mountains, NW China: Constraints on the metallogenesis. Ore Geol. Rev. 2014, 56, 487–502. [Google Scholar] [CrossRef]
  46. Xie, W.; Luo, Z.Y.; Chen, Y.B.; Hong, L.B.; Ma, L.; Ma, Q. Petrogenesis and geochemistry of the Late Carboniferous rear-arc (or back-arc) pillow basaltic lava in the Bogda Mountains, Chinese North Tianshan. Lithos 2016, 244, 30–42. [Google Scholar] [CrossRef]
  47. Xie, W.; Xu, Y.G.; Chen, Y.B.; Luo, Z.Y.; Hong, L.B.; Ma, L.; Liu, H.Q. High-alumina basalts from the Bogda Mountains suggest an arc setting for Chinese Northern Tianshan during the Late Carboniferous. Lithos 2016, 256, 165–181. [Google Scholar] [CrossRef]
  48. Kirkland, C.L.; Smithies, R.H.; Taylor, R.; Evans, N.; McDonald, B. Zircon Th/U ratios in magmatic environs. Lithos 2015, 212, 397–414. [Google Scholar] [CrossRef]
  49. Su, B.X.; Qin, K.Z.; Sakyi, P.A.; Li, X.H.; Yang, Y.H.; Sun, H.; Tang, D.M.; Liu, P.P.; Xiao, Q.H.; Malaviarachchi, P.K. U–Pb ages and Hf–O isotopes of zircons from Late Paleozoic mafic–ultramafic units in the southern Central Asian Orogenic Belt: Tectonic implications and evidence for an Early-Permian mantle plume. Gondwana Res. 2011, 20, 516–531. [Google Scholar] [CrossRef]
  50. Liu, D.D.; Zhang, C.; Yao, E.D.; Song, Y.; Jiang, Z.X.; Luo, Q. What generated the Upper Permian to Triassic unconformities in the southern Junggar Basin and western Turpan Basin; tectonic uplift, or increasing aridity? Palaeogeogr. Palaeoclimatol. Palaeoecol. 2017, 468, 1–17. [Google Scholar] [CrossRef]
  51. Liu, D.D.; Kong, X.Y.; Zhang, C.; Wang, J.B.; Yang, D.X.; Liu, X.Y.; Wang, X.P.; Song, Y. Provenance and geochemistry of Lower to Middle Permian strata in the southern Junggar and Turpan basins: A terrestrial record from mid-latitude NE Pangea. Palaeogeogr. Palaeoclimatol. Palaeoecol. 2018, 495, 259–277. [Google Scholar] [CrossRef]
  52. Cawood, P.A.; Nemchin, A.A.; Freeman, M.; Sircombe, K. Linking source and sedimentary basin: Detrital zircon record of sediment flux along a modern river system and implications for provenance studies. Earth Planet. Sci. Lett. 2003, 210, 259–268. [Google Scholar] [CrossRef]
  53. Deng, K.; Yang, S.Y.; Li, C.; Su, N.; Bi, L.; Chang, Y.P.; Chang, S.C. Detrital zircon geochronology of river sands from Taiwan: Implications for sedimentary provenance of Taiwan and its source link with the east China mainland. Earth-Sci. Rev. 2017, 164, 31–47. [Google Scholar] [CrossRef]
  54. Wang, Z.X.; Li, T.; Zhang, J.; Liu, Y.Q.; Ma, Z.J. The uplifting process of the Bogda Mountain during the Cenozoic and its tectonic implication. Sci. China Ser. D. 2008, 51, 579–593. [Google Scholar] [CrossRef]
  55. Greene, T.J.; Carroll, A.R.; Wartes, M.; Graham, S.A.; Wooden, J.L. Integrated provenance analysis of a complex orogenic terrane: Mesozoic uplift of the Bogda Shan and inception of the Turpan-Hami Basin, NW China. J. Sediment. Res. 2005, 75, 251–267. [Google Scholar] [CrossRef] [Green Version]
  56. Ji, H.J.; Tao, H.F.; Wang, Q.; Ma, D.X.; Hao, L.W. Petrography, geochemistry, and geochronology of Lower Jurassic sedimentary rocks from the Northern Tianshan (West Bogda area), Northwest China: Implications for provenance and tectonic evolution. Geol. J. 2018, 54, 1688–1714. [Google Scholar] [CrossRef]
  57. Wang, J.; Cao, Y.C.; Wang, X.T.; Liu, K.Y.; Wang, Z.K.; Xu, Q.S. Sedimentological constraints on the initial uplift of the West Bogda Mountains in Mid-Permian. Sci. Rep. 2018, 8, 1–14. [Google Scholar] [CrossRef] [PubMed] [Green Version]
  58. Carroll, A.R.; Graham, S.A.; Hendrix, M.S.; Ying, D.; Zhou, D. Late Paleozoic tectonic amalgamation of northwestern China: Sedimentary record of the northern Tarim, northwestern Turpan, and southern Junggar basins. Geol. Soc. Am. Bull. 1995, 107, 571–594. [Google Scholar] [CrossRef]
  59. Lewin, A.; Meinhold, G.; Hinderer, M.; Dawit, E.L.; Bussert, R. Provenance of sandstones in Ethiopia during Late Ordovician and Carboniferous–Permian Gondwana glaciations: Petrography and geochemistry of the Enticho Sandstone and the Edaga Arbi Glacials. Sediment. Geol. 2018, 375, 188–202. [Google Scholar] [CrossRef] [Green Version]
  60. McLennan, S.M.; McCulloch, M.T.; Taylor, S.R.; Maynard, J.B. Effects of sedimentary sorting on neodymium isotopes in deep-sea turbidites. Nature 1989, 337, 547–549. [Google Scholar] [CrossRef]
  61. Nelson, B.K.; DePaolo, D.J. Comparison of isotopic and petrographic provenance indicators in sediments from Tertiary continental basins of New Mexico. J. Sediment. Res. 1988, 58, 348–357. [Google Scholar]
  62. Yang, S.Y.; Jung, H.S.; Choi, M.S.; Li, C.X. The rare earth element compositions of the Changjiang (Yangtze) and Huanghe (Yellow) river sediments. Earth Planet. Sci. Lett. 2002, 201, 407–419. [Google Scholar] [CrossRef]
  63. Taylor, S.R.; McLennan, S.M. The Continental Crust: Its Composition and Evolution; Blackwell: Oxford, UK, 1985; pp. 1–312. [Google Scholar]
  64. Zhang, X.R.; Zhao, G.C.; Paul, R.E.; Sun, M.; Han, Y.G.; Hou, W.Z.; Liu, D.X.; Wang, B.; Liu, Q.; Xu, B. Paleozoic magmatism and metamorphism in the Central Tianshan block revealed by U–Pb and Lu–Hf isotope studies of detrital zircons from the South Tianshan belt, NW China. Lithos 2015, 233, 193–208. [Google Scholar] [CrossRef]
  65. Huang, B.; Fu, D.; Kusky, T.; Ruan, K.; Zhou, W.X.; Zhang, X.H. Sedimentary provenance in response to Carboniferous arc-basin evolution of East Junggar and North Tianshan belts in the southwestern Central Asian Orogenic Belt. Tectonophysics 2018, 722, 324–341. [Google Scholar] [CrossRef]
  66. McLennan, S.M.; Hemming, S.; McDaniel, D.K.; Hanson, G.N. Geochemical Approaches to Sedimentation, Provenance, and Tectonics; Geological Society of America: Boulder, CO, USA, 1993; p. 21. [Google Scholar]
  67. Floyd, P.A.; Leveridge, B.E. Tectonic environment of the Devonian Gramscatho basin, south Cornwall: Framework mode and geochemical evidence from turbiditic sandstones. J. Geol. Soc. 1987, 144, 531–542. [Google Scholar] [CrossRef]
  68. Allegre, C.J.; Minster, J.F. Quantitative models of trace element behavior in magmatic processes. Earth Planet. Sci. Lett. 1978, 38, 1–25. [Google Scholar] [CrossRef]
  69. Herron, M.M. Geochemical classification of terrigenous sands and shales from core or log data. J. Sediment. Res. 1988, 58, 820–829. [Google Scholar]
  70. Pettijohn, F.J.; Potter, P.E.; Siever, R. Production and Provenance of Sand and Sandstone; Springer: Berlin/Heidelberg, Germany, 1972; pp. 294–326. [Google Scholar]
  71. Condie, K.C. Chemical composition and evolution of the upper continental crust: Contrasting results from surface samples and shales. Chem. Geol. 1993, 104, 1–37. [Google Scholar] [CrossRef]
  72. Suttner, L.J.; Dutta, P.K. Alluvial sandstone composition and paleoclimate; I, Framework mineralogy. J. Sediment. Res. 1986, 56, 329–345. [Google Scholar]
  73. Chen, X.J.; Shu, L.S.; Santosh, M. Late Paleozoic post-collisional magmatism in the Eastern Tianshan Belt, Northwest China: New insights from geochemistry, geochronology and petrology of bimodal volcanic rocks. Lithos 2011, 127, 581–598. [Google Scholar] [CrossRef]
  74. Xie, W.; Xu, Y.G.; Luo, Z.Y.; Liu, H.Q.; Hong, L.B.; Ma, L. Petrogenesis and geodynamic implications of the Late Carboniferous felsic volcanics in the Bogda belt, Chinese Northern Tianshan. Gondwana Res. 2016, 39, 165–179. [Google Scholar] [CrossRef]
  75. Bhatia, M.R.; Crook, K.A. Trace element characteristics of graywackes and tectonic setting discrimination of sedimentary basins. Contrib. Mineral. Petr. 1986, 92, 181–193. [Google Scholar] [CrossRef]
  76. Roser, B.P.; Korsch, R.J. Determination of tectonic setting of sandstone-mudstone suites using SiO2 content and K2O/Na2O ratio. J. Geol. 1986, 94, 635–650. [Google Scholar] [CrossRef]
  77. Gabo, J.A.S.; Dimalanta, C.B.; Asio, M.G.S.; Queaño, K.L.; YumulJr, G.P.; Imaie, A. Geology and geochemistry of the clastic sequences from Northwestern Panay (Philippines): Implications for provenance and geotectonic setting. Tectonophysics 2009, 479, 111–119. [Google Scholar] [CrossRef]
  78. Verma, S.P.; Armstrong-Altrin, J.S. New multi-dimensional diagrams for tectonic discrimination of siliciclastic sediments and their application to Precambrian basins. Chem. Geol. 2013, 355, 117–133. [Google Scholar] [CrossRef]
  79. Bhatia, M.R. Plate tectonics and geochemical composition of sandstones. J. Geol. 1983, 91, 611–627. [Google Scholar] [CrossRef]
  80. Wang, X.W.; Wang, X.W.; Ma, Y.S. The tectonic evolution of Bogda Mountain, Xinjiang, Northwest China and its relationship to oil and gas accumulation. Geoscience 2007, 21, 116–124, (In Chinese with English Abstract). [Google Scholar]
  81. Laurent, C.S.; Charvet, J.; Monié, P.; Shu, L. Late Paleozoic strike-slip shear zones in eastern Central Asia (NW China): New structural and geochronological data. Tectonics 2003, 22, 1–24. [Google Scholar]
  82. Yang, W.; Marc, J.; Guillaume, D.N.; Guo, Z.J.; Zhang, Z.C.; Wu, C.D. Source to sink relations between the Tian Shan and Junggar Basin (northwest China) from Late Palaeozoic to Quaternary: Evidence from detrital U-Pb zircon geochronology. Basin Res. 2013, 25, 219–240. [Google Scholar] [CrossRef]
  83. Simonov, V.A.; Mikolaichuk, A.V.; Safonova, I.Y.; Kotlyarov, A.V.; Kovyazin, S.V. Late Paleozoic–Cenozoic intra-plate continental basaltic magmatism of the Tienshan–Junggar region in the SW Central Asian Orogenic Belt. Gondwana Res. 2015, 27, 1646–1666. [Google Scholar] [CrossRef]
  84. Carroll, A.R.; Liang, Y.H.; Graham, S.A.; Xiao, X.C.; Hendrix, M.S.; Chu, J.C.; McKnight, C.L. Junggar basin, northwest China: Trapped Late Paleozoic Ocean. Tectonophysics 1990, 181, 1–14. [Google Scholar] [CrossRef]
  85. Xiao, W.J.; Han, C.M.; Yuan, C.; Sun, M.; Lin, S.F.; Chen, H.L.; Li, Z.L.; Li, J.L.; Sun, S. Middle Cambrian to Permian subduction-related accretionary orogenesis of Northern Xinjiang, NW China: Implications for the tectonic evolution of central Asia. J. Asian Earth Sci. 2008, 32, 102–117. [Google Scholar] [CrossRef]
  86. Gao, H.H.; He, D.F.; Tong, X.G.; Wen, Z.X.; Wang, Z.M. Tectonic-depositional environment and proto-type basins evolution of the Late Ordovician in the Tarim Basin. In Proceedings of the 19th EGU General Assembly, Vienna, Austria, 23–28 April 2017; Volume 19, p. 11218. [Google Scholar]
  87. Yang, W.; Feng, Q.; Liu, Y.Q.; Neil, T.; Dan, M.; James, L.C.; Lin, J.Y.; Thomas, S. Depositional environments and cyclo-and chronostratigraphy of uppermost Carboniferous–Lower Triassic fluvial–lacustrine deposits, southern Bogda Mountains, NW China—A terrestrial paleoclimatic record of mid-latitude NE Pangea. Glob. Planet. Chang. 2010, 73, 15–113. [Google Scholar] [CrossRef]
  88. Obrist-Farner, J.; Yang, W. Provenance and depositional conditions of fluvial conglomerates and sandstones and their controlling processes in a rift setting, mid-Permian lower and upper Quanzijie low order cycles, Bogda Mountains, NW China. J. Asian Earth Sci. 2017, 138, 317–340. [Google Scholar] [CrossRef]
Figure 1. The sketch map of Junggar basin and the strata of Dalongkou section. (a) Maps show the study region, the Central Asian Orogenic Belt, Tianshan Mountains, and Bogeda Shan; (b) a map of Bogeda Shan; (c) strata distribution of the Dalongkou section.
Minerals 10 00341 g001
Figure 2. Chronology and lithostratigraphy of the Permian strata around the Bogeda Shan, southern Junggar Basin, NW China [33].
Minerals 10 00341 g002
Figure 3. Panorama of the Upper Permian Wutonggou Formation and sampling location for zircon chronology analysis. (a) Panorama of Dalong kou section. (b) Lithology column of P3wt. (c) Photomicrographs of the sandstone samples of P3wt. (d) Plant fragements were found in thin section. (e) Serious strata deformation in P2l (the end of Middle Permian). (f) and (g) Conglomerates of P3q. (h) and (i) Sandstone of P3wt. (j) and (k) Bivalve and plant fragements were distributed in sandstone.
Minerals 10 00341 g003
Figure 4. Representative cathodoluminescence (CL) images of detrital zircons from the Upper Permian rocks, west of Bogeda Shan, NW China.
Minerals 10 00341 g004
Figure 5. Zircon U-Pb ages versus Th/U ratios of the Upper Permian Wutonggou Formation. The dashed line is Th/U = 0.1.
Minerals 10 00341 g005
Figure 6. Age distribution of all the samples. (a) Age of standard samples 91500 and Plešovice. The age of 91500 and PLE were 1062.8 ± 9.9 Ma and 336.1 ± 3.1 Ma respectively; which were very close to reference ages. (b) Distribution characteristics of samples. Most of the zircon grains formed during the Carboniferous period in the West Bogeda Shan. The t/σ on X-axis indicates the precision.
Minerals 10 00341 g006
Figure 7. Probability-density-frequency plots and number histograms of U-Pb ages of detrital zircons. (a) Upper Permian, (b) Upper Carboniferous to Lower Triassic. Data of Carboniferous are from [24,45,46,47]; Data of Lower Permian and Middle Permian are from [8,44]; Data for Triassic are from [56]. (c) Paleo-current of Lower Permian [57], Middle Permian [58] and Upper Permian to Lower Triassic [15]. N is total measured grains, and n is grains with 90–110% concordance.
Minerals 10 00341 g007
Figure 8. Compositions of sedimentary rock samples in the Dickinson ternary diagrams of Lower, Middle, and Upper Permian, West Bogeda Shan, NW China, modified after [57,59]. Qt: Quartz; F: Feldspar; L: Lithic.
Minerals 10 00341 g008
Figure 9. Chondrite-normalized rare earth element (REE) diagrams for the sedimentary samples [63]. (a) Chondrite-normalized REE diagrams of Lower Permian. (b) Chondrite-normalized REE diagrams of Middle Permian. (c) Chondrite-normalized REE diagrams of Upper Permian. Data of Lower-Middle Permian from previously published papers, while the data of Upper Permian is from this study.
Minerals 10 00341 g009
Figure 10. Discrimination provenance diagrams for sedimentary rocks from Carboniferous to Upper Permian of West Bogeda Shan. (a) Diagram of Th/Sc vs Zr/Sc [66]; (b) REE vs La/Yb [68]; (c) geochemical classification of clastic rocks [69,70]; (d) diagram of La/Th vs Hf [67]. (e) Diagram of Co/Th vs. La/Sc. Average compositions of volcanic rocks from [71]; (f) binary diagram SiO2 versus Al2O3 + K2O + Na2O to discriminate the climatic conditions during the period of Carboniferous to Late Permian [72].
Minerals 10 00341 g010
Figure 11. Tectonic discrimination diagrams with major elements of clastic rocks from Carboniferous to Upper Permian. (a) Discriminant-function multi-dimensional diagram for high and low silica clastic sediments from three tectonic settings (equation for DF1 and DF2 based on Surendra P. Verma et al. [78]. (b) Discriminant-function multi-dimensional diagram for high and low silica clastic sediments from three plots of discriminant scores along Function 1 versus Function 2, to discriminate rocks suites of West Bogeda Shan (equation for DF1 and DF2 based on Mukul R. Bhatia [79]). Symbols are the same as those in Figure 10.
Minerals 10 00341 g011
Figure 12. Tectonic discrimination diagrams with trace elements of clastic rocks from Carboniferous to Upper Permian, modified after [75]; OIA = oceanic island arc; CIA = continental island arc; ACM = active continental margin; PM = passive continental margin. Symbols are the same as in Figure 10.
Minerals 10 00341 g012
Figure 13. Tectonic evolution modal of West Bogeda Shan during the Permian. The initial uplift started at the end of Middle Permian. (a) Early Permian; (b) Early to Middle Permian; (c) Middle Permian; (d) Late Permian to Triassic?
Minerals 10 00341 g013
Table 1. Compositions of major (unit: wt.%) and trace elements (unit: ppm) in the sedimentary rocks of the Upper Permian in Dalongkou section, West Bogeda Shan. LOI is loss on ignition. Eu/Eu* indicates the anomaly of europium. See text for the details.
ElementsDLG-1-01DLG-1-02DLG-1-03DLG-2-01DLG-2-02DLG-2-03DLG-2-04DLG-2-05DLG-3-01DLG-3-03DLG-5-01
Al2O36.46.86.95.57.36.02.64.44.74.55.9
CaO0.521.71.90.80.62.416.40.80.719.91.0
Fe2O33.93.02.93.13.22.83.11.73.02.33.3
K2O1.51.61.41.71.91.41.81.01.81.62.0
MgO0.80.70.50.70.70.40.70.40.60.50.7
MnO0.10.30.20.10.10.20.80.10.10.60.1
Na2O2.42.13.21.92.12.72.41.93.32.12.9
P2O50.10.10.10.10.10.10.10.20.10.10.1
Ti2O0.60.40.50.40.50.50.60.40.50.30.5
SiO281.558.678.084.381.682.466.286.383.364.781.6
LOI1.53.93.71.01.50.54.02.01.42.51.5
Total99.499.299.499.599.599.298.599.199.599.199.5
Sc6.68.16.54.74.97.34.48.36.94.95.6
Ti39372708355929233197389948085694334223253531
Cr68.946.141.535.057.678.784.2134.431.220.737.5
Cu19.714.020.313.714.822.728.425.820.615.319.4
Zn63.249.160.699.256.360.772.693.556.360.172.6
Sr152.7650.5145.1179.6135.4470.9705.0243.3187.7526.3147.8
Y14.618.713.916.914.917.317.319.911.410.015.1
Zr167.2114.3167.7139.0149.0198.1187.0163.7151.3109.9169.9
Nb7.15.67.75.45.87.89.09.27.45.47.3
La20.016.115.419.119.415.622.824.317.818.722.0
Ce48.034.333.949.545.635.546.556.936.538.852.3
Pr5.03.73.94.84.84.15.46.44.14.15.4
Nd19.414.615.518.718.916.221.026.015.915.520.6
Sm3.83.03.33.93.73.74.35.63.13.04.0
Eu1.01.01.11.11.11.11.41.61.01.01.1
Gd3.73.13.24.03.73.64.45.53.03.03.8
Tb0.50.40.50.60.50.60.60.80.40.40.5
Dy3.12.52.73.23.03.33.64.22.42.33.0
Ho0.60.50.50.60.60.70.70.80.50.50.6
Er1.91.71.81.91.82.12.22.21.41.41.9
Tm0.30.20.20.30.30.30.30.30.20.20.3
Yb1.91.81.71.81.72.32.11.91.41.21.8
Lu0.30.30.30.30.30.30.30.30.20.20.3
Th5.94.94.56.16.34.75.85.65.04.16.4
Eu/Eu*0.81.01.00.80.91.01.00.91.01.10.9
La/Th3.43.33.43.13.13.34.04.43.64.63.5
Zr/Sc25.314.126.029.930.127.142.819.822.022.630.4
Th/Sc0.90.60.71.31.30.61.30.70.70.81.1
Table 2. Comparison of representative REE characteristics of clastic rocks from Carboniferous to Upper Permian clastic rocks with greywacke from various tectonic settings [75]. The REE was normalized with chondrite [63].
Tectonic SettingProvenanceREE Parameters
LaCeREELa/Yb(La/Yb)NLREE/HREEEu/Eu*
Ocean Island ArcUndissected magmatic arc8 ± 1.719 ± 3.758 ± 104.2 ± 1.32.8 ± 0.93.8 ± 0.91.04 ± 0.1
Continental Island ArcDissected magmatic arc27 ± 4.559 ± 8.2146 ± 2011 ± 3.67.5 ± 2.57.7 ± 1.70.79 ± 0.1
Active Continental MarginUplifted basement377818612.58.59.10.6
Passive MarginCraton-interior tectonic highland498521015.910.88.50.6
Lower Permian
(Average)
16.636.888.98.96.07.10.6
Middle Permian
(Average)
16.335.196.96.34.25.10.7
Upper Permian
(Average)
19.243.4102.611.07.57.60.9

