Experimental Development of a Novel Mine Backfill Material: Foam Mine Fill


1
Mining Engineering Department, King Abdulaziz University, Jeddah 21589, Saudi Arabia
2
Department of Mining and Materials Engineering, McGill University, Montreal, QC H3A 0C5, Canada
*
Author to whom correspondence should be addressed.
Minerals 2020, 10(6), 564; https://0-doi-org.brum.beds.ac.uk/10.3390/min10060564
Submission received: 30 May 2020
/
Revised: 19 June 2020
/
Accepted: 22 June 2020
/
Published: 23 June 2020
Abstract
:This study aims to develop a novel mine backfill material called foam mine fill (FMF). A cellular structure is achieved by incorporating a premade foam into the backfill mixture using an air-entraining agent. FMF samples were prepared with copper-nickel mine tailings and normal Portland cement. Experiments were designed to investigate the effect of binder dosage, volume of entrained air, and foam mixing time on FMF unconfined compressive strength (UCS) and dry density. Moreover, a qualitative microscopic assessment investigated the effect of foam mixing time on air bubble structure. The pore size distribution and porosity of selected samples were investigated through mercury intrusion porosimetry. Relative to reference samples without entrained air, the UCS of FMF samples was 20–50% lower. However, the concomitant lower dry density (by up to 360 kg/m3) could enhance the safety of the underground working environment, especially in underhand cut-and-fill mining where miners and machinery work beneath the backfilled stope, and lower-density fill material would minimize the adverse effects of potential backfill failure. Prolonged foam mixing time led to a significant loss in UCS and total collapse of the air bubble structure. Other potential applications for FMF are areas where there are tailings shortages and as an alternative to hydraulic fill.
1. Introduction
Backfilling in underground stopes is practiced by many mines around the world for environmental, technical, and economic reasons. In general, the objectives of mine backfilling are to: Reduce tailings storage on the surface by up to 50% and, thus, tailings exposure to the environment [1]; stabilize underground operations; and maximize the volume of ore recovered [2,3]. Mine tailings are waste products generated from mineral processing plants during ore concentration. The physical and chemical properties of mine tailings can influence the mechanical properties of mine backfill and should be considered in backfill design [4]. For example, mine tailings containing sulfide minerals such as pyrite (FeS2) are susceptible to sulfate attack, whereby ettringite formation causes expansion that reduces the backfill unconfined compressive strength (UCS) over the long term [5]. Binders (typically cement) are added at low concentration (2–8 wt.% of dry materials) to enhance the mechanical properties of the backfill mixture [4,5]. Supplementary cementitious materials such as pozzolans (e.g., blast furnace slag and fly ash) often partially replace cement to protect backfill prone to sulfate attack [5,6]. Moreover, the use of pozzolanic materials minimizes binder costs, which can range from 40 to 80% of operational costs in backfill plants. Many industrial wastes have pozzolanic characteristics and are readily available at low cost [3,6,7,8].
The three main types of mine backfill materials are hydraulic fill (HF), paste fill (PF), and rock fill (RF). HF typically has a solids concentration of 60–75% by weight. Water is used to transport HF to underground stopes through pipelines and for cement hydration [8]. Therefore, excess water must be removed underground because inefficient drainage can pose high risk to miners and lead to fill liquefaction or barricade failure [7,9]. PF is made with fine particles (at least 50% passing 20 μm); thus, it has low permeability and behaves as a non-segregating slurry [7,10]. The higher solid content and lower water content of PF (75–85% by weight) may require the use of a superplasticizer or a high-range water reducer to ensure workable paste suitable for transportation through pipelines [11]. RF uses larger particles from waste rocks (typically ~16 mm) and is delivered underground through boreholes where it may be mixed with cement slurry, depending on strength requirements [10]. RF has several disadvantages such as the use of heavy equipment to transport crushed rock and the presence of larger voids, which may increase binder consumption to ensure fill competence [10].
As part of an ongoing research program to overcome the shortcomings associated with conventional mine backfill materials, this paper describes the development of a novel mine backfill called foam mine fill (FMF), building upon preliminary work by the authors that demonstrated the feasibility of FMF [12,13,14,15]. The concept of FMF is very similar to cellular concrete. A premade foam is added to the backfill mixture to increase the porosity and lower the density. An air-entraining (foaming) agent and a foam generator are required to produce micrometer-scale air bubbles. The foaming agent is a surfactant that facilitates bubble creation by reducing the surface tension of water. Each surfactant molecule consists of a hydrophilic polar head and a hydrophobic nonpolar tail [16]. Most foaming agents are designed to be negatively charged in order to be electrostatically attracted to the positively charged cement particles [17]. The two main types of foaming agents are protein-based and synthetic-based. The use of protein-based agents results in closely spaced air bubbles with a cellular structure, whereas synthetic-based agents expand the cellular structure, resulting in a lower density [18,19]. Protein- and synthetic-based foaming agents are typically diluted with water to a specified volumetric ratio and added to the foam machine, where air bubbles are generated with the help of an air compressor. The entrained air voids—sometimes called macropores—can range in size from 50 μm to 1 mm [20]. They occupy up to 70% of the total volume of cellular concrete, resulting in a versatile material that can be used in several civil applications such as void filling, thermal insulation, wall casting, and screed floors [19,21]. Cellular concrete is highly flowable and self-compacted, with densities of 400–1800 kg/m3 [22]. The 28 days unconfined compressive strength (UCS) of cellular concrete can range from 0.43 to 43 MPa [23]. UCS is a key mechanical property for mine backfill. For example, in underhand cut-and-fill mining, a UCS of 1 MPa after 28 days is required to maintain ground stability [8].
Therefore, the advantageous physical and mechanical properties of cellular concrete triggered this research program to investigate the potential development of FMF for application to underground mines. The purpose of this study is to investigate the effect of: (1) Binder dosage and amount of air entrained on the UCS of FMF; (2) amount of air entrained on dry densities and pore size distribution of FMF; and (3) foam mixing time on the UCS, dry densities, and air bubble structure of FMF. Finally, the results from this study will be used to explore the potential use of FMF in mine backfilling applications and provide guidelines for further research in this field.
2. Experimental Materials
2.1. Mine Tailings
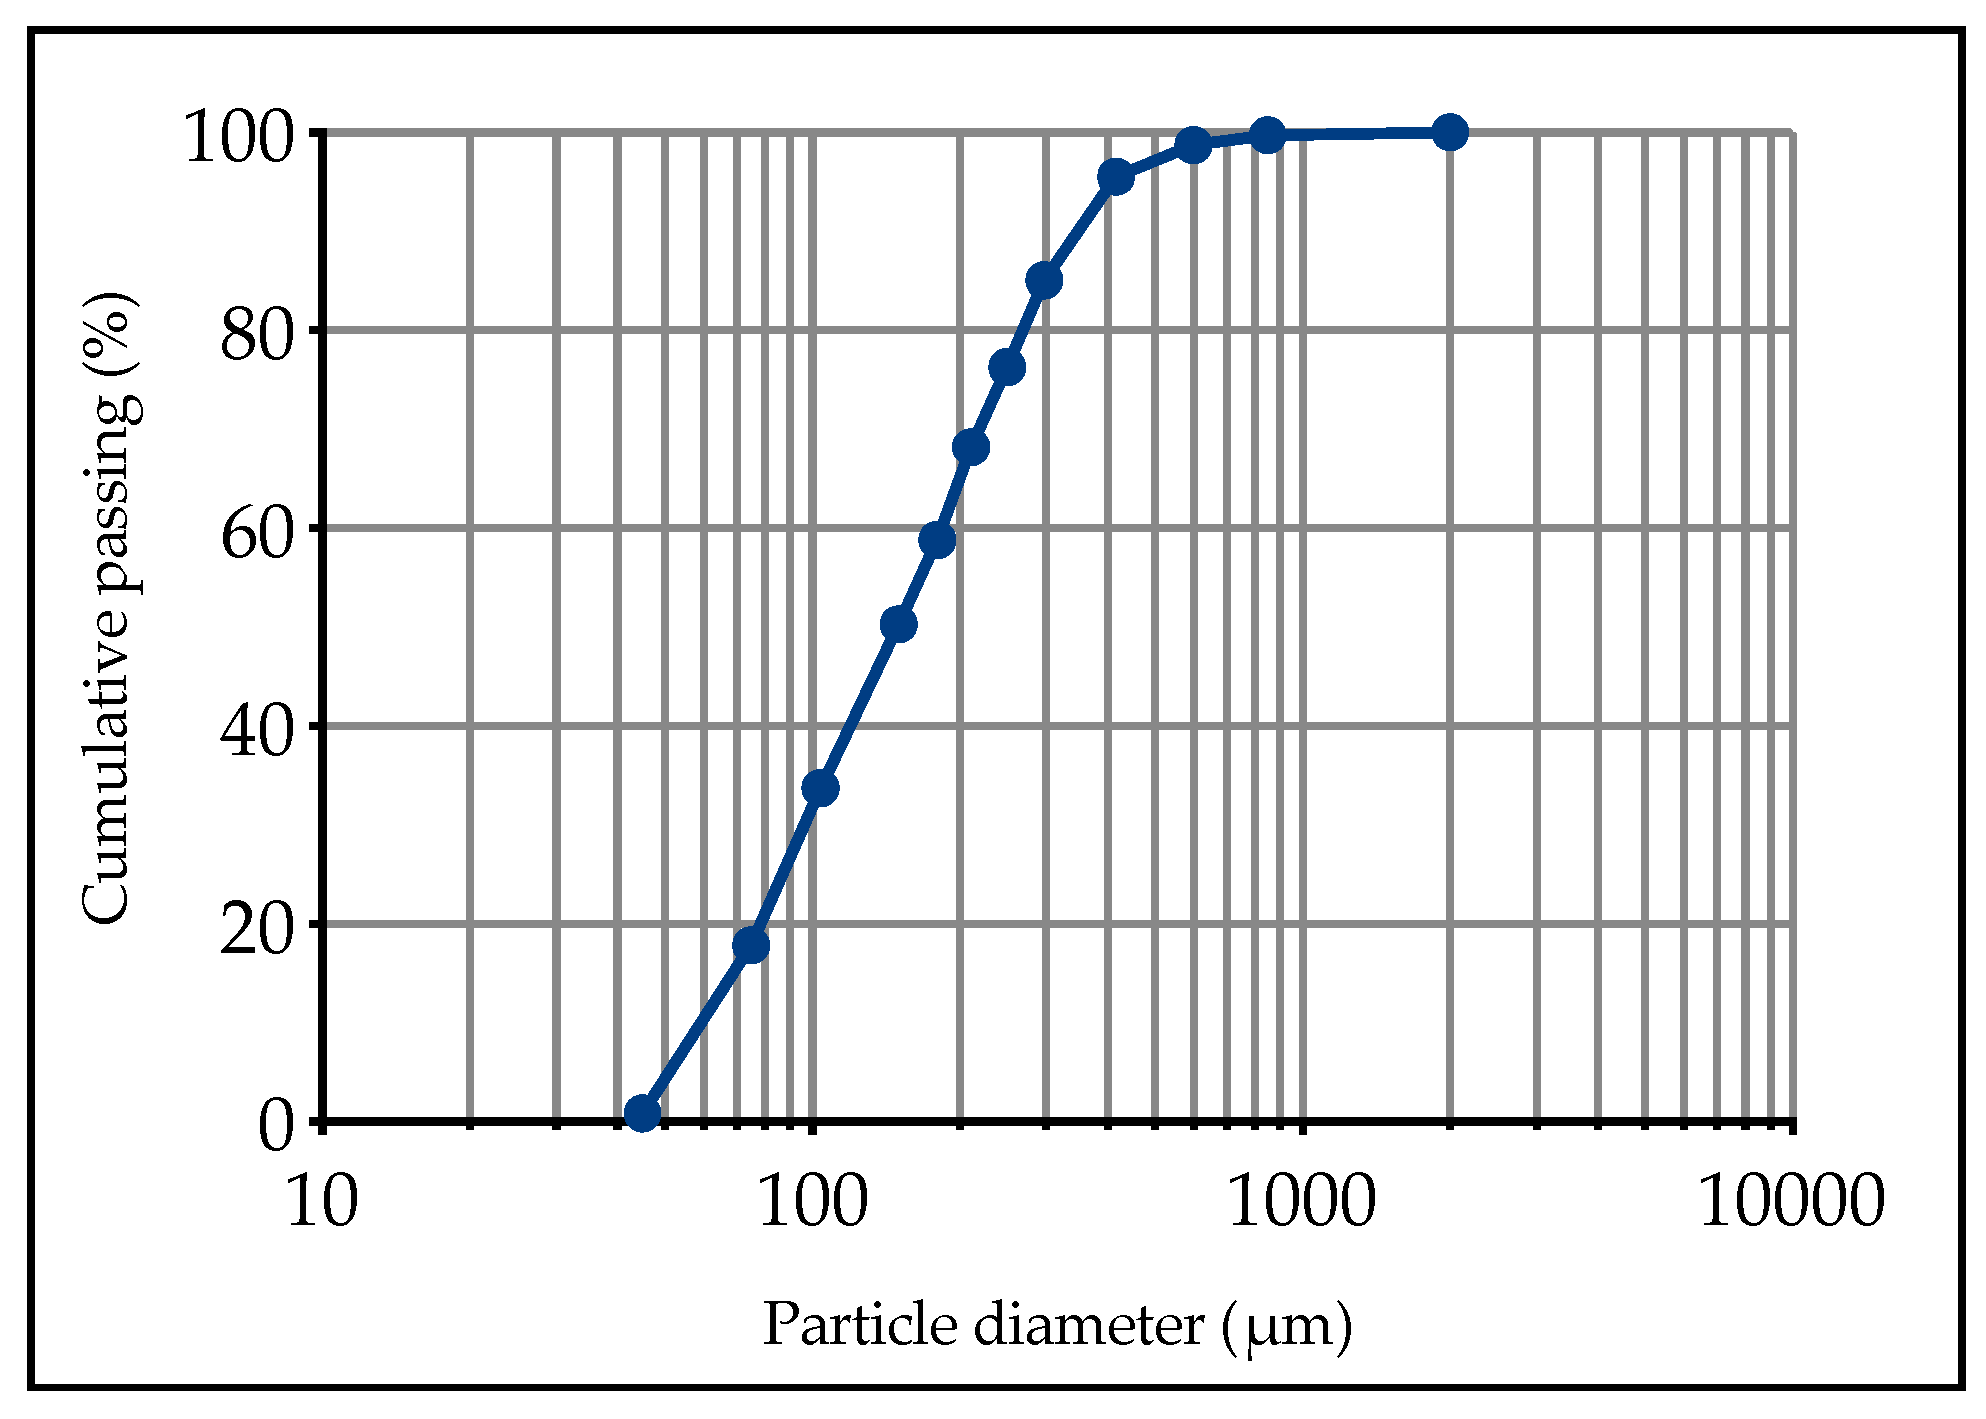
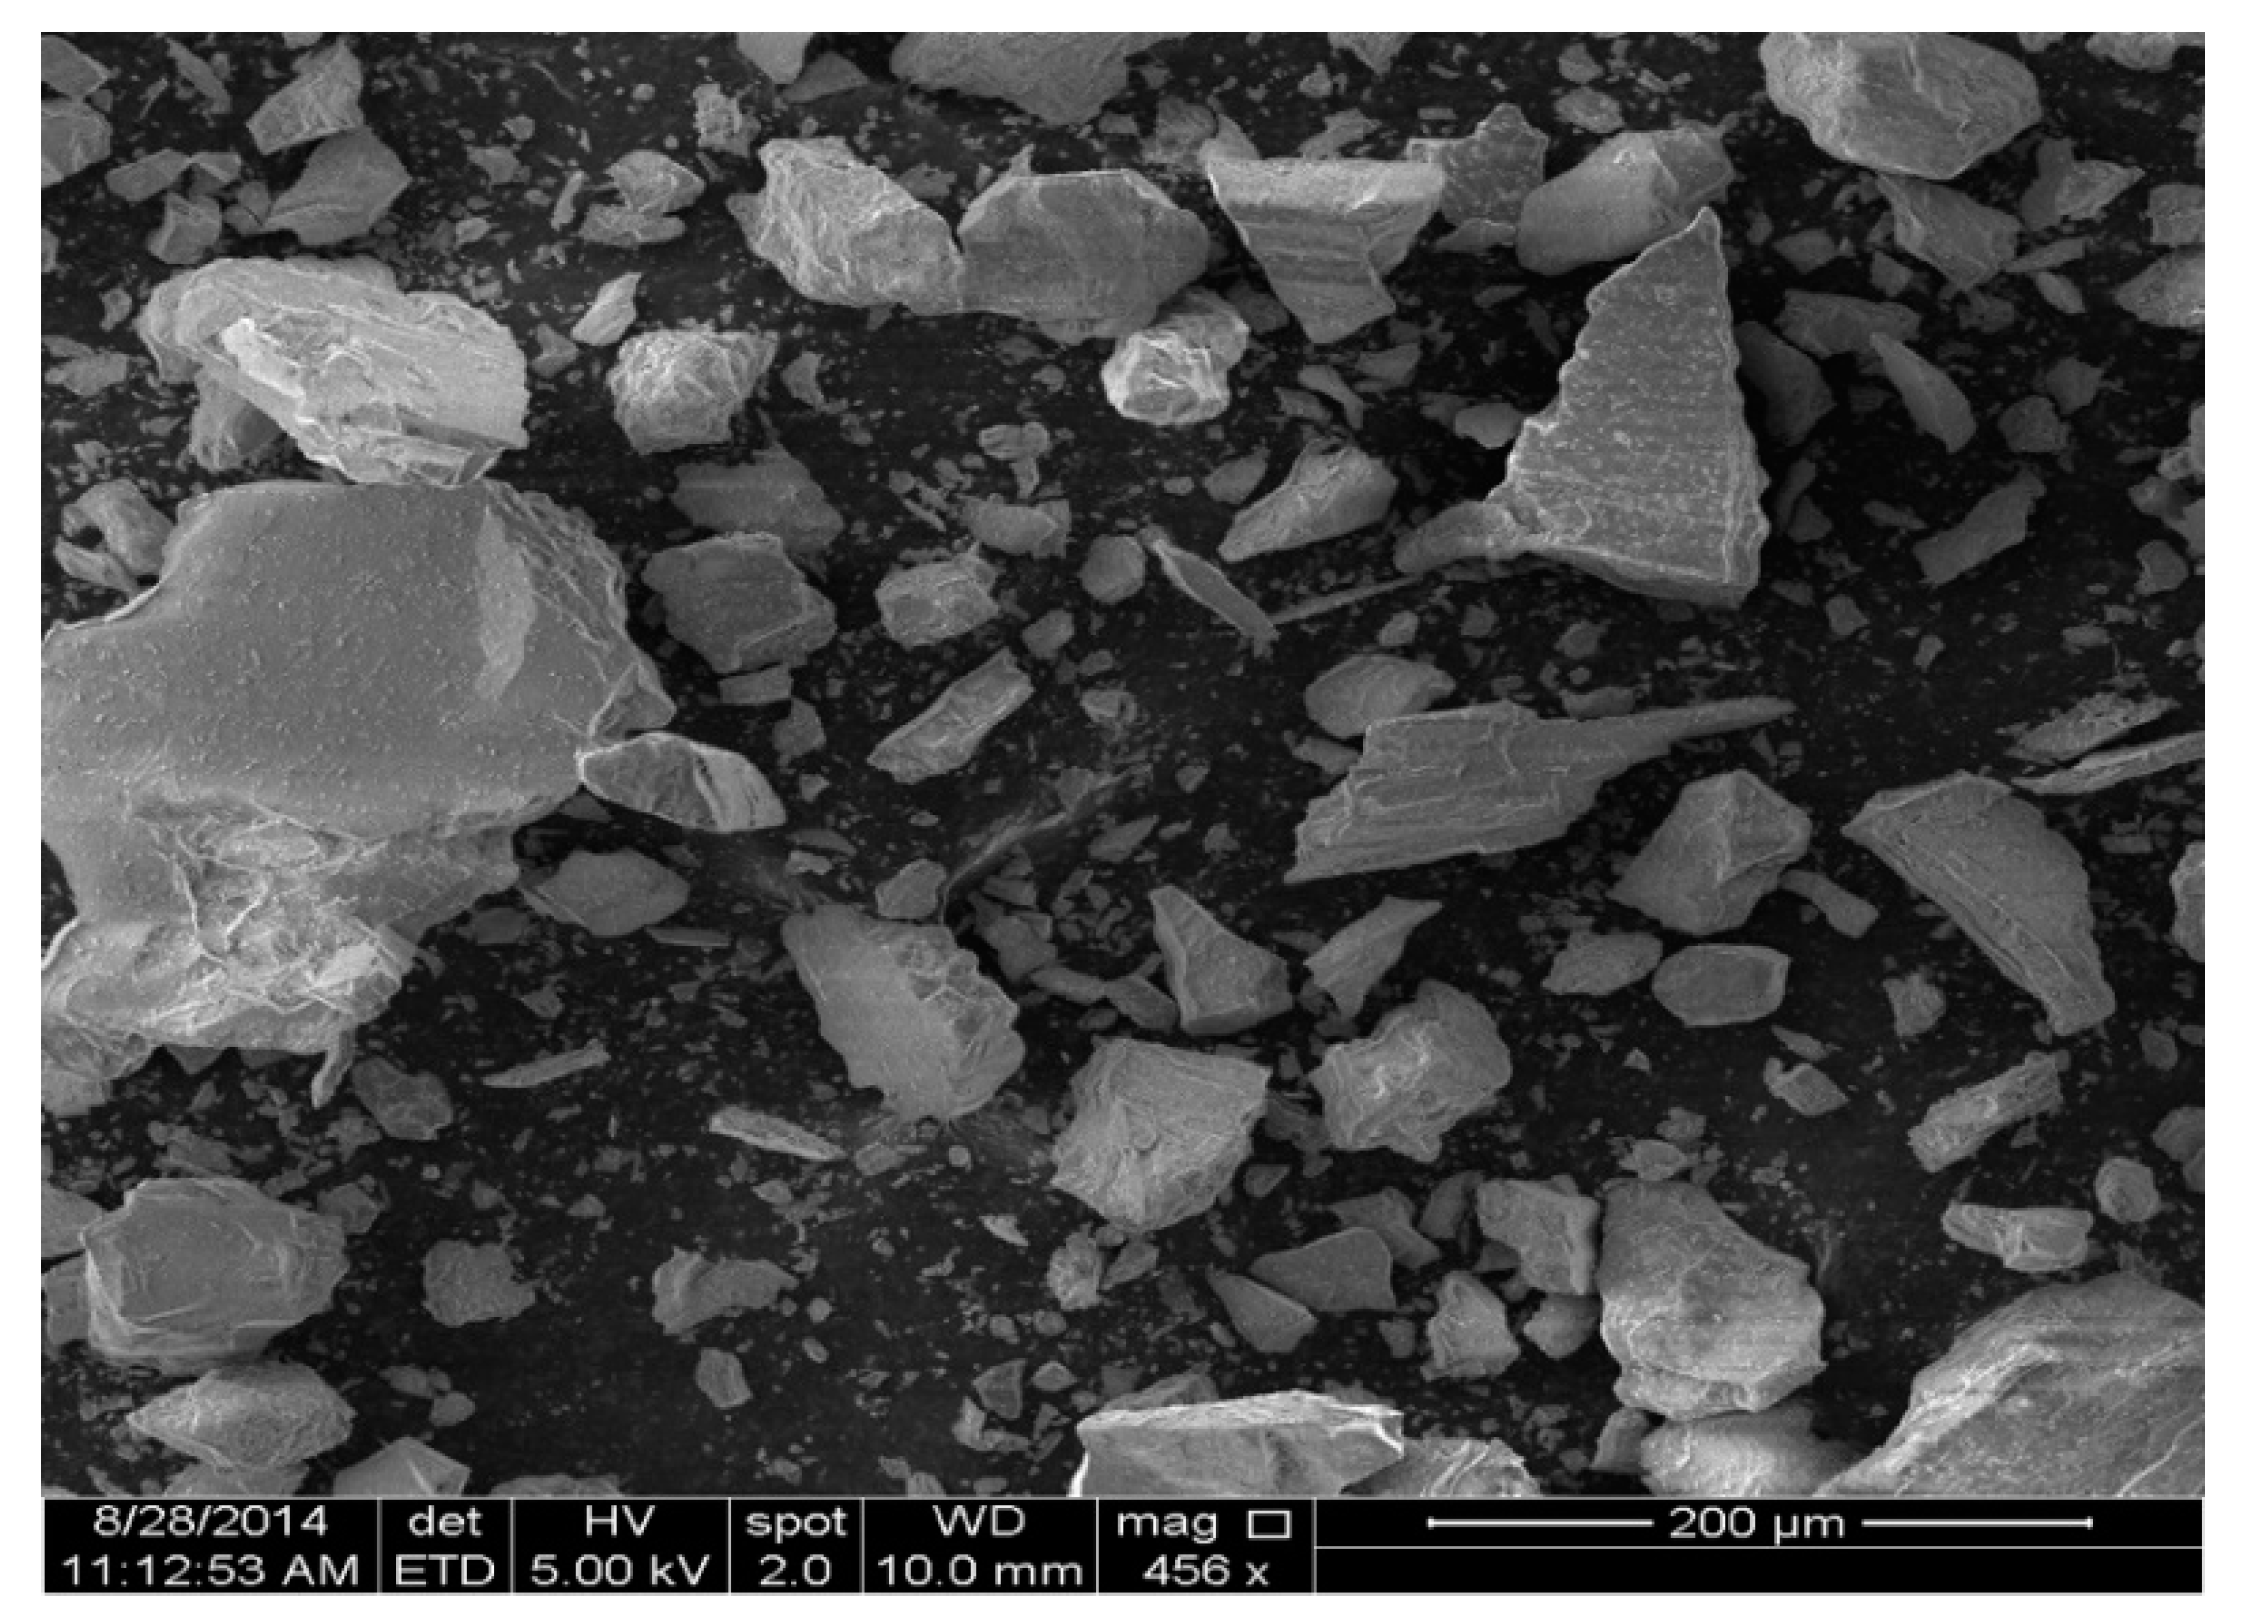
The tailings used in this study were provided by a copper-nickel mine in Canada where HF is used as backfill at a solids concentration of 70 wt.%. The tailings mineralogy provided by the mine is shown in Table 1. The tailings particle size distribution (Figure 1) was determined using a combination of dry and wet sieving. A sample was oven-dried for 24 h at 100 ± 5 °C and sieved according to ASTM C136/C136M-19 (ASTM International, 2019), and particles <75 μm were then wet sieved according to ASTM C117-17 (ASTM International, 2017). The physical properties of the tailings are shown in Table 2. Based on the coefficients of uniformity (Cu) and curvature (Cc), the tailings are poorly graded. Scanning electron micrographs show that the tailings particles have an angular shape and rough surface texture (Figure 2).
2.2. Binder
A general use cement with a specific gravity of 3.15 and a specific surface area of 3710 cm2/g was used to prepare the FMF samples. The chemical composition of the cement was determined using X-ray fluorescence analysis (Table 3).
2.3. Water
Backfill can be prepared using water from different sources such as lakes, municipal drinking water supplies, or processing plants [24,25]. Compounds in the water can affect both the yield stress of the backfill and cement hydration. For example, Mahlaba et al. reported that using a salty brine decreased the workability for a given binder content [26]. Further, elevated dissolved calcium (480 mg/L) and magnesium (280 mg/L) concentrations have been found to contribute to the formation of hydration products during cement hydration [27]. In this study, samples were prepared using tap water from the Montreal region with a pH of 7.4. Table 4 summarizes the average content of the dissolved salts in the tap water used in this study.
2.4. Foaming Agent and Foam Generator
The goal in choosing a foaming agent is to achieve evenly distributed air bubbles throughout the FMF [13]. The Stable Air® system (Vatne Concrete Systems Ltd., Beaconsfield, QC, Canada) consists of two components: The foaming agent and the foaming machine. The foaming agent is a proprietary admixture of synthetic materials designed to comply with ASTM C260/C260M-10a and C869/C869M-11 (ASTM International, 2016a, 2016b). Table 5 summarizes the properties of the foaming agent.
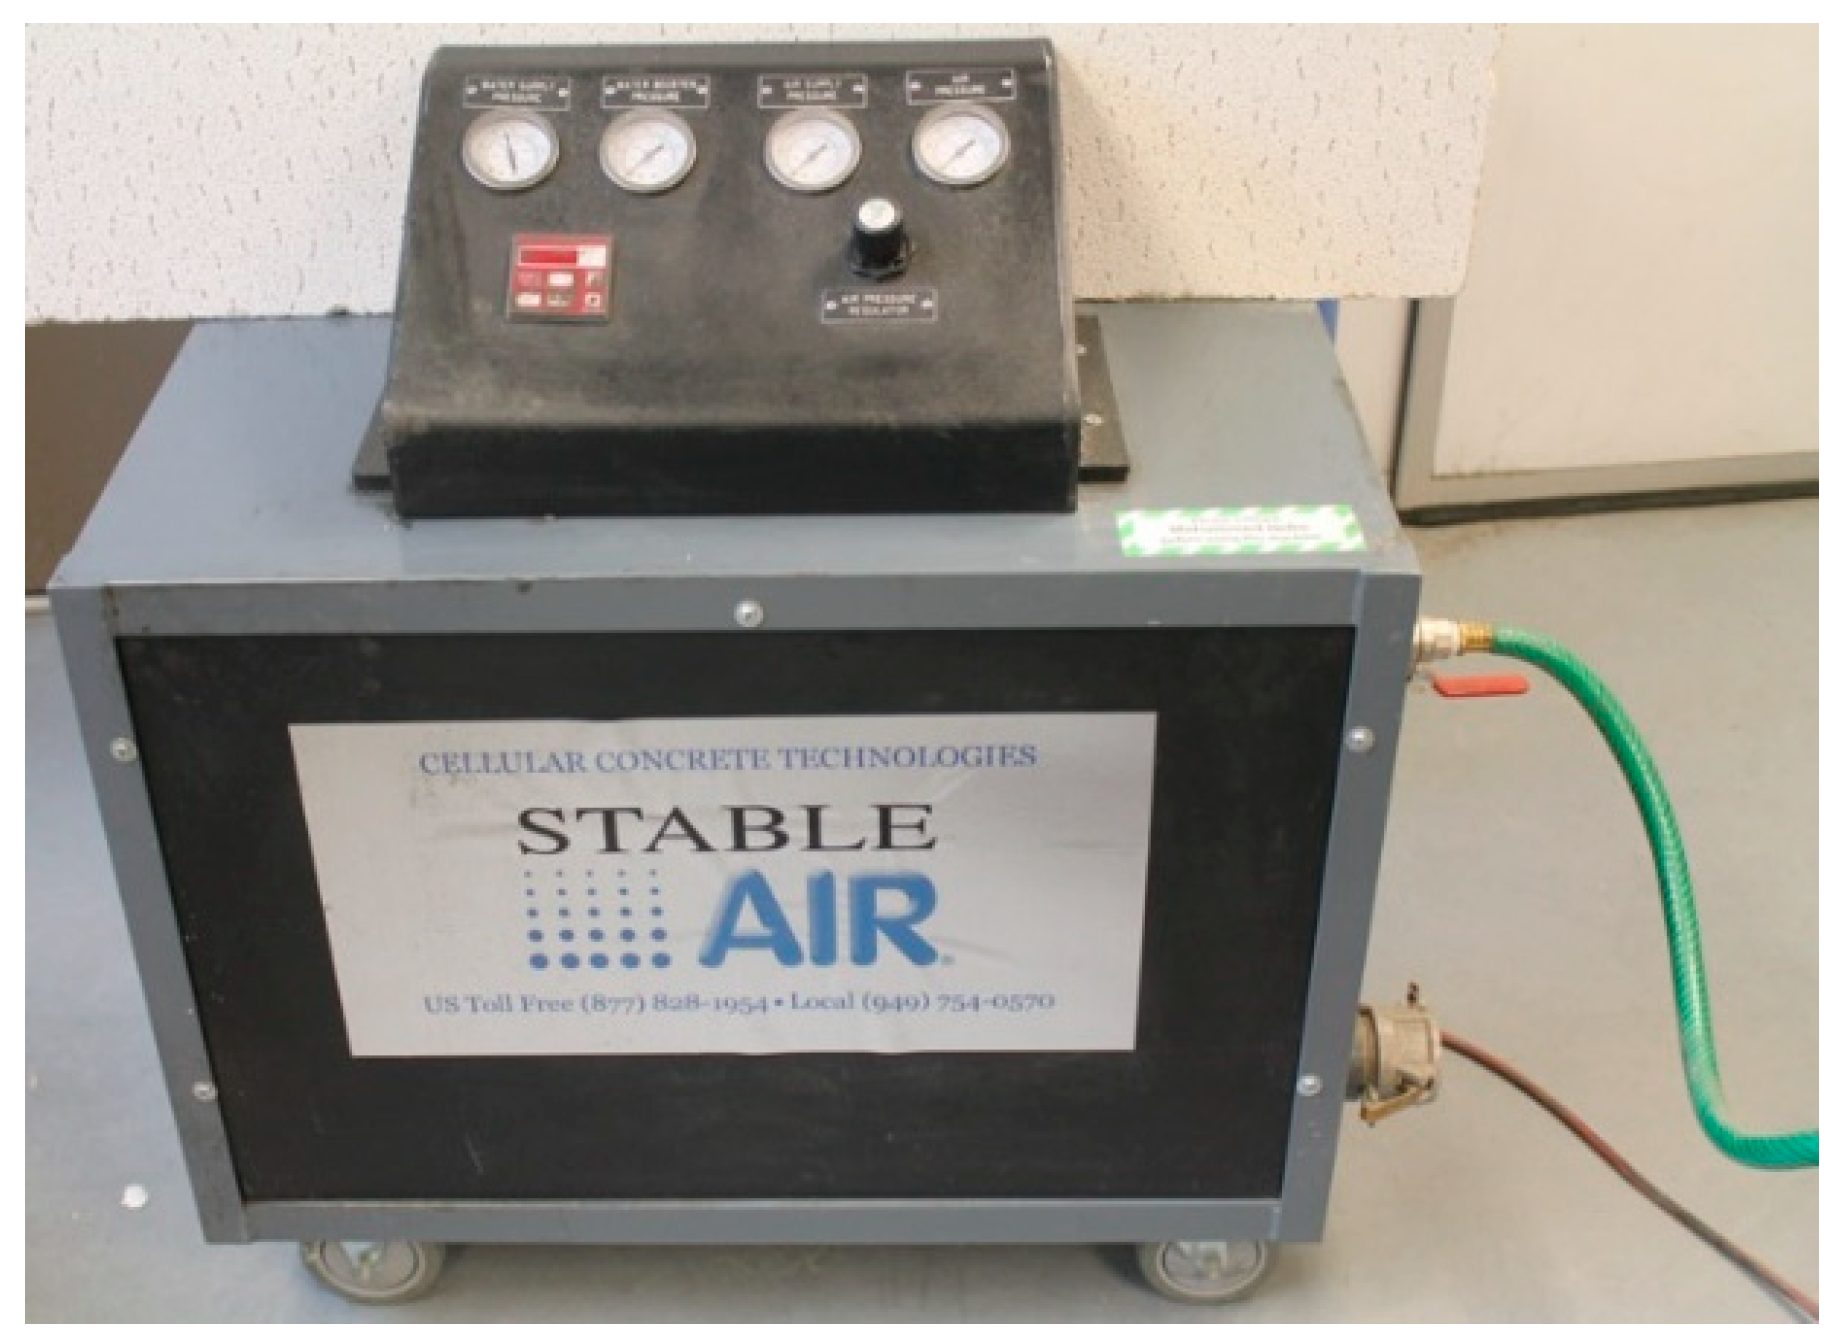
The portable foaming machine (Model M100) has an air output of 0.0047–0.0057 m3/s, a programmable digital timer, and water and air pressure gauges (Figure 3). To obtain the desired foam consistency (density 69 kg/m3) per the manufacturer’s recommendation, the foaming agent is poured into the tank inside the machine, which is then connected to a water supply with a hose to achieve a water pressure of 0.48 MPa (70 psi). The water is used to dilute the foaming agent at a volumetric ratio of 1:120 (i.e., 1 L foaming agent to 120 L water). The machine is also connected to an air compressor to supply an air pressure of 0.38 MPa (55 psi). The blend of foaming agent, water, and compressed air generates the foam with a cellular structure to be incorporated into the backfill mixture.
2.5. FMF Composition
The FMF composition was calculated using Equations (1)–(4):
where MB, MT, and MW are the mass of binder, tailings, and water, respectively (g), VT is the targeted total volume of backfill (m3), Ae is the desired percentage of entrained air, Vfoam is the foam volume, and ρfoam is the foam density (69 kg/m3). The binder dosage and solid concentration were simply calculated on a mass basis, as shown in Equations (1) and (2). The mass of foam to be added to the mixture was calculated using Equation (4) because it is not practical to add the foam by volume. Thus, it was necessary to predetermine the targeted Vt and Ae to calculate Vf using Equation (3).
2.6. Experimental Design
The solids concentration in all mixtures was held at 78% (Table 6) because the foam tended to segregate when the slurry was thin (solids concentration < 78%), and air bubbles tended to collapse when the mixture was too stiff (solids concentration > 78%). The foam mixing time was also held constant at 2 min unless it was varied in selected samples, to investigate the effect of foam mixing time. The binder dosage and the amount of air entrained were varied at three levels each. Samples with 0% entrained air served as reference samples.
2.7. Sample Preparation
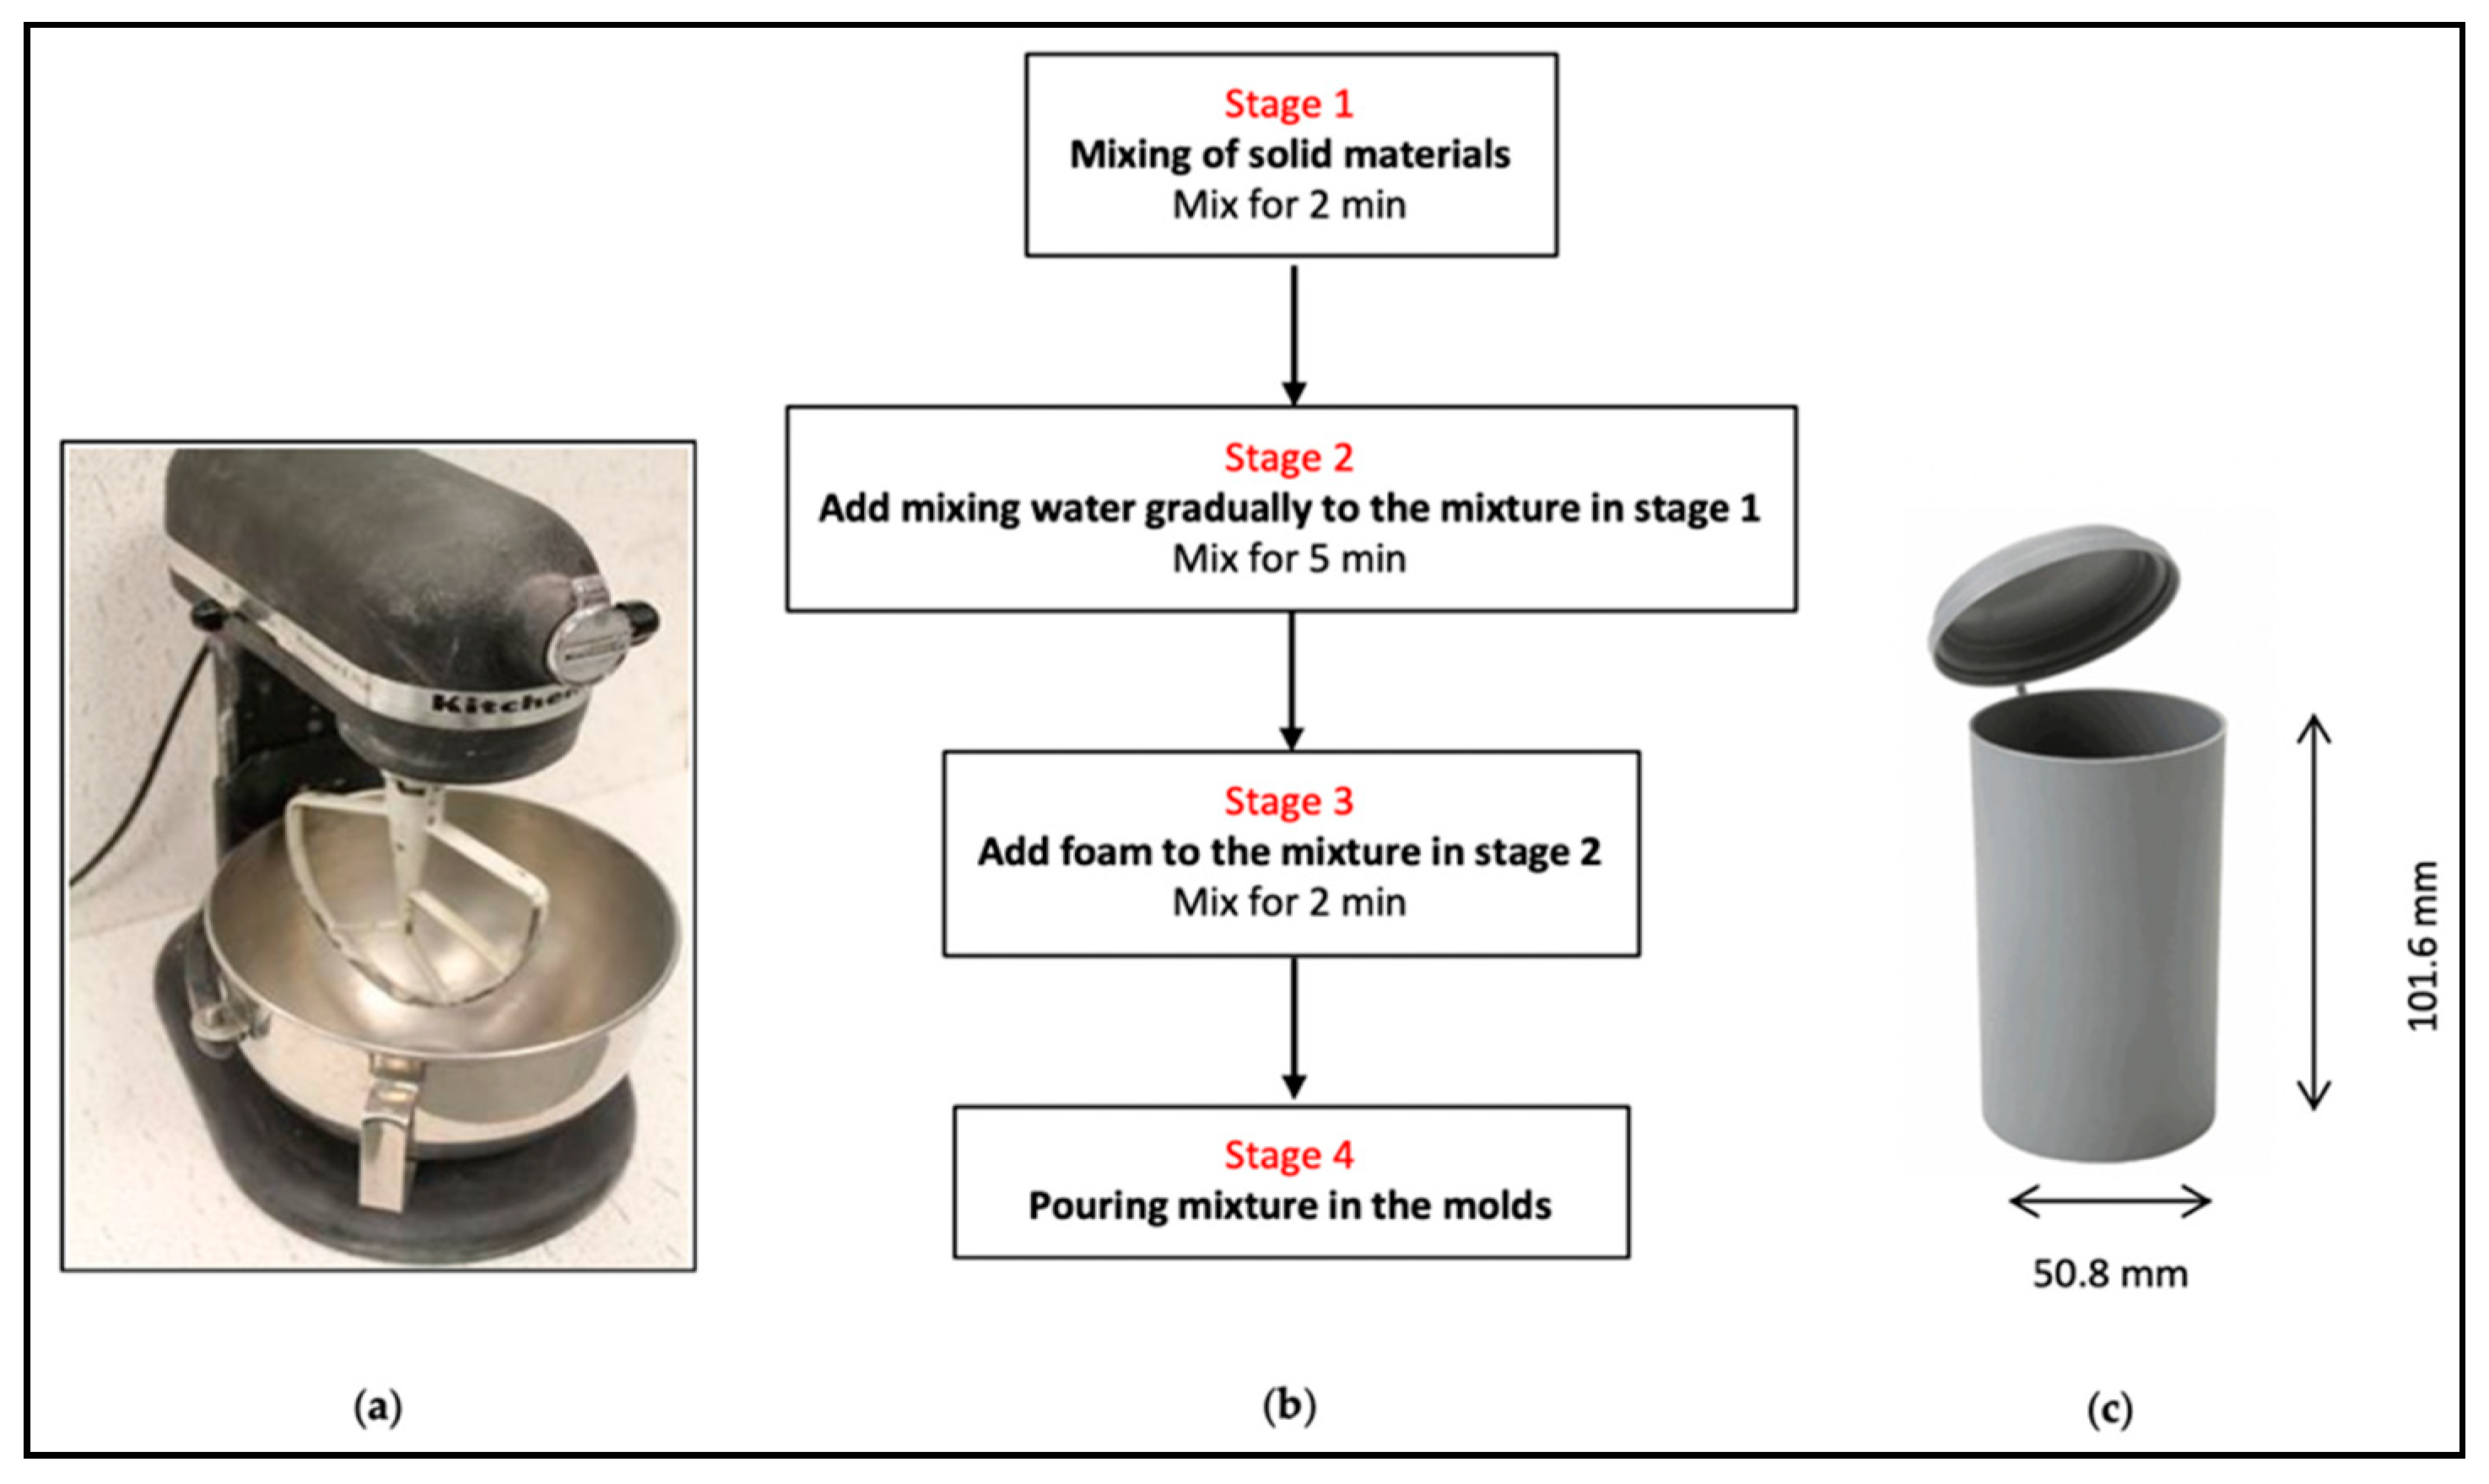
FMF samples were prepared using a KitchenAid® 5 Professional Plus Series mixer with a 4.73 L stainless steel bowl (Figure 4a). Mixing was done in three stages (Figure 4b):
- Tailings and binder were mixed for 2 min at 75 rpm.
- Water was gradually added and the slurry mixed at 75 rpm for 5 min to obtain a homogeneous slurry.
- Premade foam was added to the slurry and mixed for 2 min at 58 rpm. The lower mixing speed prevented the air bubble breakage observed at higher mixing speed.
The final mixture was cast into 50.8 × 101.6 mm, single-use plastic molds that comply with ASTM C31/C31M-19a (ASTM International, 2019) (Figure 4c).
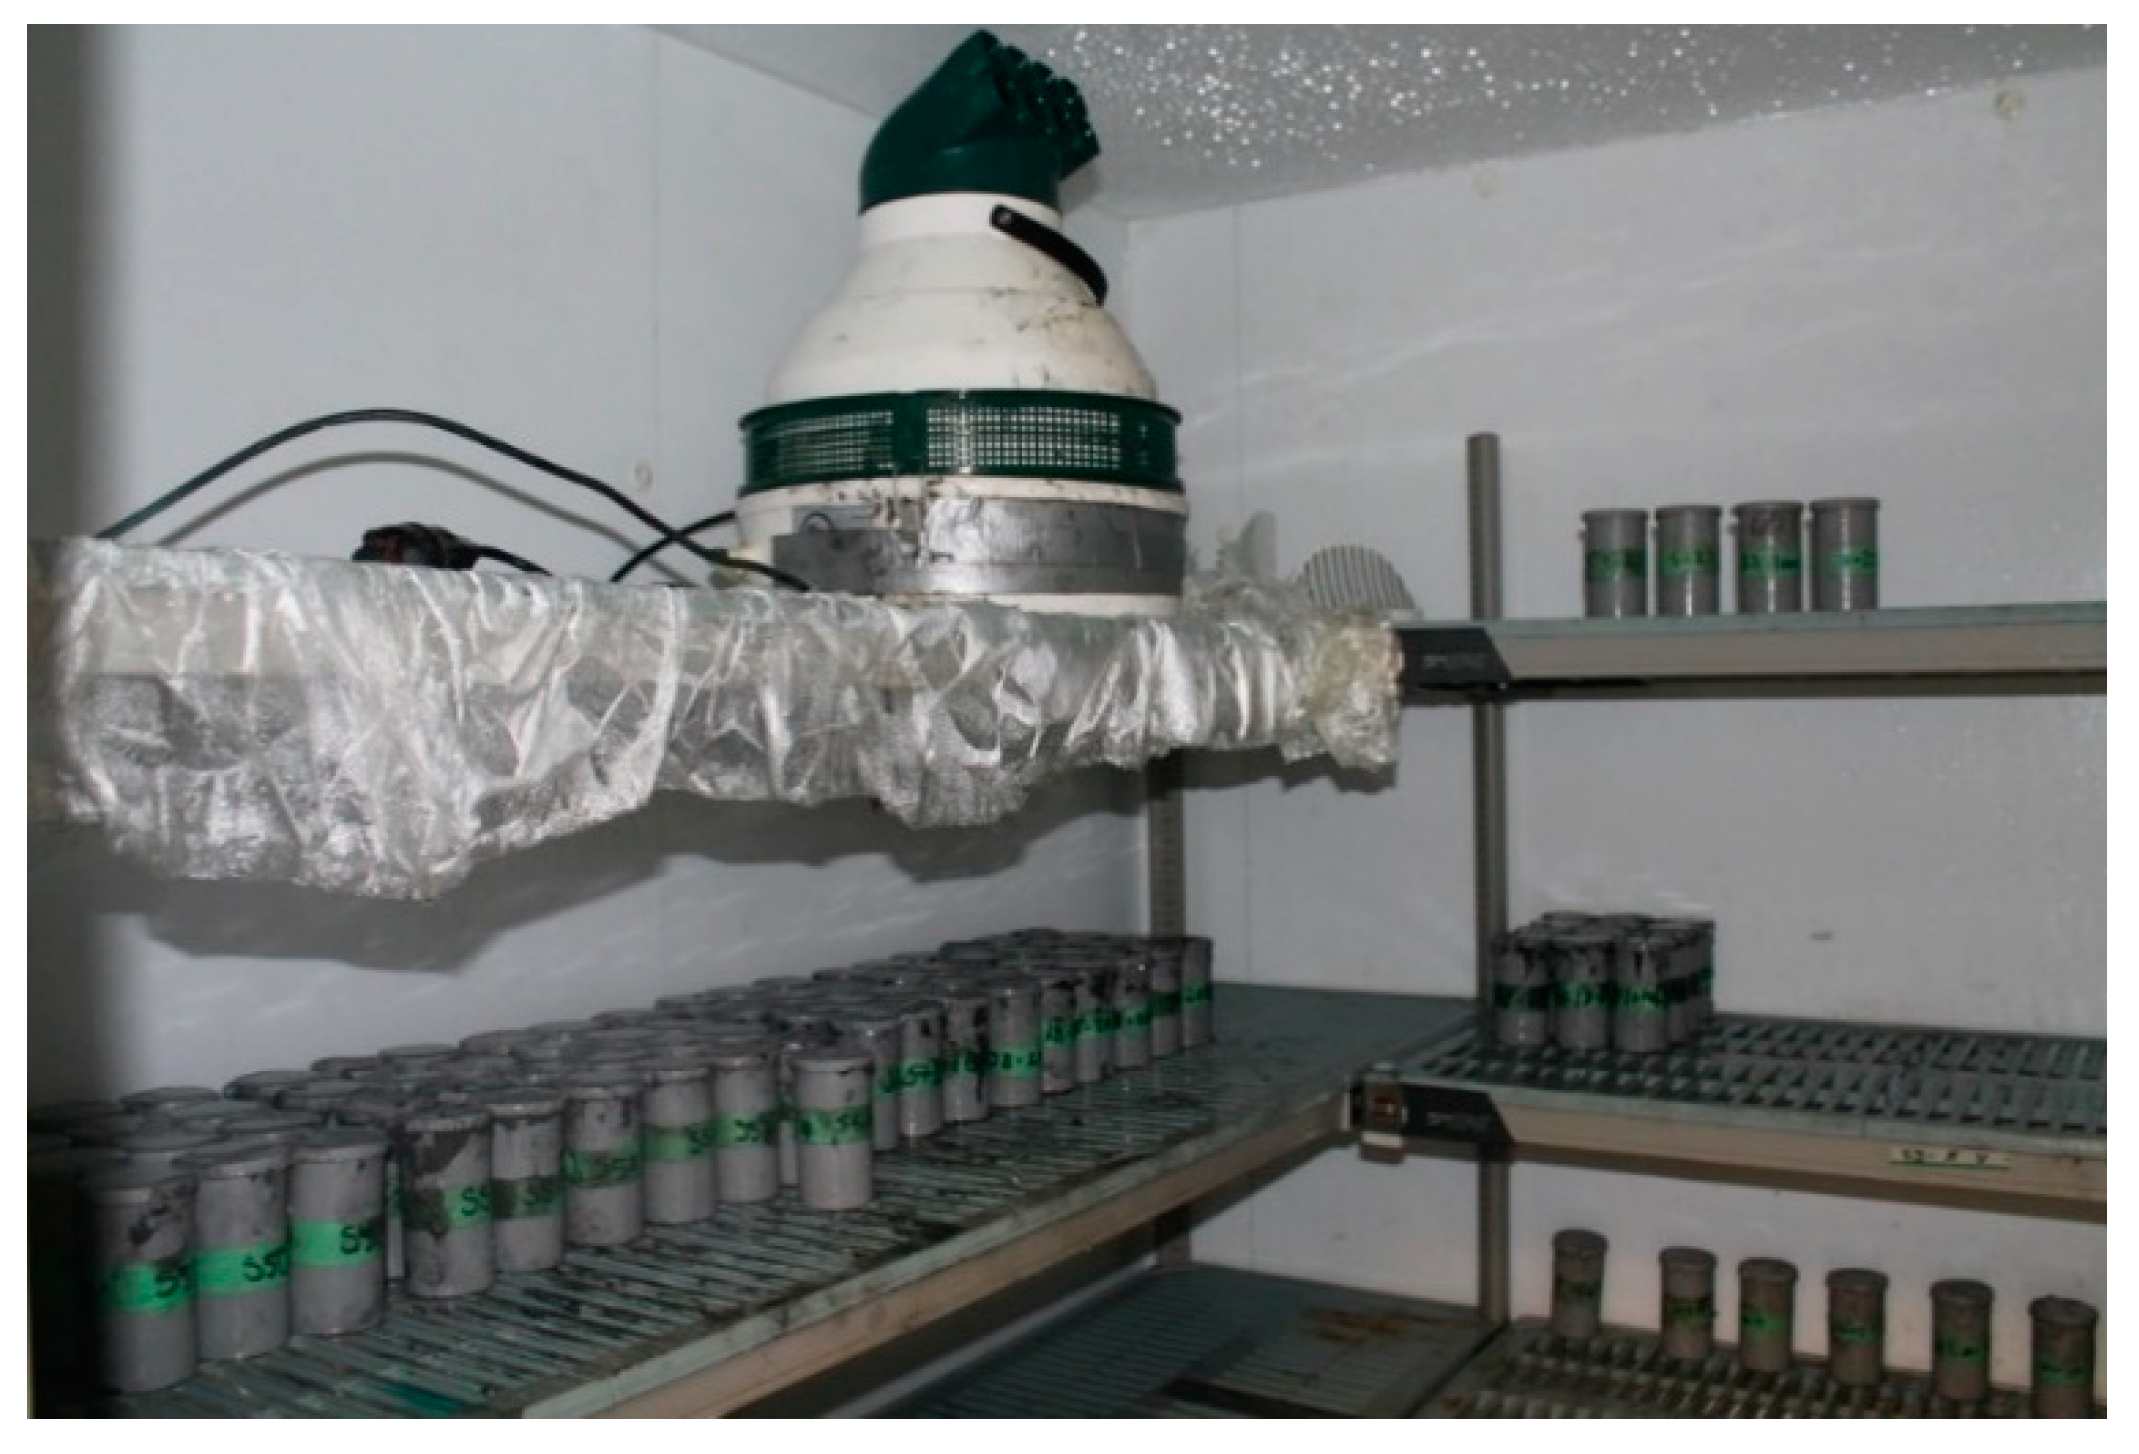
A total of 144 samples were prepared (Table 7). For UCS testing, 9 molds were prepared for each mixture design and cured in a curing chamber (Figure 5) for 7, 14, and 28 days at 25 ± 2 °C and 90 ± 2% relative humidity to simulate underground conditions (Table 7). Additional samples were prepared to evaluate the effect of foam mixing time on UCS, dry density, and air bubble structure after 28 days of curing. Pilot testing showed that the optimal foam mixing time to obtain consistent mixtures for the experimental batch volumes was 2 min. It has been reported in the literature that prolonged mixing can lead to loss of air content in foam concrete [29,30]. However, foam concrete is usually mixed inside a concrete drum mixer unlike this study, where FMF was mixed with a flat beater blade (Figure 4a). In step 3 above, triplicate samples were prepared for UCS testing and for dry density testing by mixing foam for 5, 8, 15, 25, and 45 min (ID 9B20A-5M, -8M, -15M, -25M, -45M, respectively; Table 7). For mercury intrusion porosimetry (MIP) tests, two additional molds were prepared for mixtures 9B0A and 9B20A-2M.
3. Testing Methods
3.1. Unconfined Compressive Strength Test
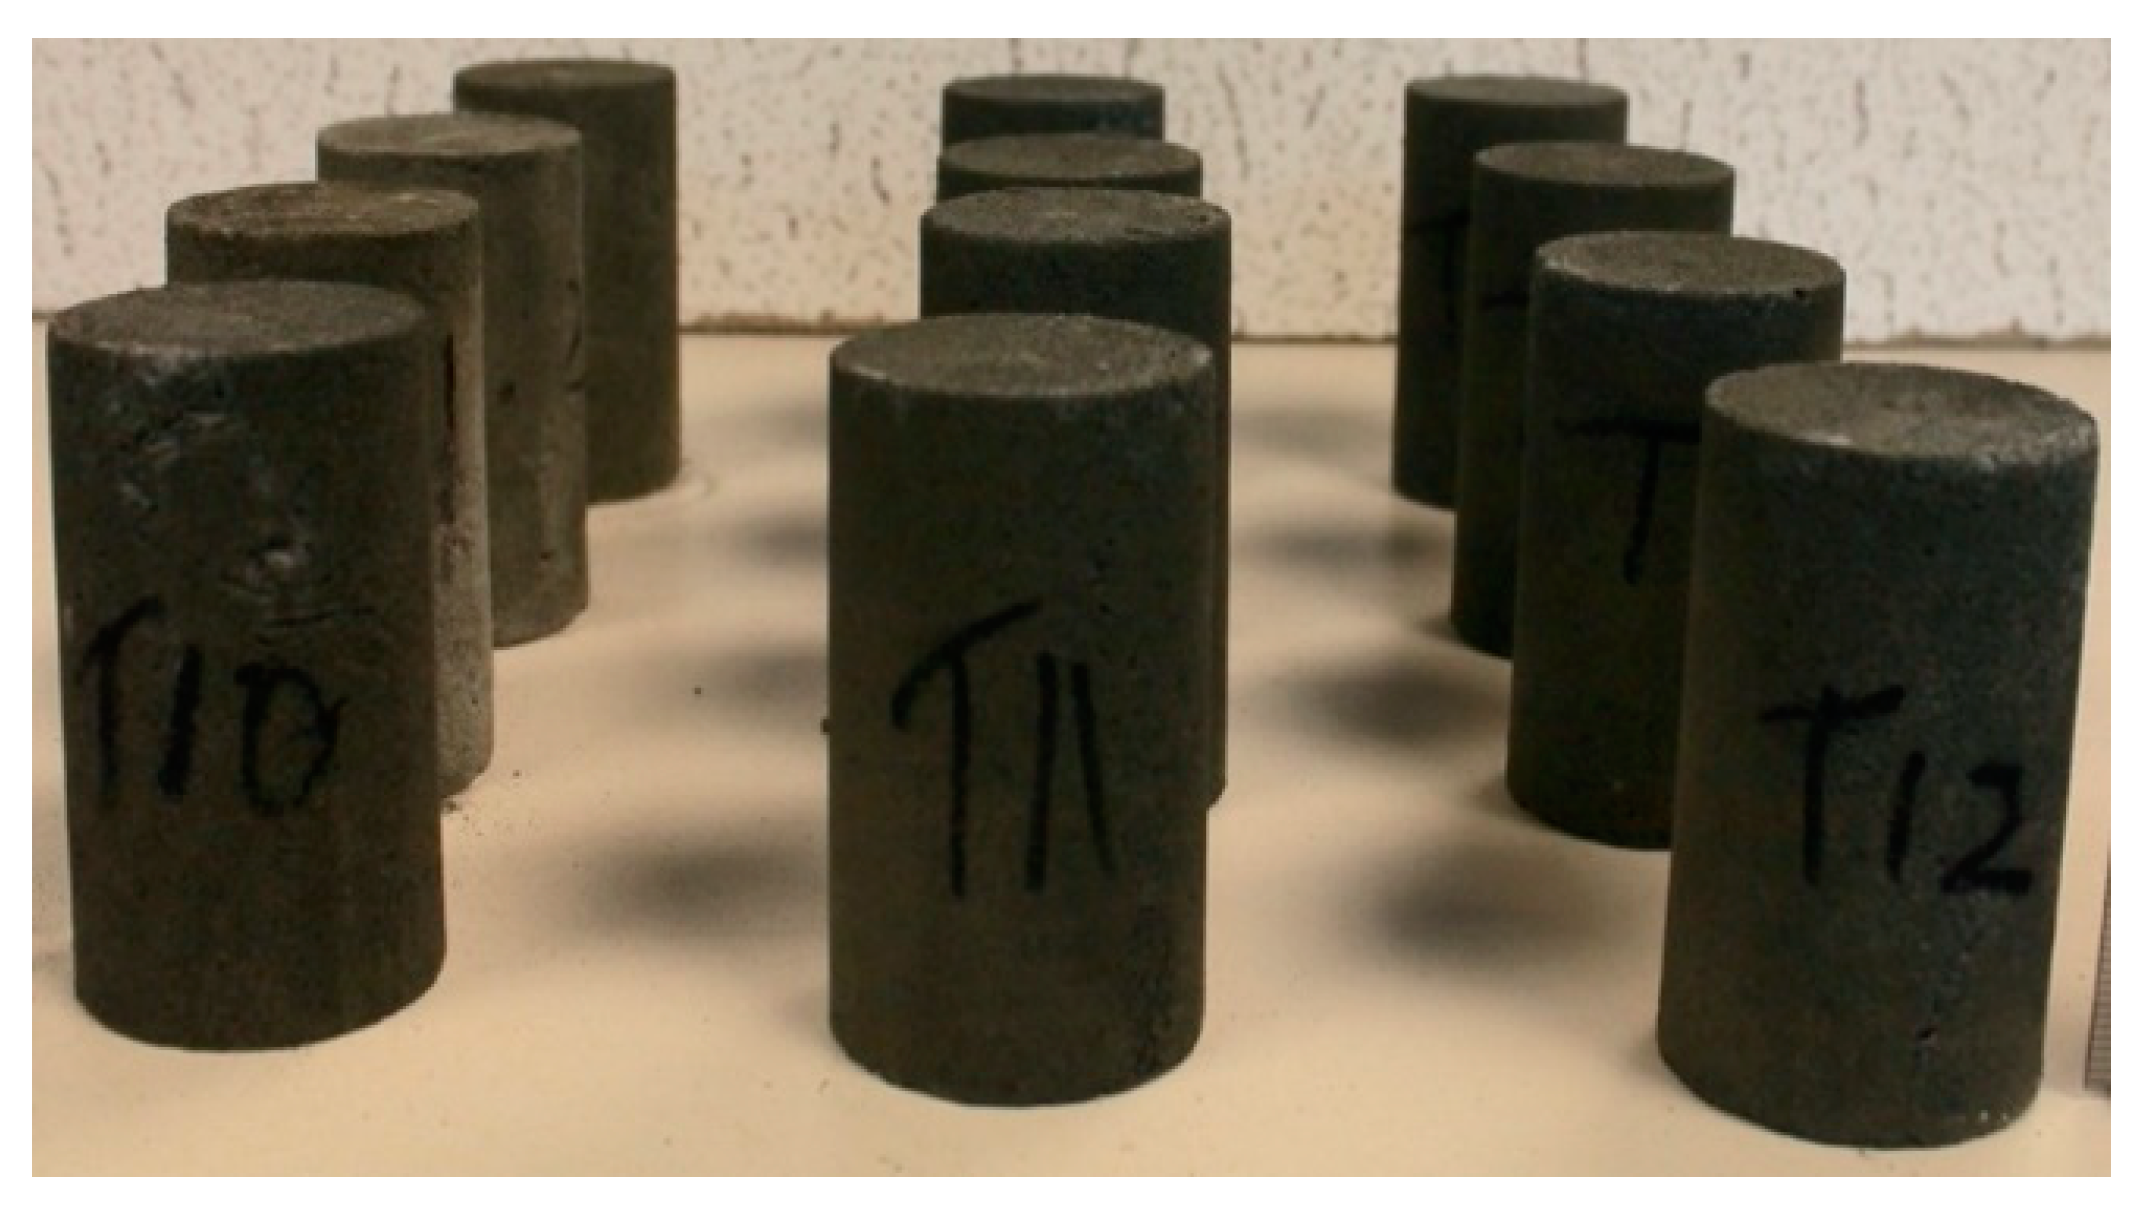
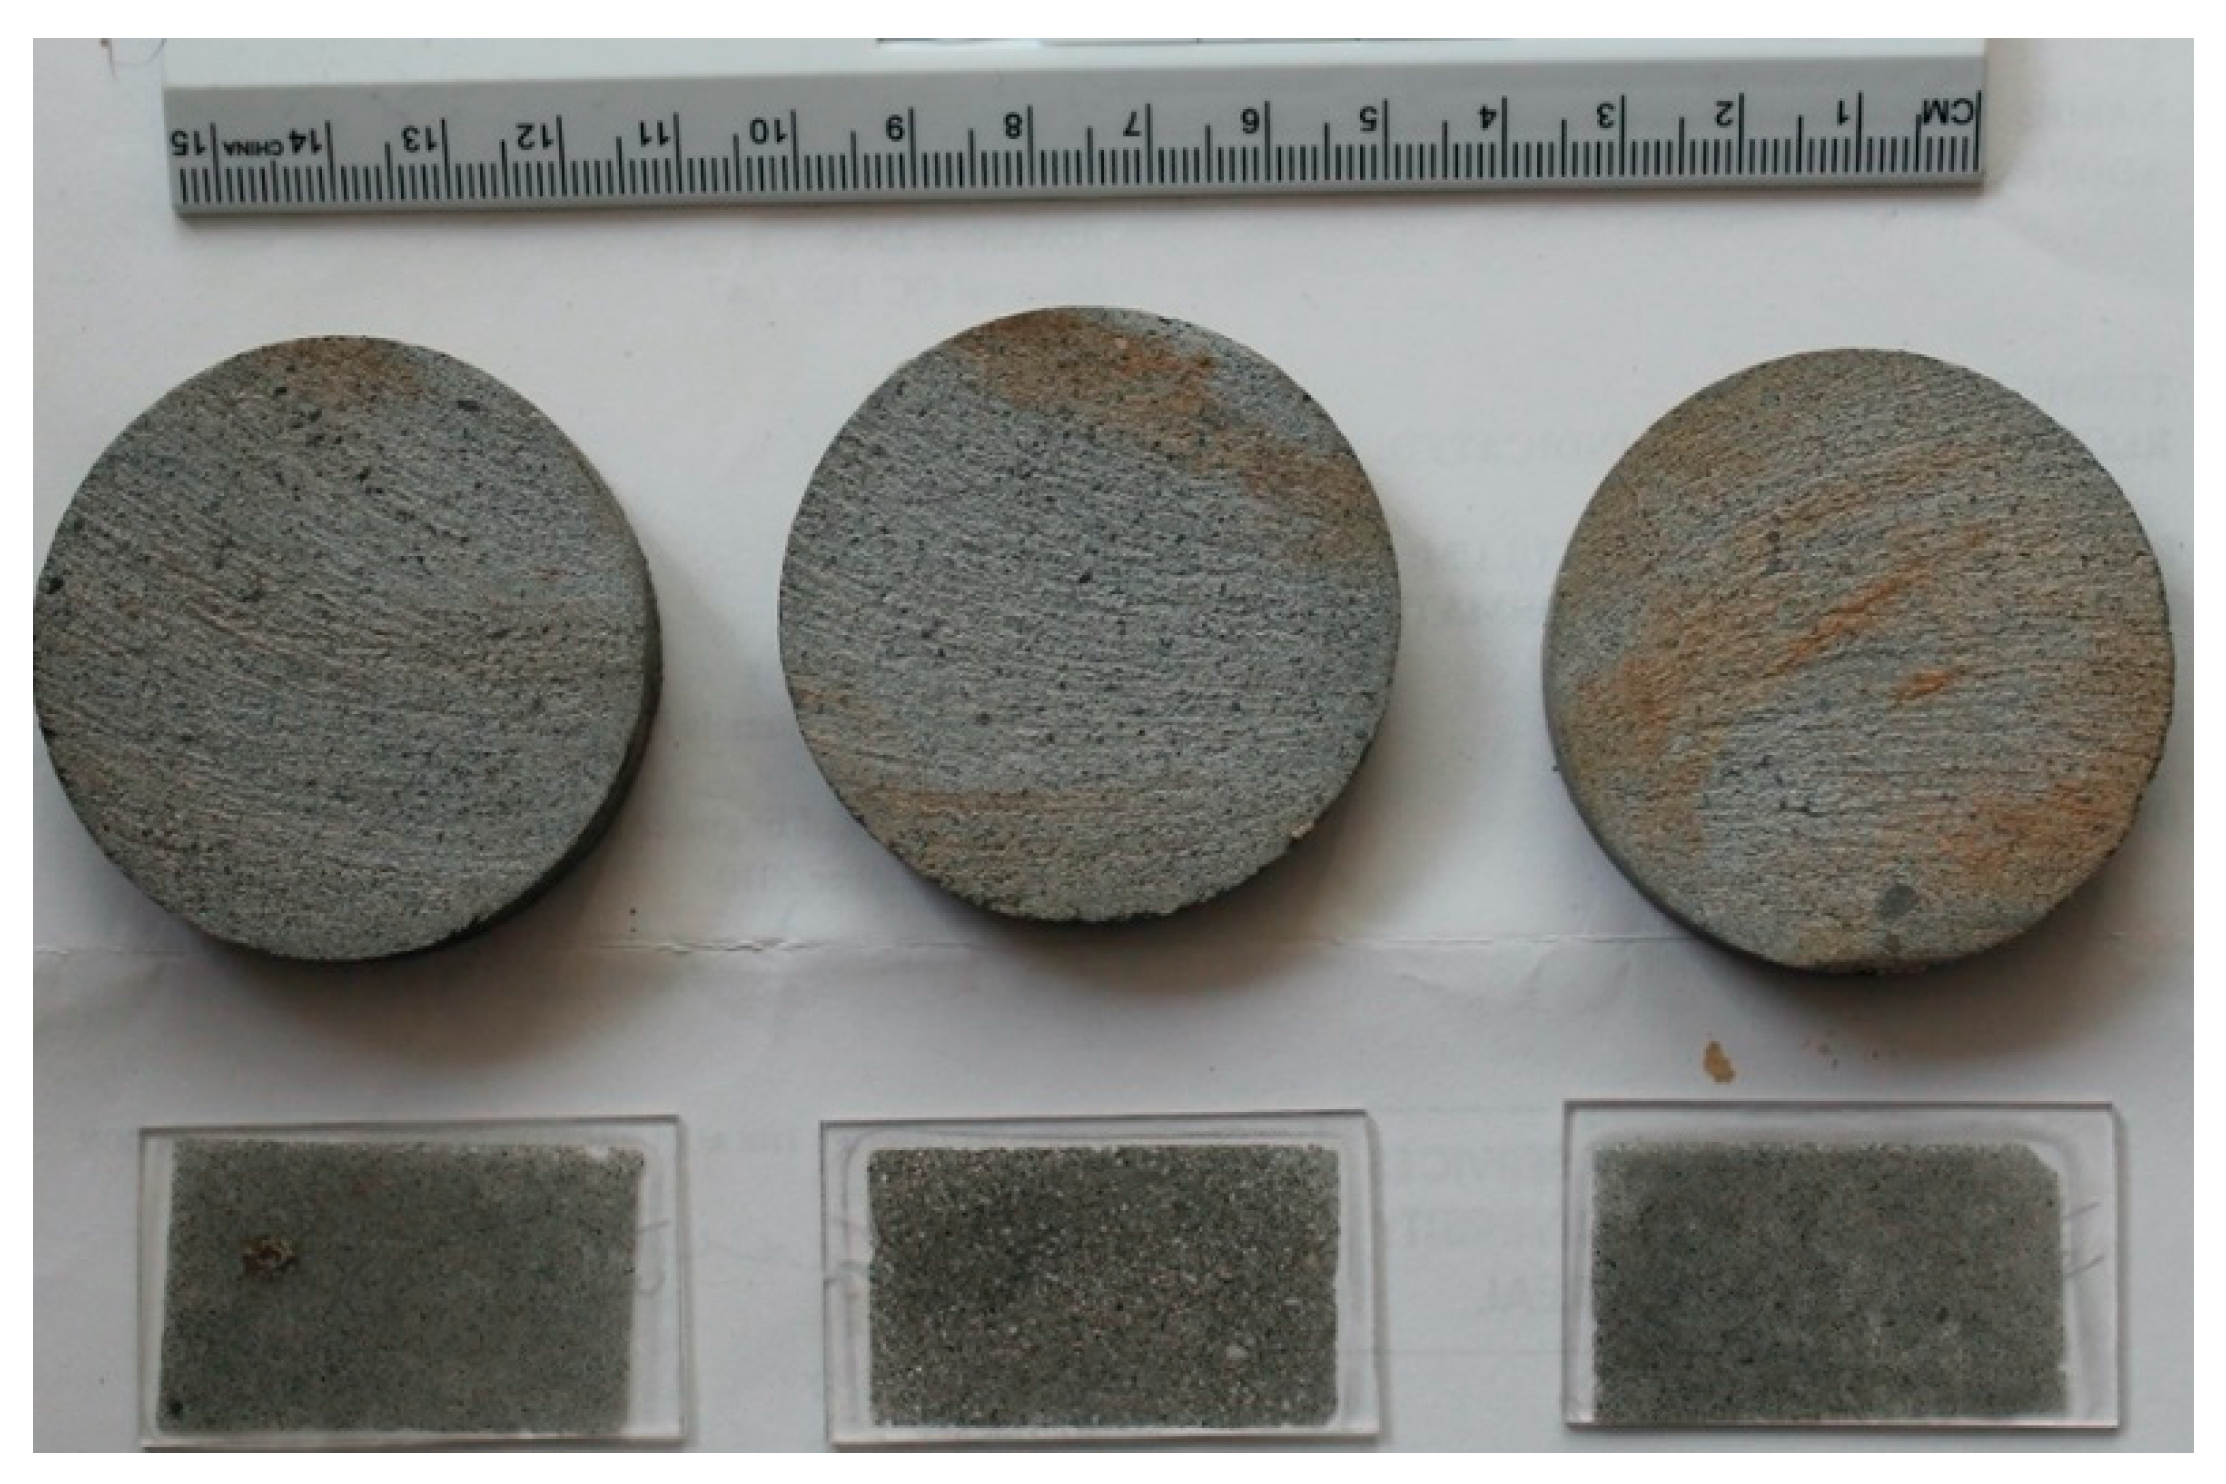
To conduct UCS tests, samples were extruded from the molds using air pressure. The tops of the samples were trimmed to obtain flat surfaces (Figure 6). Sample height and diameter were measured using a Vernier caliper to an accuracy of 0.01 mm. All samples met the height-to-diameter ratio of 2:1 to 2.5:1 in accordance with ASTM D2166/D2166M-16 (ASTM International 2016c).
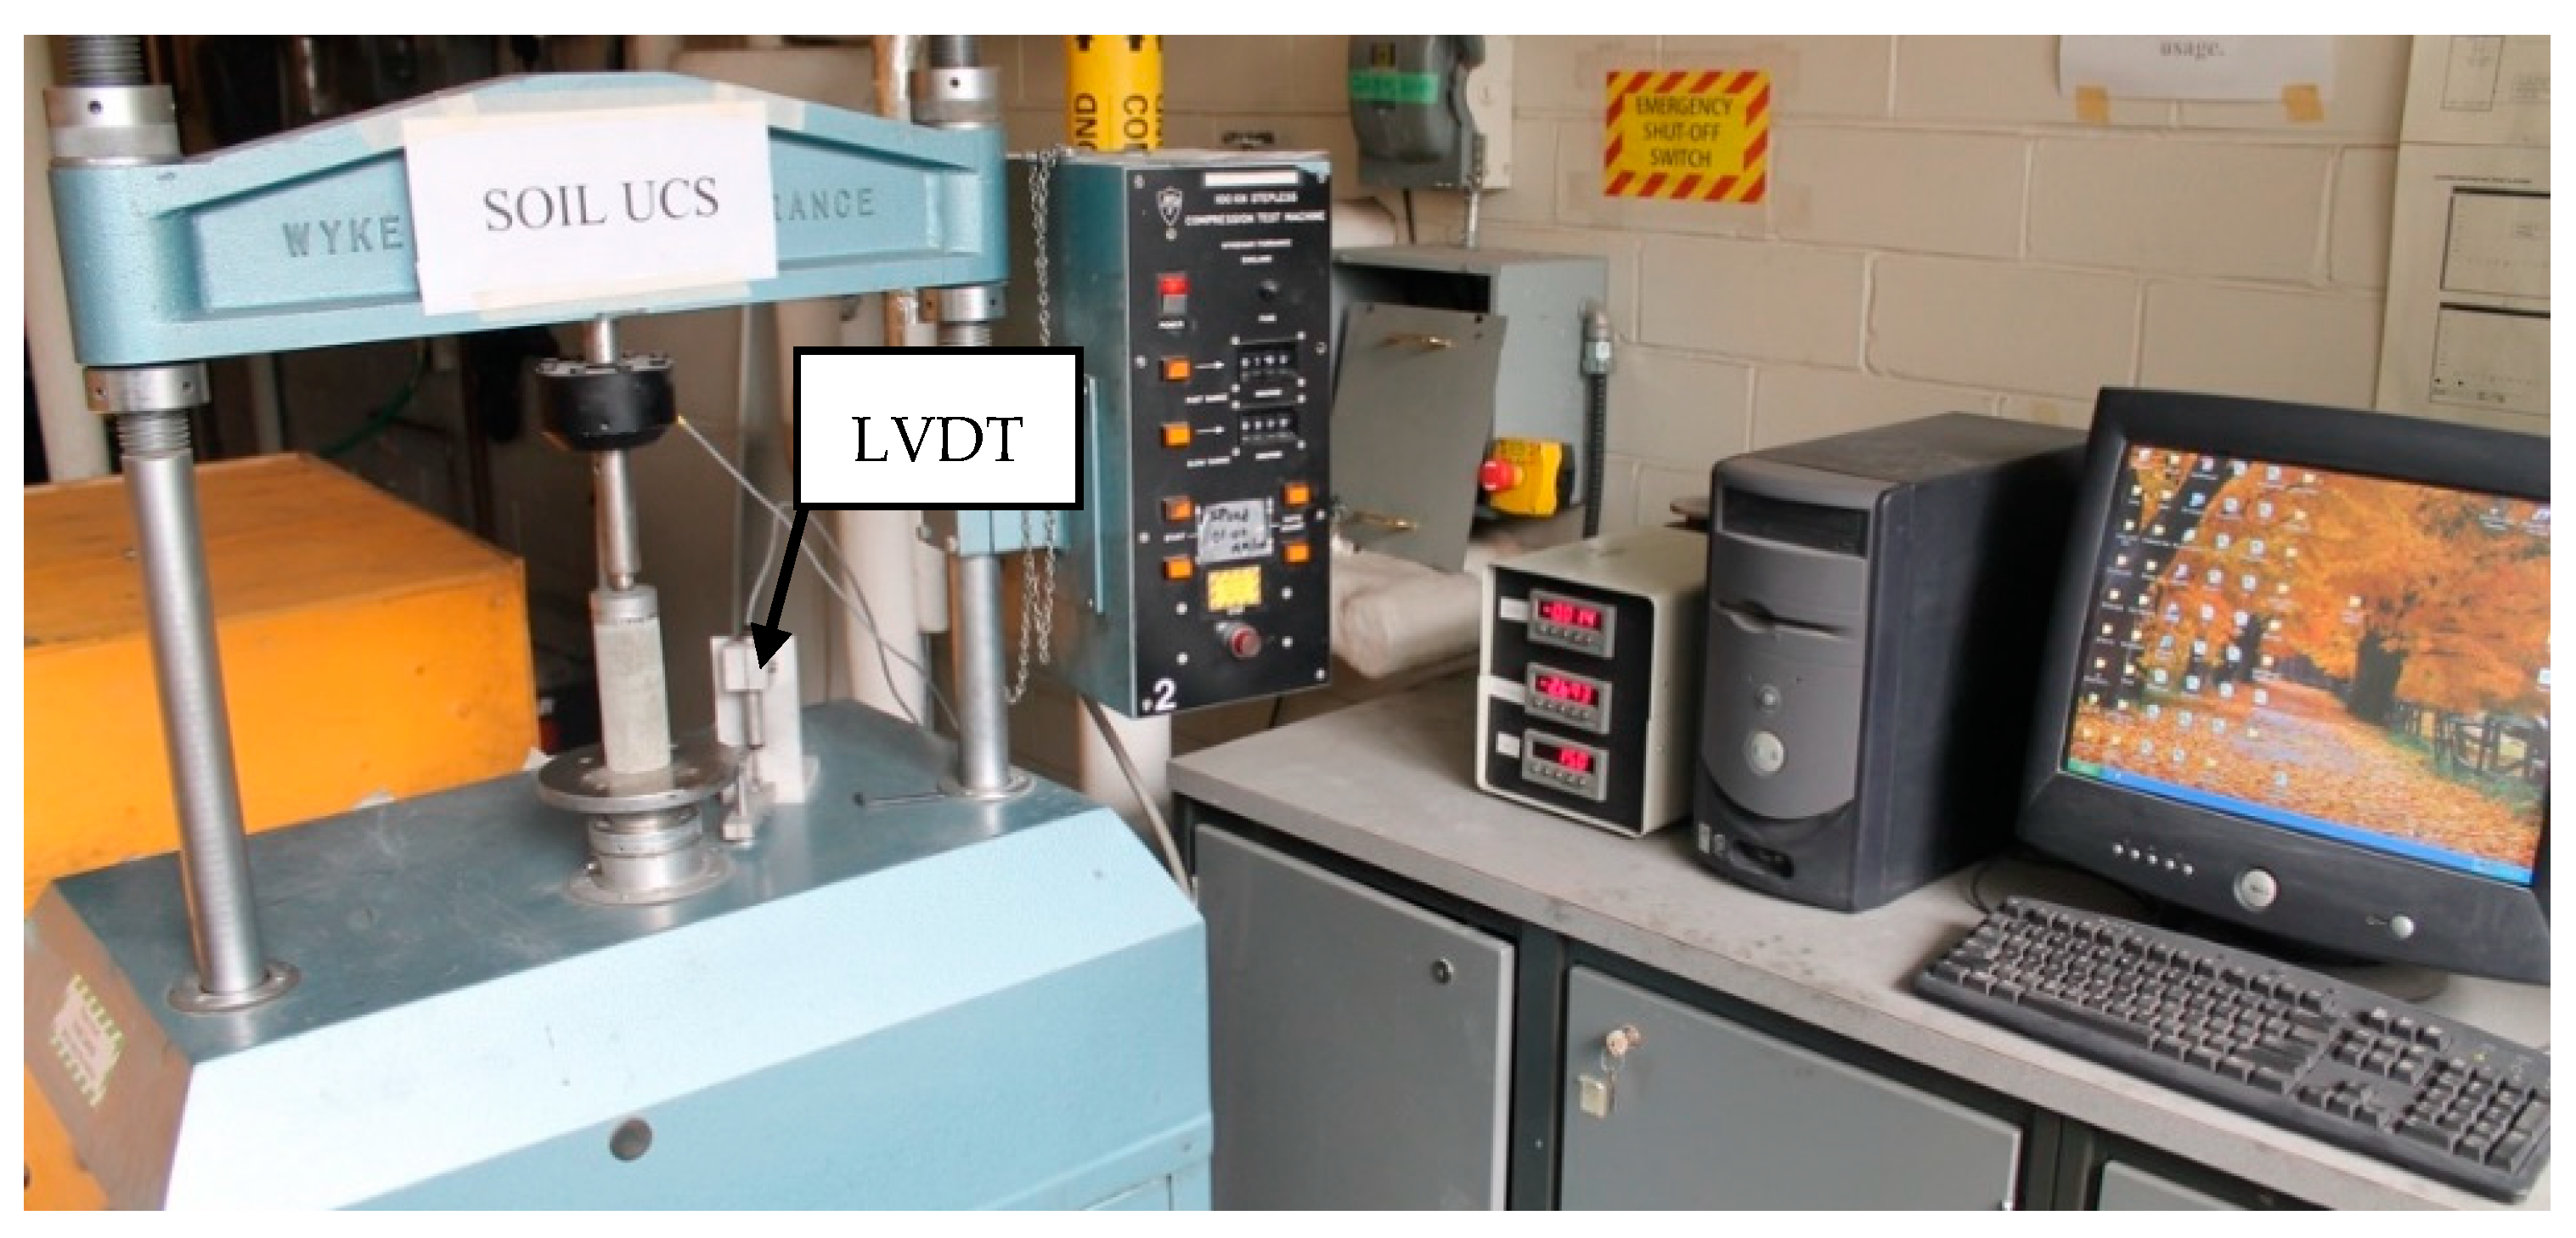
UCS tests were conducted after ASTM D2166/D2166M-16 (ASTM International 2016c) using the Wykeham Farrance 100 kN stepless loading machine equipped with a 50 kN load cell and linear variable displacement transducer for axial deformation measurement (Figure 7). The loading rate was 1 mm/min. On curing days 7, 14 and 28, the test was conducted on triplicate samples for each of the nine mixtures listed in Table 5, and the mean UCS was calculated for each mixture each day.
3.2. Mercury Intrusion Porosimetry Test
The MIP test is a widely accepted test to characterize the pore structure of cement-based materials such as cement pastes, mortars, and concretes [31]. It is a suitable method to characterize pores greater than 5 nm [20]. Briefly, the MIP test involves forcing mercury at high pressure into the test material using a porosimeter. The pressure required to overcome the surface tension of the liquid and force the liquid into a pore provides an indicator of pore size. Equation (5) developed by Edward W. Washburn in 1921 was used to calculate pore radius [32]:
where is the surface tension of mercury (485.5 mN/m), is the mean contact angle of mercury (140°), and P is the pressure exerted (Pa).
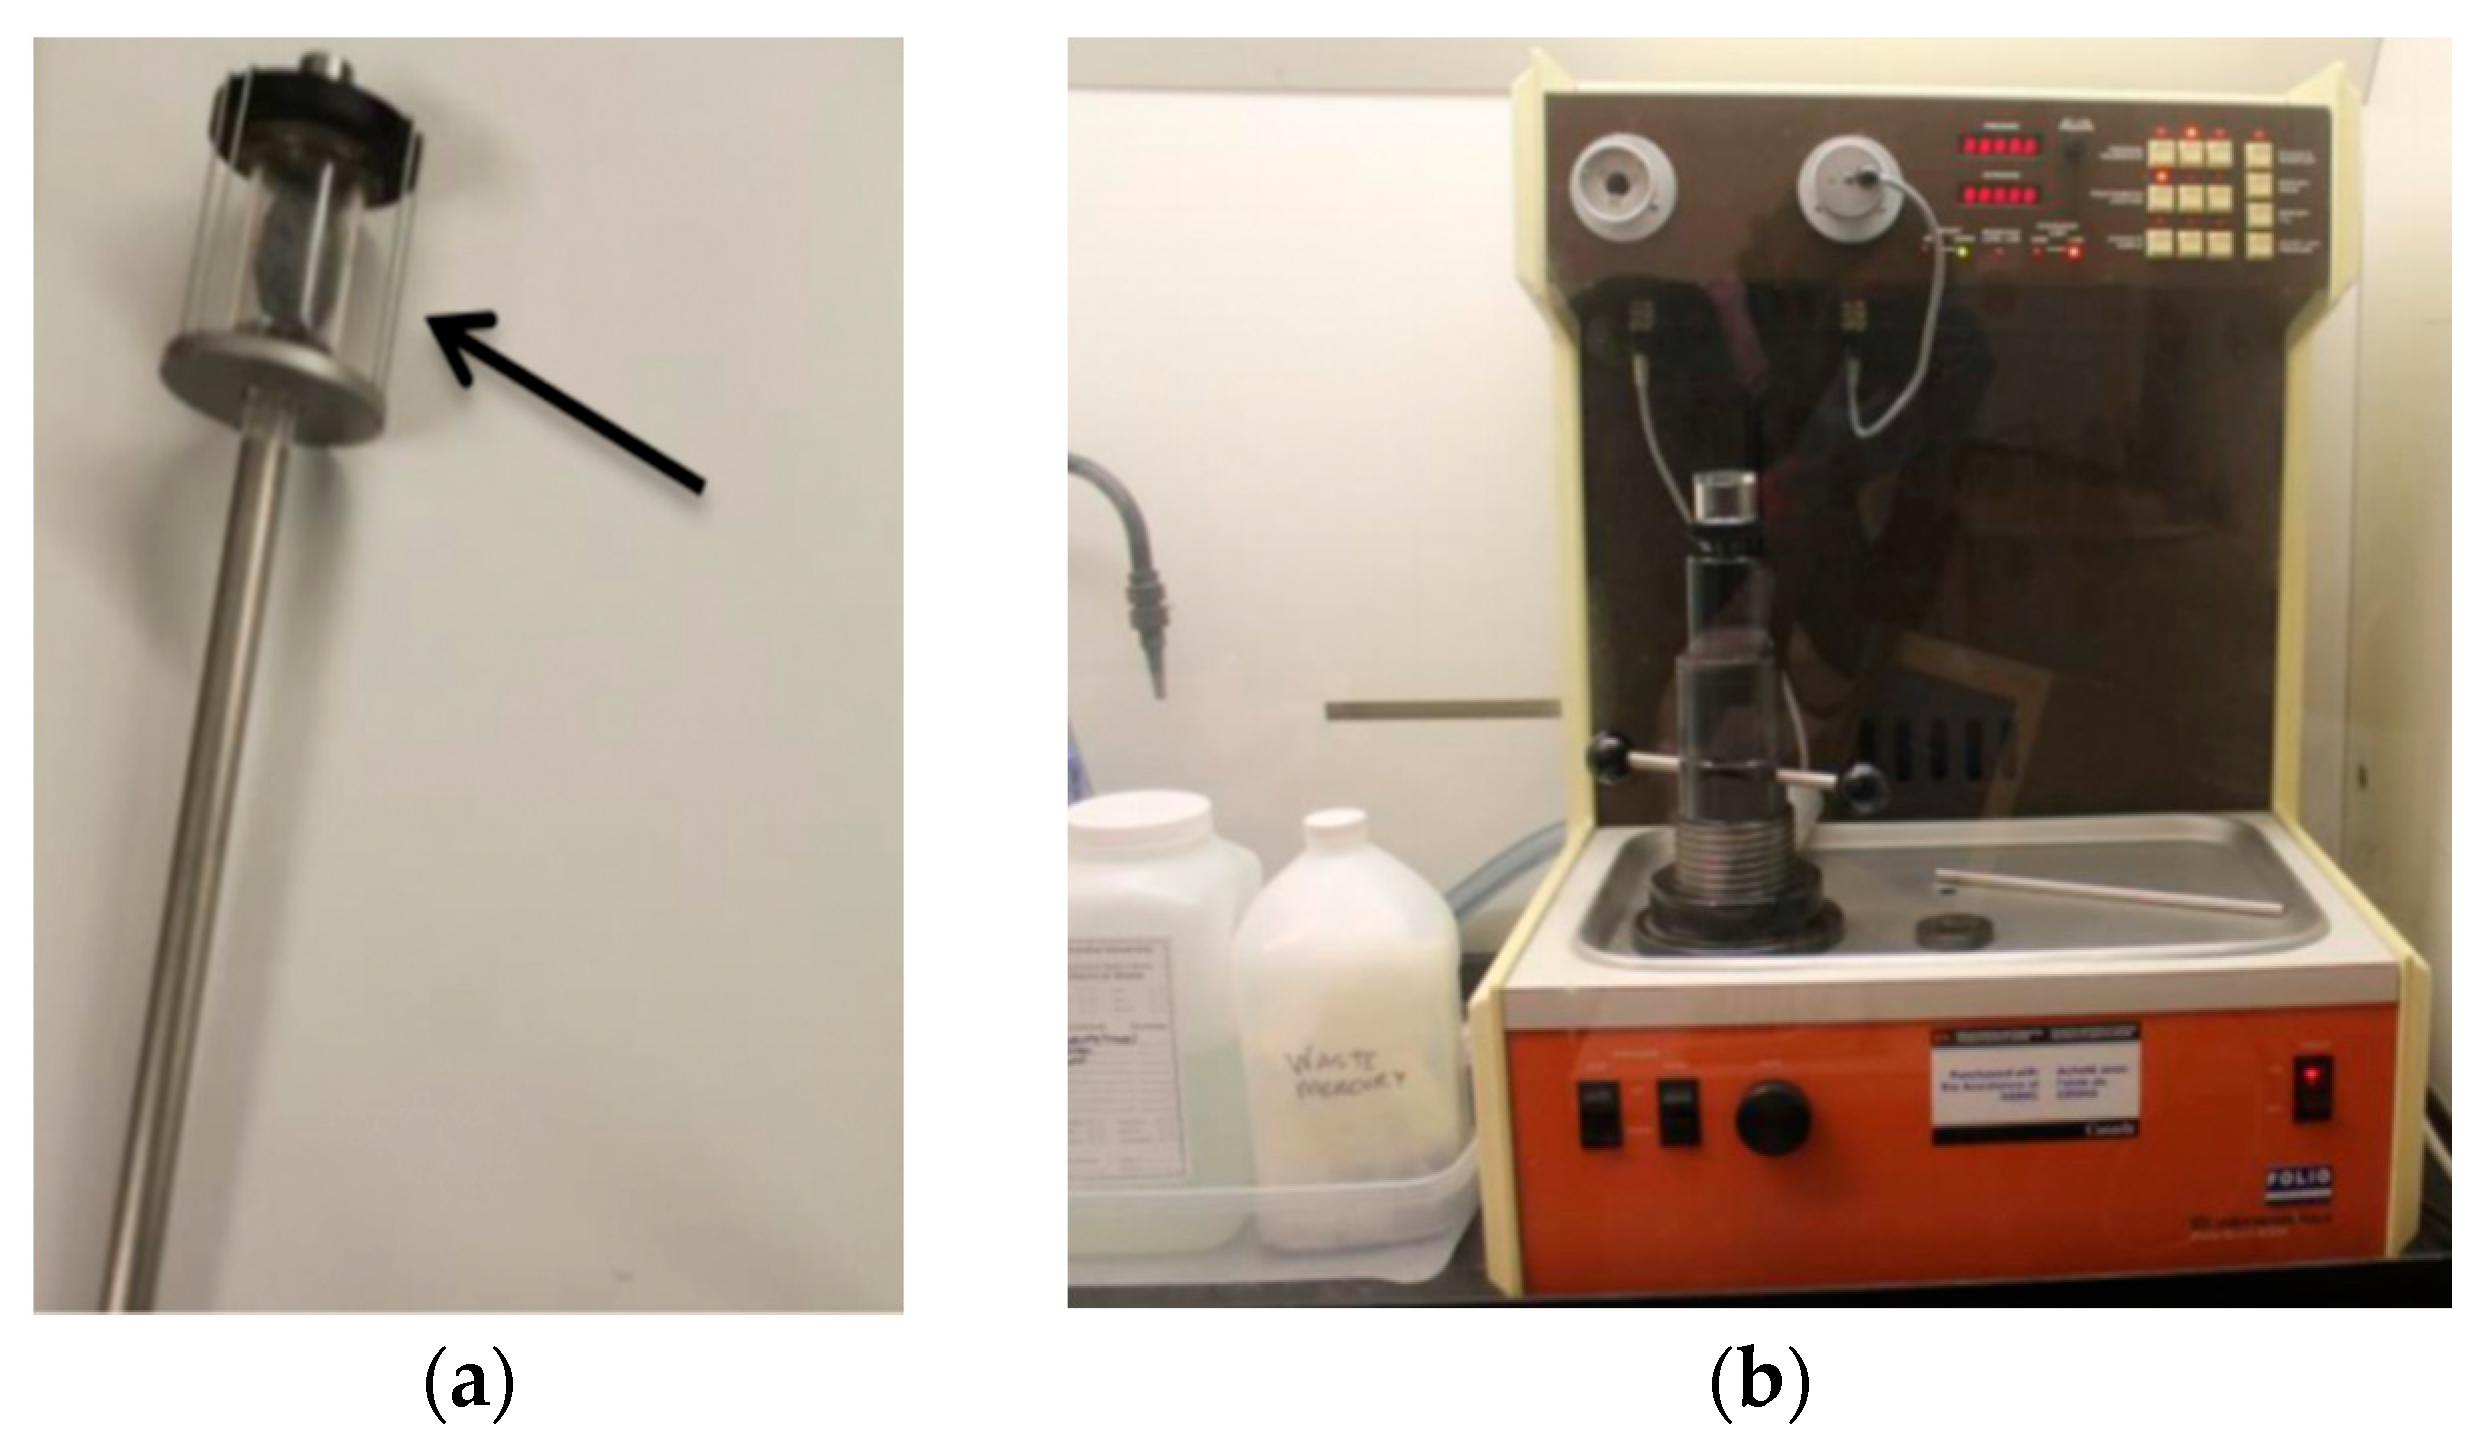
Two samples were chosen for the MIP test: 0% and 20% entrained air with 9% binder (9B0A and 9B20A, respectively; Table 7). To conduct the test, a small sample was loaded into a model 920-61711-00 penetrometer (Figure 8a), and the penetrometer was then loaded onto a Micromeritics 9320 Poresizer® machine (Figure 8b).
Once the test was started, mercury was forced to intrude into the sample as the pressure increased until the sample was saturated. The unit was equipped with a data acquisition system. Readings were recorded and transferred to Microsoft Excel for analysis.
3.3. Dry Density
To analyze the effect of air entrainment, triplicate samples were oven-dried overnight at 100 ± 5 °C and weighed. Sample heights and diameters were measured with a Vernier caliper to an accuracy of 0.01 mm. The dry density was calculated by dividing the sample dry weight by the cylinder volume.
3.4. Microscopic Analysis
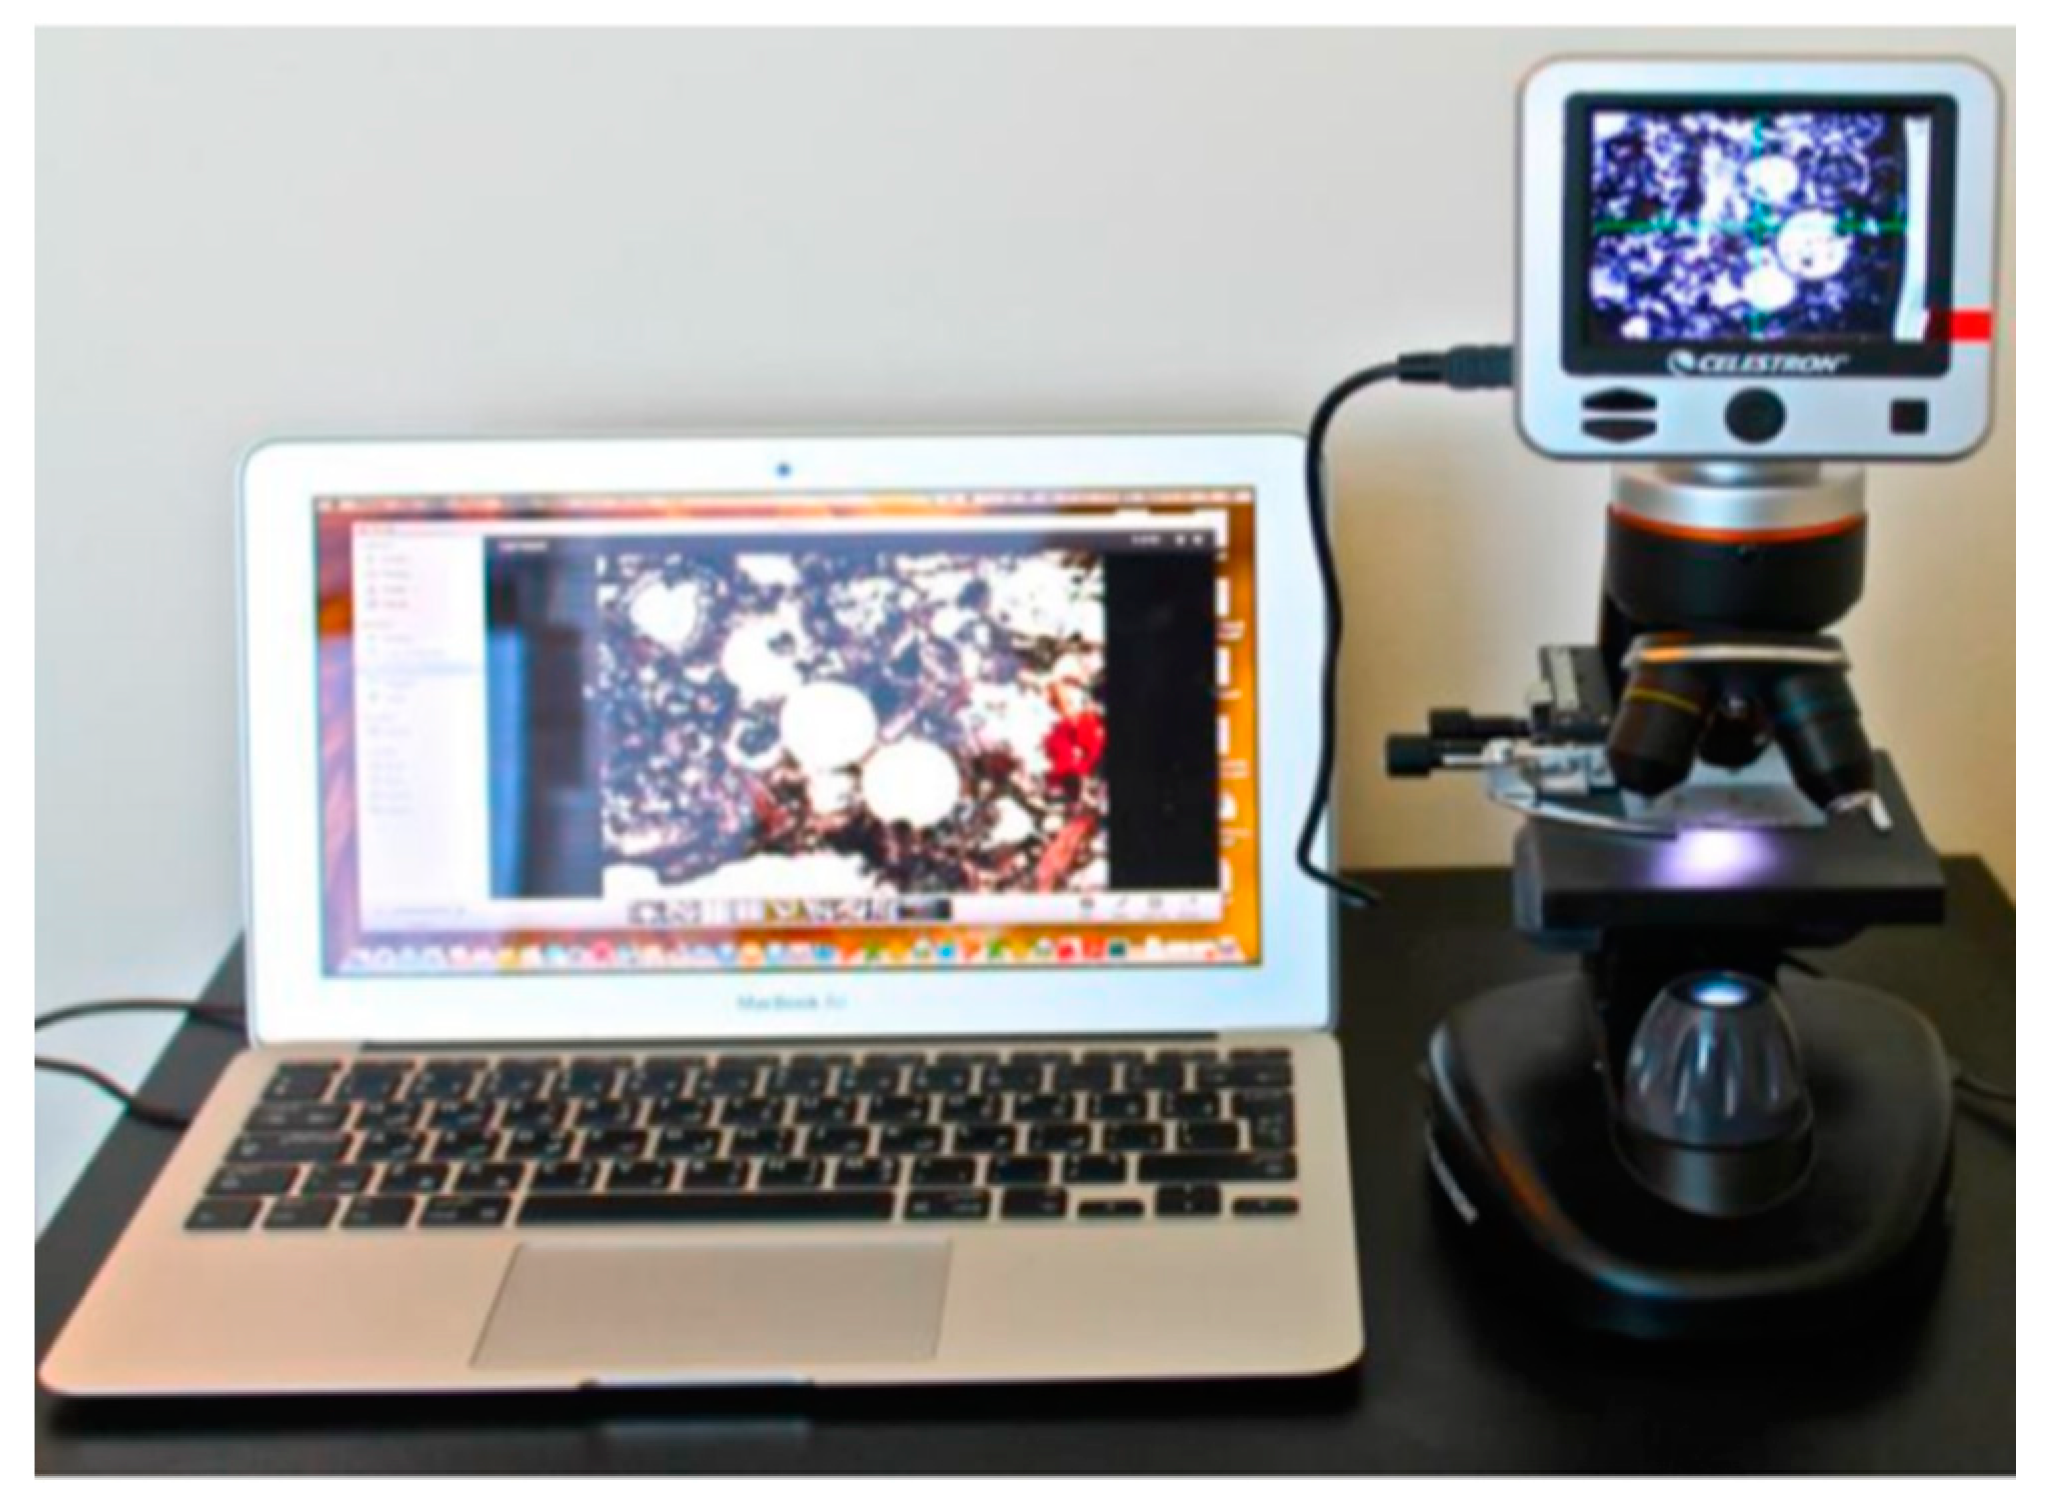
To investigate the effect of foam mixing time on the evolution of air bubbles, samples subjected to foam mixing times of 2, 8, 25 and 45 min were thin-sectioned (24 mm wide × 46 mm long × 30 µm thick) to visualize air bubbles under a Celectron® digital microscope II with a built-in 5 megapixel camera and a magnification of 40× (Figure 9 and Figure 10).
4. Results and Discussion
4.1. Unconfined Compressive Strength
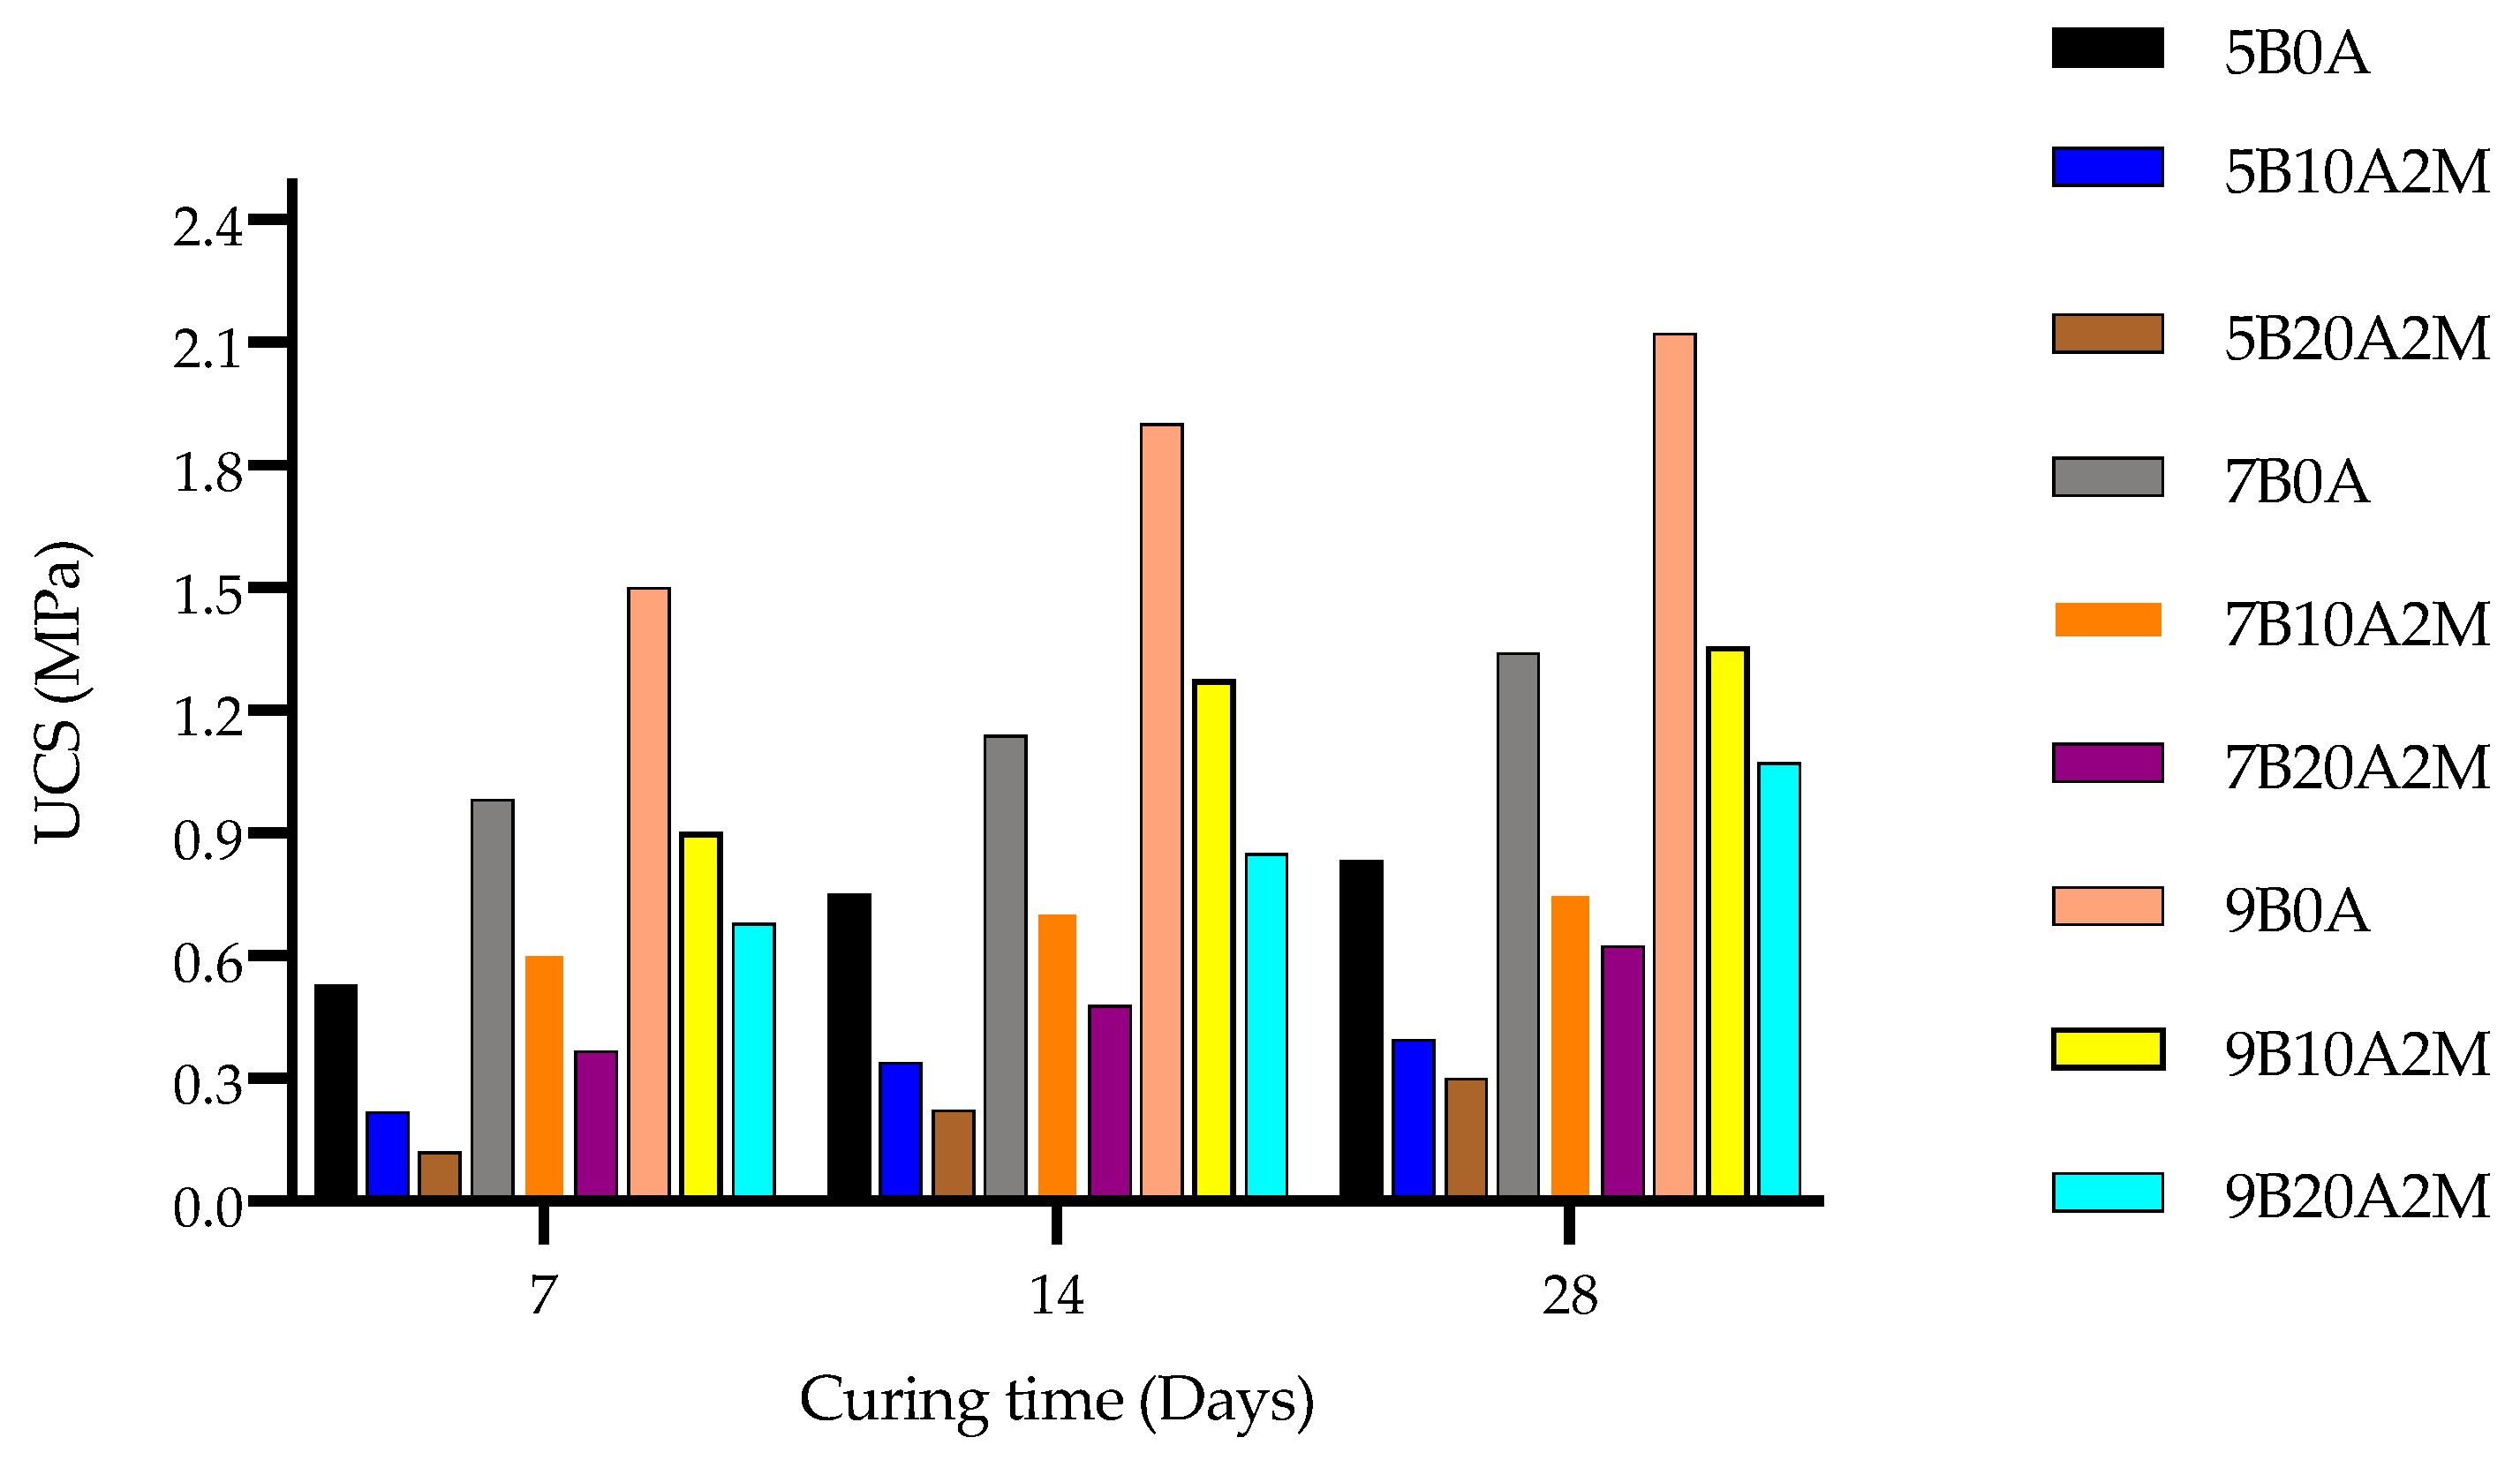
Binder dosage and air entrainment had opposing effects on UCS. Increasing the binder dosage from 5 to 9% led to a higher UCS, but increasing the air entrained from 0 to 20% led to a lower UCS (Figure 11). Thus, the highest UCS (2.1 MPa) was achieved on samples containing 9% binder and 0% air entrainment after 28 days of curing (Figure 11). More hydration products are formed at higher binder content [24]. The UCS increased with curing time from 7 to 28 days across all nine mixtures (Figure 11). This is expected because of the progressive formation of cement hydration products as curing proceeds.
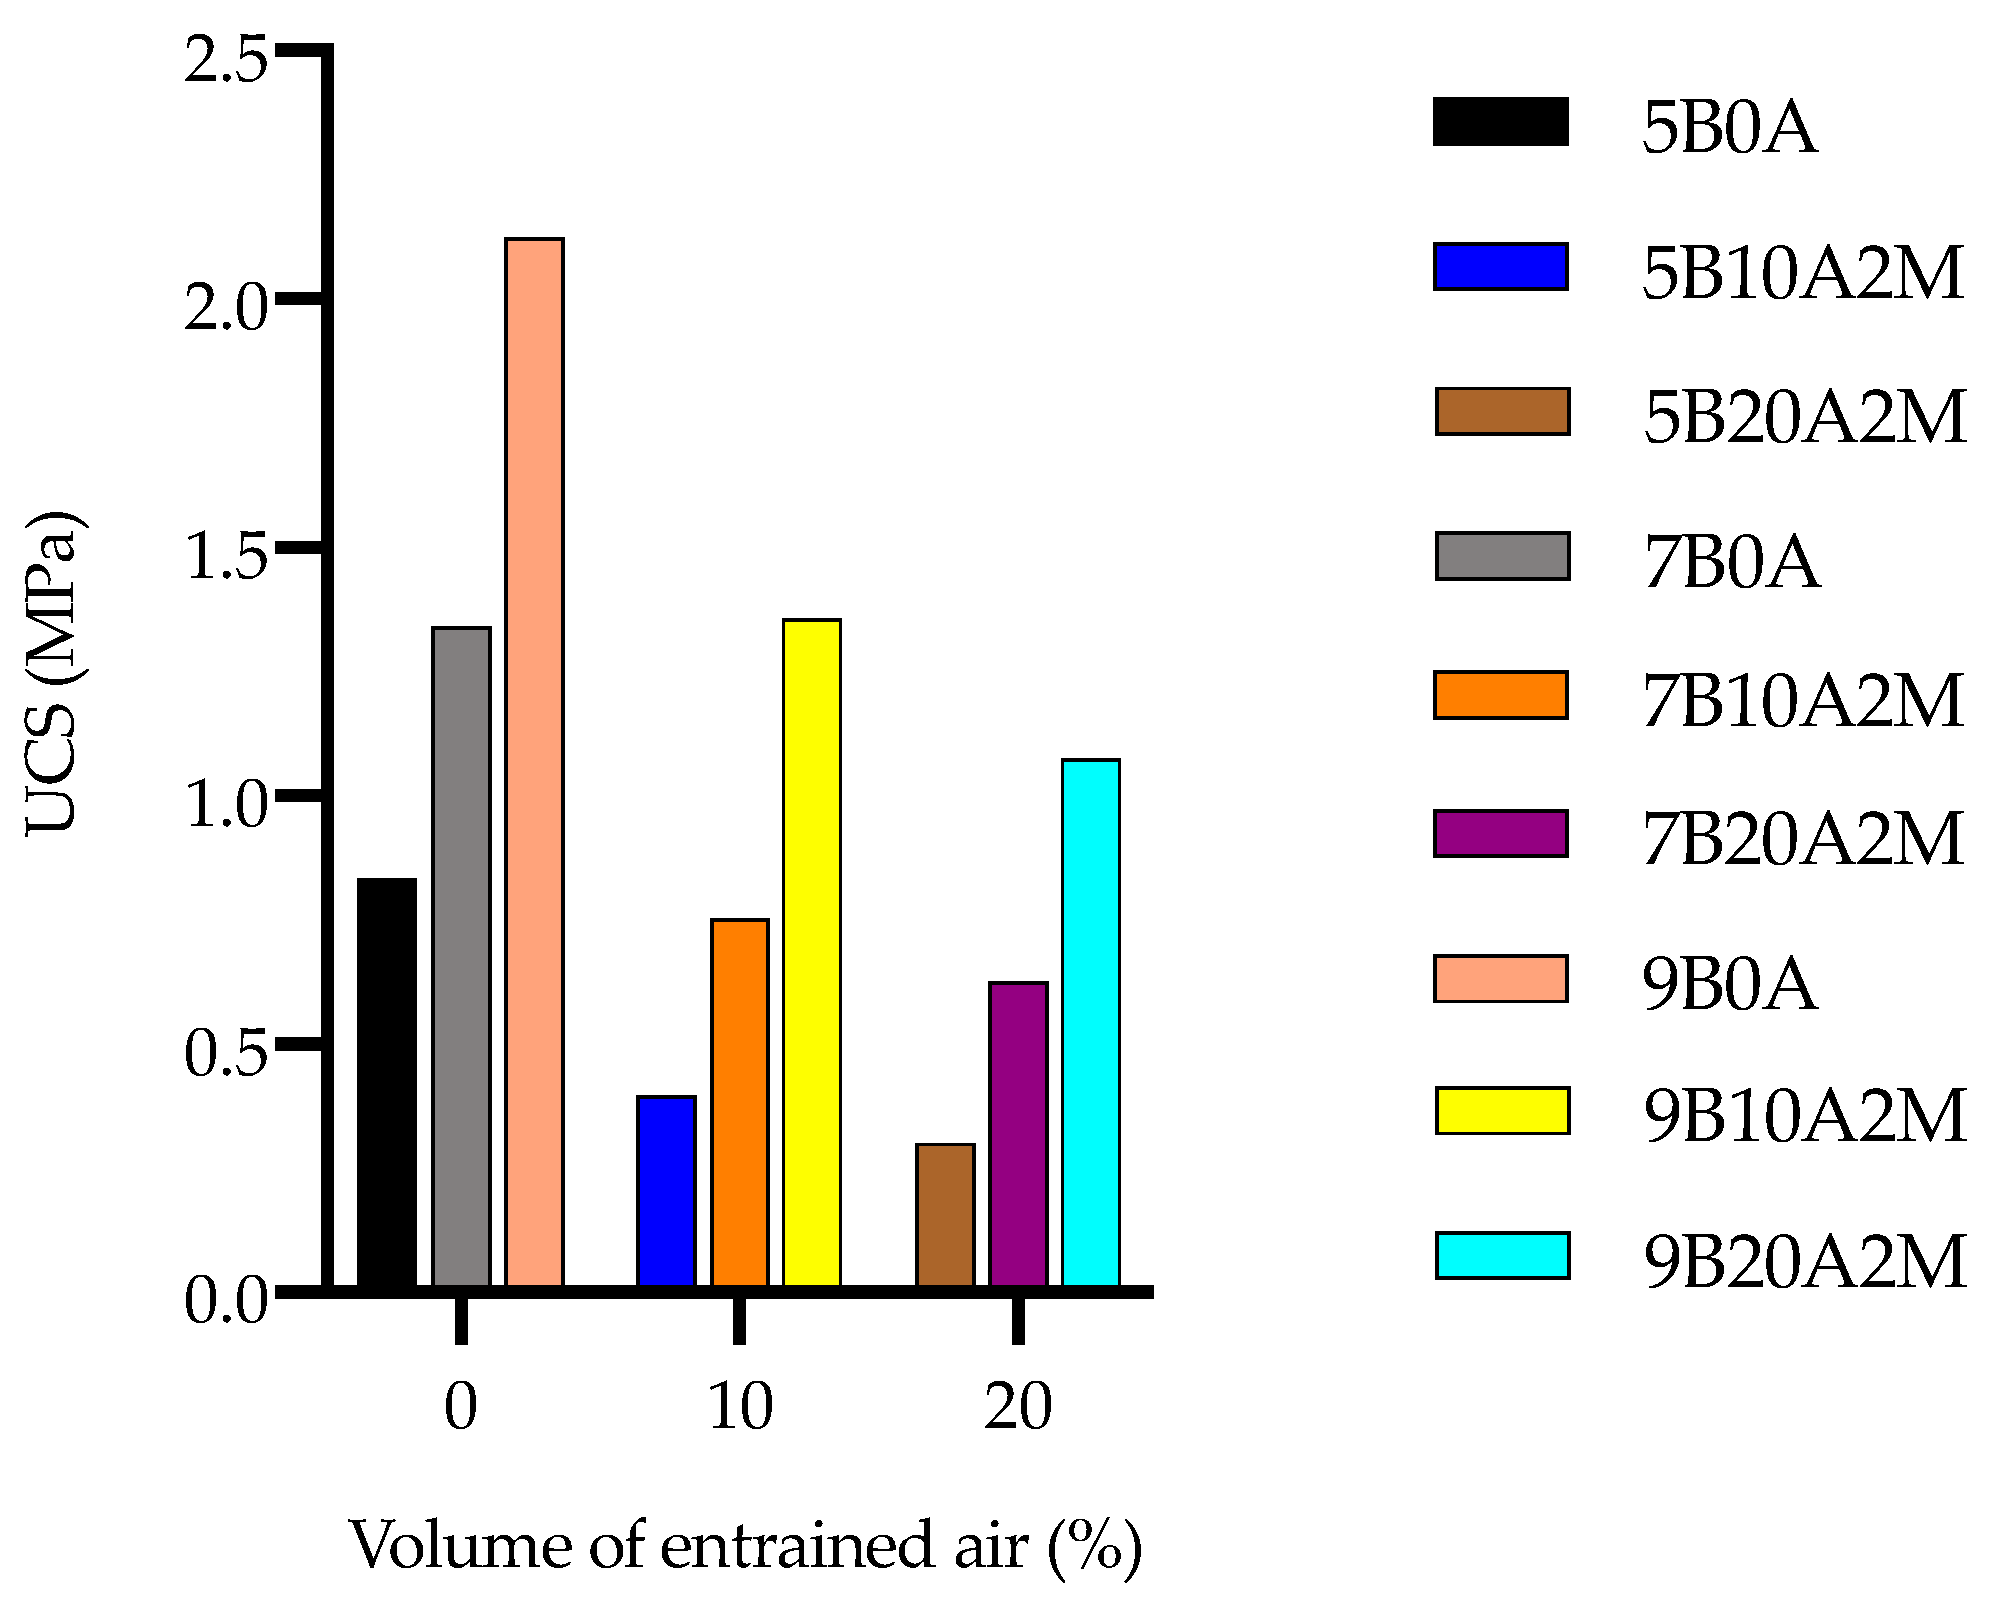
Closer examination of samples cured for 28 days shows that the negative relationship between UCS and entrained air is not linear (Figure 12). This phenomenon can be explained by the fact that air entrainment can also enhance dispersion of cement grains through electrostatic and steric repulsion [33]. Cement grains tend to agglomerate in response to van der Waals forces once water is added to the mixture [33]. However, once a chemical admixture with a plasticizing effect is added, agglomerated cement grains disperse [34,35,36]. The foaming agent is considered to have a plasticizing effect because it contains surfactant molecules. The hydrophilic heads of the surfactant molecules adsorb onto the cement grains, resulting in the formation of a charged layer, while the hydrophobic tails increase the hydrophobicity of the cement grains [37]. The cement grains are dispersed because of electrostatic repulsion caused by the charged layer. This action helps to improve the flowability of the mine backfilling material and facilitate its transport through pipelines.
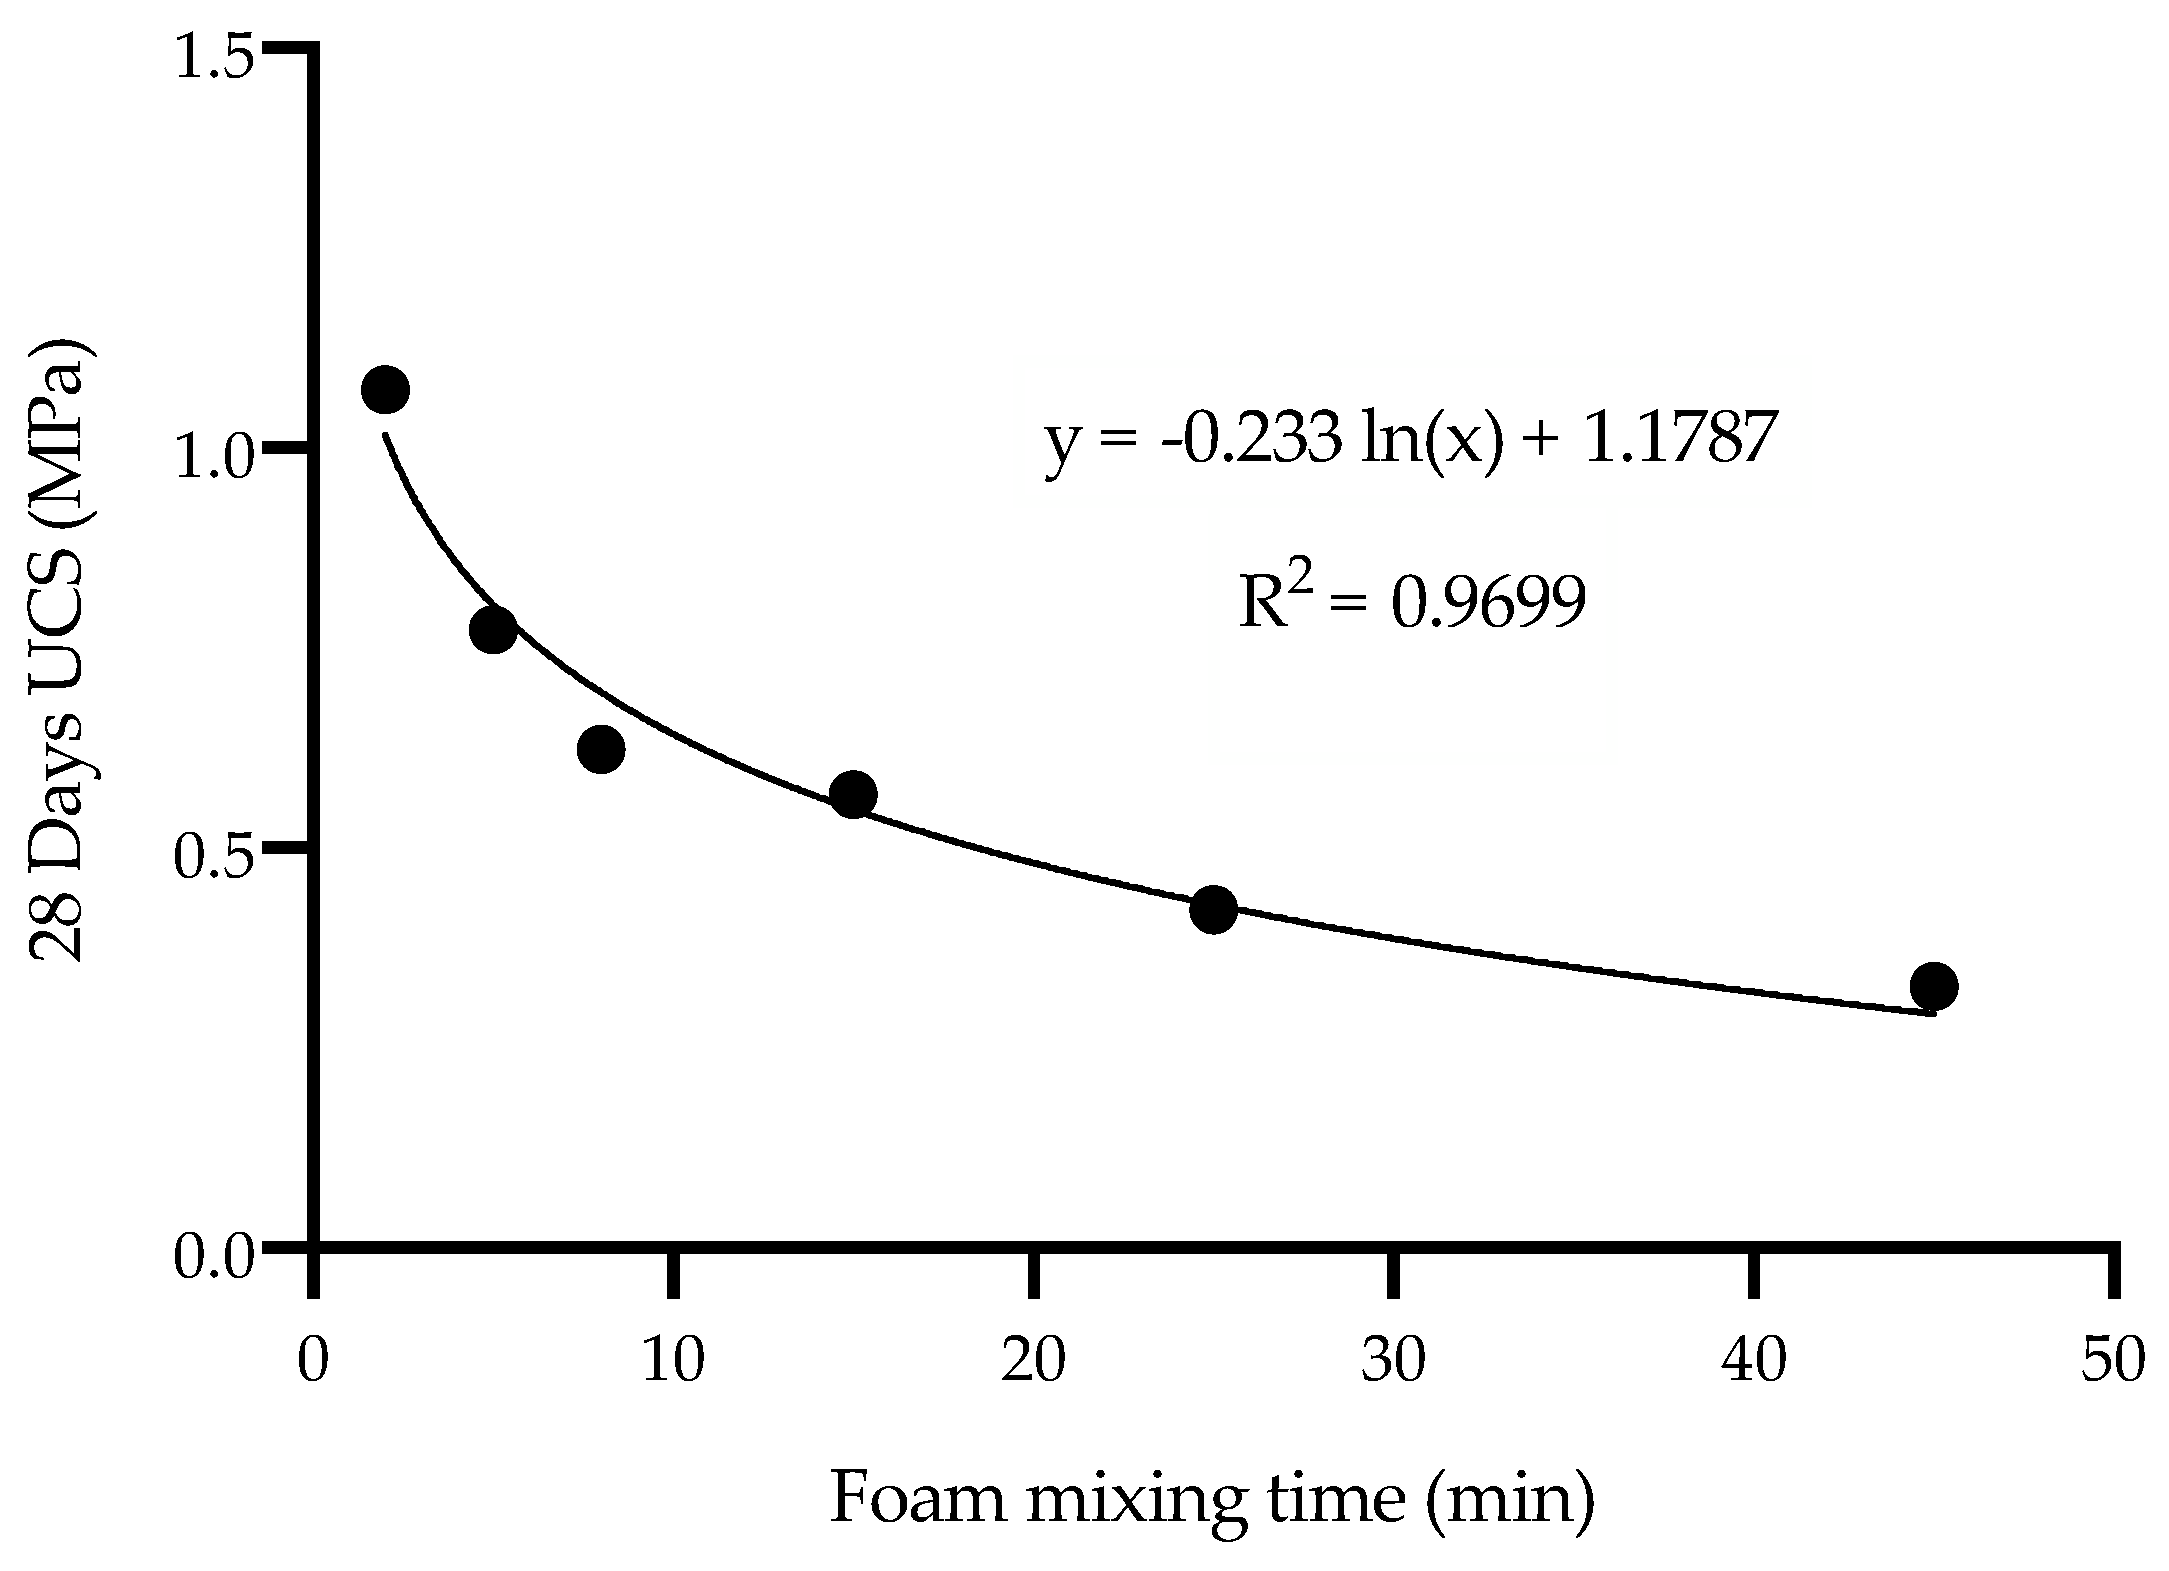
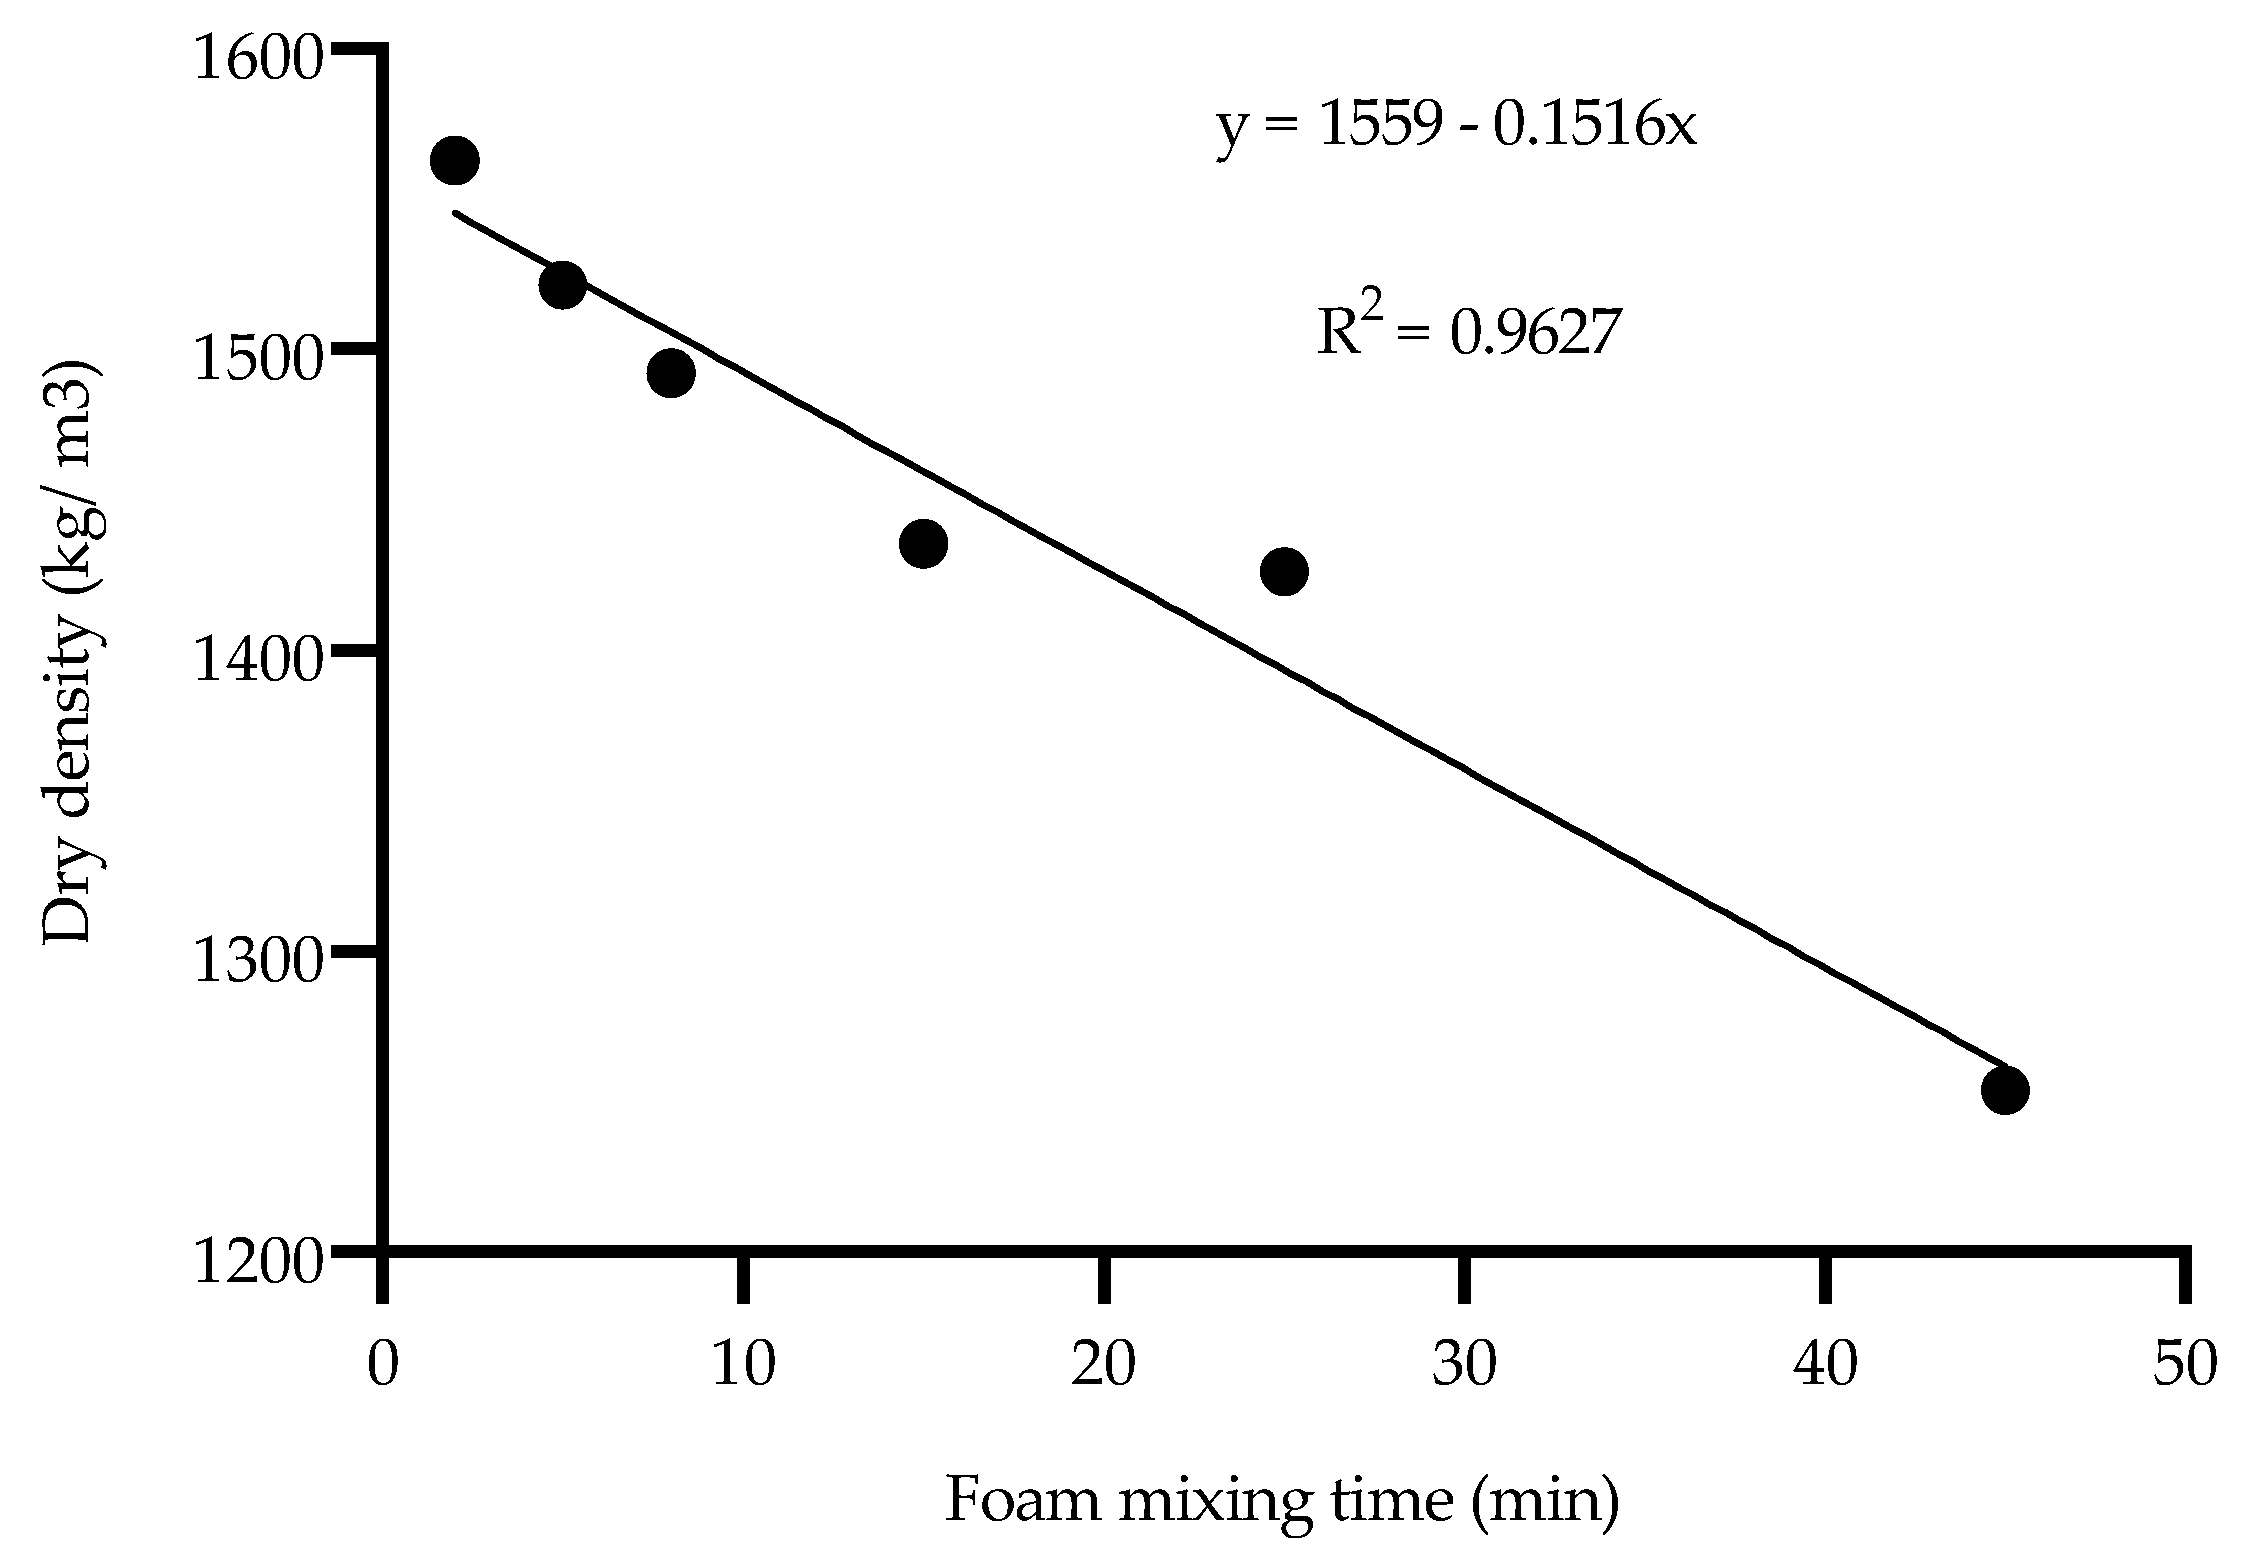
The UCS of FMF samples decreased exponentially as foam mixing time increased (Figure 13). For example, the UCS value dropped considerably from 1.1 MPa for the 2 min mix to 0.3 MPa in the 45 min mix (Figure 13). Moreover, the densities decreased linearly from approximately 1600 kg/m3 for the 2 min mix to about 1250 kg/m3 in the 45 min mix. This means that as the foam mixing time increases, the samples become more porous and, hence, density and UCS decrease. This will be further investigated in Section 4.4.
4.2. Porosity
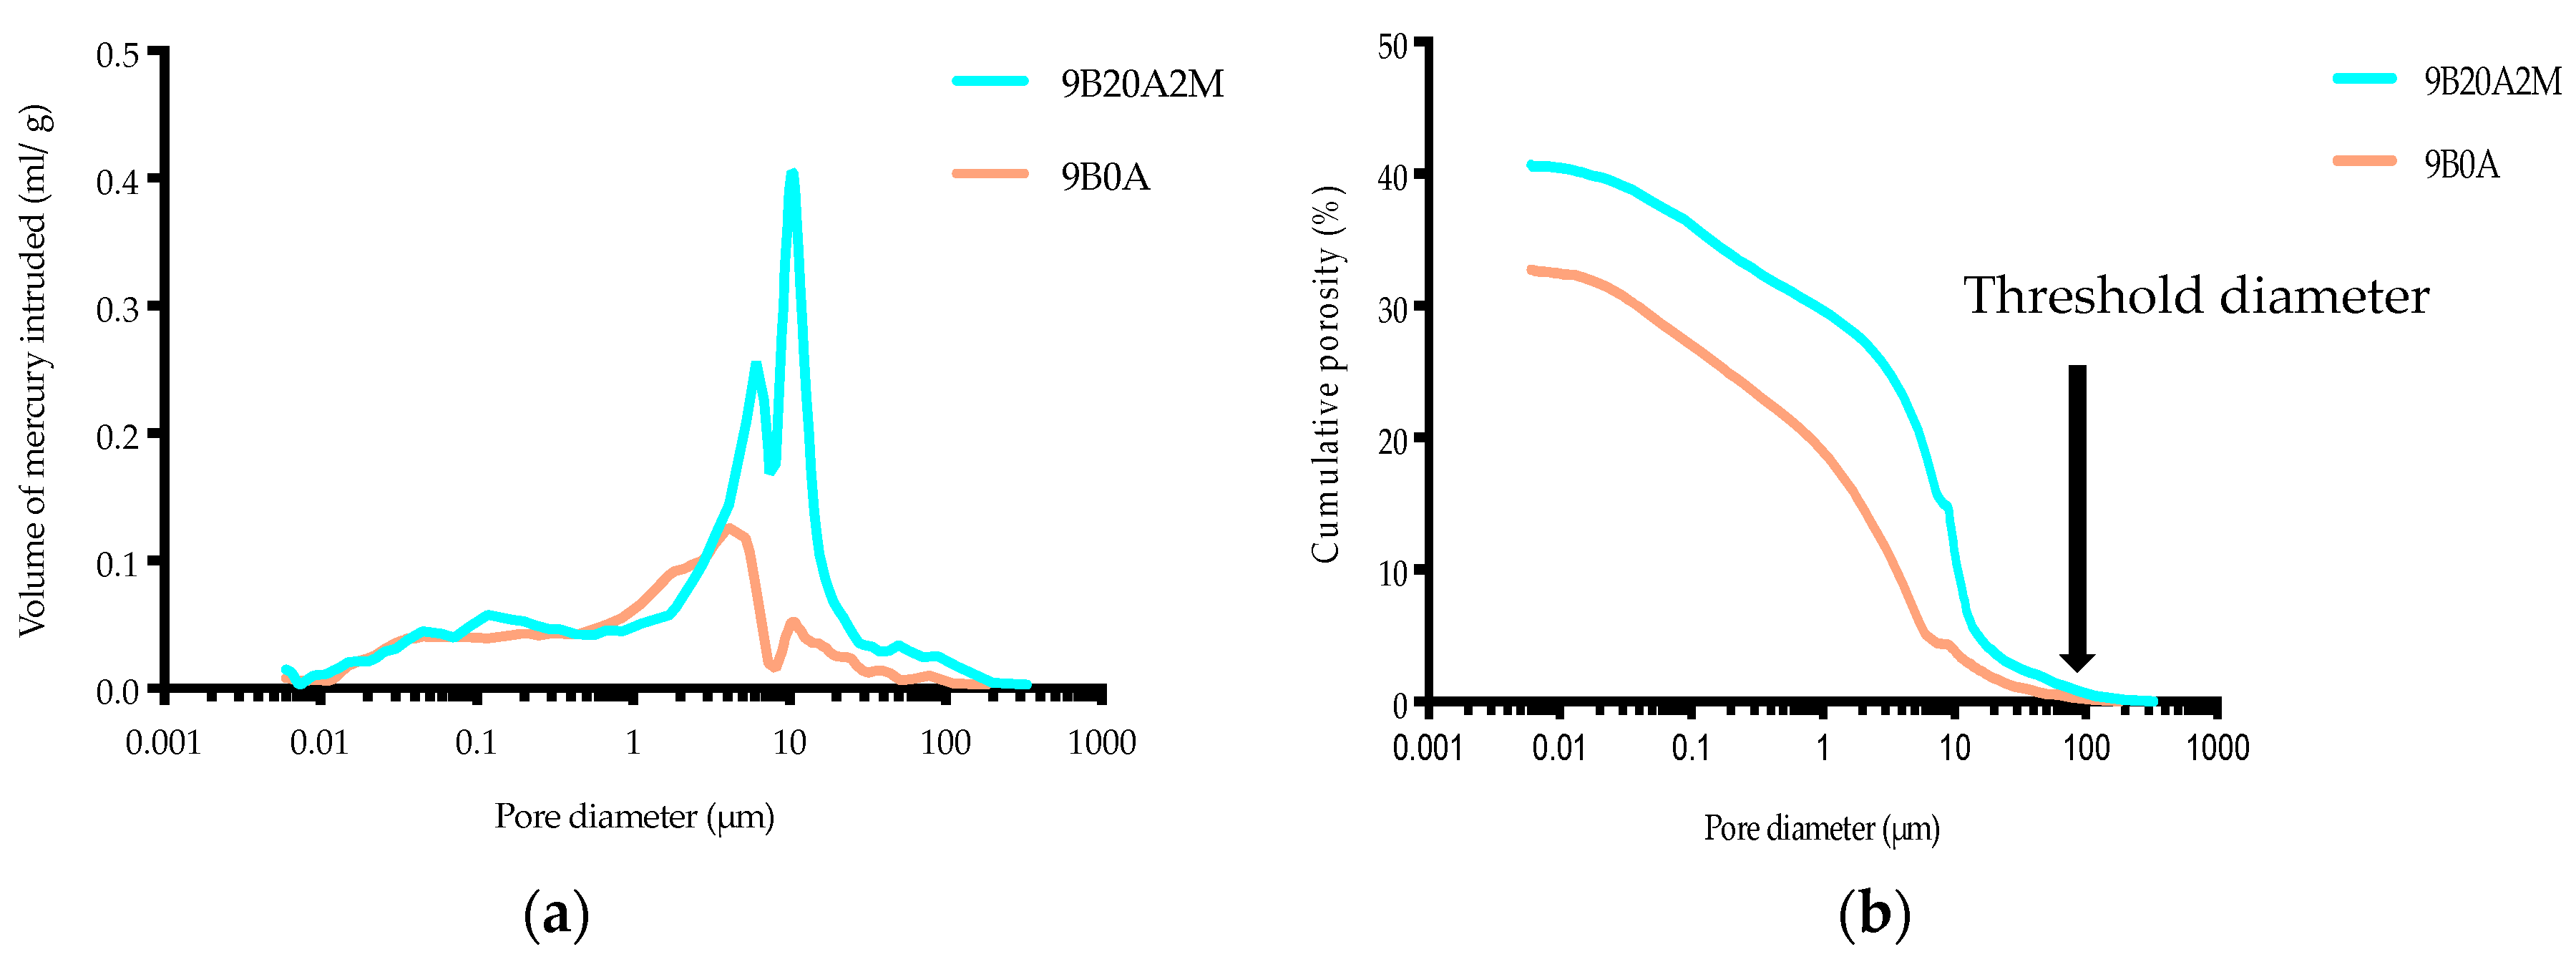
The pore size distribution and porosity of FMF prepared with 9% binder were strongly influenced by the volume of entrained air. If air entrainment was 0%, the samples had a high frequency of pore sizes between 1 and 10 µm (Figure 14a), but at 20% air entrainment, samples had a high frequency of pore sizes between 1 and 50 µm. The total porosity was higher for the sample with 20% entrained air (41%) than 0% entrained air (32%; Figure 14b). This difference in porosity explains the lower mean UCS for sample 9B20A-2M (1.06 MPa) relative to sample 9B0A (2.13 MPa). It should be noted that MIP may have underestimated the porosity by failing to capture pore sizes larger than the threshold diameter (i.e., at which mercury started intruding the samples) shown as a vertical line in Figure 14b. Regardless, MIP is still considered an acceptable test to characterize the pore structure of cement-based materials.
4.3. Dry Densities
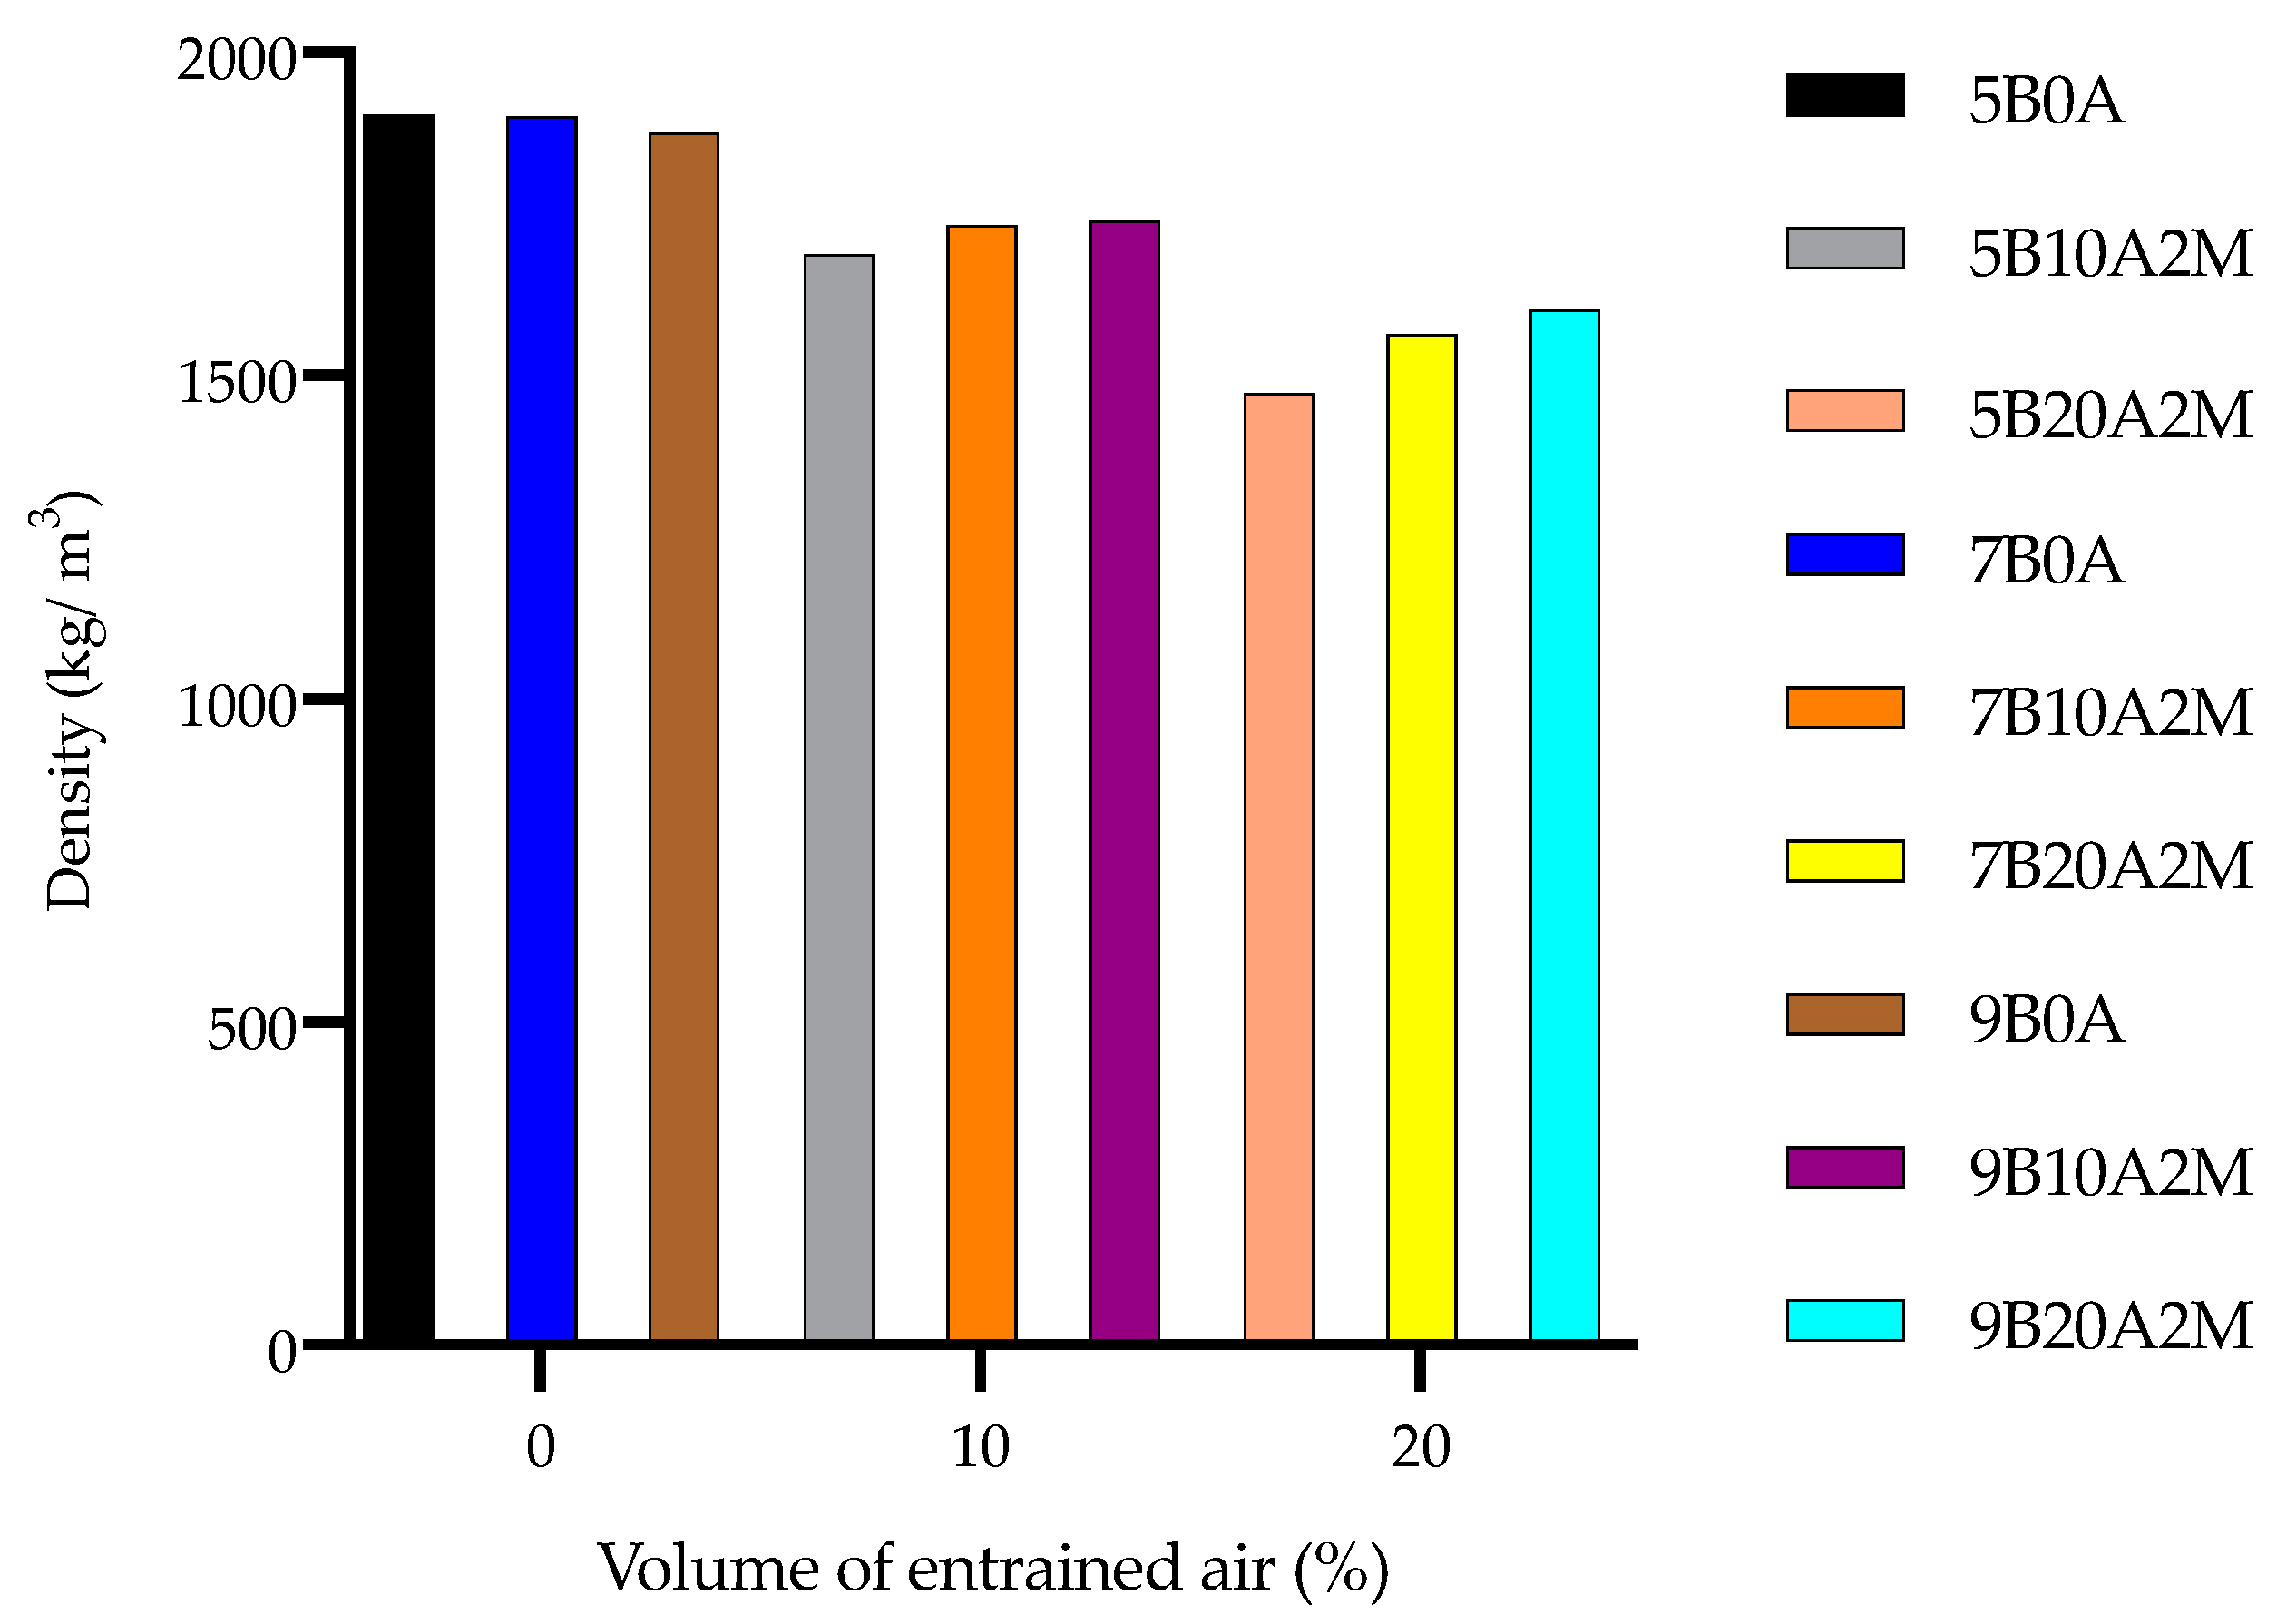
Higher amounts of entrained air were associated with lower dry densities at all three binder dosages (Figure 15). For example, the mean dry density linearly decreased from 1878 kg/m3 at 0% air entrainment by approximately 18 kg/m3 for every 1% increase in the amount of entrained air. A linear decrease in density was also observed (Figure 16) as mixing time was increased from 2 min (1600 kg/m3) to 45 min (1250 kg/m3). More porous samples had more empty pores occupying the sample volume. These results show that FMF is considerably less dense relative to the reference samples. As mentioned previously, a less dense fill material may be desirable in some mining methods like underhand cut-and-fill mining to ensure a safer working environment.
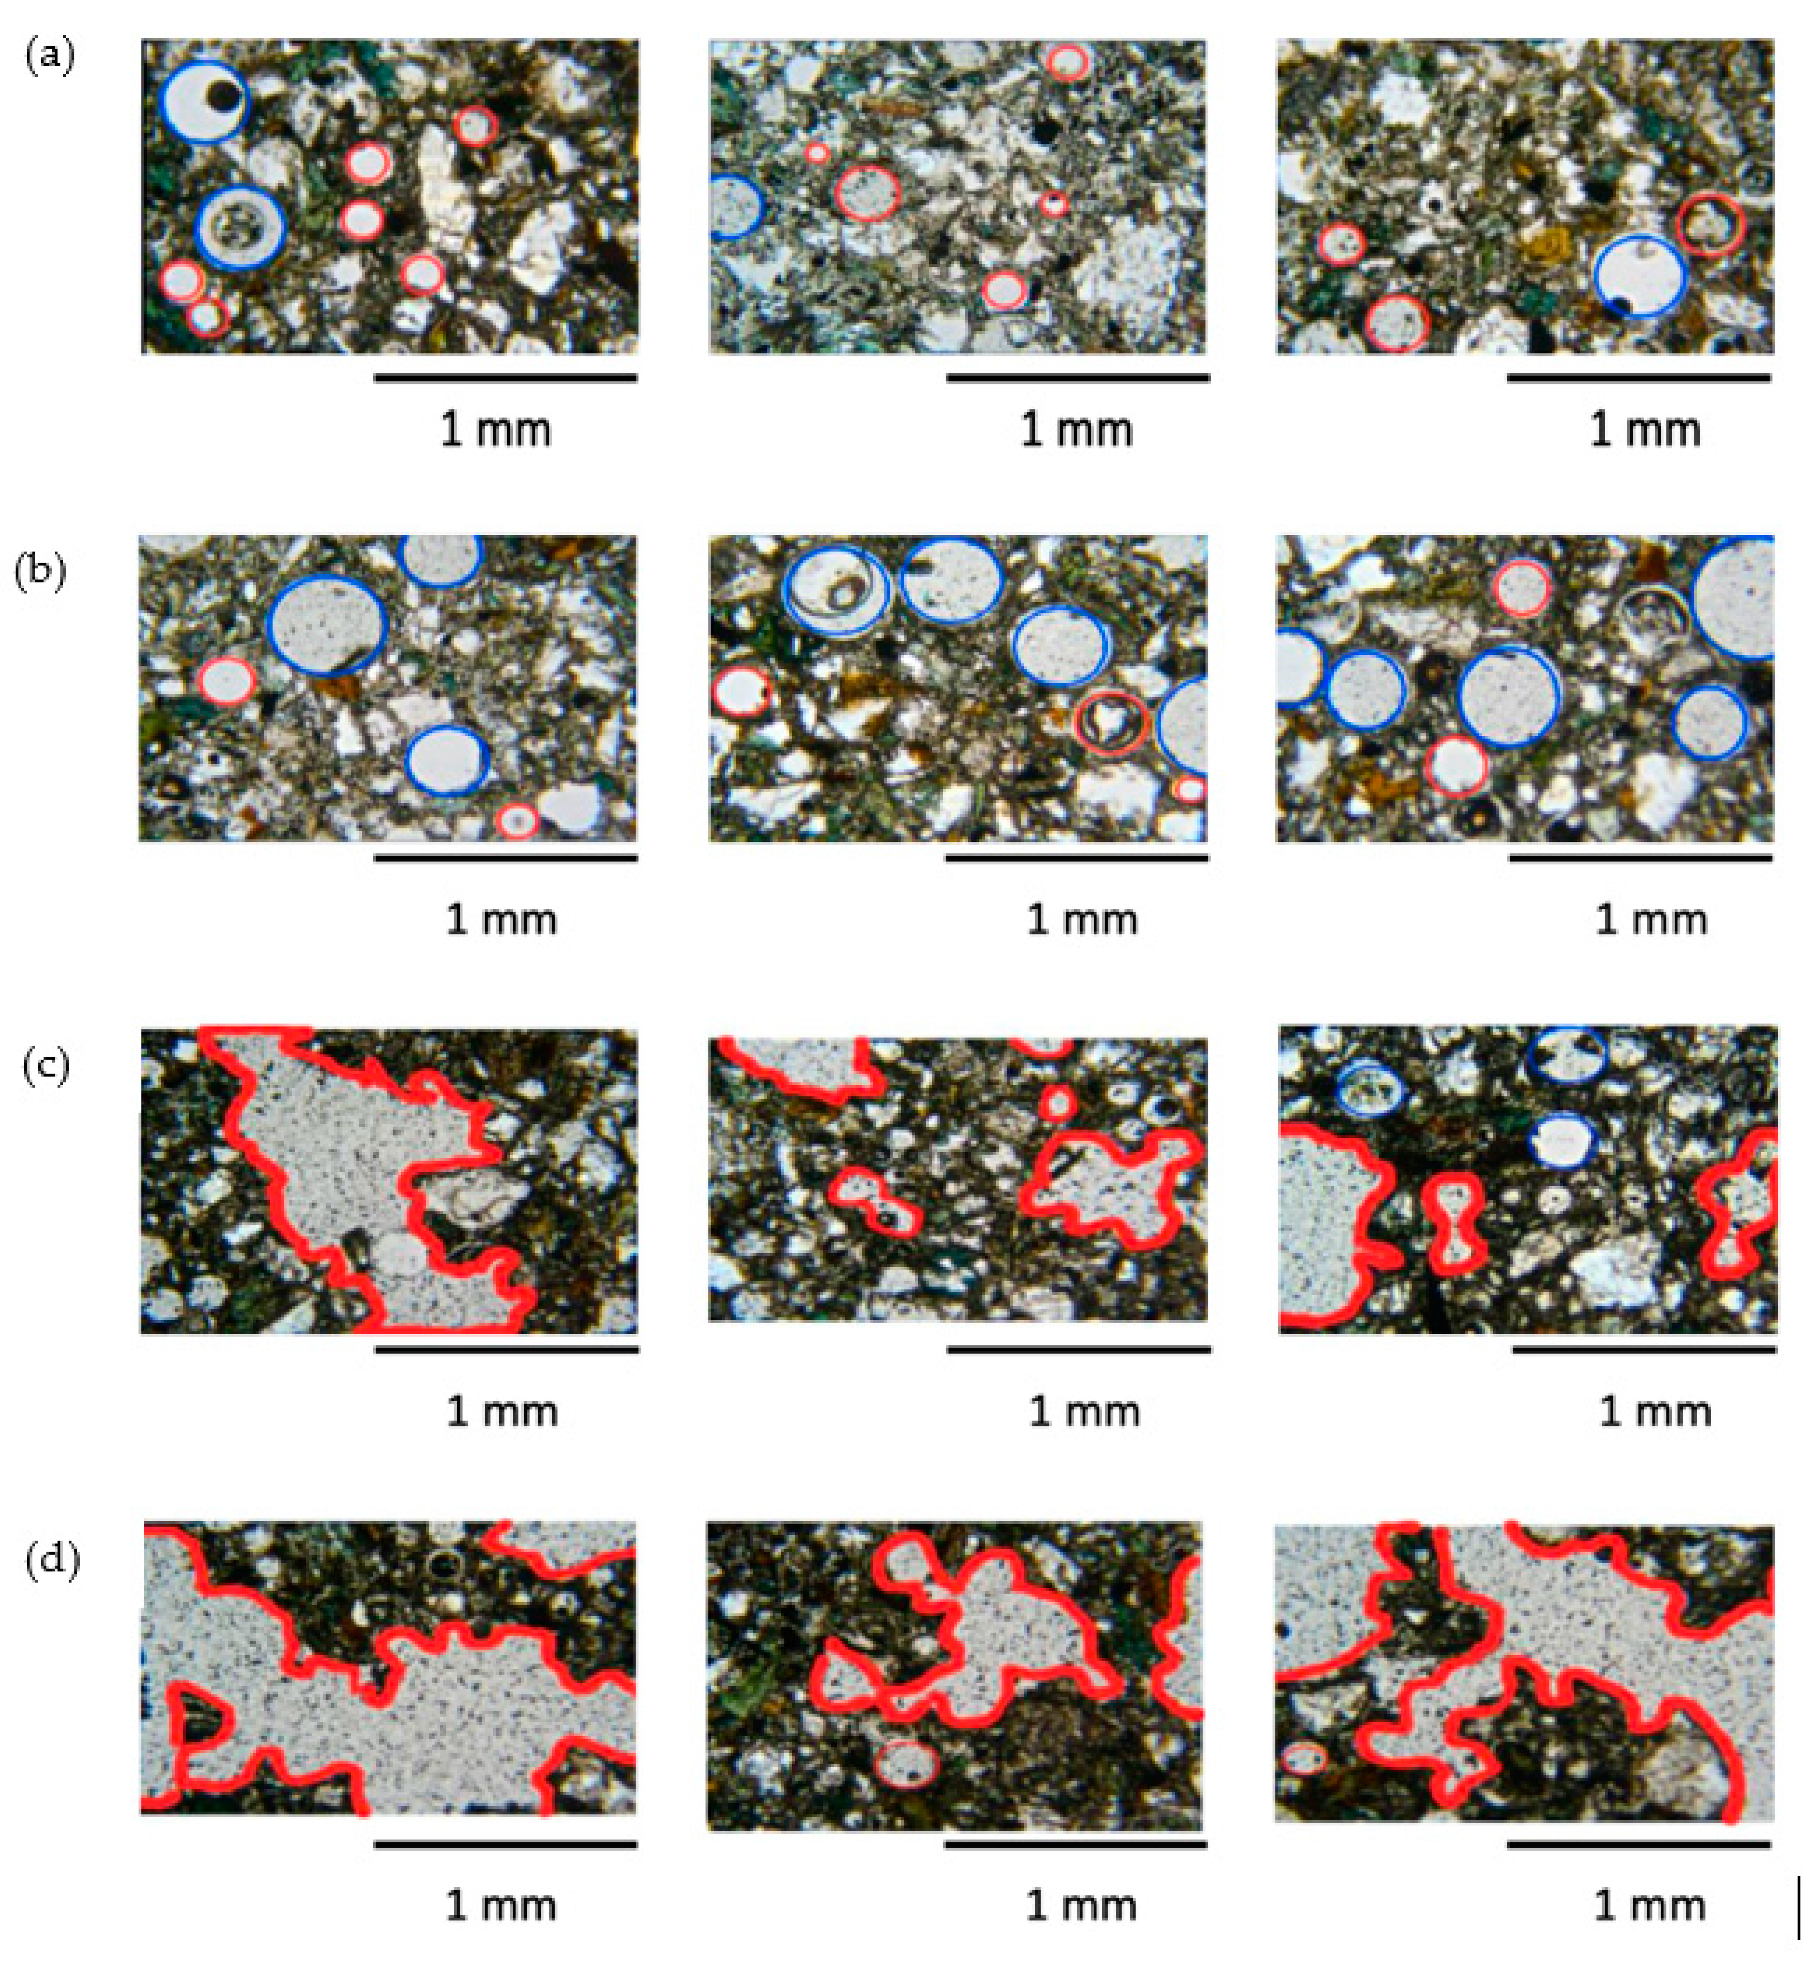
4.4. Bubble Morphology
Photomicrographs of thin sections of FMF samples made with four foam mixing times indicate that FMF underwent three transitional stages as foam mixing continued:
These images explain why the UCS and dry density were lower at longer mixing times. Therefore, foam mixing should be optimized to maintain an isotropic air bubble structure in the FMF.
5. Conclusions
The development of FMF suitable for application to underground mining applications was documented through a series of laboratory-scale tests. The conclusions drawn from this study are summarized as follows:
- The solids concentration for the backfill mixture should be optimized to avoid either foam segregation or loss of air bubbles.
- The UCS was strongly negatively influenced by the amount of entrained air. As the amount of air increased from 0 to 10%, the UCS fell by approximately 50%. However, it decreased less sharply (approximately 20%) when increasing the amount of entrained air from 10 to 20%.
- The foaming agent appeared to have a plasticizing effect, which can help enhance the flowability of the filling material. Further investigations are encouraged to investigate the rheological properties of FMF.
- The amount of entrained air strongly influenced the porosity of the filling material. As the amount of air increased, the porosity increased due to the induced air bubbles. The increase in porosity led to a considerable decrease in the dry density. Relatively light FMF can be used to promote a safer working environment, for example, beneath the backfilled stope.
- Foam mixing time must be optimized for the volume of the FMF batch being prepared. Prolonged foam mixing had a significant adverse effect, causing the air bubbles structure to collapse.
- This study indicates that there is a strong potential for FMF to replace HF at the collaborating mine site at a higher solids concentration (78%) than is currently used in the mine (70%). This means more tailings will be used in backfill and less will be stored in storage facilities. Moreover, air bubbles may be used to aid transportation of the backfill and avoid the water drainage requirements of HF. More investigation is recommended in this field.
- One of the advantages of FMF is that it can be used in mines where the mill output of tailings is low and does not meet the backfill production requirement. The volume can be increased by this mechanism of air entrainment.
- Finally, field trials are required to investigate the feasibility of implementing FMF in practice. Further field studies are encouraged, including: (1) Evaluating methods for FMF preparation and placement; (2) quantifying potential air bubble losses during transportation from the preparation plant to the delivery point; (3) optimizing pipeline layout to protect air bubbles, and (4) investigating the potential use of foam as a lubricant layer to reduce pipe wear.
6. Patents
This work has resulted in a patent granted in Australia [14].
Author Contributions
M.H. designed the experiment, performed the tests, and wrote the paper; F.H. contributed to the experimental design and data analysis. All authors have read and agreed to the published version of the manuscript.
Funding
This research was partly funded by the Saudi Cultural Bureau in Canada.
Acknowledgments
The authors would like to acknowledge the technical support from members of the Geomechanics Laboratory at McGill University and from Michelle Nokken from Concordia University. Moreover, the authors would like to acknowledge Vatne concrete systems for providing the Stable Air® system to accomplish the objectives of this study.
Conflicts of Interest
The authors declare no conflict of interest.
References
- Koohestani, B.; Koubaa, A.; Belem, T.; Bussière, B.; Bouzahzah, H. Experimental investigation of mechanical and microstructural properties of cemented paste backfill containing maple-wood filler. Constr. Build. Mater. 2016, 121, 222–228. [Google Scholar] [CrossRef]
- Belem, T.; Benzaazoua, M. An overview on the use of paste backfill technology as a ground support method in cut-and-fill mines. In Proceedings of the 5th Int. Symp. on Ground support in Mining and Underground Construction, Villaescusa & Potvin (eds.), Perth, Australia, 28–30 September 2004. [Google Scholar]
- Peyronnard, O.; Benzaazoua, M. Alternative by-product based binders for cemented mine backfill: Recipes optimisation using Taguchi method. Miner. Eng. 2012, 29, 28–38. [Google Scholar] [CrossRef]
- Benzaazoua, M.; Fall, M.; Belem, T. A contribution to understanding the hardening process of cemented pastefill. Miner. Eng. 2004, 17, 141–152. [Google Scholar] [CrossRef]
- Sivakugan, N.; Rankine, R.M.; Rankine, K.J.; Rankine, K.S. Geotechnical considerations in mine backfilling in Australia. J. Clean. Prod. 2006, 14, 1168–1175. [Google Scholar] [CrossRef]
- Niroshan, N.; Sivakugan, N.; Veenstra, R.L. Laboratory Study on Strength Development in Cemented Paste Backfills. J. Mater. Civ. Eng. 2017, 29, 04017027. [Google Scholar] [CrossRef]
- Ercikdi, B.; Cihangir, F.; Kesimal, A.; Deveci, H.; Alp, I. Utilization of industrial waste products as pozzolanic material in cemented paste backfill of high sulphide mill tailings. J. Hazard. Mater. 2009, 168, 848–856. [Google Scholar] [CrossRef]
- Hassani, F.; Archibald, J. Mine Backfill; Canadian Institute of Mining, Metallurgy and Petroleum: Montreal, QC, Canada, 1998. [Google Scholar]
- Grice, T. Underground Mining with Backfill. In Proceedings of the 2nd Annual Summit—Mine Tailings Disposal Systems, Brisbane, Austrila, 24–25 November 1998; pp. 1–14. [Google Scholar]
- Potvin, Y.; Thomas, E.; Fourie, A. Handbook on Mine Fill; Australian Centre for Geomechanics: Nedlands, Australia, 2005. [Google Scholar]
- Yang, L.; Yilmaz, E.; Li, J.; Liu, H.; Jiang, H. Effect of superplasticizer type and dosage on fluidity and strength behavior of cemented tailings backfill with different solid contents. Constr. Build. Mater. 2018, 187, 290–298. [Google Scholar] [CrossRef]
- Hefni, M.; Hassani, F.P.; Kermani, M.F. A review of the properties of foam mine fill. In Proceedings of the 13th ISRM International Congress of Rock Mechanics, Montreal, QC, Canada, 10–13 May 2015. [Google Scholar]
- Hefni, M.; Hassani, F.; Nokken, M.; Kermani, M.; Vatne, D. Investigation into the development of foam mine fill. In Proceedings of the Eleventh International Symposium on Mining with Backfill, Perth, Australia, 20–22 May 2014; pp. 49–59. [Google Scholar] [CrossRef]
- Hassani, F.; Hefni, M.; Kermani, M.; Vatne, D. Methods and Systems for Foam Mine Fill—Google Patents. AU2015252777A1, 9 September 2019. [Google Scholar]
- Hefni, M.A. An Investigation into the Development and Potential of Foam Minefill; McGill University: Montreal, QC, Canada, 2015. [Google Scholar]
- Du, L.; Folliard, K.J. Mechanisms of air entrainment in concrete. Cem. Concr. Res. 2005, 35, 1463–1471. [Google Scholar] [CrossRef]
- Panesar, D.K. Cellular concrete properties and the effect of synthetic and protein foaming agents. Constr. Build. Mater. 2013, 44, 575–584. [Google Scholar] [CrossRef]
- Khan, Q.S.; Sheikh, M.N.; McCarthy, T.J.; Robati, M.; Allen, M. Experimental investigation on foam concrete without and with recycled glass powder: A sustainable solution for future construction. Constr. Build. Mater. 2019, 201, 369–379. [Google Scholar] [CrossRef]
- Amran, Y.H.M.; Farzadnia, N.; Ali, A.A.A. Properties and applications of foamed concrete; A review. Constr. Build. Mater. 2015, 101, 990–1005. [Google Scholar] [CrossRef]
- Aligizaki, K.K. Pore Structure of Cement-Based Materials; CRC Press: Boca Raton, FL, USA, 2005. [Google Scholar] [CrossRef]
- Tarasov, A.S.; Kearsley, E.P.; Kolomatskiy, A.S.; Mostert, H.F. Heat evolution due to cement hydration in foamed concrete. Mag. Concr. Res. 2010, 62, 895–906. [Google Scholar] [CrossRef] [Green Version]
- Bing, C.; Zhen, W.; Ning, L. Experimental Research on Properties of High-Strength Foamed Concrete. J. Mater. Civ. Eng. 2012, 24, 113–118. [Google Scholar] [CrossRef]
- Ramamurthy, K.; Nambiar, E.K.; Ranjani, G.I.S. A classification of studies on properties of foam concrete. Cem. Concr. Compos. 2009, 31, 388–396. [Google Scholar] [CrossRef]
- Jiang, H.; Qi, Z.; Yilmaz, E.; Han, J.; Qiu, J.; Dong, C. Effectiveness of alkali-activated slag as alternative binder on workability and early age compressive strength of cemented paste backfills. Constr. Build. Mater. 2019, 218, 689–700. [Google Scholar] [CrossRef]
- Fall, M.; Célestin, J.C.; Pokharel, M.; Touré, M. A contribution to understanding the effects of curing temperature on the mechanical properties of mine cemented tailings backfill. Eng. Geol. 2010, 114, 397–413. [Google Scholar] [CrossRef]
- Mahlaba, J.S.; Kearsley, E.P.; Kruger, R.A.; Pretorius, P.C. Evaluation of workability and strength development of fly ash pastes prepared with industrial brines rich in SO4= and Cl- to expand brine utilisation. Miner. Eng. 2011, 24, 1077–1081. [Google Scholar] [CrossRef]
- Wu, A.; Wang, Y.; Wang, H.; Yin, S.; Miao, X. Coupled effects of cement type and water quality on the properties of cemented paste backfill. Int. J. Miner. Process. 2015, 143, 65–71. [Google Scholar] [CrossRef]
- Castano, G.; Joseph, M. Municipal Drinking Water Produced by Atwater and Charles-J. des Baillets Drinking Water Treatment Plants. Montreal. 2016. Available online: https://ville.montreal.qc.ca/pls/portal/docs/PAGE/EAU_FR/MEDIA/DOCUMENTS/ANNUAL_REPORT_2016_MONTREAL.PDF (accessed on 17 June 2020).
- Mindess, S. Developments in the Formulation and Reinforcement of Roncrete; Elsevier Ltd.: Amsterdam, The Netherlands, 2019. [Google Scholar]
- Beningfield, N.; Gaimster, R.; Griffin, P. Investigation into the air void characteristics of foamed concrete. In Proceedings of the International Conference on the Use of Foamed Concrete in Construction, Scotland, UK, 5 July 2005. [Google Scholar]
- Ma, H. Mercury intrusion porosimetry in concrete technology: Tips in measurement, pore structure parameter acquisition and application. J. Porous Mater. 2014, 21, 207–215. [Google Scholar] [CrossRef]
- Washburn, E.W. The dynamics of capillary flow. Phys. Rev. 1921, 17, 273. [Google Scholar] [CrossRef]
- Flatt, R.J. Dispersion forces in cement suspensions. Cem. Concr. Res. 2004, 34, 399–408. [Google Scholar] [CrossRef]
- Lewis, J.A.; Matsuyama, H.; Kirby, G.; Morissette, S.; Young, J.F. Polyelectrolyte effects on the rheological properties of concentrated cement suspensions. J. Am. Ceram. Soc. 2004, 83, 1905–1913. [Google Scholar] [CrossRef]
- Palacios, M.; Puertas, F.; Bowen, P.; Houst, Y.F. Effect of PCs superplasticizers on the rheological properties and hydration process of slag-blended cement pastes. J. Mater. Sci. 2009, 44, 2714–2723. [Google Scholar] [CrossRef]
- Sakai, E.; Kawakami, A.; Daimon, M. Dispersion mechanisms of comb-type superplasticizers containing grafted polyethylene oxide chains. Macromol. Symp. 2001, 175, 367–376. [Google Scholar] [CrossRef]
- Zhang, T.; Shang, S.; Yin, F.; Aishah, A.; Salmiah, A.; Ooi, T.L. Adsorptive behavior of surfactants on surface of Portland cement. Cem. Concr. Res. 2001, 31, 1009–1015. [Google Scholar] [CrossRef]
Figure 1.
Particle size distribution of the experimental tailings [15].
Figure 1.
Particle size distribution of the experimental tailings [15].

Figure 2.
Scanning electron micrograph of the experimental mine tailings at 456× magnification [15].
Figure 2.
Scanning electron micrograph of the experimental mine tailings at 456× magnification [15].

Figure 3.
Stable Air® model M100 foam generator.

Figure 4.
FMF sample preparation: (a) Mixer, (b) mixing stages, and (c) plastic molds.

Figure 5.
FMF samples inside the curing room.

Figure 6.
Trimmed samples of FMF.

Figure 7.
Experimental setup for unconfined compressive strength test showing linear variable displacement transducer (LVDT) for axial deformation measurement.
Figure 7.
Experimental setup for unconfined compressive strength test showing linear variable displacement transducer (LVDT) for axial deformation measurement.

Figure 8.
Mercury intrusion porosimetry test: (a) A sample loaded into the penetrometer, and (b) test setup with Micromeritics 9320 Poresizer.
Figure 8.
Mercury intrusion porosimetry test: (a) A sample loaded into the penetrometer, and (b) test setup with Micromeritics 9320 Poresizer.

Figure 9.
Thin sections of selected samples.

Figure 10.
Experimental setup for microscopic investigation.

Figure 11.
Unconfined compressive strength for cylindrical FMF samples prepared with 10 and 20% air entrainment compared to reference samples with 0% air entrainment.
Figure 11.
Unconfined compressive strength for cylindrical FMF samples prepared with 10 and 20% air entrainment compared to reference samples with 0% air entrainment.

Figure 12.
Unconfined compressive strength versus amount of entrained air for FMF samples prepared at three binder dosages and cured for 28 days.
Figure 12.
Unconfined compressive strength versus amount of entrained air for FMF samples prepared at three binder dosages and cured for 28 days.

Figure 13.
Effect of mixing time on the unconfined compressive strength (UCS) of FMF samples prepared using 9% binder and 20% entrained air.
Figure 13.
Effect of mixing time on the unconfined compressive strength (UCS) of FMF samples prepared using 9% binder and 20% entrained air.

Figure 14.
(a) Volume of mercury intruded and (b) cumulative porosity of FMF samples containing 9% binder and 20 or 0% entrained air.
Figure 14.
(a) Volume of mercury intruded and (b) cumulative porosity of FMF samples containing 9% binder and 20 or 0% entrained air.

Figure 15.
Dry densities of FMF samples made with three binder dosages and three entrained air dosages after 28 days of curing.
Figure 15.
Dry densities of FMF samples made with three binder dosages and three entrained air dosages after 28 days of curing.

Figure 16.
Effect of mixing time on the dry density of FMF samples prepared using 9% binder and 20% entrained air.
Figure 16.
Effect of mixing time on the dry density of FMF samples prepared using 9% binder and 20% entrained air.

Figure 17.
Photomicrographs of thin sections of FMF samples made with foam mixing times of: (a) 2, (b) 8, (c) 25, and (d) 45 min.
Figure 17.
Photomicrographs of thin sections of FMF samples made with foam mixing times of: (a) 2, (b) 8, (c) 25, and (d) 45 min.


Table 1.
Experimental tailings mineralogy (% by weight).
| Quartz | Anorthite | Albite | Actinolite | Biotite | Muscovite | Calcite | Chlorite | Pyrrhotite |
|---|---|---|---|---|---|---|---|---|
| 21.53 | 21.08 | 18.69 | 10.27 | 8.38 | 6.07 | 5.78 | 4.27 | 2.32 |
Table 2.
Physical properties of experimental tailings.
| Color | Specific Gravity | D10 (µm) | D30 (µm) | D50 (µm) | D60 (µm) | D90 (µm) | Cu 1 | Cc 2 |
|---|---|---|---|---|---|---|---|---|
| Grey | 2.90 | 60.76 | 97.46 | 149.63 | 187.73 | 346.29 | 3.09 | 0.83 |
1 Cu = D60/D10; 2 Cc = (D30)2/(D10 × D60).
Table 3.
Chemical composition of general use cement (wt.%).
| SiO2 | Al2O3 | Fe2O3 | CaO | MgO | K2O | Na2O | SO3 |
|---|---|---|---|---|---|---|---|
| 19.39 | 4.61 | 2.01 | 61.13 | 3.30 | 0.71 | 2.03 | 2.27 |
Table 4.
Chemical composition of the tap water used to prepare backfill (mg/L) [28].
Table 4.
Chemical composition of the tap water used to prepare backfill (mg/L) [28].
| Chlorides Cl | Sulfates SO42− | Nitrites + Nitrates NO2− + NO3− | Sodium Na+ | Calcium Ca2+ | Potassium K+ | Magnesium Mg2+ |
|---|---|---|---|---|---|---|
| 26.88 | 24.15 | 0.26 | 14.57 | 30.97 | 1.50 | 7.88 |
Table 5.
Properties of Stable Air® foaming agent.
| Solubility in Water | Specific Gravity | Odor | Form | Color | pH |
|---|---|---|---|---|---|
| 100% | 1.1 | Organic | Liquid | Brown | 8 |
Table 6.
Foam mine fill (FMF) mixtures tested.
| Mixture ID | Solids Concentration (%) | Binder Dosage (%) | Volume of Entrained Air (%) | Foam Mixing Time (Min) |
|---|---|---|---|---|
| 5B0A | 78 | 5 | 0 | - |
| 5B10A-2M | 78 | 5 | 10 | 2 |
| 5B20A-2M | 78 | 5 | 20 | 2 |
| 7B0A | 78 | 7 | 0 | - |
| 7B10A-2M | 78 | 7 | 10 | 2 |
| 7B20A-2M | 78 | 7 | 20 | 2 |
| 9B0A | 78 | 9 | 0 | - |
| 9B10A-2M | 78 | 9 | 10 | 2 |
| 9B20A-2M | 78 | 9 | 20 | 2 |
Table 7.
Number of FMF samples prepared for each test.
| Mixture ID | UCS (7 Days) | UCS (14 Days) | UCS (28 Days) | Dry Density (28 Days) | MIP (28 Days) | Microscopic Analysis (28 Days) |
|---|---|---|---|---|---|---|
| 5B0A | 3 | 3 | 3 | 3 | - | - |
| 5B10A-2M | 3 | 3 | 3 | 3 | - | - |
| 5B20A-2M | 3 | 3 | 3 | 3 | - | - |
| 7B0A | 3 | 3 | 3 | 3 | - | - |
| 7B10A-2M | 3 | 3 | 3 | 3 | - | - |
| 7B20A-2M | 3 | 3 | 3 | 3 | - | - |
| 9B0A | 3 | 3 | 3 | 3 | 1 | - |
| 9B10A-2M | 3 | 3 | 3 | 3 | - | - |
| 9B20A-2M | 3 | 3 | 3 | 3 | 1 | 1 |
| 9B20A-5M | 3 | 3 | - | - | ||
| 9B20A-8M | - | - | 3 | 3 | - | 1 |
| 9B20A-15M | - | - | 3 | 3 | - | - |
| 9B20A-25M | - | - | 3 | 3 | - | 1 |
| 9B20A-45M | - | - | 3 | 3 | - | 1 |
| Total | 27 | 27 | 42 | 42 | 2 | 4 |
© 2020 by the authors. Licensee MDPI, Basel, Switzerland. This article is an open access article distributed under the terms and conditions of the Creative Commons Attribution (CC BY) license (http://creativecommons.org/licenses/by/4.0/).
Share and Cite
MDPI and ACS Style
Hefni, M.; Hassani, F. Experimental Development of a Novel Mine Backfill Material: Foam Mine Fill. Minerals 2020, 10, 564. https://0-doi-org.brum.beds.ac.uk/10.3390/min10060564
AMA Style
Hefni M, Hassani F. Experimental Development of a Novel Mine Backfill Material: Foam Mine Fill. Minerals. 2020; 10(6):564. https://0-doi-org.brum.beds.ac.uk/10.3390/min10060564
Chicago/Turabian StyleHefni, Mohammed, and Ferri Hassani. 2020. "Experimental Development of a Novel Mine Backfill Material: Foam Mine Fill" Minerals 10, no. 6: 564. https://0-doi-org.brum.beds.ac.uk/10.3390/min10060564
Note that from the first issue of 2016, this journal uses article numbers instead of page numbers. See further details here.