Self-Sensing Alkali-Activated Materials: A Review


Department of Civil and Environmental Engineering, University of Strathclyde, Glasgow G1 1XJ, UK
*
Author to whom correspondence should be addressed.
Minerals 2020, 10(10), 885; https://0-doi-org.brum.beds.ac.uk/10.3390/min10100885
Submission received: 9 July 2020
/
Revised: 2 October 2020
/
Accepted: 2 October 2020
/
Published: 6 October 2020
(This article belongs to the Special Issue Alkali Activated Materials: Advances, Innovations, Future Trends)
Abstract
:Alkali-activated materials are an emerging technology that can serve as an alternative solution to ordinary Portland cement. Due to their alkaline nature, these materials are inherently more electrically conductive than ordinary Portland cement, and have therefore seen numerous applications as sensors and self-sensing materials. This review outlines the current state-of-the-art in strain, temperature and moisture sensors that have been developed using alkali activated materials. Sensor fabrication methods, electrical conductivity mechanisms, and comparisons with self-sensing ordinary Portland cements are all outlined to highlight best practice and propose future directions for research.
1. Introduction
Monitoring and surveillance of civil infrastructure is required to ensure structural health and resilience in the face of degradation. While sensors can provide adequate localized measurements, self-sensing “smart” materials have gained popularity over the years. In a civil engineering context, self-sensing materials are components that can simultaneously detect measurands without the need of additional sensing instruments. Such materials include self-sensing cementitious materials [1,2], bricks [3,4], aggregates [5,6] and pavements [7,8]. In terms of self-sensing cementitious materials, extensive research has been carried out in both ordinary Portland cement (OPC) and alkali activated materials (AAM).
AAM are multifunctional materials that have gained extensive interest over that past decades, predominantly as an emerging, low-carbon alternative to OPC in concrete production [9]. AAM display similar mechanical properties to OPC and have been reported to attain high early age strength under both heat curing [10] and ambient curing [11] regimes. They also present higher thermal [12] and chemical resistances [13] when compared to conventional OPC systems. AAM applications have been demonstrated in waste immobilization [14], repairs [15], coatings [16] and in additive manufacturing [17], and they have also been shown to demonstrate self-healing [18] and self-compacting [19] properties.
In the realm of smart materials, AAM were initially used as bonding agents [20] and as encapsulants [21] for conventional sensors. However, as the understanding and the technology of AAM progresses, the need for these additional sensing devices has diminished: interrogation of changes in the electrolytic conductivity of AAM allow them to be directly used as a sensing tool in their own right [22]. As a result, AAM have increased the number of supporting roles in structural health monitoring and maintenance, being used as both structural self-sensing elements (e.g., AAM concrete cubes and beams) [23,24,25], and as self-sensing coatings for OPC concrete substrates [26,27].
There are already numerous reviews on self-sensing cementitious materials in general [1,2,28], and on multifunctional AAM [29], but there are currently no reviews that detail the self-sensing aspects of AAM. This review covers the sensing applications reported for AAM, specifically strain, temperature and moisture sensing. Materials denoted as “alkali activated materials”, ”geopolymers” and any other derivatives originating from these terms will be considered for this review, without focusing on debates over their terminology. Our hope is that this review will shed light on areas where further work on self-sensing AAM is required.
2. Alkali Activated Material Sensors
2.1. Fabrication
2.1.1. Material Binder
AAM are most commonly formulated with a two-part mix consisting of:
- i.
- a solid aluminosilicate precursor, typically metakaolin (calcined clay), fly ash or ground granulated blast furnace slag (GGBFS) [30] and;
- ii.
- an alkaline solution, which is usually a mixture of an alkali hydroxide (MOH) and a silicate solution (M2O∙rSiO2) typically sodium (Na+) or potassium based (K+) [31].
Mixing these two constituents together initiates the chemical process called alkaline activation in which the material undergoes the phases of dissolution, rearrangement, condensation and solidification [32].
AAM can also be formulated with a one-part mix, in which a dry powder is mixed with water. The dry powder is a mixture of a solid aluminosilicate precursor and a solid activator. This approach resembles the procedure followed for OPC mixes and is expected to be a prominent approach to AAM mixing in future applications [33,34].
The properties of a cured AAM hinge on the molecular composition of the binder. Molar ratios of Si/Al = 2; Al/Na = 1; H2O/Na2O = 11–15 have all shown to consistently result in better mechanical properties for low calcium binders [35,36,37]. In regards to high-calcium binders and specifically GGBFS AAM, high mechanical properties have been reported for binders with molar ratios of Si/Al = 2.03–2.26 [38] and when alkaline activators with a modulus of SiO2/Na2O = 1.4–1.6 with Na2O concentration of 6–8% by slag mass are used [39,40,41]. However, additional factors such as binder composition e.g., Mg, TiO2 and Al2O3 content [42,43,44,45,46] and the type of alkali activation e.g., silicate, hydroxide, sulphate and carbonate activation [47,48] are also important factors that influence the performance of GGBFS AAM. Moreover, the mass ratio of alkaline solution and the aluminosilicate precursor (denoted as the “liquid:binder” or “liquid:solid” ratio), may not provide a complete chemical overview of the binder, but are often quoted as they are easier to measure. Note that liquid-to-binder ratios do not account for masses of sand or coarse aggregates.
2.1.2. Fillers and Additives
As with OPC systems, AAMs can be mixed with sand and aggregates to produce:
- (a)
- Pastes/binders: precursor + alkaline solution
- (b)
- Mortars: precursor + alkaline solution + fine aggregate (typically sand)
- (c)
- Concretes: precursor + alkaline solution + fine aggregate + coarse aggregate
Although it is not required to produce a self-sensing material, electrically conductive additives can also be added to an AAM binder to improve electrical conductivity. Fillers must be properly dispersed to achieve a homogenous mix and avoid agglomeration [49]. For two-part mixes the main ways of achieving this are:
- A.
- B.
Cases have also been reported in which the filler is sonicated but added to the mix at a later stage, particularly after the alkaline solution and the precursor have been mixed together [58,59]. However, the recommended process is to disperse the fillers in the alkaline solution (prior to mixing with the solid precursor), as this has been reported to lead to greater dispersion and uniform density in the matrix and therefore leading to increased electrical performance [50,58,60]. Fillers can also be chemically manipulated to enhance their dispersion, for example, carbon nanotubes coated with SiO2 demonstrated enhanced dispersion, owing to a chemical reaction between the coated filler and the alkaline solution [23].
To our knowledge, there have not yet been any reported one-part self-sensing filler AAM demonstrations. This may change in the near future, so the mixing procedure is provided here for completeness. The solid material (precursor and activator) are first dry mixed together. Following this, water is added and mixed until a homogenous mix is achieved. Contrary to the two-part mixes, filler is incorporated at the end and is gradually added in small amounts to ensure proper dispersion and uniform distribution [61,62,63,64]. It is reasonable to assume that the conductive filler could potentially be sonicated in the water and then added to the mix. However, as there are as yet no reported applications, so the most effective method is yet to be determined.
2.1.3. Sensor Fabrication
Regardless of whether a conductive filler is used, electrodes can be prearranged within the binder, either in a mould or on the surface of a substrate. The AAM can then be cured. During curing, temperature and humidity may need to be adjusted to control reaction rates and water transport within the system. Alternatively, electrodes can be attached to cured specimens using conductive paint. Examples of AAM components and coatings are shown in Figure 1.
AAM sensing essentially relies on measuring changes in electrical conductivity in response to environmental variables. To interrogate conductivity, an electrical current (or voltage) is applied across the specimen, and the voltage (or current) response is measured. This allows the electrical conductivity, σ, to be calculated via Equation (1):
where V is the voltage, I is the current, L is the distance between the electrodes, and A is the shared cross-sectional area of sample between the electrodes. The term resistivity, ρ, is also used to measure the electrical properties of AAM which is essentially the inverse value of conductivity.
2.2. Electrical (Ionic) Conductivity: Mechanisms
2.2.1. Overview of Mechanisms
Ionic conduction of AAM and OPC materials is associated with the mobility of free ions in the pore solution, primarily Ca2+, K+, Na+, Si4+, Fe2+, Al3+ and OH− [66]. In OPC, ionic conductivity is attributed to the mobility of the Ca2+ and OH− ions in the pore solution. This form of ionic conduction is highly dependent on the amount of free water in the matrix, and usually results in an electrical conductivity that is too low to be of use for deploying a sensing solution. OPC substrates are effectively electrical insulators unless they are wet [67].
Ionic conductivity is stronger in AAM. Ionic conductivity originates from the structure of AAM, as the alkali cations (Na+ or K+) in the matrix charge balance the aluminium (III) in the tetrahedral AlO4− group [31,32]. Cations are either bonded to the matrix via Al-O or Si-O bonds or are present in the framework cavities to maintain electrical charge balance. Ions that are not bound to the structure are “free ions” that are able to move through the pore network to enhance electrical conductivity [68].
2.2.2. Equivalent Circuits
The current best understanding of AAM electrical conductivity states that it is mainly a function of three components, the resistance of the electrolyte, ion transport of the connected and unconnected pores, and the effect of the electrodes on the matrix. In fact, these three components can be modelled as a circuit, made up of serial and parallel combinations of standard electronic components (e.g., resistors, inductors, capacitors). There are several of these so-called “equivalent circuits” that can be used to model the electrical response of AAM. Figure 2 displays one such equivalent circuit that contains components to model:
- i.
- The resistance of the electrolyte, Re: refers to the liquid electrolyte in the AAM pores and is dependent on the number of ions (which is based on the concentration of the volume of the AAM) and ion mobility (which is a function of ion concentration, alkali metal and temperature).
- ii.
- The connected pore resistance, Rc, and unconnected pore resistance, Ruc: are the resistance of the ion conducting pathways between the connected (percolating) and unconnected pores in the AAM matrix.
- iii.
- An interface resistance, Ri: refers to the specimen- electrode interface in which a single layer of Na+ ions in the AAM will adhere to the negatively charged surface of the metal electrode. This layer acts as a dielectric, separating the electrons in the metal electrode from the Na+ in the AAM [69,70].
- iv.
- Qi and Qp are double-layer capacitances: this is an imperfect capacitor, or “constant phase element” used to describe the net result of ion dynamics in electrochemical systems.
- v.
- L refers to inductance effects: that are observed at high frequencies due to factors such as electrode cross-talk, particularly when measured currents are small and due to relaxation of adsorbates on the electrodes.
2.2.3. The Impact of Conductive Fillers
In the case of cementitious materials with conductive fillers, the sensing mechanism may include additional electronic conduction: in fact, it may be the dominant conduction mechanism. The type of electronic conduction depends on whether there are a large number of locations where adjacent filler particles (or fibres) are in direct physical contact.
If there is a continuous, long-range conductive network of filler/fibres inside the material (i.e., the system is above the percolation threshold), then electronic conduction is the result of the straightforward movement of electrons. If the filler/fibres are not in direct contact but are close enough, then conductivity is still possible, as electrons can hop (via tunneling) between fibres. Changes to the distance between fibres affect the dominant conduction mechanism, and overall conductivity [71,72,73,74,75,76].
In AAM, it is common (though sometimes unnecessary) to add conductive fillers to further improve conductivity [56,77,78]. The volume of filler added is usually high, so that the percolation threshold can be overcome, and so the conductive filler can form a continuous electrical path in the material [79,80]. It has been reported that conduction is a combination of both ionic and electronic conduction, as ions are still mobile while the filler allows the shortening of the conduction path in the matrix [56], but there have not yet been many in-depth studies on this topic within AAM.
2.3. Electrical Impedance
Applying direct current (DC) and alternate current (AC) have been both been used to interrogate AAM conductivity. If DC is used, the electrical resistance, R, of the sample is calculated via Equation (2):
DC has a significant drawback however: AAM are electrolytic cells. Similar to saltwater solutions, applying DC will result in electrolysis. Ions within the AAM cannot travel within the electrodes (which conduct via electrons), and so the conducting cations within the AAM migrate towards and react with the cathode. This results in a so-called “polarization resistance”, that gradually increases in magnitude over time. The effect is likely less pronounced when conductive fillers are used to set up an electronic conduction path, but issues with electrolysis may still arise in the long-term if even a small part of the conduction is ionic [81,82,83].
To prevent electrolysis, AC is often preferred (the direction, or polarity, of the applied current is frequently switched) [52,84]. Using AC allows one to determine the electrical impedance of a sample, Z. In this case, a sinusoidal voltage of magnitude V and frequency f, is applied to the sample and the current response, I is measured. This allows the impedance to be calculated by using Equation (3) [85]:
where ΦV – ΦI is the phase difference between the applied voltage and measured current and the impedance is a complex number of the form in Equation (4) [85]:
where Z and arg(Z) are the impedance’s magnitude and argument. In AAM, the phase difference between the current and voltage results from capacitive effects in the material.
Electrical impedance is frequency dependent, and so sweeping the frequency can lead to a rich dataset. The AC frequency can be selected to minimize or maximize the measurement of capacitive or resistive effects in the sample, depending on the application [24,26,57] and allows for the elimination of polarization if desired [26,52,86]. Overall, however, frequency tends to be selected to produce the highest sensitivity to measurands during characterization [24,55].
2.4. Electrical (Ionic) Conductivity: Reported Magnitudes
AAM possess a higher conductivity than OPC at room temperature due to the alkali metal ions in their matrix. The electrical properties of AAM do tend to vary as they are influenced by mix ratios, chemical composition, and environment. Table 1 summarizes reported conductivities for AAM composites with and without conductive fillers.
2.4.1. Without Conductive Fillers
The conductivity of AAM without conductive fillers has been reported to range from 10−4 S/m [68] to 1 S/m [60]. In general, the conductivity of AAM increases with increasing alkali metal concentration [60,95], and with higher liquid-to-binder ratios [56]. Too much liquid in an AAM can, however, lead to highly porous binders which in turn can affect conductivity. While increased porosity has been reportedly linked to higher conductivity [96,97,98], it has also been linked to reduced conductivity [91,99]. Having reviewed this literature, the authors of the present review believe that increasing porosity likely leads to higher conductivities, up until a point: the dominant conduction mechanism in AAM is, after all, accepted to be via pore solution, the volume of which would be higher with more pore space. This hypothesis is also supported by the fact that when interrogating at moderate-to-low AC frequencies, maximum conductivity tends to coincide with high liquid-to-solid ratios: at moderate-to-low AC frequencies, the conduction mechanism that dominates is related to bulk pore solution conductivity. It should be pointed out though that at low AC frequencies, the conduction mechanism of the binder is influenced by the electrodes rather than the bulk pore solution [69,100]. As a result, careful consideration is required to distinguish between the two regions to ensure proper data interpretation. This also makes it clear that the dominant conduction mechanisms that occur at different AC frequencies could be better used to probe and make sense of behaviour.
Results from Cai et al. [95] show that metakaolin AAM have a higher conductivity than fly ash AAM. It was again speculated that the difference in conductivities was due to the higher liquid-to-solid ratio used for metakaolin AAM. The same authors also reported that incorporating different types of precursors in the same mix can create a denser matrix, which subsequently leads to decreased conductivity [95]. This is all further evidence for our hypothesis. Comparisons are, however, still often challenging, because precursors of the same type, but from different sources, can also present variable behaviour due to their dissimilar chemical composition [101].
For samples with low to no conductive filler content, the resistance of the matrix continues to increase over time due to the progress of the geopolymerization process [56,101]. Under the same curing and alkaline conditions, it has been reported that the resistance of metakaolin-based AAM stabilizes over a quicker period of time due to their quicker geopolymerization and higher chemical activity when compared to low calcium fly ash AAM [95].
While not as common, high water contents in the binder during fabrication have been reported to have a negative impact on the conductivity of AAM. In a study carried out by Cui et al. [68] it was mentioned that even when increasing Na2O/Al2O3 ratios the conductivity did not increase as expected. It was explained by Cui et al. that the excess water was overriding the effect of the free ions in the matrix. By removing the water through drying, the conductivity of AAM was reported to increase with increasing sodium content. That said, it can be observed that for the same Na2O/Al2O3 ratios, drying led to decreased conductivity. Moreover, based on the molecular composition of this study, the highest Na/Al ratio is approximately 0.55–0.60. The sodium ions in this situation are not enough to charge balance the aluminium ions [102]. Therefore, increasing sodium content will have a direct impact on the overall chemistry and structure of the binder. Subsequently, this will also influence ion mobility. Bearing all this in mind, additional factors need to be taken into account before a definitive claim on the impact of water in this investigation could be made.
2.4.2. With Conductive Fillers
Conductive fillers can increase electrical conductivity of the composite by several orders of magnitude. Comparing conductivity of AAM is somewhat difficult due to the broad nature of available materials, the conductive fillers employed and the type of current (AC or DC) used.
From the data available in Table 1, it can be seen that the addition of graphene-based filler and carbon fibre has led to high conductivities between 10−1–102 S/m and 10−2–101 S/m respectively. However, it can be easily observed that the range of reported conductivities is quite vast and varies significantly. For example:
- On the contrary, Behera et al. [59] added over 10% by volume carbon microfibre to metakaolin AAM, and found conductivity only increased from 10−3 S/m to 10−2 S/m.
While we do wish to posit a mechanism, these are seemingly contradictory results that might suggest there is some turning point in the conductivity gains produced by fibre addition. The difference could, on the other hand, stem from the fact that Deng et al. and Payakaniti et al. dispersed their carbon fibres in the alkaline solution, whereas Behera et al. dispersed the carbon microfibre in deionized water.
The literature underpinning Table 1 also shows that fibre size impacts conductivity, with longer fibres able to form conductive paths more easily than short fibres. This suggests the percolation threshold is an important consideration when adding fibres [74,103,104]. If this is the case, it means that the difference in dispersion techniques could potentially be the primary source of the differences in reported conductivities.
Graphite powders are an alternative to carbon fibres. By adding 10 wt% graphite powder to slag AAM Rovnanik et al. [52] reported conductivities of order 10−5–10−4 S/m. Conductive filler in powder form (carbon black, or graphite powder) has been speculated to result in lower conductivity gains compared to fibre fillers due to the formation of shorter conductive pathways [1]. This is indeed supported by the results presented in Table 1.
While the information in Table 1 is relevant to sensor design, binder conductivity does not alone determine how the material will perform as a sensor. Powder fillers may not generally present the highest conductivity gains, but they have proven highly beneficial for strain sensing applications [105,106]. The interrogating electronics, the spacing between electrodes, the volume of the sample, and even the requirements of the application: these are all just examples of variables that can be tuned to deliver adequate sensing performance with almost any AAM formulation.
The addition of conductive filler does, however, provide other important benefits: when added in appropriate quantities they can significantly enhance the mechanical properties of the composites [54,59,107,108,109]. One of their only major downsides is that they increase cost, and the additional costs can be significant when scaled to the volumes of material required in a civil engineering context.
2.5. Electrode Layout
The electrode layout used to apply electrical excitation and measure the response of an AAM plays an important role in the behaviour of the electrical system, and hence the sensing capabilities. AAM follow a similar principal to OPC in this regard. Table 2 summarizes the electrode configuration of reported AAM sensing applications.
As shown in Figure 1, interrogation can be achieved with two-probe or four-probe electrode layouts. While two-probe sensing provides a simpler setup, this method means that the contact resistances and lead resistances of the electrodes contribute to the resistance measurement. Four-probe sensing, on the other hand, significantly reduces the contribution of lead and contact resistances, allowing only the AAM specimen itself to be measured.
Four probe sensing can either be in a serial arrangement (i.e., a linear configuration, as shown in Figure 1a and Figure 3a) or in a rectangular arrangement with the electrodes placed at the corners of the specimen, also known as the Van der Pauw (VDP) configuration (Figure 1c,d and Figure 3b). Both these applications have merits and can be advantageous in various situations when used accordingly.
2.5.1. Serial Arrangement
Linear layouts, shown in Figure 3a, are the most commonly used electrode configuration in AAM and OPC sensing. This layout is applicable to the majority of cementitious sensing applications. The electrodes are usually equally spaced or in proportionate distances and are symmetrical in reference to the center of the substrate. The electrodes are divided as “inner” electrodes and “outer” electrodes, as depicted in Figure 3a, in which voltage or current are applied and measured respectively.
Careful consideration must be given primarily in strain sensing as the response of the substrate is dependent on the direction of the applied load. In uniaxial compression and tension the load is typically parallel to the electrodes. Under flexural tests, the load is primarily perpendicular to the electrodes. Altering the measuring configuration can ultimately impact the response of the specimen [111]. Furthermore, in a linear setup the current density is concentrated between the electrodes, this essentially provides a more localized sensing capability for the entire substrate.
2.5.2. Van der Pauw Arrangement
In the Van der Pauw configuration, shown in Figure 3b, the electrodes are placed at the corners of the specimen [112]. This approach measures the overall average resistance of the sample as the voltage and current are applied/measured over the entire span of the sample’s surface. The layout is also beneficial as it minimizes the concentrated stresses that can be developed near the electrodes during curing [113]. This occurs as shrinkage during curing creates stresses at the electrode-material interface that can cause cracking and delamination, particularly in thin samples. The use of VDP is thought to reduce and spread stress, and it is what allows electrodes to be embedded successfully in these thin samples, rather than attached onto the substrate with conductive paint.
While the VDP method is typically employed in samples with low thickness, it can also be used in larger specimens as well [65]. The distances between electrodes are essentially predefined by the geometry of the sample. The application and measurement of the electrical properties are carried out over a larger area allowing for an average measurement of substrate resistance (not local as with the linear layout) [113]. This method provides multiple options in terms of the direction of voltage application. As a result, consistency in probe connections is required for repeatability and proper interpretation of the sensor’s response.
Under strain sensing, in order to mirror the performance of the linear configuration, for uniaxial compression and tension, the voltage and current should be measured and applied parallel to the applied load. Similarly, these two measurands should be perpendicular to the applied load under flexure.
2.5.3. Embed or Surface Mount
Embedding electrodes has shown more consistent and reliable results than surface-mounting electrodes with conductive paint [114,115]. However, embedding can result in additional stresses to the AAM matrix, resulting in cracking during curing [115,116]. Embedding thin wires (rather than large electrodes) can reduce stress concentration and minimize the mechanical impact of the electrodes on the AAM during curing [27,65].
2.6. Sensor Interrogation
In general sensor interrogation of self-sensing systems is based on measuring the change of electrical properties of the sample (in this case AAM) in response to an applied external factor e.g., strain, temperature, water content.
A general sensor characterization equation for AAM has the form of Equation (5):
where M is the electrical response variable measured (e.g., conductivity, resistivity, resistance, impedance, or capacitance), M0 is the response variable with no applied strain, temperature change or moisture change, ΔM = M − M0, and f, g and h are functions that parameterize the response to changes in strain, Δε, temperature, ΔT, and moisture, Δw. The functions f, g, h, and their constants are what need to be parameterized. The methods and results of this parameterization are outlined in detail in the following sections.
3. Strain Sensing
3.1. Loading Schemes
Strain sensing is the most prominent application for AAM sensors. The electrical response of AAM components to strain is similar to OPC components. When the applied load is colinear to the serial electrode configuration of the substrate, under compression the resistance (and impedance) of the sample decreases. Likewise, under tension the resistance of the specimen increases. This behaviour has been widely reported in both AAM [24,25,26,52,57,92] and OPC [106,117,118,119,120] strain sensing. Figure 4a,b display a typical sensing response for AAM under compression and tension. The loading schemes for the strain characterization of cementitious materials typically employ monotonic or cyclic loading.
3.1.1. Monotonic Loading
Under monotonic loading, a load is applied at a constant rate to the AAM and is removed once the test has terminated. The sensing response is different for tension and compression: not just in its sign. Under tension, resistance tends to increase in a quasi-linear manner [119]. In compression, however, the response of the substrate differs and can be typically broken down into three regions depending on the loading amplitude, as illustrated in Figure 4a and Figure 5:
- (1)
- Elastic: The first region of monotonic loading coincides with the elastic region of the substrate. In this zone, the relationship between change in resistance and applied strain is considered to be linear [73,121] or of a linear-like function [122,123]. The sensor’s performance is usually at its peak within this region. In various cases, a nonlinear segment with low sensitivity at the very early stages of loading has been detected [55,86] which has also been regarded as a separate region in monotonic compression altogether [124]. This has led to applications commencing above zero [24,55,86]. While this has been attributed to contact resistance between the substrate and electrodes in two-probe sensing [86], this behaviour has also been observed in four-probe sensing applications as well [55].
- (2)
- Non-linear: In the second region of monotonic loading, the resistance of the materials continues to change, however the sensing performance is generally lower and the response at this stage is nonlinear which eventually plateaus (small-no change for load applied) [117,125]. At this stage damage to the matrix has begun in the form of cracks and defects. This leads to the destruction and reconstruction of the conductive network and ultimately reaching a state of balance [2,126].
- (3)
- Severe damage: Lastly, the third region of monotonic compression is associated with severe damage to the matrix as the cracks continue to expand and the performance is being compromised. At this juncture an abrupt increase in resistance is typically expected with increasing load [126]. The substrate in this instance essentially loses its sensing capabilities, and resistance may not even begin to return to its original baseline value once load is removed [126,127].
3.1.2. Cyclic Loading
Cyclic loading refers to the loading and unloading of a substrate multiple times under a certain magnitude. This loading scheme typically takes place within the elastic region of the material [122,128]: the load applied is normally below 30% of the ultimate failure load [123]. As such the sensor response of the AAM is linear in both tension and compression [129]. Figure 6 provides an example of the response of slag AAM under repeated loading.
When referring to cyclic loading, the terms reversible and repeatable are often used to characterize the performance of the sensor. The term reversible indicates that the resistance of the substrate can start reverting towards its initial value once the applied load has been removed: this is often the case regardless of the magnitude of load applied. By repeatable, it is meant that the sensing performance of the sample (e.g., the change in resistance in regard to the applied load) remains fairly constant after multiple loading cycles.
The resistance of the material at the beginning of the sensing test is usually referred to as the “baseline resistance” or “initial resistance”, and is denoted as R0. Since the test is taking place within the elastic region, according to Hooke’s Law the sample behaves elastically and reverts to its initial state [130]. Subsequently, the resistance is also expected to change reversibly close to its initial value [128,131]. That said, AAM like OPC is only ever quasi-linear: due to the internal changes inside the matrix upon every load cycle, repeatable strain sensing can be difficult to achieve [121,132], even in the linear region (if the material enters the plastic region, repeatable sensing is not achievable, as there is a reconstruction of the conductive network inside the matrix upon load removal [120]).
3.1.3. Other Strain Responses in AAM Samples
While most sensing applications follow the above behaviours, self-sensing cementitious materials are comprised of a diverse and broad range of available materials and system layouts, and therefore exceptions to the rules above are actually rather common.
To provide a few examples, in a monotonic compression AAM application by Bi et al. [23] it was reported that upon load the change in resistance in the sample continuously increased rather than decreased. It was posited that the formation of cracks in the matrix hindered ion migration. While this is a justifiable explanation, it was also mentioned by the authors that the binders were fabricated with the electrodes perpendicular to the applied load and on different planes. This approach differs from the conventional orientation employed in these circumstances [115] and could have ultimately influenced the sensing response of the sample [111,133].
In a similar application for AAM under monotonic compression, as can be seen in Figure 5, Rovnanik et al. [86] mentioned that upon loading the resistance of the matrix initially decreased as expected in the elastic zone, however as the load increased, the resistance began increasing until it started decreasing again up until failure. This behaviour was explained due to the initial formation of cracks and the destruction of the conductive network and the subsequent reconstruction of the conductive network due to the healing of the defects.
Finally, Vaidya and Allouche [110] reported a fluctuation in the electrical response of carbon fibre AAM cylinders under compression. It was mentioned that this behaviour could be attributed to the simultaneous densification of the AAM paste and the development of micro-cracks as both these occurrences have opposite effects on the resistance of the sample.
3.2. Gauge Factors
The performance of a strain sensing material is generally evaluated by the change in resistance compared to the applied strain. The most common approach used in these applications is the strain sensitivity coefficient, otherwise known as the gauge factor (GF) which is also used in commercial strain gauges. The GF is calculated by the fractional change in resistance divided by the applied strain, Equation (6).
where R0 = resistance at start of the test, Ri = resistance at given strain, ε = applied strain. Alternative methods of assessing strain capability similar to the gauge factor include expressing the change in resistance per unit of stress (Equation (7)) e.g., 100 Ω/MPa or by displaying the resolution of the sensor in terms of strain sensitivity e.g., 1000 με.
where σ = applied stress. The strain response may differ between loading cycles due to repeatability issues resulting from microcracks and deformations in the matrix [134] or due to polarization effects [53].
Table 3 below displays the reported strain sensing performances and GFs of AAM. AAM showcase similar strain sensitivity to OPC exhibiting GFs within similar orders of magnitude in respective applications [76,111,120,135,136,137]. In regard to AAM the highest GF reported is GF = 1986 in a metakaolin-graphene based application under compression [55]. This sensing performance is comparable with a study on OPC with nickel powder that reported GF = 1930 [106]. Table 3 also presents strain sensing values such as resistance per unit stress (Ω/MPa), electric charge per unit force (pC/N) and the fractional change in resistance (ΔR/R0). While these values provide important information in their own respect, a comparison with other applications is difficult to make with these values alone. Therefore, it is recommended that the GF is used in these instances to allow for simpler comparisons with other strain sensing applications. If other strain sensing values are used then information such as strain, modulus of elasticity of binder and conversion into common electrical units should be provided to allow for the calculation of the GF.
Note that AAM strain performance presented in Table 3 is based on ‘standard’ testing conditions i.e., at room temperature and once the substrate has reached moisture equilibrium. The influence of additional factors such as moisture and temperature on strain performance have not yet been accounted for in AAM apart from certain niche applications [22]. In comparison, the effects of moisture [138,139] and temperature [140] on OPC strain sensing have already been reported. While the literature available is fairly limited, it can be viewed that metakaolin and ground granulated blast furnace slag based AAM have the potential of showcasing high sensing capabilities compared to fly ash AAM. Lastly, as can be seen in Table 3, compared to OPC, AAM also exhibit sensing capabilities without the use of conductive filler.
3.3. Conductive Filler Applications
As mentioned in Section 2.4, conductive filler is added to cementitious materials to increase their conductivity thus making them more suitable for large area/volume sensing applications. When AAM are loaded with conductive fillers, the sensing mechanism is attributed to both ionic and electronic conduction [56]. Under strain tests, the response is dominated by conduction within the filler, and the change of the conductive network inside the matrix. In situations in which the applied load generates cracks in the sample, the resistance is expected to abruptly increase due to the destruction of the conductive network [51,52,53,58].
The types of conductive filler that have been used in AAM strain sensing include carbon fibre [25,53,110], graphene [24,55], graphite powder [52], carbon nanotubes [23,58] and carbon black [51]:
- For a graphene-based application, Saafi et al. [57] reported that the electrical response of graphene composites is attributed to the contact resistance of the overlapped graphene filler. When the contact area between the graphene sheets increased under compression, the resistance of the material would decrease. Similar behaviour was also reported by Lamuta et al. [55] in a graphene metakaolin-based application under compression.
- Similar to carbon fibres, in carbon nanotube applications the resistance of the matrix is influenced by the distances between the filler under mechanical load [23,58]. Coating carbon nanotubes with SiO2 was reported to result into a better conductive network, due to greater dispersion, allowing for the greater detection of cracks [23].
- For graphite powder and carbon black the changes in resistance have been attributed to changes in the conductive path the current follows in the matrix [51,52]. Chen et al. [141] coated metakaolin AAM with a conductive polymer PEDOT:PSS solution. The sample was subjected to natural and artificial cracking and tested under uniaxial compression. The conducting mechanism proposed by Chen et al. was coupled-mechanical-conductive contact mechanism based on the Hertizan contact model between cracks.
3.4. Filler Free Applications
As mentioned in Section 3.2, AAM have seen multiple applications without the use of conductive filler due to ionic conductivity of the alkali metals in the matrix. In simple terms, most researchers accept that strain affects the mechanisms responsible for hopping of the Na+ or K+ ions in the matrix [23,24,92,143]. The exact mechanisms are not completely understood, however. For strain-sensing applications the following more elaborate mechanisms have been provided by authors to explain the change in electrical properties of AAM:
- I.
- Lamuta et al. [22] proposed a chemical-physical model to explain the piezoelectric effect of AAM based on ionic mobility due to the presence of water. This effect is promoted by the migration of mobile hydrated cations under loading in the pores of the AAM matrix, thus creating a charge imbalance and local dipoles. The Na+ ions balance the single negative charge associated with aluminium (III) in tetrahedral coordination. In completely dry samples, the AAM did not exhibit any piezoelectric effect due to the absence of water. Hydration reduces the cation–lattice electrostatic interaction through cation–water interaction, thus resulting in a weaker bond that promotes the Na+ migration away from the framework wall during mechanical loading and therefore creates the charge imbalance.
- II.
- Saafi et al. [24,92] stated that the alkali ions diffuse in the structure by hopping through vacancy sites to balance the negative charge on the AlO4− tetrahedral. It was hypothesized that the induced load to the substrate changes the lattice structure and alters the ion diffusion paths (essentially the distances between electron holes) in the matrix. As a result, it has been speculated that this changes the activation energy barrier the ion is required to overcome to accommodate a vacant site. As the hopping distance changes this subsequently affects the ion movement inside the AAM and as a result the resistance of the substrate changes accordingly. Figure 7 presents a schematic drawing of the ion hopping mechanism that can be found in AAM and Figure 8 explains the ion diffusion paths in AAM under applied stress.
- III.
- Bi et al. [23] mentioned that the water in the matrix facilitates the migration of Na+ ions within the framework during mechanical loading which leads into ionic conduction. As ionic conduction is associated with the movement of hydrated Na+ ions, the formation of the cracks in the substrate during loading potentially hindered the migration process.
- IV.
- Moreover, in the case of slag-based AAM it was reported by Rovanik et al. [86] that apart from the alkali metals ions in the matrix, the Fe ions found in the precursor also have a positive effect on the sensing capability of the substrate. This ultimately led to a combination of ionic, contact and tunneling conduction. This was explained due to the fact that the Fe content in the slag precursor does not always contribute to the overall chemistry of the binder and is passivated in the pore solution [144]. However, that is not to say that all Fe does not contribute to alkaline activation. Slag with high Fe content has seen successful applications in the formulation of AAM [145,146,147]. As a result, this conduction mechanism remains unproven.
While AAM have been effectively used in sensing applications without conductive filler, situations exist in which filler free samples did not present similar performance. In particular, cases have been reported where AAM failed to showcase any sensing response [53] and in which AAM have been rendered unsuitable for certain types of applications due to repeatability and reversibility issues [51]. As a result, conductive filler was required in both cases to allow for more reliable sensing performances. Furthermore, even in the cases in which substrates absent of filler saw successful applications, the sensing performance of the substrate undoubtedly benefited from the addition of conductive filler [23,52,57]. Table 4 showcases filler free applications of AAM and their respective performances.
4. Temperature Sensing
4.1. Overview
Temperature sensing using AAM is less frequently explored, but is critical: without knowledge of the sensor’s response to thermal effects, its strain behaviour cannot be decoupled.
The response of cementitious materials to temperature tends to be more complicated when compared to strain sensing. This is because elevated temperatures tend to cause evaporation, and so changes to environmental humidity and AAM matrix moisture (effects which are discussed separately in Section 5 of this paper). The result is that temperature characterization must be conducted in a sealed environment with controlled or monitored moisture and humidity conditions.
For the most part the behaviour of AAM and OPC under temperature change is fairly similar. As a rule of thumb, as the temperature increases, the resistance of the sample decreases due to increased ion mobility at high temperatures [65]. Figure 9 displays the fractional change in impedance of AAM for various temperatures. Based on the existing literature in both OPC and AAM, the behaviour of cementitious materials under temperature change can be divided into three primary regions. Compared to strain sensing though, these regions are not as distinctly defined and overlapping among regions is quite common.
Sensing Behaviour at Different Temperatures
The first region of temperature sensing of reported applications is situated approximately between –30°C up to around 50 °C. This section encapsulates most of the temperature sensing tests that have been carried out and corresponds to the majority of field and civil engineering applications. The behaviour for this temperature range is fairly straightforward as when the temperature increases, the resistance of the material decreases [24,26,27,65,87,131,139,148,149,150].
The second region typically lies between 50–110 °C. In this region, the response of the materials begins to showcase somewhat irregular behaviour depending on the testing conditions. For metakaolin AAM, it was reported by MacKenzie and Bolton [87] that as the temperature increased up to 80 °C the resistance of the sample started to increase as well due to the depletion of water in the matrix. On the contrary though, in an OPC based investigation conducted by Demircilioglu et al. [139] under sealed conditions the resistance of the sample between 50–115 °C remained fairly constant due to the equilibrium of water vapor as a result of the sealed environment. Similarly, in another OPC based application under sealed conditions Teomete [151] reported small changes in resistance between 50 °C up until 200 °C.
The third region has so far been loosely defined as “the temperature at which the behaviour of the sample begins to change once again”. This point is usually found to lie between 80–200 °C. In AAM, MacKenzie and Bolton [87] pointed out that beyond 80 °C the mobile charge-carrying hydrous species were depleted and other charge carrying mechanisms were more significant at this point. Up until 290 °C after the water has been removed, the resistance of the material decreased as a function of the added conductive filler content and temperature. Similarly, Gulicovski et al. [152] noted that at greatly elevated temperatures (500–700 °C) the impedance of AAM decreased as the temperature increased. This was explained due dehydration and dehydroxylation of the AAM, introducing new conduction pathways in the matrix. In addition, Sellami et al. [94] mentioned that for temperatures beyond 575 °C the AAM underwent structure rearrangement which ultimately led to the improved alkali metal ion transfer rate and electrical conductivity (decrease in resistance). Under sealed conditions in OPC applications by Teomete [151] and Demircilioglu et al. [139] it was reported that beyond a certain point the resistance of the sample started to increase significantly. It was explained by the authors that this rapid increase in resistance was due to the mismatch in behaviours between the cement paste and the aggregates and conductive fibre at elevated temperatures. The cement paste contracted while the aggregates and conductive fibre elongated causing tensile stresses to develop and thus damage inside the matrix. In general, the third region of temperature sensing is highly complex due to the simultaneous occurrence of multiple phenomena. The increased temperature can cause depletion of moisture in the pores of the binder [153]. Moreover, as previously mentioned, the increased temperature can also cause the expansion of aggregates. Both can lead to cracks in the binder and thus an increase in resistance. At the same time though, elevated temperature increases ion mobility which leads to decreased resistance. In this region applications only for AAM pastes have been reported, in which a decrease in resistance was observed. It can be inferred that AAM with aggregates will showcase a different response. This region requires greater in-depth analysis to determine the dominant factor affecting resistance for each type of AAM binder.
4.2. Temperature Sensing: Characterization Equation
Most temperature applications of AAM are conducted at around ambient temperatures, in the first region of temperature sensing. Similar to strain tests, a material’s temperature behaviour is normally examined by investigating the change in resistance/impedance against the applied temperature. The relationship in this case is not as clearly defined as it is in strain sensing applications as the reported responses tend to vary.
In a fly ash AAM study by Saafi et al. [24] conducted between −10–35 °C, a linear relationship between the change in impedance and temperature was presented, although with a low coefficient of determination (0.802–0.904). Moreover, Perry et al. [154] also reported a linear response between change in impedance and temperature change for fly ash AAM, albeit under a small temperature range (ΔT = 3 °C) where a linear approximation can be made. A linear change in resistance has also been identified in OPC for temperatures between 25–50 °C [139].
In contrast, Perry et al. [26] reported a polynomial relationship between change in impedance and temperature change between 10–30 °C in a fly ash AAM investigation. More recent and in-depth work on filler free AAM applications between 5–30 °C and 10–30 °C conducted by Biondi et al. [65] and Vlachakis et al. [27] respectively showcased that the change in impedance in relation to temperature follows an exponential trend (Equation (8)) expressed by [155] such that:
where Z0 = impedance at start of the test, Zi = impedance at given temperature, T = temperature and A, B and C are constants. Figure 10 illustrates the temperature response of printed metakaolin AAM following Equation (8). Similarly, in OPC based studies carried out by Lee et al. [150] between 5 °C to 40 °C, Chang et al. [149] between −15–20 °C and Sun et al. [131] between −30–60 °C, while the response was not characterized, it can be easily observed by the graphs provided that the relationship between resistance and temperature was nonlinear in both instances.
Crucially, Equation (8) is underpinned by accepted physical explanations of the mechanisms responsible for changes in cementitious material conductivity. The temperature response of AAM can be described using the time-temperature superposition principle [156]. While this is described in detail in [65], the time-temperature superposition principle states that increasing the temperature of an AAM is completely equivalent to speeding up the motion of its ions and conduction mechanisms. In order to produce an electrical current, an ion within the AAM must hop from its existing site to an adjacent site, and that site must relax to accommodate the ion. The longer it takes for an ion to be accommodated, the greater the probability of a backwards hop. Increasing temperature speeds up relaxation, and essentially accelerates ion hopping.
4.3. Temperature Sensitivity Values
The temperature response of various AAM applications are presented in Table 5. As the characterization equation describing the relationship between temperature and impedance/resistance has historically been poorly defined, the sensitivity values of AAM during temperature characterization has varied.
Saafi et al. [24] reported a linear temperature sensitivity of kT = 0.02 °C−1 (21.5 kΩ/C) for AAM with graphene-based electrodes. Perry et al. [26,154] in fly ash-based coating applications showcased a sensor with a sensitivities ranging from kT = of 0.08 °C−1 to 0.5 °C−1. Cai et al. [157] also investigated the Seebeck effect for both fly ash and metakaolin AAM and quoted their sensitivities as −6.31 μV/°C for fly ash AAM, and −15.12 μV/°C for metakaolin AAM.
Biondi et al. [65] explored the temperature response for fly ash AAM for various water content ratios. The temperature sensitivity ranged between 0.06 °C−1 to 0.18 °C−1 and with a repeatability of 1–2% deviation. Additionally, in a 3D printed AAM coating application Vlachakis et al. [27] reported a temperature sensitivity of 0.1 °C−1 and a repeatability of 0.3 °C.
Making a clear comparison between AAM and OPC binders is challenging. While the resistance for OPC binders has been reported for various temperatures, the sensing response has not been characterized as it has for AAMs. Figure 11 provides temperature characterization curves for conductive-fibre laced OPC composites reported in [131,139,149,150]. These data were not explicitly included in the original references but were determined based on the reported dependencies of electrical resistance, resistivity, or impedance, on temperature. In Figure 11, M is the reported electrical quantity measured (e.g., resistance, resistivity, or impedance), and M0 is the value of that measurand at 20 °C. Normalization using M/M0 is performed to make fractional shifts in resistance and resistivity comparable, as the normalization reduces the impact of geometric effects. The fits shown all use an equation of the form, Equation (9):
where the parametric constants, a and b, for each study are listed in Table 6.
An AAM study by Vlachakis et al. [27] is also included in Figure 11 for comparison. As shown, the temperature response of OPC and AAM binders is comparable. However, temperature sensing is affected by numerous factors such as saturation of the binder [65] and therefore a definitive claim cannot be made with these data alone.
5. Moisture Sensing
Moisture sensing is infrequently explored in AAM but is important even in strain sensing applications due to moisture’s significant impact on AAM electrical conductivity.
Moisture is here defined as the water content inside the matrix: this is something which can be impacted by environmental humidity condensing in AAM pores or existing in a vapor phase. It is universally acknowledged that increasing the water content, whether AAM or OPC, increases the sample’s conductivity [158]. The relationship between resistance and moisture content is typically expressed as an exponential [159] or by a power law correlation [158,160].
A study was carried out by Biondi et al. [65] in fly ash based AAM for water content ranging between 25.5–87.7%. It was shown that similar to temperature, increasing water content in the matrix increases the ion hopping mechanism described in Section 3.4. Water was explained to increase the connectivity of the pore network and the volume of the pore network filled with electrolyte solution. The relationship between impedance, water content and temperature was defined by Equation (10):
In which G1–5 = constants, T = temperature, W = water content, Zmod,0 = impedance at ambient conditions, Zmod = impedance at given temperature and water content. Figure 12 displays the moisture response of AAM for different temperatures. Similarly, in cement-based moisture sensing applications the resistance of the specimens increased as the moisture content decreased as the water which acts as an electrolyte in the micro-voids was removed [139,151] and due to ionic and moisture conductivity [159].
6. Future Work and Recommendations
While extensive research has been carried out in self-sensing AAM, Table 7 highlights that the extent of study is very limited compared to the body of work for OPC. This is simply because AAM are relatively new, and OPC concretes are still the most widely used construction material today. This will change as civil engineers strive to meet climate targets, and it will be important to bear in mind that the work from OPC will not always be translatable to AAM.
Table 7 reveals the gaps in knowledge that need to be filled in future work:
- AAM sensor response to humidity has not been investigated
- while strain applications exist, they have primarily focused on uniaxial loading: multiaxial applications are quite limited.
- the combined effects of multiple phenomena on the sensing performance of AAM have not been looked into apart from combined moisture and temperature. The impact of both moisture and temperature on strain sensitivity have not yet been explored.
AAM sensing is also currently limited in its applications: most papers are focused on concrete structural health monitoring. Broader applications such as traffic detection would be feasible but are currently absent in AAM literature.
AAM sensing is also limited in the number of techniques it employs. OPC sensing, for example, has already explored small-sized self-sensing composites embedded in larger substrates [111,121,137]. While applications with a similar purpose have been explored in AAM in the form of coatings [26,27,154], the number of applications and available literature is still quite limited.
As mentioned in Section 3.4. the sensing mechanism for filler-free AAM is not fully understood but various explanations have been given. A more in-depth explanation of this mechanism is required to further progress in AAM sensing applications.
It has been acknowledged that the performance of AAM is governed by molar ratios rather than the mass ratios that are typically used in OPC [31]. While studies have focused on the effect of the chemical composition and mix design on the conductivity of AAM [56,60,68,91,95] a direct translation between molar ratios and sensing capability, apart from very specific applications [157], is currently absent. As can been seen in Table 3 and Table 4 the reported sensing performances of AAM are quite vast and broad. Correlating the molecular composition with the sensing performance may potentially pave the road for more repeatable and consistent results. With that in mind, it can be accepted that altering the chemistry of AAM to fit research requirements and performing a proper analysis may be associated with more challenges compared to an OPC mix design.
AAM can be fabricated with different types of precursors, each with a different molar composition. While the reported applications have focused on using fly ash, metakaolin and ground granulated blast furnace slag, the range of available precursors for AAM keeps on increasing. Materials such as rice husk ash, palm fuel ash, red mud etc. have seen applications in AAM fabrication [161]. This can open the path to new research and development possibilities and perspectives on AAM sensing. Sensing applications have primarily focused on the standard two-part mix of AAM. It has been posited that one-part mixes may provide a more approachable route in future applications of AAM [34]. Therefore, exploring one-part AAM mixes may allow a more straightforward approach allowing the material to be more easily deployed in the field.
Finally, while standards for AAM fabrication and sensing applications do not currently exist, a unified approach or common sensing setup for general cementitious sensing is required to allow for more convenient and accurate comparison between applications. A universal methodology will be essential for laying the groundwork for industrial applications. Recommendations that can be considered in future applications follow:
- The chemical composition of all constituents should be reported where possible. A thorough mix design with both solid-liquid ratios and molar ratios of AAM should be included. The curing regime should also be clearly stated e.g., heated cured, sealed conditions etc.
- Gauge factors or common equivalent sensing performance units should be reported in all applications. For strain applications the applied strain and/or modulus of elasticity should also be provided where possible to allow for further analysis and comparisons in future applications.
- An average gauge factor/sensing performance with standard deviation and coefficient of determination should be provided instead of reporting the highest sensing performance values achieved.
- The surrounding conditions e.g., temperature and humidity should be monitored with an external sensing device to ensure a relatively constant testing environment. Strain sensing in particular can be impacted by fluctuations in temperature and humidity.
- The number of samples tested and number of measurements per sample should be reported.
- Proper insulation between the binder and the surrounding environment must be ensured throughout the entire duration of the experiment.
- The type of current, direct or alternating, should be explicitly mentioned. The frequency and sampling rate should also be reported if alternating current is used.
- The orientation of the electrodes should be consistent throughout subsequent tests. For strain sensing, the direction of the electrodes should reflect the anticipated behaviour of the sample e.g., current and voltage are parallel to the applied load for compression and perpendicular for tension.
- A period of stabilization should be allowed for samples prior to testing.
- The state of the binder e.g., dried, saturated, unsaturated etc. and the testing conditions, sealed or unsealed, should be stated.
7. Conclusions
This review provided an overview of the current state-of-the-art in sensing using alkali activated materials. As our understanding of these materials progresses, agreement between studies will hopefully begin to converge. As alkali-activated materials provide the benefits of being an economically viable and environmentally friendly alternative to OPC, we anticipate this field of research will grow as their use becomes more common. AAM have already seen some successful applications in strain, temperature and moisture sensing either as the main structural material or as a self-sensing coating applied to existing infrastructure. One primary advantage of using AAM for sensing is the elimination of the need for conductive filler due to the migration of the alkali metal ions in their matrix. While rapid development in sensing research has been carried out recently, numerous fields of sensing are still waiting to be explored.
Author Contributions
Conceptualization, C.V. and M.P.; methodology, C.V.; software, C.V.; validation, C.V., M.P. and L.B.; formal analysis, C.V., M.P.; investigation, C.V.; data curation, C.V.; writing—original draft preparation, C.V.; writing—review and editing, C.V., M.P., L.B.; visualization, C.V., M.P.; supervision, M.P.; project administration, M.P.; funding acquisition, M.P. All authors have read and agreed to the published version of the manuscript.
Funding
This work was supported in part by the Royal Society (grant number RG160748), EPSRC (EP/L014041/1) and the Oil & Gas Technology Centre (OGTC).
Conflicts of Interest
The authors declare no conflict of interest.
References
- Ding, S.; Dong, S.; Ashour, A.; Han, B. Development of sensing concrete: Principles, properties and its applications. J. Appl. Phys. 2019, 126, 241101. [Google Scholar] [CrossRef] [Green Version]
- Tian, Z.; Li, Y.; Zheng, J.; Wang, S. A state-of-the-art on self-sensing concrete: Materials, fabrication and properties. Compos. Part B 2019, 177, 107437. [Google Scholar] [CrossRef]
- Downey, A.; D’Alessandro, A.; Laflamme, S.; Ubertini, F. Smart bricks for strain sensing and crack detection in masonry structures. Smart Mater. Struct. 2018, 27, 015009. [Google Scholar] [CrossRef] [Green Version]
- Meoni, A.; D’Alessandro, A.; Ubertini, F. Characterization of the strain-sensing behavior of smart bricks: A new theoretical model and its application for monitoring of masonry structural elements. Constr. Build. Mater. 2020, 250, 118907. [Google Scholar] [CrossRef]
- Kong, Q.; Fan, S.; Bai, X.; Mo, Y.L.; Song, G. A novel embeddable spherical smart aggregate for structural health monitoring: Part I. Fabrication and electrical characterization. Smart Mater. Struct. 2017, 26, 095050. [Google Scholar] [CrossRef]
- Zhao, S.; Fan, S.; Yang, J.; Kitipornchai, S. A spherical smart aggregate sensor based electro-mechanical impedance method for quantitative damage evaluation of concrete. Struct. Heal. Monit. 2019, 19, 1560–1576. [Google Scholar] [CrossRef]
- Han, B.; Zhang, K.; Burnham, T.; Kwon, E.; Yu, X. Integration and road tests of a self-sensing CNT concrete pavement system for traffic detection. Smart Mater. Struct. 2013, 22, 015020. [Google Scholar] [CrossRef]
- Arabzadeh, A.; Ceylan, H.; Kim, S.; Sassani, A.; Gopalakrishnan, K.; Mina, M. Electrically-conductive asphalt mastic: Temperature dependence and heating efficiency. Mater. Des. 2018, 157, 303–313. [Google Scholar] [CrossRef] [Green Version]
- Zhang, G.; Yang, H.; Ju, C.; Yang, Y. Novel selection of environment-friendly cementitious materials for winter construction: Alkali-activated slag/Portland cement. J. Clean. Prod. 2020, 258, 120592. [Google Scholar] [CrossRef]
- Assi, L.N.; Deaver, E.; Elbatanouny, M.K.; Ziehl, P. Investigation of early compressive strength of fly ash-based geopolymer concrete. Constr. Build. Mater. 2016, 112, 807–815. [Google Scholar] [CrossRef] [Green Version]
- Provis, J.L.; Arbi, K.; Bernal, S.A.; Bondar, D.; Buchwald, A.; Castel, A.; Chithiraputhiran, S.; Cyr, M.; Dehghan, A.; Dombrowski-Daube, K.; et al. RILEM TC 247-DTA round robin test: Mix design and reproducibility of compressive strength of alkali-activated concretes. Mater. Struct. Constr. 2019, 52, 1–13. [Google Scholar] [CrossRef]
- Khan, M.N.N.; Sarker, P.K. Effect of waste glass fine aggregate on the strength, durability and high temperature resistance of alkali-activated fly ash and GGBFS blended mortar. Constr. Build. Mater. 2020, 263, 120177. [Google Scholar] [CrossRef]
- Aguirre-Guerrero, A.M.; Robayo-Salazar, R.A.; Mejía de Gutiérrez, R. Corrosion resistance of alkali-activated binary reinforced concrete based on natural volcanic pozzolan exposed to chlorides. J. Build. Eng. 2021, 33, 101593. [Google Scholar] [CrossRef]
- Komljenović, M.; Tanasijević, G.; Džunuzović, N.; Provis, J.L. Immobilization of cesium with alkali-activated blast furnace slag. J. Hazard. Mater. 2020, 388, 121765. [Google Scholar] [CrossRef]
- Nunes, V.A.; Borges, P.H.R.; Zanotti, C. Mechanical compatibility and adhesion between alkali-activated repair mortars and Portland cement concrete substrate. Constr. Build. Mater. 2019, 215, 569–581. [Google Scholar] [CrossRef]
- Biondi, L.; Perry, M.; Vlachakis, C.; Wu, Z.; Hamilton, A.; McAlorum, J. Ambient Cured Fly Ash Geopolymer Coatings for Concrete. Materials 2019, 12, 923. [Google Scholar] [CrossRef] [Green Version]
- Panda, B.; Tan, M.J. Experimental study on mix proportion and fresh properties of fly ash based geopolymer for 3D concrete printing. Ceram. Int. 2018, 44, 10258–10265. [Google Scholar] [CrossRef]
- Kan, L.L.; Lv, J.W.; Duan, B.B.; Wu, M. Self-healing of Engineered Geopolymer Composites prepared by fly ash and metakaolin. Cem. Concr. Res. 2019, 125, 105895. [Google Scholar] [CrossRef]
- Huseien, G.F.; Shah, K.W. Durability and life cycle evaluation of self-compacting concrete containing fly ash as GBFS replacement with alkali activation. Constr. Build. Mater. 2020, 235, 117458. [Google Scholar] [CrossRef]
- He, J.; Zhang, G.; Hou, S.; Cai, C.S. Geopolymer-Based Smart Adhesives for Infrastructure Health Monitoring: Concept and Feasibility. J. Mater. Civ. Eng. 2011, 23, 100–109. [Google Scholar] [CrossRef]
- Suweni Muntini, M.; Ahmadi, H. Performance of metakaolin geopolymer ceramic for fiber optic temperature sensor. Mater. Today Proc. 2018, 5, 15137–15142. [Google Scholar] [CrossRef]
- Lamuta, C.; Candamano, S.; Crea, F.; Pagnotta, L. Direct piezoelectric effect in geopolymeric mortars. Mater. Des. 2016, 107, 57–64. [Google Scholar] [CrossRef]
- Bi, S.; Liu, M.; Shen, J.; Hu, X.M.; Zhang, L. Ultrahigh Self-Sensing Performance of Geopolymer Nanocomposites via Unique Interface Engineering. ACS Appl. Mater. Interfaces 2017, 9, 12851–12858. [Google Scholar] [CrossRef] [PubMed]
- Saafi, M.; Piukovics, G.; Ye, J. Hybrid graphene/geopolymeric cement as a superionic conductor for structural health monitoring applications. Smart Mater. Struct. 2016, 25. [Google Scholar] [CrossRef]
- Vilaplana, J.L.; Baeza, F.J.; Galao, O.; Zornoza, E.; Garcés, P. Self-sensing properties of alkali activated blast furnace slag (BFS) composites reinforced with carbon fibers. Materials 2013, 6, 4776–4786. [Google Scholar] [CrossRef] [Green Version]
- Perry, M.; Saafi, M.; Fusiek, G.; Niewczas, P. Hybrid optical-fibre/geopolymer sensors for structural health monitoring of concrete structures. Smart Mater. Struct. 2015, 24, 45011. [Google Scholar] [CrossRef] [Green Version]
- Vlachakis, C.; Perry, M.; Biondi, L.; Mcalorum, J. 3D printed temperature-sensing repairs for concrete structures. Addit. Manuf. 2020, 34, 101238. [Google Scholar] [CrossRef]
- Dong, W.; Li, W.; Tao, Z.; Wang, K. Piezoresistive properties of cement-based sensors: Review and perspective. Constr. Build. Mater. 2019, 203, 146–163. [Google Scholar] [CrossRef]
- Tang, Z.; Li, W.; Hu, Y.; Zhou, J.L.; Tam, V.W.Y. Review on designs and properties of multifunctional alkali-activated materials (AAMs). Constr. Build. Mater. 2019, 200, 474–489. [Google Scholar] [CrossRef]
- Duxson, P.; Provis, J.L. Designing precursors for geopolymer cements. J. Am. Ceram. Soc. 2008, 91, 3864–3869. [Google Scholar] [CrossRef]
- Provis, J.L. Geopolymers and other alkali activated materials: Why, how, and what? Mater. Struct. Constr. 2014, 47, 11–25. [Google Scholar] [CrossRef]
- Duxson, P.; Fernández-Jiménez, A.; Provis, J.L.; Lukey, G.C.; Palomo, A.; Van Deventer, J.S.J. Geopolymer technology: The current state of the art. J. Mater. Sci. 2007, 42, 2917–2933. [Google Scholar] [CrossRef]
- Luukkonen, T.; Abdollahnejad, Z.; Yliniemi, J.; Kinnunen, P.; Illikainen, M. One-part alkali-activated materials: A review. Cem. Concr. Res. 2018, 103, 21–34. [Google Scholar] [CrossRef]
- Provis, J.L. Alkali-activated materials. Cem. Concr. Res. 2018, 114, 40–48. [Google Scholar] [CrossRef]
- Duxson, P.; Provis, J.L.; Lukey, G.C.; Mallicoat, S.W.; Kriven, W.M.; Van Deventer, J.S.J. Understanding the relationship between geopolymer composition, microstructure and mechanical properties. Colloids Surfaces A Physicochem. Eng. Asp. 2005, 269, 47–58. [Google Scholar] [CrossRef]
- Pouhet, R.; Cyr, M. Formulation and performance of flash metakaolin geopolymer concretes. Constr. Build. Mater. 2016, 120, 150–160. [Google Scholar] [CrossRef]
- Provis, J.L.; Bernal, S.A. Geopolymers and Related Alkali-Activated Materials. Annu. Rev. Mater. Res. 2014, 44, 299–327. [Google Scholar] [CrossRef]
- Qureshi, M.N.; Ghosh, S. Effect of Si/Al ratio on engineering properties of alkali-activated GGBS pastes. Green Mater. 2014, 2, 123–131. [Google Scholar] [CrossRef]
- Sisol, M.; Kudelas, D.; Marcin, M.; Holub, T.; Varga, P. Statistical evaluation of mechanical properties of slag based alkali-activated material. Sustain. 2019, 11, 5935. [Google Scholar] [CrossRef] [Green Version]
- Jiao, Z.; Wang, Y.; Zheng, W.; Huang, W. Effect of Dosage of Alkaline Activator on the Properties of Alkali-Activated Slag Pastes. Adv. Mater. Sci. Eng. 2018, 2018, 10–12. [Google Scholar] [CrossRef] [Green Version]
- Aydin, S.; Baradan, B. Mechanical and microstructural properties of heat cured alkali-activated slag mortars. Mater. Des. 2012, 35, 374–383. [Google Scholar] [CrossRef]
- Tänzer, R.; Buchwald, A.; Stephan, D. Effect of slag chemistry on the hydration of alkali-activated blast-furnace slag. Mater. Struct. Constr. 2014, 48, 629–641. [Google Scholar] [CrossRef] [Green Version]
- Haha, M.B.; Lothenbach, B.; Le Saout, G.; Winnefeld, F. Influence of slag chemistry on the hydration of alkali-activated blast-furnace slag—Part I: Effect of MgO. Cem. Concr. Res. 2011, 41, 955–963. [Google Scholar] [CrossRef]
- Bernal, S.A.; San Nicolas, R.; Myers, R.J.; Mejía De Gutiérrez, R.; Puertas, F.; Van Deventer, J.S.J.; Provis, J.L. MgO content of slag controls phase evolution and structural changes induced by accelerated carbonation in alkali-activated binders. Cem. Concr. Res. 2014, 57, 33–43. [Google Scholar] [CrossRef] [Green Version]
- Park, S.; Park, H.M.; Yoon, H.N.; Seo, J.; Yang, C.-M.; Provis, J.L.; Yang, B. Hydration kinetics and products of MgO-activated blast furnace slag. Constr. Build. Mater. 2020, 249, 118700. [Google Scholar] [CrossRef]
- Haha, M.B.; Lothenbach, B.; Le Saout, G.; Winnefeld, F. Influence of slag chemistry on the hydration of alkali-activated blast-furnace slag—Part II: Effect of Al2O3. Cem. Concr. Res. 2012, 42, 74–83. [Google Scholar] [CrossRef]
- Bernal, S.A.; San Nicolas, R.; Van Deventer, J.S.J.; Provis, J.L. Alkali-activated slag cements produced with a blended sodium carbonate/sodium silicate activator. Adv. Cem. Res. 2016, 28, 262–273. [Google Scholar] [CrossRef]
- Bernal, S.A.; Provis, J.L.; Fernández-Jiménez, A.; Krivenko, P.V.; Kavalerova, E.; Palacios, M.; Shi, C. Binder Chemistry—High-Calcium Alkali-Activated Materials. In Alkali Activated Materials State-of-the-Art Report, RILEM TC 224-AAM.; Provis, J.L., van Deventer, J.S.J., Eds.; RILEM: Dordrecht, The Netherlands; Heidelberg, Germany; New York, NY, USA; London, UK, 2014; pp. 59–91. ISBN 978-94-007-7672-2. [Google Scholar]
- Kim, G.M.; Yang, B.J.; Cho, K.J.; Kim, E.M.; Lee, H.K. Influences of CNT dispersion and pore characteristics on the electrical performance of cementitious composites. Compos. Struct. 2017, 164, 32–42. [Google Scholar] [CrossRef]
- Candamano, S.; Sgambitterra, E.; Lamuta, C.; Pagnotta, L.; Chakraborty, S.; Crea, F. Graphene nanoplatelets in geopolymeric systems: A new dimension of nanocomposites. Mater. Lett. 2019, 236, 550–553. [Google Scholar] [CrossRef]
- Rovnaník, P.; Mizerová, C.; Kusák, I.; Schmid, P. Self-sensing properties of alkali-activated slag composite with carbon black during bending test. Solid State Phenom. 2019, 296 SSP, 167–172. [Google Scholar] [CrossRef]
- Rovnaník, P.; Kusák, I.; Bayer, P.; Schmid, P.; Fiala, L. Electrical and self-sensing properties of alkali-activated slag composite with graphite filler. Materials 2019, 12, 1616. [Google Scholar] [CrossRef] [PubMed] [Green Version]
- Deng, L.; Ma, Y.; Hu, J.; Yin, S.; Ouyang, X.; Fu, J.; Liu, A.; Zhang, Z. Preparation and piezoresistive properties of carbon fiber-reinforced alkali-activated fly ash/slag mortar. Constr. Build. Mater. 2019, 222, 738–749. [Google Scholar] [CrossRef]
- Saafi, M.; Tang, L.; Fung, J.; Rahman, M.; Liggat, J. Enhanced properties of graphene/fly ash geopolymeric composite cement. Cem. Concr. Res. 2015, 67, 292–299. [Google Scholar] [CrossRef] [Green Version]
- Lamuta, C.; Bruno, L.; Candamano, S.; Pagnotta, L. Piezoresistive characterization of graphene/metakaolin based geopolymeric mortar composites. MRS Adv. 2017, 2, 3773–3779. [Google Scholar] [CrossRef]
- Payakaniti, P.; Pinitsoontorn, S.; Thongbai, P.; Amornkitbamrung, V. Electrical conductivity and compressive strength of carbon fiber reinforced fly ash geopolymeric composites. Constr. Build. Mater. 2017, 135, 164–176. [Google Scholar] [CrossRef]
- Saafi, M.; Tang, L.; Fung, J.; Rahman, M.; Sillars, F.; Liggat, J.; Zhou, X. Graphene/fly ash geopolymeric composites as self-sensing structural materials. Smart Mater. Struct. 2014, 23, 65006. [Google Scholar] [CrossRef]
- Saafi, M.; Andrew, K.; Tang, P.L.; McGhon, D.; Taylor, S.; Rahman, M.; Yang, S.; Zhou, X. Multifunctional properties of carbon nanotube/fly ash geopolymeric nanocomposites. Constr. Build. Mater. 2013, 49, 46–55. [Google Scholar] [CrossRef]
- Behera, P.; Baheti, V.; Militky, J.; Naeem, S. Microstructure and mechanical properties of carbon microfiber reinforced geopolymers at elevated temperatures. Constr. Build. Mater. 2018, 160, 733–743. [Google Scholar] [CrossRef]
- Hanjitsuwan, S.; Hunpratub, S.; Thongbai, P.; Maensiri, S.; Sata, V.; Chindaprasirt, P. Effects of NaOH concentrations on physical and electrical properties of high calcium fly ash geopolymer paste. Cem. Concr. Compos. 2014, 45, 9–14. [Google Scholar] [CrossRef]
- Shah, S.F.A.; Chen, B.; Oderji, S.Y.; Aminul Haque, M.; Ahmad, M.R. Comparative study on the effect of fiber type and content on the performance of one-part alkali-activated mortar. Constr. Build. Mater. 2020, 243, 118221. [Google Scholar] [CrossRef]
- Abdollahnejad, Z.; Mastali, M.; Falah, M.; Shaad, K.M.; Luukkonen, T.; Illikainen, M. Durability of the Reinforced One-Part Alkali-Activated Slag Mortars with Different Fibers. Waste Biomass Valorization 2020. [Google Scholar] [CrossRef] [Green Version]
- Abdollahnejad, Z.; Mastali, M.; Luukkonen, T.; Kinnunen, P.; Illikainen, M. Fiber-reinforced one-part alkali-activated slag/ceramic binders. Ceram. Int. 2018, 44, 8963–8976. [Google Scholar] [CrossRef]
- Nematollahi, B.; Sanjayan, J.; Qiu, J.; Yang, E.H. High ductile behavior of a polyethylene fiber-reinforced one-part geopolymer composite: A micromechanics-based investigation. Arch. Civ. Mech. Eng. 2017, 17, 555–563. [Google Scholar] [CrossRef]
- Biondi, L.; Perry, M.; McAlorum, J.; Vlachakis, C.; Hamilton, A. Geopolymer-based moisture sensors for reinforced concrete health monitoring. Sens. Actuators B Chem. 2020, 309, 127775. [Google Scholar] [CrossRef]
- Hansson, I.L.H.; Hansson, C.M. Ion-conduction in cement-based materials. Cem. Concr. Res. 1985, 15, 201–212. [Google Scholar] [CrossRef]
- Xu, J.; Zhong, W.; Yao, W. Modeling of conductivity in carbon fiber-reinforced cement-based composite. J. Mater. Sci. 2010, 45, 3538–3546. [Google Scholar] [CrossRef]
- Cui, X.M.; Zheng, G.J.; Han, Y.C.; Su, F.; Zhou, J. A study on electrical conductivity of chemosynthetic Al2O3-2SiO2geoploymer materials. J. Power Sources 2008, 184, 652–656. [Google Scholar] [CrossRef]
- McCarter, W.J.; Brousseau, R. The A.C. response of hardened cement paste. Cem. Concr. Res. 1990, 20, 891–900. [Google Scholar] [CrossRef]
- Gu, P.; Xie, P.; Beaudoin, J.J.; Brousseau, R.A.C. impedance spectroscopy (I): A new equivalent circuit model for hydrated portland cement paste. Cem. Concr. Res. 1992, 22, 833–840. [Google Scholar] [CrossRef]
- Wen, S.; Chung, D.D.L. The role of electronic and ionic conduction in the electrical conductivity of carbon fiber reinforced cement. Carbon 2006, 44, 2130–2138. [Google Scholar] [CrossRef]
- Wen, S.; Chung, D.D.L. Effect of carbon fiber grade on the electrical behavior of carbon fiber reinforced cement. Carbon 2001, 39, 369–373. [Google Scholar] [CrossRef]
- Li, H.; Xiao, H.; Ou, J. Effect of compressive strain on electrical resistivity of carbon black-filled cement-based composites. Cem. Concr. Compos. 2006, 28, 824–828. [Google Scholar] [CrossRef]
- Chen, B.; Wu, K.; Yao, W. Conductivity of carbon fiber reinforced cement-based composites. Cem. Concr. Compos. 2004, 26, 291–297. [Google Scholar] [CrossRef]
- Han, B.; Yu, X.; Ou, J. Effect of water content on the piezoresistivity of MWNT/cement composites. J. Mater. Sci. 2010, 45, 3714–3719. [Google Scholar] [CrossRef]
- Sun, S.; Han, B.; Jiang, S.; Yu, X.; Wang, Y.; Li, H.; Ou, J. Nano graphite platelets-enabled piezoresistive cementitious composites for structural health monitoring. Constr. Build. Mater. 2017, 136, 314–328. [Google Scholar] [CrossRef] [Green Version]
- Fiala, L.; Jerman, M.; Rovnaník, P.; Černý, R. Basic physical, mechanical and electrical properties of electrically enhanced alkali-activated aluminosilicates. Mater. Tehnol. 2017, 51, 1005–1009. [Google Scholar] [CrossRef]
- Rovnaník, P.; Míková, M.; Kusák, I. Electrical properties of alkali-activated slag mortar with carbon fibres. Mater. Sci. Forum 2017, 908, 100–105. [Google Scholar] [CrossRef]
- Chung, D.D.L. Piezoresistive cement-based materials for strain sensing. J. Intell. Mater. Syst. Struct. 2002, 13, 599–609. [Google Scholar] [CrossRef]
- Al-Dahawi, A.; Sarwary, M.H.; Öztürk, O.; Yildirim, G.; Akin, A.; Şahmaran, M.; Lachemi, M. Electrical percolation threshold of cementitious composites possessing self-sensing functionality incorporating different carbon-based materials. Smart Mater. Struct. 2016, 25, 105005. [Google Scholar] [CrossRef]
- Pour-Ghaz, M.; Isgor, O.B.; Ghods, P. The effect of temperature on the corrosion of steel in concrete. Part 1: Simulated polarization resistance tests and model development. Corros. Sci. 2009, 51, 415–425. [Google Scholar] [CrossRef]
- Wen, S.; Chung, D.D.L. Electric polarization in carbon fiber-reinforced cement. Cem. Concr. Res. 2001, 31, 141–147. [Google Scholar] [CrossRef]
- Song, G. Theoretical analysis of the measurement of polarization resistance in reinforced concrete. Cem. Concr. Compos. 2000, 22, 407–415. [Google Scholar] [CrossRef]
- Han, B.; Zhang, K.; Yu, X.; Kwon, E.; Ou, J. Electrical characteristics and pressure-sensitive response measurements of carboxyl MWNT/cement composites. Cem. Concr. Compos. 2012, 34, 794–800. [Google Scholar] [CrossRef]
- Lasia, A. Electrochemical Impedance Spectroscopy and Its Applications; Springer: Berlin/Heidelberg, Germany, 2014; ISBN 9781461489320. [Google Scholar]
- Rovnaník, P.; Kusák, I.; Bayer, P.; Schmid, P.; Fiala, L. Comparison of electrical and self-sensing properties of Portland cement and alkali-activated slag mortars. Cem. Concr. Res. 2019, 118, 84–91. [Google Scholar] [CrossRef]
- MacKenzie, K.J.D.; Bolton, M.J. Electrical and mechanical properties of aluminosilicate inorganic polymer composites with carbon nanotubes. J. Mater. Sci. 2009, 44, 2851–2857. [Google Scholar] [CrossRef]
- Zhang, Y.J.; He, P.Y.; Zhang, Y.X.; Chen, H. A novel electroconductive graphene/fly ash-based geopolymer composite and its photocatalytic performance. Chem. Eng. J. 2018, 334, 2459–2466. [Google Scholar] [CrossRef]
- Zhong, J.; Zhou, G.X.; He, P.G.; Yang, Z.H.; Jia, D.C. 3D printing strong and conductive geo-polymer nanocomposite structures modified by graphene oxide. Carbon 2017, 117, 421–426. [Google Scholar] [CrossRef]
- Fiala, L.; Petříková, M.; Lin, W.T.; Podolka, L.; Černý, R. Self-heating ability of geopolymers enhanced by carbon black admixtures at different voltage loads. Energies 2019, 12, 4121. [Google Scholar] [CrossRef] [Green Version]
- Hanjitsuwan, S.; Chindaprasirt, P.; Pimraksa, K. Electrical conductivity and dielectric property of fly ash geopolymer pastes. Int. J. Miner. Metall. Mater. 2011, 18, 94–99. [Google Scholar] [CrossRef]
- Saafi, M.; Gullane, A.; Huang, B.; Sadeghi, H.; Ye, J.; Sadeghi, F. Inherently multifunctional geopolymeric cementitious composite as electrical energy storage and self-sensing structural material. Compos. Struct. 2018, 201, 766–778. [Google Scholar] [CrossRef] [Green Version]
- Kusak, I.; Lunak, M. On the effect of addition of carbon nanotubes on the electric conductivity of alkali-activated slag mortars. In IOP Conference Series: Materials Science and Engineering; IOP Publishing Ltd.: Bristol, UK, 2017; Volume 246, p. 012044. [Google Scholar] [CrossRef] [Green Version]
- Sellami, M.; Barre, M.; Toumi, M. Synthesis, thermal properties and electrical conductivity of phosphoric acid-based geopolymer with metakaolin. Appl. Clay Sci. 2019, 180, 105192. [Google Scholar] [CrossRef]
- Cai, J.; Pan, J.; Li, X.; Tan, J.; Li, J. Electrical resistivity of fly ash and metakaolin based geopolymers. Constr. Build. Mater. 2020, 234, 117868. [Google Scholar] [CrossRef]
- Salem, T.M.; Ragai, S.M. Electrical conductivity of granulated slag cement kiln dust-silica fume pastes at different porosities. Cem. Concr. Res. 2001, 31, 781–787. [Google Scholar] [CrossRef]
- Liu, K.; Cheng, X.; Li, J.; Gao, X.; Cao, Y.; Guo, X.; Zhuang, J.; Zhang, C. Effects of microstructure and pore water on electrical conductivity of cement slurry during early hydration. Compos. Part B Eng. 2019, 177, 107435. [Google Scholar] [CrossRef]
- Liang, K.; Zeng, X.; Zhou, X.; Qu, F.; Wang, P. A new model for the electrical conductivity of cement-based material by considering pore size distribution. Mag. Concr. Res. 2017, 69, 1067–1078. [Google Scholar] [CrossRef] [Green Version]
- Kultayeva, S.; Ha, J.H.; Malik, R.; Kim, Y.W.; Kim, K.J. Effects of porosity on electrical and thermal conductivities of porous SiC ceramics. J. Eur. Ceram. Soc. 2020, 40, 996–1004. [Google Scholar] [CrossRef]
- Gu, P.; Xie, P.; Beaudoin, J.J.; Brousseau, R. AC impedance spectroscopy (II): Microstructural characterization of hydrating cement-silica fume systems. Cem. Concr. Res. 1993, 23, 157–168. [Google Scholar] [CrossRef]
- Zeng, S.; Wang, J.; Lake, M. Characterization of mechanical and electric properties of geopolymers synthesized using four locally available fly ashes. Constr. Build. Mater. 2016, 121, 386–399. [Google Scholar] [CrossRef] [Green Version]
- Provis, J.L.; Lukey, G.C.; Van Deventer, J.S.J. Do geopolymers actually contain nanocrystalline zeolites? A reexamination of existing results. Chem. Mater. 2005, 17, 3075–3085. [Google Scholar] [CrossRef]
- Wang, X.; Wang, Y.; Jin, Z. Electrical conductivity characterization and variation of carbon fiber reinforced cement composite. J. Mater. Sci. 2002, 37, 223–227. [Google Scholar] [CrossRef]
- Chuang, W.; Geng-sheng, J.; Bing-liang, L.; Lei, P.; Ying, F.; Ni, G.; Ke-zhi, L. Dispersion of carbon fibers and conductivity of carbon fiber-reinforced cement-based composites. Ceram. Int. 2017, 43, 15122–15132. [Google Scholar] [CrossRef]
- Han, B.; Zhang, L.; Ou, J. Influence of water content on conductivity and piezoresistivity of cement-based material with both carbon fiber and carbon black. J. Wuhan Univ. Technol. Mater. Sci. Ed. 2010, 25, 147–151. [Google Scholar] [CrossRef]
- Han, B.G.; Han, B.Z.; Ou, J.P. Experimental study on use of nickel powder-filled Portland cement-based composite for fabrication of piezoresistive sensors with high sensitivity. Sens. Actuators A Phys. 2009, 149, 51–55. [Google Scholar] [CrossRef]
- Khater, H.M.; Abd El Gawaad, H.A. Characterization of alkali activated geopolymer mortar doped with MWCNT. Constr. Build. Mater. 2016, 102, 329–337. [Google Scholar] [CrossRef]
- Abbasi, S.M.; Ahmadi, H.; Khalaj, G.; Ghasemi, B. Microstructure and mechanical properties of a metakaolinite-based geopolymer nanocomposite reinforced with carbon nanotubes. Ceram. Int. 2016, 42, 15171–15176. [Google Scholar] [CrossRef]
- Vilaplana, J.L.; Baeza, F.J.; Galao, O.; Alcocel, E.G.; Zornoza, E.; Garcés, P. Mechanical properties of alkali activated blast furnace slag pastes reinforced with carbon fibers. Constr. Build. Mater. 2016, 116, 63–71. [Google Scholar] [CrossRef]
- Vaidya, S.; Allouche, E.N. Strain sensing of carbon fiber reinforced geopolymer concrete. Mater. Struct. 2011, 44, 1467–1475. [Google Scholar] [CrossRef]
- Liu, Q.; Gao, R.; Tam, V.W.Y.; Li, W.; Xiao, J. Strain monitoring for a bending concrete beam by using piezoresistive cement-based sensors. Constr. Build. Mater. 2018, 167, 338–347. [Google Scholar] [CrossRef]
- Van der Pauw, L.J. A method of measuring specific resistivity and and Hall effect of discs of arbitrary shape. Philips Res. Rep. 1958, 13, 1–9. [Google Scholar]
- Yao, Y.; Duan, X.; Luo, J.; Liu, T. Two-probe versus van der Pauw method in studying the piezoresistivity of single-wall carbon nanotube thin films. Nanotechnology 2017, 28, 445501. [Google Scholar] [CrossRef] [Green Version]
- Chiarello, M.; Zinno, R. Electrical conductivity of self-monitoring CFRC. Cem. Concr. Compos. 2005, 27, 463–469. [Google Scholar] [CrossRef]
- Han, B.; Guan, X.; Ou, J. Electrode design, measuring method and data acquisition system of carbon fiber cement paste piezoresistive sensors. Sens. Actuators A Phys. 2007, 135, 360–369. [Google Scholar] [CrossRef]
- Tang, S.W.; Cai, X.H.; He, Z.; Zhou, W.; Shao, H.Y.; Li, Z.J.; Wu, T.; Chen, E. The review of pore structure evaluation in cementitious materials by electrical methods. Constr. Build. Mater. 2016, 117, 273–284. [Google Scholar] [CrossRef]
- Azhari, F.; Banthia, N. Cement-based sensors with carbon fibers and carbon nanotubes for piezoresistive sensing. Cem. Concr. Compos. 2012, 34, 866–873. [Google Scholar] [CrossRef]
- Xiao, H.; Li, H.; Ou, J. Strain sensing properties of cement-based sensors embedded at various stress zones in a bending concrete beam. Sens. Actuators A Phys. 2011, 167, 581–587. [Google Scholar] [CrossRef]
- Yoo, D.-Y.; Kim, S.; Lee, S.H. Self-sensing capability of ultra-high-performance concrete containing steel fibers and carbon nanotubes under tension. Sens. Actuators A Phys. 2018, 276, 125–136. [Google Scholar] [CrossRef]
- Han, B.; Wang, Y.; Ding, S.; Yu, X.; Zhang, L.; Li, Z.; Ou, J. Self-sensing cementitious composites incorporated with botryoid hybrid nano-carbon materials for smart infrastructures. J. Intell. Mater. Syst. Struct. 2017, 28, 699–727. [Google Scholar] [CrossRef]
- Sun, M.Q.; Liew, R.J.Y.; Zhang, M.H.; Li, W. Development of cement-based strain sensor for health monitoring of ultra high strength concrete. Constr. Build. Mater. 2014, 65, 630–637. [Google Scholar] [CrossRef]
- Ding, S.; Ruan, Y.; Yu, X.; Han, B.; Ni, Y.Q. Self-monitoring of smart concrete column incorporating CNT/NCB composite fillers modified cementitious sensors. Constr. Build. Mater. 2019, 201, 127–137. [Google Scholar] [CrossRef]
- Han, B.; Ou, J. Embedded piezoresistive cement-based stress/strain sensor. Sens. Actuators A Phys. 2007, 138, 294–298. [Google Scholar] [CrossRef]
- Galao, O.; Baeza, F.J.; Zornoza, E.; Garcés, P. Strain and damage sensing properties on multifunctional cement composites with CNF admixture. Cem. Concr. Compos. 2014, 46, 90–98. [Google Scholar] [CrossRef] [Green Version]
- Yoo, D.Y.; You, I.; Youn, H.; Lee, S.J. Electrical and piezoresistive properties of cement composites with carbon nanomaterials. J. Compos. Mater. 2018, 52, 3325–3340. [Google Scholar] [CrossRef]
- Wang, W.; Dai, H.; Wu, S. Mechanical behavior and electrical property of CFRC-strengthened RC beams under fatigue and monotonic loading. Mater. Sci. Eng. A 2008, 479, 191–196. [Google Scholar] [CrossRef]
- Han, B.; Ding, S.; Yu, X. Intrinsic self-sensing concrete and structures: A review. Meas. J. Int. Meas. Confed. 2015, 59, 110–128. [Google Scholar] [CrossRef]
- Konsta-Gdoutos, M.S.; Aza, C.A. Self sensing carbon nanotube (CNT) and nanofiber (CNF) cementitious composites for real time damage assessment in smart structures. Cem. Concr. Compos. 2014, 53, 162–169. [Google Scholar] [CrossRef]
- Yoo, D.Y.; You, I.; Lee, S.J. Electrical and piezoresistive sensing capacities of cement paste with multi-walled carbon nanotubes. Arch. Civ. Mech. Eng. 2018, 18, 371–384. [Google Scholar] [CrossRef]
- Beer, F.P.; Johnston, E.R.J.; DeWolf, J.T.; Mazurek, D.F. Mechanics of Materials, 5th ed.; McGraw-Hill: New York, NY, USA, 2009; ISBN 978–0–07–352938–7. [Google Scholar]
- Sun, S.; Ding, S.; Han, B.; Dong, S.; Yu, X.; Zhou, D.; Ou, J. Multi-layer graphene-engineered cementitious composites with multifunctionality/intelligence. Compos. Part B Eng. 2017, 129, 221–232. [Google Scholar] [CrossRef]
- Fu, X.; Chung, D.D.L. Self-monitoring of fatigue damage in carbon fiber reinforced cement. Cem. Concr. Res. 1996, 26, 15–20. [Google Scholar] [CrossRef]
- Wen, S.; Chung, D.D.L. Uniaxial compression in carbon fiber reinforced cement, sensed by electrical resistivity measurement in longitudinal and transverse directions. Cem. Concr. Res. 2000, 30, 1289–1294. [Google Scholar] [CrossRef]
- Yoo, D.; You, I.; Zi, G.; Lee, S. Effects of carbon nanomaterial type and amount on self-sensing capacity of cement paste. Measurement 2019, 134, 750–761. [Google Scholar] [CrossRef]
- Materazzi, A.L.; Ubertini, F.; D’Alessandro, A. Carbon nanotube cement-based transducers for dynamic sensing of strain. Cem. Concr. Compos. 2013, 37, 2–11. [Google Scholar] [CrossRef]
- D’Alessandro, A.; Rallini, M.; Ubertini, F.; Materazzi, A.L.; Kenny, J.M. Investigations on scalable fabrication procedures for self-sensing carbon nanotube cement-matrix composites for SHM applications. Cem. Concr. Compos. 2016, 65, 200–213. [Google Scholar] [CrossRef]
- Baeza, F.J.; Galao, O.; Zornoza, E.; Garcés, P. Multifunctional Cement Composites Strain and Damage Sensors Applied on Reinforced Concrete (RC) Structural Elements. Materials 2013, 6, 841–855. [Google Scholar] [CrossRef] [PubMed] [Green Version]
- Zhang, L.; Ding, S.; Han, B.; Yu, X.; Ni, Y.Q. Effect of water content on the piezoresistive property of smart cement-based materials with carbon nanotube/nanocarbon black composite filler. Compos. Part A Appl. Sci. Manuf. 2019, 119, 8–20. [Google Scholar] [CrossRef]
- Demircilioğlu, E.; Teomete, E.; Schlangen, E.; Baeza, F.J. Temperature and moisture effects on electrical resistance and strain sensitivity of smart concrete. Constr. Build. Mater. 2019, 224, 420–427. [Google Scholar] [CrossRef]
- Hong, Y.; Li, Z.; Qiao, G.; Ou, J.; Cheng, W. Pressure sensitivity of multiscale carbon-admixtures–enhanced cement-based composites. Nanomater. Nanotechnol. 2018, 8, 1–8. [Google Scholar] [CrossRef] [Green Version]
- Chen, S.; Li, Y.; Yan, D.; Wu, C.; Leventis, N. Piezoresistive geopolymer enabled by crack-surface coating. Mater. Lett. 2019, 255, 1–4. [Google Scholar] [CrossRef]
- Rovnaník, P.; Šimonová, H.; Topolář, L.; Keršner, Z. Mechanical Fracture Properties of Alkali-Activated Slag with Graphite Filler. Procedia Eng. 2017, 190, 43–48. [Google Scholar] [CrossRef]
- Padma Kumar, P.; Yashonath, S. Ionic Conduction in the Solid State. ChemInform 2006, 37, 135–154. [Google Scholar] [CrossRef]
- Bernal, S.A.; Rose, V.; Provis, J.L. The fate of iron in blast furnace slag particles during alkali-activation. Mater. Chem. Phys. 2014, 146, 1–5. [Google Scholar] [CrossRef]
- Peys, A.; Douvalis, A.P.; Hallet, V.; Rahier, H.; Blanpain, B.; Pontikes, Y. Inorganic Polymers from CaO-FeOx-SiO2 Slag: The Start of Oxidation of Fe and the Formation of a Mixed Valence Binder. Front. Mater. 2019, 6, 1–10. [Google Scholar] [CrossRef]
- Machiels, L.; Arnout, L.; Jones, P.T.; Blanpain, B.; Pontikes, Y. Inorganic polymer cement from fe-silicate glasses: Varying the activating solution to glass ratio. Waste Biomass Valorization 2014, 5, 411–428. [Google Scholar] [CrossRef] [Green Version]
- Peys, A.; White, C.E.; Olds, D.; Rahier, H.; Blanpain, B.; Pontikes, Y. Molecular structure of CaO–FeOx–SiO2 glassy slags and resultant inorganic polymer binders. J. Am. Ceram. Soc. 2018, 101, 5846–5857. [Google Scholar] [CrossRef]
- Dehghanpour, H.; Yilmaz, K. Investigation of specimen size, geometry and temperature effects on resistivity of electrically conductive concretes. Constr. Build. Mater. 2020, 250, 118864. [Google Scholar] [CrossRef]
- Chang, C.; Song, G.; Gao, D.; Mo, Y.L. Temperature and mixing effects on electrical resistivity of carbon fiber enhanced concrete. Smart Mater. Struct. 2013, 22, 35021. [Google Scholar] [CrossRef]
- Lee, S.Y.; Le, H.V.; Kim, D.J. Self-stress sensing smart concrete containing fine steel slag aggregates and steel fibers under high compressive stress. Constr. Build. Mater. 2019, 220, 149–160. [Google Scholar] [CrossRef]
- Teomete, E. The effect of temperature and moisture on electrical resistance, strain sensitivity and crack sensitivity of steel fiber reinforced smart cement composite. Smart Mater. Struct. 2016, 25, 75024. [Google Scholar] [CrossRef]
- Gulicovski, J.; Nenadovic, S.; Kljajevic, L.; Mirkovic, M.; Nišavic, M.; Kragovic, M.; Stojmenovic, M. Geopolymer/CeO2 as Solid Electrolyte for IT-SOFC. Polymers 2020, 12, 248. [Google Scholar] [CrossRef] [Green Version]
- Lo Monte, F.; Felicetti, R.; Miah, M.J. The influence of pore pressure on fracture behaviour of Normal-Strength and High-Performance Concretes at high temperature. Cem. Concr. Compos. 2019, 104, 103388. [Google Scholar] [CrossRef]
- Perry, M.; Saafi, M.; Fusiek, G.; Niewczas, P. Geopolymeric thermal conductivity sensors for surface-mounting onto concrete structures. In Environment, Efficiency and Economic Challenges for Concrete; University of Dundee: Dundee, UK, 2016. [Google Scholar]
- Van Meurs, N. Temperature Dependence of the Conductivity of Electrolyte Solutions. Nature 1958, 182, 1532–1533. [Google Scholar] [CrossRef]
- Funke, K.; Banhatti, R.D. Ionic motion in materials with disordered structures. Solid State Ionics 2006, 177, 1551–1557. [Google Scholar] [CrossRef]
- Cai, J.; Tan, J.; Li, X. Thermoelectric behaviors of fly ash and metakaolin based geopolymer. Constr. Build. Mater. 2020, 237, 117757. [Google Scholar] [CrossRef]
- Brantervik, K.; Berg, A.; Niklasson, G.A.; Hedberg, B.; Nilsson, L.O. Percolation effects in the electrical conductivity of porous cement mortar. EPL Europhys. Lett. 1990, 13, 549–554. [Google Scholar] [CrossRef]
- Saleem, M.; Shameem, M.; Hussain, S.E.; Maslehuddin, M. Effect of moisture, chloride and sulphate contamination on the electrical resistivity of Portland cement concrete. Constr. Build. Mater. 1996, 10, 209–214. [Google Scholar] [CrossRef]
- Nguyen, A.Q.; Klysz, G.; Deby, F.; Balayssac, J.P. Evaluation of water content gradient using a new configuration of linear array four-point probe for electrical resistivity measurement. Cem. Concr. Compos. 2017, 83, 308–322. [Google Scholar] [CrossRef]
- Provis, J.L.; Palomo, A.; Shi, C. Advances in understanding alkali-activated materials. Cem. Concr. Res. 2015, 78, 110–125. [Google Scholar] [CrossRef]
Figure 1.
Self-sensing AAM substrates (a) metakaolin AAM with wound wires [55] (b) metakaolin AAM printed coating with stainless steel wires [27] (c) fly ash AAM with stainless steel wires [65].

Figure 2.
Equivalent circuit of AAM [65].
Figure 2.
Equivalent circuit of AAM [65].

Figure 3.
Electrode array for AAM sensing applications (a) serial arrangement (b) Van der Pauw arrangement.
Figure 3.
Electrode array for AAM sensing applications (a) serial arrangement (b) Van der Pauw arrangement.

Figure 4.
Diagram of typical response of AAM under (a) compression (b) tension; the x-axis represents the force, stress, or strain applied to the binder. The y-axis displays the fractional change in resistance (or impedance) in relation to the external factors applied.
Figure 4.
Diagram of typical response of AAM under (a) compression (b) tension; the x-axis represents the force, stress, or strain applied to the binder. The y-axis displays the fractional change in resistance (or impedance) in relation to the external factors applied.

Figure 5.
Fractional change in resistivity of slag AAM under monotonic compression for three filler contents, example adapted from [52].
Figure 5.
Fractional change in resistivity of slag AAM under monotonic compression for three filler contents, example adapted from [52].

Figure 6.
Fractional change in resistivity of slag AAM under cyclic flexural loading, example adapted from [51].
Figure 6.
Fractional change in resistivity of slag AAM under cyclic flexural loading, example adapted from [51].

Figure 7.
3D crystal structure of AAM and ion hopping of alkali metal under electric field, adapted from [24].
Figure 7.
3D crystal structure of AAM and ion hopping of alkali metal under electric field, adapted from [24].

Figure 8.
Self-sensing mechanism in AAM (a) AAM sensor under stress, (b) ion diffusion pathway in the matrix and energy landscape, (c) effect of the compressive stress on the activation energy and hopping distance d; adapted from [92].
Figure 8.
Self-sensing mechanism in AAM (a) AAM sensor under stress, (b) ion diffusion pathway in the matrix and energy landscape, (c) effect of the compressive stress on the activation energy and hopping distance d; adapted from [92].

Figure 9.
Fractional change in impedance-frequency response for 3D printed metakaolin AAM between 10–30 °C adapted from [27].
Figure 9.
Fractional change in impedance-frequency response for 3D printed metakaolin AAM between 10–30 °C adapted from [27].

Figure 10.
Normalized impedance response of metakaolin 3D printed AAM patch to temperature during four temperature cycles. Zmod is the modulus impedance at a given temperature and Zmod,0 the initial modulus impedance at 10 °C [27].
Figure 10.
Normalized impedance response of metakaolin 3D printed AAM patch to temperature during four temperature cycles. Zmod is the modulus impedance at a given temperature and Zmod,0 the initial modulus impedance at 10 °C [27].

Figure 11.
Characterization of temperature sensing response for OPC and AAM binders. M refers to the reported electrical measurand (resistance, resistivity or impedance) and M0 the value at 20 °C.
Figure 11.
Characterization of temperature sensing response for OPC and AAM binders. M refers to the reported electrical measurand (resistance, resistivity or impedance) and M0 the value at 20 °C.

Figure 12.
A 3D calibration curve for a fly ash AAM, showing sensor response to both moisture and temperature. Here, dryness is the inverse of moisture content [65].
Figure 12.
A 3D calibration curve for a fly ash AAM, showing sensor response to both moisture and temperature. Here, dryness is the inverse of moisture content [65].


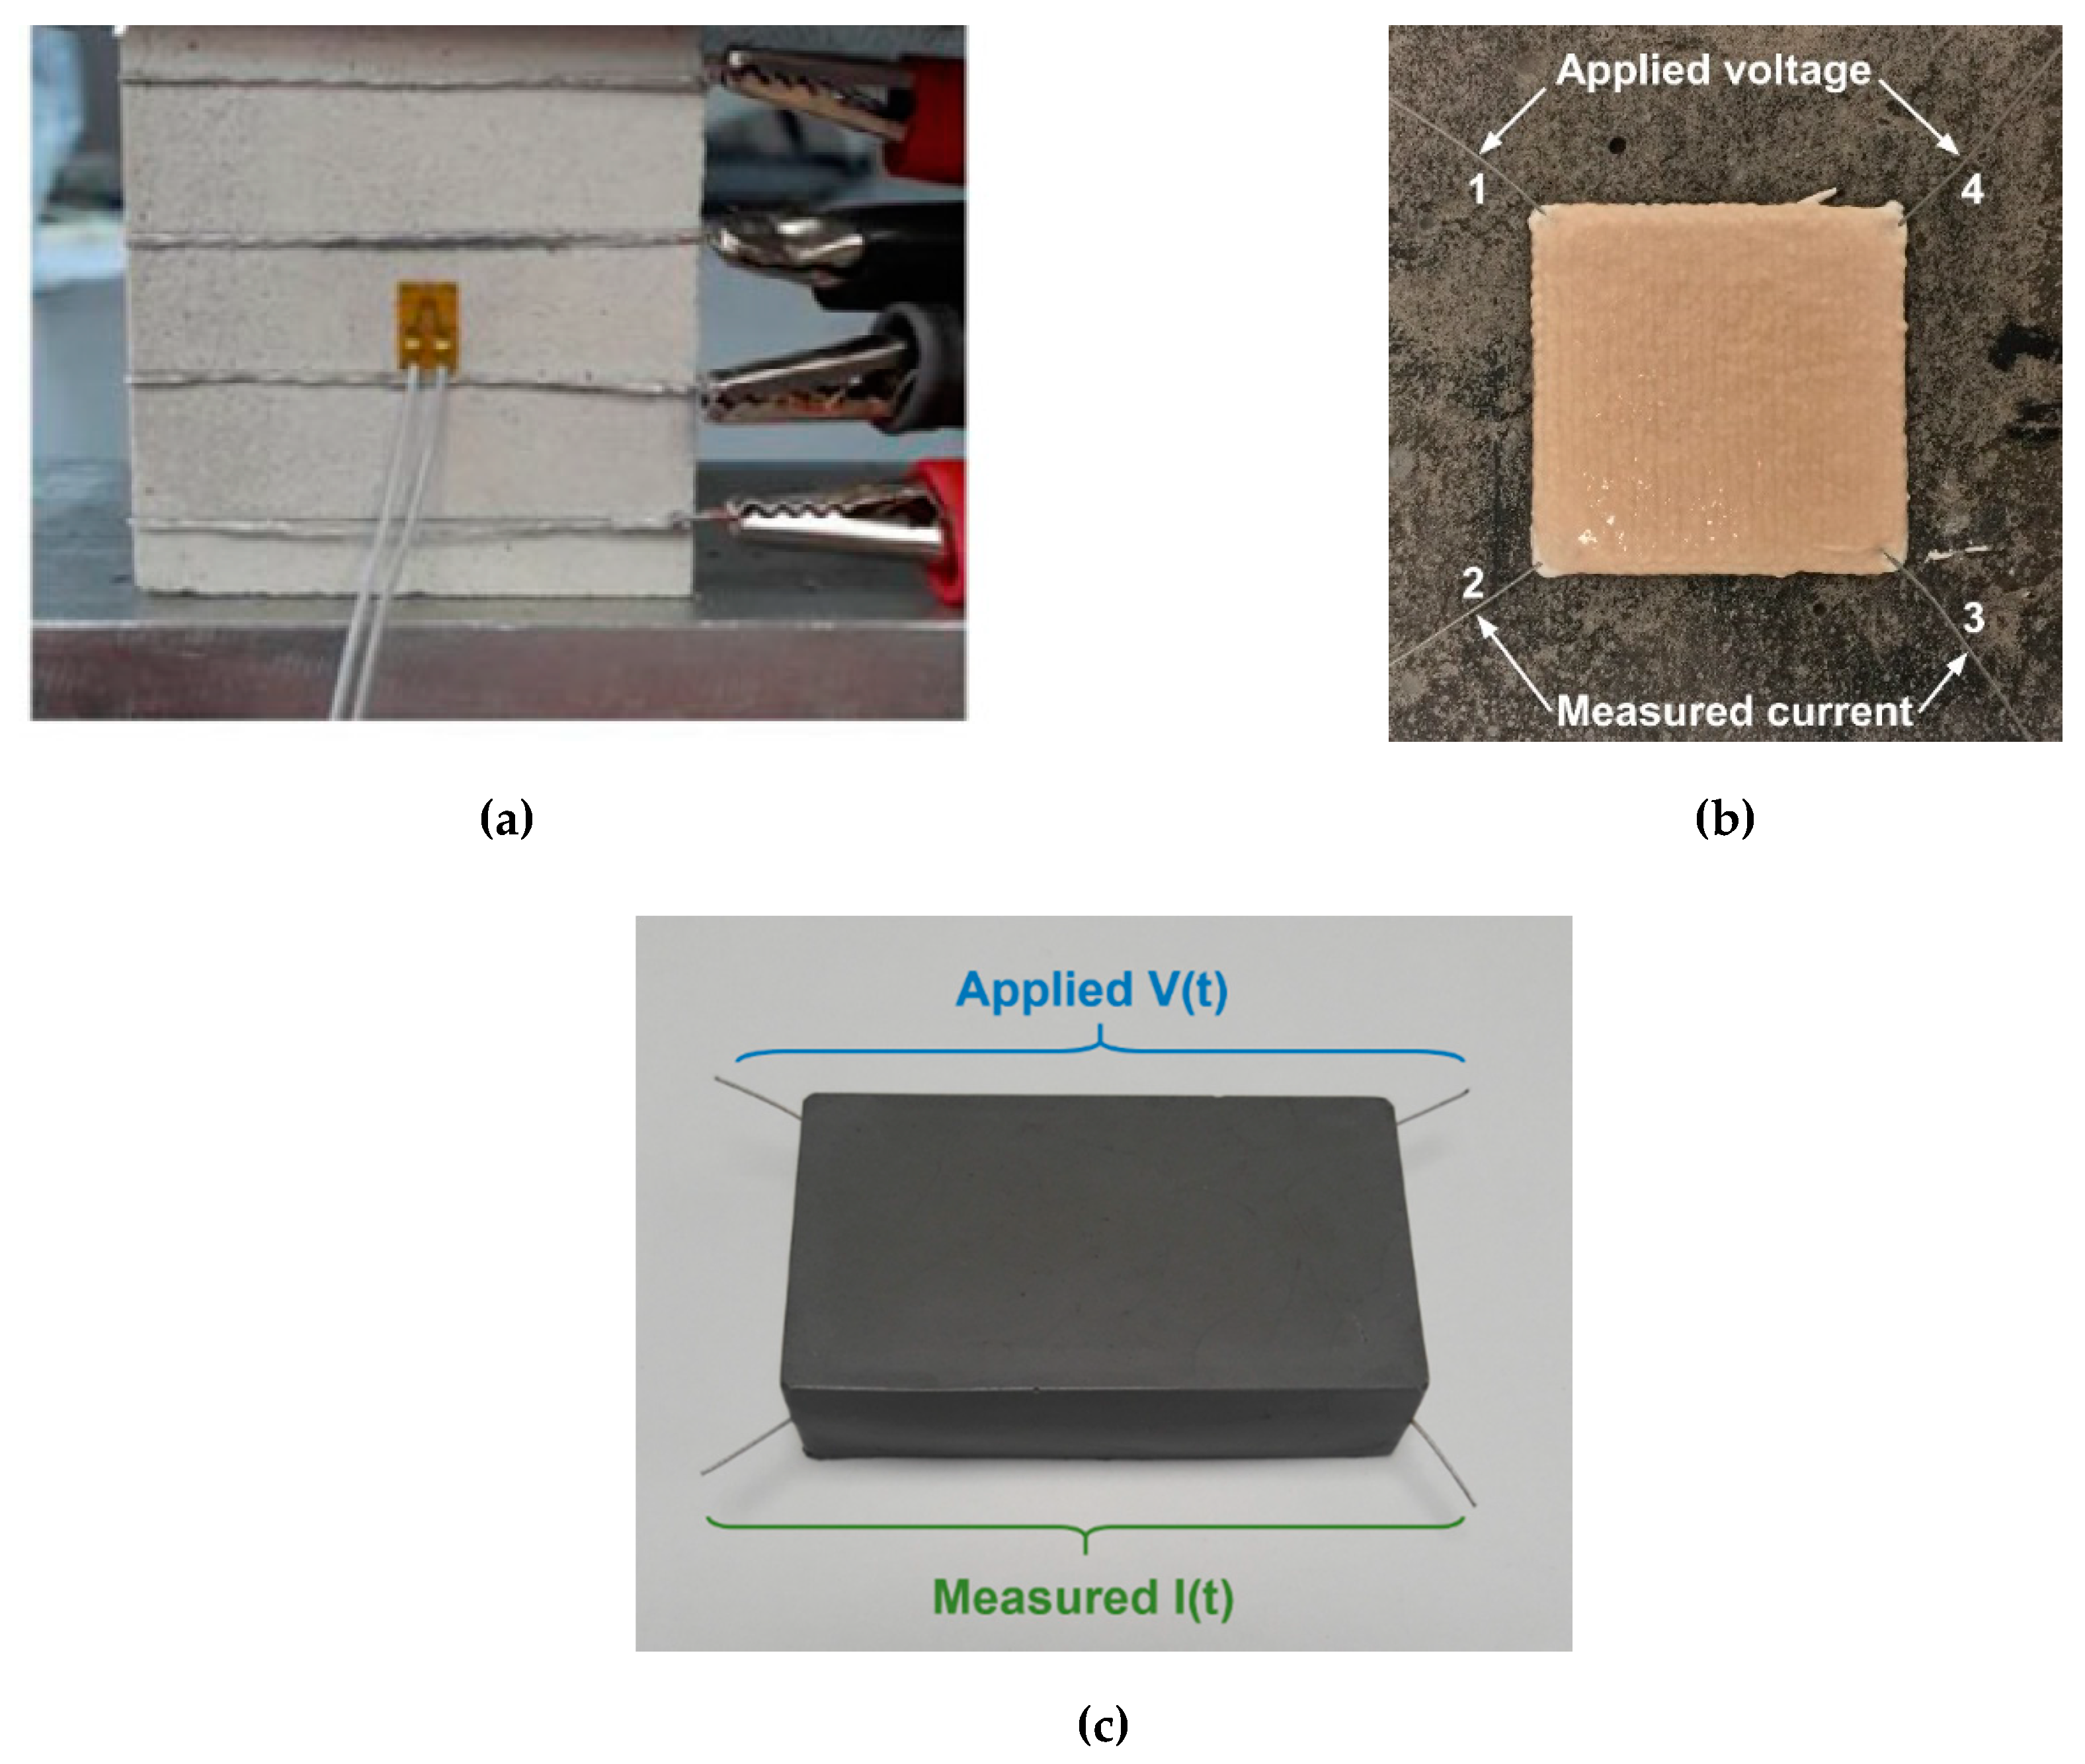
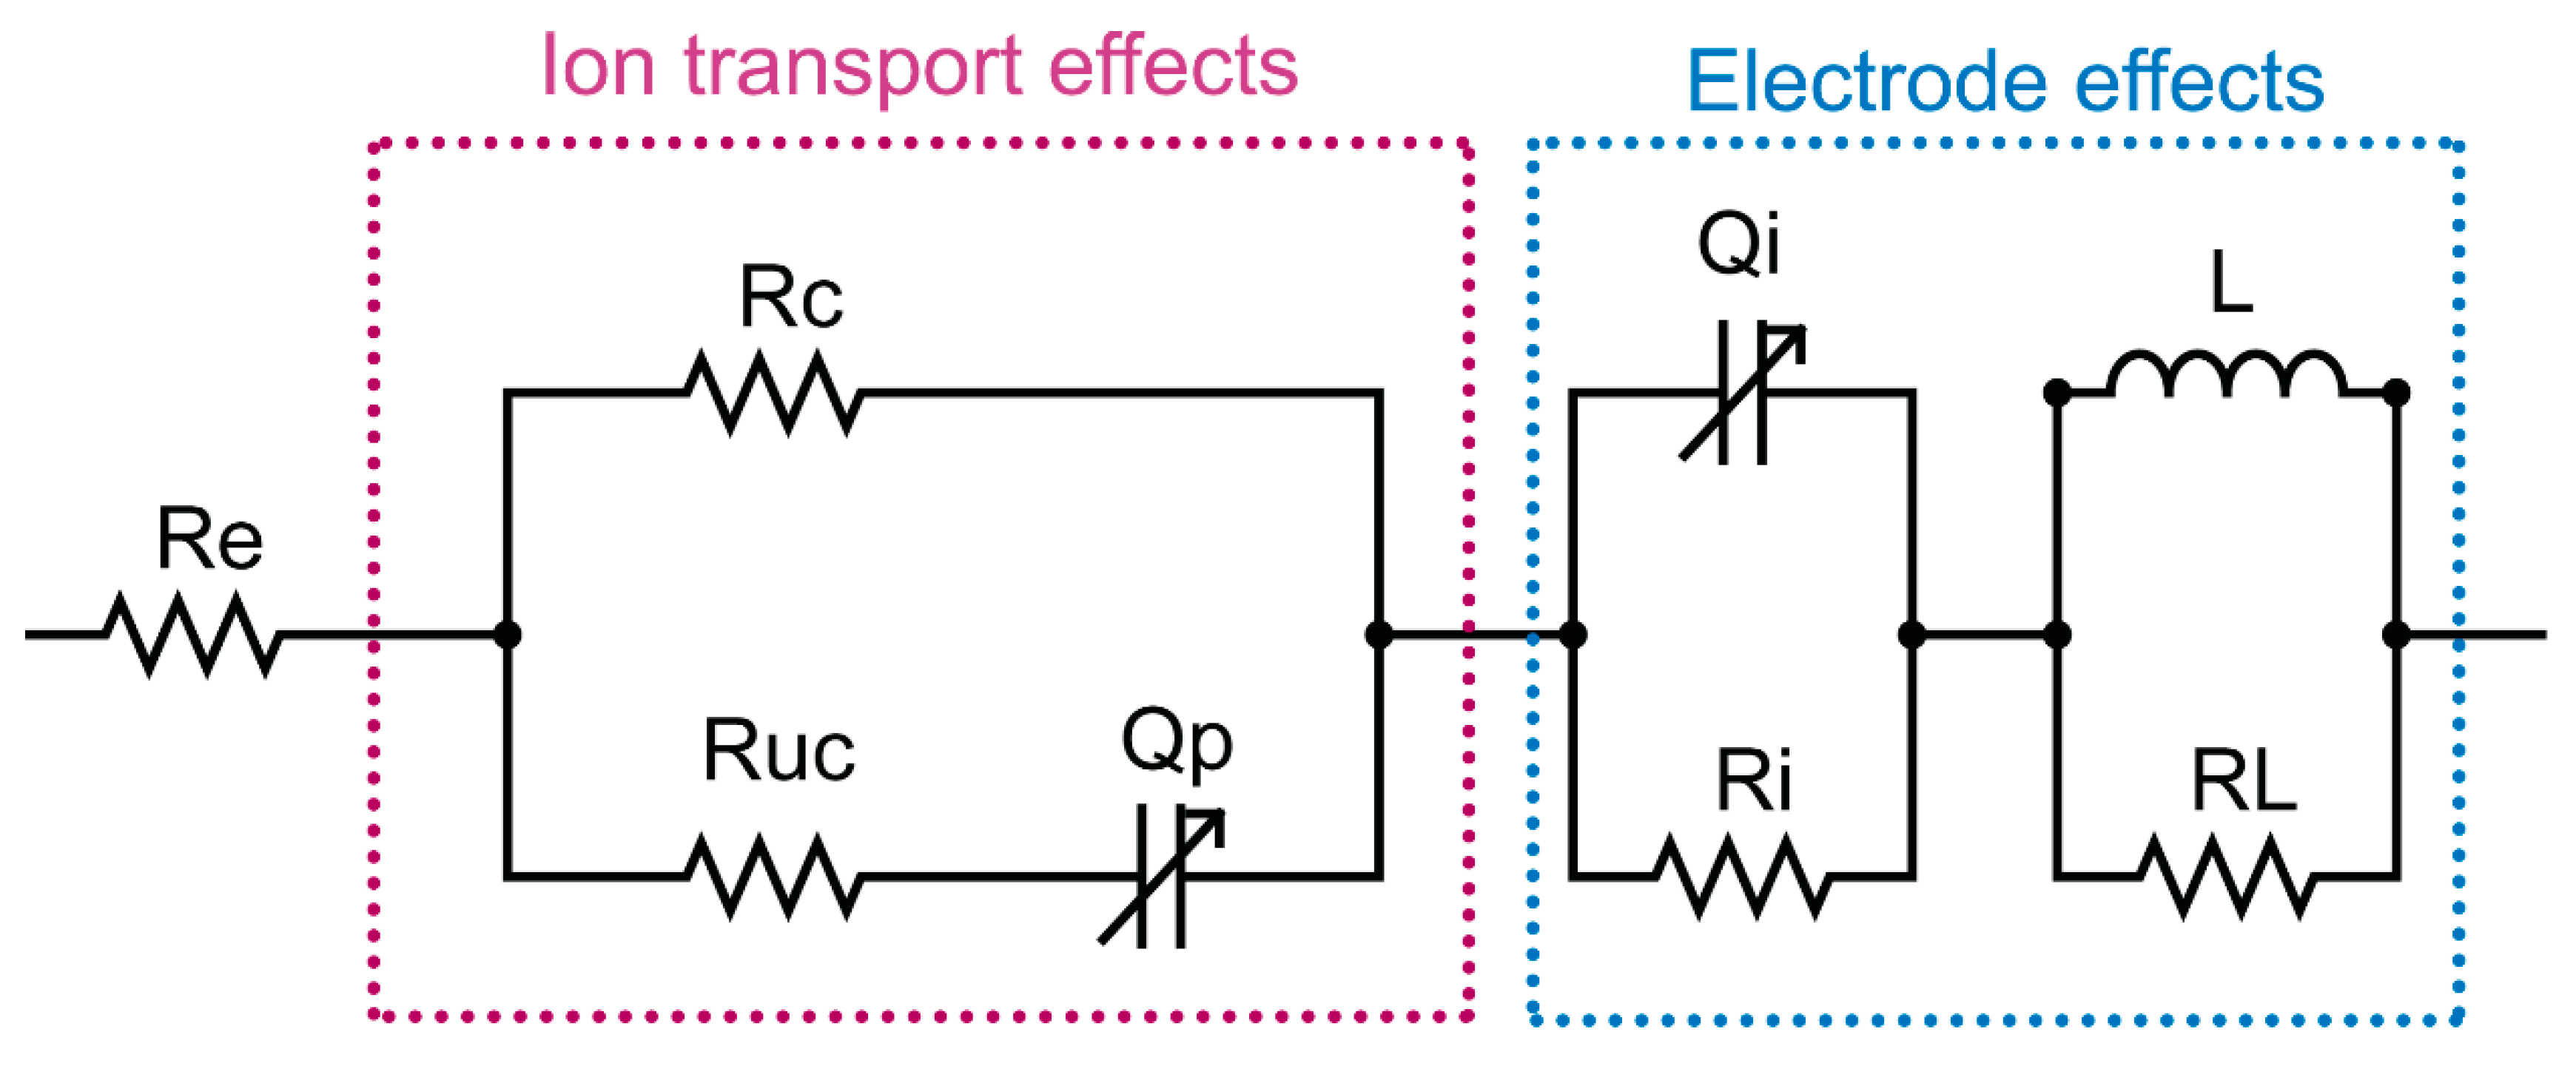
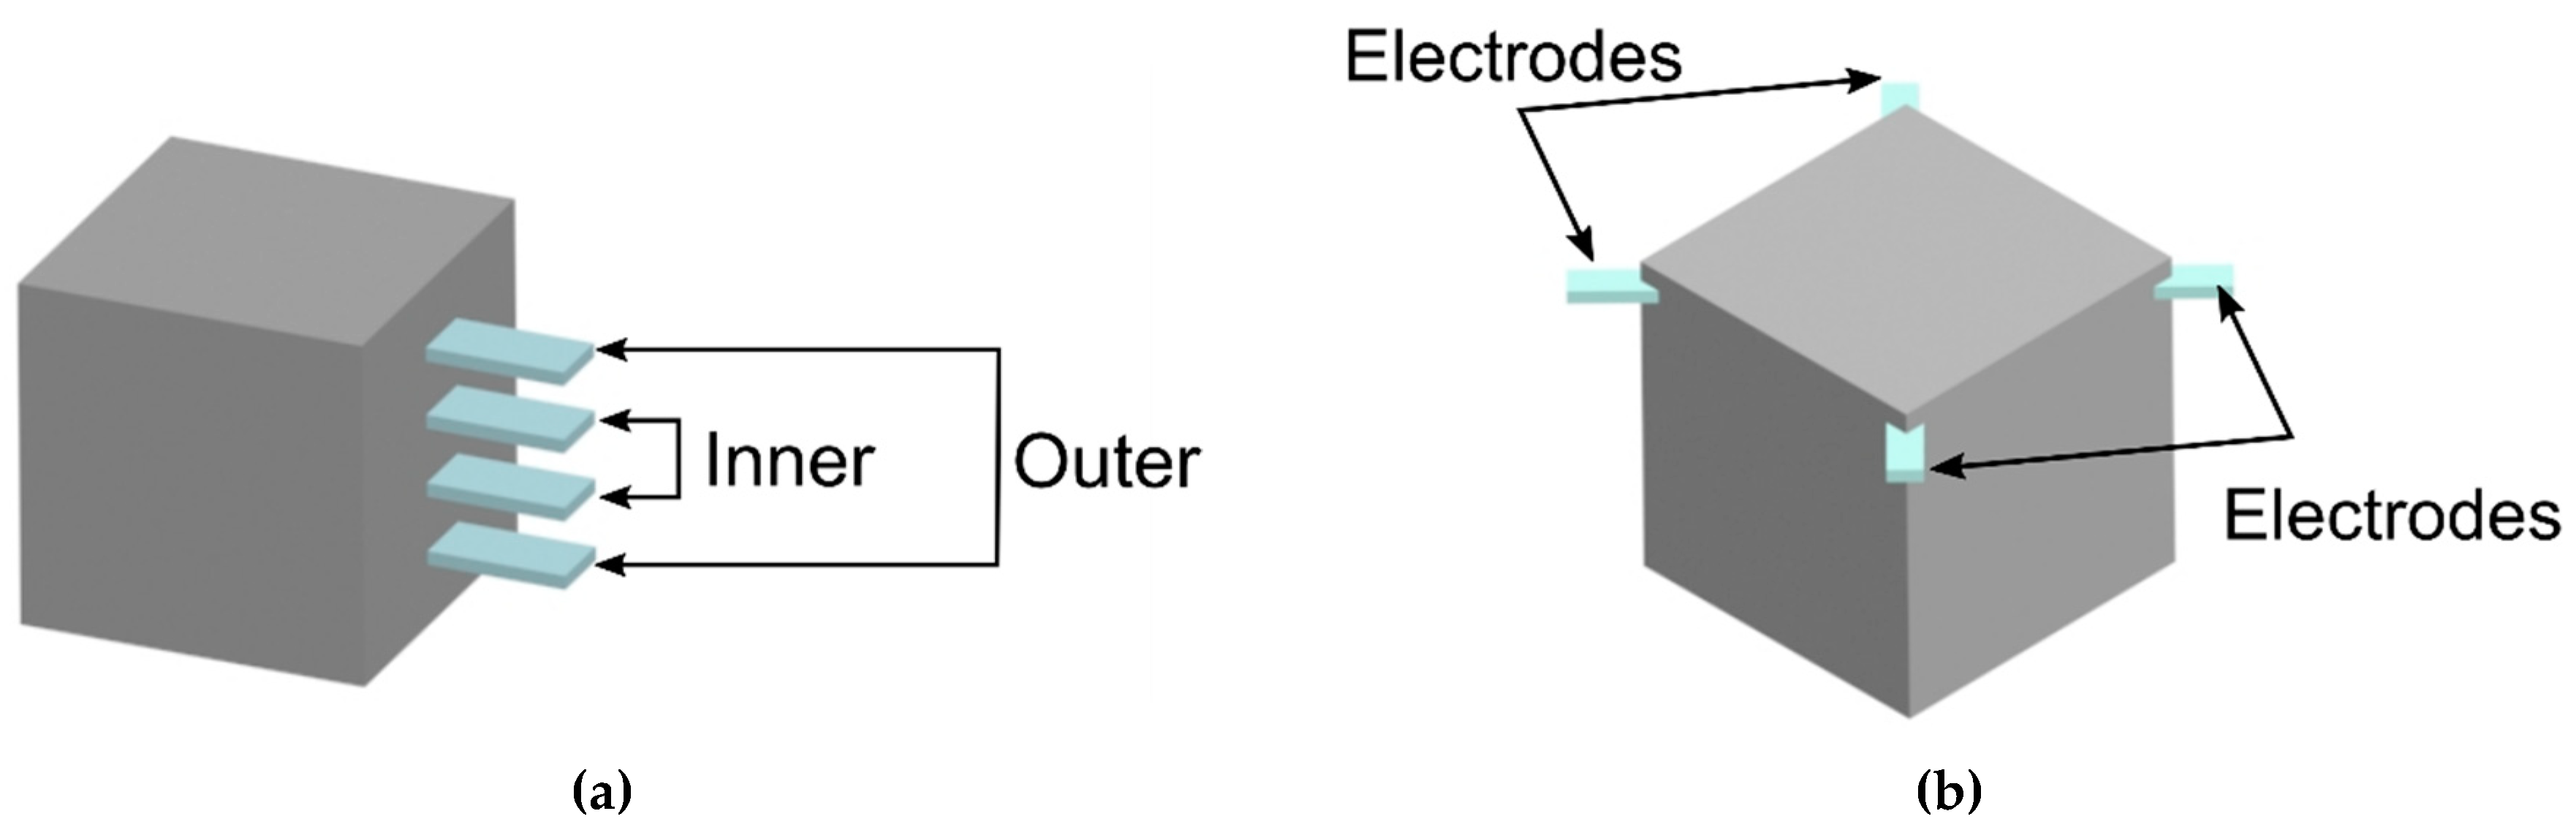
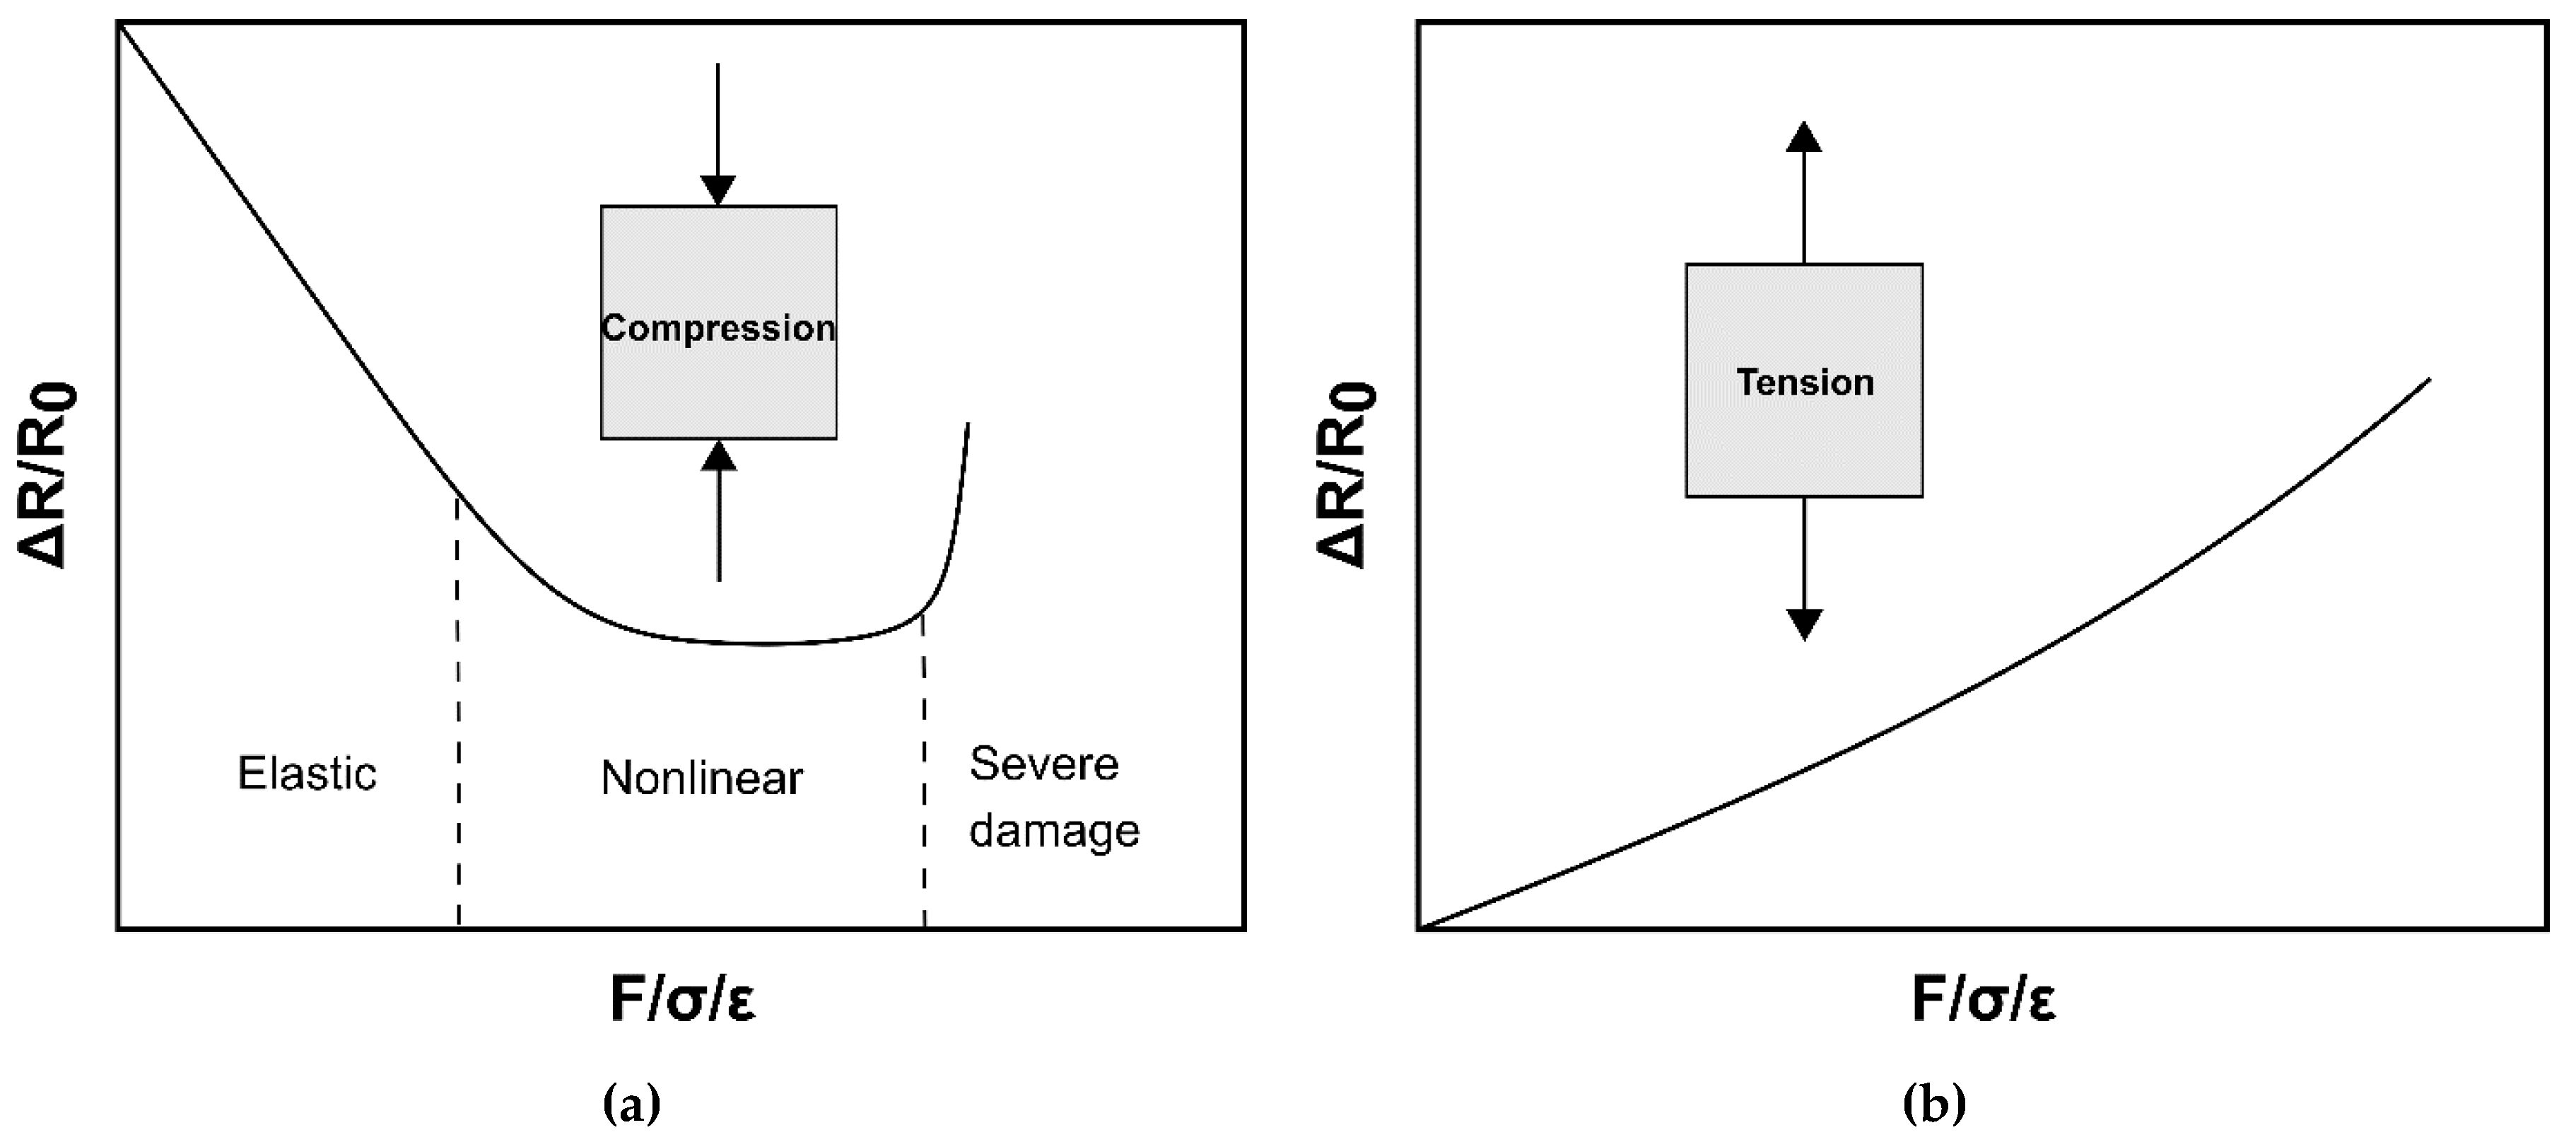
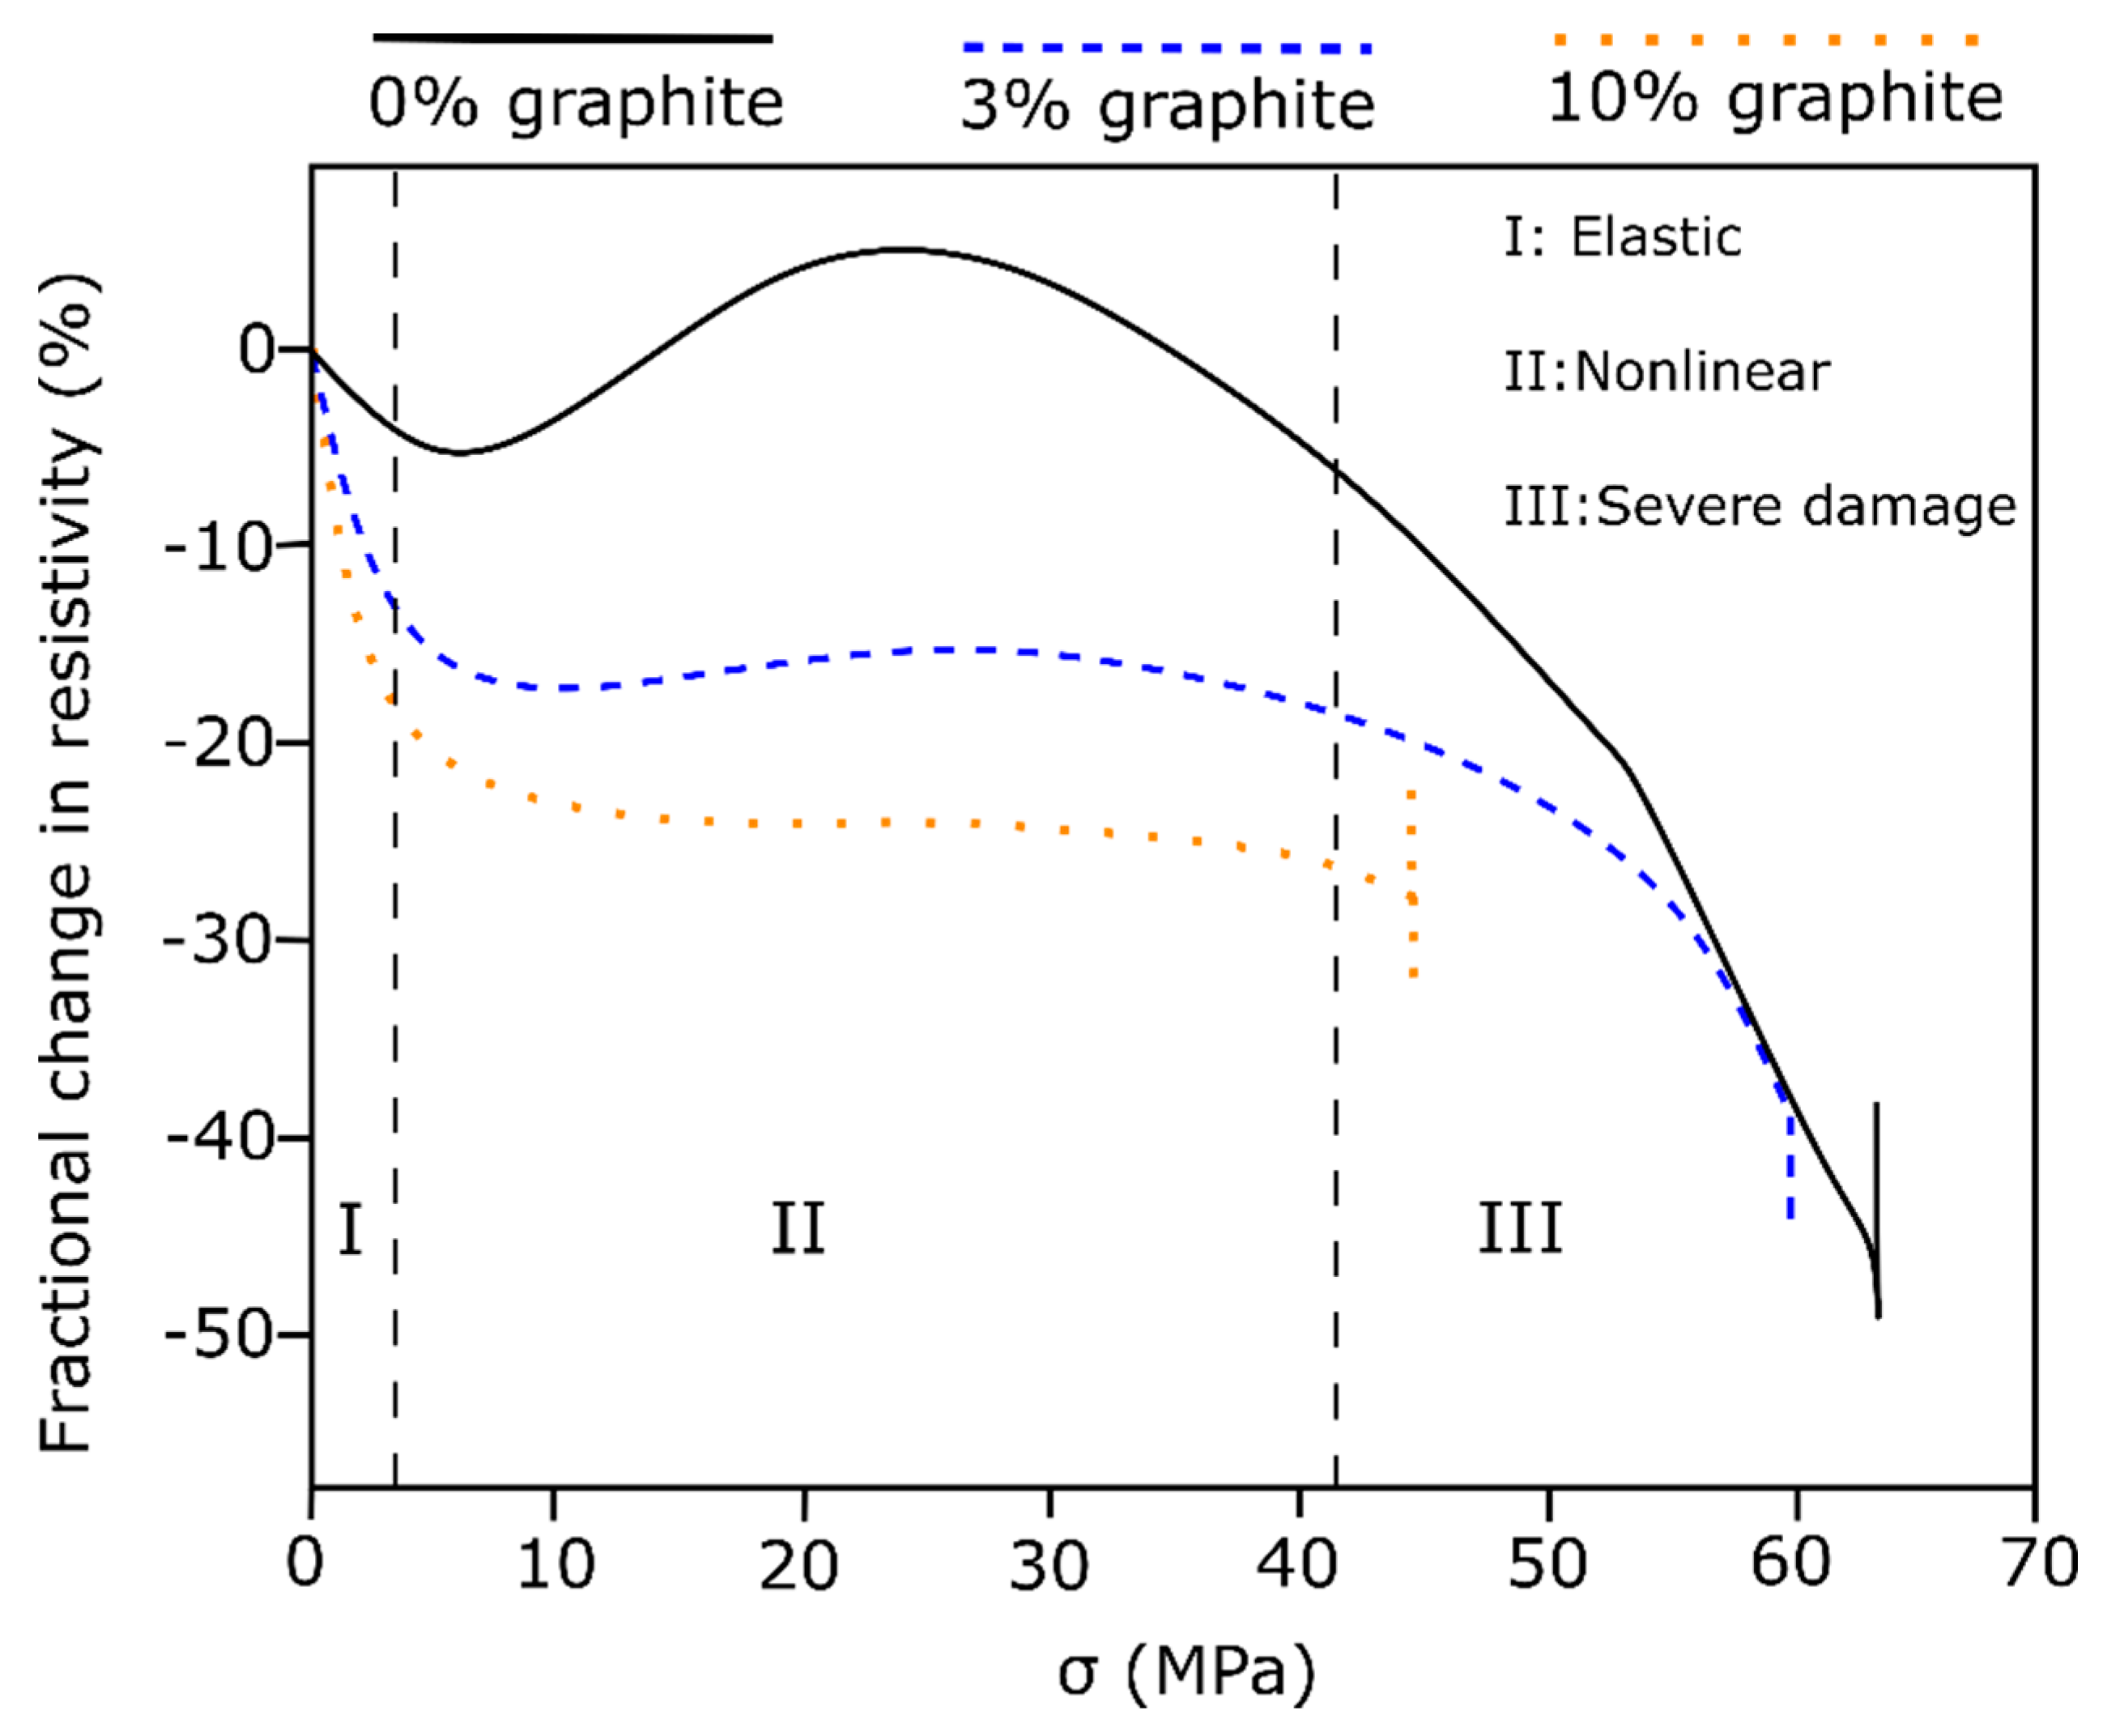
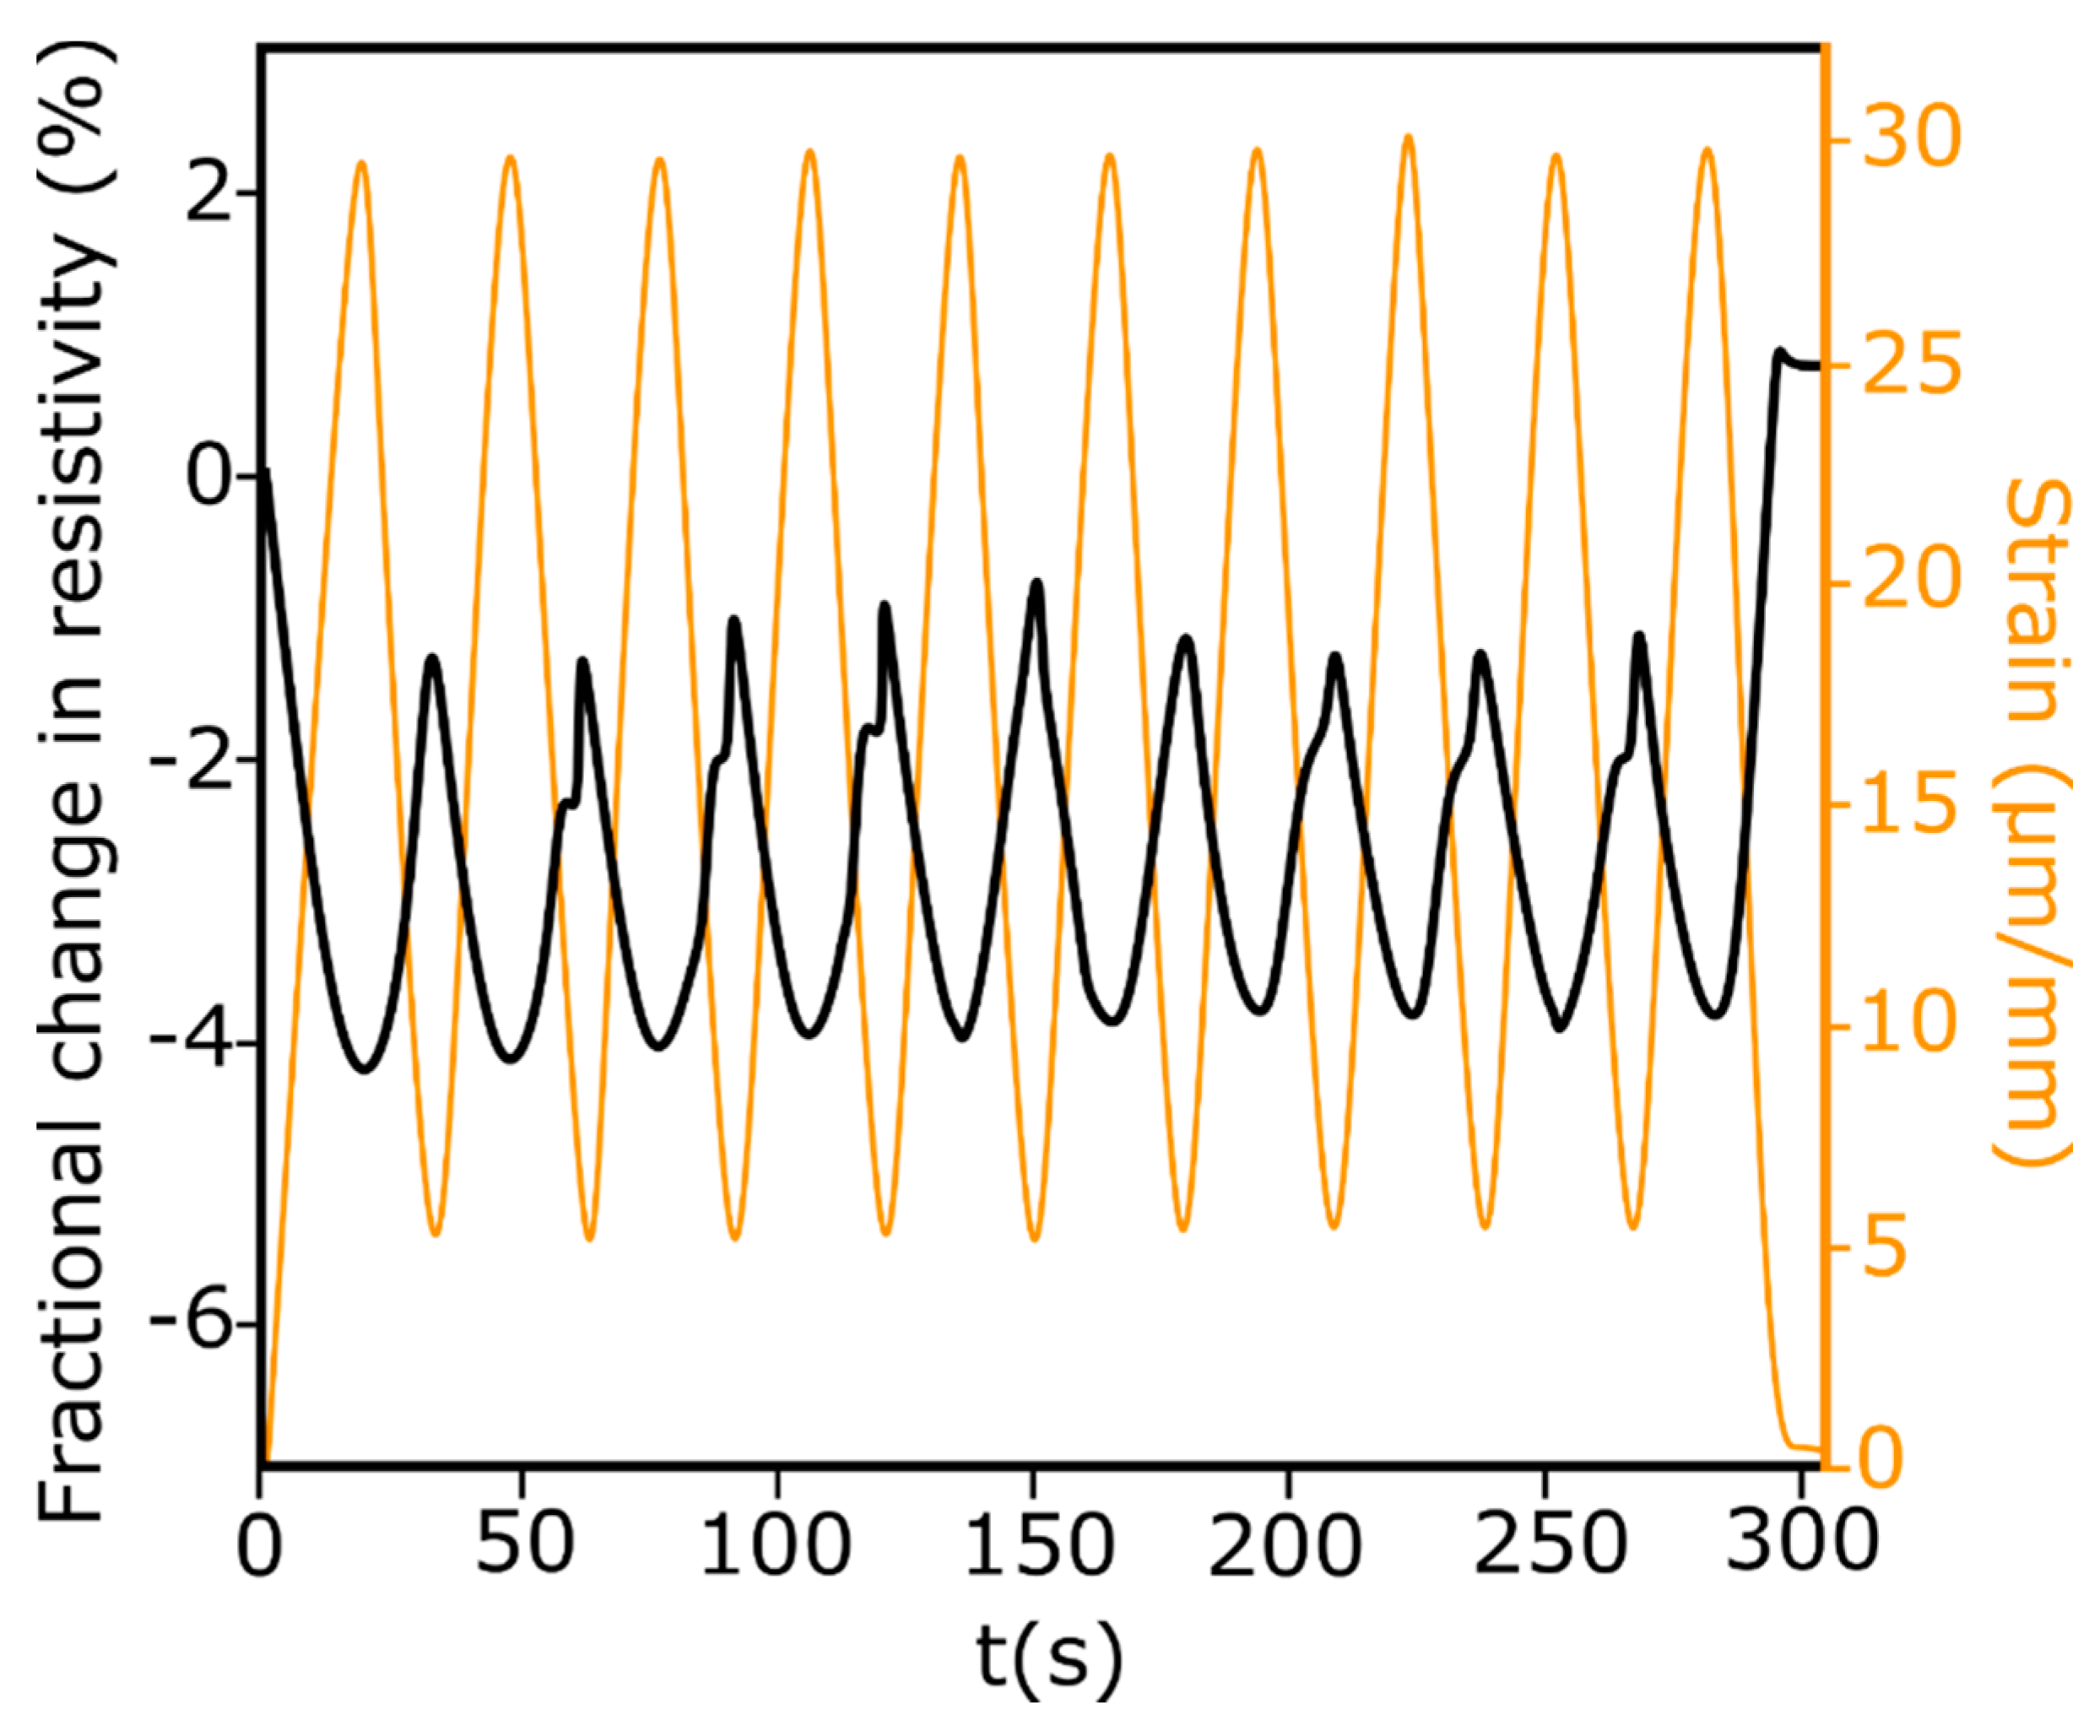
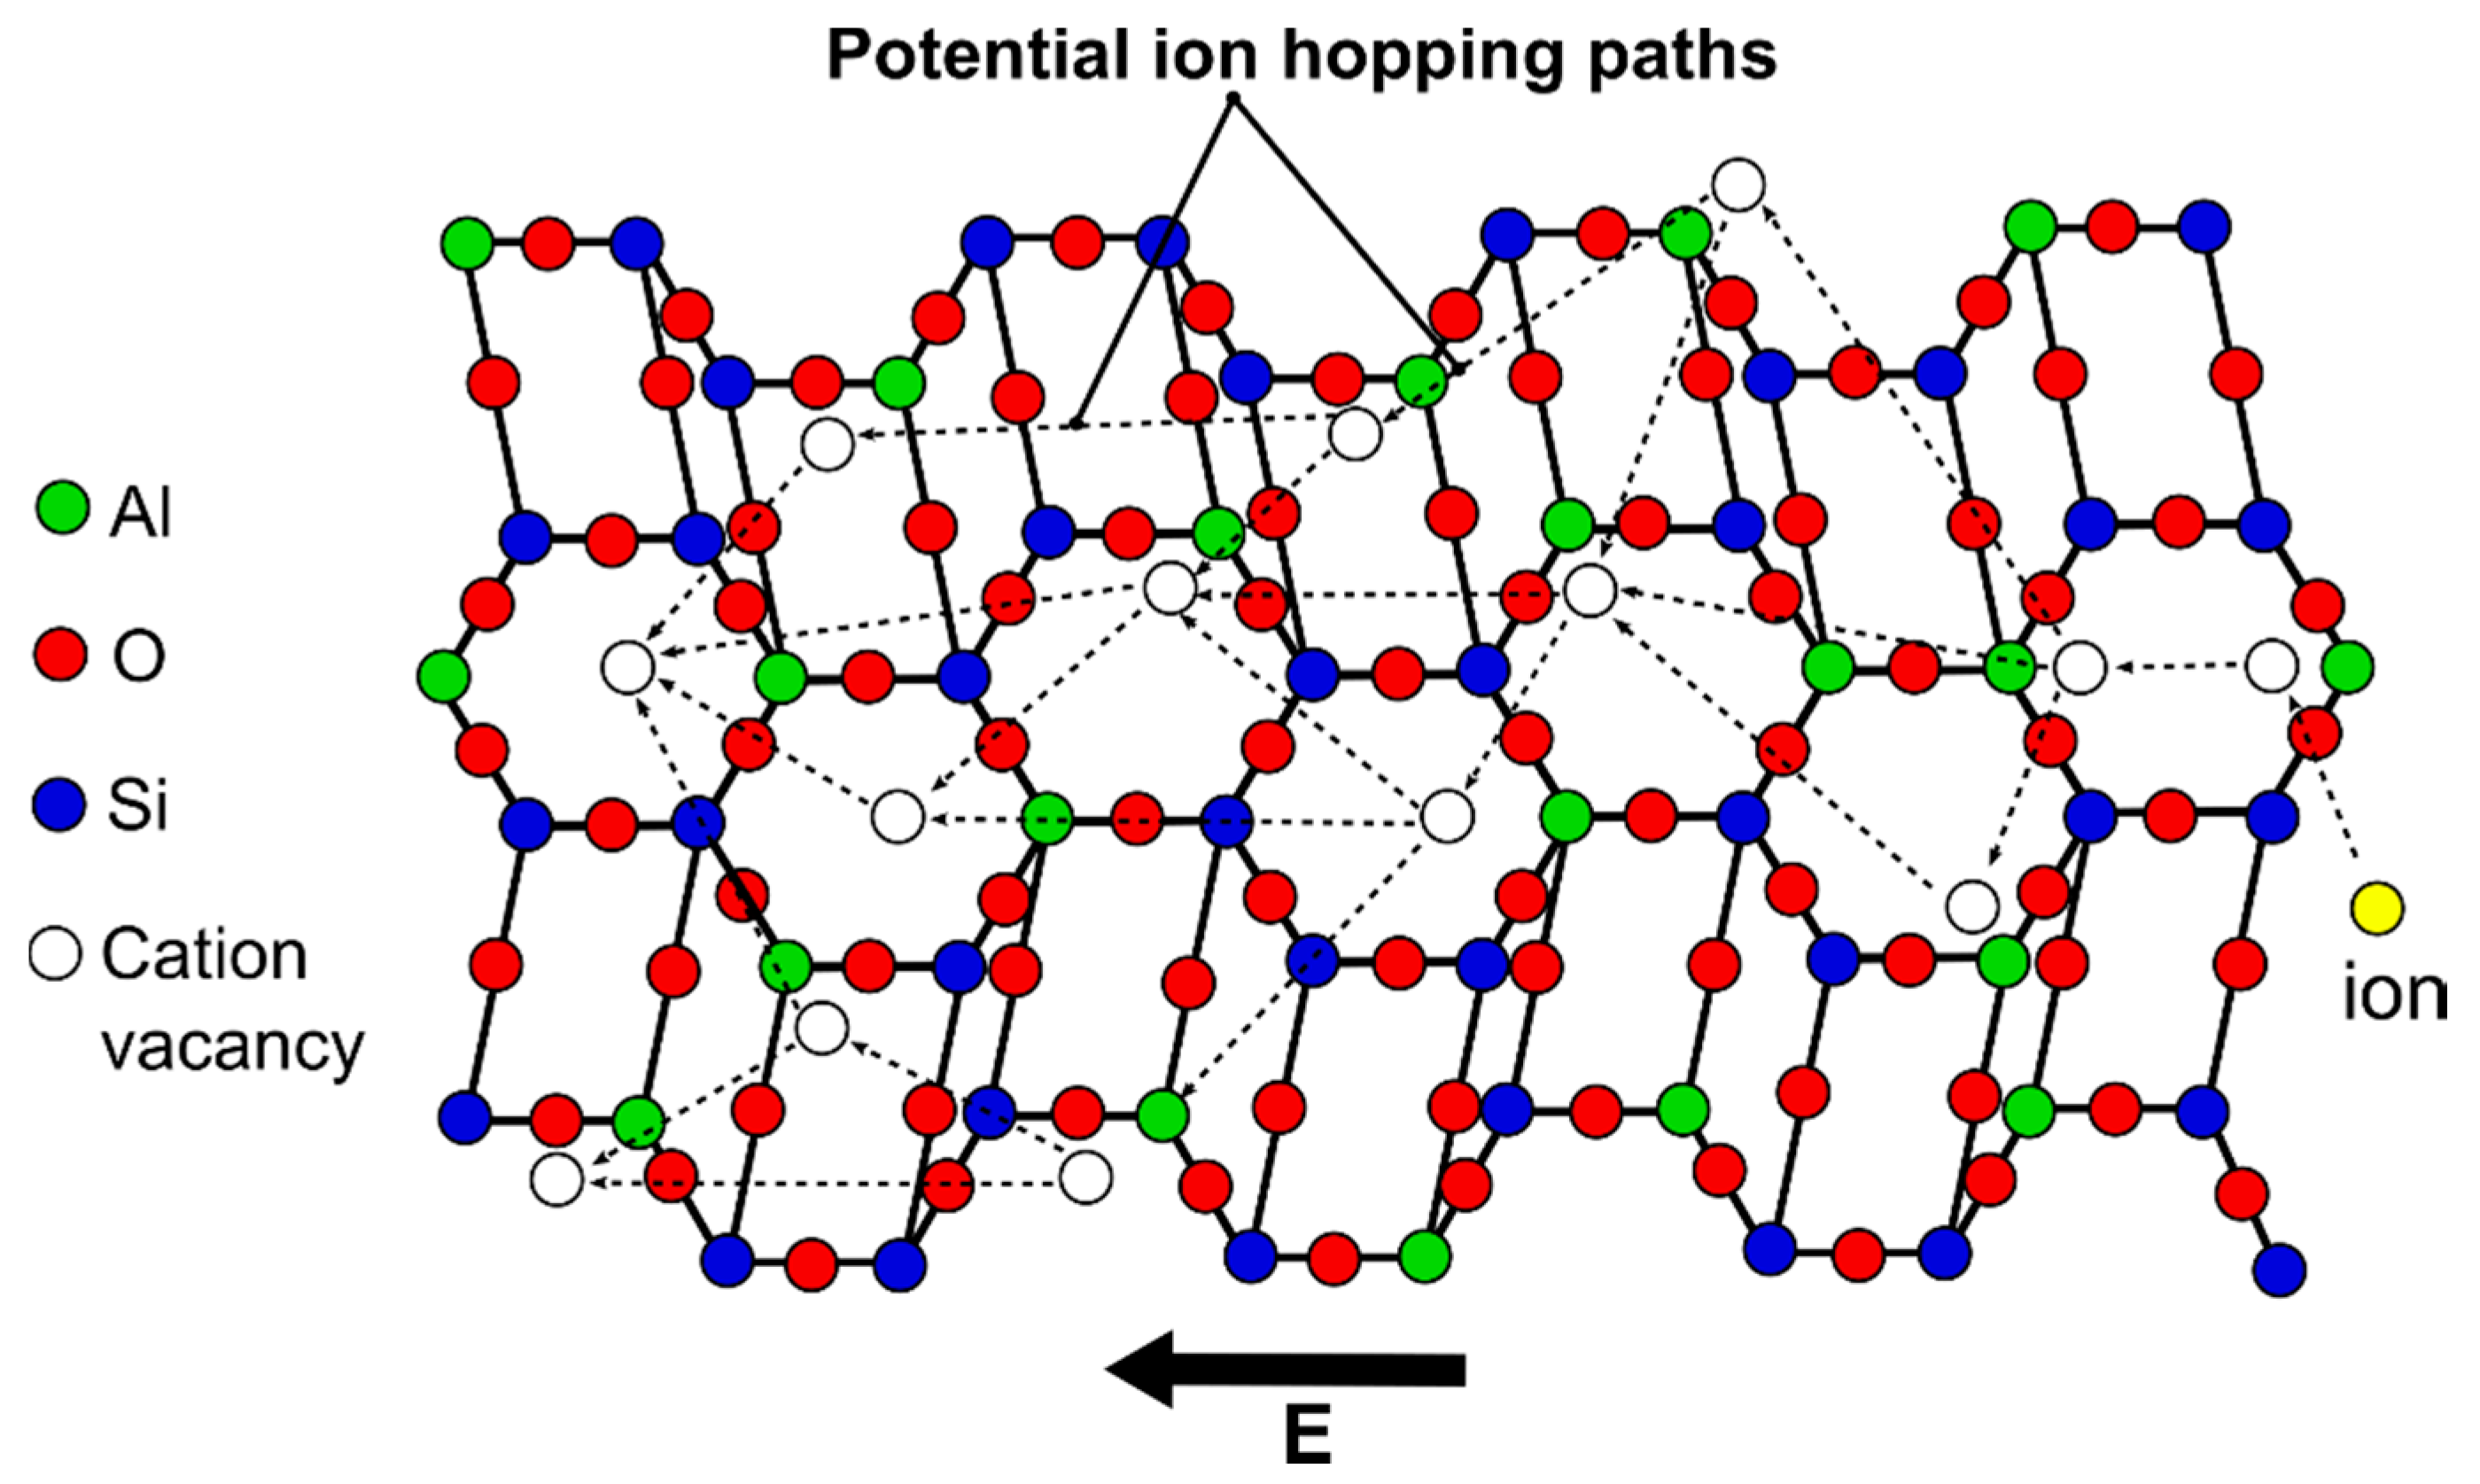
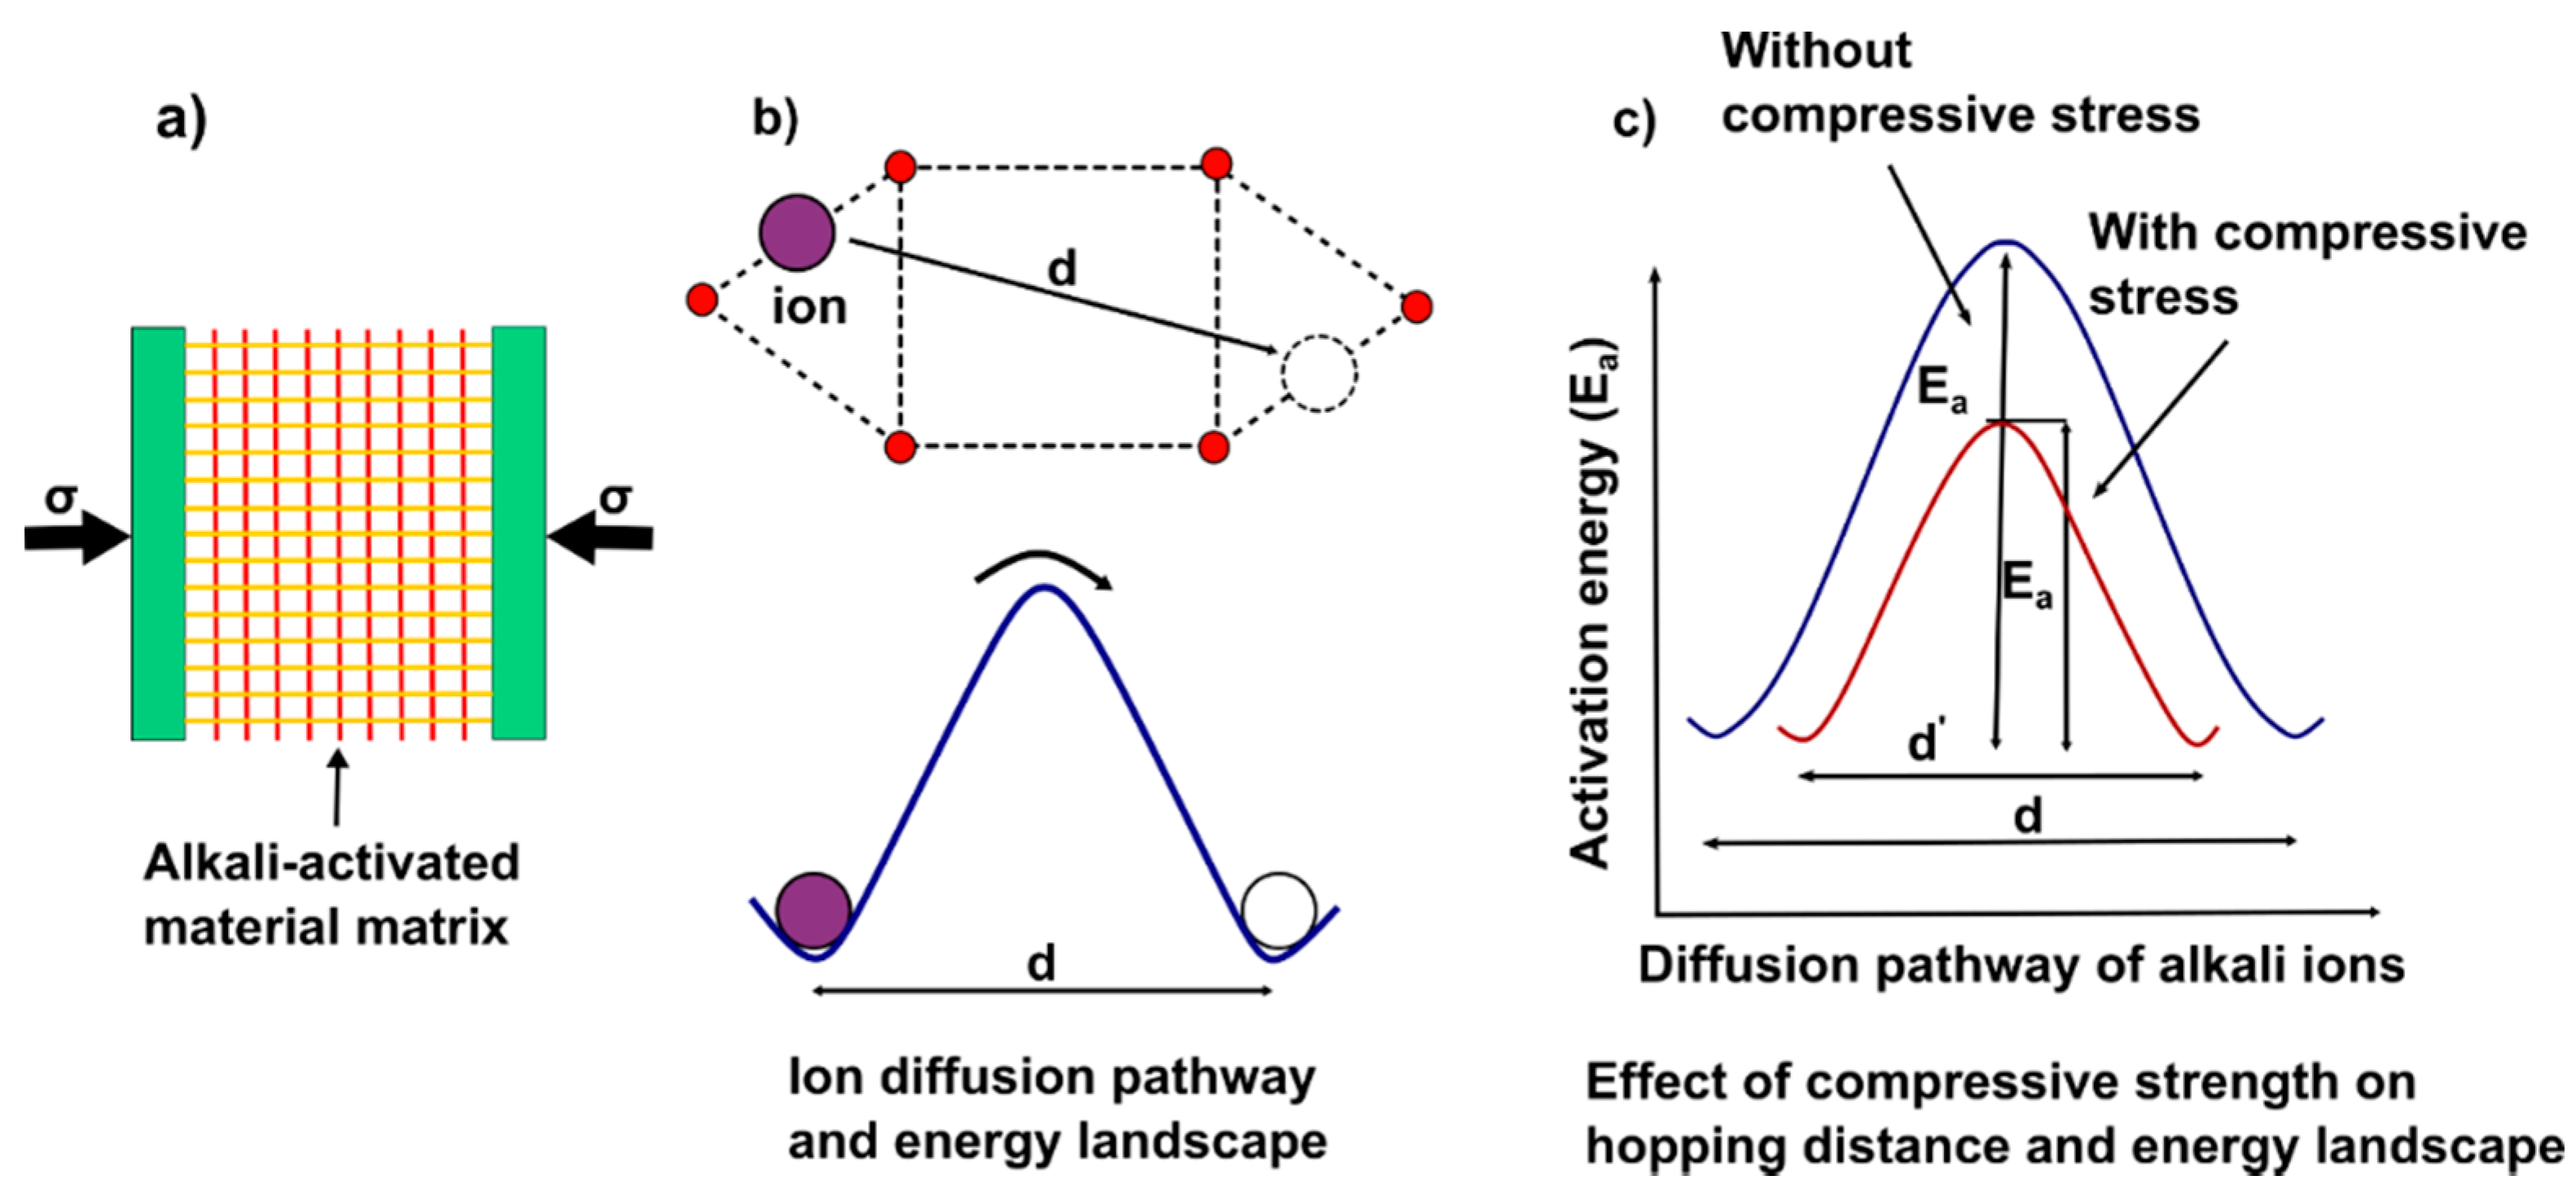
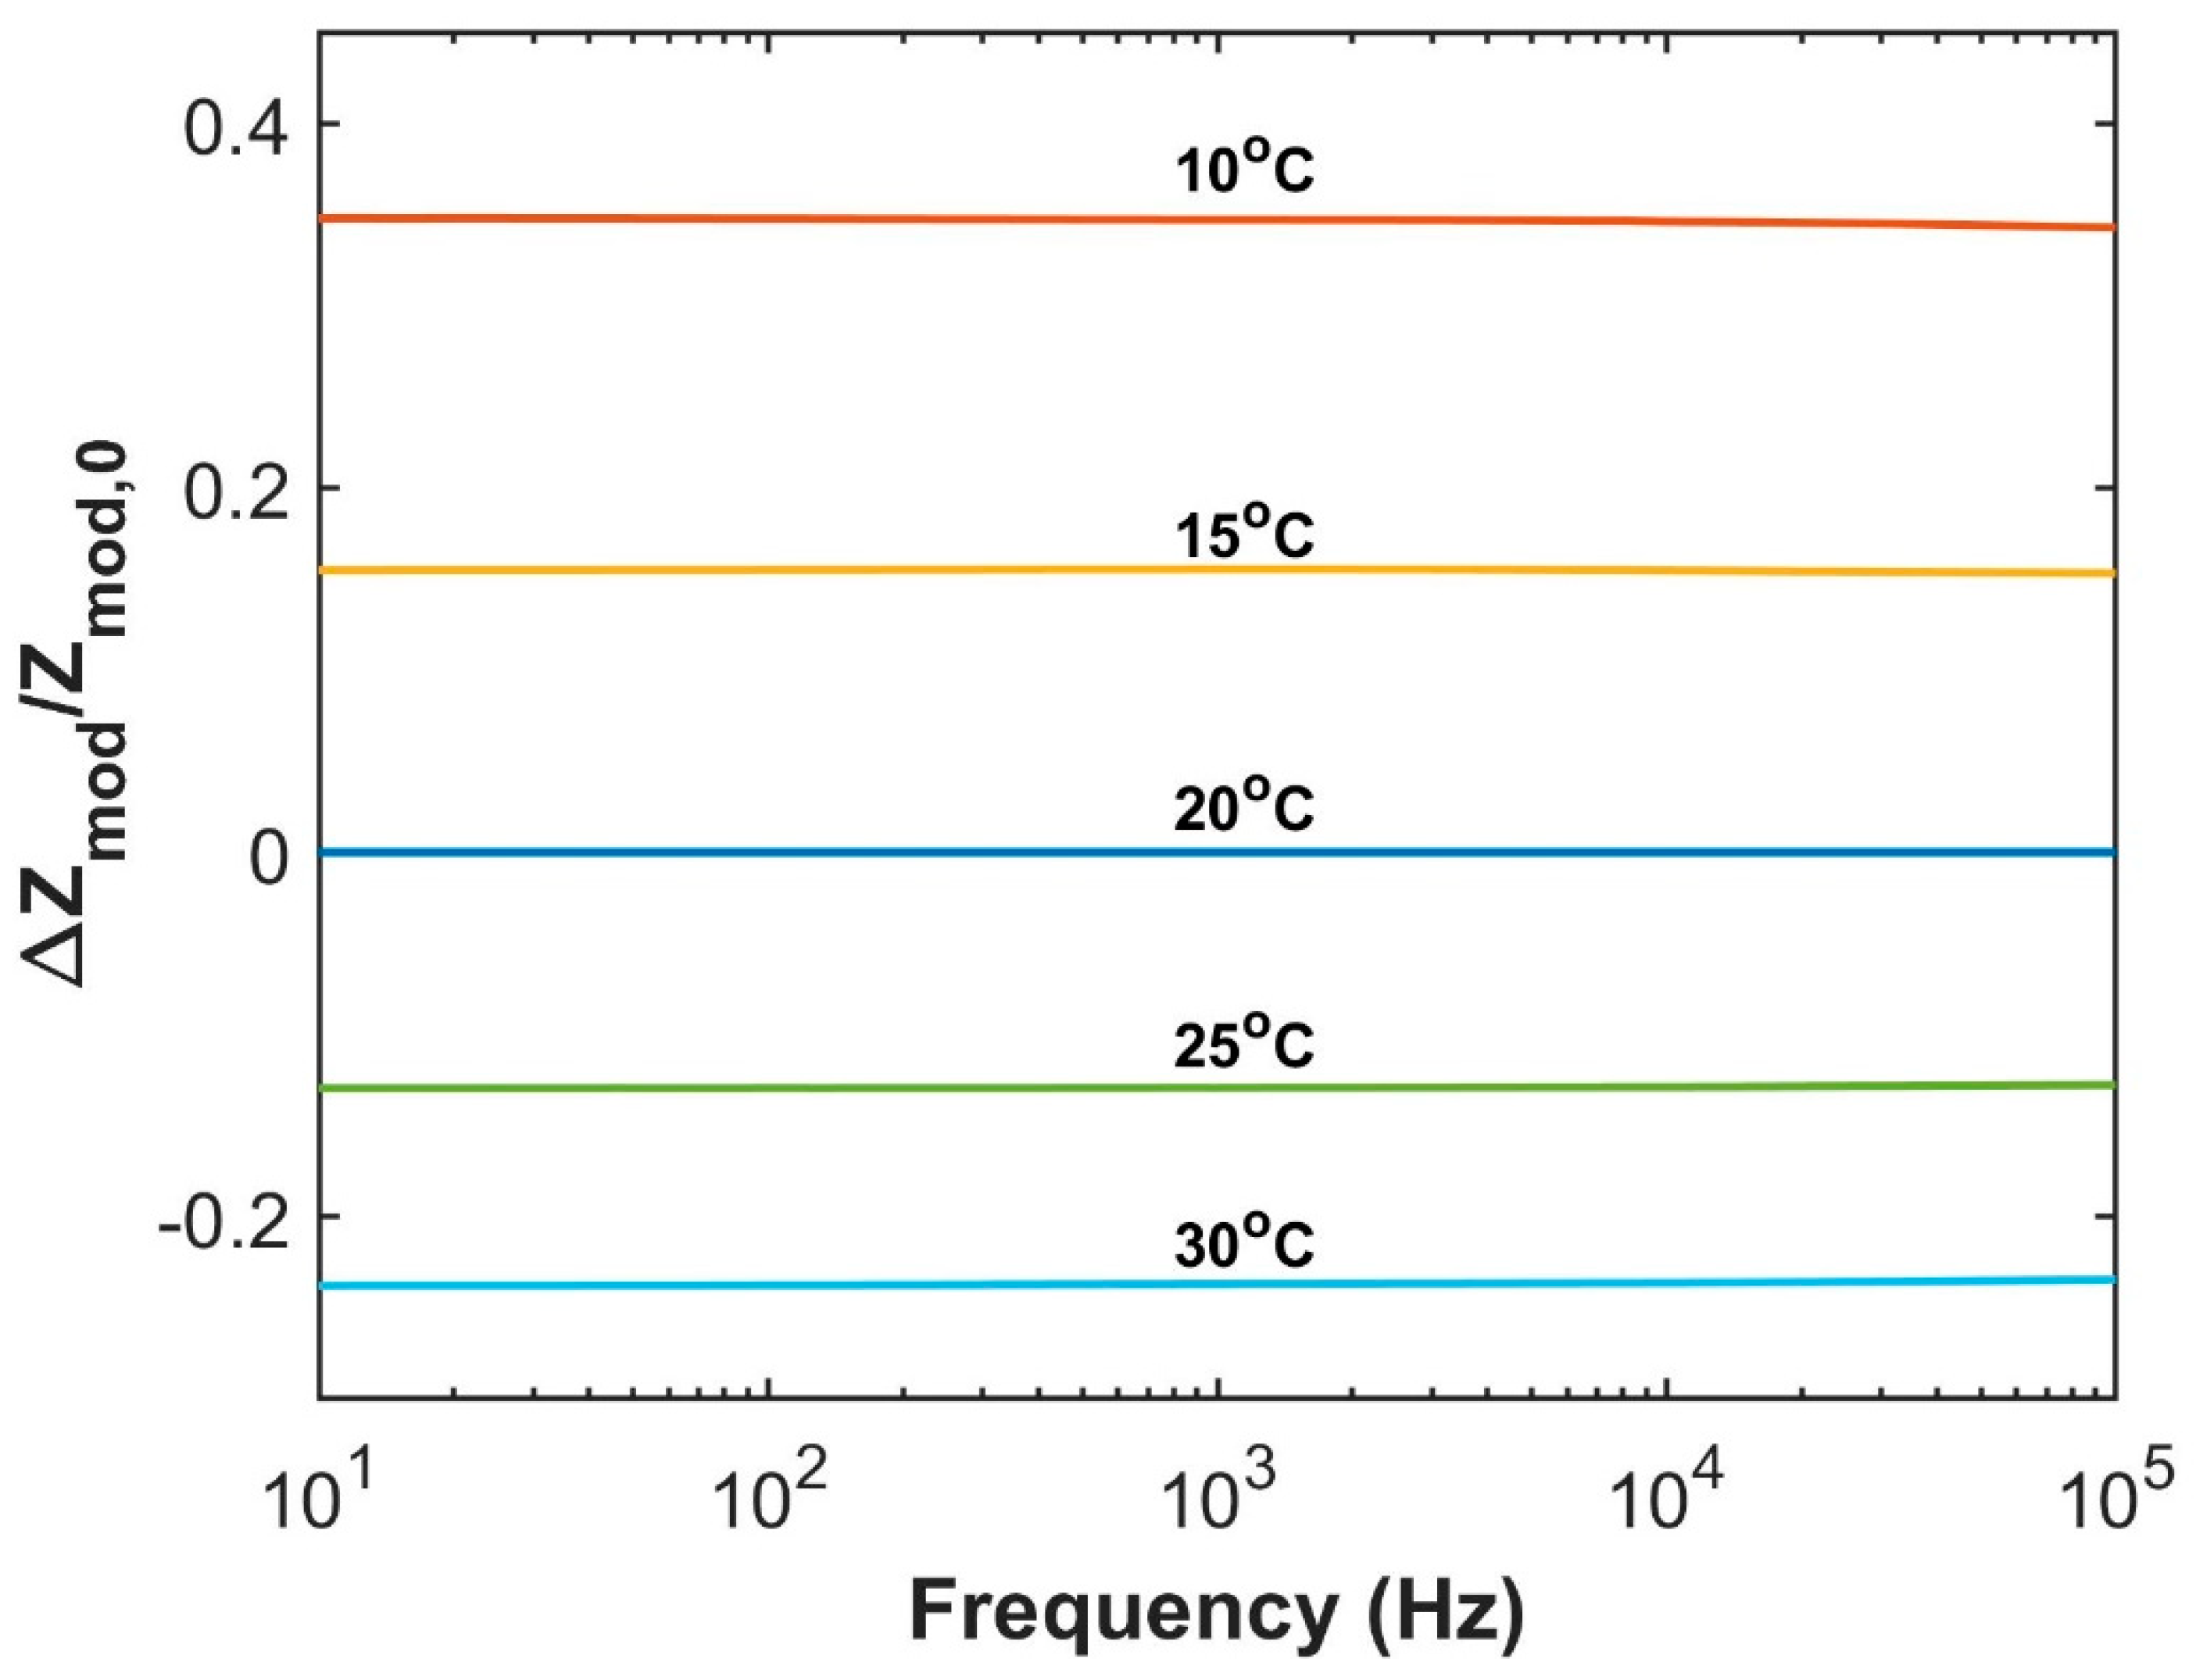
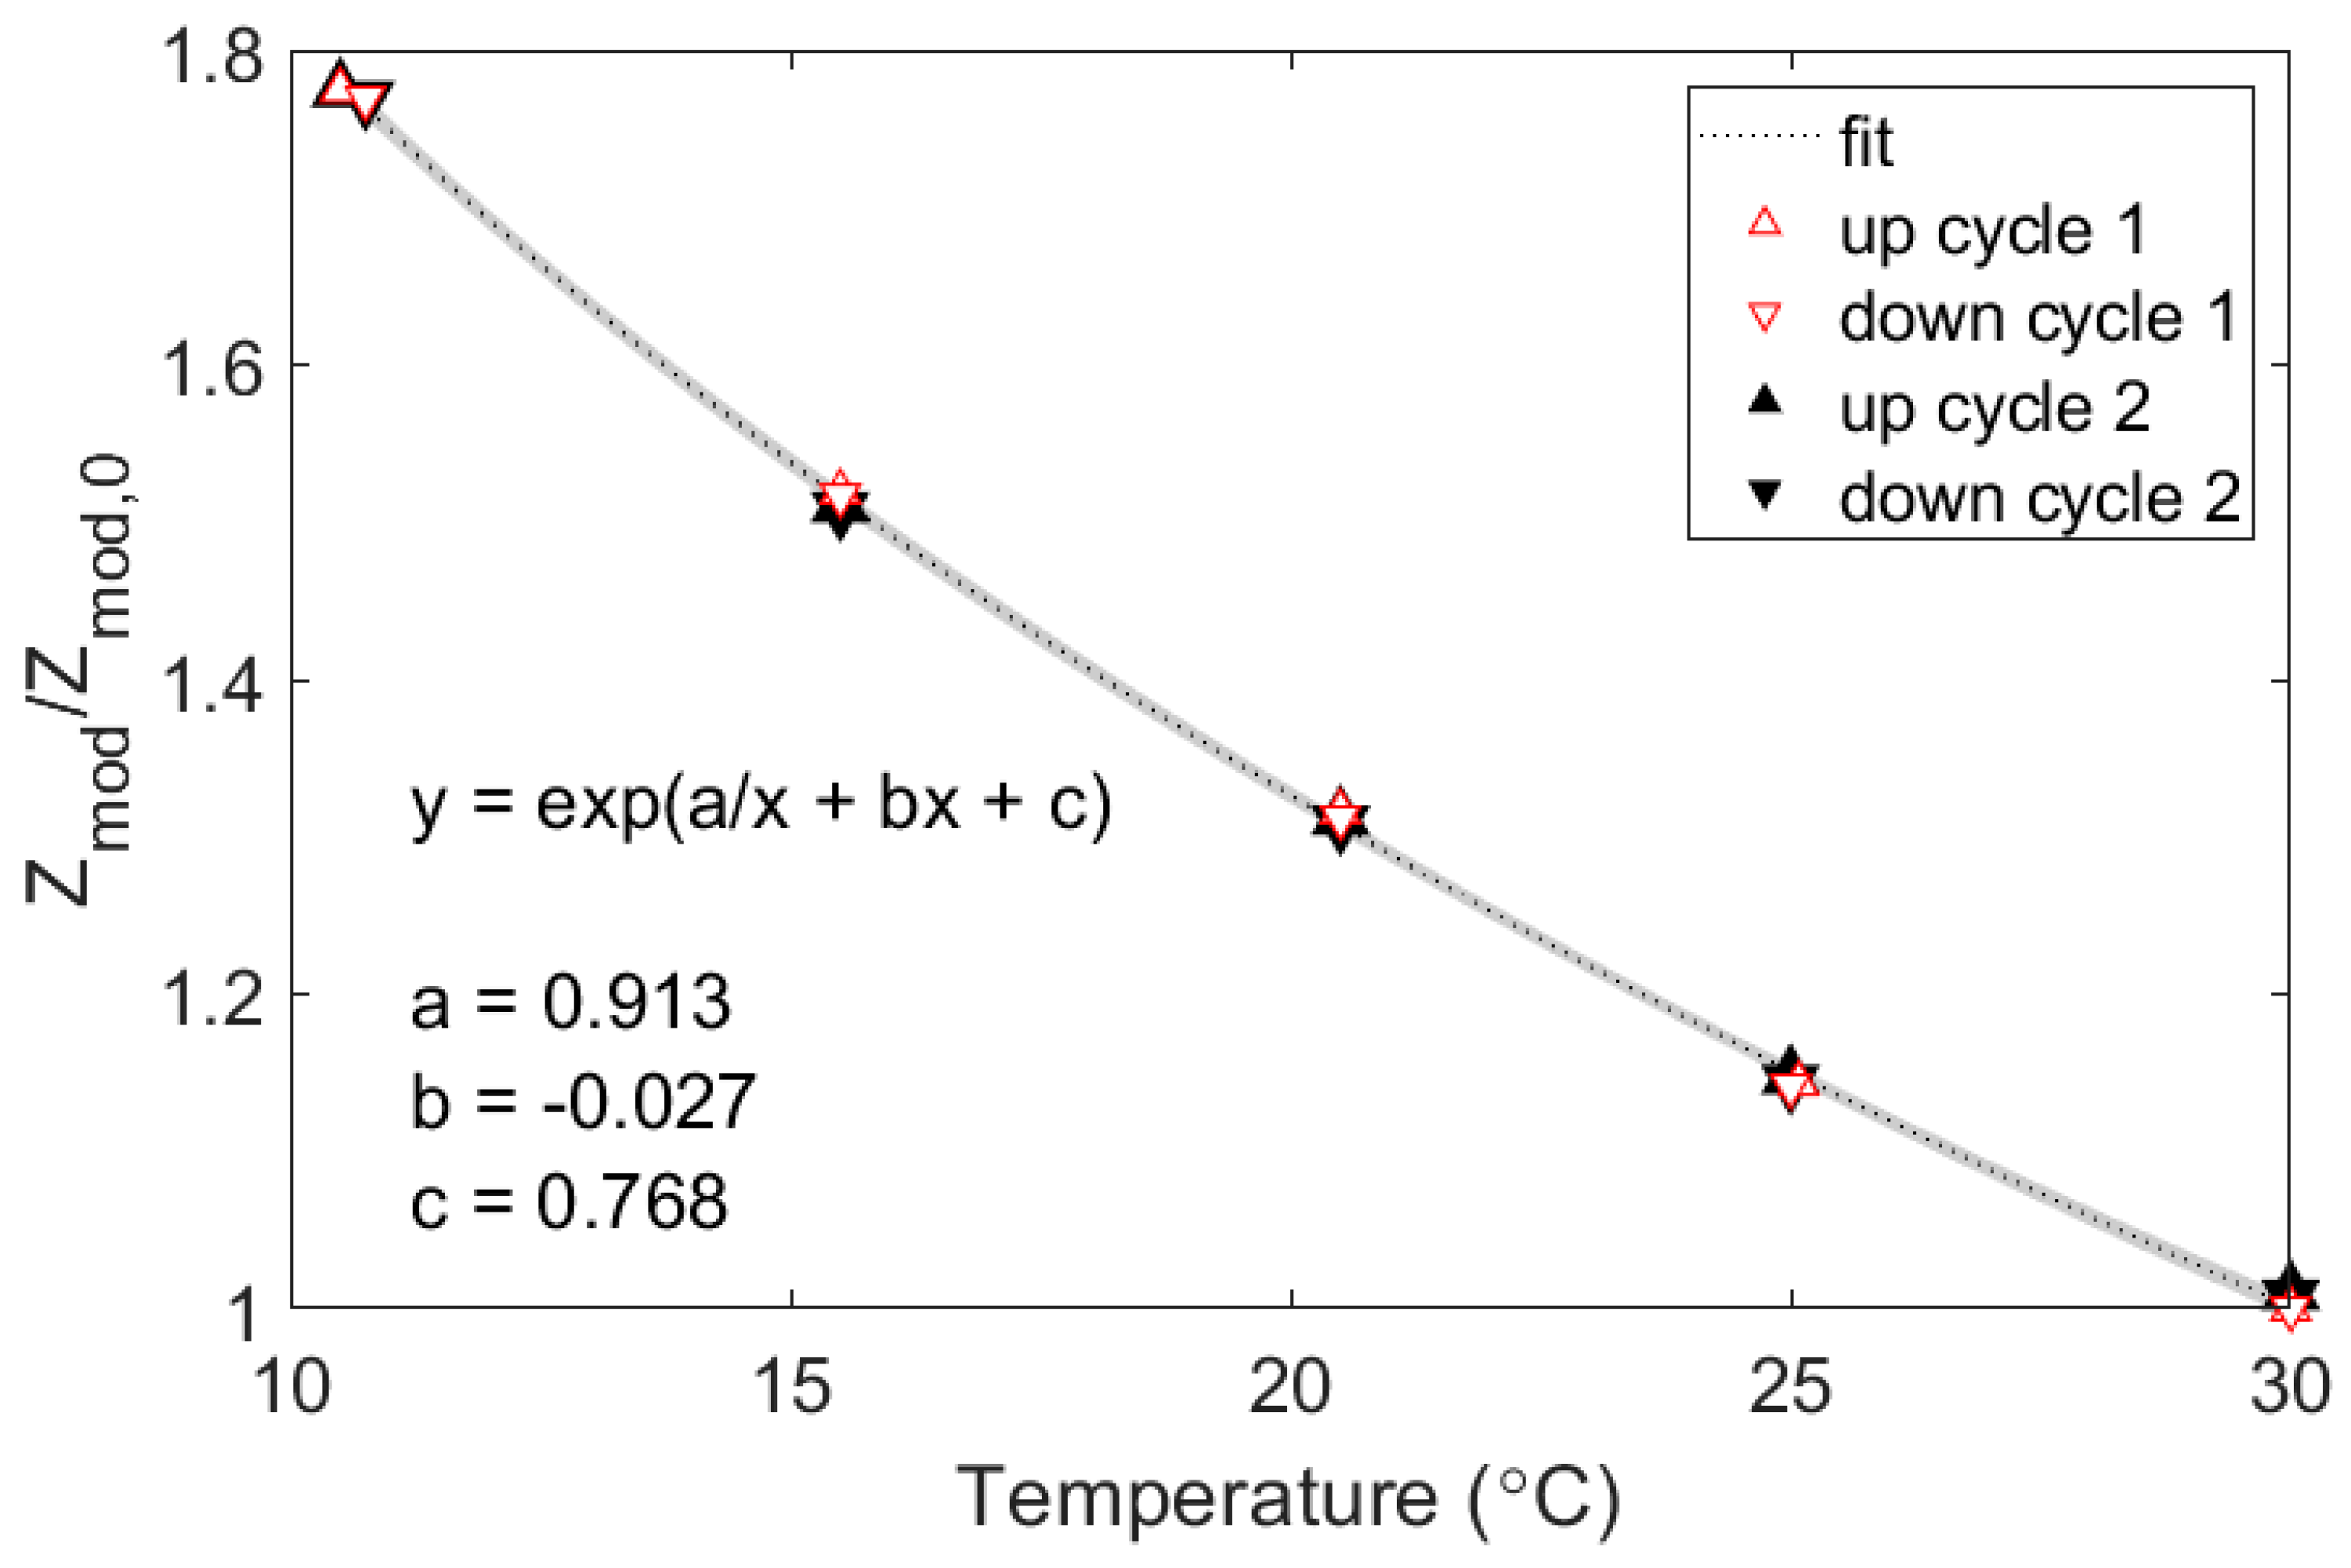
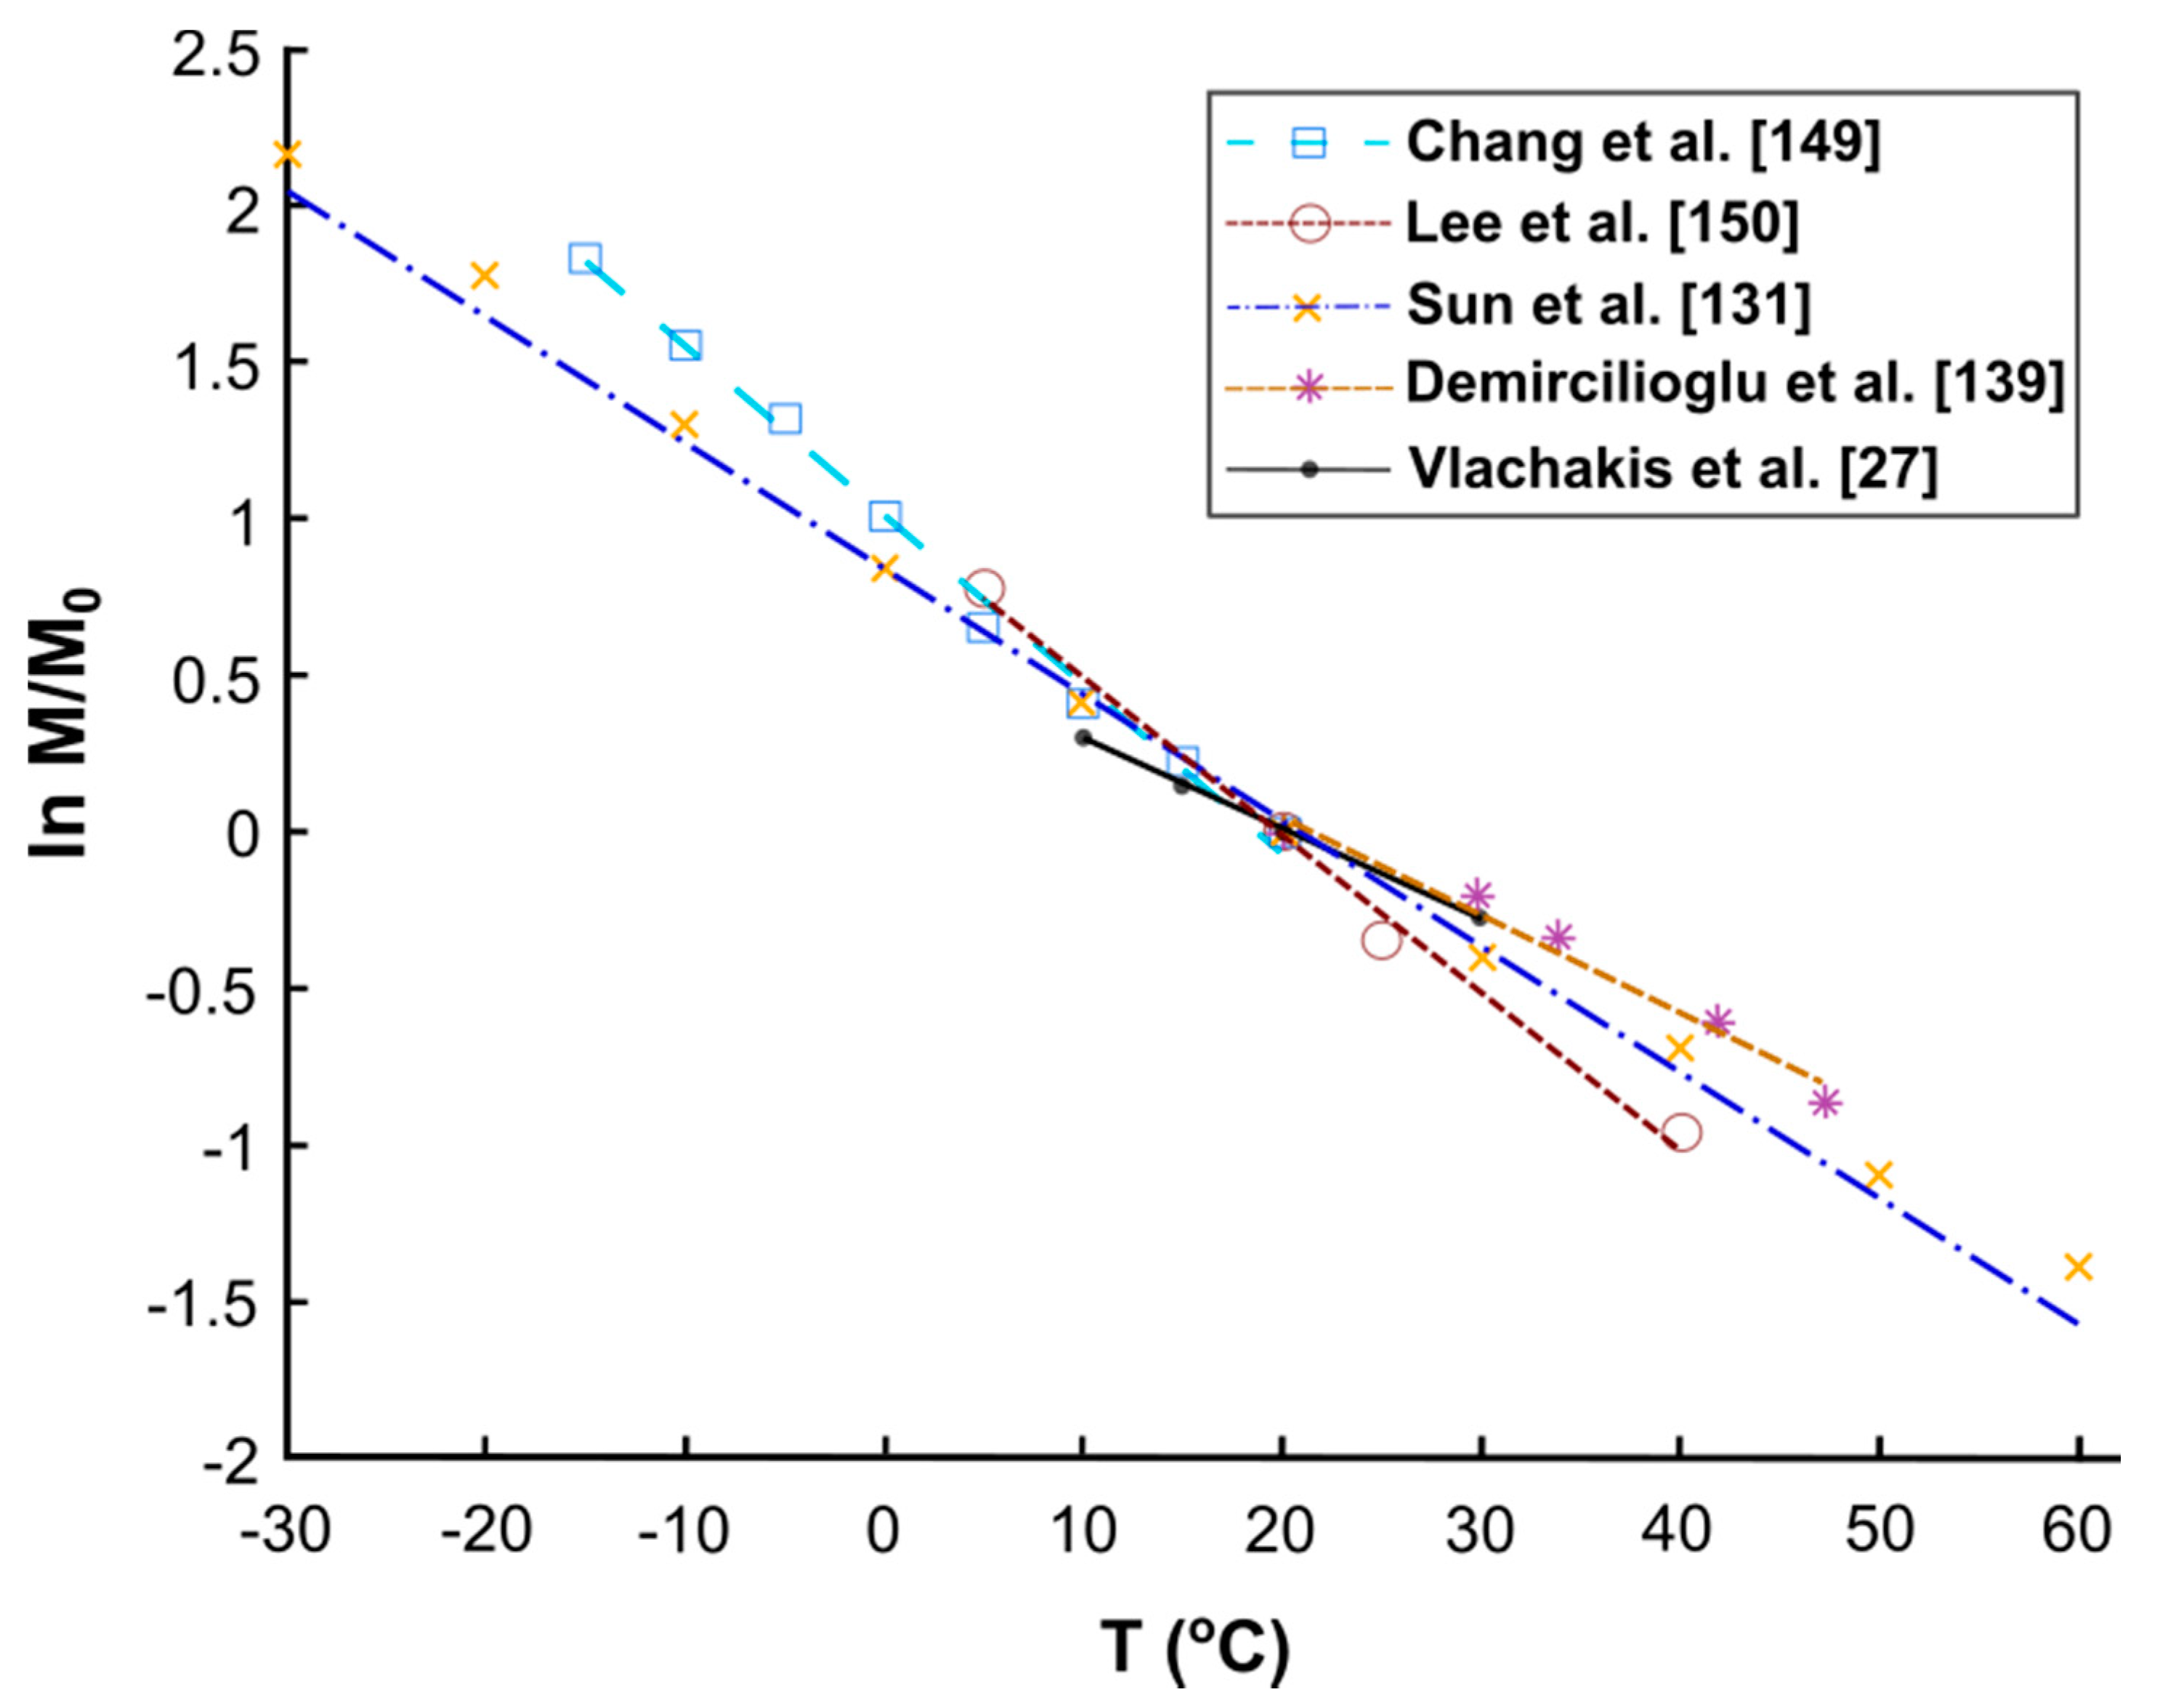
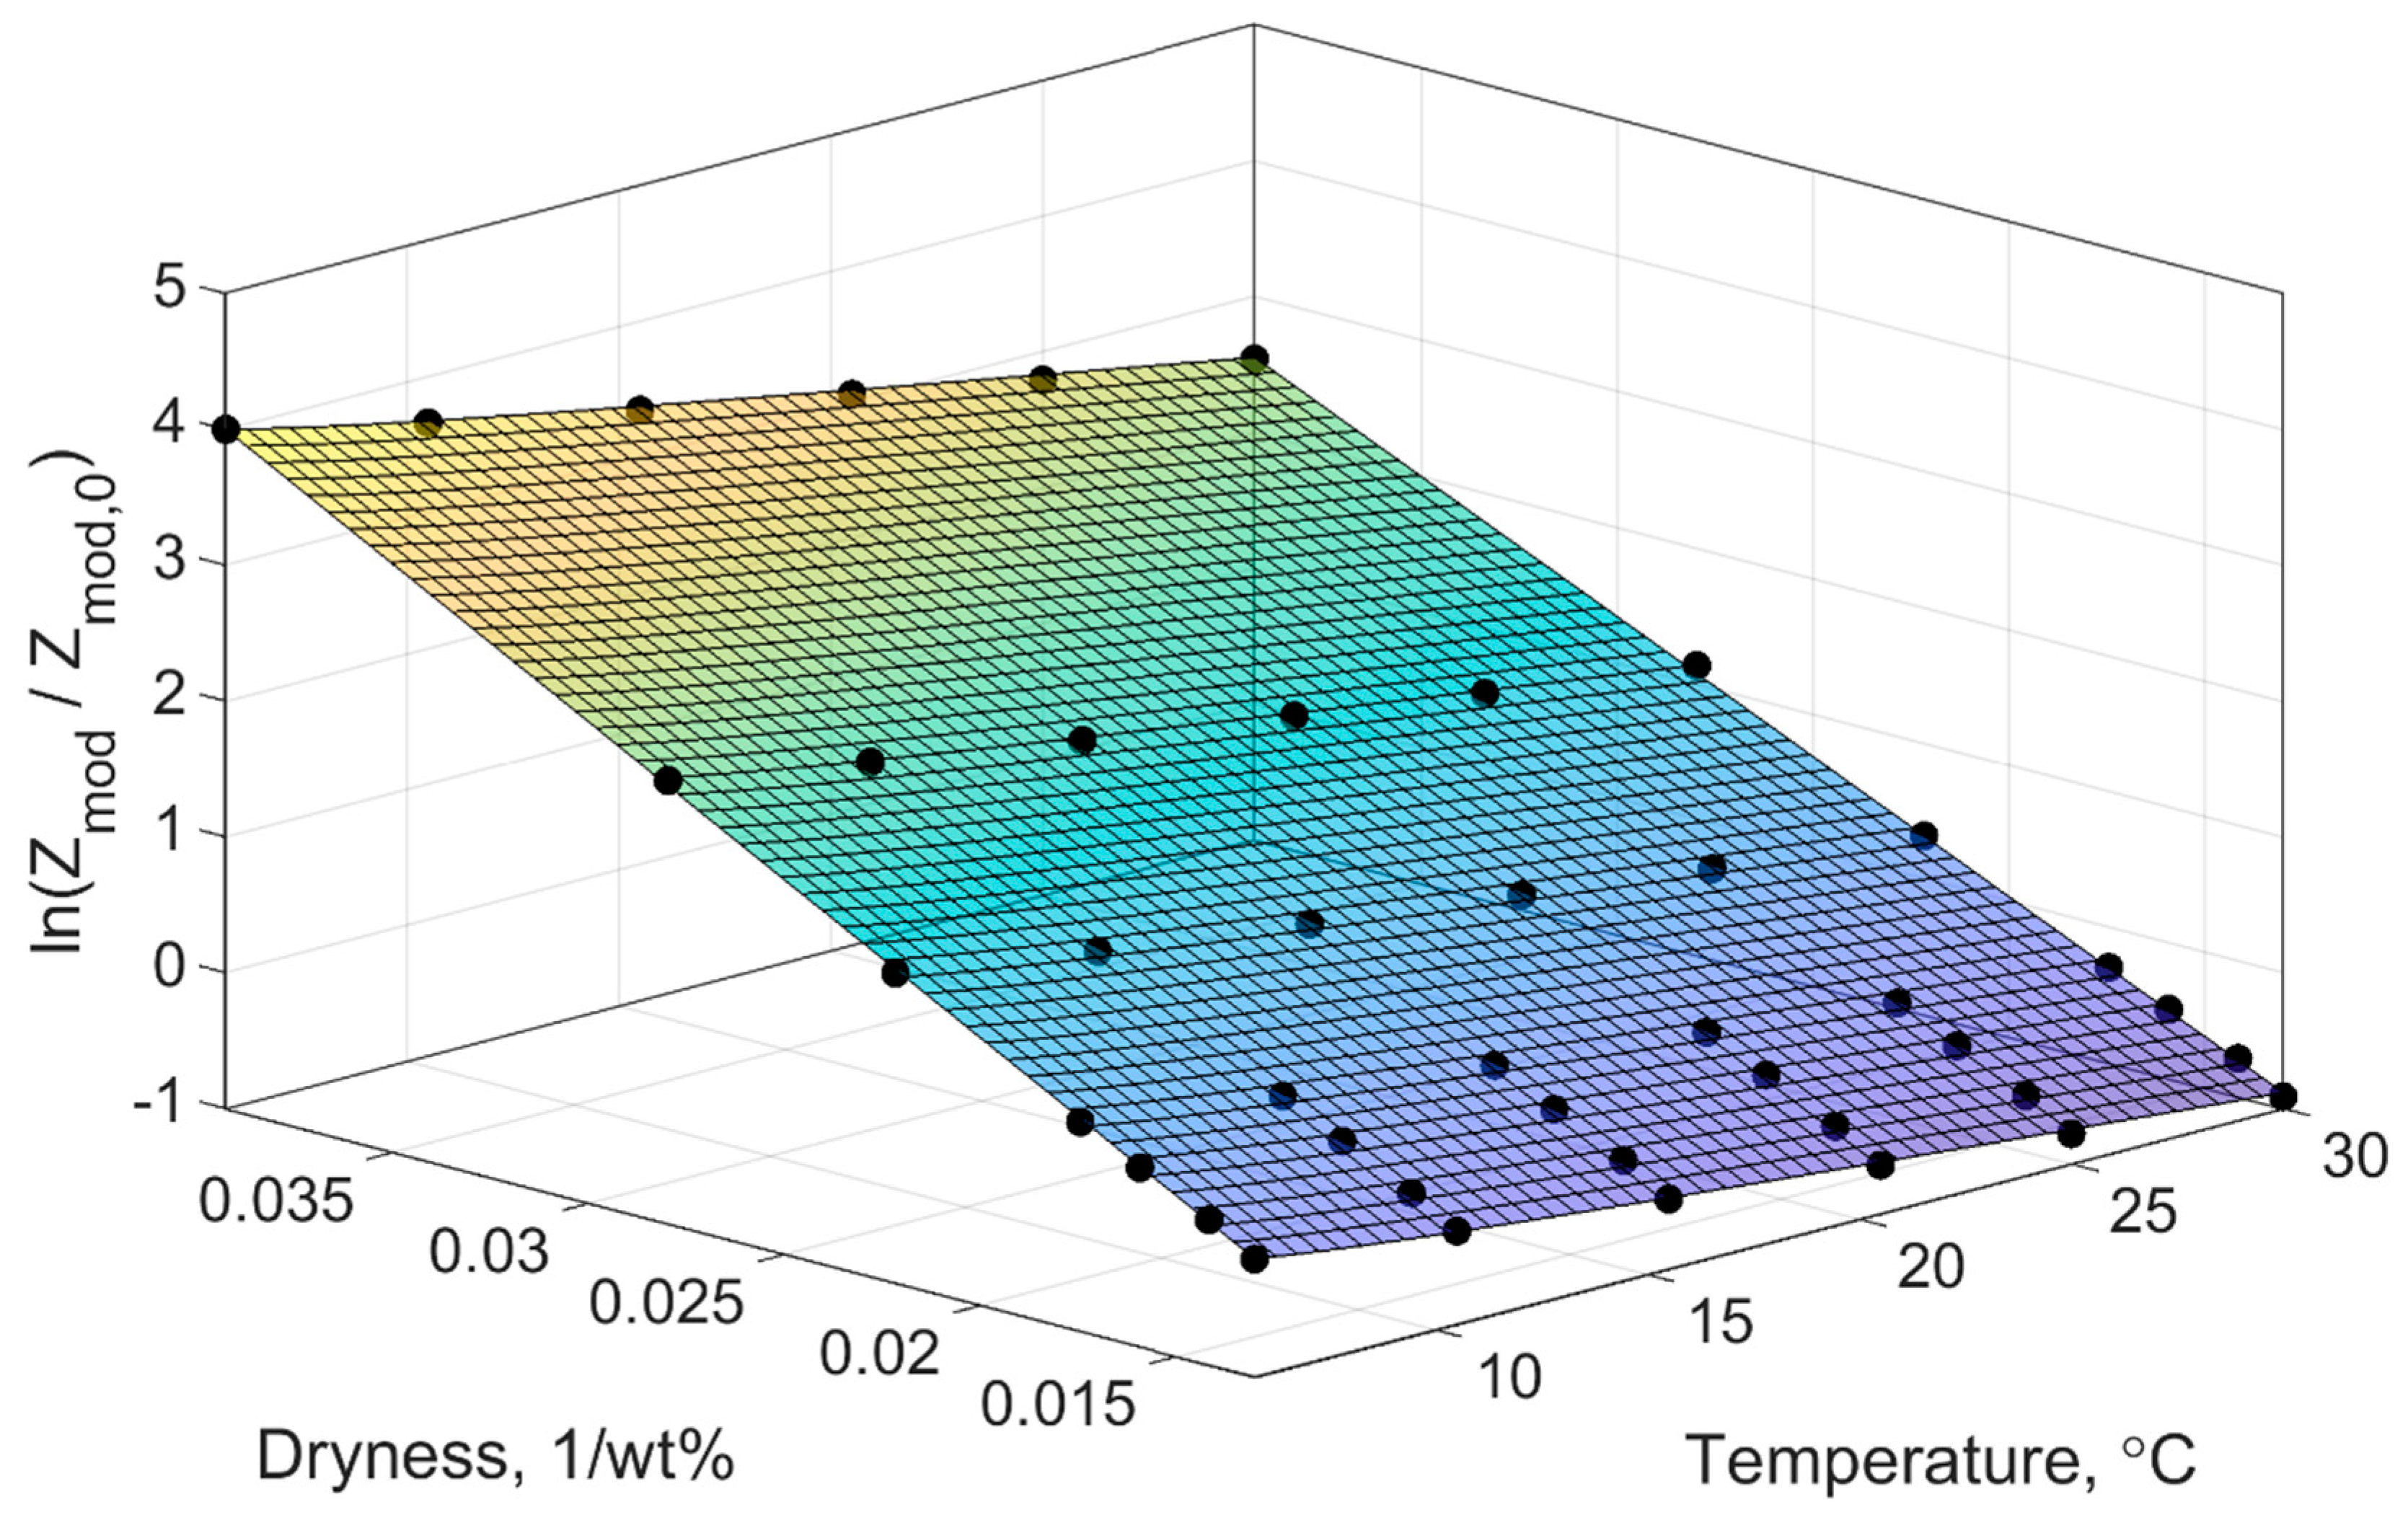
Table 1.
Reported conductivity for AAM under ambient-near ambient conditions. Notations- sodium silicate (Na2SiO3), sodium hydroxide (NaOH), potassium silicate (K2SiO3), potassium hydroxide (KOH), silicon (Si), aluminium (Al), sodium (Na), potassium (K), Phosphorus (P).
Table 1.
Reported conductivity for AAM under ambient-near ambient conditions. Notations- sodium silicate (Na2SiO3), sodium hydroxide (NaOH), potassium silicate (K2SiO3), potassium hydroxide (KOH), silicon (Si), aluminium (Al), sodium (Na), potassium (K), Phosphorus (P).
| Matrix | Precursor | Activator | Liquid-Binder Ratio | Molar Ratios | Filler Content | Filler Concentration | Order of Magnitude for Conductivity (S/m) | AC or DC? | Reference |
|---|---|---|---|---|---|---|---|---|---|
| Paste | GGBFS | K2SiO3 + KOH | Unreported | Si/Al = 1.64 * K/Al = 1.56 * | Single wall carbon nanotubes | 0.2 wt% | 10−3 | DC | [87] |
| Mortar | Fly ash Class C + GGBFS | Na2SiO3+ NaOH | 0.4 | Cannot calculate | Carbon fibre | 0.5 %volume | 1 | DC | [53] |
| Paste | Fly ash Class F | Na2SiO3 + KOH | 0.51 | Si/Al = 3.10 * Na + K/Al = 2.23 * | Graphene | 1 wt% | 10−1 | DC | [88] |
| Paste | Metakaolin | Na2SiO3 + NaOH | 1.2 | Si/Al = 2 | Carbon microfibre | 15 wt% | 10−2 | DC | [59] |
| Paste | Unreported | Unreported | 0.53 | Cannot calculate | Graphene oxide | 20 wt% | 102 | Unreported | [89] |
| Mortar | GGBFS | Na2SiO3 | 0.84 | Cannot calculate | Carbon black | 2.25 wt% | 10−1 | DC | [90] |
| Paste | GGBFS | Na2SiO3 + NaOH | 0.43 | Si/Al = 3.20 * Na/Al = 1.19 * | Carbon fibre | 0.76 wt% | 101 | Unreported | [25] |
| Paste | Fly ash Class F | Na2SiO3 + NaOH | 0.39 | Cannot calculate | Graphene oxide | 0.35 wt% | 1 | AC | [57] |
| Mortar | Fly ash Class F | Na2SiO3 + NaOH | 0.36 | Si/Al = 1.57 * Na/Al = 0.27 * | Multiwall carbon nanotubes | 1 wt% | 1 | AC | [58] |
| Paste | Fly ash Class C | Na2SiO3 + NaOH | 0.5 | Si/Al = 2.05 * Na/Al = 0.85 * | Carbon fibre | 0.5 wt% | 101 | AC | [56] |
| Paste | Fly ash Class C | Na2SiO3 + NaOH | 0.4 | Si/Al = 1.93 * Na/Al = 0.51 * | No filler | - | 10−1 | AC | [91] |
| Paste | Fly ash Class F | Na2SiO3 + NaOH | 0.37 | Si/Al = near 2 | No filler | - | 10−2 | AC | [24] |
| Paste | Fly ash Class F | K2SiO3 | 0.6 | Si/Al = 1.17 | No filler | - | 10−1 | AC | [92] |
| Paste | Fly ash Class F | Na2SiO3 + NaOH | 0.4 | Si/Al = 2.15 * Na/Al = 1.18 * | No filler | - | 1 | AC | [60] |
| Mortar | GGBFS | Na2SiO3 + NaOH | 0.61 | Cannot calculate | Carbon nanotubes | 2.5 wt% | 10−6 | AC | [93] |
| Mortar | GGBFS | Na2SiO3 | 0.36 | Si/Al = 6.71 * Na/Al = 1.11 * | Graphite powder | 30 wt% | 10−4 | AC | [52,86] |
| Mortar | GGBFS | Na2SiO3 | 0.61 | Si/Al = 6.71 * Na/Al = 1.11 * | No filler | - | 10−6 | AC | [52,86] |
| Paste | Metakaolin | Na2SiO3 | Unreported | Si/Al = 1.04 * Na/Al = 0.17 * | No filler | - | 10−4 | AC | [68] |
| Paste | Metakaolin | Phosphoric acid | Unreported | Si/P = 1 | No filler | - | 10−7 | AC | [94] |
* Not provided by authors, calculated from data available in cited paper (s).
Table 2.
Electrode configuration for AAM sensing applications.
| Matrix | Precursor | Number of Probes | Material of Probe | Attachment Method | Reference |
|---|---|---|---|---|---|
| Paste | Fly ash | 2-probe | Graphene | Embedded | [24] |
| Paste | Fly ash | 4-probe | Copper | Embedded | [57,58] |
| Paste | Fly ash | 2-probe | Steel mesh | Embedded | [92] |
| Paste | Fly ash | 4-probe | Copper fibres | Embedded | [26] |
| Paste | Fly ash | 4-probe | Stainless steel wires | Embedded | [65] |
| Paste | Fly ash | 4-probe | Brass plates | Embedded | [56] |
| Paste | Metakaolin | 2-probe | Copper wires | Embedded | [23] |
| Paste | Metakaolin | 4-probe | Stainless steel wires | Embedded | [27] |
| Paste | GGBFS | 4-probe | Copper wires | Wound around substrate with conductive silver paint | [25] |
| Mortar | Metakaolin | 2-probe | Copper foils | Attached | [22,50] |
| Mortar | Metakaolin | 4-probe | Copper wires | Wound around substrate with conductive paste | [55] |
| Mortar | GGBFS | 2-probe | Copper mesh | Embedded | [52,86] |
| Mortar | GGBFS | 4-probe | Self-adhesive copper tape | Attached with graphite conductive paste | [51] |
| Mortar | GGBFS+ fly ash | 4-probe | Titanium mesh | Embedded | [53] |
| Concrete | Fly ash | 2-probe | Copper wires | Wound around substrate with conductive silver paste | [110] |
Table 3.
Strain sensing performance of AAM. Notations-sodium silicate (Na2SiO3), sodium hydroxide (NaOH), potassium silicate (K2SiO3), potassium hydroxide (KOH).
Table 3.
Strain sensing performance of AAM. Notations-sodium silicate (Na2SiO3), sodium hydroxide (NaOH), potassium silicate (K2SiO3), potassium hydroxide (KOH).
| Matrix | Precursor | Activator | Conductive Filler | Filler Concentration | Application | Loading Amplitude | Gauge Factor or Reported Response | Reference |
|---|---|---|---|---|---|---|---|---|
| Paste | Fly ash | Na2SiO3 + NaOH | No filler | - | Tension | 10–40 N | 358 | [24] |
| Paste | Fly ash | Na2SiO3 + NaOH | Graphene oxide sheet | 0.35 wt% | Compression Tension | 0.6–12 MPa 200–1000 µε | 43.87 20.7 | [57] |
| Paste | Fly ash | Na2SiO3 + NaOH | No filler | - | Compression | 0–100 kN | 47 * | [26] |
| Paste | Metakaolin | Na2SiO3 + NaOH | Carbon nanotubes | 0.25 %volume | Compression Bending | 7–9% 0.05–0.08% | 663 724.6 | [23] |
| Paste | Metakaolin | Na2SiO3 + NaOH | PEDOT: PSS solution | - | Compression | Up to 200 N | loading: 376.9 unloading: 513.3 | [141] |
| Paste | GGBFS | Na2SiO3 + NaOH | Carbon fibre | 0.58 %volume | Compression | 0–8 kN | 662 | [25] |
| Mortar | Metakaolin | Na2SiO3 + NaOH | Graphene | 1 wt% | Compression | 1–5 kN | 1986 | [55] |
| Mortar | GGBFS | Na2SiO3 | No filler | - | Compression | 5–50 kN | 97.13 Ω /MPa; 35 * | [86] |
| Mortar | GGBFS | Na2SiO3 | Graphite powder | 30 wt% | Compression | 5–50 kN | 292 * | [52,142] |
| Mortar | GGBFS | Na2SiO3 | Carbon black | 4 wt% | Flexure | 0.07–0.50 kN | ≈1300 * | [51] |
| Paste | Fly ash | K2SiO3 | No filler | - | Compression | 0–15 kN | 11 Ω/MPa | [92] |
| Mortar | Metakaolin | Na2SiO3 + NaOH | No filler | - | Compression | 0–2500 N | 4.02 ± 0.49 pC/N | [22] |
| Mortar | Metakaolin | Na2SiO3 + NaOH | Graphene | 1 wt% | Compression | 0–2500 N | 11.99 pC/N | [50] |
| Mortar | GGBFS+ fly ash | Na2SiO3 + NaOH | Carbon fibre | 0.1 %volume | Compression | 6.25–18.75 MPa | ΔR/R0 = 0.11 | [53] |
| Concrete | Fly ash | Na2SiO3 + NaOH | Carbon fibre | 0.4 wt% | Compression Bending | 0–9.34 kN | 6–7.5 Ω/MPa | [110] |
* Not provided by authors, calculated from data available in cited paper (s).
Table 4.
Strain sensing performance of AAM with no conductive filler. Notations- sodium silicate (Na2SiO3), sodium hydroxide (NaOH), potassium silicate (K2SiO3), potassium hydroxide (KOH).
Table 4.
Strain sensing performance of AAM with no conductive filler. Notations- sodium silicate (Na2SiO3), sodium hydroxide (NaOH), potassium silicate (K2SiO3), potassium hydroxide (KOH).
| Matrix | Precursor | Activator | Application | Loading Amplitude | Gauge Factor or Reported Response | Reference |
|---|---|---|---|---|---|---|
| Paste | Fly ash | Na2SiO3 + NaOH | Tension | 10–40 N | 358 | [24] |
| Paste | Fly ash | Na2SiO3 + NaOH | Compression Tension | 0.6–12 MPa 200–1000 µε | 21.6 9.76 | [57] |
| Paste | Fly ash | Na2SiO3 + NaOH | Compression | 0–100 kN | 47 * | [26] |
| Paste | Metakaolin | Na2SiO3 + NaOH | Compression Bending | 7–9% 0.05–0.08% | 62.7 189.8 | [23] |
| Mortar | Metakaolin | Na2SiO3 + NaOH | Compression | 1–5 kN | 1662 | [55] |
| Mortar | GGBFS | Na2SiO3 | Compression | 5–50 kN | 97.13 Ω/MPa 35 * | [86] |
| Mortar | GGBFS | Na2SiO3 | Flexure | 0.07–0.50 kN | ≈1150 * | [51] |
| Mortar | GGBFS+ fly ash | Na2SiO3 + NaOH | Compression | 6.25–18.75 MPa | Close to 0 | [53] |
| Paste | Fly ash | K2SiO3 | Compression | 0–15 kN | 11 Ω/MPa | [92] |
| Mortar | Metakaolin | Na2SiO3 + NaOH | Compression | 0–2500 N | 4.02 ± 0.49 pC/N | [22] |
* Not provided by authors, calculated from data available in cited paper.
Table 5.
Temperature sensing response of AAM.
| Matrix | Precursor | Conductive Filler | Temperature Range | Reported Response | Reference |
|---|---|---|---|---|---|
| Paste | Fly ash | No filler | −10–35 °C | 21.5 kΩ °C−1 | [24] |
| Paste | Fly ash | No filler | 10–30 °C | 0.5 °C−1 | [26] |
| Paste | Fly ash | No filler | 5–30 °C | 0.1 °C−1 | [65] |
| Paste | Fly ash | Magnetite | ΔT = 3 °C | 0.0781 °C−1 * | [154] |
| Paste | Metakaolin | Graphite, single wall carbon nanotube | Up to 340 °C | Conductivity function of temperature | [87] |
| Paste | Metakaolin | No filler | 10–30 °C | 0.1 °C−1 | [27] |
| Paste | Metakaolin Fly ash | No filler | ΔT = 45 °C | −15.12 μV/°C −6.31 μV/°C | [157] |
* Not provided by authors, calculated from data available in cited paper.
Table 6.
Parametric constants for the fits for temperature characterization of OPC and AAM binders.
| Application | a | b | Reference |
|---|---|---|---|
| OPC | 0.054 | 1.01 | [149] |
| OPC | 0.050 | 1.00 | [150] |
| OPC | 0.040 | 0.86 | [131] |
| OPC | 0.030 | 0.68 | [139] |
| AAM | 0.028 | 0.58 | [27] |
Table 7.
Could literature be found that demonstrated sensing techniques in OPC and AAM?
| Material | Strain | Temperature | Moisture | Humidity | Strain-Temperature | Strain-Moisture | Temperature-Moisture |
|---|---|---|---|---|---|---|---|
| AAM | Uniaxial, multiaxial limited | Yes | Yes | No | No | No | Yes |
| OPC | Yes | Yes | Yes | Yes | Yes | Yes | No |
© 2020 by the authors. Licensee MDPI, Basel, Switzerland. This article is an open access article distributed under the terms and conditions of the Creative Commons Attribution (CC BY) license (http://creativecommons.org/licenses/by/4.0/).
Share and Cite
MDPI and ACS Style
Vlachakis, C.; Perry, M.; Biondi, L. Self-Sensing Alkali-Activated Materials: A Review. Minerals 2020, 10, 885. https://0-doi-org.brum.beds.ac.uk/10.3390/min10100885
AMA Style
Vlachakis C, Perry M, Biondi L. Self-Sensing Alkali-Activated Materials: A Review. Minerals. 2020; 10(10):885. https://0-doi-org.brum.beds.ac.uk/10.3390/min10100885
Chicago/Turabian StyleVlachakis, Christos, Marcus Perry, and Lorena Biondi. 2020. "Self-Sensing Alkali-Activated Materials: A Review" Minerals 10, no. 10: 885. https://0-doi-org.brum.beds.ac.uk/10.3390/min10100885
Note that from the first issue of 2016, this journal uses article numbers instead of page numbers. See further details here.