Article

Impact of Paleosalinity, Paleoredox, Paleoproductivity/Preservation on the Organic Matter Enrichment in Black Shales from Triassic Turbidites of Semanggol Basin, Peninsular Malaysia

by
Zulqarnain Sajid
1,*,
Mohd S. Ismail
1,
Muhammad Noor Amin Zakariah
1,
Haylay Tsegab
1,
José Antonio Gámez Vintaned
1,
Tanzila Hanif
2 and
Nisar Ahmed
1
1
Geosciences Department, Universiti Teknologi PETRONAS, Bandar Seri Iskandar, Perak 32610, Malaysia
2
Institute of Geology, University of the Punjab, Lahore 54000, Pakistan
*
Author to whom correspondence should be addressed.
Submission received: 8 August 2020 / Revised: 7 September 2020 / Accepted: 9 September 2020 / Published: 16 October 2020
(This article belongs to the Section Environmental Mineralogy and Biogeochemistry)

Abstract

:
Turbidite-associated black shale of the Semanggol Formation is extensively distributed in the northwestern part of the Western Belt, Peninsular Malaysia. The black shale occurs as a dark grey to black and thick to medium-bedded deposit. It represents the distal part of submarine fan system (outer-fan) overlying interbedded sandstone to shale facies of the mid-fan and conglomeratic pebbly sandstone facies of the inner-fan. Field observations and its widespread occurrence have resulted in the black shale being considered as a potential analog for a source rock in offshore Peninsular Malaysia. The present study includes detailed mineralogical (XRD, SEM, and EDX analysis), inorganic geochemical (major oxides, trace elements TEs, and rare earth elements REEs), and Rock-Eval pyrolysis analyses of the black shale samples, collected from the Gunung Semanggol, Bukit Merah, and Nami areas in northwestern Peninsular Malaysia. The primary focus of this study is to investigate the provenance, paleoredox conditions, paleoclimate, sedimentary rate, paleoproductivity, and upwelling system that would be helpful to understanding the role of these parameters in the enrichment of organic matter (OM) in the black shale. The Rock-Eval analysis shows that the black shale of the Semanggol Formation comprises type-III kerogens, which suggests organic input from a terrestrial source. The black shale also contains mature to postmature organic matter. Based on the mineralogical analysis, the mineral composition of the black shale comprises illite and kaolinite, with abundant traces of quartz and feldspar as well as few traces of titanium and zircon. Inorganic geochemical data designate black shale deposition in a passive margin setting that has experienced moderate to strong weathering, semi-arid to hot arid climate, and moderate sedimentation rate. Ratios of Ni/Co, U/Th, and V/(V+Ni) along with slightly negative to positive Ce* anomalies and UEF-MoEF cross-plot unanimously indicate anoxic/dysoxic water conditions that are suitable for organic matter preservation. Geochemical proxies related to modern upwelling settings (i.e., Cd/Mo, Co vs. Mn) show that the deep marine black shale was strongly influenced by persistent upwelling, a first-order controlling factor for organic matter enrichment in the distal part (outer fan of the submarine fan system) of the Semanggol Basin. However, productivity-controlled upwelling and a high sedimentary rate, as well as high-productivity in oxygen-depleted settings without strong anoxic conditions, has played an essential role in the accumulation of organic matter.

Graphical Abstract

1. Introduction

Gravity-driven turbidity currents underwater cause sediment loads to deposit when these currents lose energy. These sediments are usually normally graded and ideally form a sequence of sedimentary rocks recognized as a Bouma sequence [1]. Over the last few decades, there has been a substantial increase in the impact of turbidite-associated deposits on worldwide petroleum reserves [2]. Turbidite-associated black shale plays an essential role in the petroleum system as a source and seal rock at many offshore and onshore sedimentary basins worldwide. Many efforts have been made by various researchers to find out the accumulation, maturation, and generation of organic matter (OM) in these host rocks by utilizing organic and inorganic geochemical proxies. Fortunately, the Triassic turbidite-associated Semanggol black shale in northwestern Peninsular Malaysia offers a splendid opportunity to conduct organic and inorganic geochemical studies that could further assist in determining the rock’s association with depositional conditions and the enrichment of the organic matter.
Importantly, outcrop-based studies on the geochemical characteristics of turbidite-associated black shale can be helpful in interpreting sedimentary environments systematically. Currently, geochemical approaches are extensively employed for deciphering and reconstructing depositional settings because of their reliable, easily reproducible, and efficient results [3,4]. Recently some studies have used different redox-sensitive trace element proxies to understand palaeodepositional conditions and organic matter enrichment [5,6,7,8,9,10]. Algeo and Maynard [11] and Tribovillard et al. [12] reported that rocks with a high total organic content (TOC ) are mostly enriched in redox-metals (e.g., As, Cr, Mo, Re, Sb, U, and V) and/or have a high content of sulphide-forming trace elements (e.g., Cd, Co, Cu, Ni, Pb, and Zn), and most probably have different degrees of enrichment caused by dissimilar redox conditions. Sweere et al. [13] and Rimmer [14] set different standard values for differentiating between upwelling and restricted basin settings by utilizing Cd/Mo ratios and Mo enrichment factors (EFs). Moreover, molybdenum (Mo) is considered to be the best diagnostic element for sediment deposition under seawater sulfate-reducing conditions [14]. In addition, less attention has been given to organic matter enrichment, paleoproductivity, and ancient upwelling analysis of the turbidite-associated black shale of the Semanggol Formation based on geochemical methods. These geochemical studies can also be more valuable in depicting paleoenvironment fluctuations.
For the present study, samples of turbidite-associated black shale were collected from three locations: (1) Gunung Semanggol, 98 km northwest of Ipoh city, North Perak; (2) Bukit Merah, 90 km northwest of Ipoh city, North Perak; and (3) Nami areas, 50 km northwest of Alor Setar, North Kedah (Figure 1A). The samples were collected for the analysis of paleo-redox conditions (MoEF, UEF, V/Cr), paleoproductivity (Baxs, Sixs, Pxs), terrestrial influx (Al, Ti), sedimentation rate (La/Yb)N, and evidence of an ancient upwelling system (Cd/Mo, Co vs. Mn). The objectives of the study are (1) to develop a better understanding towards the reconstruction of a depositional system of the turbidite-associated black shale of the Semanggol Formation; (2) to investigate the hypothesis of deep marine upwelling and develop an understanding of the parameters controlling the organic matter accumulation in the Semanggol Formation; and (3) to determine the paleoenvironment, paleoproductivity, paleoredox conditions, and sedimentation rate during black shale deposition. The findings from current research can be applied in the study of other tectonically confined foreland basins, and can further contribute to understanding the sedimentary controls on hydrocarbon potentiality of the deposits in such settings, especially in the Semanggol Basin.

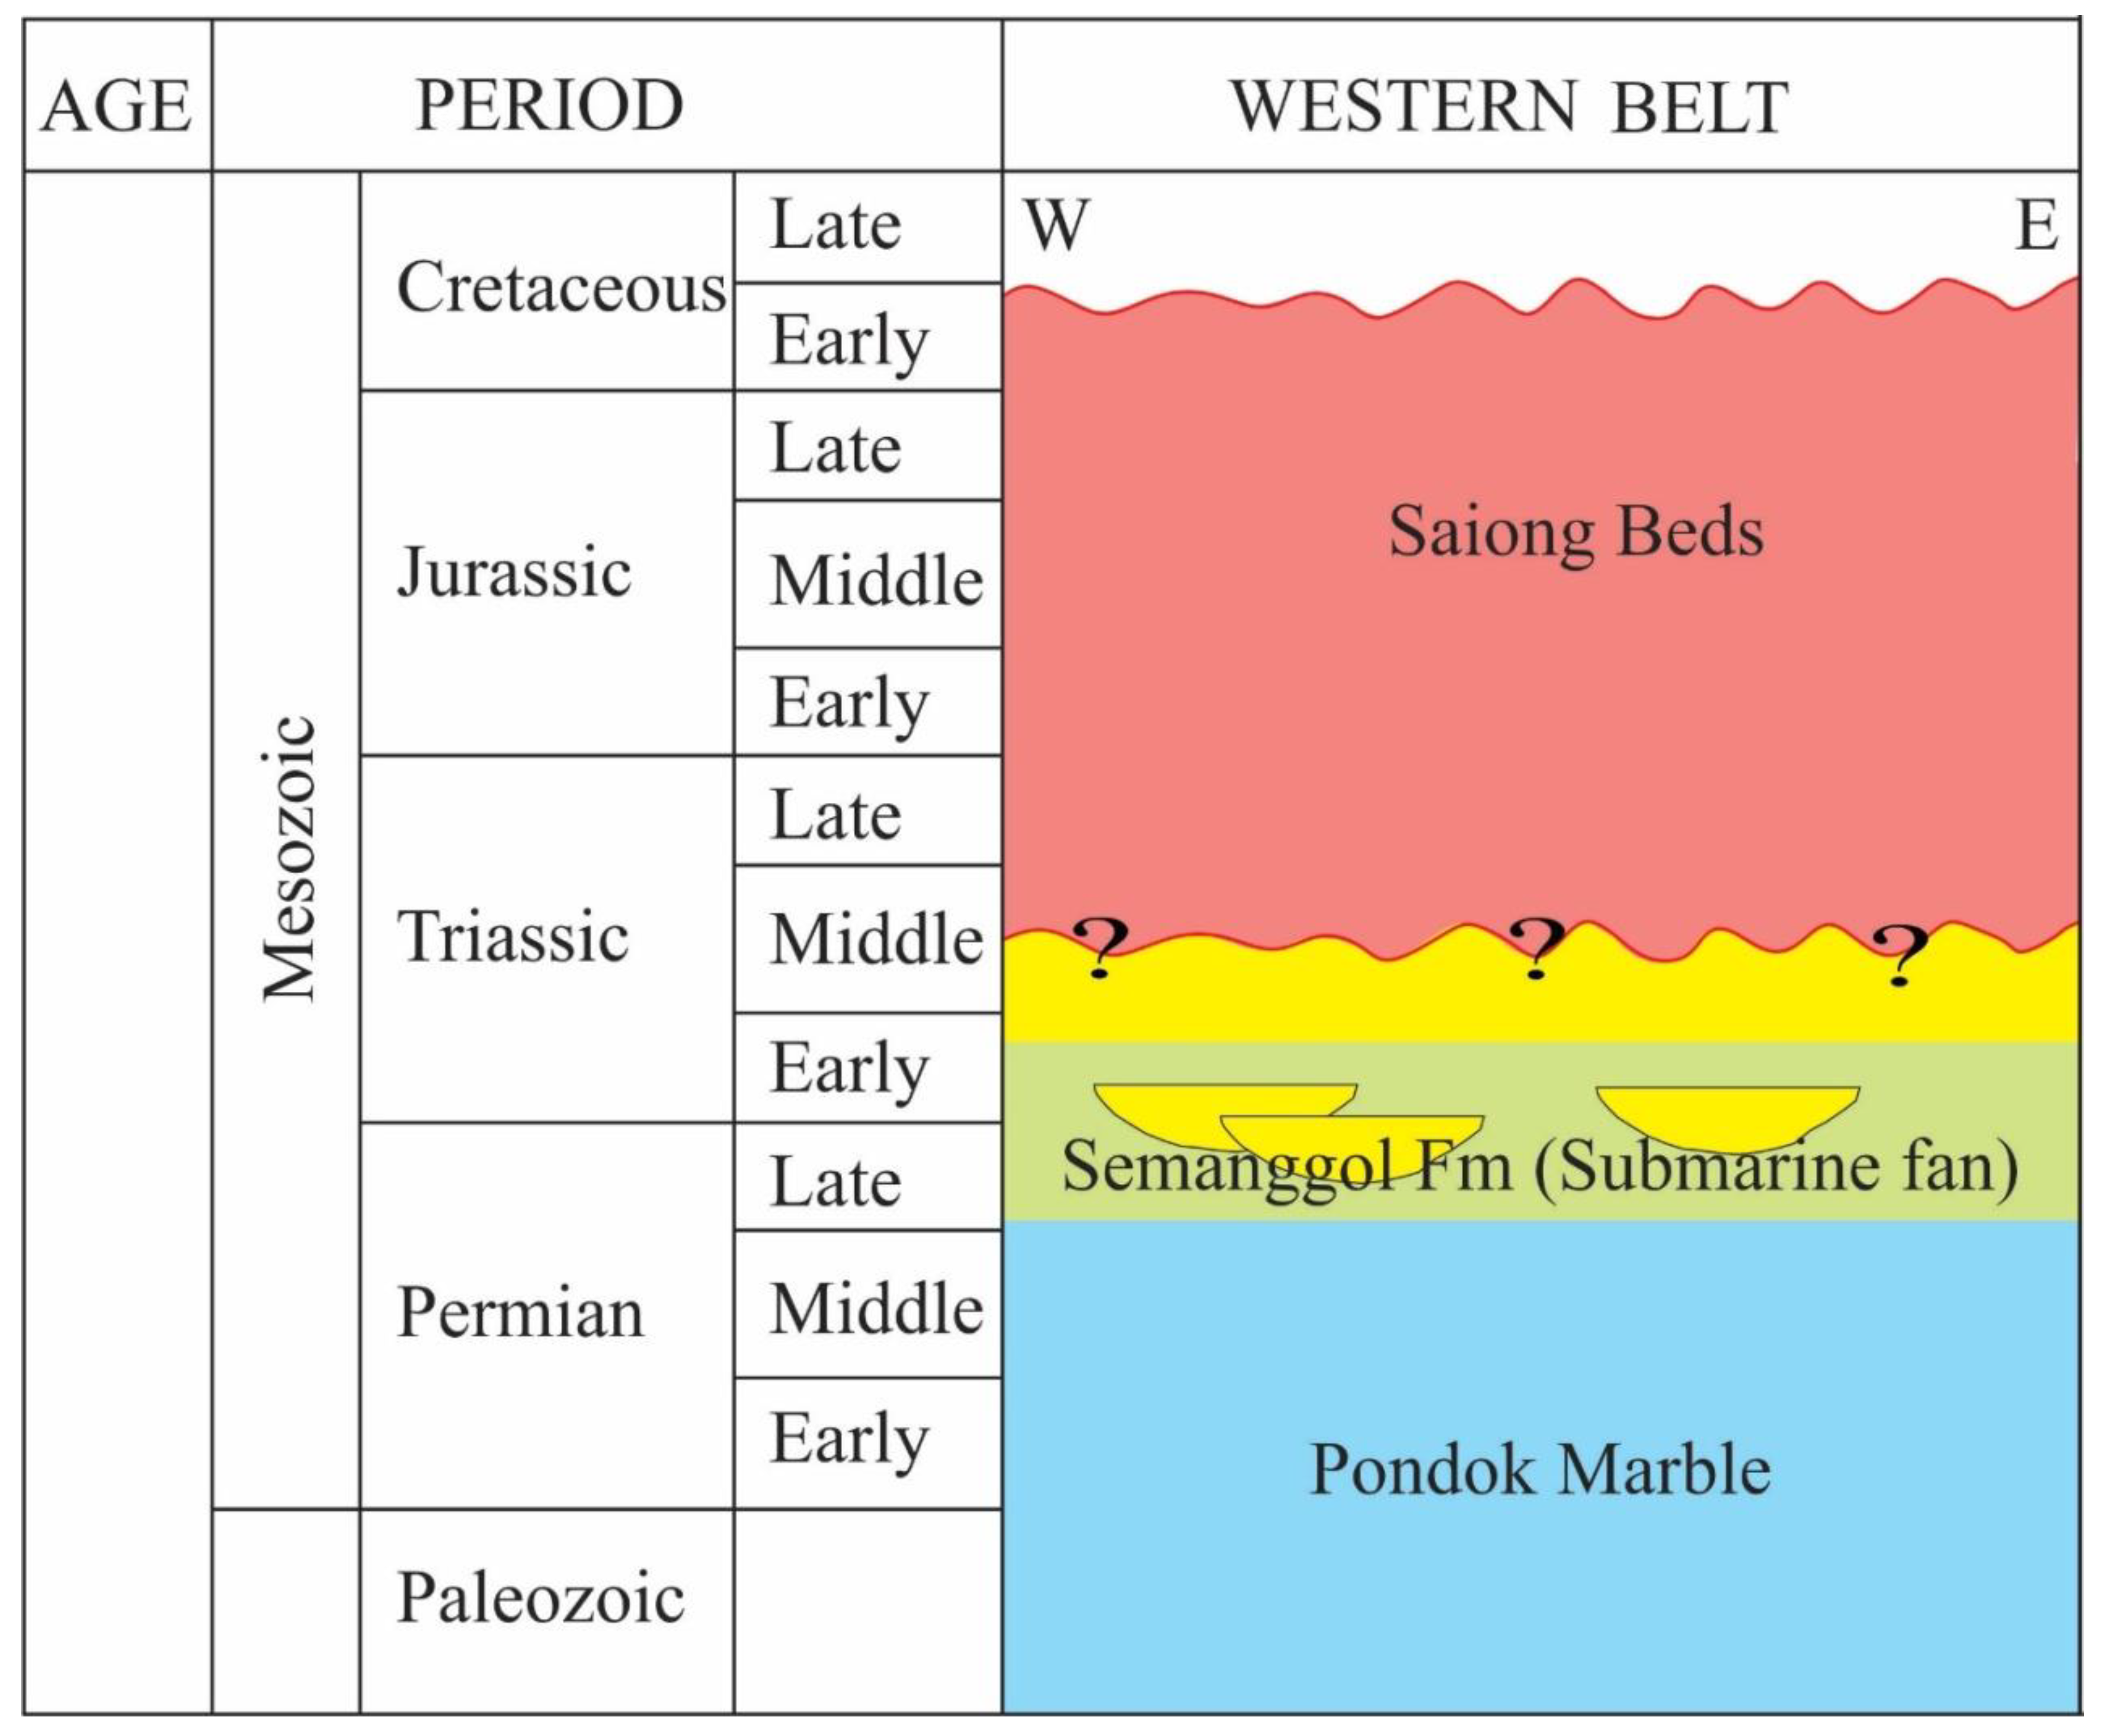
2. Geological Setting

Peninsular Malaysia belongs to the Southeast Asian continental core of Sundaland and possesses two tectonic blocks/terranes, the Sibumasu block in the west and the East Malaya block in the east, which were brought together during the Late Triassic times [15,16]. The Bentong–Raub Suture Zone is the area of separation between the two blocks [17,18]. During the Paleozoic–Mesozoic, northward migration of Southeast Asian continental blocks resulted in the opening and closure of oceanic gateways in the east and west of Panthalassa (Figure 1B). This oscillating nature of oceanic basins in the Tethyan region during the Permian–Triassic resulted in a changing of the ocean currents and further deep marine upwelling, which affected the climatic patterns and distribution of biota (e.g., ammonite dispersal of Brayard [19]) (Figure 1B). Following this, Peninsula Malaysia was uplifted and exposed during the early Mesozoic, and marine sediments were deposited mainly in two areas of the Central Belt (i.e., the northwestern Kodiang-Semanggol and Gua Musang-Semantan depocenters) [20] (Figure 1C).
With the advent of the Mesozoic Era, a large part of the Peninsula was uplifted and remained subaerially exposed. Marine sedimentation was centered in the northwestern Kodiang-Semanggol depocenter and the Gua Musang-Semantan depocenter in the Central Belt. The deposition of the Semanggol Formation commenced into the Kodiang-Semanggol depocenter. Later, the basin truncated into three small basins by thrust/wrench faulting because of tectonic instability during Triassic times [20].
Late Permian-Triassic rocks of the Western Belt outcropping in North Perak were first discovered by Alexander [22], who gave the rock name as the Semanggol Formation. Rocks having similar characteristics were also observed in the northern and southern parts of Kedah [23,24,25]. Before the discovery of “radiolarian assemblages” of Late Permian age from the Chert Member of this formation [26,27,28,29], the whole formation was considered to be Triassic in age. Conodonts from the middle Chert Member represent Middle Triassic, whereas the overlying Rhythmite Member is a Late Triassic deposit [30] (Figure 2). Katsuo [31] further subdivided the Semanggol Formation into seven lithofacies. With regards to regional distribution, outcrops of this formation in the northwest can be found extensively in three “mini basins” of north Perak and north and south Kedah [31,32,33]. It has been proposed that these three widely separated sub-basins of sediment accumulation were once a continuous basin that was truncated by strike-slip faulting [30,34]. The Semanggol Formation consists of two dominant lithofacies: (1) conglomerate-sandstone facies with intraformational conglomerate representing inner fan; and (2) rhythmically interbedded sandstone showing mid-fan and black shale facies representing the outer fan setting of the deep-marine fan system (Figure 3). The active convergent environment and intense volcanism played a pivotal role in the development of deep-marine fan systems of the Semanggol turbidite deposits [35]. Therefore, the fan system of turbidite deposits experienced intensive tectonism along with granitic intrusion (e.g., Sintok Batholith [36]) and basin inversion during the Late Triassic [20].

3. Materials and Methods

A total of 10 representative samples were subjected to mineralogy and inorganic geochemistry analyses and Rock-Eval pyrolysis to characterize the black shale.
Before analysis, the samples were passed through the process of washing, drying, crushing, and grounding in an agate mortar to obtain grains with sizes finer than 200 mesh (75 µm). Some of these analyses, such as TOC, XRD, and SEM with EDX, were performed at the Geosciences Department, Universiti Teknologi PETRONAS, Malaysia. The same suite of samples was also used for Rock-Eval pyrolysis conducted by the CGG Professional Laboratory, Aberdeen, United Kingdom; however, analyses for major oxides, trace elements (TEs), and rare earth elements (REEs) were performed at the ACME Lab, Canada.
The mineralogical composition of the black shale was determined by XRD and SEM with EDX. For XRD analysis, both bulk and clay fractions of the black shale were used. Bulk rock samples were pulverized by agate mortar and placed in the X-ray frame. The clay fractions were separated by placing 10 g of the sample in a 600 mL beaker diluted with 1 M acetic acid to remove the carbonates. After some time, when there was no more reaction in the solution, the residue was washed with distilled water.
For the removal of organic matter, the samples were treated with 30% concentrated hydrogen peroxide (H2O2). Complete disaggregated rock samples were washed with distilled water several times to suspend all clay particles. Suspended clay fractions were then sucked by a dropper and placed onto glass slides and left to dry. Three slides were prepared for every four samples: (1) one for untreated, (2) second slide treated with ethylene glycol vapor at 60 °C for 1 h, and (3) third slide heated at 550 °C for 3 h. Both bulk shale samples and clay fractions were analyzed by utilizing the Bruker D8 X-ray generator with Ni-filtered Cu–Kα, operated at 40 kV and 25 mA. For the bulk samples, scanning showed a limited range between 2° and 80° 2θ, while for clay fractions it varied from 2° to 40° 2θ.
The external morphology (texture), mineral chemical composition, crystalline structure, and orientation of materials were analyzed using SEM. Moreover, the chemical composition of selected spots in the prepared samples was determined using SEM coupled with EDX. Four samples were prepared for this purpose, with a dimension of about 70 mm in diameter and 50 mm in height. To remove the moisture, samples were dried in an oven overnight at a temperature of around 35 °C. After the moisture removal, samples were coated with a thin layer of carbon to prevent charge buildup and to obtain a clear image of the target material.
Major oxide (e.g., SiO2, Na2O, Al2O3, Fe2O3, TiO2, CaO, K2O, MnO, MgO, and P2O5) compositions were analyzed by XRF using a Philips PW 2400 X-ray spectrometer. The tube voltage was 40 kV, and the current was 60 mA. Powder samples were heated up to 1000 °C for 6 h to determine the loss on ignition (LOI). Inductively coupled plasma mass spectrometry (ICP-MS) was applied to estimate trace and rare earth elements. Analytical uncertainties were about 0.01 to 1 for all oxides, trace elements, and rare earth elements. The finely grounded samples were entirely dissolved in HF (38%) and HNO3 (68%) in capped Teflon bombs on an electric hot plate (~150 °C) for 24 h. The solution was evaporated to near dryness and redissolved in 2 mL of 6 mol/L HNO3 in capped Teflon bombs at 150 °C for two days. The samples were evaporated near to dryness, then 1 mL of 6 mol/L HNO3 was added, and the solutions were further diluted for analysis (e.g., [37]). The same set of 10 samples was used to determine TOC content at the Department of Petroleum Geosciences, Universiti Teknologi PETRONAS, Malaysia, by using a Source Rock Analyzer (SRA; Weatherford). Further, for Rock-Eval pyrolysis, about 10 mg of each sample was sent to the CGG professional Laboratory, Aberdeen, United Kingdom.

Location of Sample Collection

The outcrops of the turbidite-bearing succession of the Semanggol Formation were measured from three sections: (1) Gunung Semanggol, North Perak; (2) Bukit Merah, North Perak; and (3) Nami, North Kedah (Figure 1A). The samples were collected from black shale horizons as shown in Figure 3 and Figure 4. Triassic black shale of the Semanggol Formation is dark grey to medium light grey, thin to medium bedded intercalated with fine sandstone/or siltstone with a thickness of 15 to 20 m. The upper contact was not exposed in most of the sections. In contrast, the lower contact has thinly bedded sandstone-siltstone and interbedded shale, which is further overlain by conglomerate dominated facies. The samples were carefully taken from outcrops by removing some weathered layers to avoid any contamination of weathering material. Furthermore, 1–2 kg of fresh rock samples were appropriately labeled and packed in plastic bags.

4. Results

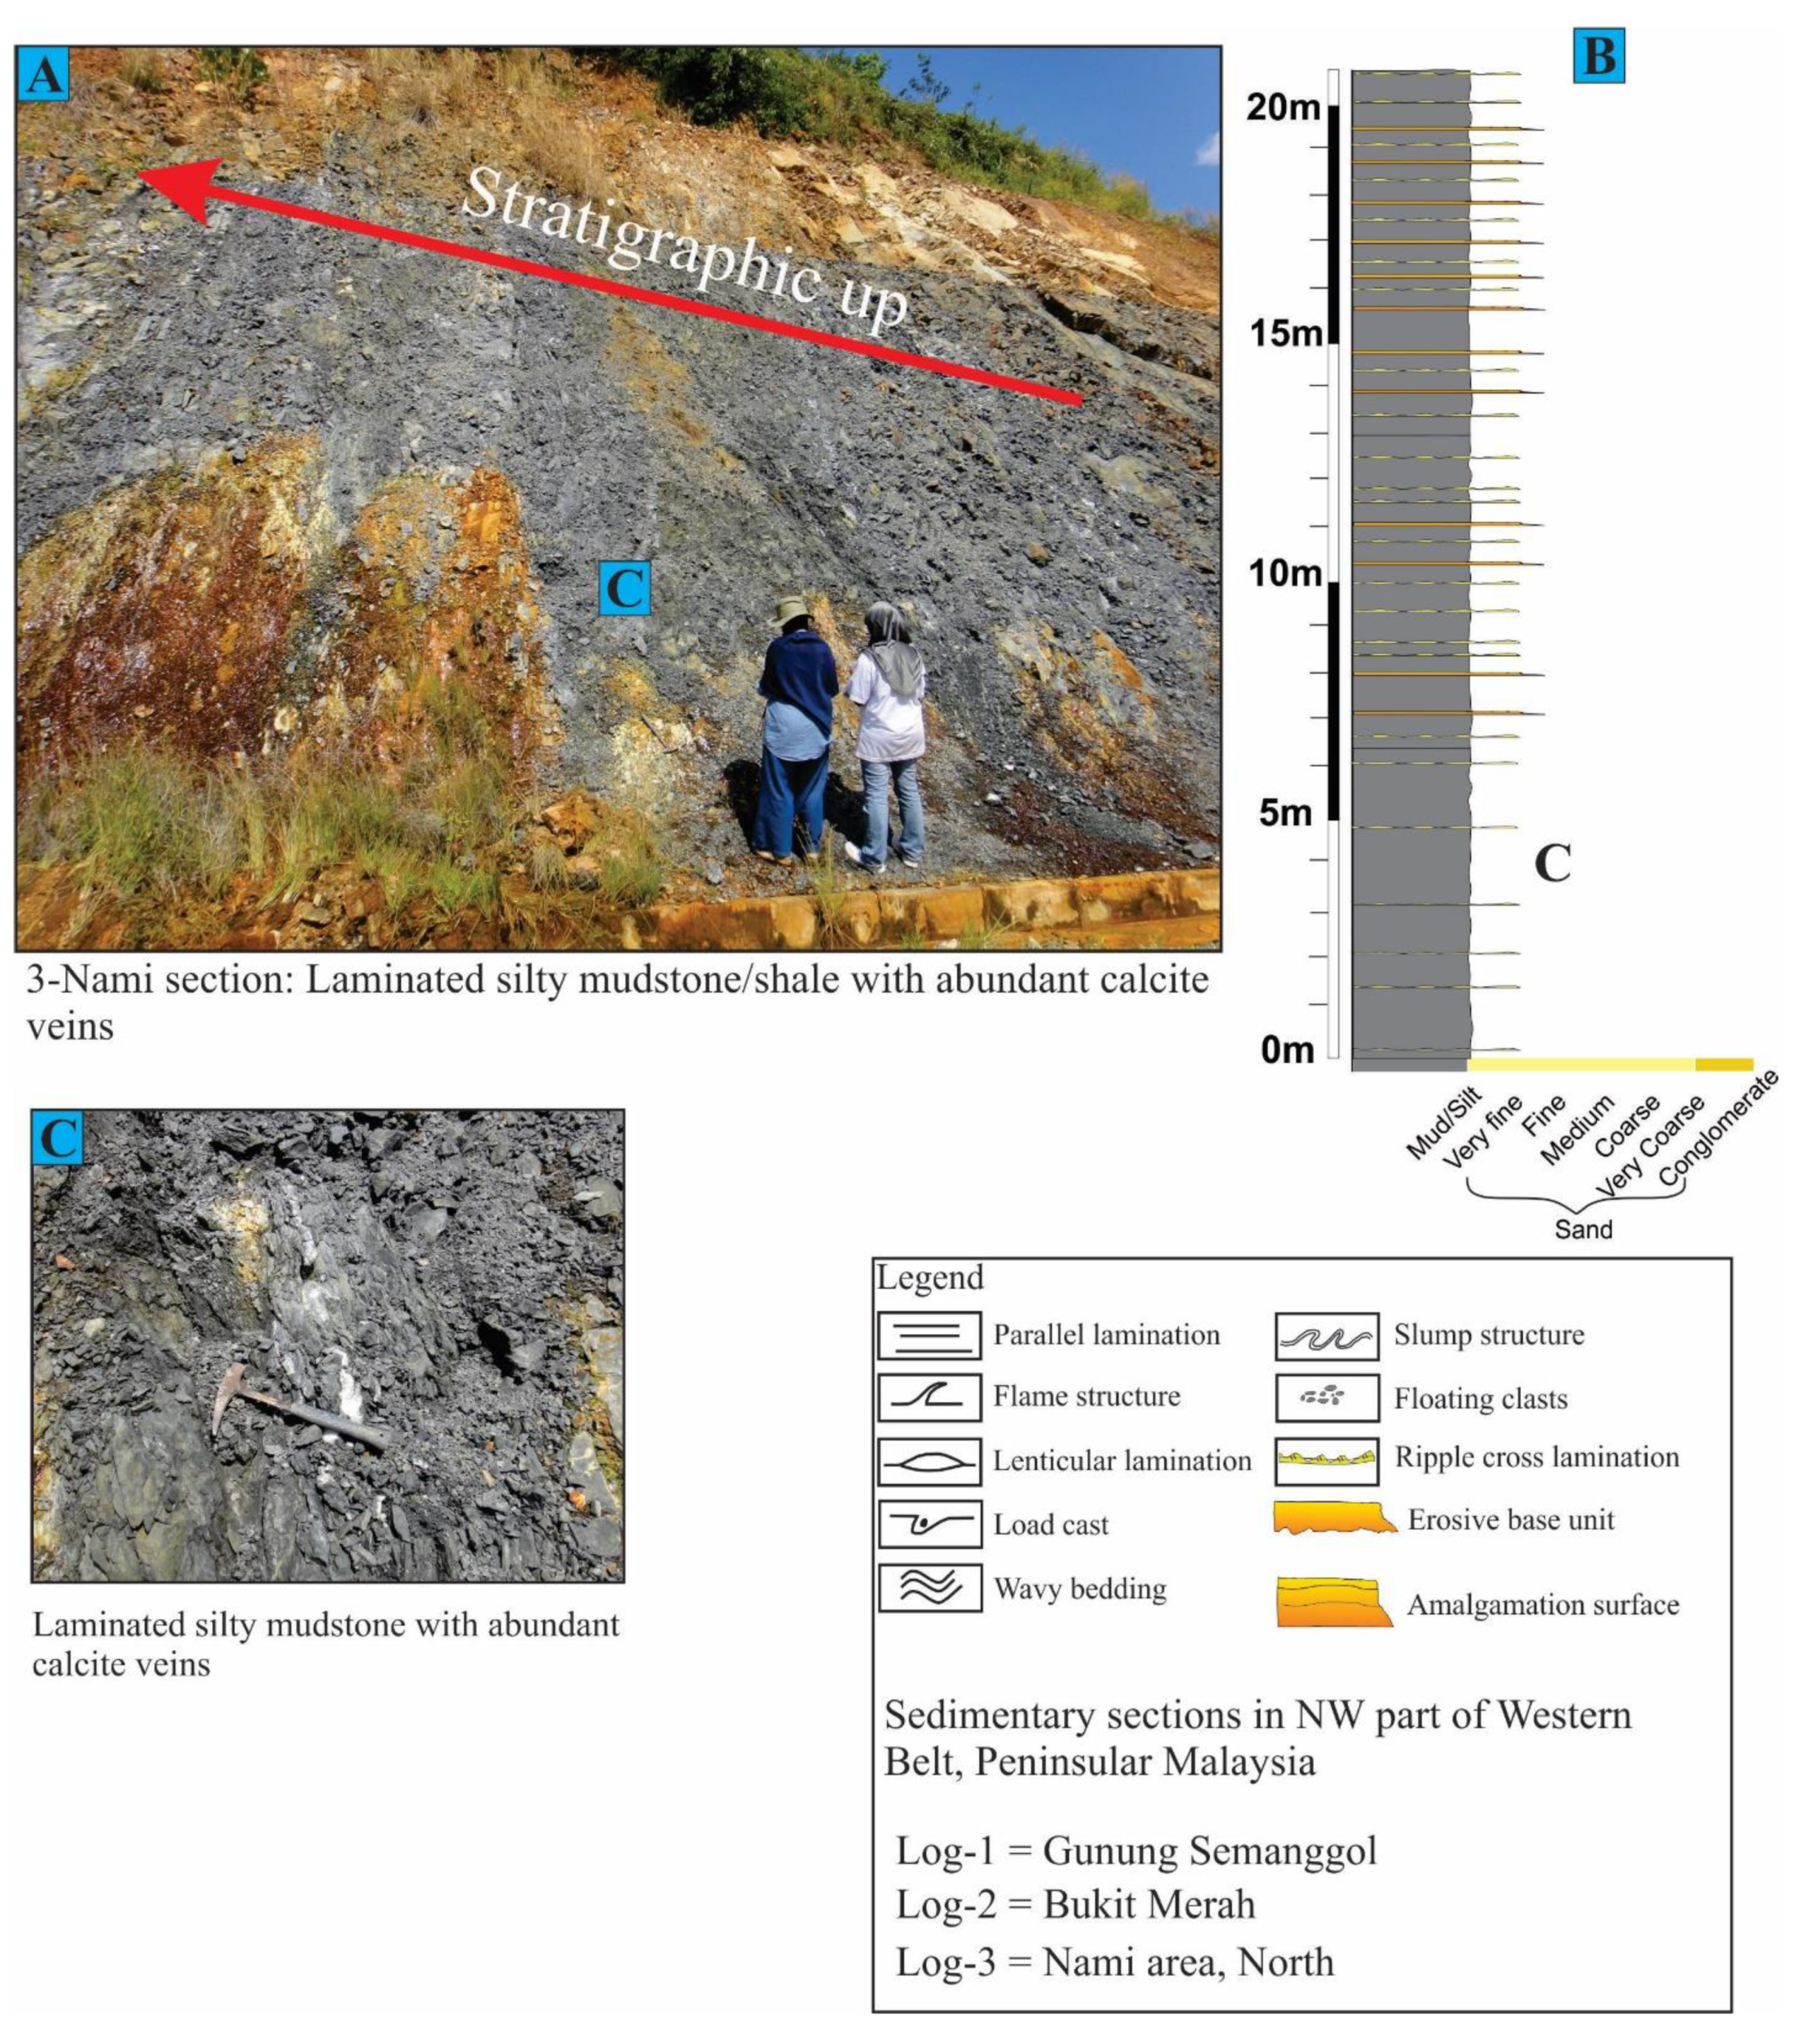
4.1. Sedimentary Characteristics

Nine sedimentary facies (Facies Fsg1–Fsg9) (Table 1) were identified in the Semanggol Formation and characterized into four major facies associations (FAs): (1) FA I, channel-fill complex; (2) FA II, levee or overbank; (3) FA III, distal lobes; and (4) FA IV, mass transport complexes (MTCs). The study area is dominated by the channel axis, levee deposits, and distal lobes within submarine fan settings [38].

4.2. Organic Geochemistry

TOC is shown in Table 2 along with the Rock-Eval pyrolysis for the 10 samples. The total organic carbon content range between 0.20 and 11.69 wt.% (average: 3.03 wt.%), but a sample from Gunung Semanggol shows exceptionally high TOC content, with values of 11.69 wt.%. TOC content decreasing according to the sample location (i.e., from Gunung Semanggol (0.21–11.69 wt.%, average: 4.42 wt.%) to Bukit Merah (0.36–2.57 wt.%, average: 1.35 wt.%) and Nami (0.55–3.67 wt.%, average: 2.11 wt.%).
The hydrogen index (HI) of the 10 selected samples fluctuate from 1 to 29 mg/(g of TOC) (average: 8 mg/(g of TOC)), and the oxygen index (OI) varies from 6 to 48 mg/(g of TOC) (average: 17 mg/(g of TOC)) (Table 2). Plots of HI−Tmax [39] and HI-OI [40] (Figure 5A,B) show that majority of black shale samples possessed type-III kerogen, while only two samples indicate type-II kerogen. The Tmax values range between 313 °C and 610 °C for all samples, indicating immature to post-mature thermal evolution. The production index (PI) values vary from 0.21 to 0.52 (average: 0.37). The plot of TOC vs. S1 (Figure 5C) can be utilized to distinguish between non-indigenous (allochthonous) and indigenous hydrocarbons (autochthonous). This plot shows that the majority of the studied black shale samples characterized as allochthonous hydrocarbons, meaning that the organic matter was not produced by the source rock itself.

4.3. Inorganic Geochemical Analysis
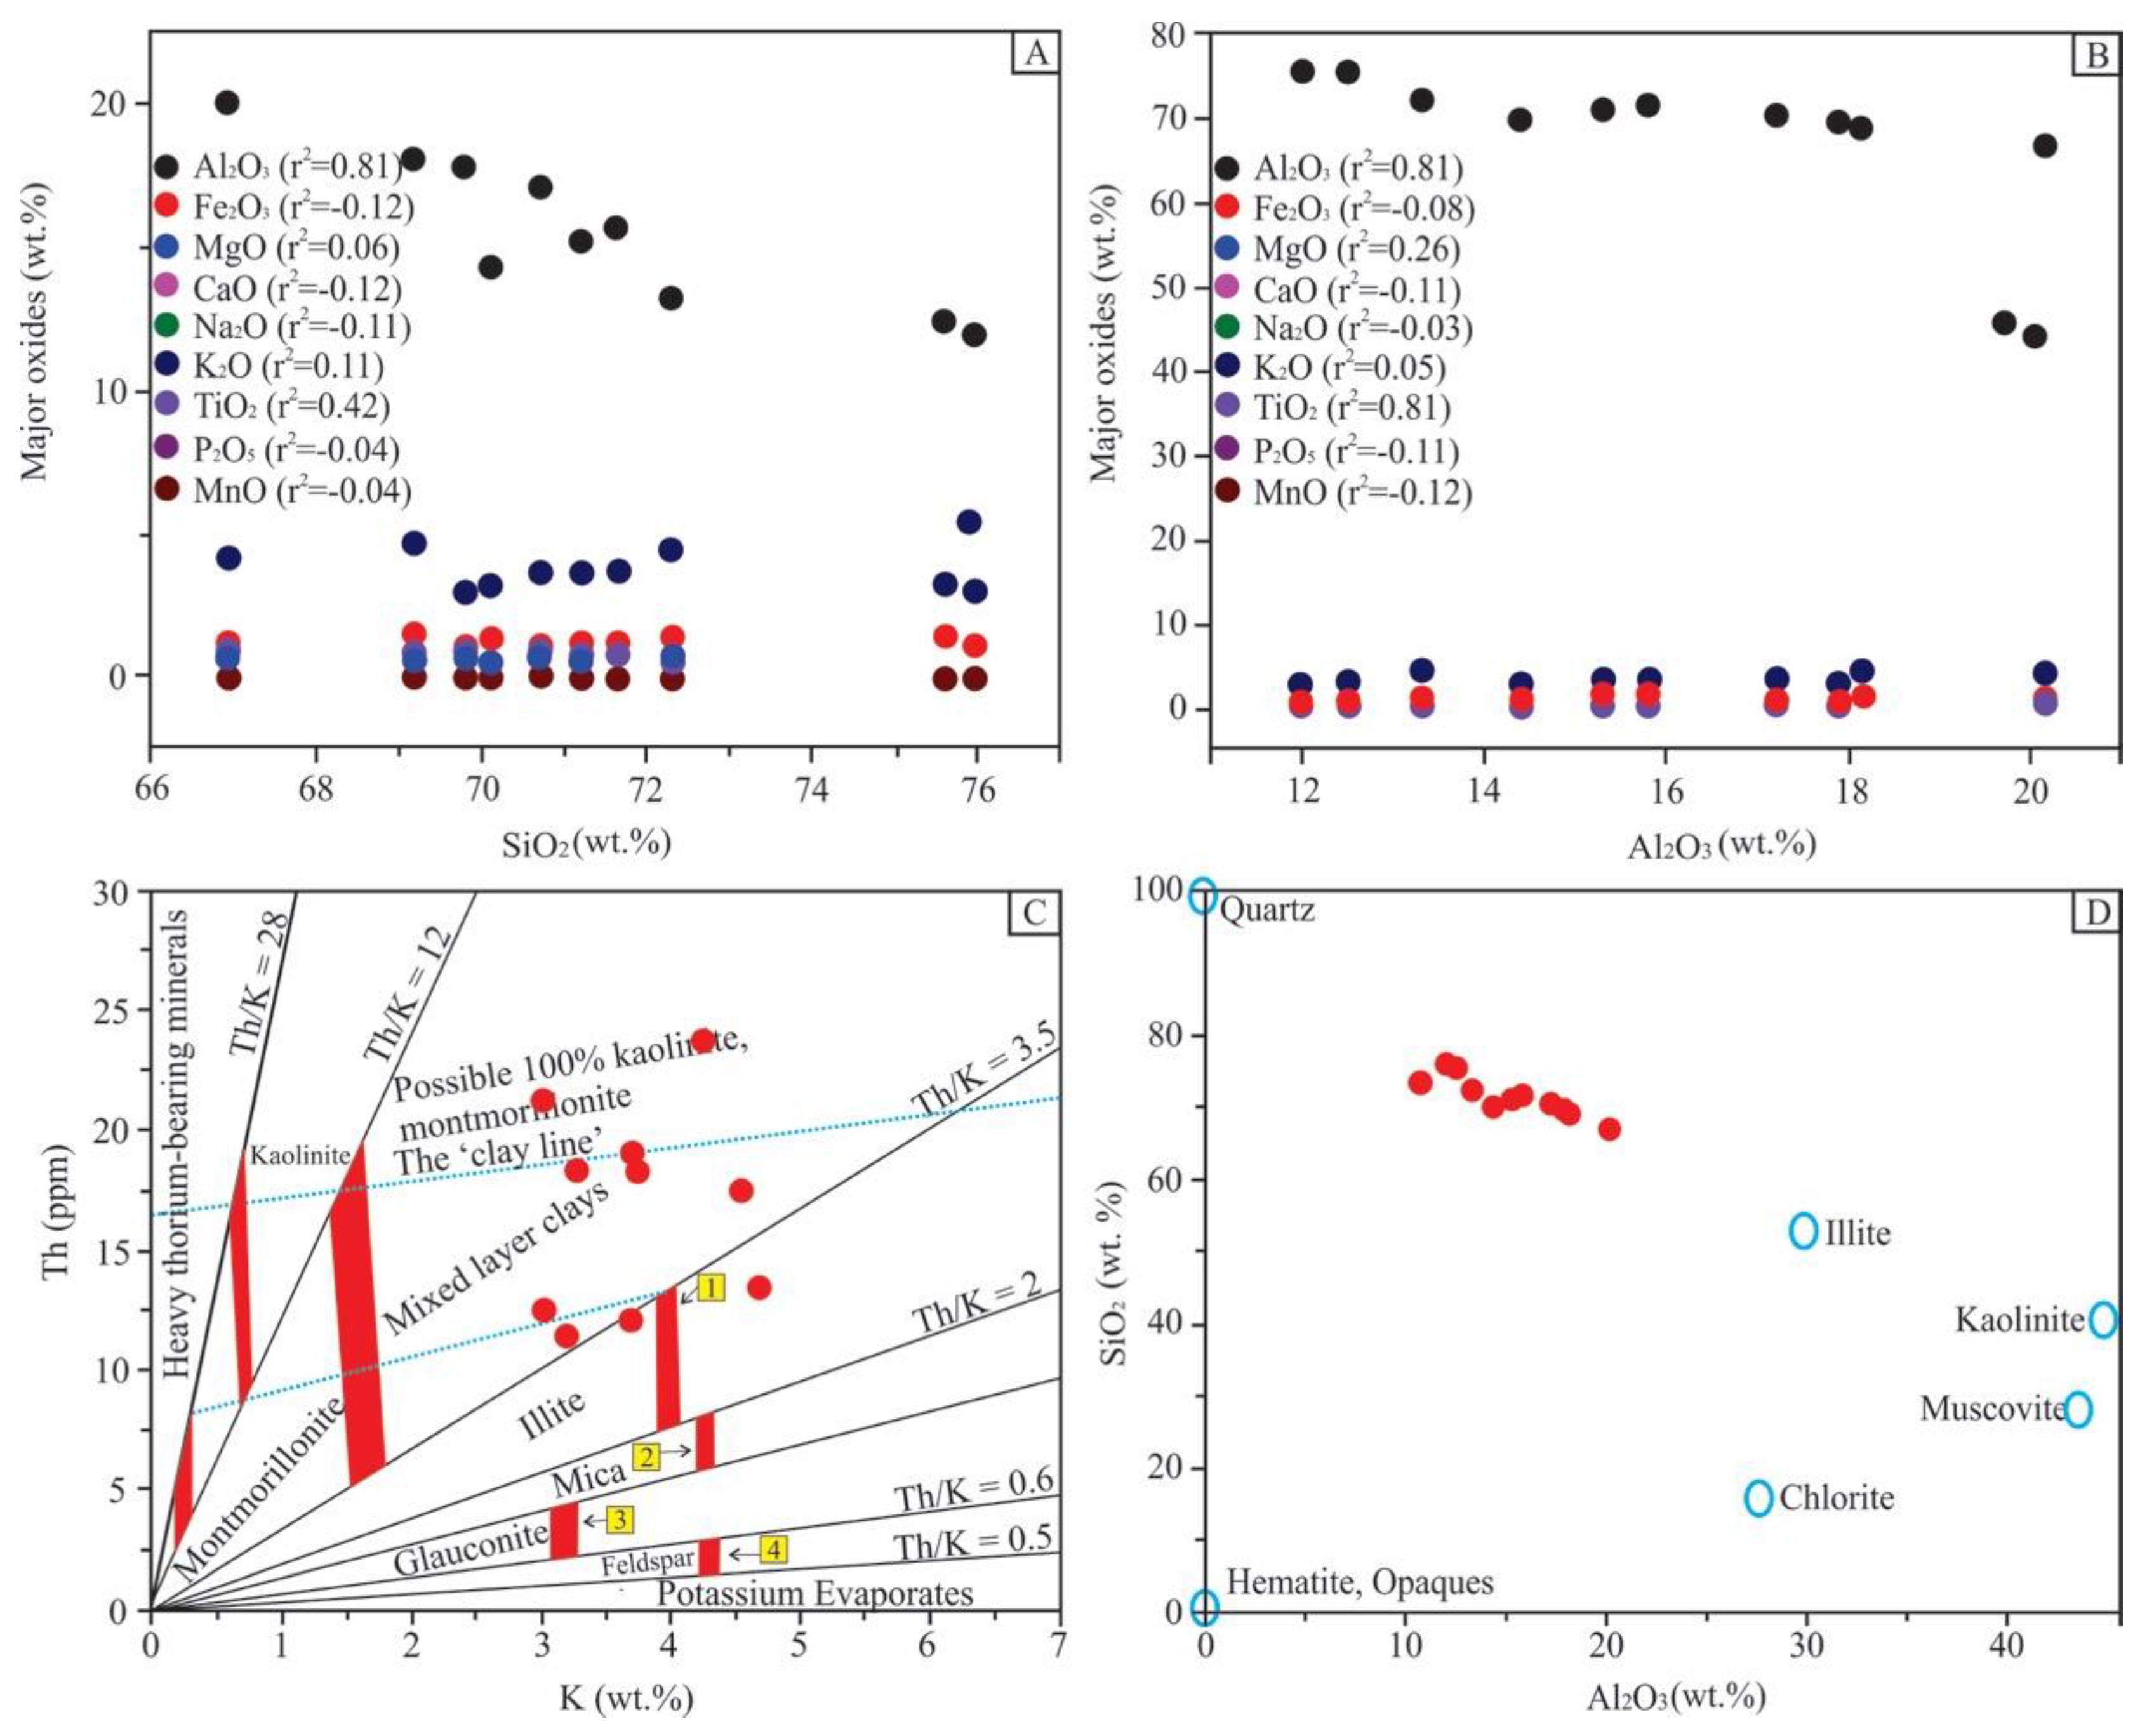
4.3.1. Major Oxides

The concentrations of major oxides in the black shale of the Semanggol Formation are shown in Table 3, including SiO2 (71.34%), Al2O3 (15.66%), Fe2O3 (1.28%), and K2O (3.71%). Some major elements are less than 1%, such as MgO (0.65%), CaO (0.019%), TiO2 (0.73%), P2O5 (0.03%), and MnO (0.02%).
Al2O3 and TiO2 are representative of the detrital component in the black shale of the Semanggol Formation because of their immobility during diagenesis, and are often regarded as a useful proxy for detrital influx [12,41]. Silica dioxide (SiO2) showed a strong positive correlation with Al2O3 and TiO2 and a negative correlation with Fe2O3, CaO, Na2O, P2O5, and MnO (Figure 6A). Aluminium oxide exhibited a strong positive correlation with SiO2 and TiO2 (0.81) and a negative correlation with Fe2O3, CaO, Na2O, P2O5, and MnO (Figure 6B). According to Parrish [42], nutrient-rich elements supply to support marine biological life ultimately lead to organic matter enrichment.
Different equations have measured the degree of weathering of fine-grained sedimentary rocks, (i.e., Nesbitt and Young’s [43] equation for the Chemical Degree of Alteration (CIA) and Harnois’s [44] equation for the Chemical Index of Weathering (CIW), as shown in Equations (1) and (2), respectively:
CIA = [ Al 2   O 3 CaO + Al 2   O 3 + N 2   O + K 2   O ]   ×   100
CIW = [ Al 2   O 3 CaO + Al 2   O 3 + N 2   O ]   ×   100
The CIA and CIW values for black shale from three sections are listed in Table 3. The black shale CIA values ranged from 79.40 to 85.27 (average: 81.85) for the Gunung Semanggol section, 74.23 to 81.54 (average: 78.16) for the Bukit Merah section, and 79.17 to 80.40 (average: 79.78) for the Nami section. On the other hand, CIW values ranged between 99.28 and 99.73 for the black shales of all the three sections. All three sections had higher CIA values (CIA: 69) for black shales than post-Archean Australian shale (PAAS) [45], indicating their origin from a more weathered source as compared to PAAS.

Type of Clay

Compositional variations of clay minerals have been used to approximate paleolatitudes with similar climatic conditions. According to Einsele [46], the concentration of illite clay minerals can advocate humid-temperate climates. Moreover, chlorite and illite clays are frequently found in areas that have previously been subjected to tectonic uplift as well as in cold desert areas [47,48]. The occurrence of illite clay minerals is also common at mid-latitudes in deep-marine sediments, and the formation of “mixed-layer clays” indicates a very low intensity of chemical weathering [48]. For this reason, different cross-plots of Schlumberger [49] and Cullers and Podkovyrov [50], such as Th vs. K (Figure 6C) and SiO2 vs. Al2O3 (Figure 6D), respectively, are utilized to depict the type of clay as well as the variation of clay minerals within black shale horizons.

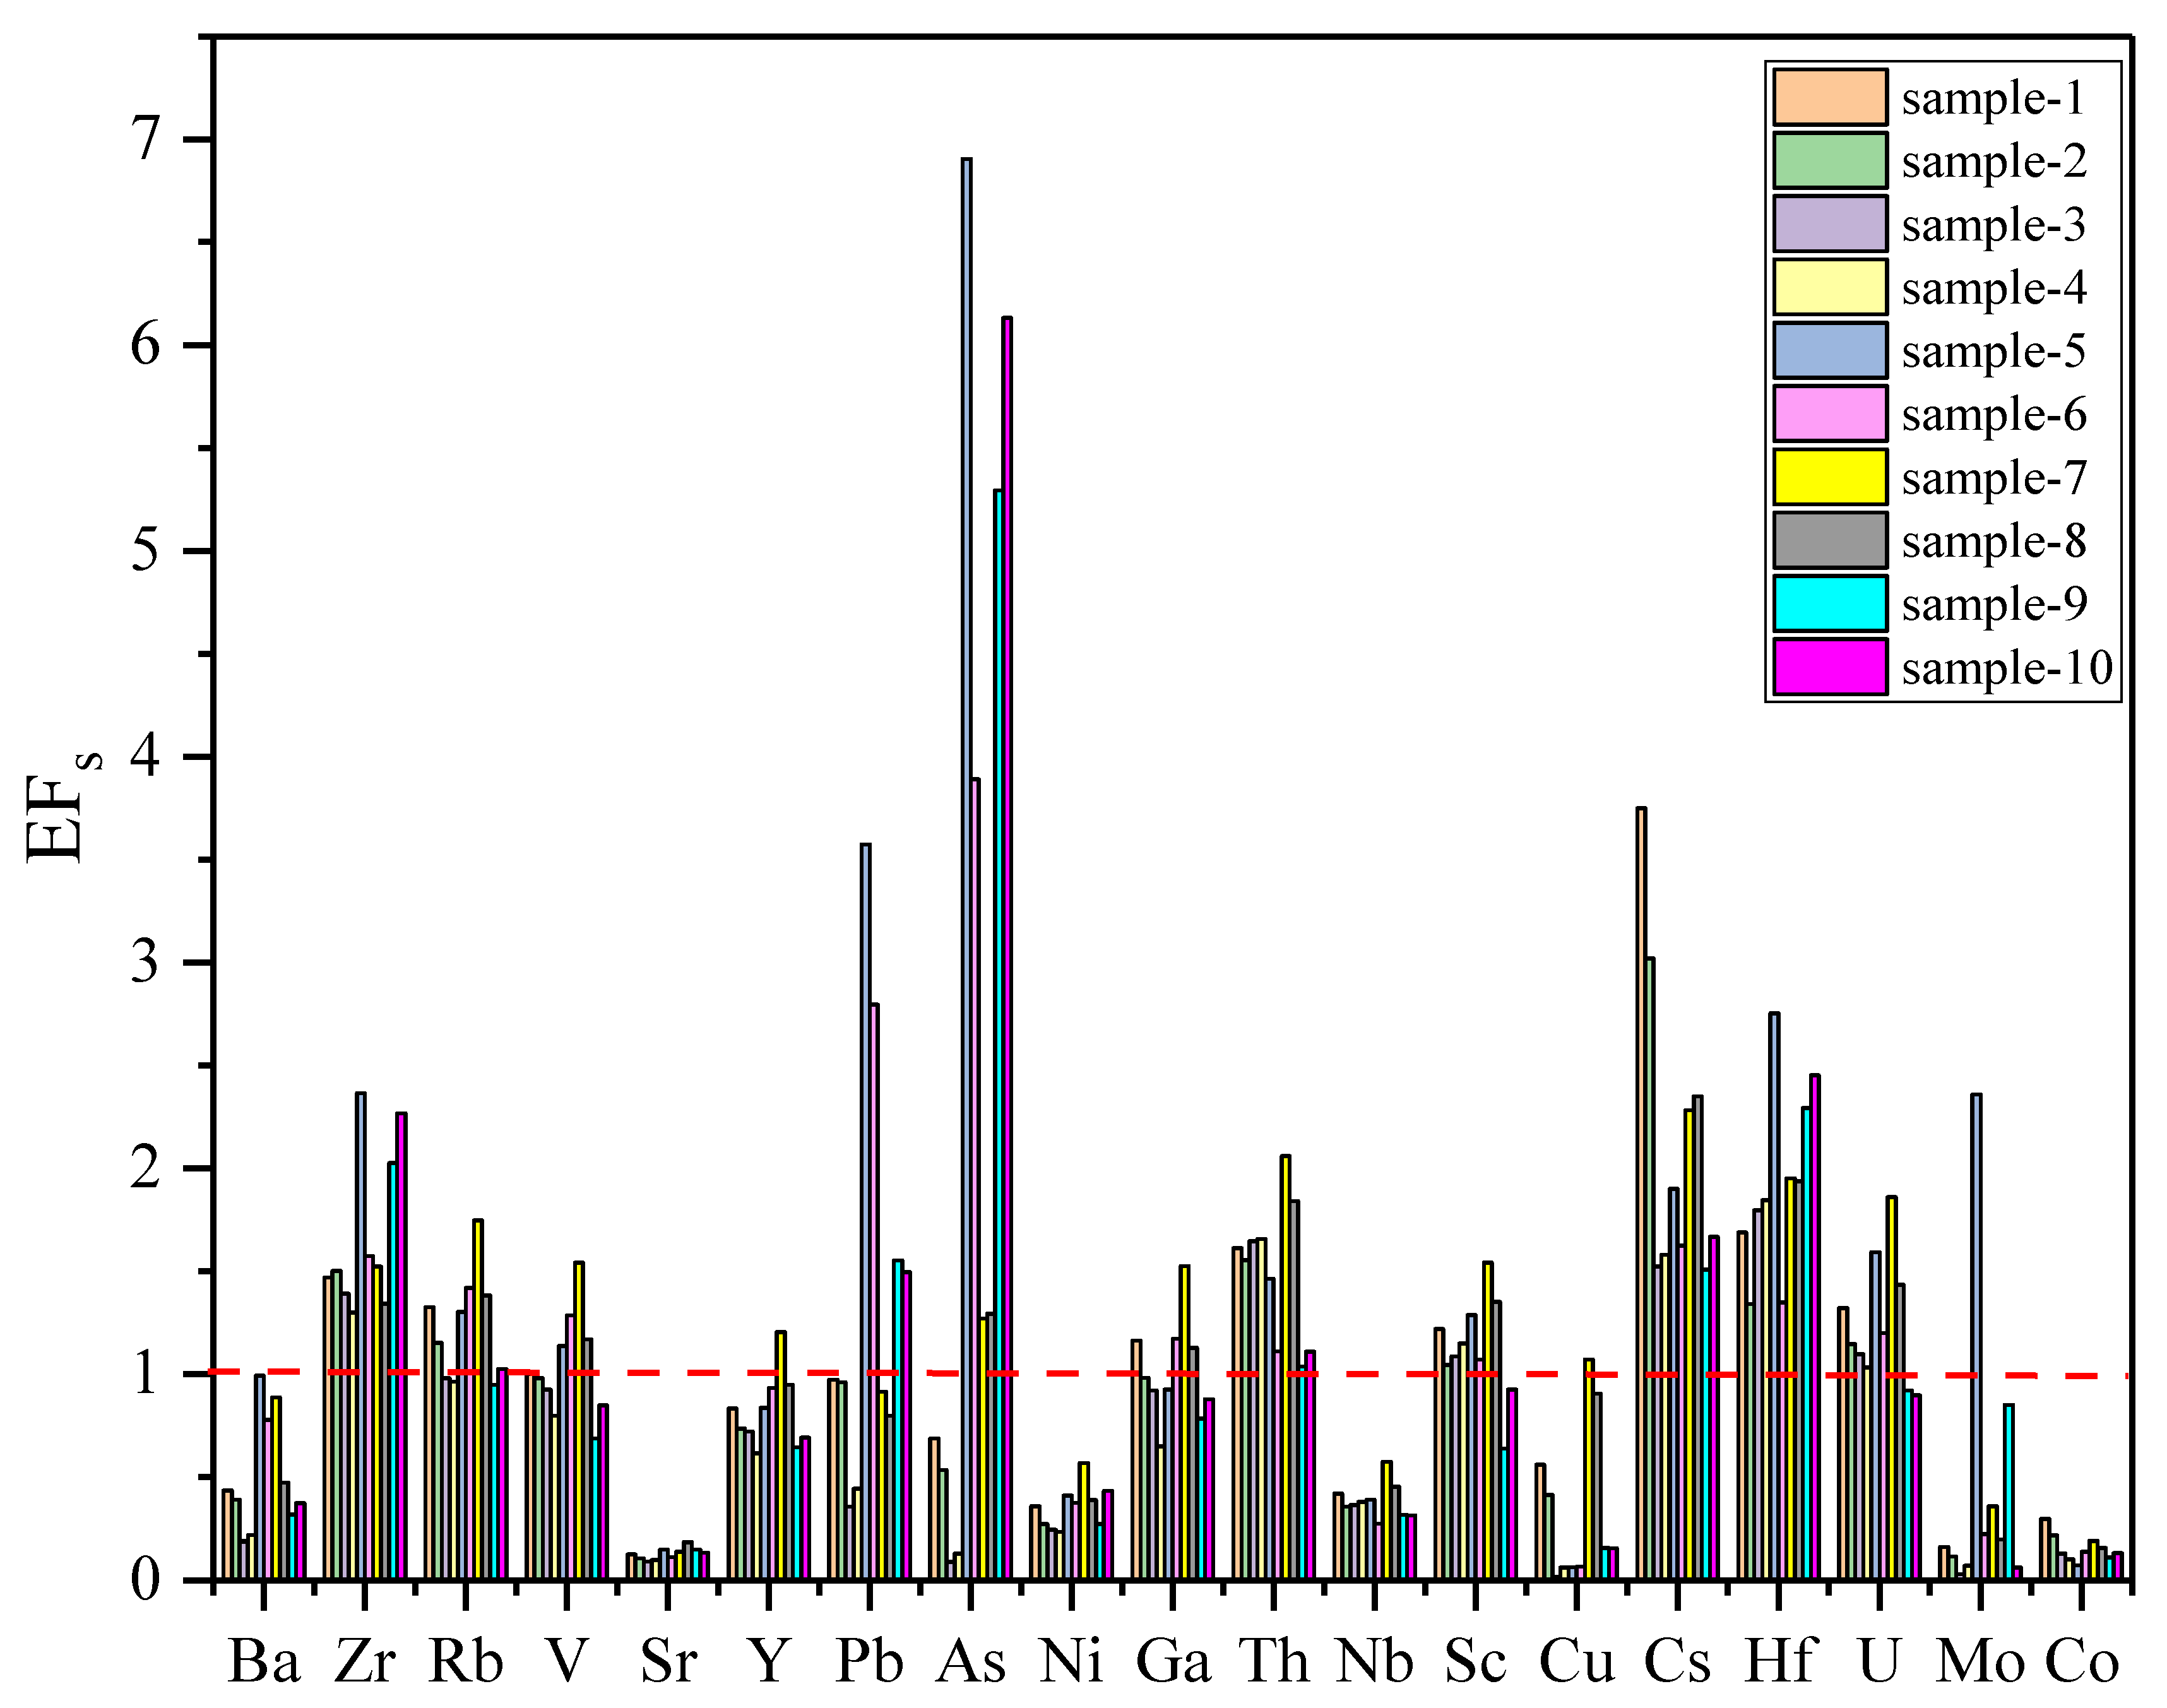
4.3.2. Trace Elements

In Table 4, TE compositions of the black shale samples are shown from three sections. The most abundant TEs in black shale included Ba, Zr, Rb, V, W, Sr, and Y. The remaining TE concentrations were lower than 30 ppm (Table 4). The enrichment factor (EF) has previously been considered to further characterize the degree of enrichment of TEs in the rocks [14,51,52].
For the enrichment factor, each element is first normalized by aluminium (Al), which is considered as one of the most significant detrital fractions; next, a comparison of these normalized values to their equivalent average shale is made [51,52]. In Equation (3), elementsample represents the investigated shale sample, and elementaverage shale represents the average shale [53].
EFelement = (element/Al)sample/(element/Al)average shale
Therefore, if the EFelement is greater than 1, the TEs are enriched relative to average shale, whereas an EFelement value less than 1 indicates depletion [12].
Distribution of TEs based on EF averages (Table 5) shows that W, As, Cs, Hf, Zr, Th, Pb, Rb, Sc, Ga, and V are enriched relative to average shale, where the enrichment of these TEs may have been related to organic matter and/or clay mineral deposition [54]. On the other hand, Sr, Co, Cu, Ni, Nb, Mo, and Ba are relatively depleted, representing the weathering of black shale [55,56] (Figure 7). Ratios of Zr/Hf 35 ± 2 suggest that the trace element data are reliable within the range of sedimentary and igneous rocks, and not affected by anomalous hydrothermal processes [57]. The average ratio of Zr/Hf for the studied black shales is 34.98.

4.3.3. Bioproductivity Proxies

Phosphorus (P) and nitrogen (N) are the vital nutrient elements of marine organisms. Phosphorus is considered an essential element of skeletal material and metabolic processes [12]; for this reason, phosphorus is widely utilized as an indicator of paleoproductivity. To reduce the effects of authigenic minerals and the dilution of organic matter on P content in terrigenous detrital fractions, ratios of P/Ti or P/Al are considered for the evaluation of paleoproductivity because titanium and aluminium originate from terrigenous sources. In the studied black shales, P/Ti ratios range between 0.008 and 0.13 (average: 0.04), and the mean value of Semanggol black shale was lower than average black shales values (0.79 ± 1.63) [58].
Barite is also used as a paleoproductivity indicator because the accumulation rate of barite in marine deposits exhibits a positive correlation with primary productivity [59,60]. Ratios of Ba/Ti or Ba/Al can be applied to approximate paleoproductivity [61]. Ba divided with Ti or Al eliminates the dilution impact of different components. Thus, both ratios are representative of the quantity of marine organisms in the ancient sea. Ba/Al ratios vary from 18.1 to 95.34, with an average of 48.55.

4.3.4. Rare Earth Elements (REEs)

The concentrations of REEs and related geochemical indicators for the studied samples are shown in Table 6. The total REE (∑REE) concentrations of the 10 black shale samples vary between 169.25 and 341.57 ppm, with an average value of 254.46 ppm (Table 6) having higher concentrations relative to North American shale composite (NASC) (i.e., 173.21 ppm), post-Archean Average Australian shale (PAAS) (i.e., 183.03 ppm), and upper continental crust (UCC) (i.e., 146.4 ppm) [62,63].
The Eu and Ce anomalies were measured using Equations (4) and (5) from Bau and Dulski [64] Dai et al. [65], respectively.
Eu N / Eu N * = Eu N / [ ( Sm N ×   0.67 ) + ( Tb N   ×   0.33 ) ]
Ce N / Ce N * =   Ce N   / ( 1 2   La N   +   1 2   Pr N )
Sample-1, -3, -4, -5, and -7 ((Ce/Ce*)N = 0.68–0.96) show negative Ce* anomalies, and Sample-1, -4, -5, and -7 ((Eu/Eu*)N = 0.58–0.94) show negative Eu* anomalies (Table 6). All other samples display positive Ce* and Eu* anomalies.
Typically, the sedimentary rate of shale has been determined by utilizing the (La/Yb)N ratio [66,67]. The ratios of the studied shale vary from 0.73 to 2.32 (average: 1.31) (Table 6), representing a high sedimentary rate during the black shale deposition in the Semanggol Basin. This high rate of sedimentation would result in weak fractionation of REEs, which is consistent with the trends of the PAAS-normalized REE distribution patterns for different black shale samples.

4.4. Mineralogical Compositions

The analyses by SEM coupled with EDX propose that the black shale samples are predominantly comprised of clay minerals like kaolinite and illite along with quartz, feldspar, pyrite, and some heavy metals like zircon and titanium.
The flakes of kaolinite have shown a deformed morphology and undefined outlines with curved and bent flakes (Figure 8A). The composition of kaolinite is also evident from the EDX pattern where Al and Si represent their elemental composition (Figure 8B). Illite consists of crumbled plates with unclear outlines under SEM micrographs (Figure 8C) about 2 μm in size. EDX spectra displaced the elemental composition of typical illite where Al, Si, and K are the main constituents (Figure 8D).
The XRD results are shown in Figure 8E, F for clay fractions of the Semanggol Formation. Illite and kaolinite are the only clay minerals interpreted in the XRD spectrum for the studied black shale. Illite diffraction peaks can be noted at d = ∼10.02 and 5.02 Å. The X-ray diffraction spectral of the Semanggol illite correlates well with that of the pure illite (d = 10.1, 5.00, and 3.38 Å). In contrast, kaolinite diffraction peaks can be identified at d = ∼7.17, 4.36, and 3.58 Å. Non-clay minerals are also noticeable (predominantly quartz grains). Therefore, the XRD pattern of black shale reveals that illite, kaolinite, and quartz were major constituents of Semanggol shale. Furthermore, values of illite crystallinity (IC) in the black shale samples fluctuated between 0.20° and 0.40° Δ2θ (average: 0.30° Δ2θ). Based on the illite crystallinity classification chart, the values of the IC fall under the anchizone [68].

5. Discussion

5.1. The Terrigenous Influx and Weathering Intensity

Aluminium (Al), titanium (Ti), silica (Si), and zirconium (Zr) are considered detrital proxies [69]. The concentration of Al (aluminium) is principally associated with aluminosilicate clay content, while the concentration of Ti (titanium) is also related to clay minerals but also with some heavy metals like ilmenite and rutile [70]. The strong positive correlation of Al2O3 with TiO2 in the black shale proposes that the presence of TiO2 linked to aluminosilicate detrital fractions (Figure 6B). Moreover, insignificant fluctuations of Al2O3 and TiO2 indicate that terrestrial detrital input is relatively stable [51,63]. The input of detrital fractions significantly influences organic matter accumulation and the composition of black shale in several ways: (1) It can dilute the organic matter content and slow down the rate of sedimentation; (2) Aluminosilicate clay minerals can hold the organic matter by an adsorption effect; (3) Detrital influx can also regulate organic matter degradation proficiency and burial rates [14,71]. The bivariate plot of Al2O3 and TiO2 exhibits weak to moderate positive correlations with TOC (r2 = 0.22). Further, (Zr + Rb)/Sr (7.38–13.6 with a mean of 11.42) and Zr/Rb (1–2.53 with a mean of 1.64) ratios are also used to distinguish between the siliciclastic and carbonate contents of rocks. Higher values suggest less carbonate content and a more siliciclastic influx [5].

5.2. Paleoredox Conditions

Recently Algeo and Liu [7] reported that enrichment factors of redox-sensitive trace metals such as U, Mo, Zn, Pb, Ni, Cu, Cd, and V are the most reliable redox identities. These elements are enriched in anoxic conditions, while Mn is depleted [6,12]. The paleoredox conditions has been interpreted by using ratios of different TEs (e.g., U/Th, Ni/Co, and V/(V+Ni)) that are sensitive to redox environments [14,51,72,73]. Further, their ratios became reduced in the water columns due to upwelling oxidation conditions [14]. To differentiate between anoxic, dysoxic, and oxic environments, a reference standard has previously been established based on the ratios of U/Th, V/Cr, Ni/Co, and V/(V+Ni) [12,72,73]. Ratios of V/(V+Ni) greater than 0.6 and 0.8 show strongly reducing conditions [74]. Ni/Co ratios less than 5 indicate an oxic environment, from 5 to 7 dysoxic, and greater than 7 dysoxic to suboxic–anoxic [73]. U/Th values <0.75 show oxic conditions, from 0.75 to 1.25 dysoxic, and >1.25 suboxic–anoxic [73].
In the studied black shale samples, the ratios of U/Th, Ni/Co, and V/(V+Ni) vary from 0.15 to 0.25, 4.34 to 20.0, and 0.79 to 0.88, with averages of 0.20, 9.31, and 0.85 respectively. The majority of V/(V+Ni) ratios indicate an anoxic environment, while ratios of Ni/Co in a few samples indicate oxic to dysoxic environments (Table 4). In the studied black shale, EFs of V, U, Mo, and Pb are slightly enriched in a few samples, while in several they were depleted. Other redox-sensitive elements such as Ni, Cr, Co, Cu, and Zn were depleted in all investigated samples. Jones and Manning [73] considered that U/Th ratios are a more reliable identity for interpreting redox conditions rather than other trace elements. Therefore, EFs of U, Th, and U/Th exhibit dominantly oxic conditions during the deposition of black shales. The perturbation in the redox condition was associated with the depositional condition of Triassic turbidites, which was tectonically controlled. During the Middle Triassic times, due to basin segmentation, thermally driven uplift and subsidence linked to Sukhothai Arc likely played a vital role in the sea level fluctuation during deposition [75,76]. This volcanic (tectonic)-controlled agitation observed throughout the deposition of Semanggol turbidite deposits greatly influenced the relative sea level in the Semanggol Basin, which triggered sporadic shallowing and deepening events. These events are best interpreted at basin margins and further explain the configuration of the basin. According to Algeo and Liu [7], various factors influence the behavior of sensitive trace elements in the depositional basin. The geological setting of the Semanggol Basin was not constant during Mesozoic times, and continuously changed from a passive to active continental margin due to the subduction of the Sibumasu block under the Indochina East Malaya block [76,77]. Moreover, these redox-sensitive metals display a weak to negative correlation with TOC (Figure 9A). Sample-1, -3, -4, -5, and -7 show negative anomalies ((Ce/Ce*)N = 0.68 – 0.96), while other rock samples display slightly positive Ce* anomalies, indicating oxic conditions (Table 6). Mo and U, both trace elements were enriched in reducing conditions and their chemical behaviors varied considerably during deposition. The concentration of authigenic U in marine sediments initiates at the Fe+2-Fe+3 redox boundary under suboxic environments [78], while enrichment of authigenic Mo under euxinic conditions needs the presence of hydrogen sulfide (H2S) [79,80]. One of the major differences between Mo and U is the transfer of authigenic Mo from the water column into sediments; however, the removal of U is unaltered by the particulate Mn/Fe-oxyhydroxide process [81]. Therefore, a cross-plot of Mo–U is a realistic proxy by which to inspect redox conditions [82,83]. Ratios of MoEF against UEF show that the deposition of Semanggol black shale trends from unrestricted marine to anoxic conditions (Figure 9B). Moreover, the bivariate plot of MoEF and UEF against TOC reveals a weak positive correlation (Figure 9C), indicating that redox-controlled organic matter accumulation effects become strong towards the deep marine environment.

5.3. Paleoclimatic Conditions

The concentrations of some major oxides and TEs were used to infer the paleoenvironmental conditions of fine-grained siliciclastic rocks [56,84,85]. Consent has been attained by previous findings [86,87,88,89] that Fe, V, Cr, Mn, Co, and Ni reasonably concentrate under moist climatic conditions. Conversely, the increase in water alkalinity because of evaporation enables precipitation of saline minerals under arid climates; consequently, concentrations of Ca, Na, Mg, K, Ba, and Sr are relatively enriched. Regarding different geochemical behaviors of these two groups, their ratios of Σ(Fe + Mn + Cr + Ni + V + Co)/Σ(Ca + Mg + Sr + Ba + K + Na) (termed as C-value) are considered to be a climate proxy and used broadly for paleoclimate interpretation [86,87,88,89]. Therefore, the different scientists have suggested that C-values of 0–0.2, 0.2–0.4, 0.4–0.6, 0.6–0.8, and 0.8–1.0 represent arid, semi-arid, semi-arid to semi-humid, semi-humid, and humid climates, respectively [86,87,88,89].
The C-values for the analyzed black shale samples ranged between 0.20 and 0.73 with an average value of 0.40 (Table 3), possibly reflecting a semi-arid to semi-humid environment. Some TE ratios like Sr/Cu and Ga/Rb can also be used to categorize the paleoclimate [85,90]. Ga is generally enriched in kaolinite clay mineral, indicating a warmer and humid climate [85,91], while Rb is mostly associated with illite minerals, inferring cold and arid climatic conditions [85]. Commonly, fine-grained clastic sedimentary rocks are categorized into warm and humid climatic conditions with low Sr/Cu and high Ga/Rb ratios [92]. Sr/Cu ratios between 0.87 and 5.0 are indicative of warm-humid environments, but values of more than 5.0 represent hot-arid climatic conditions [85,90].
Ratios of Sr/Cu and Ga/Rb in black shale differ from 0.87 to 33.70 and 0.09 to 0.13, with an average of 8.82 and 0.11, respectively. Overall, both indicators suggest that the Semanggol Basin fluctuated between humid-arid thresholds and hot–arid climatic conditions during the Triassic period (Figure 9D).
The diagenetic and metamorphic effects on phyllosilicate minerals can be approximated by the crystallinity index (IC). The value of the IC index decreases as thermal overprinting increases on clay minerals. Therefore, IC values are utilized to investigate the conversion of smectite to illite and characterize the diagenetic/low-grade metamorphic effects in different zones (e.g., [93,94]). IC index values higher than >0.42° Δ2θ indicate late diagenetic illite, whereas values from 0.42° to 0.25° Δ2θ outline the anchizone [95]. Illite crystallinity (IC) index values of the studied black shales varied from 0.2° to 0.4° Δ2θ (average: 0.28° Δ2θ), representing low IC values overall. Based on the illite crystallinity classification diagram, the values of the IC fall under the anchizone [68]. The content of illite varies from 43% to 56%, which is far less than for over-mature rocks [96]. Furthermore, The dominance of kaolinite clay mineral indicates a deep tropical weathering and hot humid climatic conditions [97].

5.4. Paleosalinity

The paleosalinity levels during the deposition of these turbidites were measured by ratios of Rb/K [98] and Sr/Ba [99,100]. Ratios of Rb/K ≤ 0.004 infer freshwater column, 0.004 ≤ 0.006 designates a fresh to brackish water environment, and >0.006 values suggest fully marine water conditions. According to Li et al. [100] and Zhen et al. [99], ratios of Sr/Ba more than 1 show saline water conditions, from 1.0 to 0.6 represent brackish environments, and less than 0.6 indicate freshwater conditions. The Rb/K ratios (0.003 to 0.006; average: 0.005) for black shales of the Semanggol Formation are characteristic of freshwater to brackish water conditions, while the Sr/Ba ratios (0.05 to 0.17; average: 0.11) indicate a freshwater environment during deposition.

5.5. Paleoproductivity

During the burial and remineralization, low TOC concentration is generally considered to be related with photosynthetic primary paleoproductivity and the rate of organic matter deposition [101,102]. Enrichment of Cu, Pb, Zn, Ni, Cd, Mo, and V is high in organic carbon zones, and these metals become adsorbed in stratified water column either electrostatically or via oxygen-containing functional groups onto terrestrial organic matter (OM) and carried away by the fluvial system, finally to be incorporated into the sediments. The disintegration of OM subsequently releases the adsorbed metals and results in the formation of sulphide minerals and V-bearing clays. In the studied black shale samples, V, Pb, and Mo are enriched in a few samples while depleted in all others. In this regard, TOC contents are used as a reliable paleoproductivity indicator when combined with other TE anomaly indicators like element Ba. Ba shows a nutrient-type behavior as mirrored by the correlation of Ba and organic carbon in the oceanic waters [59,103]. The relationship is used to assess the amount of organic carbon approaching the seafloor, though Ba and TOC concentrations in the analyzed samples presented a weak correlation, demonstrating different sources. Besides the biogenic Ba (Babio) source, there are various sources for Ba accumulation in marine sediments, including: (1) a benthic organism’s secretion; (2) detrital aluminosilicates; and (3) hydrothermal solution/precipitates [59]. In the studied samples, no evidence is identified related to the hydrothermal origin of Ba. To distinguish between Babio and Baterr (terrestrial), the following equations are used [59,103]:
Babio = Batot − Baterr
Baterr = Altot × (Ba/Al)terr
In Equations (6) and (7), Ba/Alterr is the background Ba/Al ratio, and here the PAAS values are used. Altot is the aluminium content in the samples, Babio is the biogenic Ba content, and Batot is the total bulk Ba in the samples. The black shale samples exhibited a low concentration of biogenic Ba, as shown in Figure 9E. This suggests that the bulk Ba in sediments was sourced from terrestrial input. Ba/Al/or Baxs ratios are effectively used as a paleoproductivity proxy [61]. Ba/Al shows a weak correlation against TOC.
Phosphorus is commonly removed from the marine water column as sediments have undergone assimilation into OM or by attachment to metal-oxyhydroxides [104]. In the oxic environment, authigenic phosphate precipitates through the adsorption and complexation processes with Fe-oxyhydroxides or by biological means as polyphosphates that are stable after burial [12,105,106]. Under anoxic conditions, phosphorus moves into sediment porewater, which is likely to diffuse back into above water column [106,107,108]. Ratios of P/Ti are used to determine paleo-oceanic conditions [58]. In the Semanggol black shales, the P/Ti value (0.004) was very low compared to PAAS (0.13). Furthermore, there is very weak correlation between P and TOC (−0.089) (Figure 9F), indicating that P cannot be considered a true image of paleoproductivity. Enrichment of Phosphorus is among the most reliable parameters in differentiating between the organic-rich sediments deposited in different environments like the Black Sea (restricted basin) vs. the Gulf of California (continental margin upwelling zone); therefore, P is more efficiently reduced in sediments of upwelling settings [109]. Sometimes in upwelling zones, sulphide-oxidizing bacteria unable to remove the porewater P during apatite deposition have resulted in a high concentration of phosphorites under anoxic conditions [110].
Besides P and Ba, the excess content of Si is one of the valuable paleoproductivity indicators for sediments deposited under reducing conditions [51]. The Semanggol Formation is rich in silica, and the occurrence of radiolarian assemblages, bivalve Claraia sp., Halobia, Posidonia, and Daonella multilineata have been reported by former researchers [111,112,113]. Thus, the excess concentration of SiO2 fractions in the sediments comparative to the normative terrigenous level can be regarded as biogenic in origin. Weak-to-moderate positive correlations (i.e., r2 = 0.21) can be recognized between Sixs and TOC (Figure 9F), which further verify the reliability of Sixs as a paleoproductivity proxy. However, this moderate correlation suggests that the limited nutrient flux in the deep-marine black shale is due to a deficiency in nutrient supply or a less effective recycling of phosphorus. Additionally, Si interpreted as a productivity proxy, but strong correlation of Si with Al (r2 = 0.8) reflected that silica has detrital origin. However, occurrence of radiolarians confirms biogenic silica as well as upwelling.

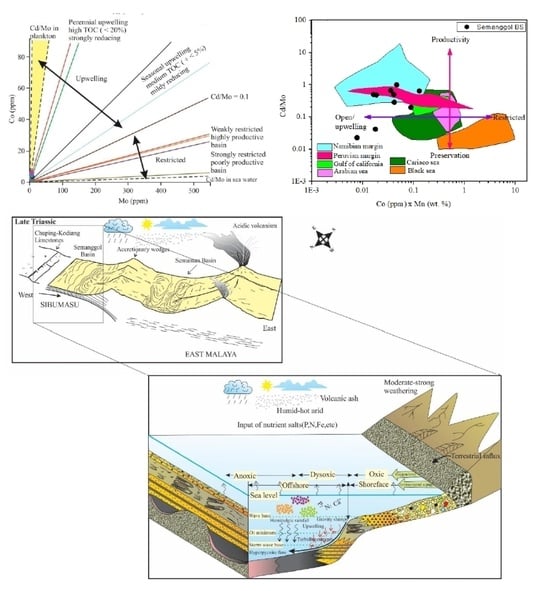
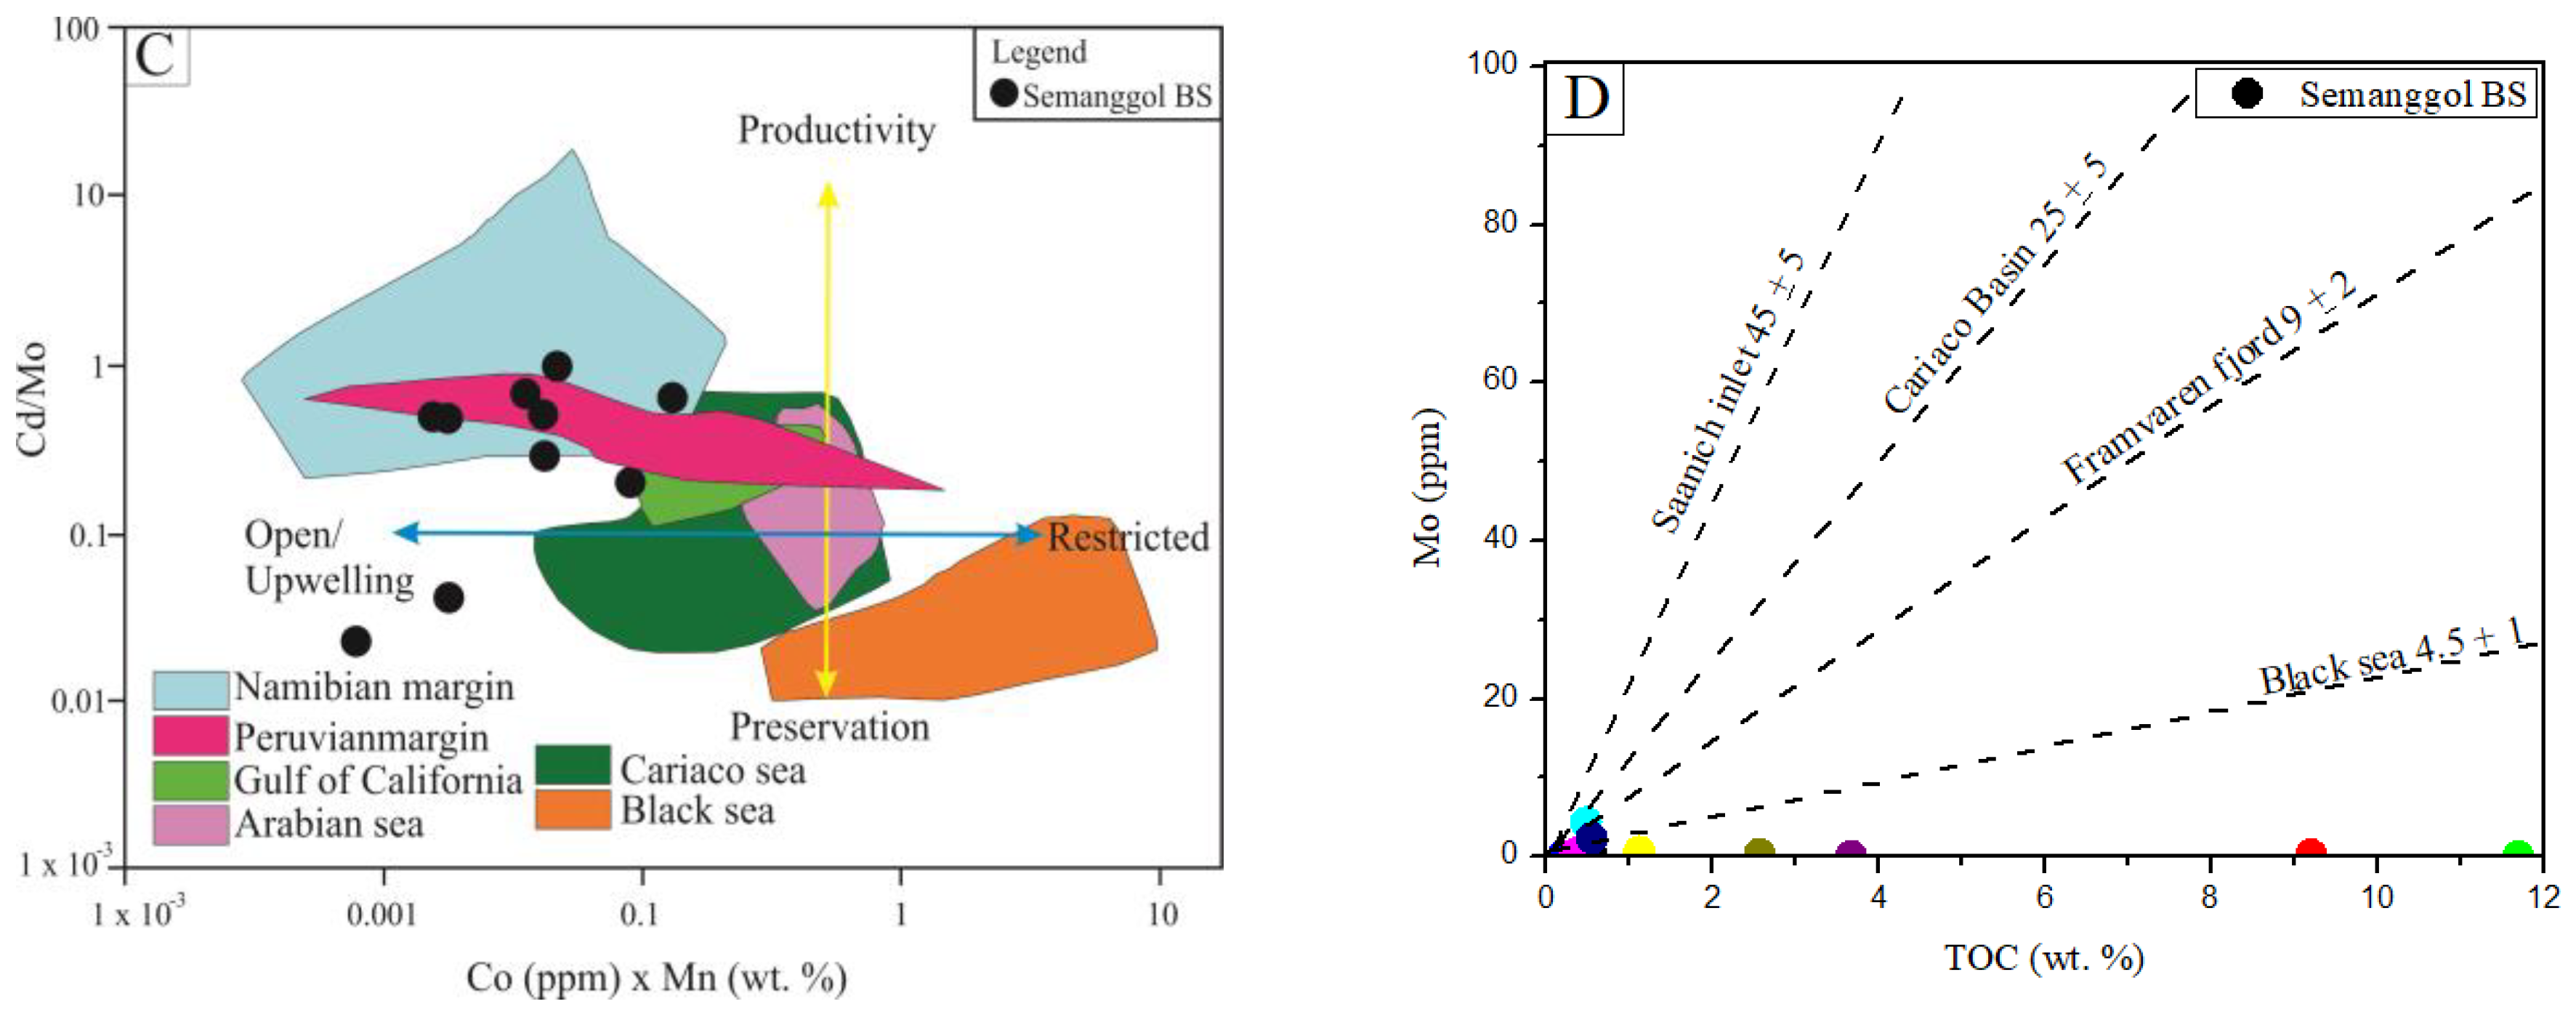
5.6. Geochemical Evidence of Ancient Upwelling

To distinguish between oxygen-depleted water in continental margin upwelling (i.e., Peru and Namibian Margins) and restricted (i.e., black sea) settings, a suite of TE proxies comprising Mo, Cd, Mn, and Co are utilized to characterize these basins [13]. The continental margin upwelling regions are described by high primary productivity at the expense of an excess nutrient supply and development of an oxygen minimal zone (OMZ), which in turn accelerated the consumption of oxygen through degradation of OM [114,115]. In contrast, the restricted basin limited the OM re-supplies as well as the deep-water circulation and ventilation because of the enhanced consumption rate of oxygen through the disintegration of OM [83]. Cadmium (Cd) and Mo are typically enriched in upwelling rocks, while concentrations of Co and Mn are depleted [115]. Ratios of Cd/Mo, Co × Mn, and MnEF × CoEF such as 0.1, 0.4, and 0.5 in terms of boundary limits are used to discriminate among upwelling and restricted settings [13] (Figure 10A–C). Sweere et al. [13] have discussed the difference between upwelling and restricted basin settings based on Cd/Mo ratios. Cd/Mo ratios above 0.1 are related to upwelling settings, while ratios below 0.1 are characteristic of hydrographically restricted settings. Sweere et al. [13] has also explained the relationship between the Cd/Mo ratio and TOC content of the rocks, proposing the validity of a proxy regardless of the amount of TOC enrichment. Relatively low organic matter (TOC ~3%) and trace metal contents might be attributable to a relatively higher proportion of metals from detrital phases. The investigated black shale had an average ratio of Cd/Mo as 1.40 (varying from 0.05 to 3.9, except for one sample showing values less than 0.1), which indicates strong upwelling conditions (Figure 10A) and suggests that black shale was exposed to stable upwelling conditions in a reducing environment. The low concentration of Cd suggests seasonal upwelling (Figure 10D). In the investigated black shales, the relationship between the Al and Co × Mn is very weak. Moreover, the upwelling system was typically deprived of Co and Mn contents, while the restricted basin was enriched with Co and Mn via dominant influxes of Co- and Mn-rich river waters.
On the contrary, a negative correlation (Figure 10E) is observed between both elements as increased Mo concentrations were accompanied by constant low Cd concentrations, indicating a strong upwelling environment (Figure 10D). Low values of Co (ppm) × Mn (wt.%) (0.007–0.13, average: 0.04) and MnEF × CoEF values (0.008–0.09, average: 0.036) also point towards the upwelling of the continental margin where the concentrations of manganese (Mn) and cobalt (Co) were decreased by deep oceanic waters, resulting in weak enrichment of authigenic Mn and Co [13] (Figure 10B,C). The correlation between Zr/Sc and Th/Sc [116] reveals that sediments of black shale of the Semanggol Formation experienced sedimentary recycling (Figure 10F).

5.7. Impact of Geological Events on Depositional History

During the Late Triassic, due to segmentation and intensified subsidence of the Gua Kodiang-Semanggol Basin, a gradual deepening of the sea level occurred towards the western side, and the depositional environment shifted from oxic to anoxic in the deeper parts of the basin, establishing favorable conditions for organic matter accumulation (Figure 11). The eastern side of the Semanggol Basin was dominated by shallow water facies like conglomerate-sandstone, which were deposited under high-energy conditions due to progressive regression during the last stage of the Indosinian Orogeny, and deposition took place in the oxic water column [20,75].
In marine sediments, organic matter dominantly hosting the distribution of Hg and reducing conditions also played a pivotal in the uptake without the contribution of TOC content. Hg can be used as a volcanic proxy, as its ratios are not significantly altered by redox conditions and can be employed to estimate the various environmental information [7]. The weak relationship between Hg/TOC (r2 = 0.2) was observed in the Semanggol black shale. Moreover, frequent volcanism occurred during Semanggol Formation deposition [20,76,77,117,118]. Higher concentrations of biological relevant nutrient elements were also introduced into seawater during volcanic eruption [119], thus enhanced growth of cyanobacterial activity resulted in increased marine primary productivity [120]. Conversely, modern equivalents reveal that fertilization of one cycle of oceanic water through volcanic activity commonly has a duration of few weeks to months [121,122]. However, during the Triassic the volcanic activity was widespread [20,76,77,117,118]. Still, this period of volcanic-induced seawater fertilization is like a flash relating to the geological time scale of million years. The correlation among parameters of CIA, salinity, and redox condition parameters could be indicative of the impact of volcanic eruptions on the deep water environment. The negative relationship between CIA and Sr/Ba (r2 = −0.11) (Figure 12A), may indicate that the input of volcanic ash caused an increase in deep-marine salinity and nutrient salts, possibly due to volcanic ash being commonly covered with soluble salt coatings [123]. In support of this argument, there is a strong positive correlation between Sr/Ba and Ba/Al (r2 = 0.81) (Figure 12B) that is consistent with an increase in nutrients leading to the flourishing of marine organisms [100].

5.8. Organic Matter Enrichment

The mechanisms that have controlled the enrichment of organic matter in the geological record have been extensively studied for the last few decades [69,124,125]. There are certain favorable geological conditions for the preservation and accumulation of organic matter that are interconnected with three main factors: (1) preservational environments/or oxygen deficiency environments; (2) high paleoproductivity (organic carbon fluxes); and (3) sedimentation rate [13,126,127,128].
To estimate the significance of productivity against preservation, the discrimination diagram of Sweere et al. [13] can be used. It shows that majority of the samples fall into the productivity-controlled upwelling sector except two samples projected to be in the preservation-controlled upwelling field (Figure 12C). Therefore, the Semanggol basinal setting is most probably similar to the Namibian margin setting based on a scatter plot of Co (ppm) × Mn (wt.%) vs Cd/Mo. The deeper part of the Semanggol Basin was substantiated to be impacted by persistent upwelling where the primary productivity was increased and adequate, or where excess OM was transported to deeper part of the basin. The moderate correlation between TOC and Sixs shows that the OM fluxes that increased with the enhanced primary productivity (Figure 6C) resulted in a combined effect of primary productivity and preservation, which are controlling factors for OM accumulation. Moreover, anoxic-oxic conditions prevailed in the upwelling OMZ, which could be a contributing factor to the burial and preservation of OM. However, this is assumed to be the secondary controlling factor for the accumulation of OM at the deeper part of the Semanggol Basin.
Our present findings are supported by the weak correlation between Ba and TOC, which suggests a more terrestrial Ba influx relative to biogenic Ba. Enrichment of Cu, Pb, Zn, Ni, Cd, Mo, and V is high in organic carbon zones, and these metals adsorbed in stratified water column either electrostatically or via oxygen functional groups onto terrestrial organic matter (OM) before being carried away by the fluvial system and being incorporated into the sediments. The deposition of OM subsequently released the adsorbed metals and resulted in the formation of sulphide minerals and V-bearing clays. In the studied black shale samples, V, Pb, and Mo were enriched in a few samples while depleted in all others [14]. Therefore, organic matter enrichment was controlled mainly by primary productivity, which increased as a result of increased nutrient flux during a time of sea level fluctuations [102]. A cross-plot of TOC vs. Mo shows that black shale samples are projected in the Black Sea field, and some samples fall in the Framvaren Fjord area. This indicates that the environment of the Semanggol Basin was continuously changing during the deposition of Triassic black shale (Figure 12D). Mo is strongly enriched in modern reducing sediments where free H2S is present, with the Black Sea reduced sediments containing 2–40 ppm [81]. Such levels are considerably higher than the average Mo concentrations in normal shales (2.6 ppm) [53] and black shales (10 ppm) [129]. The black shale under investigation had a concentration of Mo from 0.1 to 4.4 with an average of 0.95, which is significantly lower than Black Sea sediments, average shale, and black shale values. In fore-deep basin settings, sea-level rise and erosion from high land areas could carry the nutrient-rich sediments as well as terrestrial organic matter into the basin, causing photosynthetic phytoplankton blooms and increasing the generation of organic matter. Both enhanced oxygen consumption for microorganism breathing and organic matter decomposition could have caused oxygen depletion in the water column, specifically in deeper part of the basin.
According to Tenger et al. [131], if the values of a sedimentary rate are close to 1 or more than 1, the sedimentary rate is considered to be fast. In the present study, the sedimentary rate fluctuate between 0.69 and 2.31 (average: 1.31), inferring a high sedimentation rate during black shale deposition, which would further cause the dilution of organic matter.
As discussed earlier, the high concentration of detrital elements such as Al, Ti, Si, and Th are sourced from aluminosilicate minerals during the deposition of black shale. The high rate of clastic input is probably related to increased fluxes of freshwater [132], which could raise the stratification rate. The stratification of the Semanggol Basin water favored organic matter preservation [133,134].
The preservation of organic matter in sediments involves various complex physical and chemical processes, and various primary controlling factors have been examined for OM burial and preservation in siliciclastic rocks. Different clay minerals also play a vital role in the preservation of OM besides the redox and primary productivity conditions [66]. Kennedy et al. [135] reported that carbon compounds attached to clay mineral surfaces are due to adsorption effects and are significant in the preservation and burial of organic carbon. According to Ross and Bustin [51], the surface area of clay minerals provides physical protection to the OM and further helps in enriching sedimentary rocks with clay and organic materials [136]. Elements such as Si, Al, Ti, and K are commonly related to clay minerals [54]. The strong positive correlation among these elements (i.e., Al, Si, and Ti, but not K) and the occurrence of kaolinite, illite, and mixed clay layers reveal that these elements (i.e., Si, Al, K, and Ti) originated from these clay minerals. The weak-to-moderate positive correlation of SiO2, Al2O3, and K2O with TOC (0.15, 0.23, and 0.005) indicates that clay minerals may not play a significant role in the preservation of organic matter.

6. Conclusions

On basis of mineralogical, geochemical, and Rock-Eval pyrolysis analyses of turbidite-associated black shale in the Semanggol Formation, the following conclusions have been drawn.
(1)
Mineralogical analysis reveals that dominant clay minerals in turbidite-associated black shale are kaolinite and illite, and non-clays like quartz with traces of feldspar and pyrite, and some heavy metals including zircon and titanium, are also detected. Th vs. K2O, and SiO2 vs. Al2O3, show that the dominant clay mineral types are illite and kaolinite with mixed clay layers, indicating a humid-to-temperate climate at mid-latitude.
(2)
The occurrence of type-III kerogens designate in the black shale and organic matter content is supposed to occur in mature to postmature phase.
(3)
CIA and CIW values indicate moderate to strong weathering conditions, anoxic-oxic oxygen levels, semi-arid to hot-arid climatic conditions, and a high sedimentary rate.
(4)
Paleosalinity of the basin is approximated based on Rb/K and Sr/Ba ratios, which suggest fresh to brackish and freshwater conditions. Intermittent volcanic nutrient fluxes caused an increase in salinity of water that led to the flourishing of marine organisms.
(5)
Paleo-upwelling conditions derived from various cross-plots (such as Al vs. Co × Mn; Al vs. CoEF × MnEF; Mo vs. Co; and Co × Mn vs. Cd/Mo) reveal that upwelling-controlled paleoproductivity and preservation have major control over the enrichment of organic matter, while the role of the sedimentary rate is comparatively less significant.

Author Contributions

Conceptualization, Methodology, Software, Validation, Formal analysis, Investigation, Data Curation, Writing—Original Draft, Visualization, Z.S.; Resources, Investigation, Data curation, Supervision, Project administration, Funding acquisition M.S.I.; Conceptualization, Investigation, Writing—Review & Editing M.N.A.Z.; Resources, Investigation, Data curation, Supervision, Project administration H.T.; Conceptualization, Investigation, Writing—Review & Editing J.A.G.V.; Software, Investigation, Writing—Review & Editing T.H.; Software, Investigation, Writing—Review & Editing N.A. All authors have read and agreed to the published version of the manuscript.

Funding

The authors appreciate and acknowledge the “Petronas Research Fund” (PRF) for supporting and providing funds for this research under grant number YUTP GRANT 0153AA-H13.

Acknowledgments

We would like to thank anonymous reviewers and editors, whose comments and suggestions have helped us to improve the manuscript.

Conflicts of Interest

The authors declare no conflict of interest.

References

  1. Bouma, A.H. Sedimentology of Some Flysch Deposits. A Graphic Approach to Facies Interpretation; Elsevier: Amsterdam, The Netherlands, 1962. [Google Scholar]
  2. Weimer, P.; Pettingill, H.S.; Nilsen, T.H. Global overview of deep-water exploration and production. Atlas Deep. Outcrops Am. Assoc. Pet. Geol. Stud. Geol. 2007, 56, 7–11. [Google Scholar]
  3. Xie, G.; Shen, Y.; Liu, S.; Hao, W. Trace and rare earth element (REE) characteristics of mudstones from Eocene Pinghu Formation and Oligocene Huagang Formation in Xihu Sag, East China Sea Basin: Implications for provenance, depositional conditions and paleoclimate. Mar. Pet. Geol. 2018, 92, 20–36. [Google Scholar] [CrossRef]
  4. Eltom, H.A.; Abdullatif, O.M.; Makkawi, M.H.; Eltoum, I.E.A. Rare earth element geochemistry of shallow carbonate outcropping strata in Saudi Arabia: Application for depositional environments prediction. Sediment. Geol. 2017, 348, 51–68. [Google Scholar]
  5. Rakocinski, M.; Zaton, M.; Marynowski, L.; Przemysław, G. Redox conditions, productivity, and volcanic input during deposition of uppermost Jurassic and Lower Cretaceous organic-rich siltstones in Spitsbergen, Norway. Cretac. Res. 2018, 89, 126–147. [Google Scholar] [CrossRef]
  6. Pisarzowska, A.; Rakociński, M.; Marynowski, L.; Szczerba, M.; Thoby, M.; Paszkowski, M.; Perri, M.C.; Spalletta, C.; Schönlaub, H.P.; Kowalik, N.; et al. Large environmental disturbances caused by magmatic activity during the Late Devonian Hangenberg Crisis. Glob. Planet. Chang. 2020, 190, 103155. [Google Scholar]
  7. Algeo, T.J.; Liu, J. A re-assessment of elemental proxies for paleoredox analysis. Chem. Geol. 2020, 540, 119549. [Google Scholar]
  8. Dypvik, H.; Harris, N.B. Geochemical facies analysis of fine-grained siliciclastics using Th/U, Zr/Rb and (Zr + Rb)/Sr ratios. Chem. Geol. 2001, 181, 131–146. [Google Scholar] [CrossRef]
  9. Szczepanik, P.; Witkowska, M.; Sawłowicz, Z. Geochemistry of Middle Jurassic mudstones (Kraków-Czestochowa area, southern Poland): Interpretation of the depositional redox conditions. Geol. Q. 2007, 51, 57–66. [Google Scholar]
  10. Racka, M.; Marynowski, L.; Filipiak, P.; Sobstel, M.; Pisarzowska, A.; Bond, D.P.G. Anoxic Annulata Events in the Late Famennian of the Holy Cross Mountains (Southern Poland): Geochemical and palaeontological record. Palaeogeogr. Palaeoclimatol. Palaeoecol. 2010, 297, 549–575. [Google Scholar] [CrossRef]
  11. Algeo, T.J.; Maynard, J.B. Trace-element behavior and redox facies in core shales of Upper Pennsylvanian Kansas-type cyclothems. Chem. Geol. 2004, 206, 289–318. [Google Scholar] [CrossRef]
  12. Tribovillard, N.; Algeo, T.J.; Lyons, T.; Riboulleau, A. Trace metals as paleoredox and paleoproductivity proxies: An update. Chem. Geol. 2006, 232, 12–32. [Google Scholar] [CrossRef]
  13. Sweere, T.; van den Boorn, S.; Dickson, A.J.; Reichart, G.J. Definition of new trace-metal proxies for the controls on organic matter enrichment in marine sediments based on Mn, Co, Mo and Cd concentrations. Chem. Geol. 2016, 441, 235–245. [Google Scholar] [CrossRef]
  14. Rimmer, S.M. Geochemical paleoredox indicators in Devonian—Mississippian black shales, Central Appalachian Basin (USA). Chem. Geol. 2004, 206, 373–391. [Google Scholar] [CrossRef]
  15. Metcalfe, L. Tectonic evolution of the Malay Peninsula. J. Asian Earth Sci. 2013, 76, 195–213. [Google Scholar] [CrossRef]
  16. Metcalfe, I. Tectonic framework and Phanerozoic evolution of Sundaland. Gondwana Res. 2011, 19, 3–21. [Google Scholar] [CrossRef]
  17. Metcalfe, I. The Bentong–Raub Suture Zone. J. Asian Earth Sci. 2000, 18, 691–712. [Google Scholar] [CrossRef]
  18. Hutchison, C.S. Ophiolite in Southeast Asia. Geol. Soc. Am. Bull. 1975, 86, 797–806. [Google Scholar] [CrossRef]
  19. Brayard, A.; Escarguel, G.; Bucher, H.; Monnet, C.; Brühwiler, T.; Goudemand, N.; Galfetti, T.; Guex, J. Good genes and good luck: Ammonoid diversity and the end-Permian mass extinction. Science 2009, 325, 1118–1121. [Google Scholar] [CrossRef]
  20. Abdullah, N.T. Mesozoic Stratigraphy. In Geology of Peninsular Malaysia; Hutchison, C.S., Tan, D.N.K., Eds.; University of Malaya, Geological Society of Malaysia: Kuala Lumpur, Malaysia, 2009; pp. 129–131. [Google Scholar]
  21. Tate, R.B.; Tan, D.N.K.; Ng, T.F. Geological Map of Peninsular Malaysia. Scale 1:1,000,000; Geological Society of Malaysia, University of Malaya: Kuala Lumpur, Malaysia, 2008. [Google Scholar]
  22. Alexander, J.B. Pre-Tertiary stratigraphic succession in Malaya. Nature 1959, 183, 230–231. [Google Scholar] [CrossRef]
  23. Teoh, L. Geology and mineral resources of the Sungai Tiang area, Kedah Darulaman. Geol. Surv. Malays. 1992, 5, 93. [Google Scholar]
  24. Courtier, D.B. The Geology and Mineral Resources of the Neighbourhood of the Kulim Area, Kedah; Geological Society of Malaysia: Kuala Lumpur, Malaysia, 1974. [Google Scholar]
  25. Burton, C.K. The palaeotectonic status of the Malay Peninsula. Palaeogeogr. Palaeoclimatol. Palaeoecol. 1970, 7, 51–60. [Google Scholar] [CrossRef]
  26. Burton, C.K. The geology and mineral resources of the Bedung Area, Kedah, West Malaysia. Geol. Surv. Malays. Map Bull. 1988, 7, 103. [Google Scholar]
  27. Sashida, K.; Igo, H.; Adachi, S.; Koike, T.; Nakornsri, N.; Amnan, I.B.; Anlphoinnlahv, A. Occurrence of Paleozoic and Mesozoic radiolarians from Thailand and Malaysia and its geologic significance (Preliminery Report). News Osaka Micropaleontol. 1993, 9, 1–17. [Google Scholar]
  28. Sashida, K.; Adachi, S.; Igo, H.; Koike, T.; Amnan, I.B. 984 Middle and Late Permian radiolarians from the Semanggol Formation, Northwest Peninsular Malaysia. In Transactions and proceedings of the Paleontological Society of Japan; New Series; Palaeontological Society of Japan: Tokyo, Japan, 1995; pp. 43–58. [Google Scholar]
  29. Spiller, F.C.P.; Metcalfe, I. Late Palaeozoic radiolarians from the Bentong-Raub suture zone, and the Semanggol formation of Peninsular Malaysia—Initial results. J. Southeast. Asian Earth Sci. 1995, 11, 217–224. [Google Scholar] [CrossRef]
  30. Kobayashi, T.; Tamura, M. The Triassic bivalvia of Malaysia, Thailand and adjacent areas. Palaeontol. Southeast. Asia 1984, 201–227. [Google Scholar]
  31. Katsuo, S. Middle and late Permian radiolarian from the semanggol formation, northwest Peninsula Malaysia. Trans. Proc. Paleontol Soc. Jpn. 1995, 177, 43–58. [Google Scholar]
  32. Hashim, A.S. Discovery of ammonoid (Agathiceras sp.) and crinoid stems in the Kenny Hill formation of Peninsular Malaysia, and its significance. War. Geol. 1985, 11, 205–212. [Google Scholar]
  33. Burton, C.K. Mesozoic. In Geology of the Malay Peninsula, West Malaysia and Singapore; Gobbett, D.J., Hutchison, C.S., Eds.; John Wiley-Interscience: New York, NY, USA, 1973; pp. 97–141. [Google Scholar]
  34. Jasin, B.; Jantan, A.; Abdullah, I.; Said, U.; Samsudin, A.R. The Semanggol Formation–lithostratigraphy of the Semanggol rocks in the light of latest concept in stratigraphic practice: A suggestion. War. Geol. Newslet. Geol. Soc. Malays. 1989, 15, 29. [Google Scholar]
  35. Ridd, M.F. A Middle Permian–Middle Triassic accretionary complex and a Late Triassic foredeep basin: Forerunners of an Indosinian (Late Triassic) thrust complex in the Thailand–Malaysia border area. J. Asian Earth Sci. 2013, 76, 99–114. [Google Scholar] [CrossRef]
  36. Jones, C.R. The Geology and Mineral Resources of Perlis, North Kedah and the Langkawi Islands; Geological Survey Headquarters: Kuala Lumpur, Malaysia, 1981. [Google Scholar]
  37. Jenner, G.A.; Longerich, H.P.; Jackson, S.E.; Fryer, B.J. ICP-MS—A powerful tool for high-precision trace-element analysis in Earth sciences: Evidence from analysis of selected USGS reference samples. Chem. Geol. 1990, 83, 133–148. [Google Scholar]
  38. Sajid, Z.; Ismail, M.S.; Tsegaband, H.; Hanif, T.; Ahmed, N. Sedimentary geology and geochemical approach to determine depositional environment of the Triassic turbidites bearing Semanggol Formation, NW Peninsular Malaysia. J. Nat. Gas. Geosci. 2020, 5, 207–226. [Google Scholar]
  39. Mukhopadhyay, P.K.; Wade, J.A.; Kruge, M.A. Organic facies and maturation of Jurassic/Cretaceous rocks, and possible oil-source rock correlation based on pyrolysis of asphaltenes, Scotian Basin, Canada. Org. Geochem. 1995, 22, 85–104. [Google Scholar]
  40. Espitalié, J.; Laporte, J.L.; Madec, M.; Marquis, F.; Leplat, P.; Paulet, J.; Boutefeu, A. Rapid method for source rocks characterization and for determination of petroleum potential and degree of evolution. Rev. L Inst. Fr. Du Pet. 1977, 32, 23–42. [Google Scholar]
  41. Sageman, B.B.; Lyons, T.W. Geochemistry fine-grained sediments and sedimentary rocks. In Treatise on Geochemistry; Mackenzie, F.T., Holland, H.D., Turekian, K.K., Eds.; Elsevier: Amsterdam, The Netherlands, 2004; pp. 115–158. [Google Scholar]
  42. Parrish, J.T. Paleogeography of Corg-rich rocks and the preservation versus production controversy: Paleogeography, Paleoclimate, and Source Rocks. AAPG Studies Geol. 1995, 40, 1–20. [Google Scholar]
  43. Nesbitt, H.; Young, G.M. Early Proterozoic climates and plate motions inferred from major element chemistry of lutites. Nature 1982, 299, 715–717. [Google Scholar]
  44. Harnois, L. The CIW index: A new chemical index of weathering. Sediment. Geol. 1988, 55, 319–322. [Google Scholar]
  45. Kasanzu, C.; Maboko, M.A.H.; Manya, S. Geochemistry of fine-grained clastic sedimentary rocks of the Neoproterozoic Ikorongo Group, NE Tanzania: Implications for provenance and source rock weathering. Precambrian Res. 2008, 164, 201–213. [Google Scholar]
  46. Einsele, G. Sedimentary Basins: Evolution, Facies, and Sediment Budget; Springer Science & Business Media: Berlin, Germany, 2000; ISBN 354066193X. [Google Scholar]
  47. Diester-Haass, L.; Robert, C.; Chamley, H. Paleoproductivity and climate variations during Sapropel deposition in the eastern Mediterranean Sea. In Proceedings of the Ocean Drilling Program, Scientific Results; Robertson, A.H.F., Emeis, K.C., Richter, C., Camerlenghi, A., Eds.; Ocean Drilling Program: College Station, TX, USA, 1998; pp. 227–248. [Google Scholar]
  48. Chamley, H. Clay formation through weathering. In Clay Sedimentology; Springer: Berlin, Germany, 1989; pp. 21–50. [Google Scholar]
  49. Schlumberger. Log Interpretation Charts; Schlumberger Educational Services: Houston, TX, USA, 1989. [Google Scholar]
  50. Cullers, R.L.; Podkovyrov, V.N. Geochemistry of the Mesoproterozoic Lakhanda shales in southeastern Yakutia, Russia: Implications for mineralogical and provenance control, and recycling. Precambrian Res. 2000, 104, 77–93. [Google Scholar]
  51. Ross, D.J.K.; Bustin, R.M. Investigating the use of sedimentary geochemical proxies for paleoenvironment interpretation of thermally mature organic-rich strata: Examples from the Devonian-Mississippian shales, Western Canadian Sedimentary Basin. Chem. Geol. 2009, 260, 1–19. [Google Scholar]
  52. Calvert, S.E.; Pedersen, T.F. Geochemistry of Recent oxic and anoxic marine sediments: Implications for the geological record. Mar. Geol. 1993, 113, 67–88. [Google Scholar] [CrossRef]
  53. Wedepohl, K.H. Environmental influences on the chemical composition of shales and clays. Phys. Chem. Earth 1971, 8, 307–333. [Google Scholar] [CrossRef]
  54. Spears, D.A.; Zheng, Y. Geochemistry and origin of elements in some UK coals. Int. J. Coal Geol. 1999, 38, 161–179. [Google Scholar] [CrossRef]
  55. Fu, X.; Wang, J.; Zeng, Y.; Tan, F.; He, J. Geochemistry and origin of rare earth elements (REEs) in the Shengli River oil shale, northern Tibet, China. Geochemistry 2011, 71, 21–30. [Google Scholar] [CrossRef]
  56. Wang, Z.; Fu, X.; Feng, X.; Song, C.; Wang, D.; Chen, W.; Zeng, S. Geochemical features of the black shales from the Wuyu Basin, southern Tibet: Implications for palaeoenvironment and palaeoclimate. Geol. J. 2017, 52, 282–297. [Google Scholar] [CrossRef]
  57. Bau, M. Controls on the fractionation of isovalent trace elements in magmatic and aqueous systems: Evidence from Y/Ho, Zr/Hf, and lanthanide tetrad effect. Contrib. Mineral. Petrol. 1996, 123, 323–333. [Google Scholar] [CrossRef]
  58. Algeo, T.J.; Kuwahara, K.; Sano, H.; Bates, S.; Lyons, T.; Elswick, E.; Hinnov, L.; Ellwood, B.; Moser, J.; Maynard, J.B. Spatial variation in sediment fluxes, redox conditions, and productivity in the Permian–Triassic Panthalassic Ocean. Palaeogeogr. Palaeoclimatol. Palaeoecol. 2011, 308, 65–83. [Google Scholar] [CrossRef]
  59. Dymond, J.; Suess, E.; Lyle, M. Barium in deep-sea sediment: A geochemical proxy for paleoproductivity. Paleoceanography 1992, 7, 163–181. [Google Scholar] [CrossRef]
  60. Paytan, A.; Kastner, M. Benthic Ba fluxes in the central Equatorial Pacific, implications for the oceanic Ba cycle. Earth Planet. Sci. Lett. 1996, 142, 439–450. [Google Scholar] [CrossRef]
  61. Dean, W.E.; Gardner, J.V.; Piper, D.Z. Inorganic geochemical indicators of glacial-interglacial changes in productivity and anoxia on the California continental margin. Geochim. Cosmochim. Acta 1997, 61, 4507–4518. [Google Scholar] [CrossRef]
  62. Haskin, L.A.; Wildeman, T.R.; Haskin, M.A. An accurate procedure for the determination of the rare earths by neutron activation. J. Radioanal. Chem. 1968, 1, 337–348. [Google Scholar] [CrossRef]
  63. Taylor, S.R.; McLennan, S.M. The Continental Crust: Its Composition and Evolution; Blackwell Scientific Publications: Oxford, UK, 1985; pp. 46–92. [Google Scholar]
  64. Bau, M.; Dulski, P. Distribution of yttrium and rare-earth elements in the Penge and Kuruman iron-fromations, Transvaal Supergroup, South Africa. Precambrian Res. 1996, 79, 37–55. [Google Scholar] [CrossRef]
  65. Dai, S.; Graham, I.T.; Ward, C.R. A review of anomalous rare earth elements and yttrium in coal. Int. J. Coal Geol. 2016, 159, 82–95. [Google Scholar] [CrossRef]
  66. Zeng, S.; Wang, J.; Fu, X.; Chen, W.; Feng, X.; Wang, D.; Song, C.; Wang, Z. Geochemical characteristics, redox conditions, and organic matter accumulation of marine oil shale from the Changliang Mountain area, northern Tibet, China. Mar. Pet. Geol. 2015, 64, 203–221. [Google Scholar] [CrossRef]
  67. Zhang, M.; Liu, Z.; Xu, S.; Sun, P.; Hu, X. Element response to the ancient lake information and its evolution history of argillaceous source rocks in the Lucaogou Formation in Sangonghe area of southern margin of Junggar Basin. J. Earth Sci. 2013, 24, 987–996. [Google Scholar] [CrossRef]
  68. Verdel, C.; van der Pluijm, B.A.; Niemi, N. Variation of illite/muscovite 40 Ar/39 Ar age spectra during progressive low-grade metamorphism: An example from the US Cordillera. Contrib. Mineral. Petrol. 2012, 164, 521–536. [Google Scholar] [CrossRef]
  69. Murphy, A.E.; Sageman, B.B.; Hollander, D.J.; Lyons, T.W.; Brett, C.E. Black shale deposition and faunal overturn in the Devonian Appalachian basin: Clastic starvation, seasonal water-column mixing, and efficient biolimiting nutrient recycling. Paleoceanography 2000, 15, 280–291. [Google Scholar] [CrossRef]
  70. Murray, R.W.; Leinen, M. Chemical transport to the seafloor of the equatorial Pacific Ocean across a latitudinal transect at 135 W: Tracking sedimentary major, trace, and rare earth element fluxes at the Equator and the Intertropical Convergence Zone. Geochim. Cosmochim. Acta 1993, 57, 4141–4163. [Google Scholar] [CrossRef]
  71. Ibach, L.E.J. Relationship between sedimentation rate and total organic carbon content in ancient marine sediments. Am. Assoc. Pet. Geol. Bull. 1982, 66, 170–188. [Google Scholar]
  72. Hatch, J.R.; Leventhal, J.S. Relationship between inferred redox potential of the depositional environment and geochemistry of the Upper Pennsylvanian (Missourian) Stark Shale Member of the Dennis Limestone, Wabaunsee County, Kansas, U.S.A. Chem. Geol. 1992, 99, 65–82. [Google Scholar] [CrossRef]
  73. Jones, B.; Manning, D.A.C. Comparison of geochemical indices used for the interpretation of palaeoredox conditions in ancient mudstones. Chem. Geol. 1994, 111, 111–129. [Google Scholar] [CrossRef]
  74. Pi, D.H.; Jiang, S.Y.; Luo, L.; Yang, J.H.; Ling, H.F. Depositional environments for stratiform witherite deposits in the Lower Cambrian black shale sequence of the Yangtze Platform, southern Qinling region, SW China: Evidence from redox-sensitive trace element geochemistry. Palaeogeogr. Palaeoclimatol. Palaeoecol. 2014, 398, 125–131. [Google Scholar] [CrossRef]
  75. Mohamed, K.R.; Joeharry, N.A.M.; Leman, M.S.; Ali, C.A. The gua musang group: A newly proposed stratigraphic unit for the permo-triassic sequence of northern central belt, peninsular Malaysia. Bull. Geol. Soc. Malays. 2016, 62, 131–142. [Google Scholar] [CrossRef]
  76. Dodd, T.J.H.; Leslie, A.G.; Gillespie, M.R.; Dobbs, M.R.; Bide, T.P.; Kendall, R.S.; Kearsey, T.I.; Chiam, K.; Goay, M. Journal of Asian Earth Sciences Deep to shallow-marine sedimentology and impact of volcanism within the Middle Triassic Palaeo-Tethyan Semantan Basin, Singapore. J. Asian Earth Sci. 2020, 196, 104371. [Google Scholar] [CrossRef]
  77. Metcalfe, I. Tectonic evolution of Sundaland Tectonic evolution of Sundaland. Bull. Geol. Soc. Malays. 2017, 63, 27–60. [Google Scholar] [CrossRef]
  78. Zheng, Y.; Anderson, R.F.; van Geen, A.; Fleisher, M.Q. Remobilization of authigenic uranium in marine sediments by bioturbation. Geochim. Cosmochim. Acta 2002, 66, 1759–1772. [Google Scholar] [CrossRef]
  79. Zheng, Y.; Anderson, R.F.; Van Geen, A.; Kuwabara, J. Authigenic molybdenum formation in marine sediments: A link to pore water sulfide in the Santa Barbara Basin. Geochim. Cosmochim. Acta 2000, 64, 4165–4178. [Google Scholar] [CrossRef]
  80. Morford, J.L.; Russell, A.D.; Emerson, S. Trace metal evidence for changes in the redox environment associated with the transition from terrigenous clay to diatomaceous sediment, Saanich Inlet, BC. Mar. Geol. 2001, 174, 355–369. [Google Scholar] [CrossRef]
  81. Crusius, J.; Calvert, S.; Pedersen, T.; Sage, D. Rhenium and molybdenum enrichments in sediments as indicators of oxic, suboxic and sulfidic conditions of deposition. Earth Planet. Sci. Lett. 1996, 145, 65–78. [Google Scholar] [CrossRef]
  82. Algeo, T.J.; Rowe, H. Paleoceanographic applications of trace-metal concentration data. Chem. Geol. 2012, 324, 6–18. [Google Scholar] [CrossRef]
  83. Algeo, T.J.; Tribovillard, N. Environmental analysis of paleoceanographic systems based on molybdenum-uranium covariation. Chem. Geol. 2009, 268, 211–225. [Google Scholar] [CrossRef]
  84. Cao, J.; Yang, R.; Yin, W.; Hu, G.; Bian, L.; Fu, X. Mechanism of Organic Matter Accumulation in Residual Bay Environments: The Early Cretaceous Qiangtang Basin, Tibet. Energy Fuels 2018, 32, 1024–1037. [Google Scholar] [CrossRef]
  85. Roy, D.K.; Roser, B.P. Climatic control on the composition of Carboniferous-Permian Gondwana sediments, Khalaspir basin, Bangladesh. Gondwana Res. 2013, 23, 1163–1171. [Google Scholar] [CrossRef]
  86. Fu, X.; Wang, J.; Chen, W.; Feng, X.; Wang, D.; Song, C.; Zeng, S. Elemental geochemistry of the early Jurassic black shales in the Qiangtang Basin, eastern Tethys: Constraints for palaeoenvironment conditions. Geol. J. 2016, 51, 443–454. [Google Scholar] [CrossRef]
  87. Hu, J.; Li, Q.; Li, J.; Huang, J.; Ge, D. Geochemical characteristics and depositional environment of the Middle Permian mudstones from central Qiangtang Basin, northern Tibet. Geol. J. 2016, 51, 560–571. [Google Scholar] [CrossRef]
  88. Feng, X.L.; Fu, X.G.; Tan, F.W.; Chen, W.B. Sedimentary environment characteristics of Upper Carboniferous Cameng Formation in Kongkong Chaka Area of Northern Qiangtang Basin, Tibet. Geoscience 2014, 28, 953–961. [Google Scholar]
  89. Cao, J.; Wu, M.; Chen, Y.; Hu, K.; Bian, L.; Wang, L.; Zhang, Y. Trace and rare earth element geochemistry of Jurassic mudstones in the northern Qaidam Basin, northwest China. Geochemistry 2012, 72, 245–252. [Google Scholar] [CrossRef]
  90. Yandoka, B.M.S.; Abdullah, W.H.; Abubakar, M.B.; Hakimi, M.H.; Adegoke, A.K. Geochemical characterisation of Early Cretaceous lacustrine sediments of Bima Formation, Yola Sub-basin, Northern Benue Trough, NE Nigeria: Organic matter input, preservation, paleoenvironment and palaeoclimatic conditions. Mar. Pet. Geol. 2015, 61, 82–94. [Google Scholar] [CrossRef]
  91. Beckmann, B.; Flögel, S.; Hofmann, P.; Schulz, M.; Wagner, T. Orbital forcing of Cretaceous river discharge in tropical Africa and ocean response. Nature 2005, 437, 241–244. [Google Scholar] [CrossRef]
  92. Blake, J.M.; Peters, S.C.; Johannesson, K.H. Application of REE geochemical signatures for Mesozoic sediment provenance to the Gettysburg Basin, Pennsylvania. Sediment. Geol. 2017, 349, 103–111. [Google Scholar] [CrossRef]
  93. Rainer, T.; Herlec, U.; Rantitsch, G.; Sachsenhofer, R.F.; Vrabec, M. Organic matter maturation vs clay mineralogy: A comparison for Carboniferous to Eocene sediments from the Alpine-Dinaride junction (Slovenia, Austria). Geologija 2002, 45, 513–518. [Google Scholar] [CrossRef]
  94. Frey, R.W.; Seilacher, A. Uniformity in marine invertebrate ichnology. Lethaia 1980, 13, 183–207. [Google Scholar] [CrossRef]
  95. Kübler, B.; Jaboyedoff, M. Illite crystallinity. Comptes Rendus L’académie Des. Sci. Iia-Earth Planet. Sci. 2000, 331, 75–89. [Google Scholar]
  96. Dellisanti, F.; Pini, G.A.; Baudin, F. Use of T max as a thermal maturity indicator in orogenic successions and comparison with clay mineral evolution. Clay Miner. 2010, 45, 115–130. [Google Scholar] [CrossRef]
  97. Ramirez-Caro, D. Rare Earth Elements (REE) as Geochemical Clues to Reconstruct Hydrocarbon Generation History. Ph.D. Thesis, Kansas State University, Manhattan, KS, USA, 2013. [Google Scholar]
  98. Campbell, F.A.; Williams, G.D. Chemical composition of shales of Mannville group (lower Cretaceous) of central Alberta, Canada. Am. Assoc. Pet. Geol. Bull. 1965, 49, 81–87. [Google Scholar]
  99. Zhen, Z.; Li, W.; Xu, L.; Wang, C.; Zhao, L. Characteristics of palaeosalinity and palaeoredox records in sediment from Dali Lake: Climate change in North China from 0 to 2100 cal BP. Quat. Geochronol. 2020, 60, 101104. [Google Scholar] [CrossRef]
  100. Li, L.; Liu, Z.; Sun, P.; Li, Y.; George, S.C. Sedimentary basin evolution, gravity flows, volcanism, and their impacts on the formation of the Lower Cretaceous oil shales in the Chaoyang Basin, northeastern China. Mar. Petroleum Geol. 2020, 119, 104472. [Google Scholar] [CrossRef]
  101. Nara, F.; Tani, Y.; Soma, Y.; Soma, M.; Naraoka, H.; Watanabe, T.; Horiuchi, K.; Kawai, T.; Oda, T.; Nakamura, T. Response of phytoplankton productivity to climate change recorded by sedimentary photosynthetic pigments in Lake Hovsgol (Mongolia) for the last 23,000 years. Quat. Int. 2005, 136, 71–81. [Google Scholar] [CrossRef]
  102. Wei, H.; Chen, D.; Wang, J.; Yu, H.; Tucker, M.E. Organic accumulation in the lower Chihsia Formation (Middle Permian) of South China: Constraints from pyrite morphology and multiple geochemical proxies. Palaeogeogr. Palaeoclimatol. Palaeoecol. 2012, 353–355, 73–86. [Google Scholar] [CrossRef]
  103. Dehairs, F.; Chesselet, R.; Jedwab, J. Discrete suspended particles of barite and the barium cycle in the open ocean. Earth Planet. Sci. Lett. 1980, 49, 528–550. [Google Scholar] [CrossRef]
  104. Stein, M.; Föllmi, K.B.; Westermann, S.; Godet, A.; Adatte, T.; Matera, V.; Fleitmann, D.; Berner, Z. Progressive palaeoenvironmental change during the late Barremian–early Aptian as prelude to Oceanic Anoxic Event 1a: Evidence from the Gorgo a Cerbara section (Umbria-Marche basin, central Italy). Palaeogeogr. Palaeoclimatol. Palaeoecol. 2011, 302, 396–406. [Google Scholar] [CrossRef]
  105. Schoepfer, S.D.; Shen, J.; Wei, H.; Tyson, R.V.; Ingall, E.; Algeo, T.J. Total organic carbon, organic phosphorus, and biogenic barium fluxes as proxies for paleomarine productivity. Earth-Sci. Rev. 2015, 149, 23–52. [Google Scholar] [CrossRef]
  106. Kraal, P. Redox-dependent phosphorus burial in modern and ancient marine sediments. In Geologica Ultraiectina; Faculteit Geowetenschappen, Departement Aardwetenschappen: Utrecht, The Netherlands, 2011. [Google Scholar]
  107. Ingall, E.D.; Bustin, R.M.; Van Cappellen, P. Influence of water column anoxia on the burial and preservation of carbon and phosphorus in marine shales. Geochim. Cosmochim. Acta 1993, 57, 303–316. [Google Scholar] [CrossRef]
  108. Ingall, E.; Kolowith, L.; Lyons, T.; Hurtgen, M. Sediment carbon, nitrogen and phosphorus cycling in an anoxic fjord, Effingham Inlet, British Columbia. Am. J. Sci. 2005, 305, 240–258. [Google Scholar] [CrossRef]
  109. Brumsack, H.-J. The trace metal content of recent organic carbon-rich sediments: Implications for Cretaceous black shale formation. Palaeogeogr. Palaeoclimatol. Palaeoecol. 2006, 232, 344–361. [Google Scholar] [CrossRef]
  110. Goldhammer, T.; Brüchert, V.; Ferdelman, T.G.; Zabel, M. Microbial sequestration of phosphorus in anoxic upwelling sediments. Nat. Geosci. 2010, 3, 557–561. [Google Scholar] [CrossRef]
  111. Liew, J.E.; Antonio, J.; Vintaned, G. Lithostratigraphy and palaeontology of the ‘black shale’ facies of the semanggol formation (chert unit) at bukit merah (perak, peninsular malaysia). Platf. J. Eng. 2019, 3, 33–45. [Google Scholar]
  112. Hutchison, C.S.; Tan, D.N.K. Geology of Peninsular Malaysia; University of Malaya: Kuala Lumpur, Malaysia; The Geological Society: London, UK, 2009; ISBN 9834429665. [Google Scholar]
  113. Kobayashi, T.; Burton, C.K.; Tokuyama, A.; Yin, E.H. The Vaonella and Halob~ a facies of the Thai-Malay peninsula compared with those of Japan: Geol. Paleo. Southeast. Asia 1966, 3, 98–122. [Google Scholar]
  114. Scholz, F.; Hensen, C.; Noffke, A.; Rohde, A.; Liebetrau, V.; Wallmann, K. Early diagenesis of redox-sensitive trace metals in the Peru upwelling area–response to ENSO-related oxygen fluctuations in the water column. Geochim. Cosmochim. Acta 2011, 75, 7257–7276. [Google Scholar] [CrossRef]
  115. Böning, P.; Brumsack, H.-J.; Böttcher, M.E.; Schnetger, B.; Kriete, C.; Kallmeyer, J.; Borchers, S.L. Geochemistry of Peruvian near-surface sediments. Geochim. Cosmochim. Acta 2004, 68, 4429–4451. [Google Scholar] [CrossRef]
  116. Mclennan, S.M.; Hemming, S.; Mcdaniel, D.K.; Hanson, G.N. Geochemical Approaches to Sedimentation, Provenance, and Tectonics. Geol. Soc. Am. Spec. Pap. 1993, 284, 21–40. [Google Scholar]
  117. Metcalfe, I.; Crowley, J.L. Upper Permian and Lower Triassic conodonts, high-precision U-Pb zircon ages and the Permian-Triassic boundary in the Malay Peninsula. J. Asian Earth Sci. 2020, 104403. [Google Scholar] [CrossRef]
  118. Dodd, T.J.H.; Gillespie, M.R.; Leslie, A.G.; Kearsey, T.I.; Kendall, R.S.; Bide, T.P.; Dobbs, M.R.; Millar, I.L.; Kim, M.; Lee, W.; et al. Journal of Asian Earth Sciences Paleozoic to Cenozoic sedimentary bedrock geology and lithostratigraphy of Singapore. J. Asian Earth Sci. 2019, 180, 103878. [Google Scholar] [CrossRef]
  119. Olgun, N.; Duggen, S.; Andronico, D.; Kutterolf, S.; Croot, P.L.; Giammanco, S.; Censi, P.; Randazzo, L. Possible impacts of volcanic ash emissions of Mount Etna on the primary productivity in the oligotrophic Mediterranean Sea: Results from nutrient-release experiments in seawater. Mar. Chem. 2013, 152, 32–42. [Google Scholar] [CrossRef]
  120. Xie, S.; Pancost, R.D.; Wang, Y.; Yang, H.; Wignall, P.B.; Luo, G.; Jia, C.; Chen, L. Cyanobacterial blooms tied to volcanism during the 5 my Permo-Triassic biotic crisis. Geology 2010, 38, 447–450. [Google Scholar] [CrossRef]
  121. Langmann, B.; Zaksek, K.; Hort, M.; Duggen, S. Volcanic ash as fertiliser for the surface ocean. Atmos. Chem. Phys. 2010, 10, 3891–3899. [Google Scholar] [CrossRef]
  122. Duggen, S.; Croot, P.; Schacht, U.; Hoffmann, L. Subduction zone volcanic ash can fertilize the surface ocean and stimulate phytoplankton growth: Evidence from biogeochemical experiments and satellite data. Geophys. Res. Lett. 2007, 34. [Google Scholar] [CrossRef]
  123. Smith, D.B.; Zielinski, R.A.; Rose, W.I., Jr.; Huebert, B.J. Water-soluble material on aerosols collected within volcanic eruption clouds. J. Geophys. Res. Ocean. 1982, 87, 4963–4972. [Google Scholar] [CrossRef]
  124. Arthur, M.A.; Sageman, B.B. Deposi tional Mechanisms and Environments of Ancient Deposits. Annu. Rev. Earth Planet. Sci. 1994, 22, 499–551. [Google Scholar] [CrossRef]
  125. Demaison, G.J.; Moore, G.T. Anoxic environments and oil source bed genesis. Am. Assoc. Pet. Geol. Bull. 1980, 64, 1179–1209. [Google Scholar] [CrossRef]
  126. Lu, Y.; Jiang, S.; Lu, Y.; Xu, S.; Shu, Y.; Wang, Y. Productivity or preservation? The factors controlling the organic matter accumulation in the late Katian through Hirnantian Wufeng organic-rich shale, South China. Mar. Pet. Geol. 2019, 109, 22–35. [Google Scholar] [CrossRef]
  127. Ding, J.; Zhang, J.; Tang, X.; Huo, Z.; Han, S.; Lang, Y.; Zheng, Y.; Li, X.; Liu, T. Elemental geochemical evidence for depositional conditions and organic matter enrichment of black rock series strata in an inter-platform basin: The lower carboniferous datang formation, Southern Guizhou, Southwest China. Minerals 2018, 8, 509. [Google Scholar] [CrossRef]
  128. Wignall, P.B. Black Shales; Oxford University Press: Oxford, UK, 1994; ISBN 0198540388. [Google Scholar]
  129. Vine, J.D.; Tourtel, E.B. Geochemistry of black shale deposits—A summary report. Econ. Geol. 1970, 65, 253–272. [Google Scholar] [CrossRef]
  130. Algeo, T.J.; Lyons, T.W. Mo–total organic carbon covariation in modern anoxic marine environments: Implications for analysis of paleoredox and paleohydrographic conditions. Paleoceanography 2006, 21. [Google Scholar] [CrossRef]
  131. Tenger; Liu, W.; Xu, Y.; Chen, J.; Hu, K.; Gao, C. Comprehensive geochemical identification of highly evolved marine hydrocarbon source rocks: Organic matter, paleoenvironment and development of effective hydrocarbon source rocks. Chin. J. Geochem. 2006, 25, 333–340. [Google Scholar] [CrossRef]
  132. Fu, X.; Tan, F.; Feng, X.; Wang, D.; Chen, W.; Song, C.; Zeng, S. Early Jurassic anoxic conditions and organic accumulation in the eastern Tethys. Int. Geol. Rev. 2014, 56, 1450–1465. [Google Scholar] [CrossRef]
  133. Bradley, W.H.; Eugster, H.P. Geochemistry and Paleolimnology of the Trona Deposits and Associated Authigenic Minerals of the Green River Formation of Wyoming; Geological Survey Professional Paper; US Government Printing Office: Washington, DC, USA, 1969. [Google Scholar]
  134. Desborough, G.A. A biogenic-chemical stratified lake model for the origin of oil shale of the Green River Formation: An alternative to the playa-lake model. Geol. Soc. Am. Bull. 1978, 89, 961–971. [Google Scholar] [CrossRef]
  135. Kennedy, M.J.; Pevear, D.R.; Hill, R.J. Mineral surface control of organic carbon in black shale. Science 2002, 295, 657–660. [Google Scholar] [CrossRef]
  136. Jia, J.; Liu, Z.; Bechtel, A.; Strobl, S.A.I.; Sun, P. Tectonic and climate control of oil shale deposition in the Upper Cretaceous Qingshankou Formation (Songliao Basin, NE China). Int. J. Earth Sci. 2013, 102, 1717–1734. [Google Scholar] [CrossRef]
Figure 1. (A) Simplified geological map of Peninsular Malaysia showing the distribution of black shale outcrops [21]; (B) Paleogeographic location of Indochina and Sibumasu blocks during the Late Permian to Late Triassic period [16]; (C) The cross-section (A-A’) presents the subsurface structural framework.
Minerals 10 00915 g001aMinerals 10 00915 g001b
Figure 2. Distribution and stratigraphic relationships of the Mesozoic strata [20].
Minerals 10 00915 g002
Figure 3. (AD) Stratigraphic log and field photographs of the Semanggol Formation, 1-Gunung Semanggol section, North Perak; (EH) Stratigraphic log and field photographs of the Semanggol Formation, 2-Bukit Mearh section, North Perak.
Minerals 10 00915 g003
Figure 4. (AC) Stratigraphic log and field photographs of the Semanggol Formation, 3-Nami section, North Kedah.
Minerals 10 00915 g004
Figure 5. (A) Plot of Tmax vs. hydrogen index (HI) showing generative source rock potential for the Triassic turbidite black shale from Peninsular Malaysia [39]. (B) Cross-plot of oxygen index (OI) vs. hydrogen index (HI) [40]. (C) Plot of TOC vs. S1 used to distinguish between non-indigenous (allochthonous) and indigenous hydrocarbons (autochthonous).
Minerals 10 00915 g005
Figure 6. Cross-plots illustrating (A) SiO2 correlation with major oxides; (B) Al2O3 correlation with major oxides; (C) K (wt.%) vs. Th (ppm) [49]; (D) Al2O3 vs. SiO2 (wt.%) representing the clay type in black shale samples [50].
Minerals 10 00915 g006
Figure 7. EFs of selected trace elements in the Semanggol black shale. A horizontal red dashed line (EF = 1) indicates an element enrichment or depletion of these TEs.
Minerals 10 00915 g007
Figure 8. (A) SEM photo of the kaolinite in the clay fraction of the black shale from the Gunung Semanggol section; (B) EDX pattern of kaolinite showing Al, Si, O, Fe, and Ti peaks for the studied black shale from the Gunung Semanggol section; (C) SEM photo of illite in the clay fraction of the black shale from the Nami section; (D) EDX pattern of kaolinite displaying peaks of Al, Si, O, and K that characterize the illite composition for the black shale from the Nami section; (E) X-ray diffraction pattern of the clay fraction separated from the black shale from the Gunnug Semanggol section; (F) X-ray diffraction pattern of the clay fraction separated from the black shale from the Nami section.
Minerals 10 00915 g008
Figure 9. (A) Cross-plot of TOC vs. redox metals showing a very weak to negative correlation; (B) Cross-plot of the enrichment factor of MoEF against UEF. The lines display Mo/U ratios equal to seawater (SW). The patterns of UEF and MoEF are compared to the model of Algeo and Tribovillard [83]; (C) Correlation of TOC against UEF and MoEF showing a moderate positive correlation; (D) Ratios of Sr/Cu vs. Ga/Rb illustrating climatic conditions in the Semanggol Basin during Triassic black shale deposition; (E) Graph bar showing the concentrations of Babio and Baterr in the black shale sample; (F) Plot of TOC content vs. Baxs, Pxs, and Sixs showing a weak to moderate positive correlation with paleoproductivity indicators.
Minerals 10 00915 g009
Figure 10. (A) plot of TOC (wt.%) content vs. Cd/Mo; (B) Al (wt.%) vs. Co (ppm) × Mo(wt.%); (C) Al (wt.%) vs. CoEF × MnEF; (D) Mo (ppm) vs. Cd (ppm) plot showing the characteristic of a restricted setting (inferred conditions based on modern settings, after Sweere et al. [13]); (E) Cross-plot of Cd vs. Mo, indicating a negative correlation between these two trace elements; (F) Discriminating diagram of Zr/Sc vs. Th/Sc [116], revealing that sediments of black shale of the Semanggol Formation show signs of sedimentary recycling.
Minerals 10 00915 g010
Figure 11. Block diagram illustrating the formation, accumulation, and deposition of organic matter in the Semanggol Basin during the Triassic.
Minerals 10 00915 g011
Figure 12. (A) Sr/Ba vs. CIA; (B) Ba/Al vs. Sr/Ba; (C) scatter plot of Co (ppm) × Mn (wt.%) vs. Cd/Mo showing a majority of the samples plotted in the field of productivity-controlled upwelling, except for two samples plotted as upwelling-controlled preservation [13]; (D) Plot of TOC (wt.%) content vs. Mo (ppm) showing depositional conditions for the black shale samples [130].
Minerals 10 00915 g012aMinerals 10 00915 g012b
Table 1. Facies table of the Triassic turbidites bearing part of the Semanggol Formation, Peninsular Malaysia [37].
Facies CodeDescription Process InterpretationSediment Transport and Depositional ProcessSignificant Changes
Facies 1 (F1)Clast-supported conglomerate Interpreted as lower portions of high-concentrated, coarse-grained turbidity current deposits that eroded and incorporated ripped-up mud-clasts during transportationMassive: “Freezing” on decreasing bottom slopes due to intergranular friction and cohesionIncreased rate of density/energy, deposition, bed amalgamation, and fluidizationMinerals 10 00915 i004
Increased flow maturity,
mud content and tractional
Facies 2 (F2)Pebbly sandstone Deposition by sandy turbidity currents of high-densityMassive: Rapid collective grain deposition of a pebble–sand mixture due to increased intergranular friction as the flows decelerate Minerals 10 00915 i001                         Minerals 10 00915 i002
Facies 3 (F3)Thick bedded sandstoneMassive SS lacking internal stratification indicating a sudden energy decrease in turbidity currents and rapid deposition of sediments from high-density flow. The absence of sedimentary structures reflects the rapid deposition of sediments Deposition of massive sandstone may be attributable to non-turbulent liquefied or grain flows
Facies 4 (F4)Massive sandstone with large Floating clasts.Outsized clasts/blocks are interpreted as large debris falls from the walls of basins and transported by debris or sandy turbidity currents caused by tectonic activity/faulting or rafting on top of slumps Deposition by debris or sandy turbidity currents
Facies 5 (F5)Rhythmite or heterolithic interbedded sandstone, siltstone and mudstone/shale (rhythmite) facies Shows its deposition by mature and highly turbulent low-density turbidity flows Most of these sandstone–mudstone couplets were formed during the waning, tractional phase of turbidity current flow, followed by the suspension settling of sand and a combination of tractional reworking of suspension-fed silt and clay material and low rates of suspension fall-out
Facies 6 (F6)Typical bouma facies Tabcd Has resulted from gradual single waning low-density turbidity flow followed by wider tractional modification at late stages and sediment fallout from suspension Low-density turbidity current and/or suspension fallout from a waning flow density
Facies 7(F7)Major slump/mass transport deposit (MTD) Mudstone-rich, disorganized, reflected to be developed by mass transport (which includes plastic slides, muddy debris flows, and slope failure)Cessation of movement on decreasing bottom slopes because gravity forces no longer exceed or balance basal and internal friction
Facies 8(F8)Very thin-bedded “zebra-striped” mudstones Deposition by mature, lower-density turbidity current with tractional modification and pulsatory in nature from a hemi-pelagic setting Waning turbulent flow deposited from suspension clouds of low-density flowMinerals 10 00915 i004
Increased occurrence of low-density muddy and sandy turbidity currents
Facies 9(F9)Thin-medium bedded, finely laminated dark grey to black mudstoneMudstone is deposited by (1) suspension fallout from the water column containing particles of hemi-pelagic mud, and (2) low-energy turbidity currents having muddy material Load cast: Rapid suspension fallout of very fine sand/silt.
Relatively dilute, well-stratified and fully turbulent flows
Table 2. TOC (wt.%) content along with Rock-Eval pyrolysis of black shale from the Semanggol Formation.
LocationSampleTOC (wt.%)Tmax (°C)S1 (ppm)S2 (ppm)S3 (ppm)HI (mg/g TOC)OI (mg/g TOC)PIS1 + S2
Gunung Semanggol10.555023050709130.3880
29.25602550870390.2175
311.716112060910180.2580
40.21452706010029480.5470
50.4849040301708210.3370
Bukit Merah60.36313304012011330.4340
71.1236720201212110.4980
82.573593050180270.3870
Nami90.555103040909110.37170
103.6760850120220360.29130
Table 3. Major oxide concentrations and geochemical anomalies (CIA, CIW and C-value) of black shale from the Semanggol Formation.
FormationSemanggol
SectionGunung SemanggolBukit MerahNami
Sample12345678910
SiO271.6470.766.9369.875.9670.175.672.369.1871.2
Al2O315.817.220.1417.8911.9914.412.5113.3118.1315.3
Fe2O31.221.111.231.081.121.391.461.441.541.23
MgO0.880.730.70.820.50.430.520.690.70.57
CaO0.020.030.010.020.010.010.020.020.020.03
Na2O0.080.060.090.050.060.040.070.060.070.01
K2O3.743.714.253.023.043.213.294.544.683.69
TiO20.770.890.940.910.520.540.640.560.830.76
P2O50.060.050.040.010.030.10.020.010.040.02
MnO0.010.040.020.010.010.050.020.010.010.02
LOI5.65.335.45.16.66.35.75.64.65.1
TOC (wt.%)0.549.211.690.210.480.361.122.570.553.67
CIA80.4581.9082.2485.2779.4081.5478.7374.2379.1780.40
CIW99.3799.4899.5199.6199.4299.6599.2999.4099.5199.74
C-Values0.390.410.730.560.200.280.310.400.350.40
Al/Na140.90204.51159.64255.26142.56256.83127.50158.26184.77148
LOI: Loss On Ignition; CIA: Chemical Index of Alteration; CIW: Chemical Index of Weathering; C-Value: the ratio of Σ (Fe + Mn + Cr + Ni + V + Co)/Σ (Ca + Mg + Sr + Ba + K + Na).
Table 4. Concentrations of selected trace elements (TEs) (ppm) and their ratios of black shale from the Semanggol Formation.
FormationSemanggol
SectionGunung SemanggolBukit MerahNami
Sample12345678910
La57.656.174.477.335.833.781.966.738.931.4
Sc15141716121215149.011
Th1.31.11.41.00.80.91.21.31.01.1
Hf5.96.287.17.36.35.45.79.28.3
Co5.34.23.02.11.02.32.72.42.32.3
Zr222.4215.1268.6222.8271.7217.1182.4171.1351.9322.1
Cr68.4615.888.975.347.954.713.76.882.175.3
Sr35.933.233.731.732.529.531.344.14937.1
Cu23.819.21.03.12.12.636.132.57.86.5
Ga20.919.221.113.212.619.221.717.116.215.3
Rb175.5166165.5144.2130.9171.1183.2154.3144131.2
Ni23192017202229212027
U3.53.33.73.13.22.93.93.22.82.3
V12313114511110614415012197101
Cr0.0110.090.0130.0110.0070.0080.0020.0010.0120.011
Ni/Co4.344.526.678.1020.009.5710.748.758.7011.74
U/Th0.190.170.160.150.250.250.210.180.210.19
V/(V+Ni)0.840.870.880.870.840.870.840.850.830.79
Co/Th4.083.822.142.11.252.562.251.852.302.09
La/Th3.152.923.133.632.842.934.433.792.882.57
Sr/Cu1.511.7333.7010.2315.4811.350.871.366.285.71
Ga/Rb0.120.120.130.090.100.110.120.110.110.12
Table 5. Enrichment factors (EFs) for the selected trace elements of black shale samples from the Semanggol Formation.
Sample No.EFBaEFZrEFRbEFVEFSrEFPbEFAsEFNiEFGaEFThEFScEFCuEFCsEFU
10.431.461.321.000.120.970.680.351.161.611.220.553.741.32
20.341.501.150.970.100.960.530.270.981.551.040.413.021.14
30.181.390.980.920.090.320.090.240.921.641.080.011.521.09
40.211.300.960.790.090.450.130.230.641.651.140.061.571.03
50.992.361.301.130.153.576.900.400.921.461.280.061.901.59
60.771.571.411.280.112.793.890.371.171.111.070.061.621.20
70.881.521.741.540.130.911.260.561.522.051.541.072.281.85
80.471.341.381.160.180.791.290.381.121.841.350.902.351.44
90.312.020.940.680.151.555.290.270.781.030.630.151.50.92
100.372.261.020.840.1351.496.130.430.871.100.920.151.60.89
Average0.501.671.221.030.131.382.620.351.011.501.130.342.11.2
EFelement = (element/Al)sample/(element/Al)average shale. Mean Al content for average shale is 8.84% from Rimmer [14].
Table 6. Rare earth element (REE) concentrations (ppm) and calculated REE ratios along with different anomalies of black shale samples from the Semanggol Formation.
ElementsSample-1Sample-2Sample-3Sample-4Sample-5Sample-6Sample-7Sample-8Sample-9Sample-10
La57.6056.1074.4077.3035.8033.7081.9066.7038.9031.40
Ce113.50101.20142.20121.9072.7089.10141.10111.2080.6099.30
Pr12.2417.4016.109.407.6313.2015.3019.1010.6012.50
Nd44.5049.5057.7039.3028.4056.1064.2063.9031.7029.80
Sm8.377.6010.1411.405.666.6910.979.716.235.78
Eu1.601.201.901.701.232.202.071.981.351.21
Gd7.276.308.217.745.246.108.654.785.815.01
Tb1.081.011.201.100.800.701.221.140.911.30
Dy6.197.216.975.874.565.216.734.905.236.01
Ho1.251.211.411.430.950.991.241.230.990.98
Er3.463.214.134.012.783.313.632.873.022.61
Tm0.520.490.600.450.410.570.520.390.440.53
Yb3.363.213.943.712.673.403.502.122.862.76
Lu0.510.550.600.480.420.500.540.410.460.39
ΣREE261.45256.19329.50285.79169.25221.77341.57290.43189.10199.58
Average26.1525.6232.9528.5816.9322.1834.1629.0418.9119.96
ΣLREE237.81233.00302.44261.00151.42200.99315.54272.59169.38179.99
ΣHREE23.6423.1927.0624.7917.8320.7826.0317.8419.7219.59
LREE/HREE10.0610.0511.1810.538.499.6712.1215.288.599.19
(La/La*)N1.130.531.082.861.180.941.880.720.640.35
(Ce/Ce*)N0.951.140.960.680.951.250.891.101.081.26
(Pr/Pr*)N0.981.391.010.770.951.030.911.271.191.29
(Eu/Eu*)N0.941.461.050.580.841.350.941.301.051.12
(Gd/Yb)N1.291.171.241.241.171.071.471.341.211.08
(La/Yb)N1.261.291.391.540.990.731.722.321.000.84
ΣLREE: Total Concentrations of LREEs (LREE = La − Eu); ΣHREE: Total Concentrations of HREEs (HREE = Gd − Lu); ΣREE: Total Concentrations of REEs (ΣREE = ΣLREE + ΣHREE); L/H: ΣLREE/ΣHREE; (La/La*)>N = La/(3 × PrN − 2 × NdN); (Ce/Ce*)N = 2 × PrN/(LaN + PrN); (Pr/Pr*)N = 2 × PrN/(CeN + NdN); (Eu/Eu*)N = EuN/[(SmN × 0.67) + (TbN× 0.33)]; Post-Archean Average Australian Shale (PAAS)-Normalized. PAAS data from Wedepohl [41].
Publisher’s Note: MDPI stays neutral with regard to jurisdictional claims in published maps and institutional affiliations.

