Author Contributions
Conceptualization: B.V. Methodology: all authors. Formal analysis and investigation: C.B. and A.G. (Raman microspectroscopy), C.S., R.G., and K.M. (SEM/EDS, proximate, XRF), J.L.-M. (ss-NMR), N.W. (petrography), I.S.-R. (XRD), and I.C. (XRD). Data curation: C.S. and C.B. Writing—original draft preparation: C.B., C.S., J.L.-M., B.V., and N.W. Writing—review and editing: all authors. Supervision: B.V. supervised C.S. and co-supervised C.B., N.W. supervised C.B., and A.G. co-supervised C.S. Project administration: B.V. (ERA-MIN) and N.W. (ERA-MIN in South Africa). Funding acquisition: J.L.-M., B.B., M.C., G.P., B.V., and N.W. All authors have read and agreed to the published version of the manuscript.
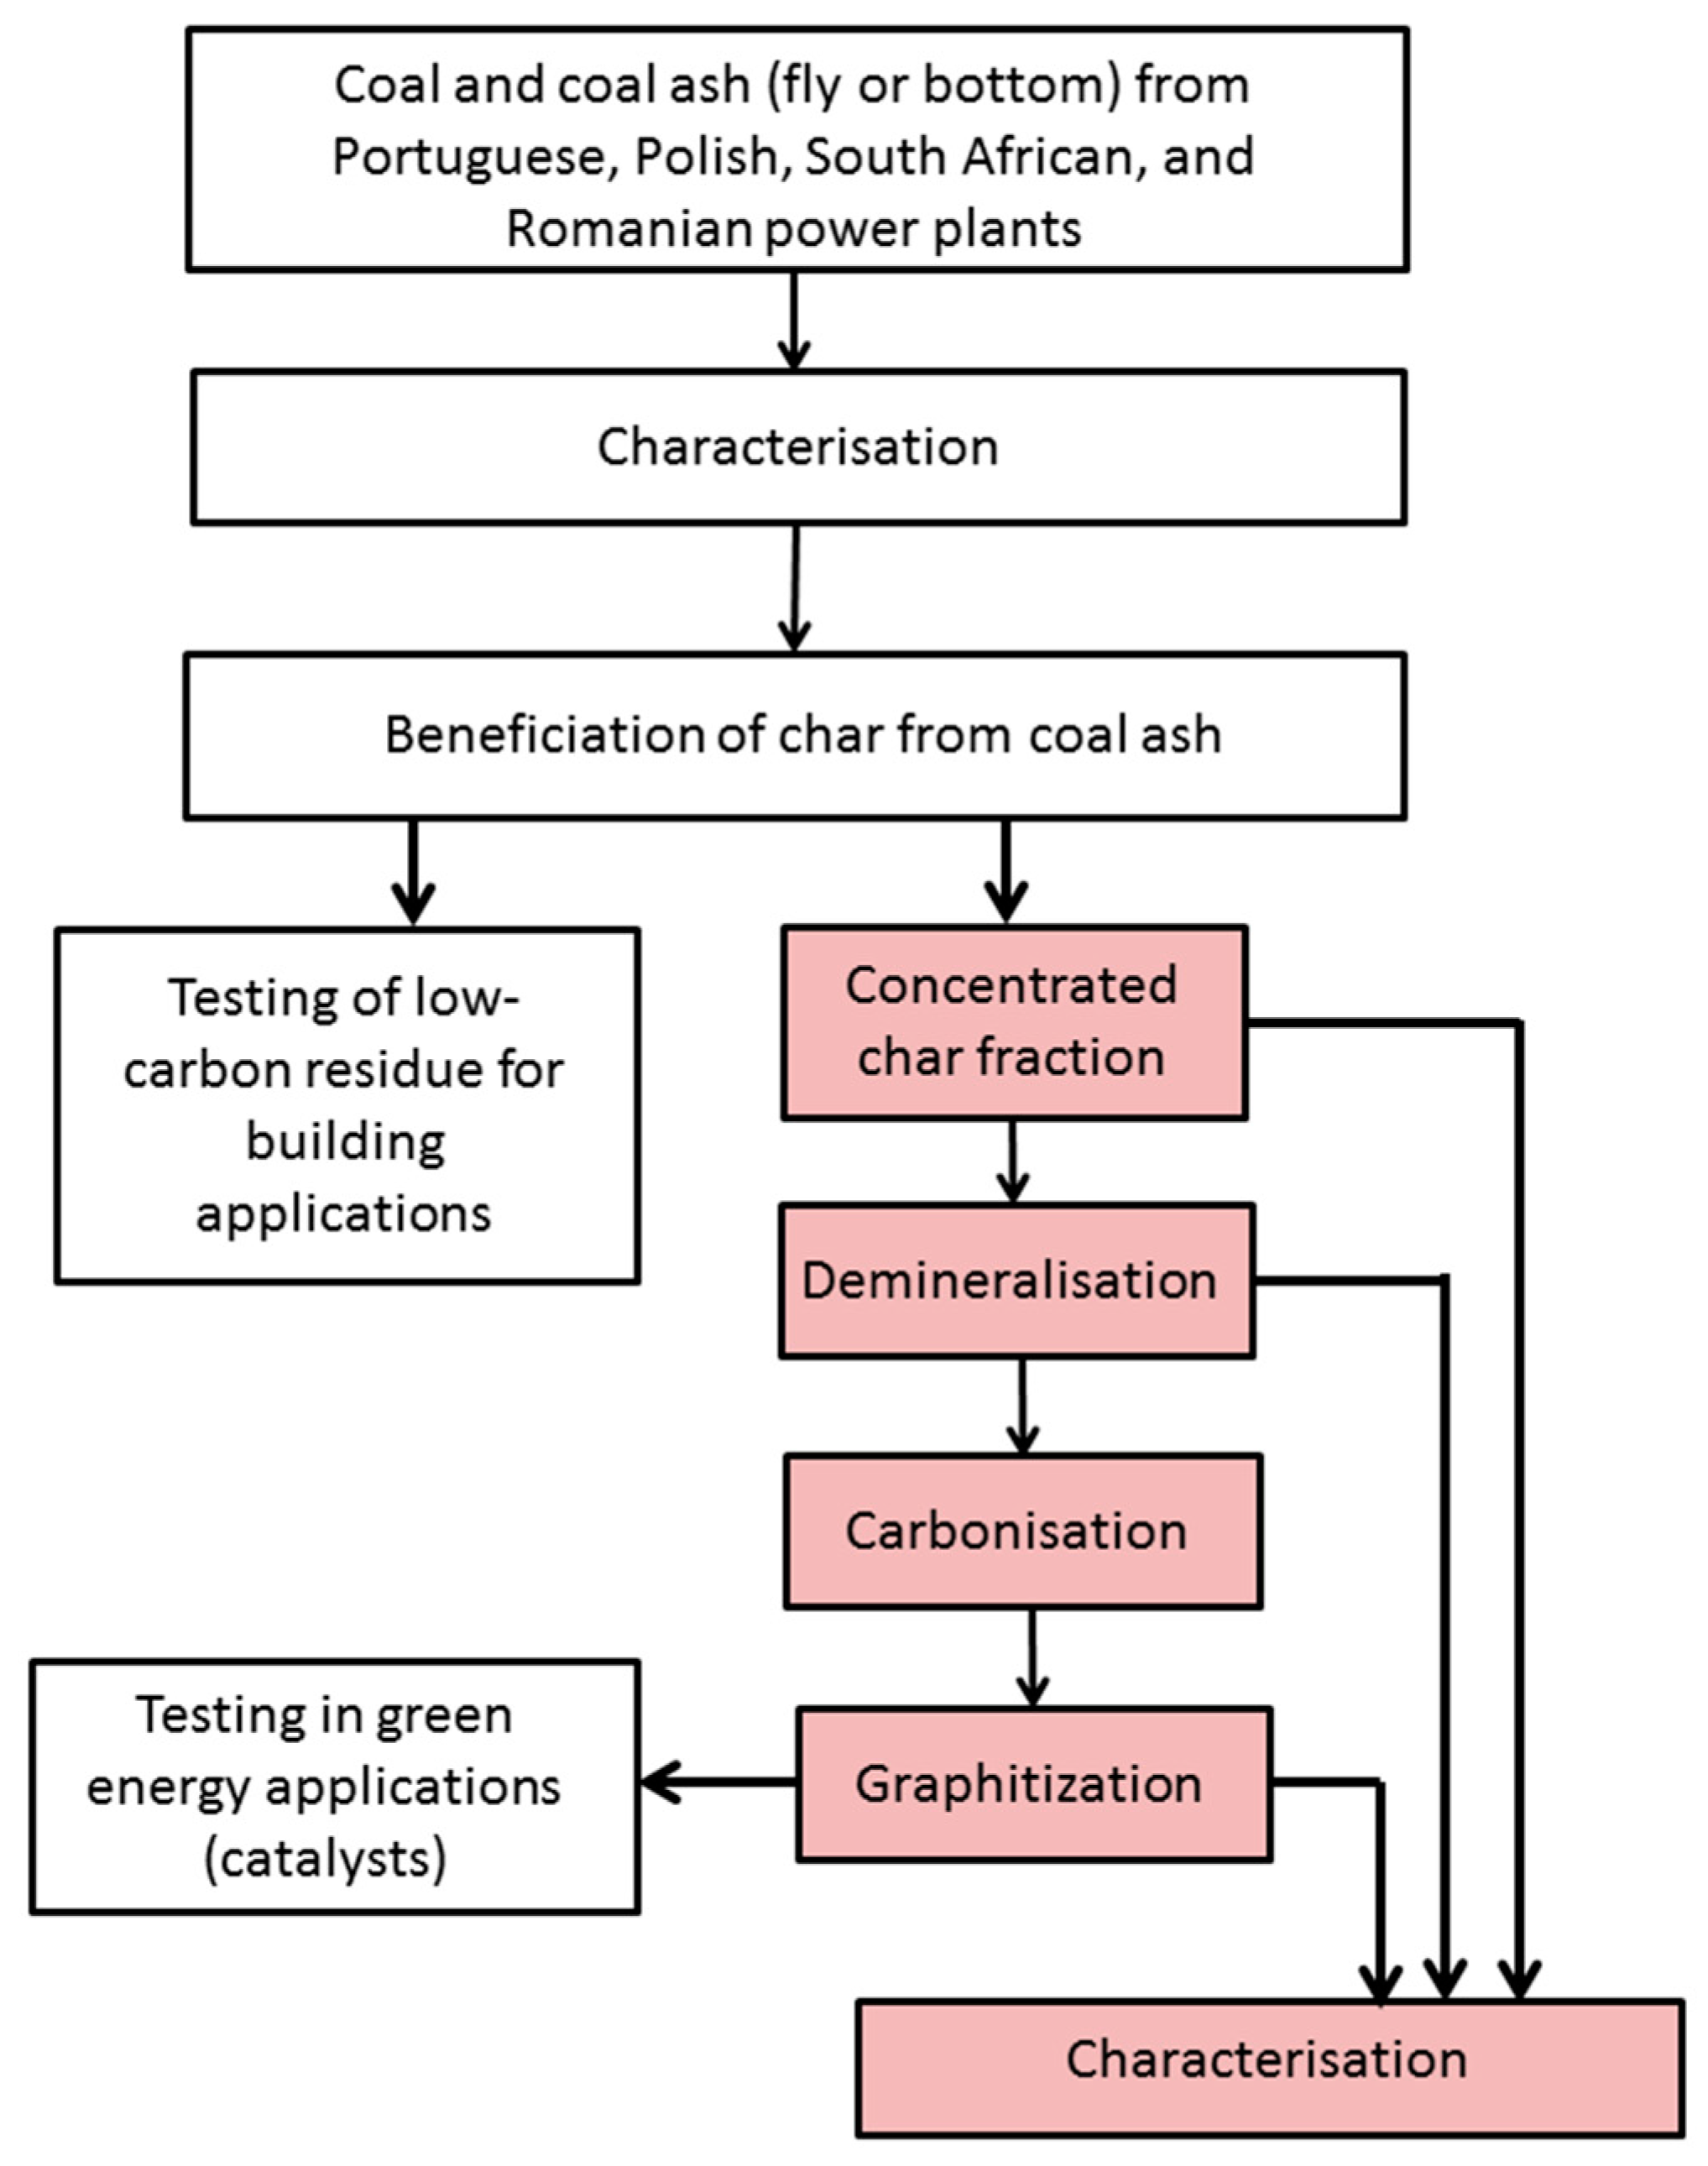
Figure 1.
Charphite project methodology (aspects covered in the current paper are shaded).
Figure 1.
Charphite project methodology (aspects covered in the current paper are shaded).
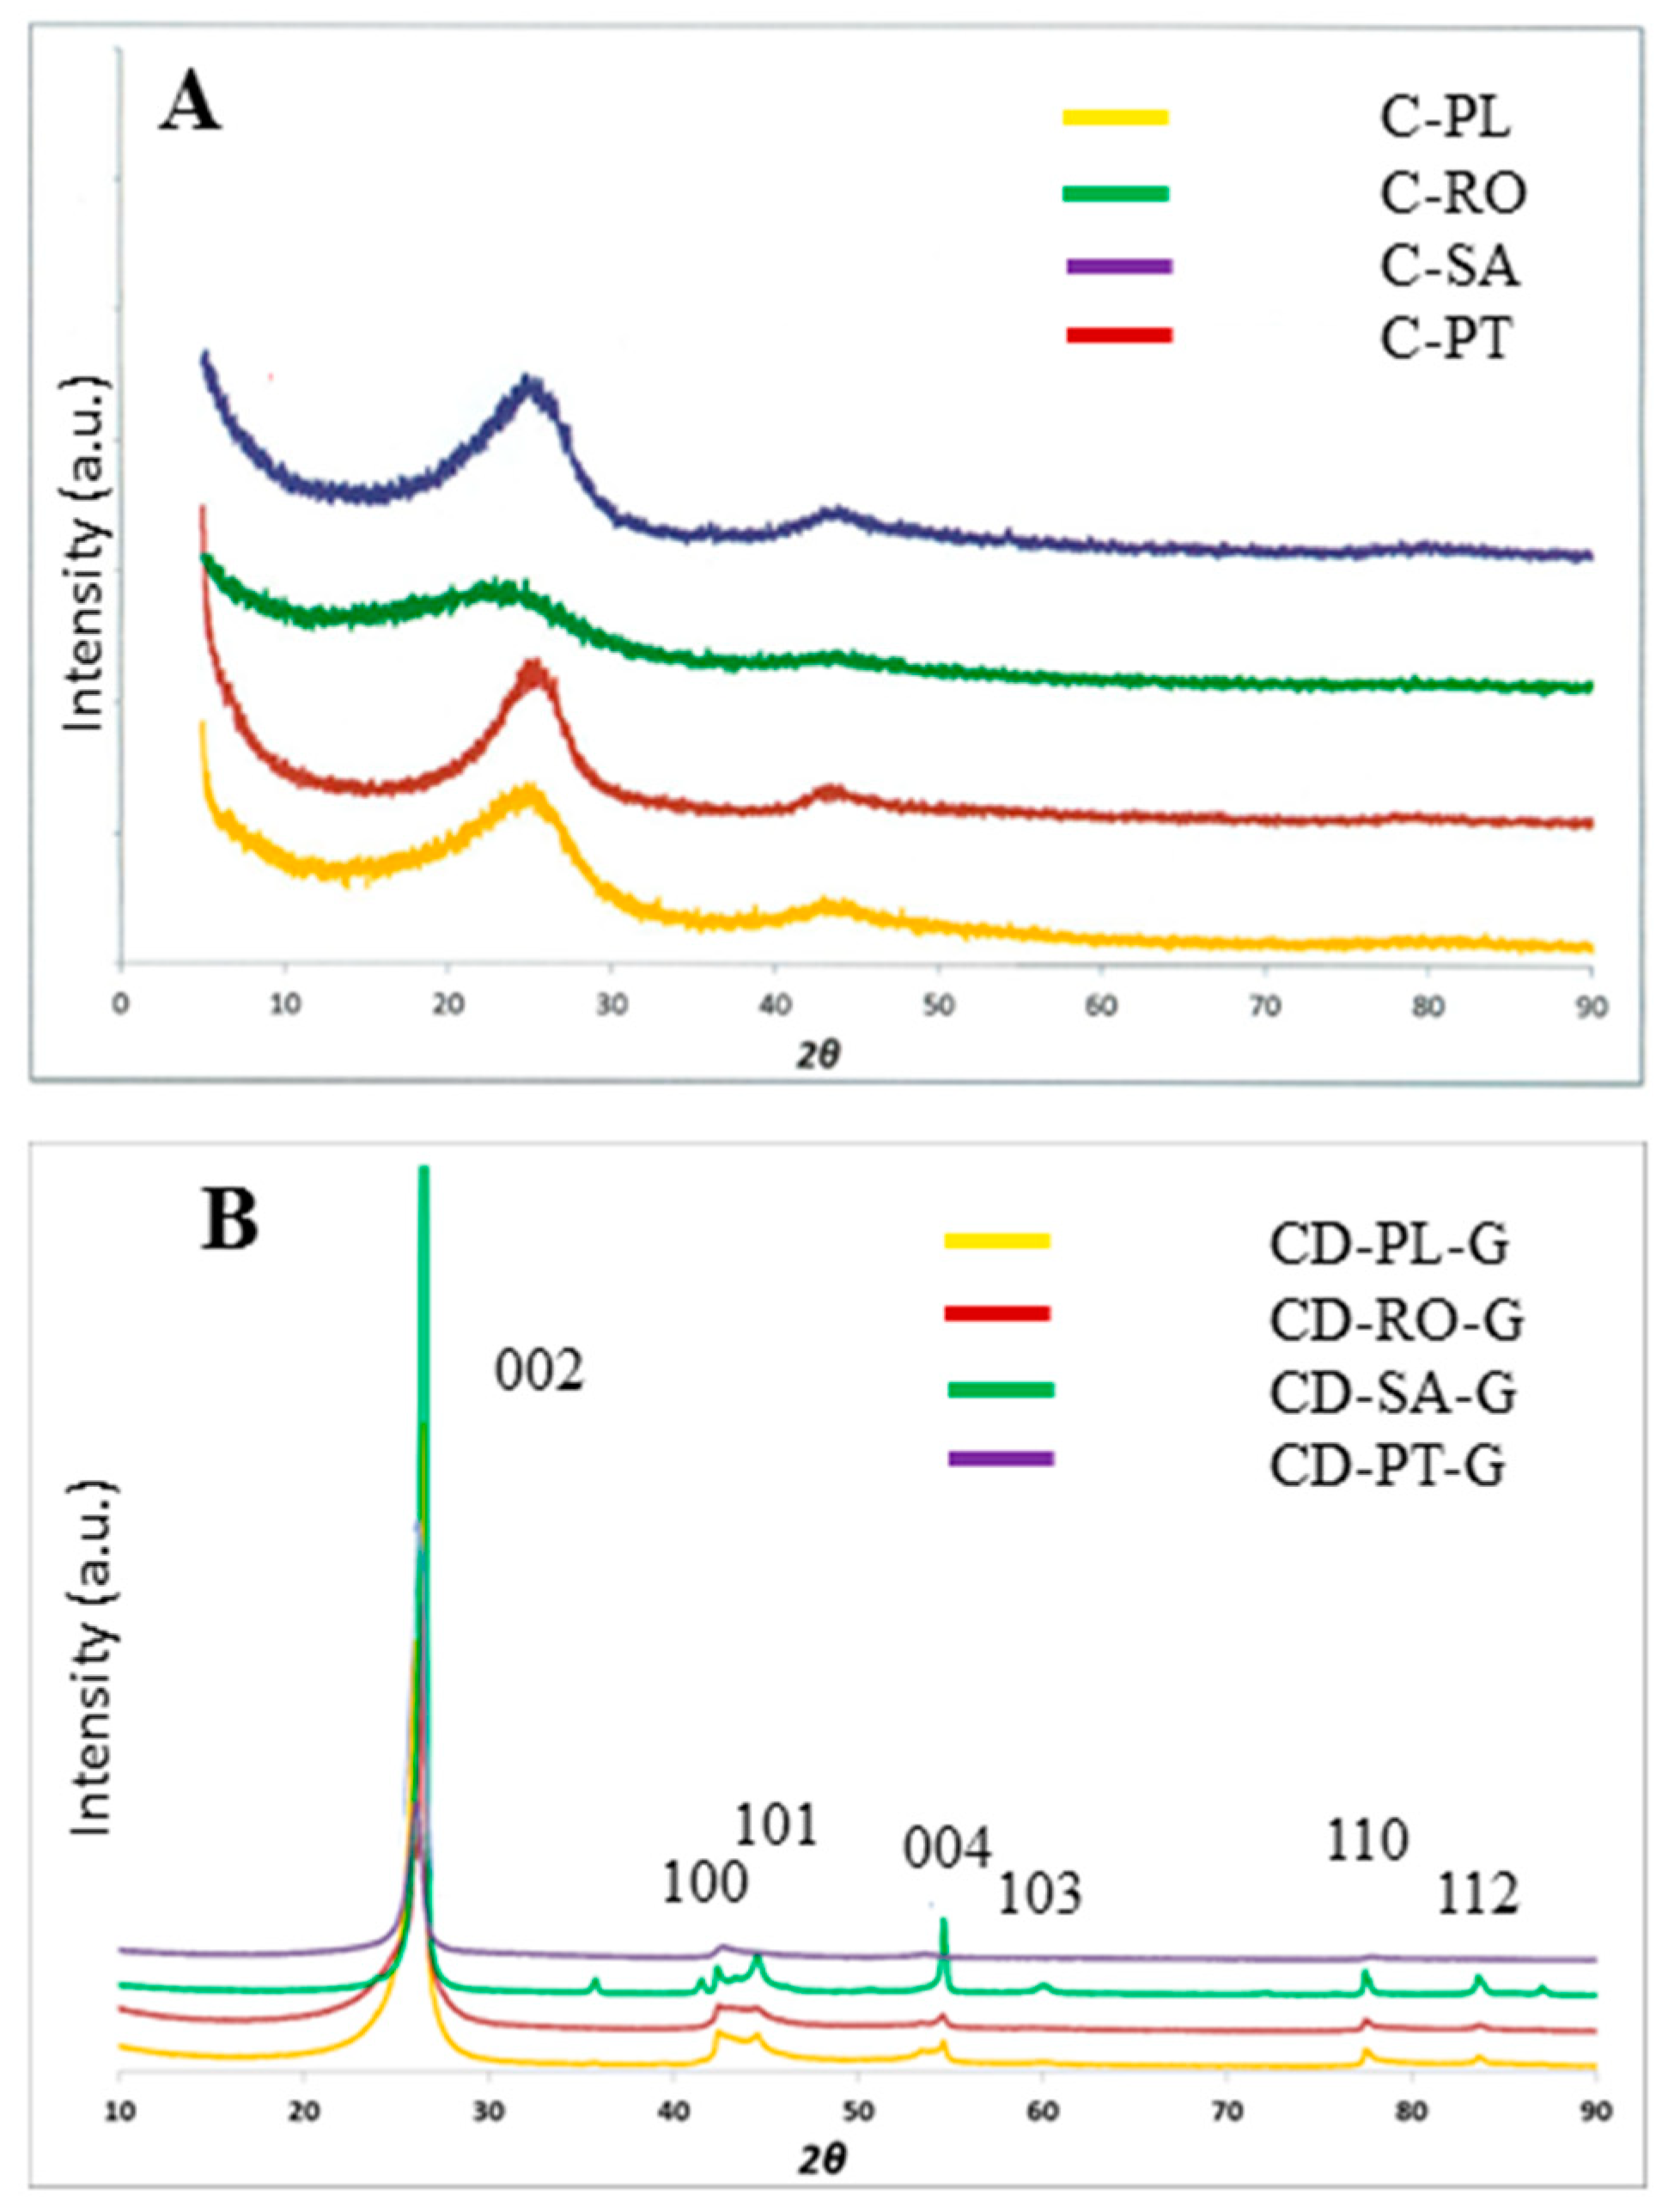
Figure 2.
XRD diffractograms: (A) char concentrates from Poland (C-PL), Romania (C-RO), South Africa (C-SA), and Portugal (C-PT); (B) graphitized demineralised char concentrates from Poland (CD-PL-G), Romania (CD-RO-G), South Africa (CD-SA-G), and Portugal (CD-PT-G).
Figure 2.
XRD diffractograms: (A) char concentrates from Poland (C-PL), Romania (C-RO), South Africa (C-SA), and Portugal (C-PT); (B) graphitized demineralised char concentrates from Poland (CD-PL-G), Romania (CD-RO-G), South Africa (CD-SA-G), and Portugal (CD-PT-G).
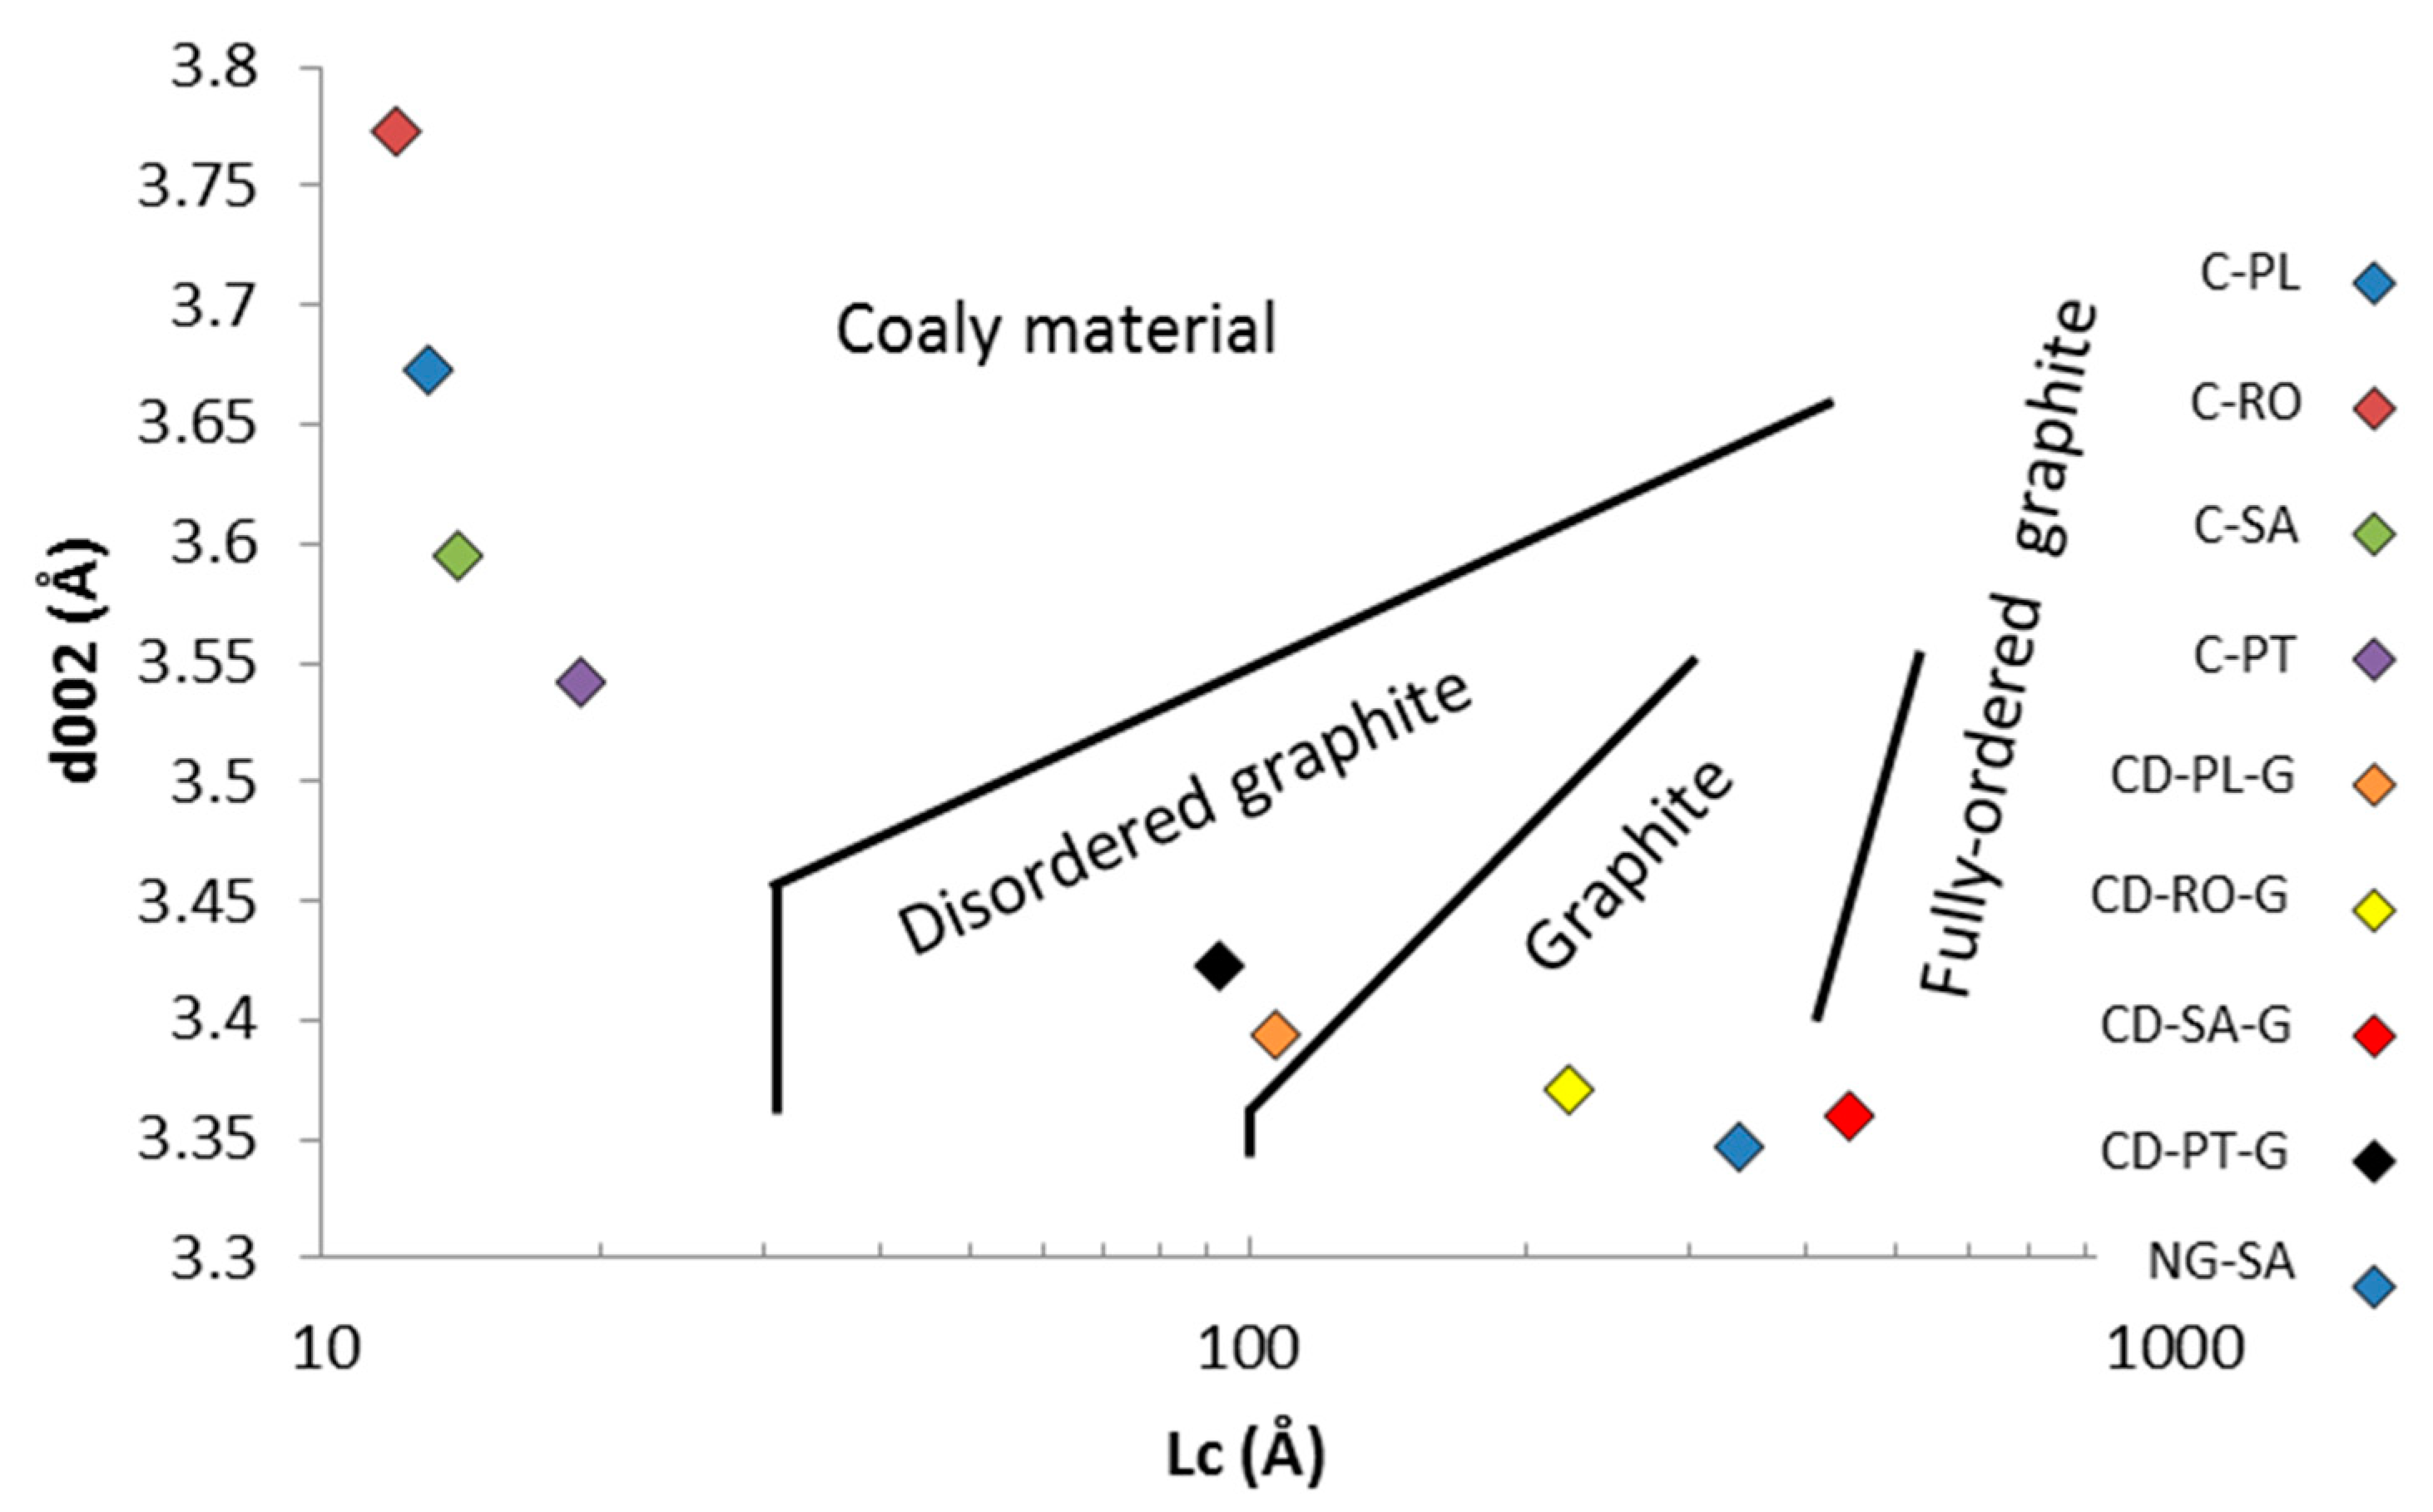
Figure 3.
Classification of carbonaceous material (modified from Tagiri and Oba [
67]).
Figure 3.
Classification of carbonaceous material (modified from Tagiri and Oba [
67]).
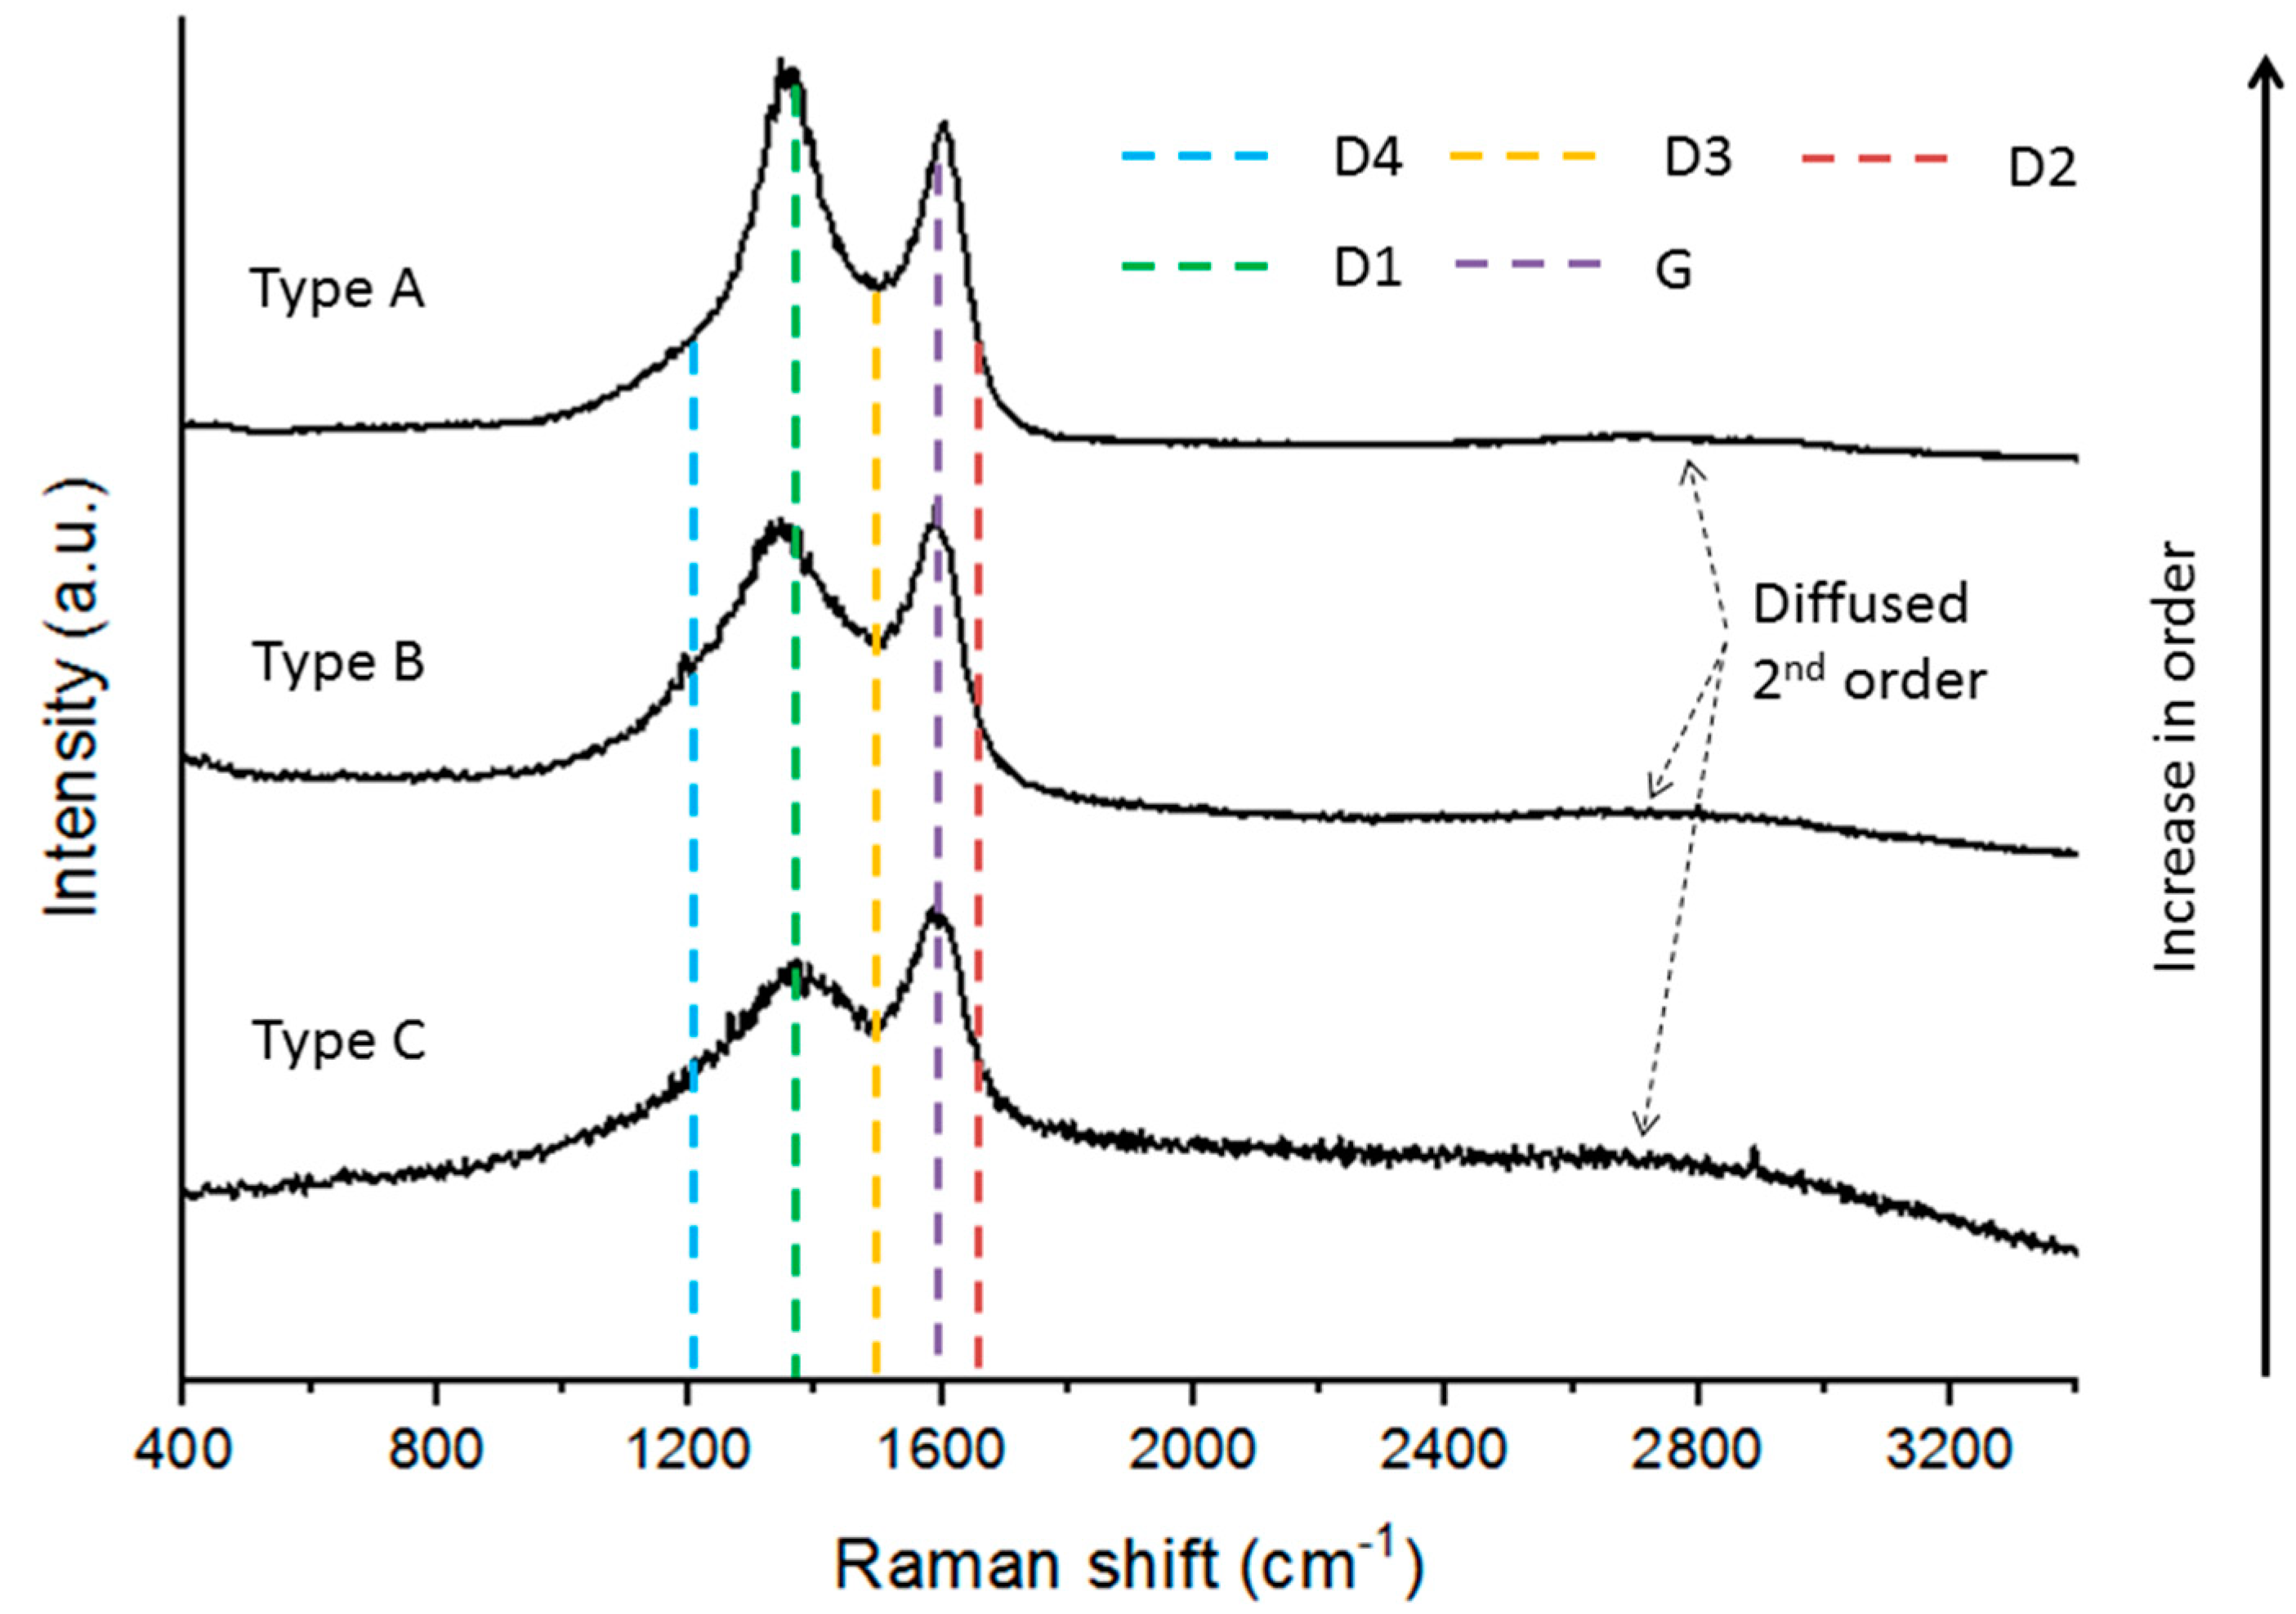
Figure 4.
Raman microspectroscopy spectra determined in the char concentrates. Type A was observed for C-PT, C-PL, C-SA, and C-RO; types B and C were only observed in C-RO (G—Graphite band, D—Defect band).
Figure 4.
Raman microspectroscopy spectra determined in the char concentrates. Type A was observed for C-PT, C-PL, C-SA, and C-RO; types B and C were only observed in C-RO (G—Graphite band, D—Defect band).
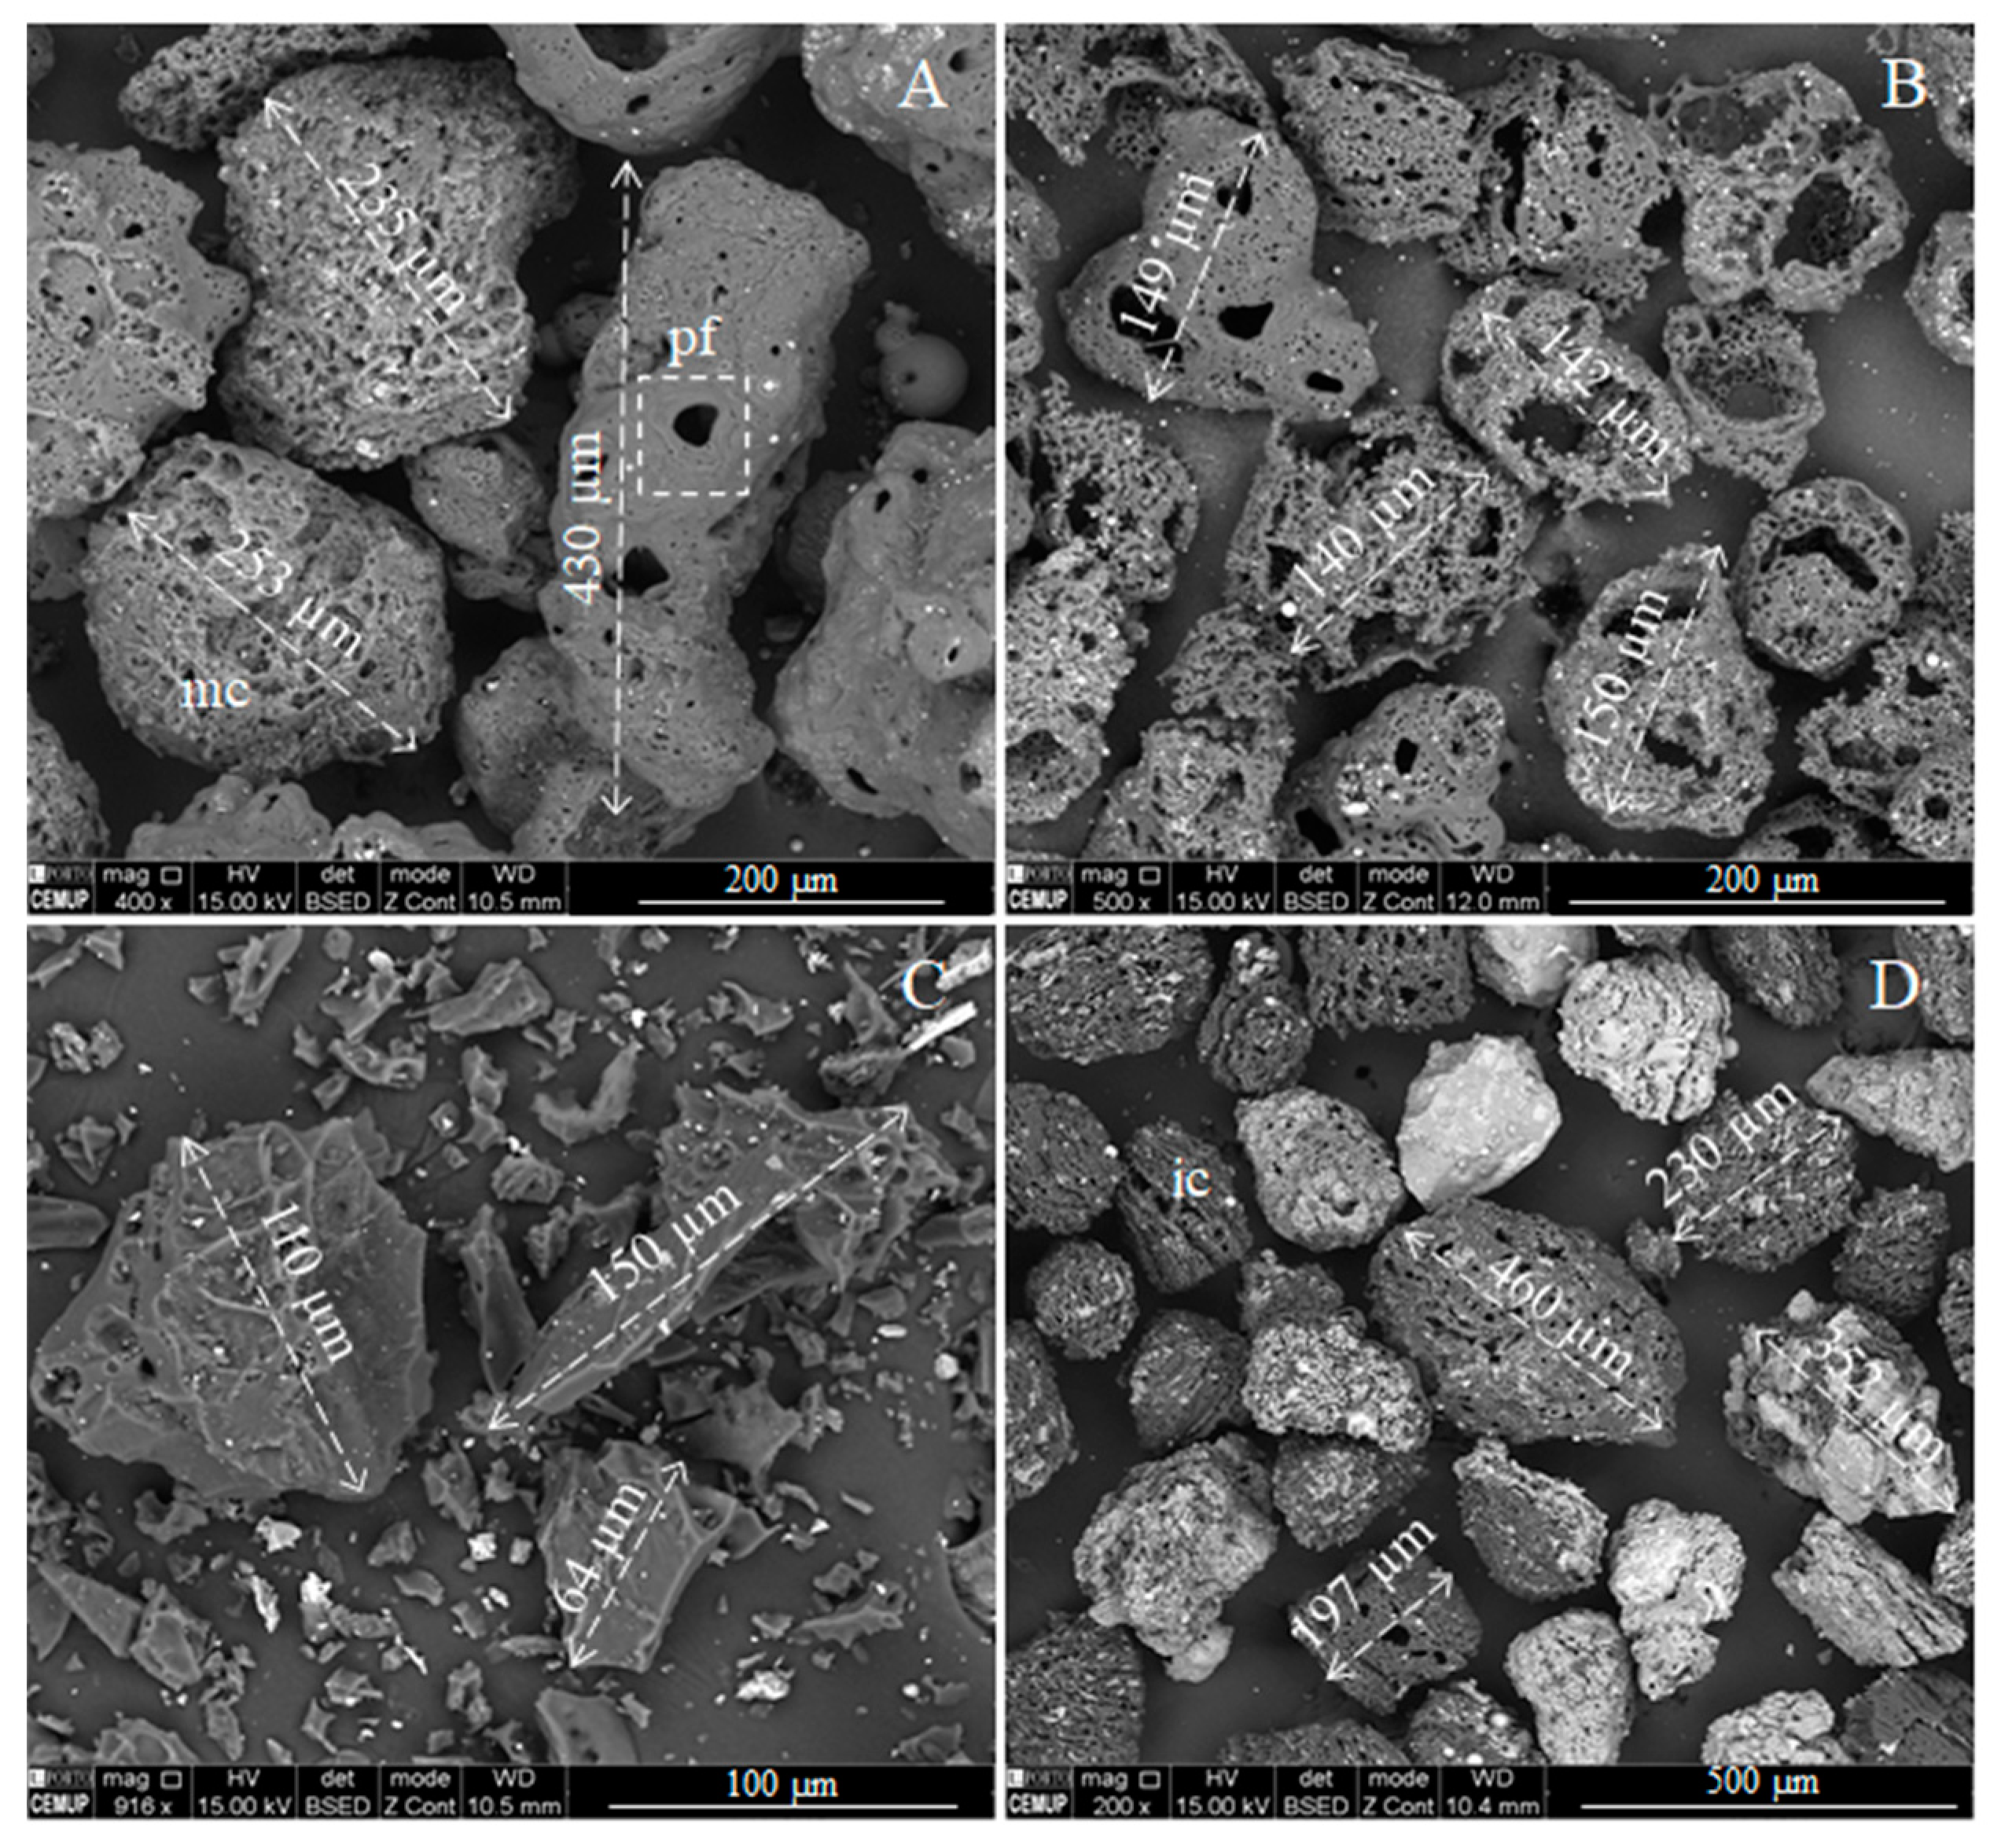
Figure 5.
Char concentrates: (A) Poland (C-PL), massive char (mc) and a char particle exhibiting plastic flow (pf) around pores (×400; BSE mode); (B) Portugal (C-PT), rounded and porous char with perforated thin walls (×500; BSE mode); (C) Romania (C-RO), massive edgy char particles (×916; BSE mode); (D) South Africa (C-SA), significant number of irregular shaped inertinite derived char particles (ic) and large glassy particles (×200; BSE mode).
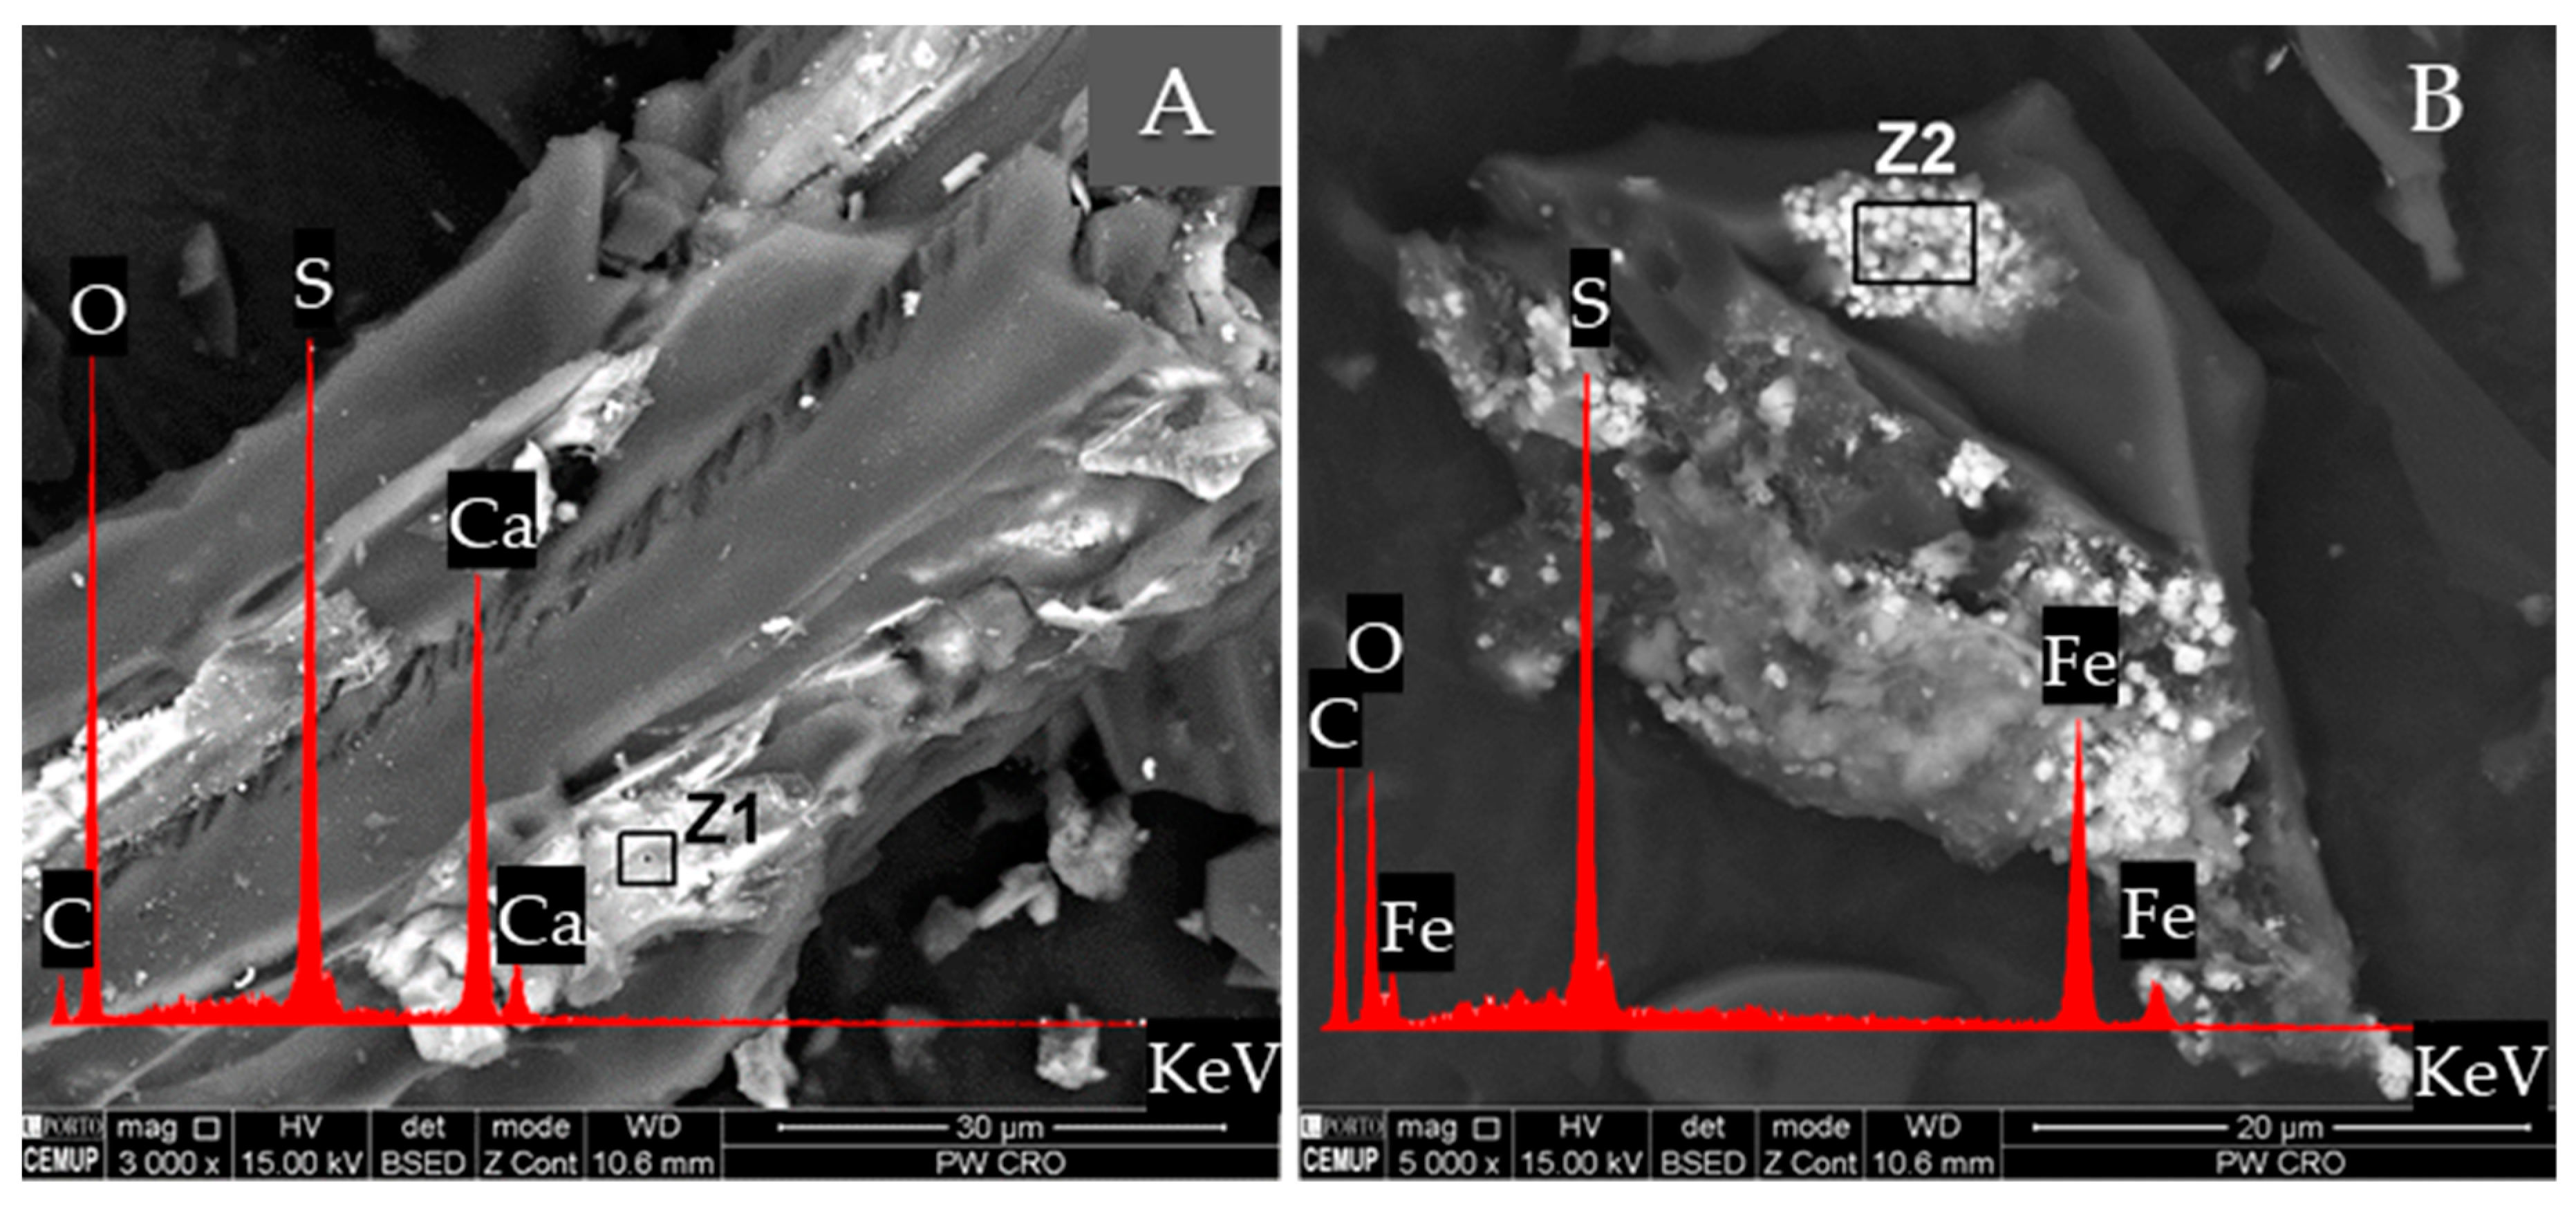
Figure 6.
Mineral matter in the Romanian char concentrate sample (C-RO): (A) gypsum (×3000; BSE mode); (B) pyrite (×5000; BSE mode).
Figure 6.
Mineral matter in the Romanian char concentrate sample (C-RO): (A) gypsum (×3000; BSE mode); (B) pyrite (×5000; BSE mode).
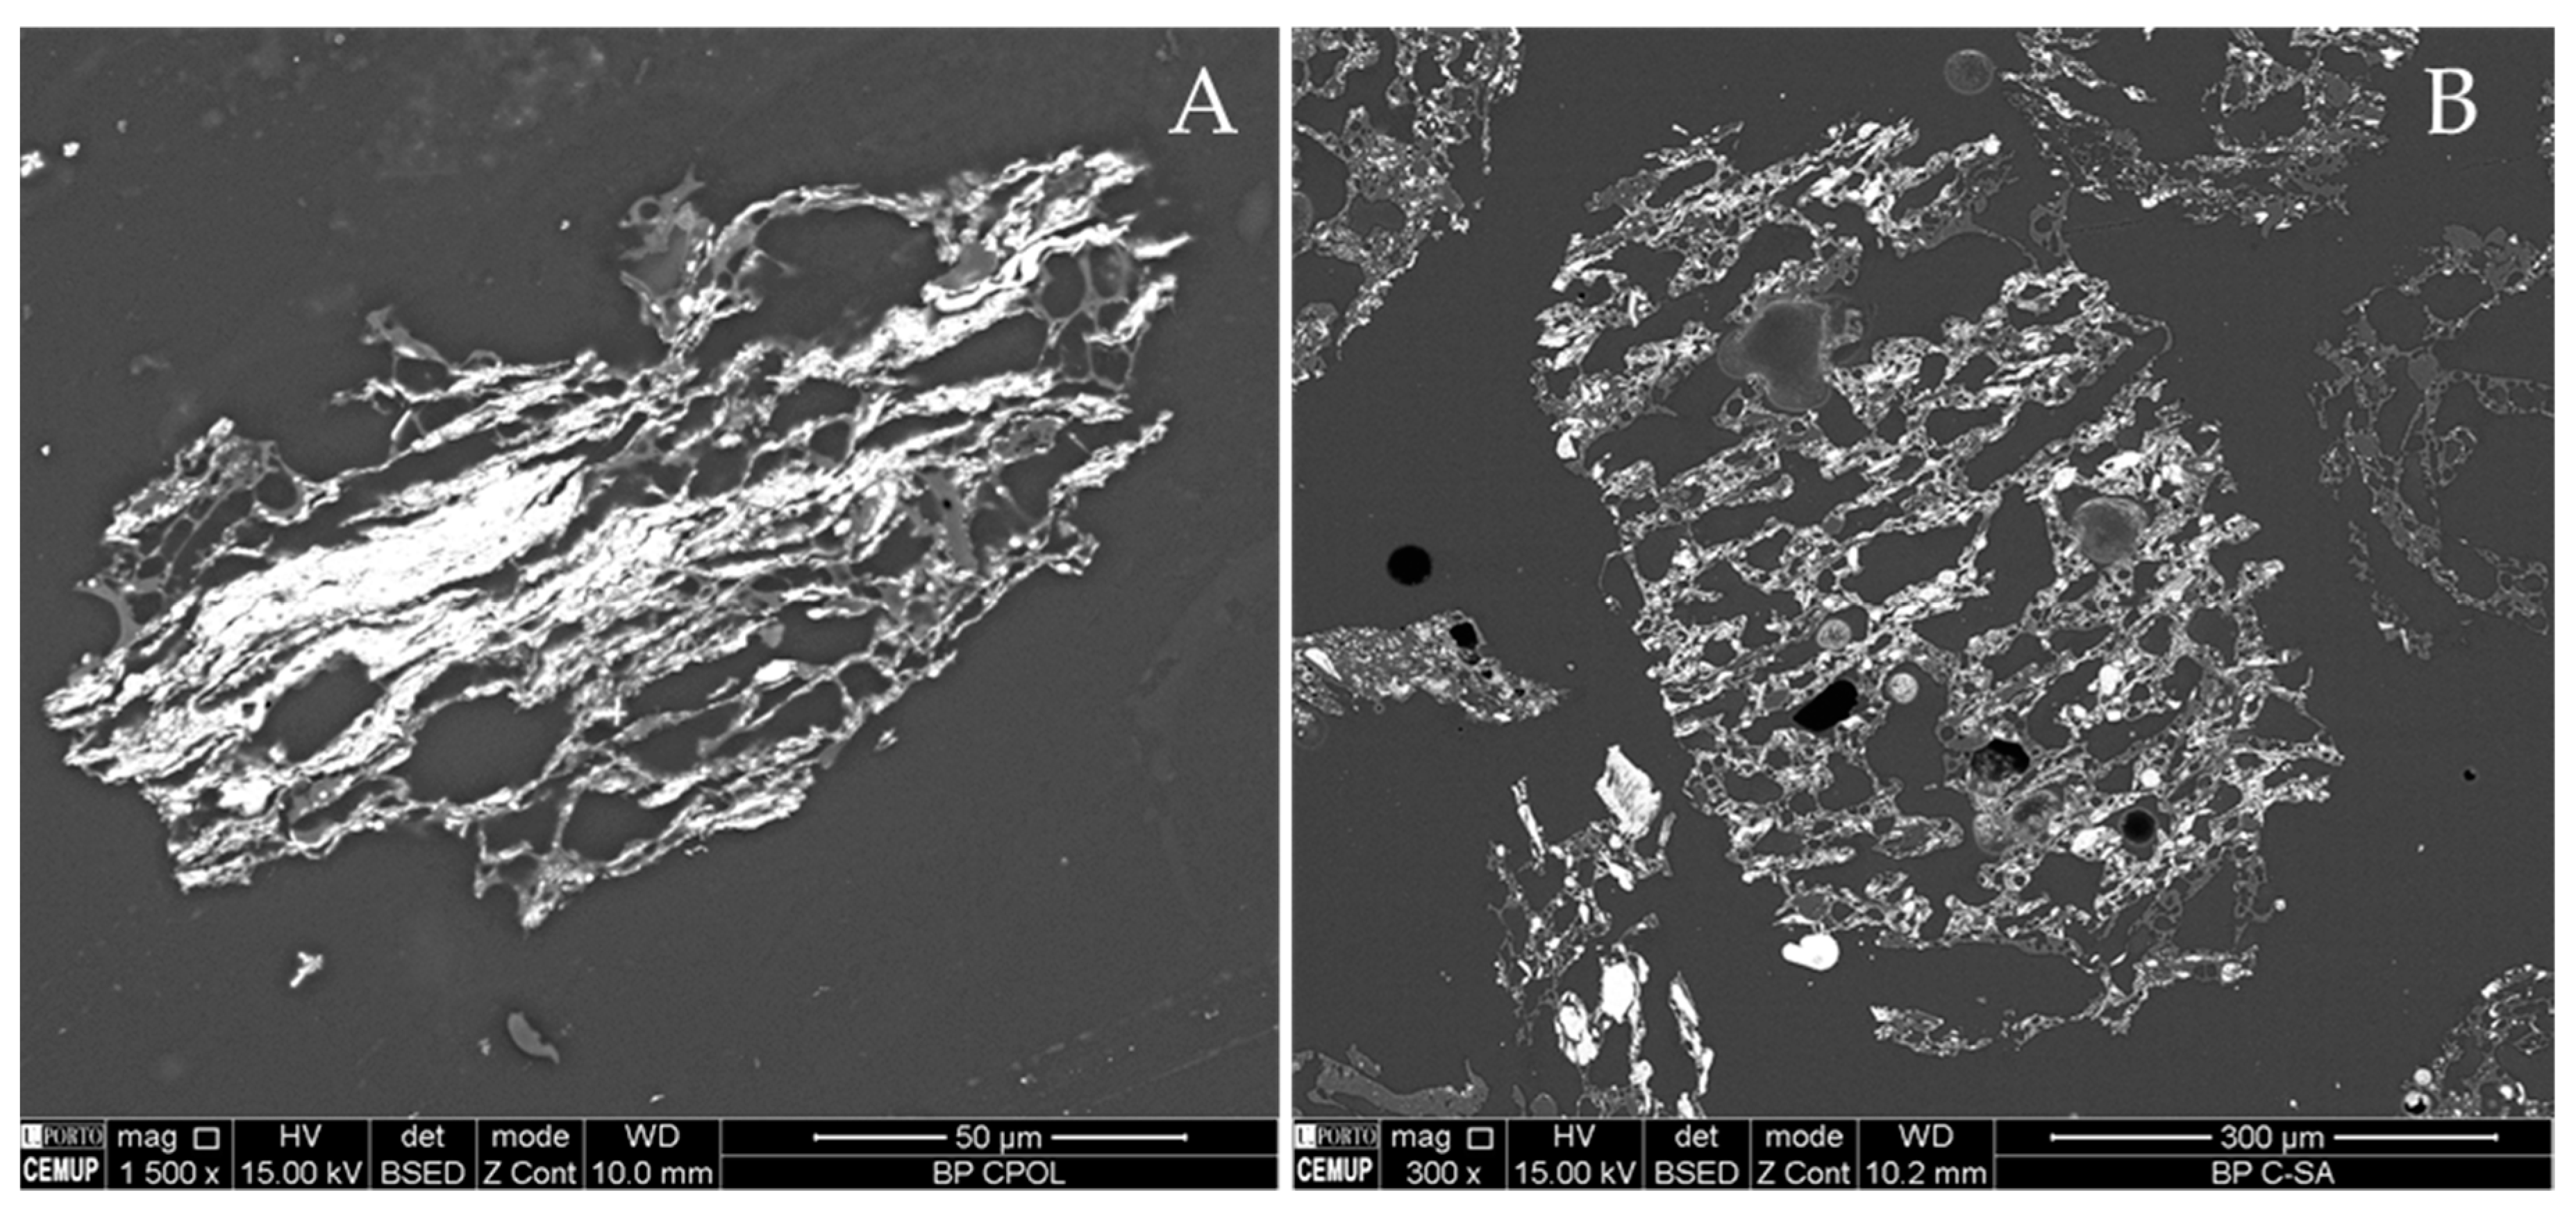
Figure 7.
Char particles with mineral matter in its structure, mainly aluminosilicates: (A) Polish char (C-PL) (×1500; BSE mode); (B) South African char (C-SA) (×300; BSE mode).
Figure 7.
Char particles with mineral matter in its structure, mainly aluminosilicates: (A) Polish char (C-PL) (×1500; BSE mode); (B) South African char (C-SA) (×300; BSE mode).
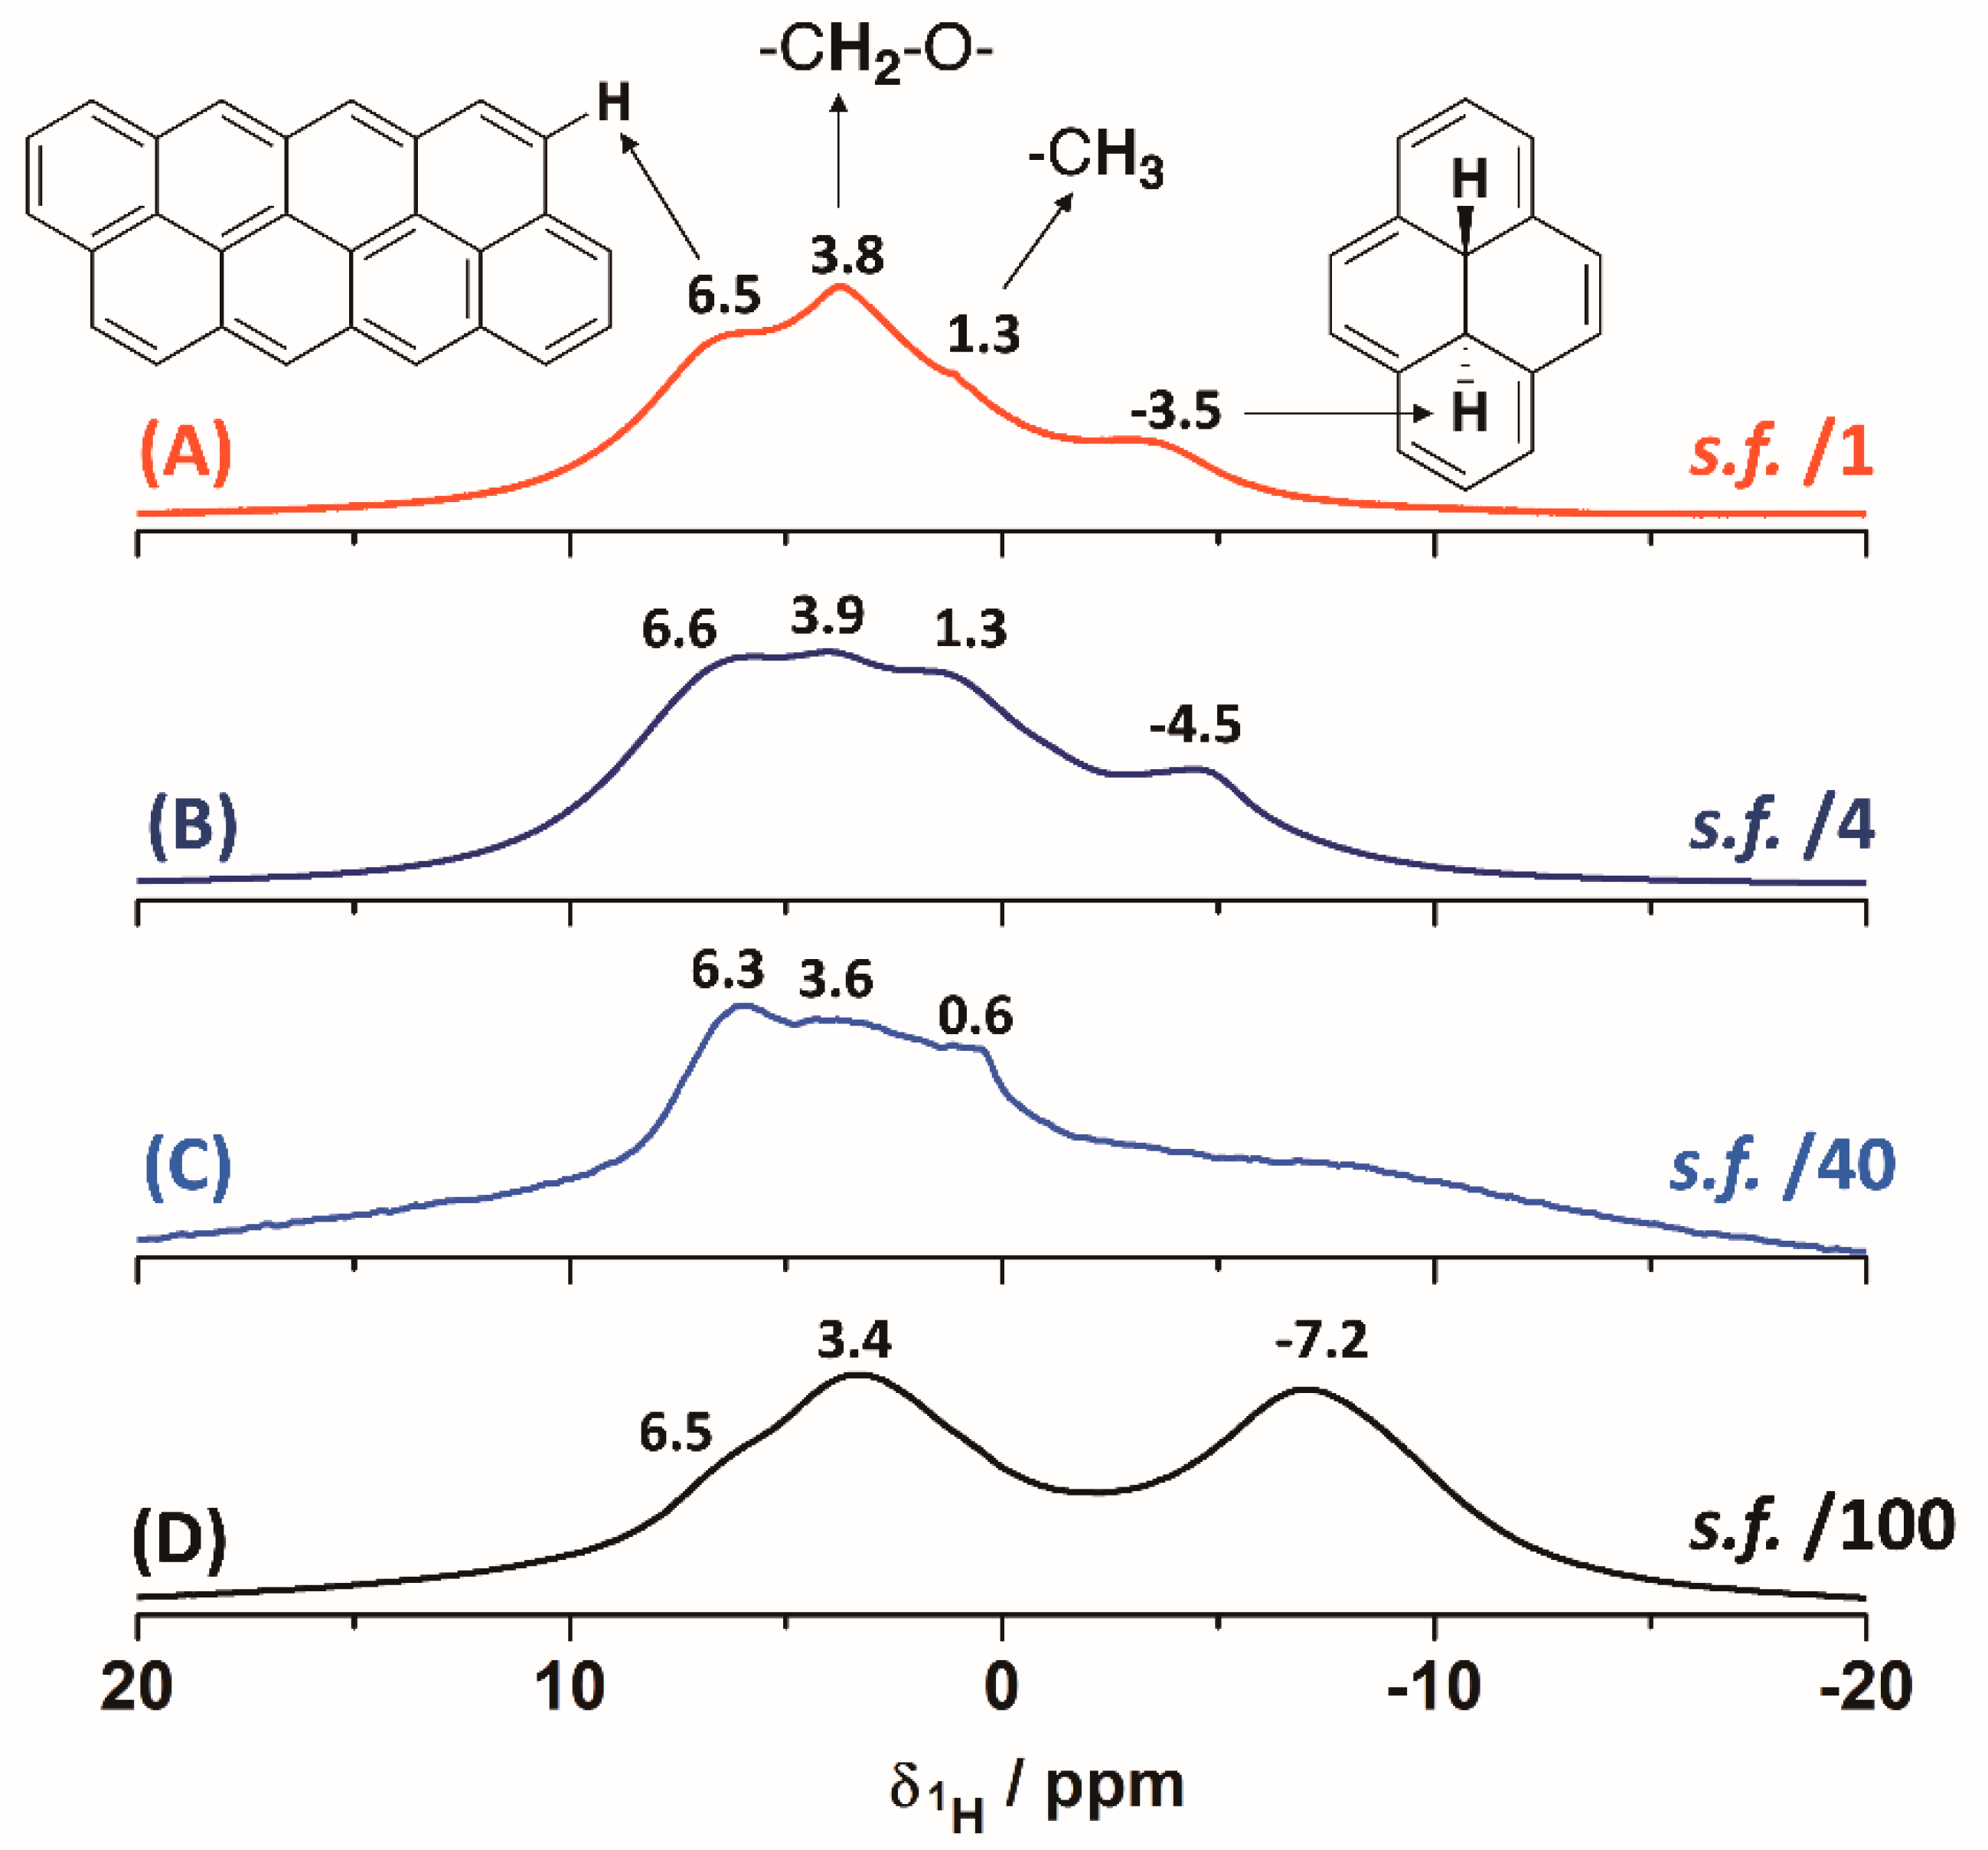
Figure 8.
1H-MAS (@32 kHz) solid-state NMR spectra for the demineralised char concentrates: (A) CD-RO; (B) CD-PL; (C) CD-PT; (D) CD-SA. Scaling factors (s.f.) are indicated in each spectrum.
Figure 8.
1H-MAS (@32 kHz) solid-state NMR spectra for the demineralised char concentrates: (A) CD-RO; (B) CD-PL; (C) CD-PT; (D) CD-SA. Scaling factors (s.f.) are indicated in each spectrum.
Figure 9.
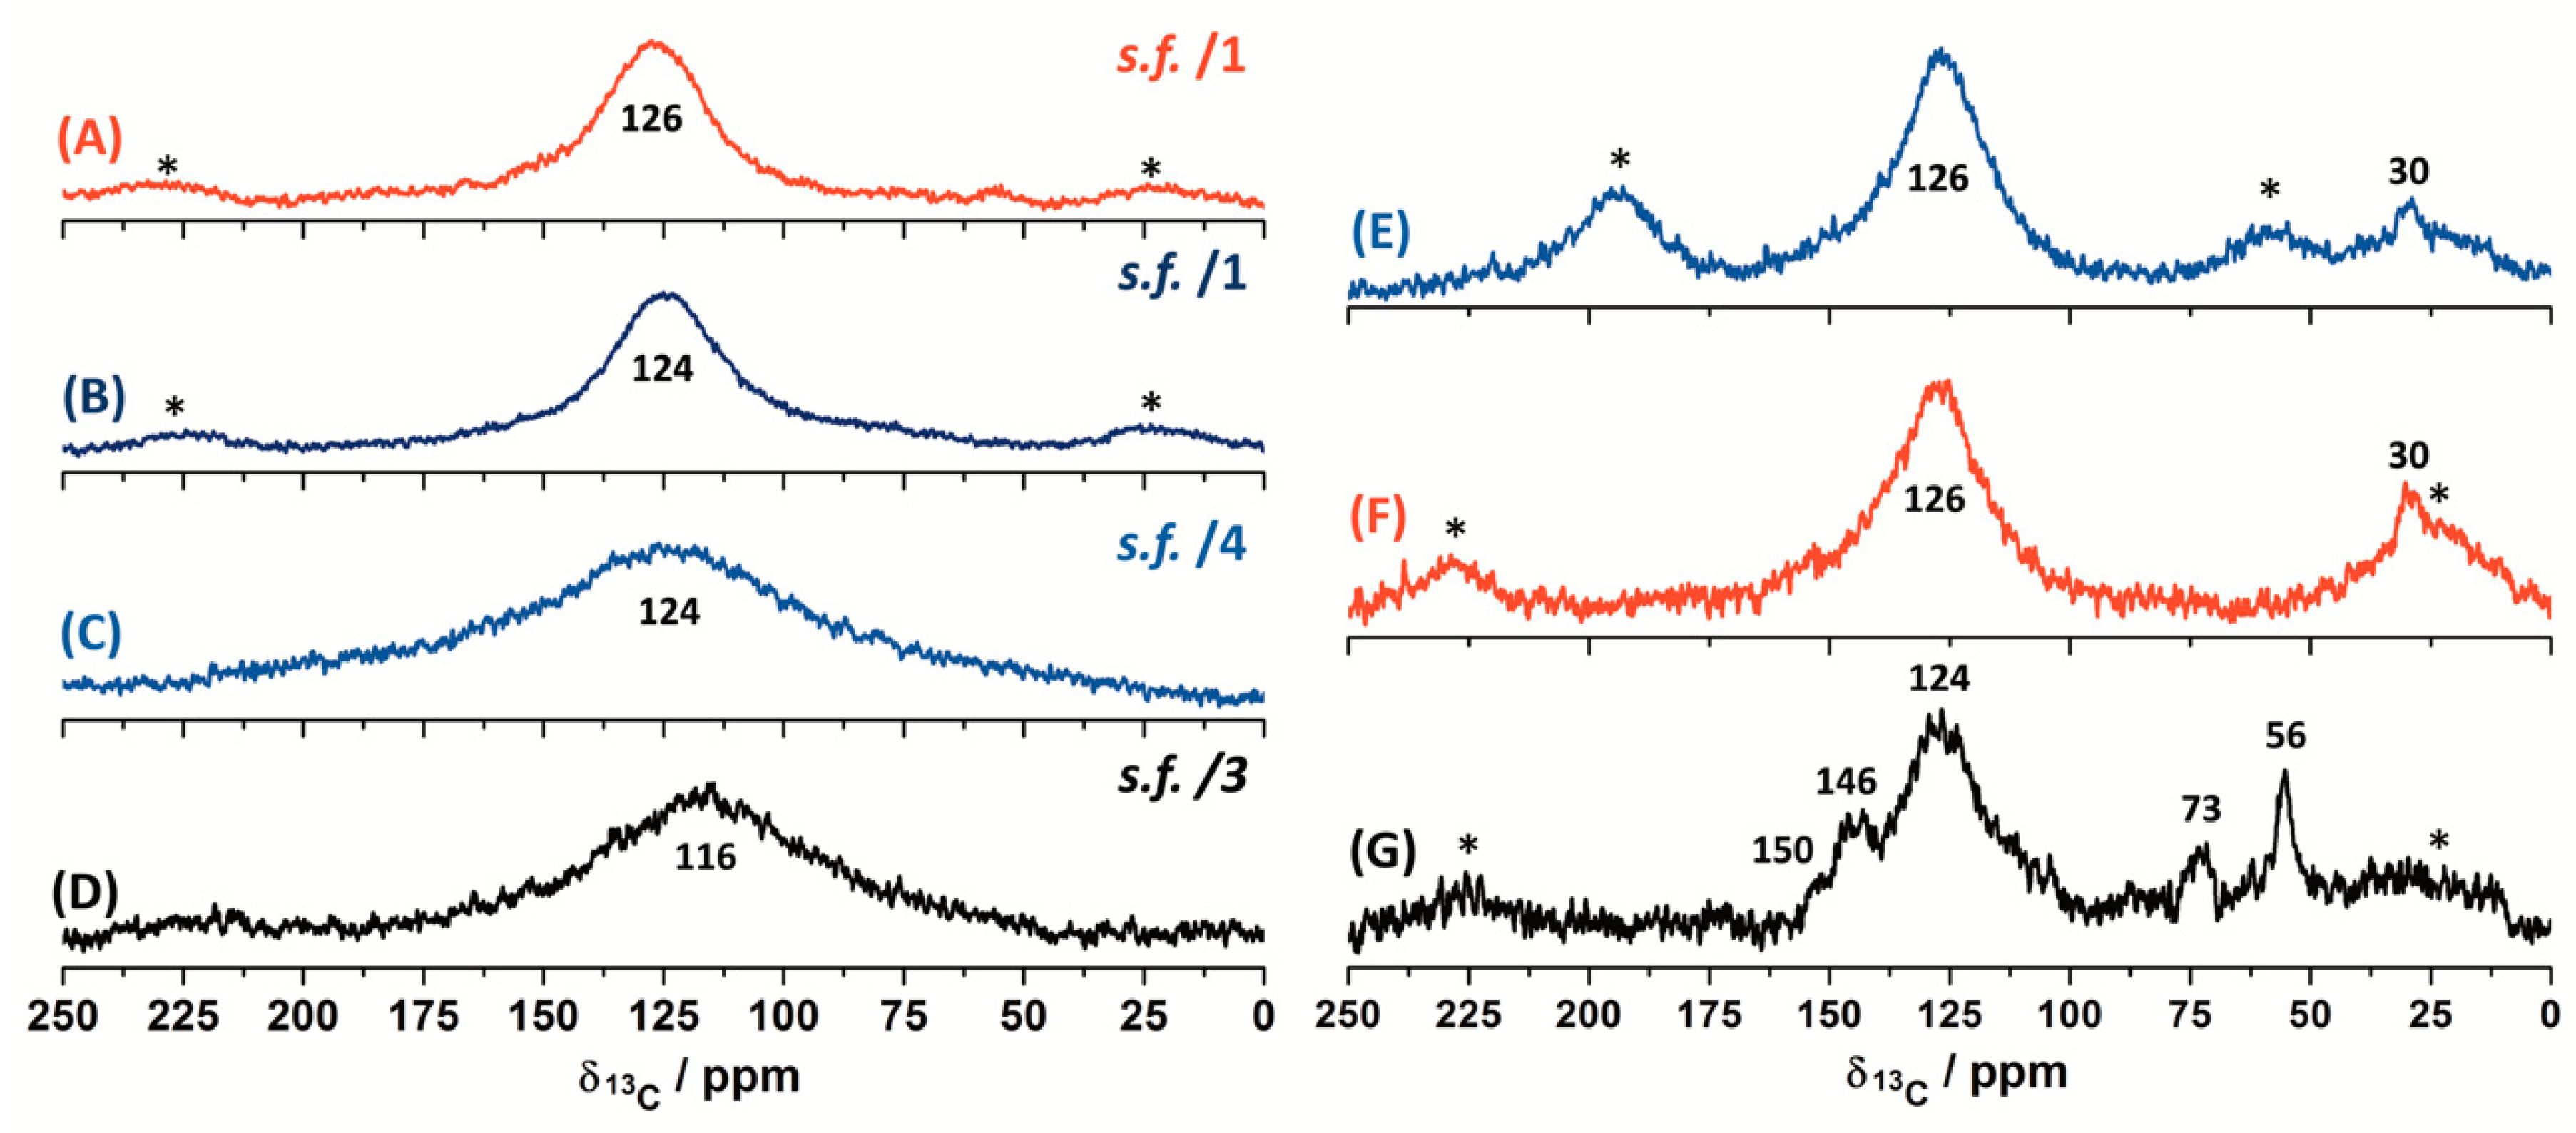
13C DP ss-NMR spectra (@15 kHz) for the demineralised char concentrates; (A) CD-RO; (B) CD-PL; (C) CD-PT; (D) CD-SA. Scaling factors (s.f.) are indicated in each spectrum. 13C CP-MAS ss-NMR spectra for the demineralised char concentrates: (E) CD-PL @10 kHz; (F) CD-PL @15 kHz; (G) CD-RO @15 kHz. Spinning side bands are indicated with an asterisk.
Figure 9.
13C DP ss-NMR spectra (@15 kHz) for the demineralised char concentrates; (A) CD-RO; (B) CD-PL; (C) CD-PT; (D) CD-SA. Scaling factors (s.f.) are indicated in each spectrum. 13C CP-MAS ss-NMR spectra for the demineralised char concentrates: (E) CD-PL @10 kHz; (F) CD-PL @15 kHz; (G) CD-RO @15 kHz. Spinning side bands are indicated with an asterisk.
Figure 10.
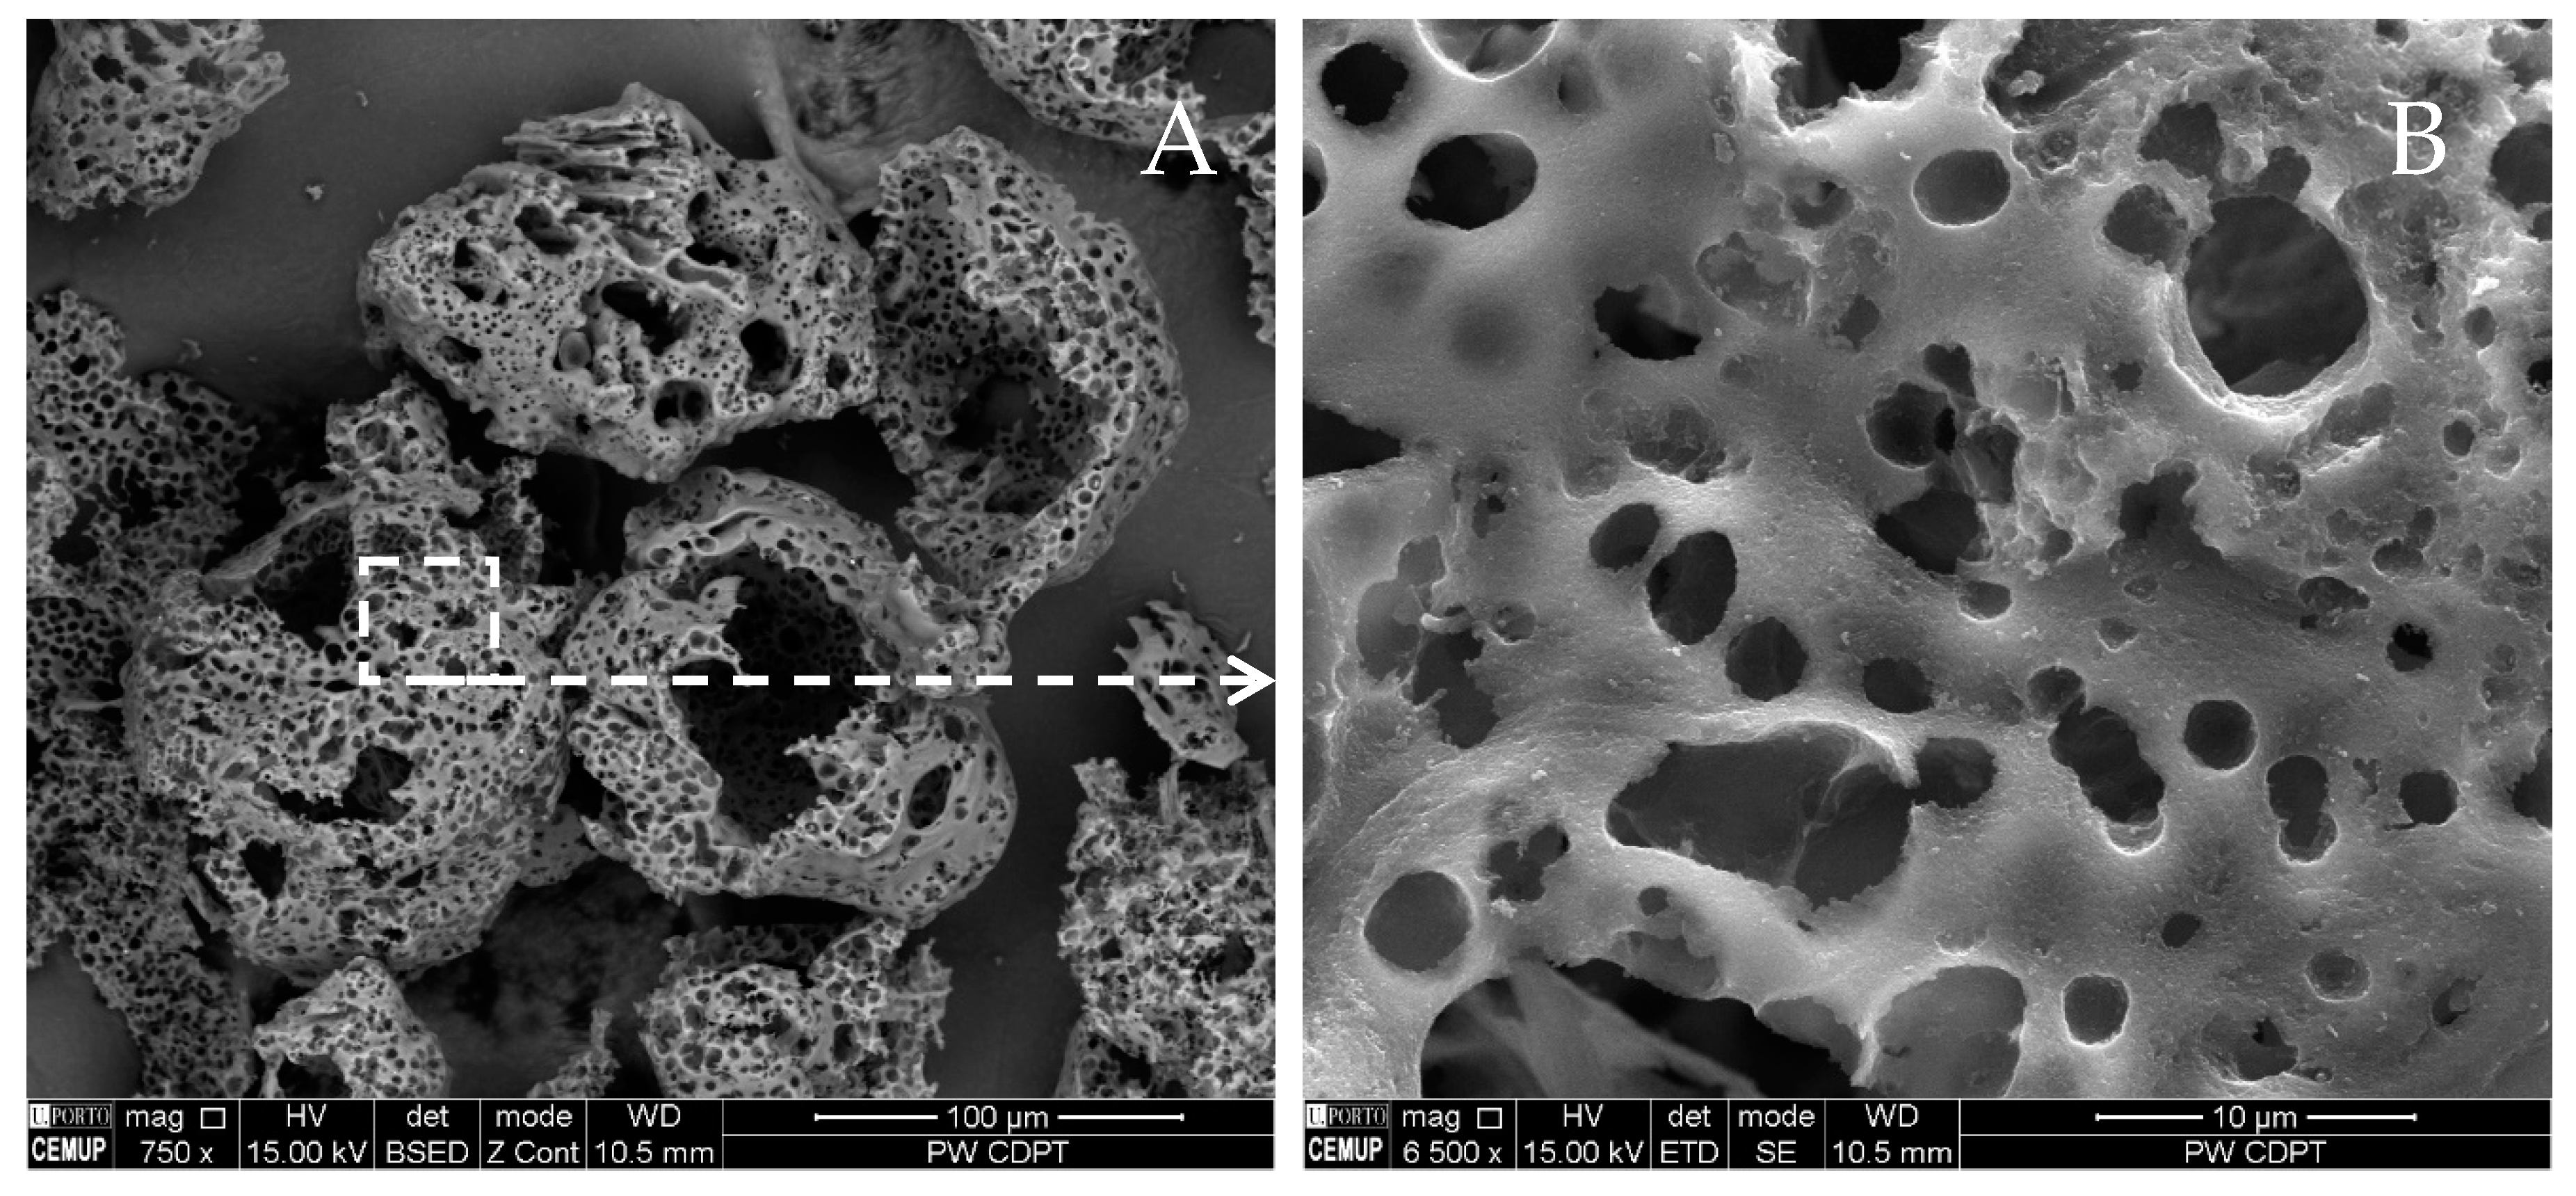
CD-PT: (A) general view (×750; BSE mode); (B) magnification of the empty char vacuoles (×6500; BSE mode).
Figure 10.
CD-PT: (A) general view (×750; BSE mode); (B) magnification of the empty char vacuoles (×6500; BSE mode).
Figure 11.
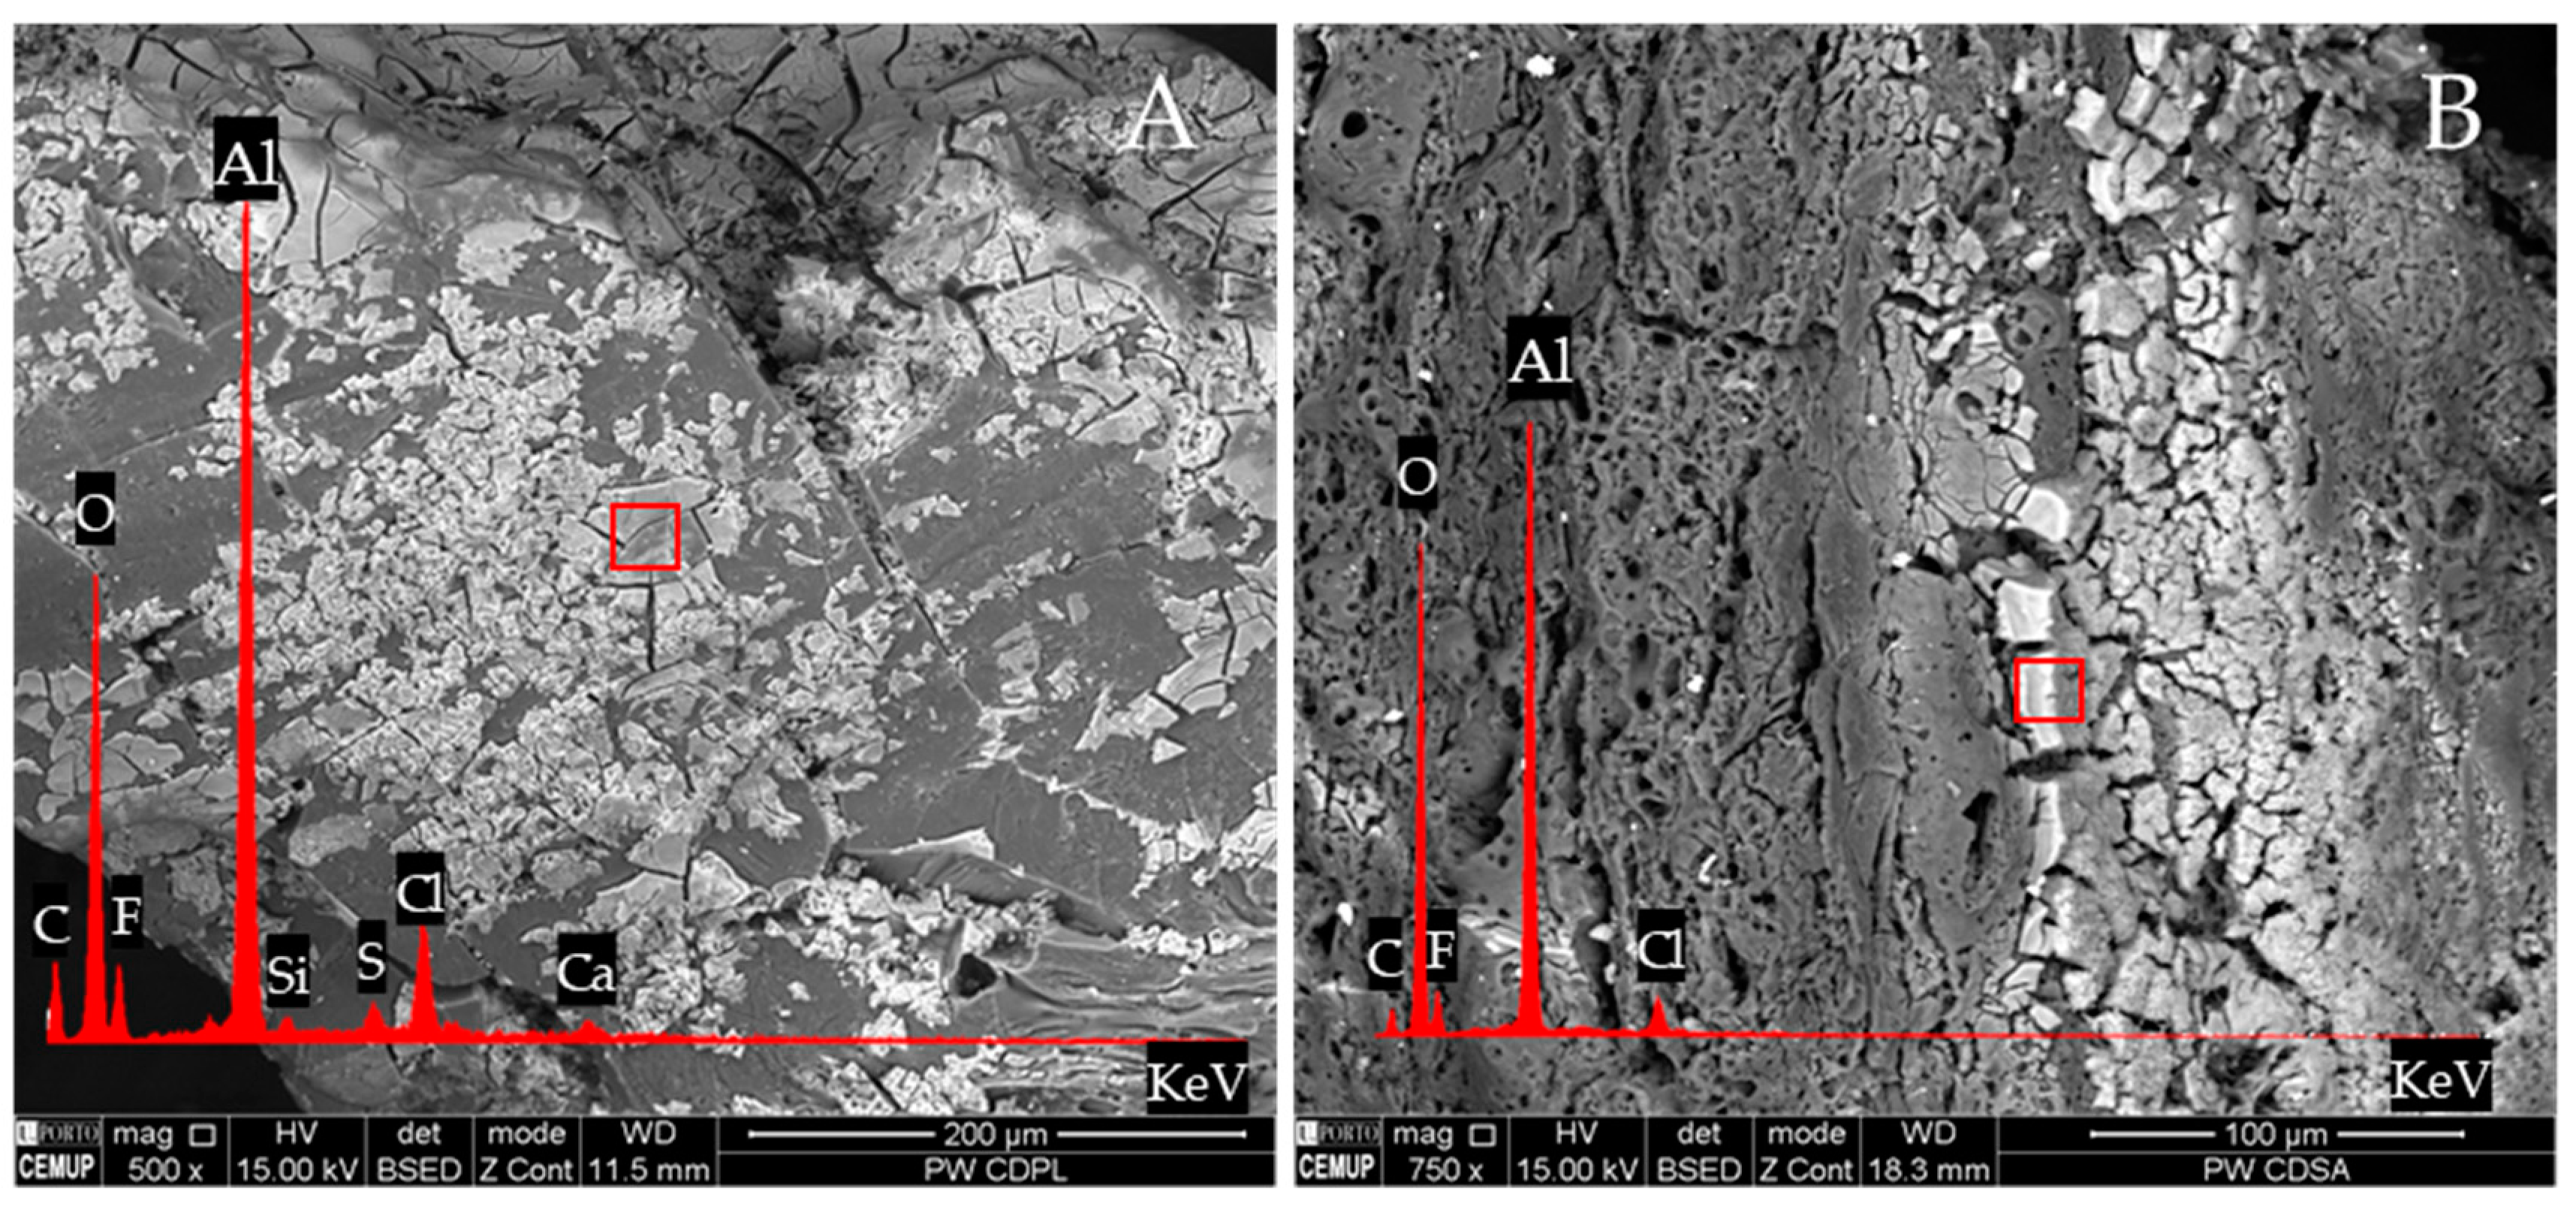
Inorganic matter remaining embedded in the chars following demineralisation and the respective EDS spectra: (A) CD-PL (×500; BSE mode); (B) CD-SA (×750; BSE mode).
Figure 11.
Inorganic matter remaining embedded in the chars following demineralisation and the respective EDS spectra: (A) CD-PL (×500; BSE mode); (B) CD-SA (×750; BSE mode).
Figure 12.
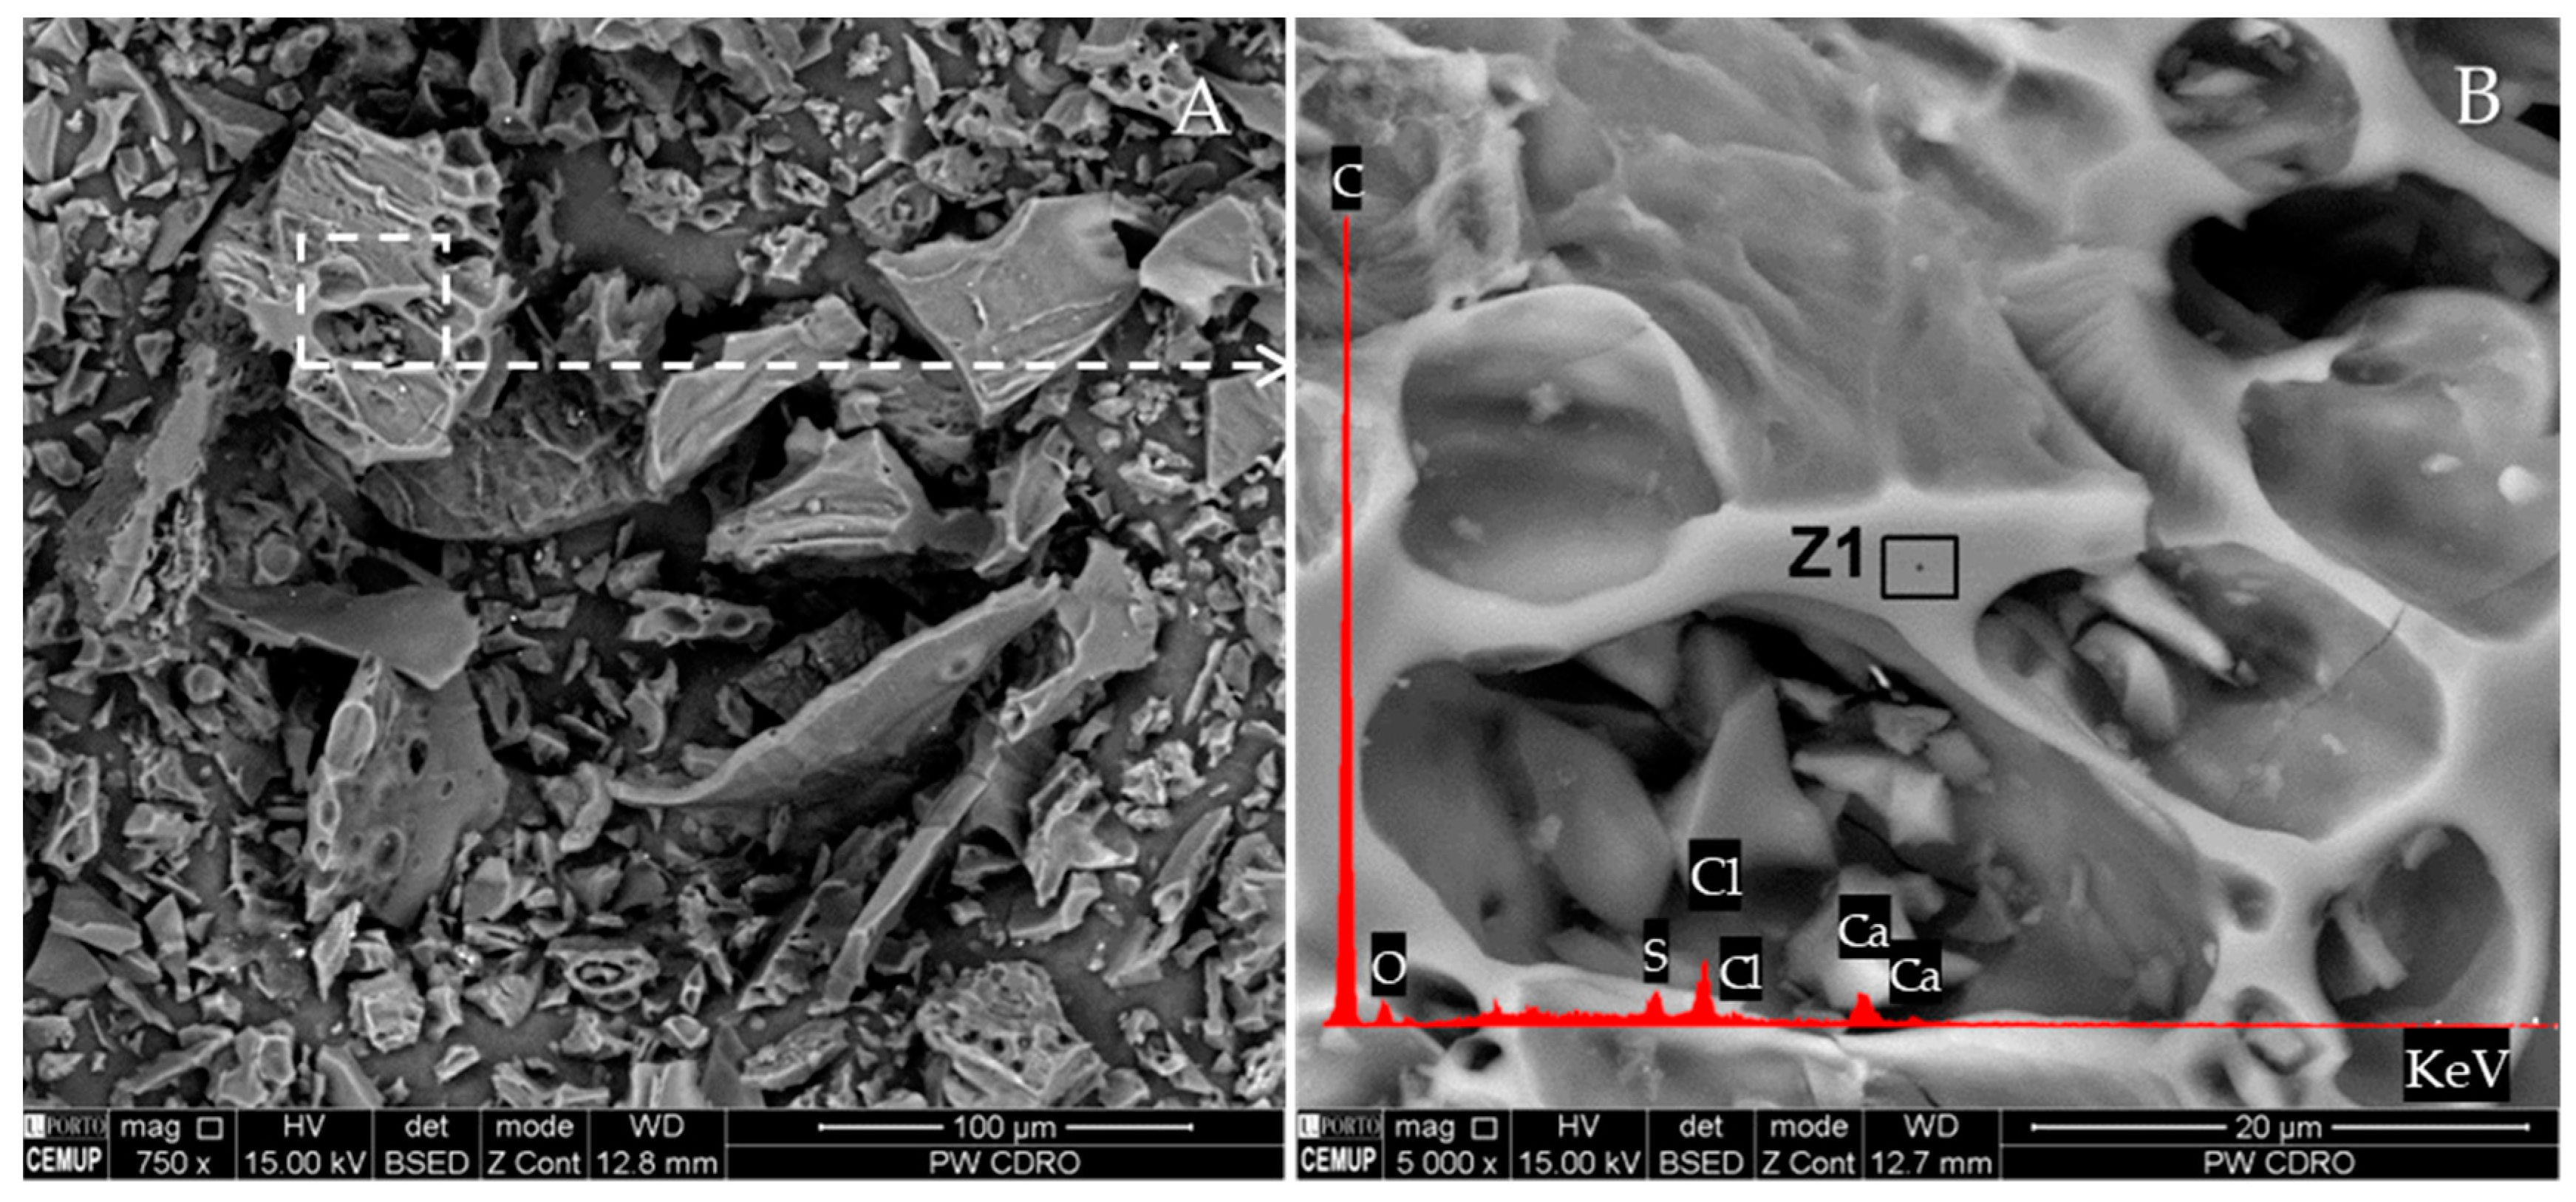
CD-RO: (A) general view with no visible mineral matter (×750; BSE mode); (B) magnified area and respective EDS spectrum demonstrating the presence of impurities, namely S, Cl, and Ca (×5000; BSE mode).
Figure 12.
CD-RO: (A) general view with no visible mineral matter (×750; BSE mode); (B) magnified area and respective EDS spectrum demonstrating the presence of impurities, namely S, Cl, and Ca (×5000; BSE mode).
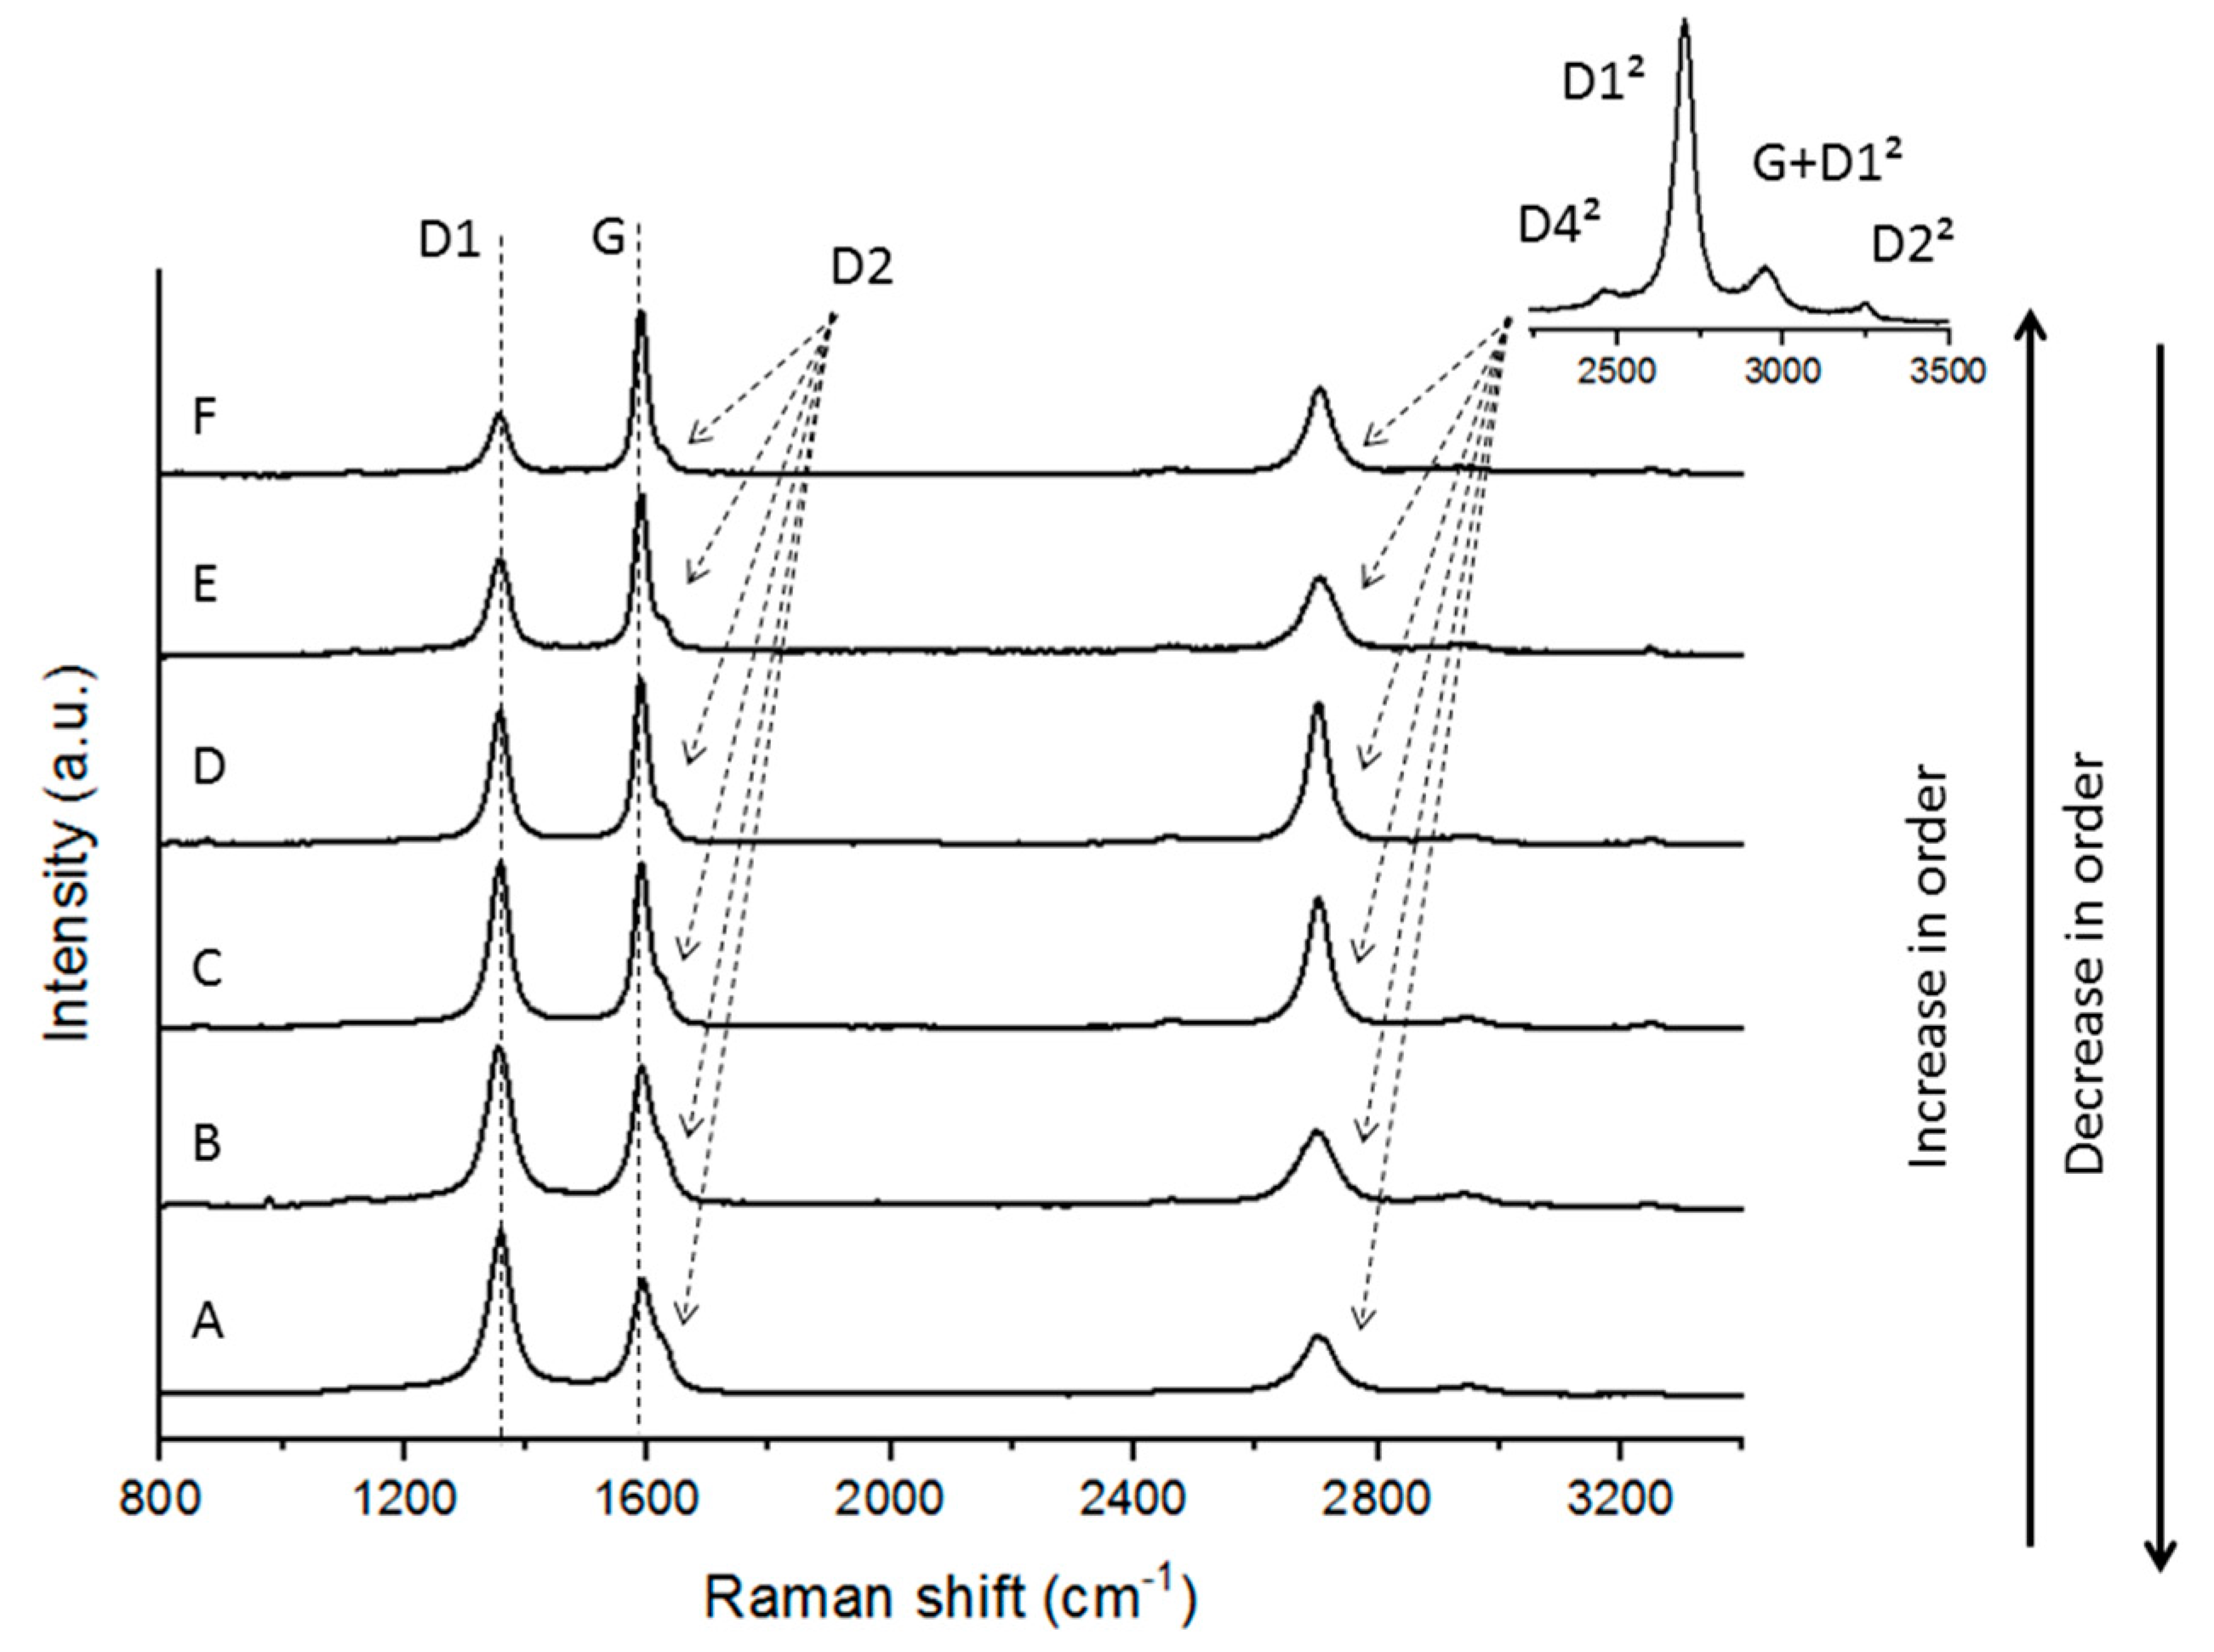
Figure 13.
Raman microspectroscopy spectra determined in the graphitized demineralised char concentrates (CD-PT-G, CD-PL-G, CD-RO-G, and CD-SA-G).
Figure 13.
Raman microspectroscopy spectra determined in the graphitized demineralised char concentrates (CD-PT-G, CD-PL-G, CD-RO-G, and CD-SA-G).
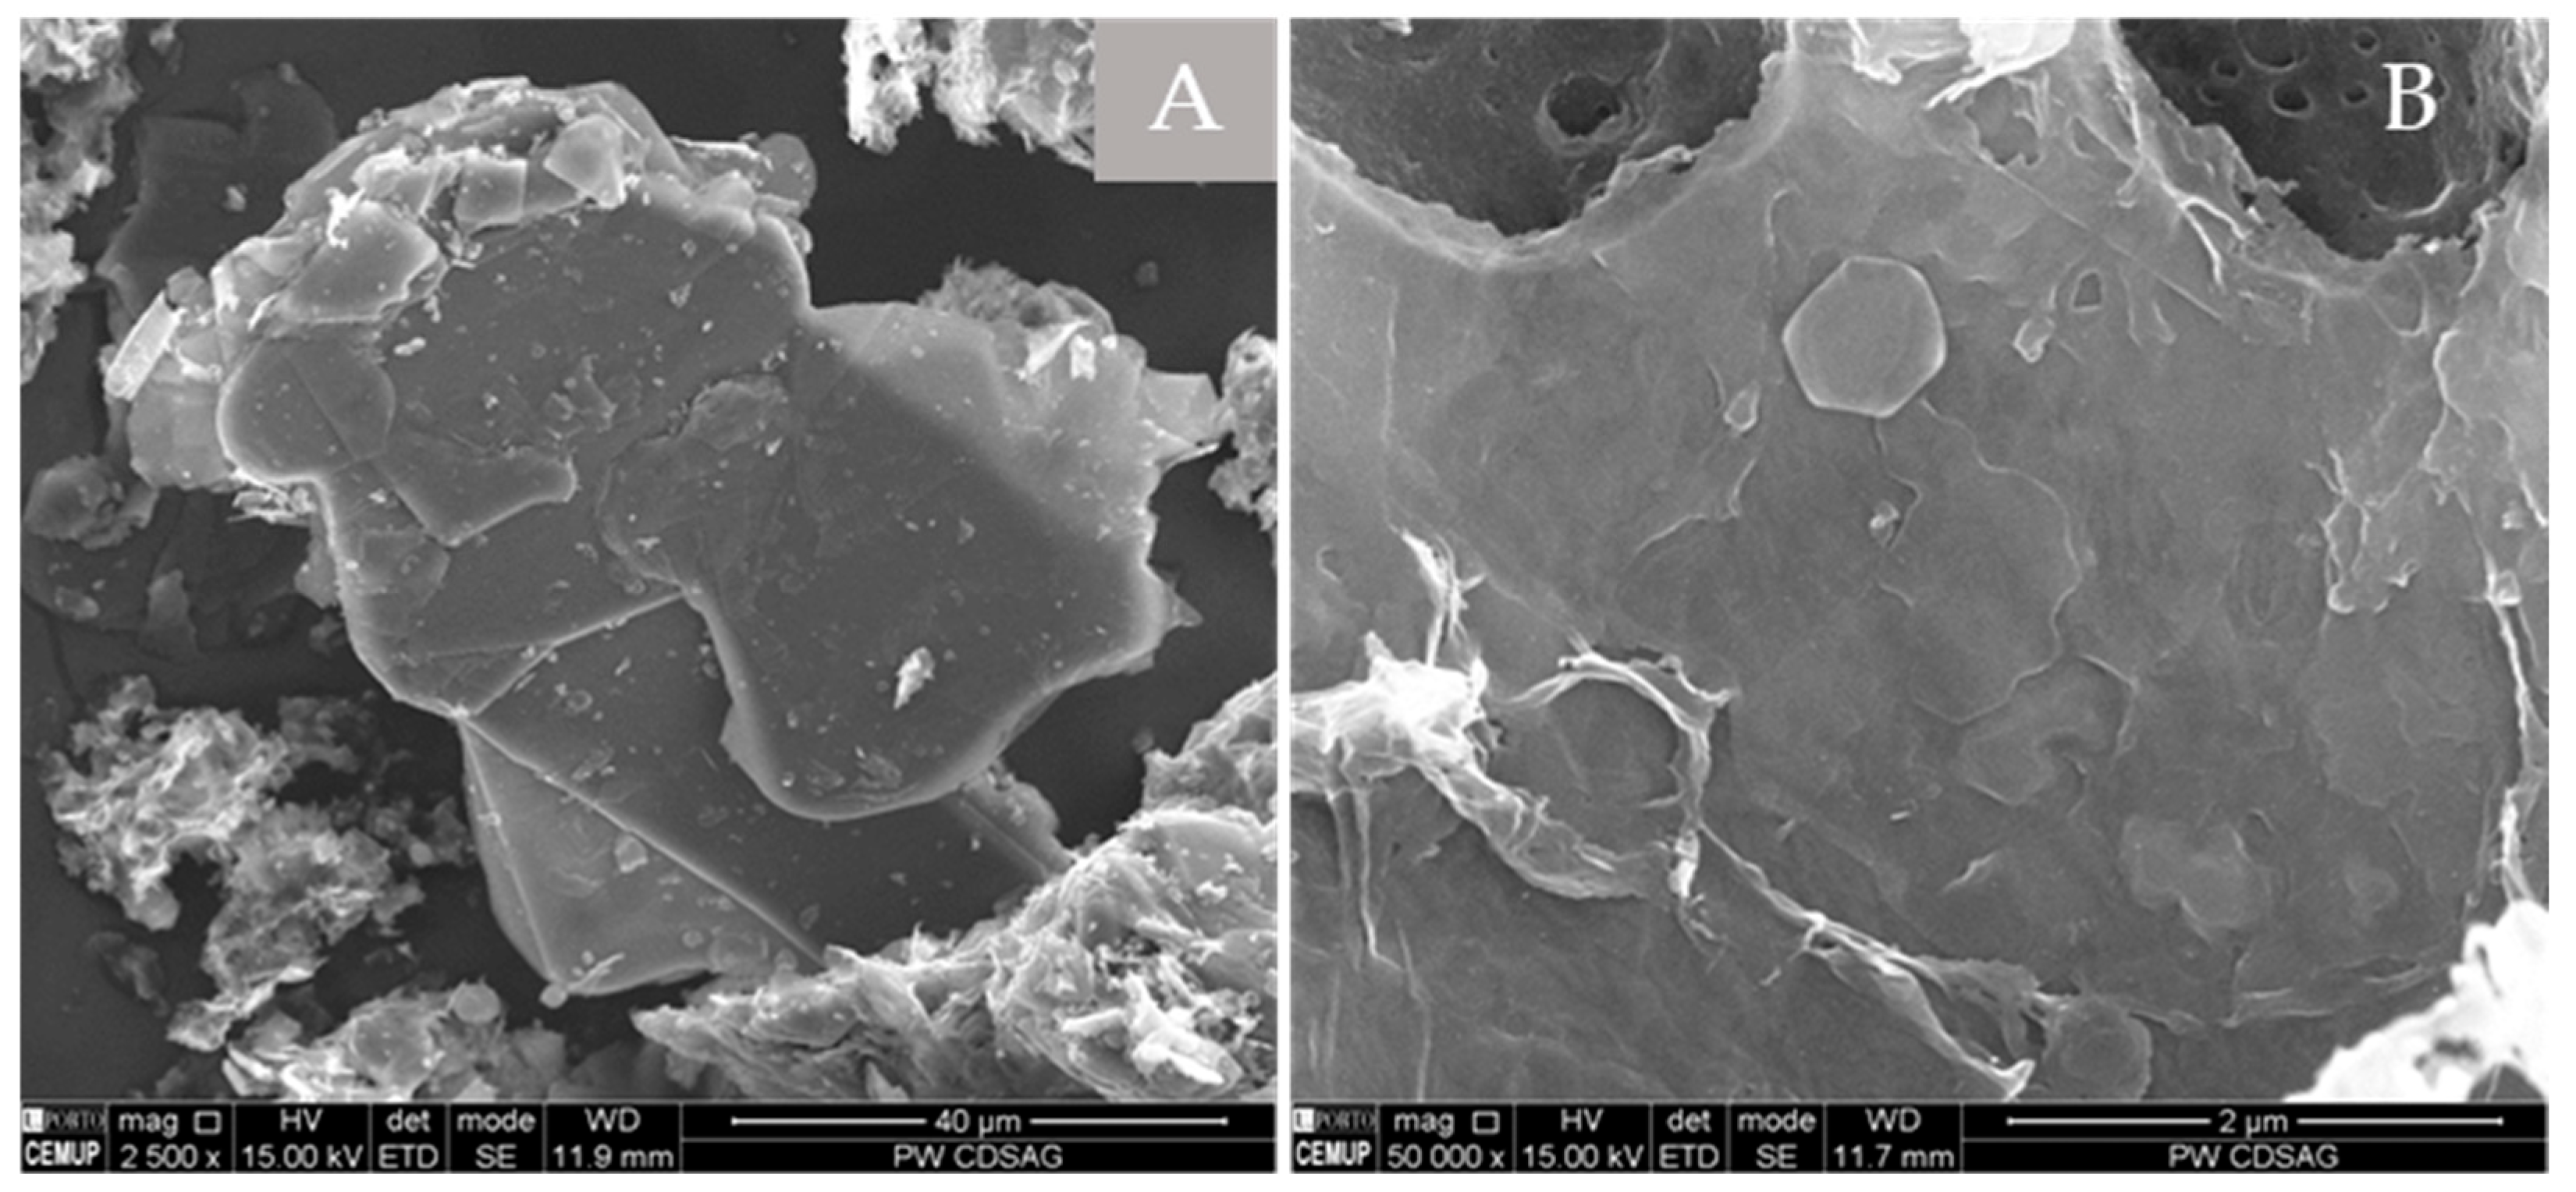
Figure 14.
Examples of imperfect hexagonal graphite crystals as well as char with micromosaic walls found in: (A) CD-SA-G; (B) CD-PL-G (×2500 and ×50000; BSE mode).
Figure 14.
Examples of imperfect hexagonal graphite crystals as well as char with micromosaic walls found in: (A) CD-SA-G; (B) CD-PL-G (×2500 and ×50000; BSE mode).
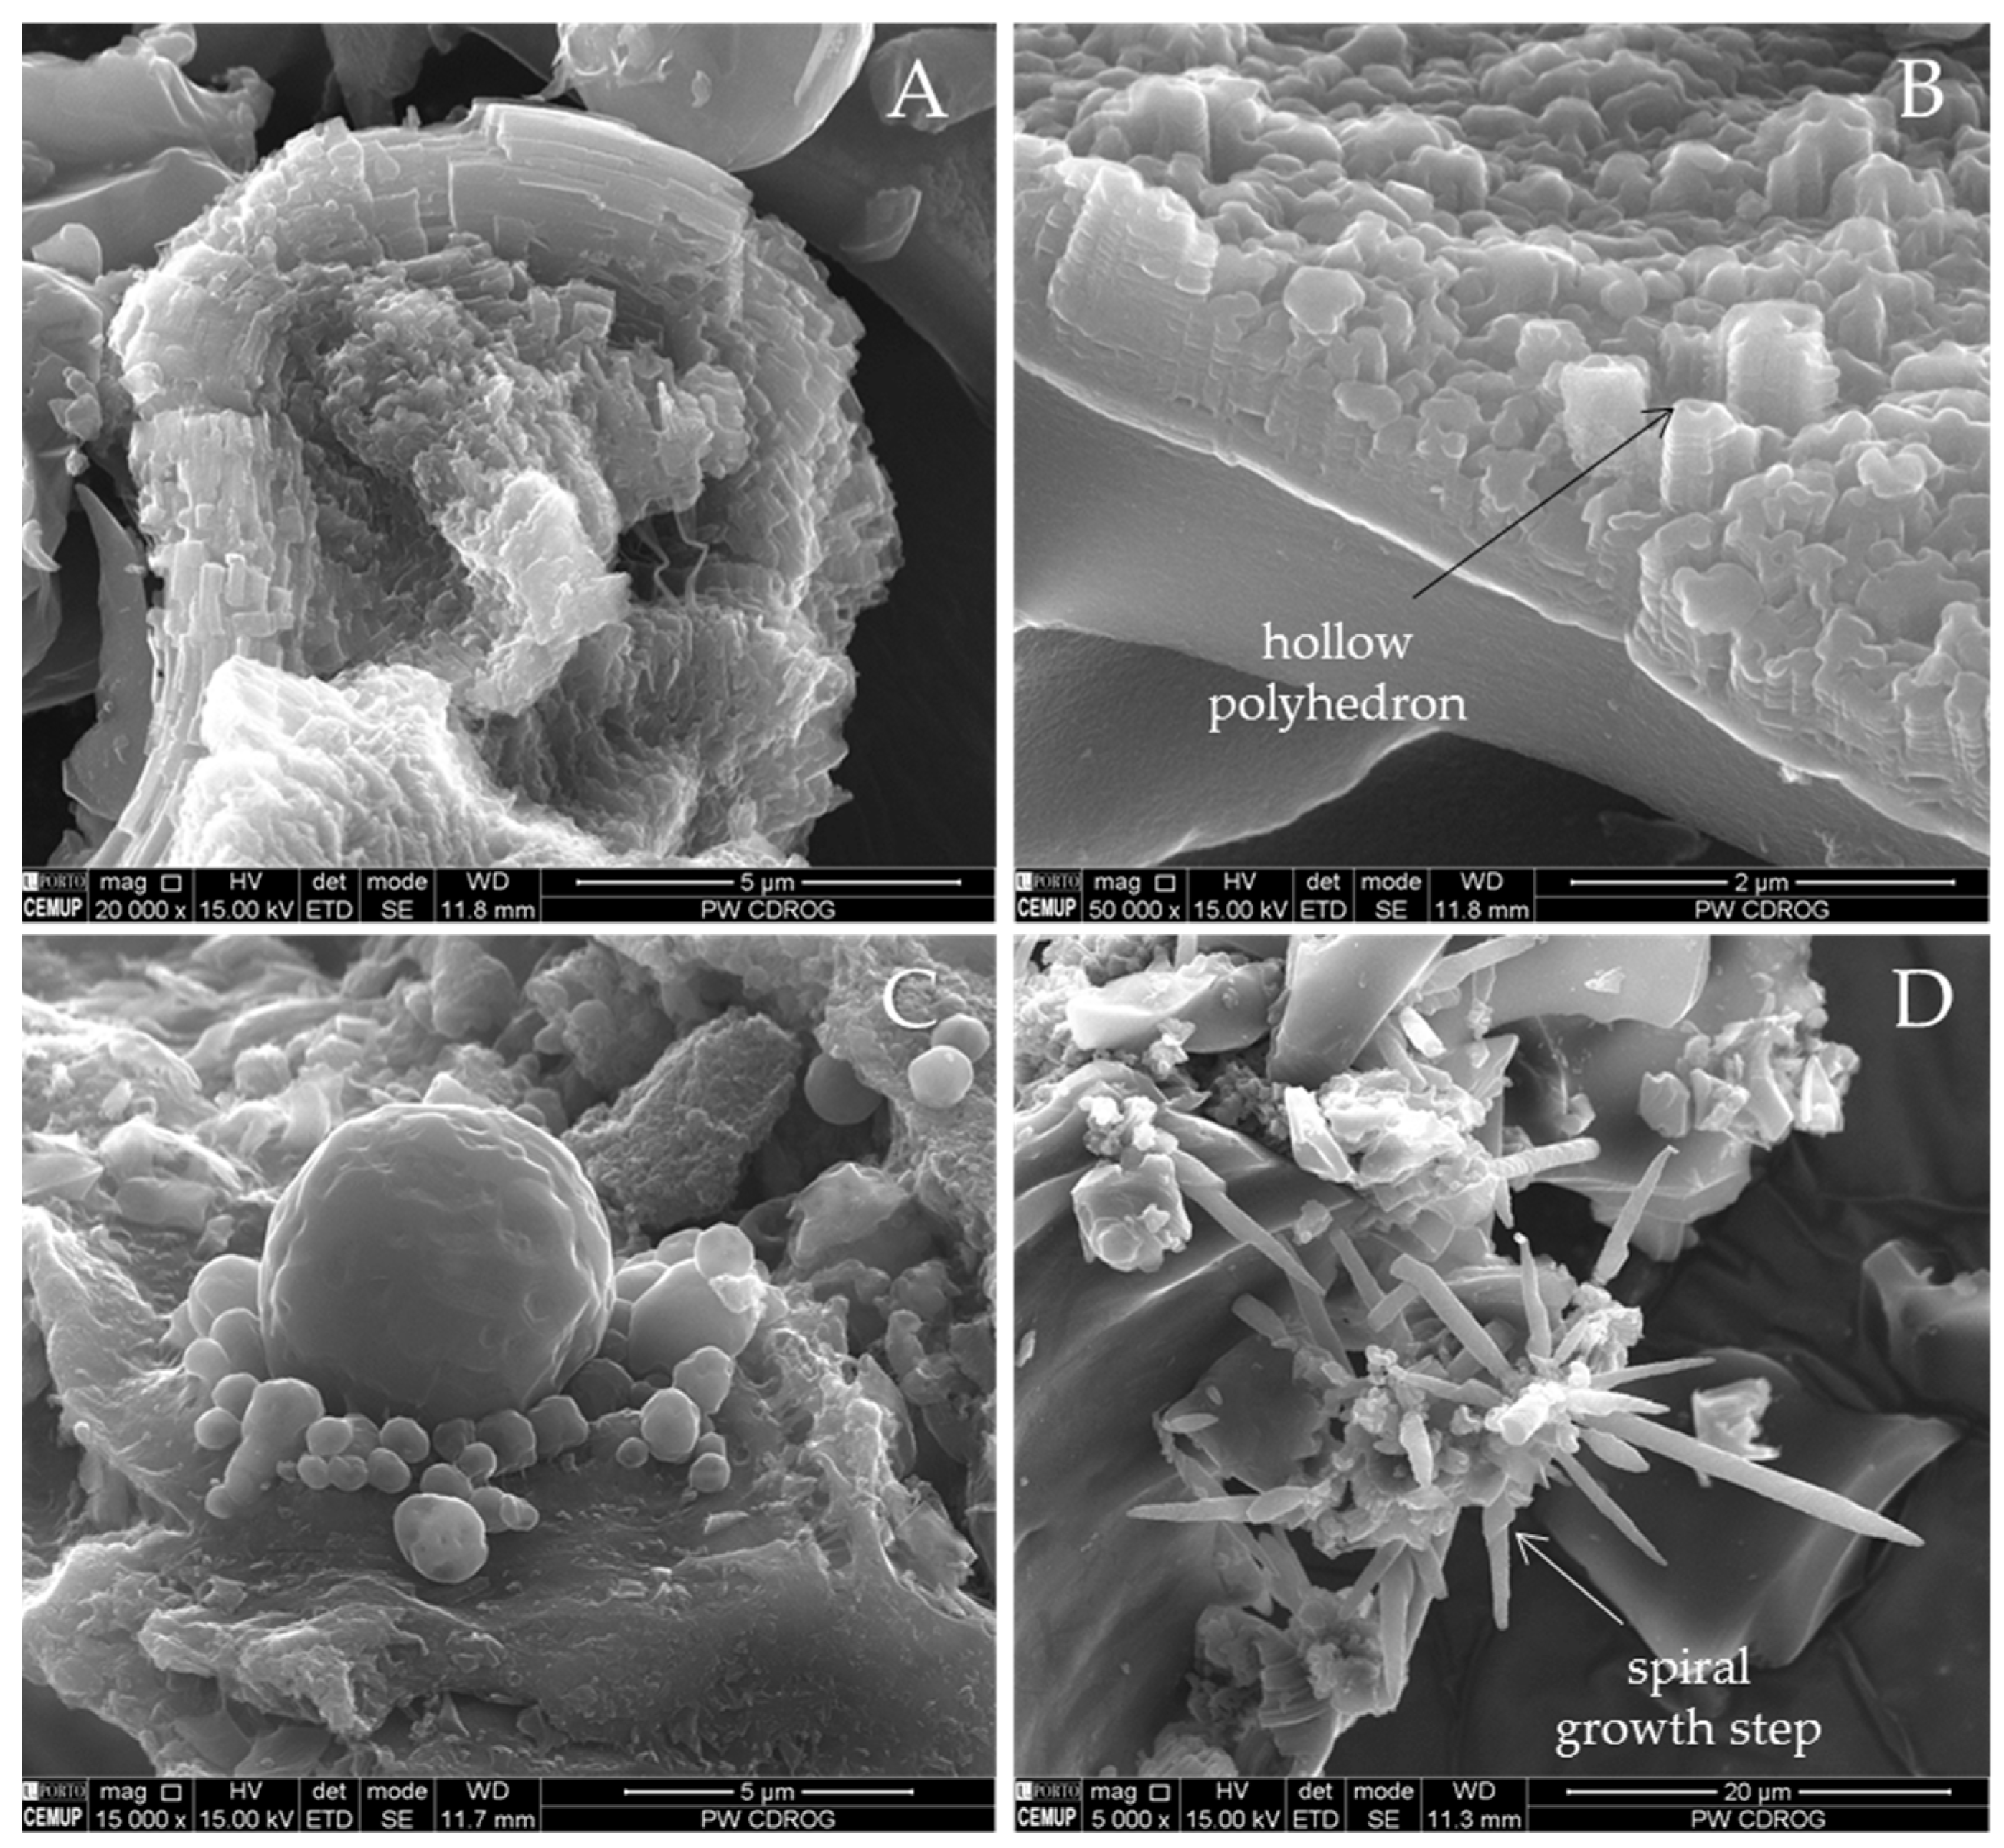
Figure 15.
CD-RO-G: (A) char particles with walls composed by tabular graphitic material (×30,000; SE); (B) char particles covered with columnar graphitic material (×50,000; SE mode); (C) spherical agglomerates (×15,000; SE mode); (D) graphite whiskers (×20,000; SE mode).
Figure 15.
CD-RO-G: (A) char particles with walls composed by tabular graphitic material (×30,000; SE); (B) char particles covered with columnar graphitic material (×50,000; SE mode); (C) spherical agglomerates (×15,000; SE mode); (D) graphite whiskers (×20,000; SE mode).
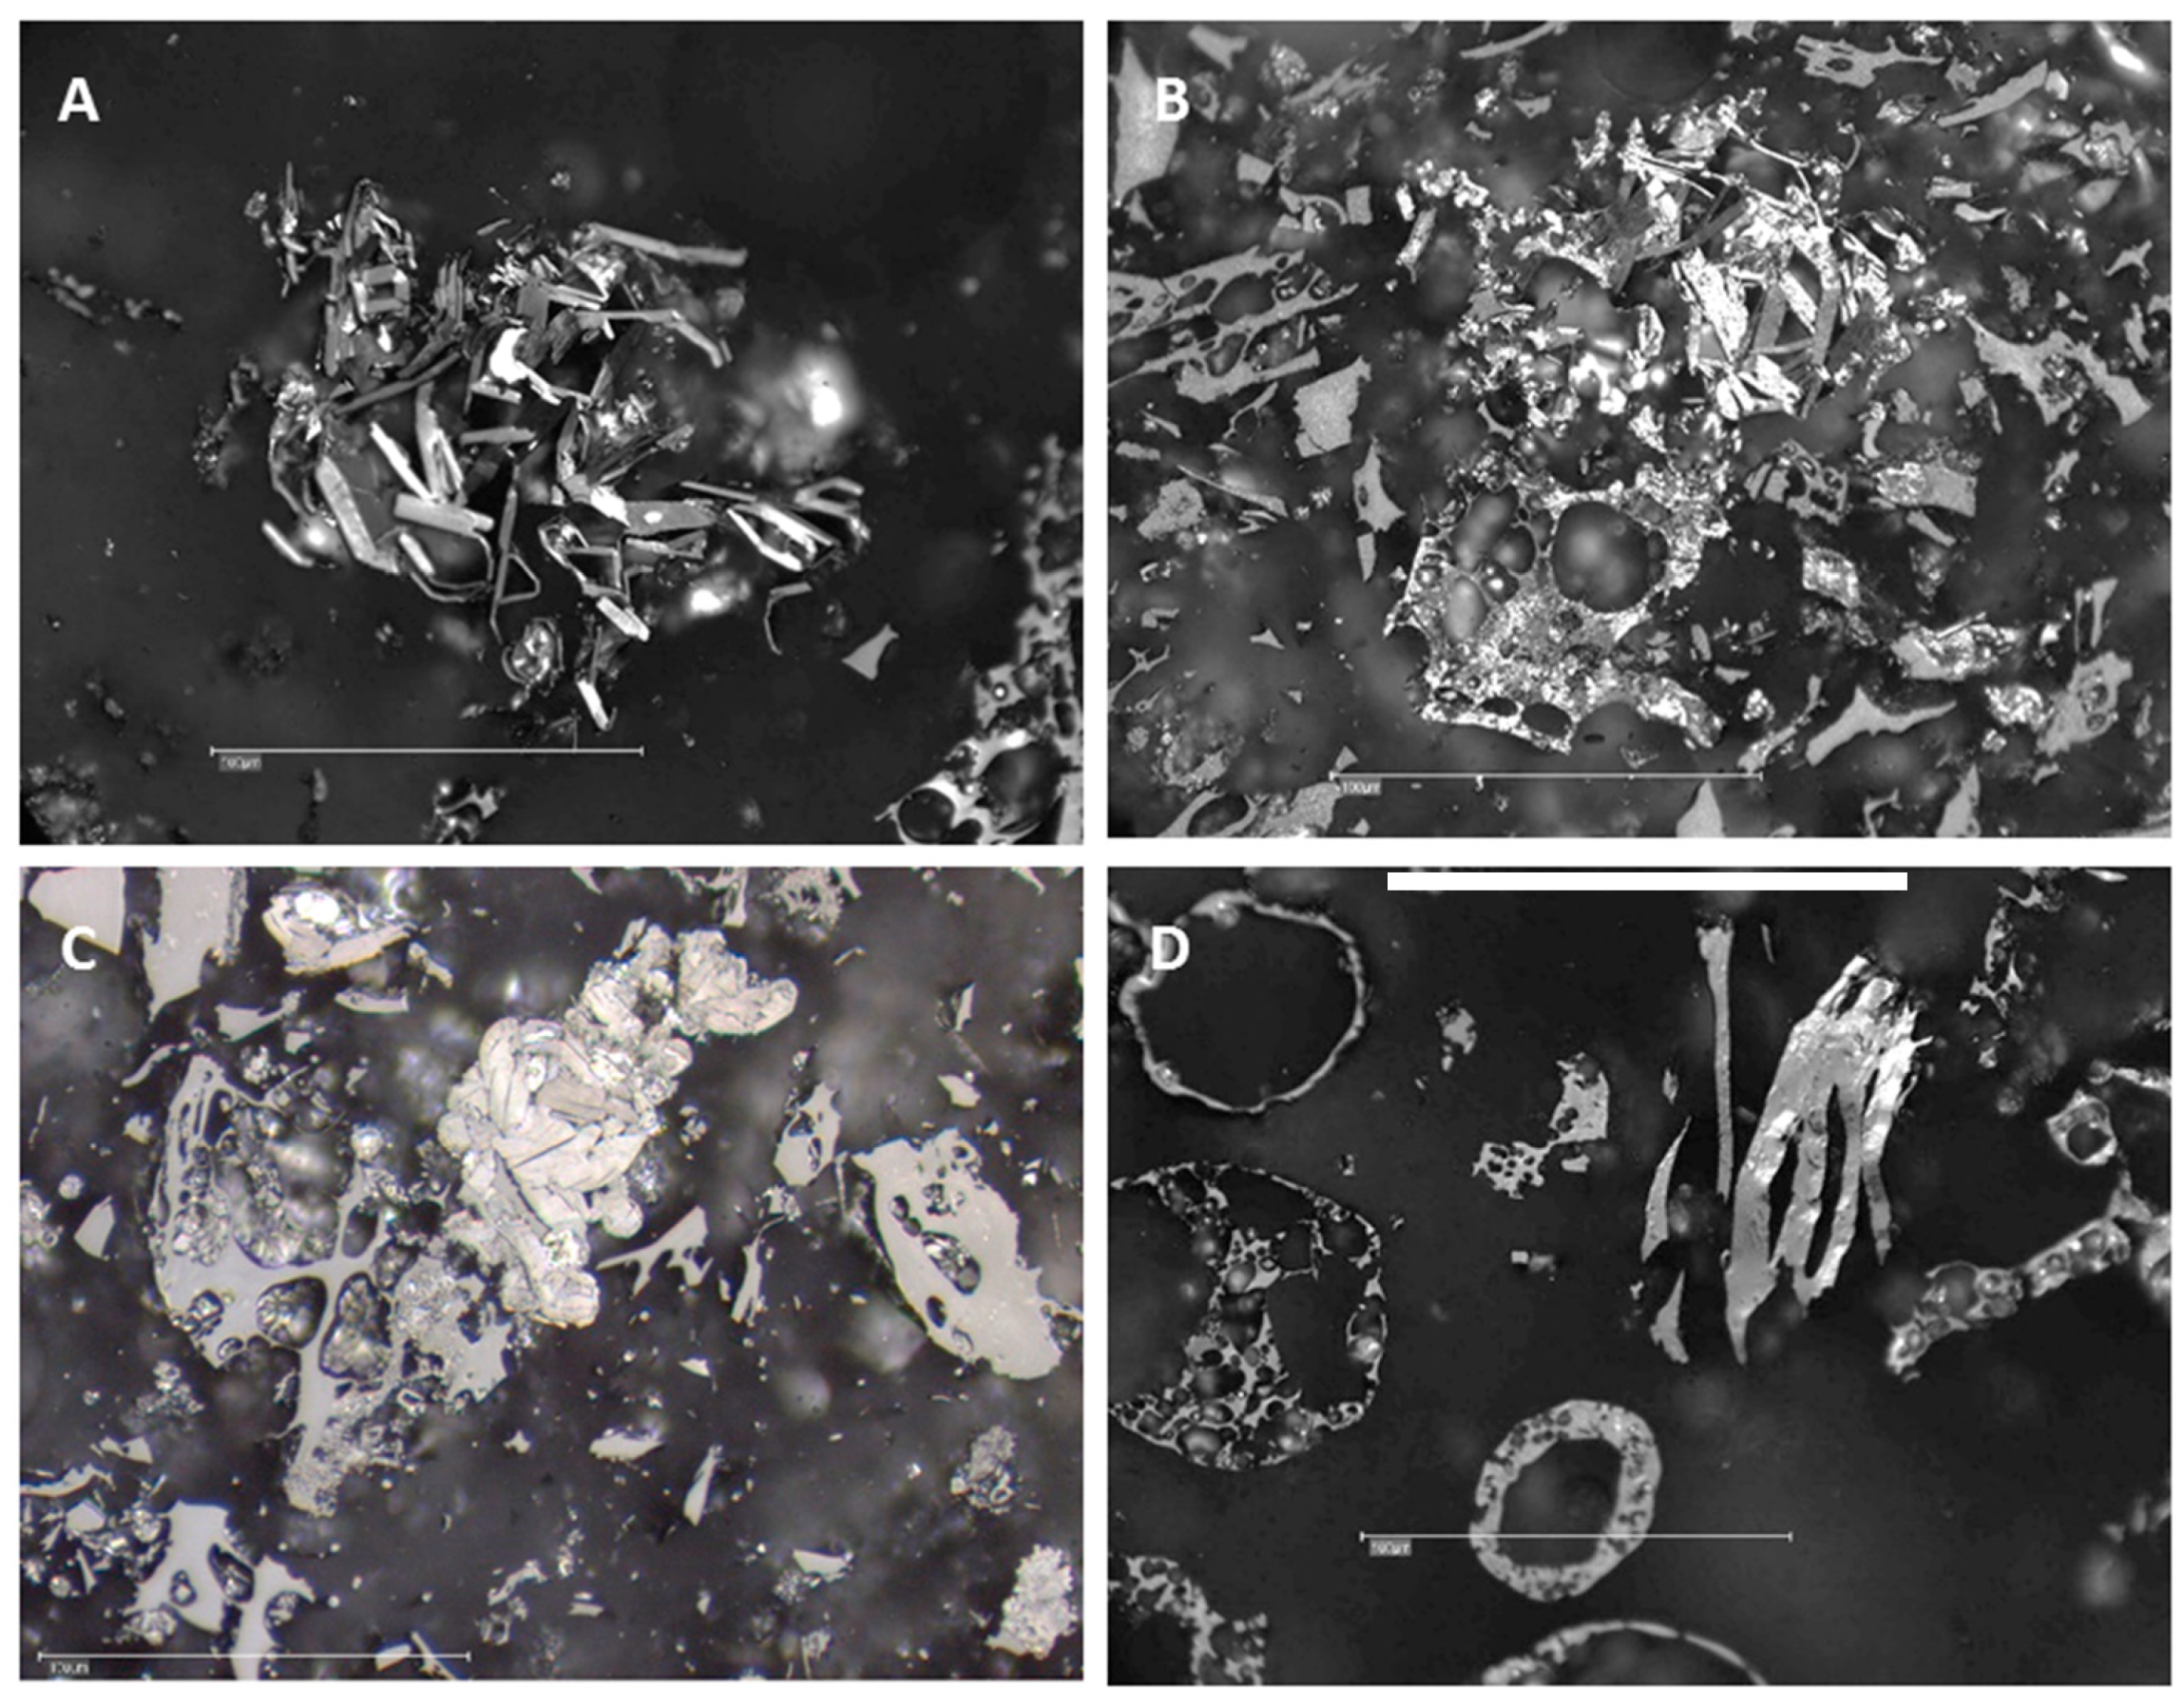
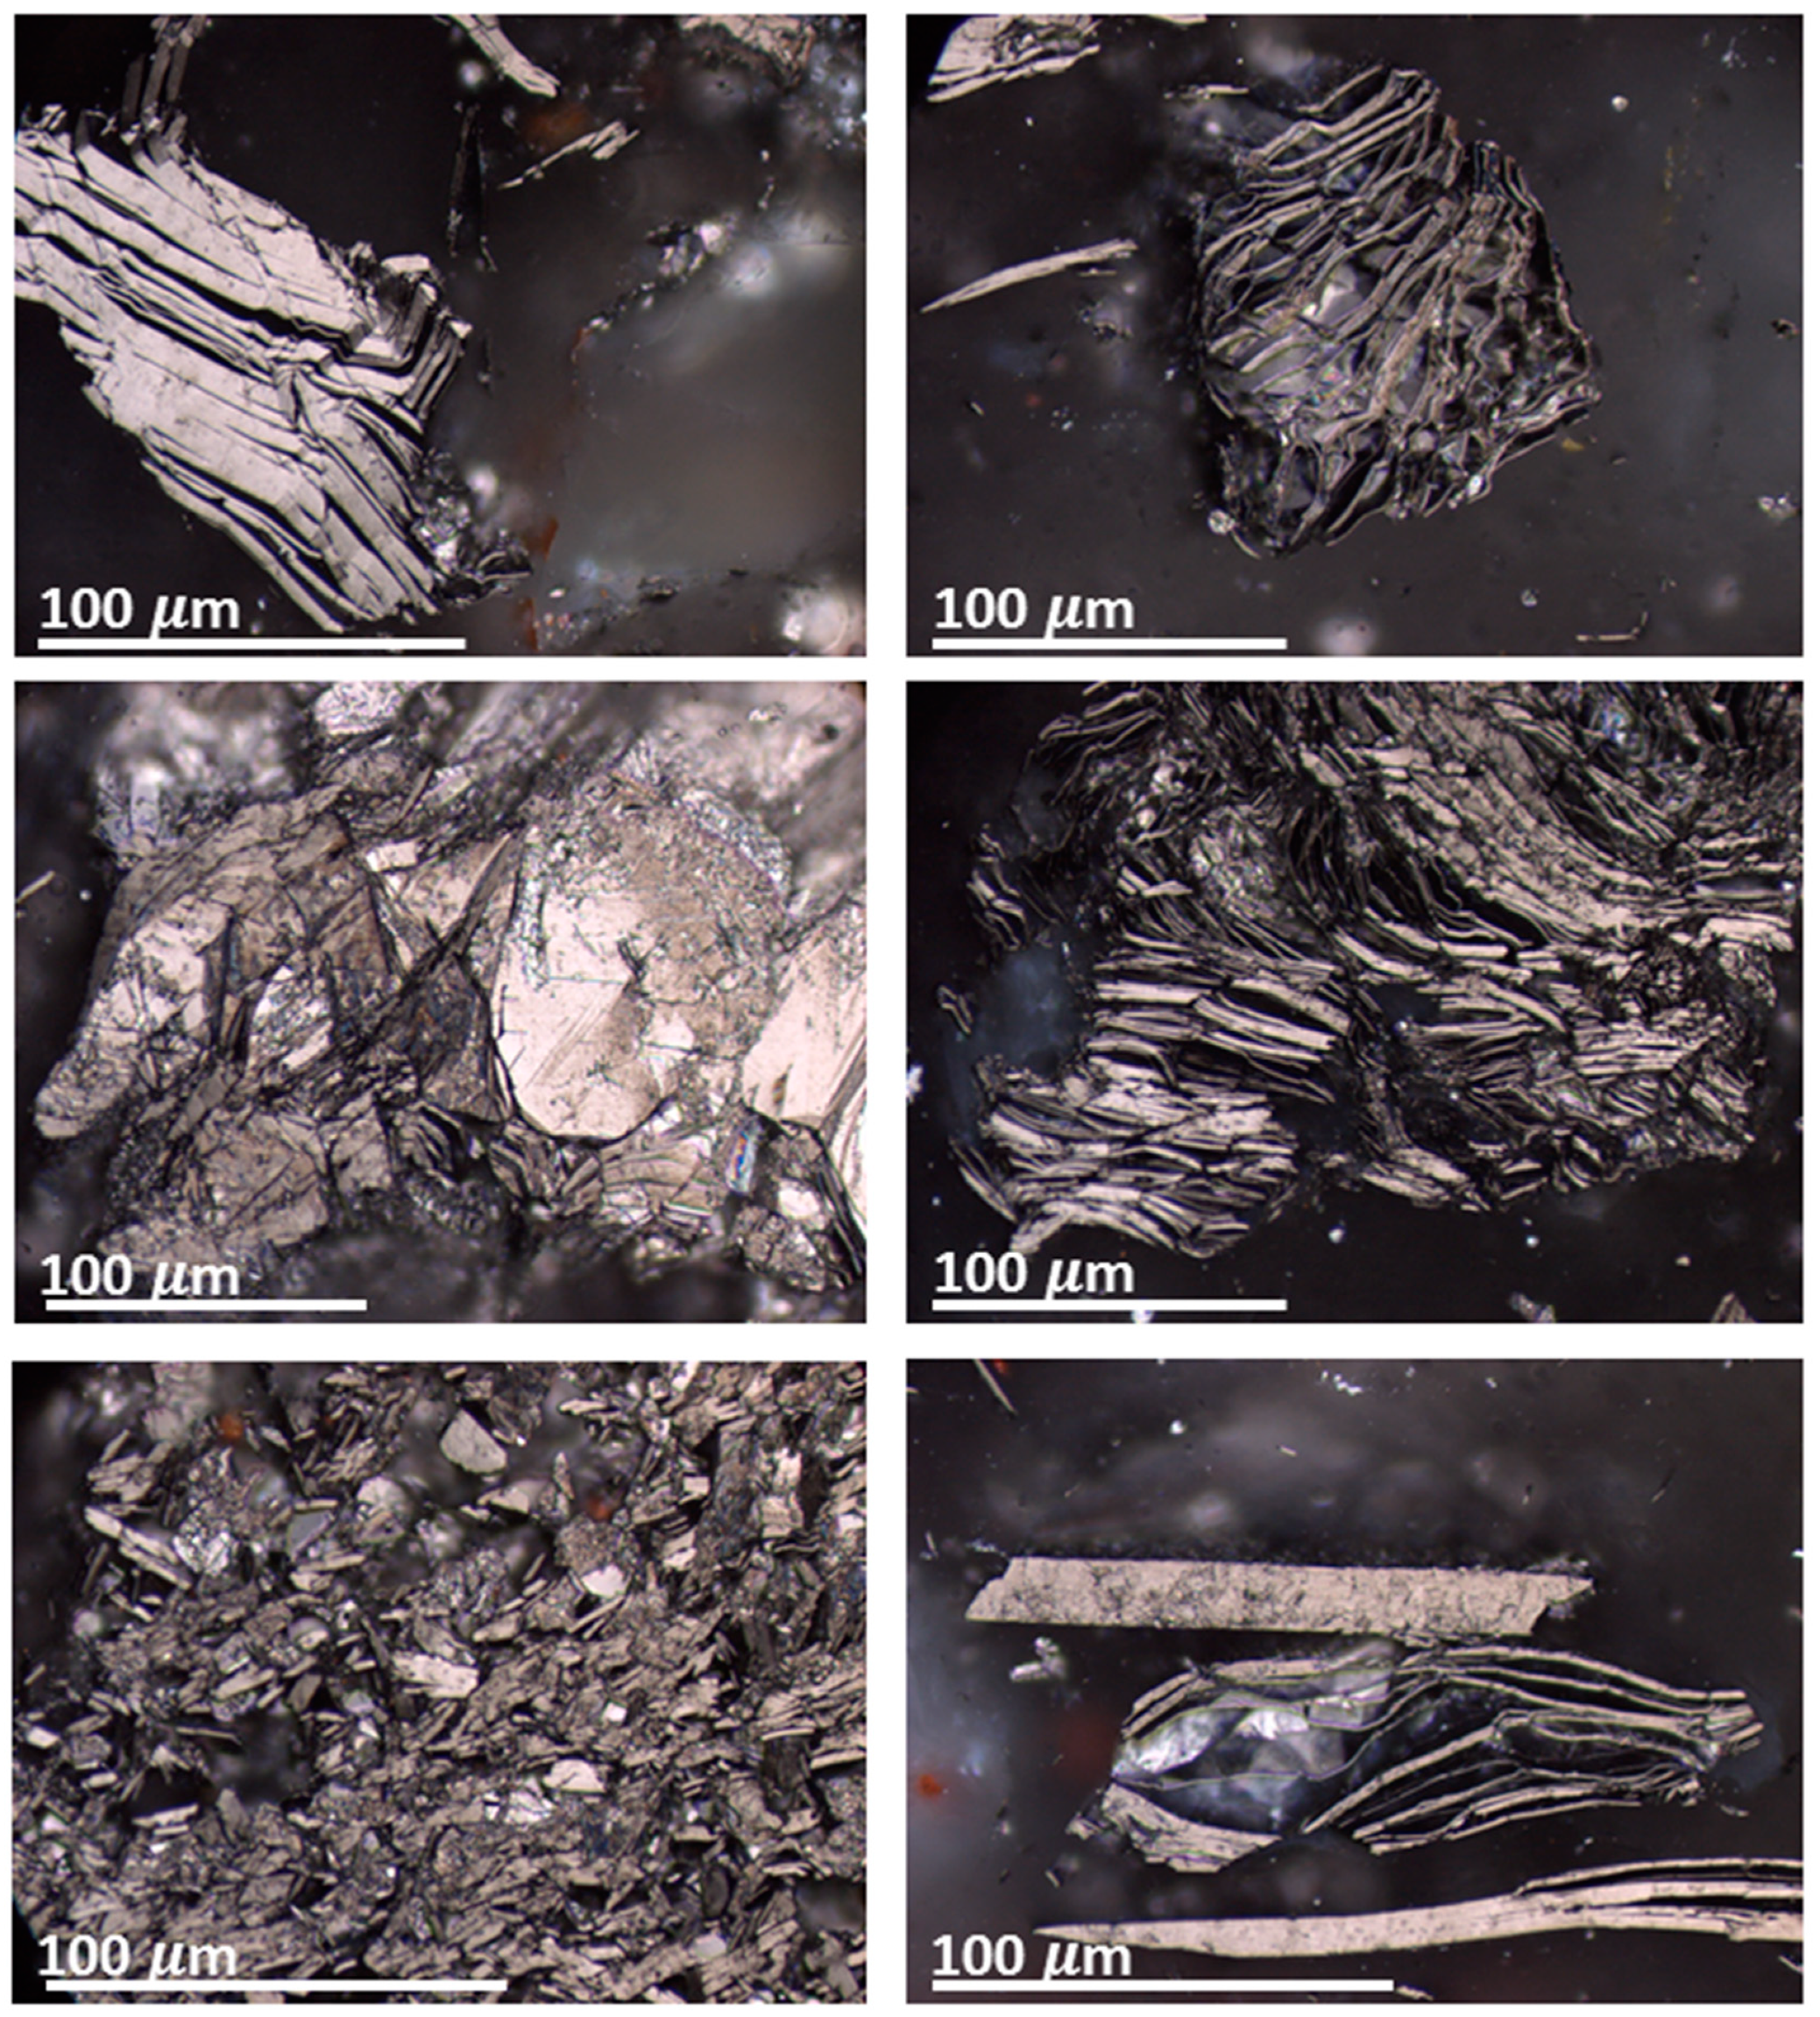
Figure 16.
Particles exhibiting graphite-like texture: (A) CD-SA-G; (B,C) CD-RO-G; (D) rare graphite particles in CD-PT-G (monochrome white light, cross-polars rotated, oil immersion, scale bar = 100 μm).
Figure 16.
Particles exhibiting graphite-like texture: (A) CD-SA-G; (B,C) CD-RO-G; (D) rare graphite particles in CD-PT-G (monochrome white light, cross-polars rotated, oil immersion, scale bar = 100 μm).
Figure 17.
A collection of flake graphite particles found in the natural graphite reference sample.
Figure 17.
A collection of flake graphite particles found in the natural graphite reference sample.
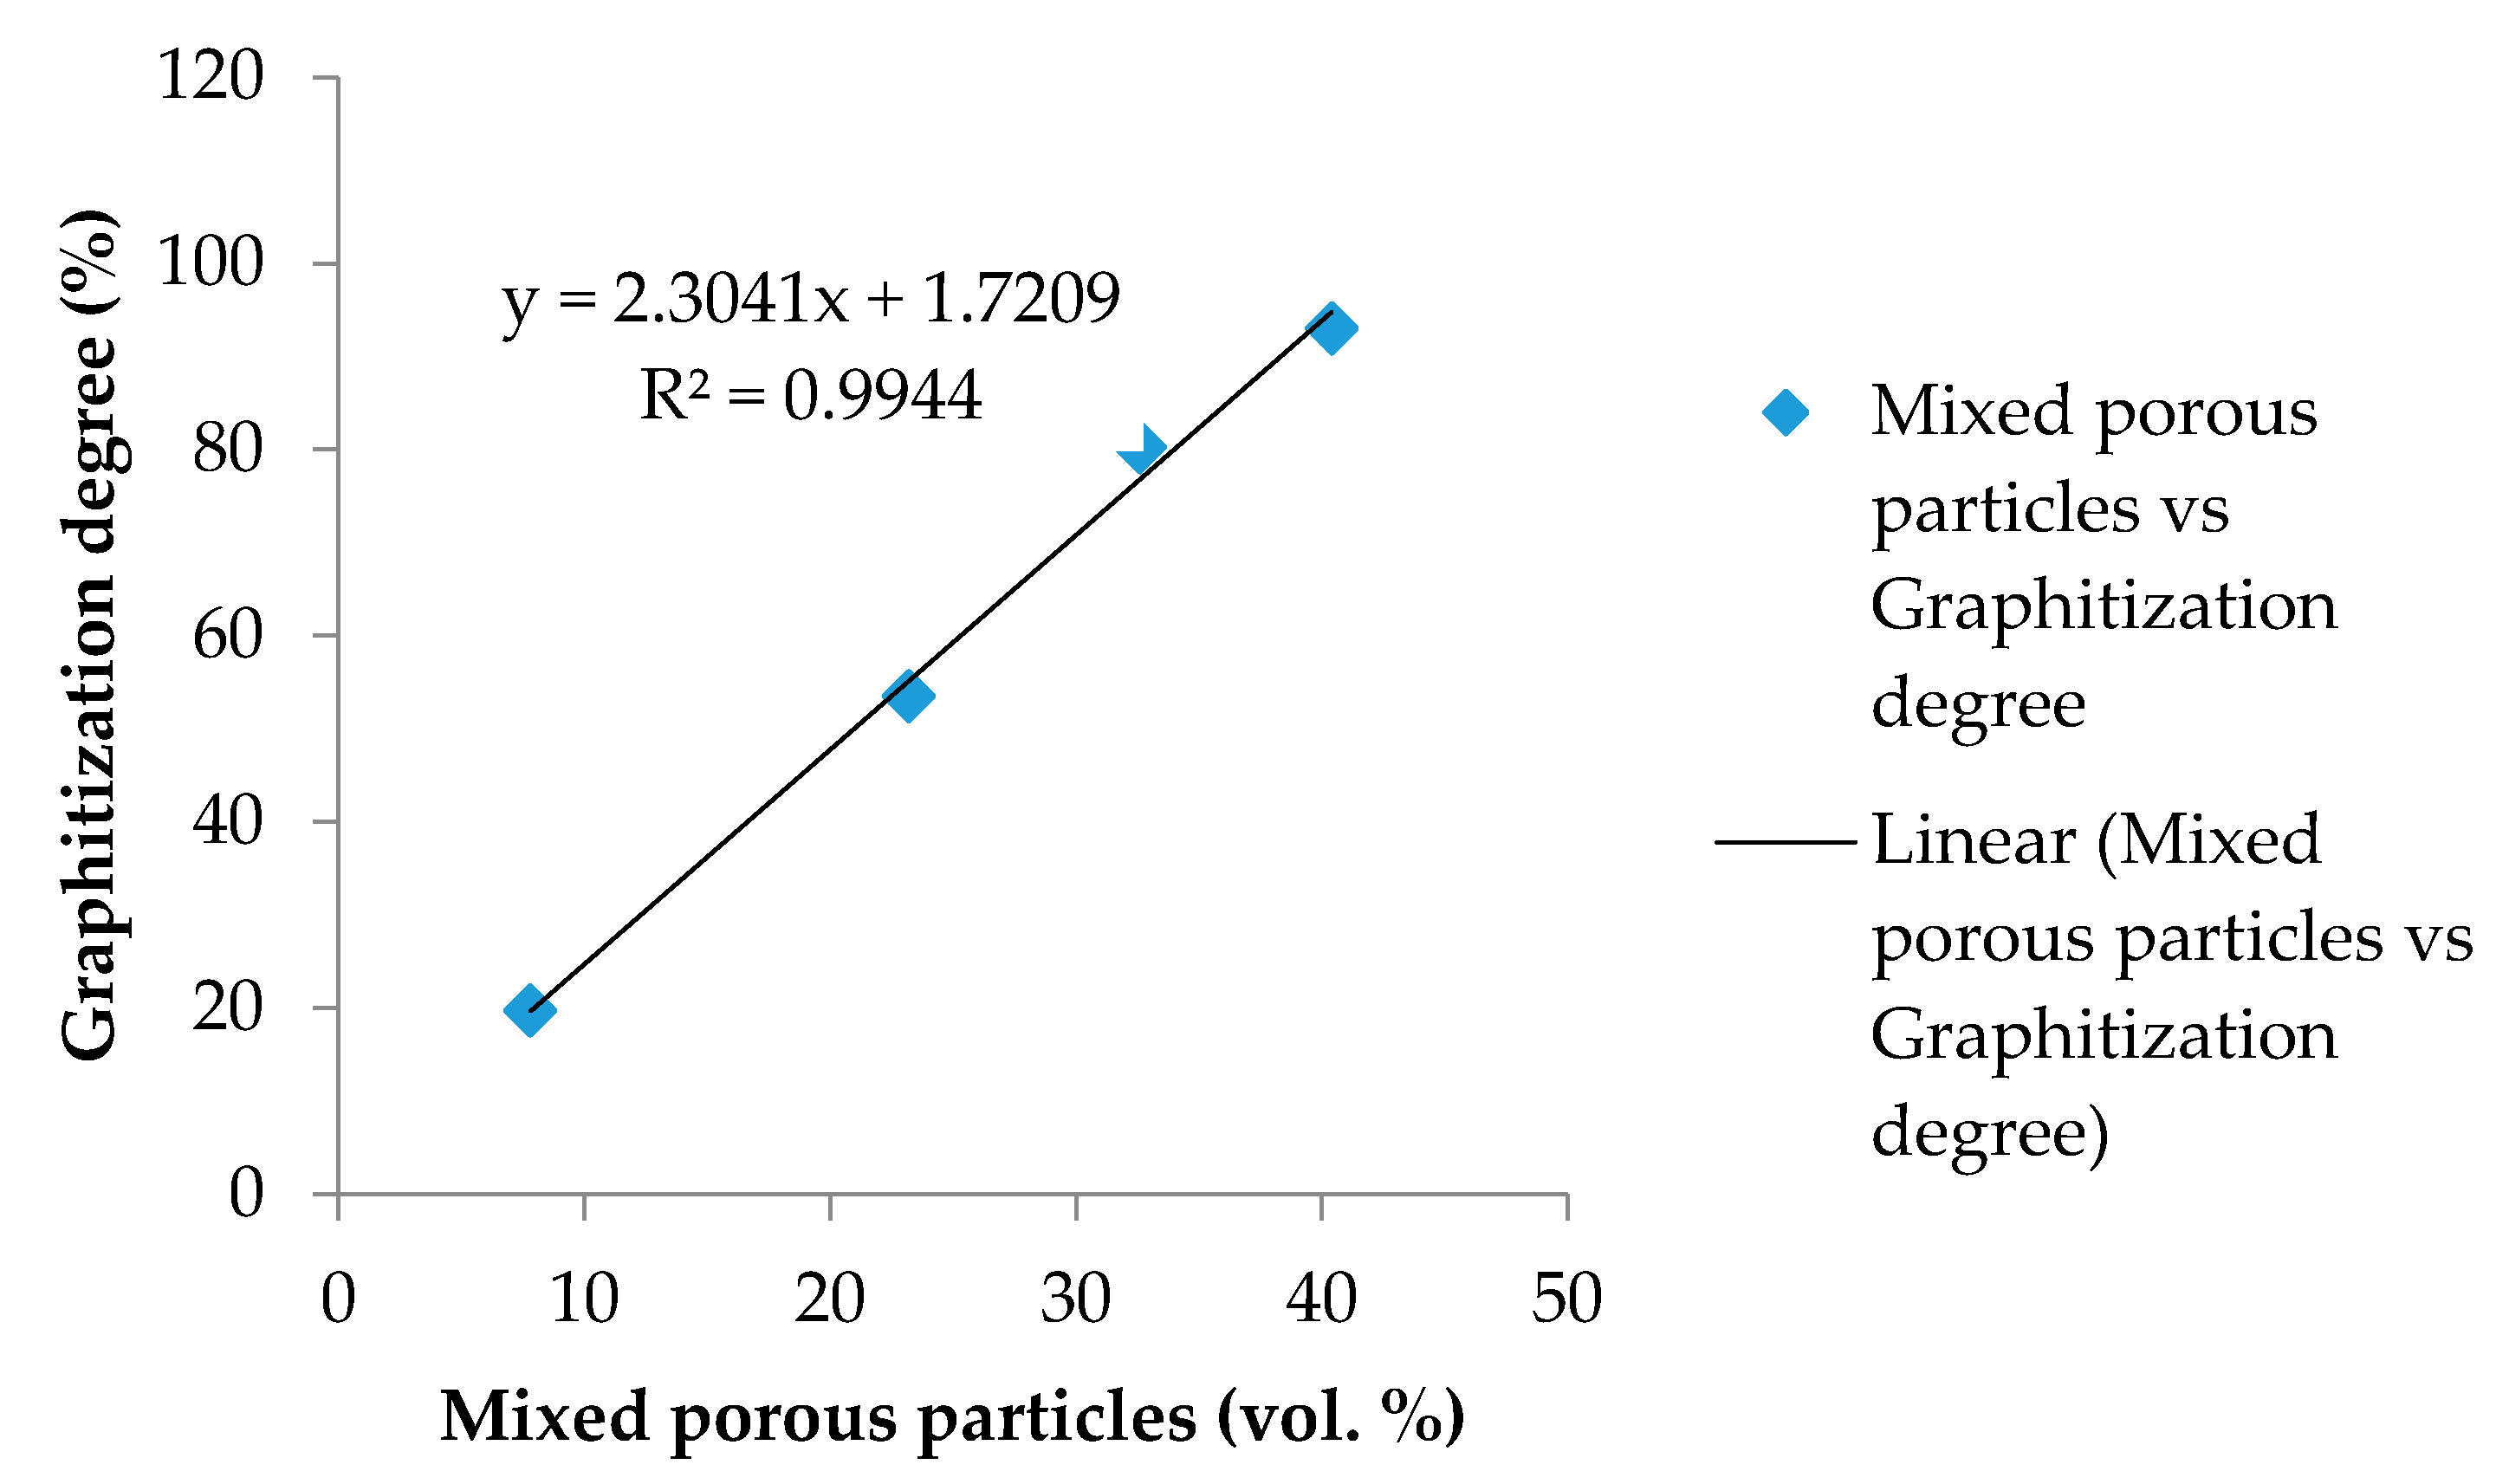
Figure 18.
Effect of mixed porous texture on the degree of graphitization.
Figure 18.
Effect of mixed porous texture on the degree of graphitization.
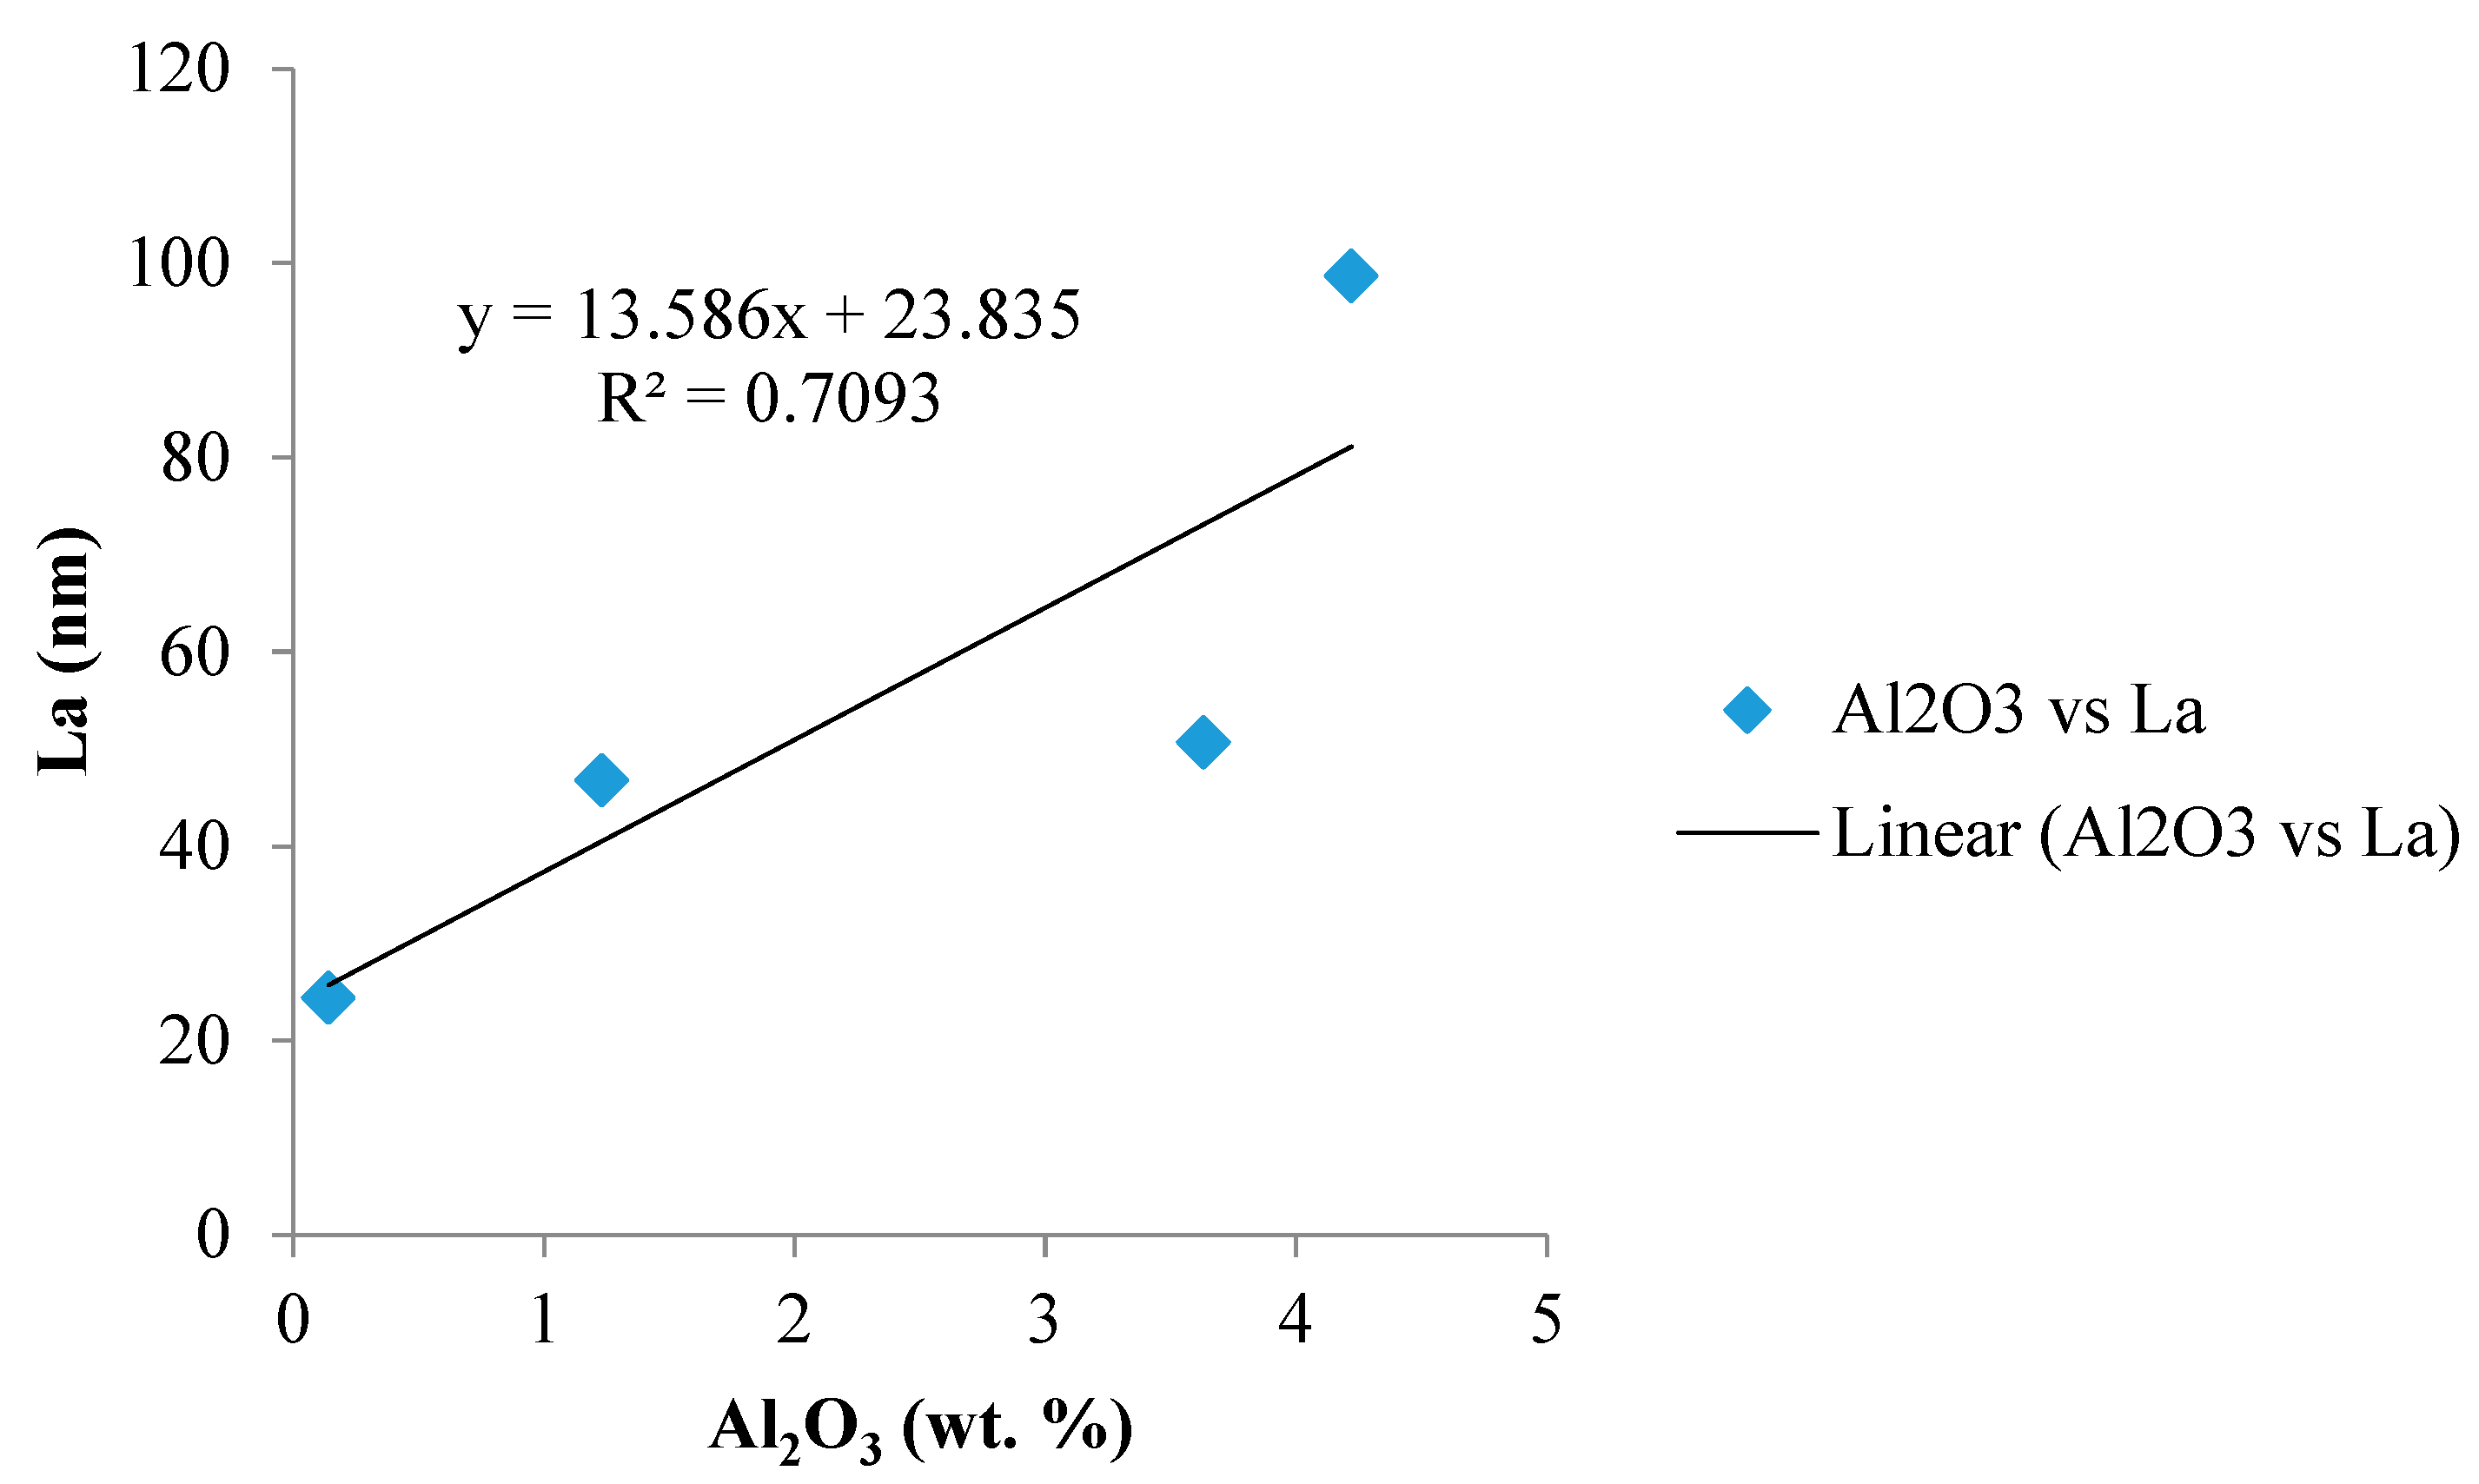
Figure 19.
Catalytic effect of Al2O3 minerals (mainly glass) on the crystallite growth of the basal plane.
Figure 19.
Catalytic effect of Al2O3 minerals (mainly glass) on the crystallite growth of the basal plane.
Table 1.
Sample nomenclature and information (C—Char concentrates, CD—Demineralised char concentrates, CD-G—Graphitized demineralised char concentrates, NG—Natural graphite, PT—Portugal, PL—Poland, SA—South Africa, RO—Romania, CFA—Coal fly ash, CBA—Coal bottom ash, CTPP—Coal thermoelectric power plant).
| Sample Type | Sample Nomenclature | Sample Information |
|---|
| Portugal | | CFA sample from the Pegop CTPP, concentrated via a combination of dry sieving, gravimetric separation, wet sieving, dry impaction, elutriation, and magnetic separation. The fixed carbon of the char concentrate was 75.1 wt. %. |
| Char concentrate | C-PT |
| Demineralised char concentrate | CD-PT |
| Graphitized demineralised char concentrate | CD-PT-G |
| Poland | | CBA sample from the Elektrownia Siersza CTPP, concentrated via a combination of dry sieving, a rising water stream, and magnetic separation. The fixed carbon of the char concentrate was 70.1 wt. %. |
| Char concentrate | C-PL |
| Demineralised char concentrate | CD-PL |
| Graphitized demineralised char concentrate | CD-PL-G |
| South Africa | | CFA sample from an Eskom CTPP, concentrated via a combination of dry sieving, double stage electrostatic separation, and magnetic separation. The fixed carbon of the char concentrate was 74.7 wt. %. |
| Char concentrate | C-SA |
| Demineralised char concentrate | CD-SA |
| Graphitized demineralised char concentrate | CD-SA-G |
| Romania | | CBA sample from the Govora CTPP, concentrated via a combination of dry sieving, gravimetric separation, magnetic separation, and grinding followed by sieving. The fixed carbon of the char concentrate was 59.2 wt. %. |
| Char concentrate | C-RO |
| Demineralised char concentrate | CD-RO |
| Graphitized demineralised char concentrate | CD-RO-G |
| Natural graphite | NG-SA | Flake graphite from the Goedehoop deposit, Limpopo Province, South Africa. |
Table 2.
Characterisation techniques (XRF—X-ray fluorescence, XRD—X-ray diffraction, ss-NMR—Solid-state nuclear magnetic resonance, SEM/EDS—Scanning electron microscopy with energy dispersive spectroscopy).
Table 2.
Characterisation techniques (XRF—X-ray fluorescence, XRD—X-ray diffraction, ss-NMR—Solid-state nuclear magnetic resonance, SEM/EDS—Scanning electron microscopy with energy dispersive spectroscopy).
| Sample Type | Proximate | XRF | XRD (Structural) | Raman Microspectroscopy | ss-NMR | SEM/EDS | Petrography |
|---|
| C | | | × | × | | × | × |
| CD | × | × | | | × | × | |
| CD-G | | | × | × | | × | × |
| NG | | | × | × | | | × |
Table 3.
Summary of earlier published char concentrate characterisation results [
37]. Refer to
Table 1 for sample description (a.d.b—air-dried basis).
Table 3.
Summary of earlier published char concentrate characterisation results [
37]. Refer to
Table 1 for sample description (a.d.b—air-dried basis).
| | Analysis | C-PT | C-PL | C-SA | C-RO |
|---|
| Proximate Analysis (a.d.b wt. %) | Moisture | 0.5 | 3.3 | 3.6 | 7.6 |
| | Ash yield | 22.4 | 22.2 | 17.7 | 13.6 |
| | Volatile matter | 2.0 | 4.4 | 4.0 | 19.6 |
| | Fixed carbon | 75.1 | 70.1 | 74.7 | 59.2 |
| Ultimate Analysis (a.d.b wt. %) | Total sulphur | 0.32 | 0.36 | 0.30 | 1.29 |
| | Carbon content | 74.50 | 70.70 | 75.00 | 67.10 |
| | Hydrogen content | 0.37 | 0.28 | 0.18 | 1.70 |
| | Nitrogen content | 0.98 | 0.90 | 1.11 | 0.56 |
| | Oxygen content | 0.93 | 2.26 | 2.11 | 8.15 |
| Carbon form Analysis (wt. %) | Total carbon | 75.37 | 74.54 | 75.45 | 69.50 |
| | Elemental carbon | 69.83 | 56.30 | 66.58 | 3.30 |
| | Organic carbon | 4.12 | 14.01 | 7.18 | 63.10 |
| | Inorganic carbon | 1.42 | 4.23 | 1.69 | 3.10 |
| XRD Analysis (wt. %) | Quartz (SiO2) | 2.4 | 1.1 | 2.0 | 0.4 |
| | Mullite (3Al2O32SiO2/2Al2O3SiO2) | 5.6 | 5.1 | 6.6 | 0.9 |
| | Gypsum (CaSO4·2H2O) | 0.0 | 0.0 | 0.1 | 0.1 |
| | Calcite (CaCO3) | 0.0 | 0.6 | 0.0 | 0.5 |
| | Bassanite (CaSO4·0.5H2O/2CaSO4·H2O) | 0.0 | 0.0 | 0.0 | 0.4 |
| | Amorphous | 92.0 | 93.2 | 91.4 | 97.7 |
| XRF Analysis (wt. %) | SiO2 | 16.12 | 10.90 | 23.93 | 4.11 |
| | Al2O3 | 7.13 | 6.12 | 11.21 | 1.88 |
| | Fe2O3 | 1.03 | 0.77 | 0.82 | 1.19 |
| | CaO | 0.32 | 1.47 | 0.79 | 3.11 |
| | MgO | 0.17 | 1.00 | 0.17 | 0.36 |
| | Na2O | 0.18 | 0.30 | 0.04 | <0.01 |
| | K2O | 0.45 | 0.51 | 0.25 | 0.16 |
| | SO3 | 0.19 | 0.15 | 0.35 | 0.72 |
| | MnO | <0.01 | <0.01 | <0.01 | <0.01 |
| | TiO2 | 0.21 | 0.23 | 0.56 | 0.08 |
| | P2O5 | 0.04 | 0.04 | 0.14 | 0.02 |
| | Cr2O3 | <0.01 | <0.01 | <0.01 | <0.01 |
| | Loss on Ignition | 73.43 | 77.64 | 61.51 | 87.64 |
Table 4.
XRD crystallite size results (d002—mean interlayer spacing, L—crystallite size, N—average number of aromatic layers, GD—graphitization degree).
Table 4.
XRD crystallite size results (d002—mean interlayer spacing, L—crystallite size, N—average number of aromatic layers, GD—graphitization degree).
| Sample Nomenclature | d002 (nm) | La (nm) | Lc (nm) | <N> | GD (%) |
|---|
| C-PT | 0.3542 | n.d | 1.9 | 5 | - |
| C-PL | 0.3673 | n.d | 1.3 | 4 | - |
| C-SA | 0.3595 | n.d | 1.4 | 4 | - |
| C-RO | 0.3773 | n.d | 1.2 | 3 | - |
| CD-PT-G | 0.3423 | 24.4 | 9.3 | 27 | 19.77 |
| CD-PL-G | 0.3394 | 46.8 | 10.7 | 32 | 53.49 |
| CD-SA-G | 0.3360 | 98.7 | 44.6 | 133 | 93.02 |
| CD-RO-G | 0.3371 | 50.7 | 22.2 | 66 | 80.23 |
| NG-SA | 0.3347 | 213.2 | 33.9 | 101 | 108.14 |
Table 5.
Raman microspectroscopy curve fitting results (FWHM—Full width at half maximum, It—Intensity ratio).
Table 5.
Raman microspectroscopy curve fitting results (FWHM—Full width at half maximum, It—Intensity ratio).
| Char Concentrates |
| Calculated Curve Fitting Parameters | TYPE A | TYPE B | TYPE C |
| G-D1 distance (cm−1) | 232.50 ± 4.52 | 222.98 ± 3.47 | 214.07 ± 3.94 |
| 1.39 ± 0.10 | 1.54 ± 0.08 | 1.62 ± 0.12 |
| 1.62 ± 0.10 | 1.31 ± 0.08 | 1.27 ± 0.15 |
| RA1 | 0.58 ± 0.02 | 0.56 ± 0.02 | 0.57 ± 0.03 |
| RA2 | 1.41 ± 0.11 | 1.29 ± 0.08 | 1.31 ± 0.13 |
| Graphitized Demineralised Char Concentrates |
| Calculated Curve Fitting Parameters | TYPE A | TYPE B | TYPE C |
| 0.57 ± 0.01 | 0.53 ± 0.02 | 0.46 ± 0.01 |
| | TYPE D | TYPE E | TYPE F |
| 0.42 ± 0.01 | 0.02 | 0.25 ± 0.00 |
| Natural Graphite Reference Sample |
| Calculated Curve Fitting Parameters | NG-SA | | |
| 0.65 | | |
Table 6.
Quantitative morphology results of the char concentrates (ICCP—International Committee for Coal and Organic Petrology).
Table 6.
Quantitative morphology results of the char concentrates (ICCP—International Committee for Coal and Organic Petrology).
| | Petrography (vol. %) | C-PT | C-PL | C-SA | C-RO |
|---|
| Hower Classification [57] | Glass | 5.0 | 8.2 | 5.8 | 4.2 |
| | Anisotropic char | 83.3 | 57.8 | 43.2 | 0.6 |
| | Isotropic char | 9.5 | 24.0 | 15.6 | 46.4 |
| | Inertinitic char | 2.2 | 9.8 | 35.0 | 3.6 |
| | Unreacted/partially burned coal | 0.0 | 0.2 | 0.4 | 45.2 |
| ICCP Classification [58] | Tenuisphere | 17.9 | 0.0 | 0.0 | 0.2 |
| | Crassisphere | 34.6 | 7.1 | 0.0 | 0.0 |
| | Tenuinetwork | 14.3 | 26.0 | 2.9 | 8.5 |
| | Crassinetwork | 18.4 | 31.3 | 23.3 | 24.2 |
| | Mixed porous | 7.8 | 23.2 | 40.4 | 32.6 |
| | Mixed dense | 0.0 | 2.8 | 22.4 | 11.7 |
| | Inertoid | 0.5 | 0.6 | 5.5 | 2.7 |
| | Fusinoid/solid | 1.7 | 1.5 | 3.9 | 14.9 |
| | Mineroid | 4.8 | 7.5 | 1.6 | 5.2 |
Table 7.
Proximate and XRF results for the demineralised char concentrates.
Table 7.
Proximate and XRF results for the demineralised char concentrates.
| | Analysis | CD-PT | CD-PL | CD-SA | CD-RO |
|---|
| Proximate Analysis (a.d.b wt. %) | Moisture | 1.3 | 4.2 | 4.4 | 6.6 |
| | Ash yield | 0.5 | 2.6 | 6.7 | 7.3 |
| | Volatile matter | 1.9 | 12 | 4.5 | 24.7 |
| | Fixed carbon | 96.3 | 81.2 | 84.5 | 61.5 |
| XRF Analysis (wt. %) | SiO2 | 0.12 | 0.61 | 0.74 | <0.01 |
| | Al2O3 | 0.14 | 1.23 | 4.22 | 3.63 |
| | Fe2O3 | 0.01 | 0.38 | 0.24 | 0.41 |
| | CaO | 0.03 | 0.19 | 0.12 | 1.23 |
| | MgO | <0.01 | <0.01 | <0.01 | 0.04 |
| | Na2O | <0.01 | 0.01 | <0.01 | <0.01 |
| | K2O | <0.01 | <0.01 | <0.01 | 0.02 |
| | SO3 | <0.002 | 0.06 | 0.05 | 0.42 |
| | MnO | <0.01 | <0.01 | <0.01 | <0.01 |
| | TiO2 | 0.02 | 0.13 | 0.39 | <0.01 |
| | P2O5 | <0.01 | <0.01 | 0.05 | 0.03 |
| | Cr2O3 | <0.01 | <0.01 | <0.01 | <0.01 |
| | Loss on Ignition | 99.47 | 96.91 | 93.97 | 93.81 |

 ,
, 


