The Impact of Coal Fly Ash Purification on Its Antibacterial Activity


1
Department of Chemistry, Faculty of Science, King Saud University, Riyadh 11495, Saudi Arabia
2
King Abdullah Institute for Nanotechnology, King Saud University, Riyadh 11451, Saudi Arabia
*
Author to whom correspondence should be addressed.
Minerals 2020, 10(11), 1002; https://0-doi-org.brum.beds.ac.uk/10.3390/min10111002
Submission received: 12 October 2020
/
Revised: 3 November 2020
/
Accepted: 6 November 2020
/
Published: 11 November 2020
(This article belongs to the Special Issue Clay Minerals and Waste Fly Ash Ceramics)
Abstract
:Fly ash (FA) is produced from coal power plants’ combustion. FA is used in the concrete industry, as an ingredient in the brick and paving. Knowledge of the chemical composition and toxic metal content in FA is essential for evaluating its environmental risks. This study aimed to assess FA purification effect on its antibacterial activity against Escherichia coli and Bacillus cereus, by calculating percent bacterial reduction. Moreover, centrifugation time effect on the purification process was evaluated. Chemical composition and properties of purified FA were determined and compared with raw FA, using Fourier transform Infrared (FTIR); X-ray diffraction (XRD); X-ray photoelectron spectroscopy (XPS); energy-dispersive X-ray (EDXA); carbon, hydrogen, nitrogen, and sulfur (CHNS) elemental analysis; moisture content; and loss-of-ignition. Particle size was predicted by using dynamic laser scattering, BET and scanning electron microscopy (SEM). The CHNS results showed that purified FA contains the highest carbon content (88.9%), as compared to raw FA (82.1%). The particle size distribution (PSD) of FA microspheres ranges from 48.53 ± 17.9 to 52.98 ± 19.4 µm by using SEM. PSD, using dynamic laser scattering, showed polydispersed and non-uniform size in raw FA, ranging in size from 107.1 to 1027 nm, while purified FA manifests a monodispersed size from 103.3 to 127.3 nm. FA showed the least bacterial growth reduction %, while the purified fly ash (FA2) showed the highest bacterial growth reduction %, as compared to the control bacterial broth culture without fly ash.
1. Introduction
Fly ash (FA), the main waste product arising from the combustion of solid fuels, is a powdery, black, solid and fine material that flies up from the combustion chamber; it is then captured and removed by emission-control methods, such as scrubbers, and baghouse [1,2,3]. According to the American Coal Ash Association (ACAA), FA total amount produced in 2018 was 38 million tons, with only 20 million tons for utilization. Therefore, only 52.63% was consumed and the rest was plunked in landfills, provoking severe financial and environmental problems. Besides, discharging fly ash into the atmosphere with the flue gas is avoided due to environmental concerns [4,5] According to the GlobeNewswire report on August 2019, the global FA market was valued at $4.13 billion in 2018 and is expected to reach up to $6.86 billion by 2026 [6]. FA is near enough in its composition as pozzolanic to volcanic ash. It is mainly consisting of metal oxides, non-combustible inorganic materials, and unburned carbon (UC) [7,8,9,10,11]. UC content indicates inefficiency in combustion and may represent a barrier to the beneficial use of FA or ash products in a variety of applications [2]. FA with high UC content represents a significant loss in the power production energy. The characteristics of the coal-derived UC are functions for the rank, type of the coal, size of the feed coal, and combustion conditions. However, UC is a valuable source of inexpensive activated carbon that can be employed in the manufacture of cokes and graphite in the metallurgical industry. Additionally, UC is utilized to seize trace elements from flue gas and to adsorb organic compounds, such as petroleum constituents, polychlorinated biphenyls, dyes, phenols, and herbicides [2,12,13]. Potential areas for the fly ash utilization range from plastic high-temperature ceramics and fillers, to activated carbon and cement production, soil microbial activities, and crop yield enhancement, and in the synthesis of zeolites [14,15,16]. Various approaches benefits emerge from the use of FA in cement, including ameliorated resistance to alkali-aggregate reduction, lower creep and shrinkage, gas and water tightness, and favorable pore size distribution. Fly ash may pose grave risks to the surrounding environment when landfilled in nature due to the presence of heavy metals. Thus, the removal of metals is substantial for the rescue of aquatic life and soil. In this regard, several purification techniques were employed as the biological, chemical, and physical leaching technique; thermal treatment; and electrochemical methods. Sometimes, the combination of two or more processes could be done to get better extraction yield and accordingly detoxification of fly ash [17]. Hence, the main objectives of the present study are (a) the removal of the non-environmentally safe metals from FA, using a simple laboratory density gradient centrifugation to increase the black carbon percentage; (b) the effect of rising the time of centrifugation, from 1 to 6 h, on the FA purification process; and (c) evaluating the antibacterial activity of FA against Gram-positive and Gram-negative bacterial strains, Bacillus cereus and Escherichia coli, respectively, before and after purification.
2. Materials and Methods
2.1. FA Purification Using Density Gradient Centrifugation (DGC)
Fly ash was collected in off-gas treatment system of power plants in Saudi Arabia using heavy fuel oils. Two samples (FA1 and FA2) of 10 g each were dispersed in a 10% solution of sodium tungstate dihydrate (Na2WO4∙2H2O) Sigma-Aldrich Darmstadt, German. FA1, and FA2 were centrifuged at 15,000 rpm, for 1 and 6 h, respectively, at room temperature. The supernatant was discarded and the resulted pellet was re-suspended in distilled water and centrifuged at 15,000 rpm for 10 min. The latter step was repeated 6 times. The resulted pellet was dried overnight, at 50 °C. The samples were denoted as FA (raw fly ash) used as control, FA1 (fly ash centrifuged for 1 h), and FA2 (fly ash centrifuged for 6 h).
2.2. Physicochemical Characterization
2.2.1. The Moisture Content of Fly Ash
The moisture content (MC) of FA, FA1, and FA2 was determined. A sample of 1 g of each was weighed and added individually in a crucible. The samples were heated to 110 °C for 1 h, using a Thermo Scientific Precision 658 oven. The heated samples were cooled to room temperature, in a desiccator, for 30 min, and then reweighted. The moisture content was calculated according to Equation (1).
where, W1 and W2 are the weight before and after heating, respectively [18].
2.2.2. Loss-of-Ignition (LOI) Determination
The loss-of-ignition (LOI) of FA, FA1, and FA2 was calculated to determine the amount of unburned fuel in fly ash. From each sample, 1 g was heated at 110 °C, for 1 h, and dried to room temperature. The dried samples were heated to 650 °C, in a Nabertherm Muffle Furnace L 3/12, for 3 h, and then cooled to room temperature. The LOI was calculated according to Equation (2).
where W1 and W2 are the weight of the dried samples after heating at 110 and 650 °C, respectively [18].
2.2.3. Fourier Transform Infrared Spectroscopy (FTIR)
FTIR spectra of FA, FA1, and FA2 were recorded with a Nicolet FTIR Avatar 360 spectrophotometer (Thermo Scientific™, Waltham, MA, USA). The spectral region between 4000 and 400 cm−1 was scanned. Specimens were prepared as KBr pellets. Samples were mixed thoroughly with KBr and then pressed, to form a thin disc with 0.5 mm thickness. The samples were 2% concentration to KBr.
2.2.4. X-Ray Diffraction (XRD)
X-ray diffraction patterns for FA, FA1, and FA2 were obtained by using a Bruker D5005 diffractometer (Bruker™, Billerica, MA, USA), at CuKα radiation (λ = 1.5418 A°). During the X-ray, the voltage was 35 kV, and the current was 25 mA.
2.2.5. X-Ray Photoelectron Spectroscopy (XPS)
XPS (X-Ray Photoelectron Spectroscopy) analysis for the surface chemistry for FA, FA1, and FA2 was carried out with a K-alpha™ X-ray Photoelectron Spectrometer (XPS) (Thermo Scientific™, Waltham, MA, USA), using the MgKα radiation of twin anode in the constant analyzer energy mode with a pass energy of 50 eV. Survey scan investigations were carried out with a pass energy of 30 eV, and a spot size of 400 μm2 area. The energy step size for the narrow scan analysis was 0.01 eV. The final high-resolution scan spectrum was obtained with at least four times of scan for each element [19,20].
2.2.6. Particle Size Distribution and Zeta Potential
The particle size distribution of the FA, FA1, and FA2 was performed by dynamic light scattering, using a Malvern Mastersizer 2000 equipment (Malvern Panalytical, Malvern, UK), where the samples were subjected to a focused laser beam. This allows for the detection of particles ranging from 0.02 to 2000 µm. Samples were diluted with 0.1 KCl, and the potential of the electrophoretic cell was adjusted to ± 150 mV. Each sample was performed in triplicate, and the results were expressed as average arithmetic mean [21,22].
2.2.7. BET Surface-Area Analysis
The BET method was employed to measure the surface area and porosity of FA, FA1, and FA2, with a Micromeritics Gemini 2360 surface area analyzer (Micromeritics, Norcross, GA, USA). Nitrogen gas molecules were adsorbed onto a solid surface, allowing the measurement of the surface area and porosity of the samples.
2.2.8. Carbon, Hydrogen, Nitrogen, and Sulfur (CHNS) Elemental Analysis
Elemental analysis is a rapid quantitative method in which the weight % of carbon, hydrogen, nitrogen, and sulfur is determined. The FA, FA1, and FA2 were analyzed and compared accordingly, using FlashEA® 1112, CHN Analyzer, (Thermo Scientific™, Waltham, MA, USA).
2.2.9. Morphological Examination Using a Scanning Electron microscope (SEM)
The effect of centrifugation time on FA, FA1, and FA2 particle size microstructure, morphology, and composition difference were carried out by using a scanning electron microscope (SEM) and energy-dispersive X-ray analyzer (EDXA). Samples were gold-sputtered before the examination. The electron microphotographs were recorded, using a JEOL JSM-6300 SEM with EDX (SEMTech Solutions Inc., Billerica, MA, USA). The electron beam was with 25 kV energy and magnifications of 10 and 100 µm. The samples’ amorphous particle size distribution was measured, using ImageJ©.
2.3. Antibacterial Activity Testing
The antibacterial activity of FA, FA1, and FA2 against Gram-positive and Gram-negative bacterial strains, Bacillus cereus and Escherichia coli, respectively, was evaluated, using 100 mg from each sample. Each bacterial strain was added to Mueller Hinton broth (Sigma-Aldrich) and kept overnight in a MaxQ™ 4000 Benchtop Orbital Shakers Thermo Scientific™, at 37 °C. the optical density (OD) was adjusted to 0.1 at λ = 625 nm, using a UV spectrophotometer Thermo Scientific™ Orion AquaMate 8000. Samples were sterilized under UV, for 1 h, prior to the addition to bacteria, and then incubated with the bacterial strains, in the shaking incubator, overnight, at 37 °C [23]. The experiment was performed in triplicates and results were expressed as average arithmetic mean of the UV absorbance at 630 nm, using Biochrom Libra S22 UV/VIS spectrophotometer (Biochrom, Cambridge, UK).
2.4. Statistical Analysis
All the samples were performed in triplicates. Results were expressed as average arithmetic mean ± standard deviation where n ≥ 3. For all experiments, average values were reported from three independently prepared samples. Particle size was measured from the SEM, using the ImageJ© program.
3. Results and Discussion
Fly ash is a complex mixed material, mainly composed of a mineral phase of glassy materials with minor minerals and amorphous phase due to the presence of the unburned carbon [24]. Furthermore, diverse environmental problems were caused by the landfill of fly ash such as leaching of heavy metals, pollution of the soil with organic compounds, and secondary dust generation. Thus, the treatment of fly ash is a crucial process preceding to its storage [25]. In this work, FA obtained from power plant combustion in Saudi Arabia was purified by removing metals and other minerals, to increase carbon content, which is an expensive source for activated carbon, using a simple density gradient centrifugation. The effect of centrifugation time was studied, and, accordingly, samples were divided into FA (raw fly ash), FA1 (fly ash after 1 h of centrifugation), and FA2 (fly ash after 6 h of centrifugation). The antibacterial activity of fly ash samples was determined against Gram-negative and Gram-positive bacterial strains, Bacillus cereus and Escherichia coli, respectively. Samples were physiochemically characterized and compared.
3.1. Moisture Content and Loss-of-Ignition Determination (LOI) of Fly Ash
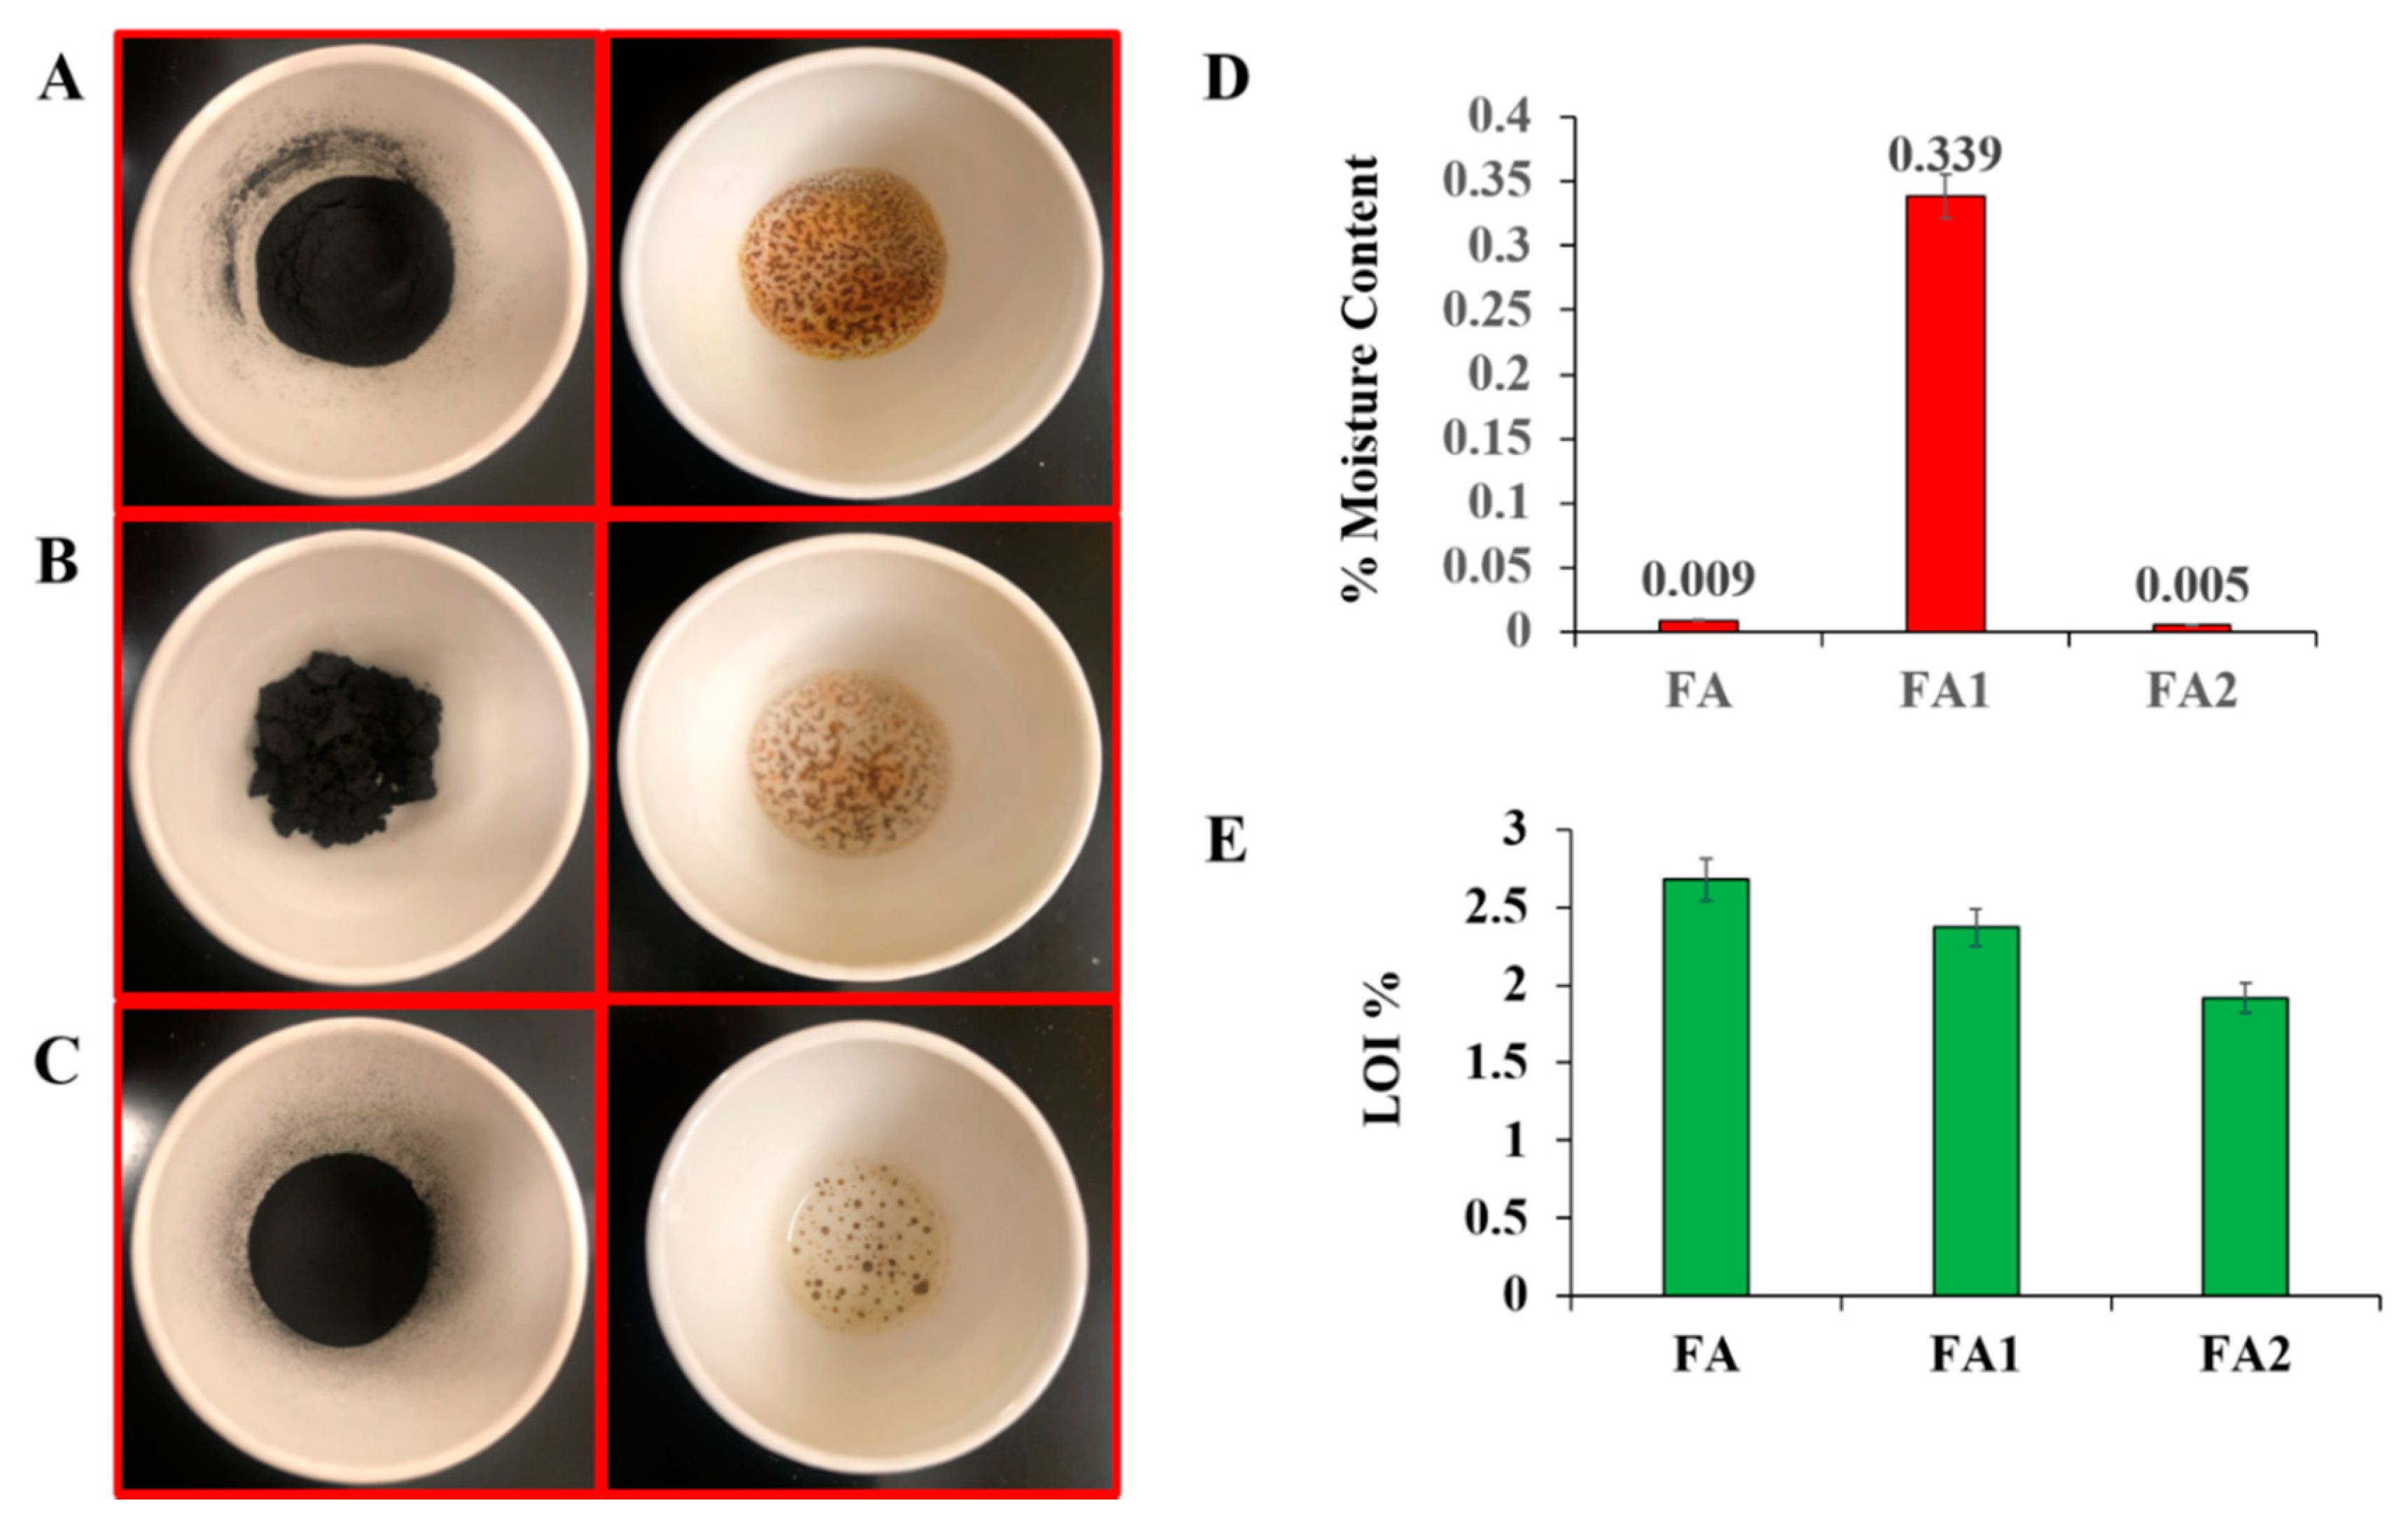
Moisture content and LOI are one of the most important physical properties of fly ash that depend on the nature of the coal and its mineralogical content [26]. The moisture content of FA, FA1, and FA2 was found to be 0.009%, 0.339%, and 0.005%, respectively (Figure 1D). These results indicate that all moisture was evacuated at 110 °C. The low moisture content of the samples suggests that they can be used in industry [27]. The FA1 had the highest moisture content, as compared to FA and FA2. This could be explained by the presence of the sodium remaining from the used sodium tungstate during the separation process, as the sodium tungstate is an inorganic compound that is water-soluble in the form of the sodium salt of tungstic acid [28]. Loss-on-ignition (LOI) is used as a standard method to measure both unburned carbon content and fineness in fly ash, but the combustion of carbon is the major provider component for the LOI. LOI also constitutes the availability of carbonates and combined water in clay minerals [29]. The LOI % of our samples decreased with increasing the time of centrifugation from 2.68% in the raw fly ash to 1.92% in the FA2 (Figure 1E). These results indicate that our FA samples are of high quality. LOI may be high with low-quality fly ash with low fineness, due to the presence of coarser carbon particles, leading to a decrease in the pozzolanic reactions of fly ash [30].
3.2. Fourier Transform Infrared (FTIR) Spectroscopy
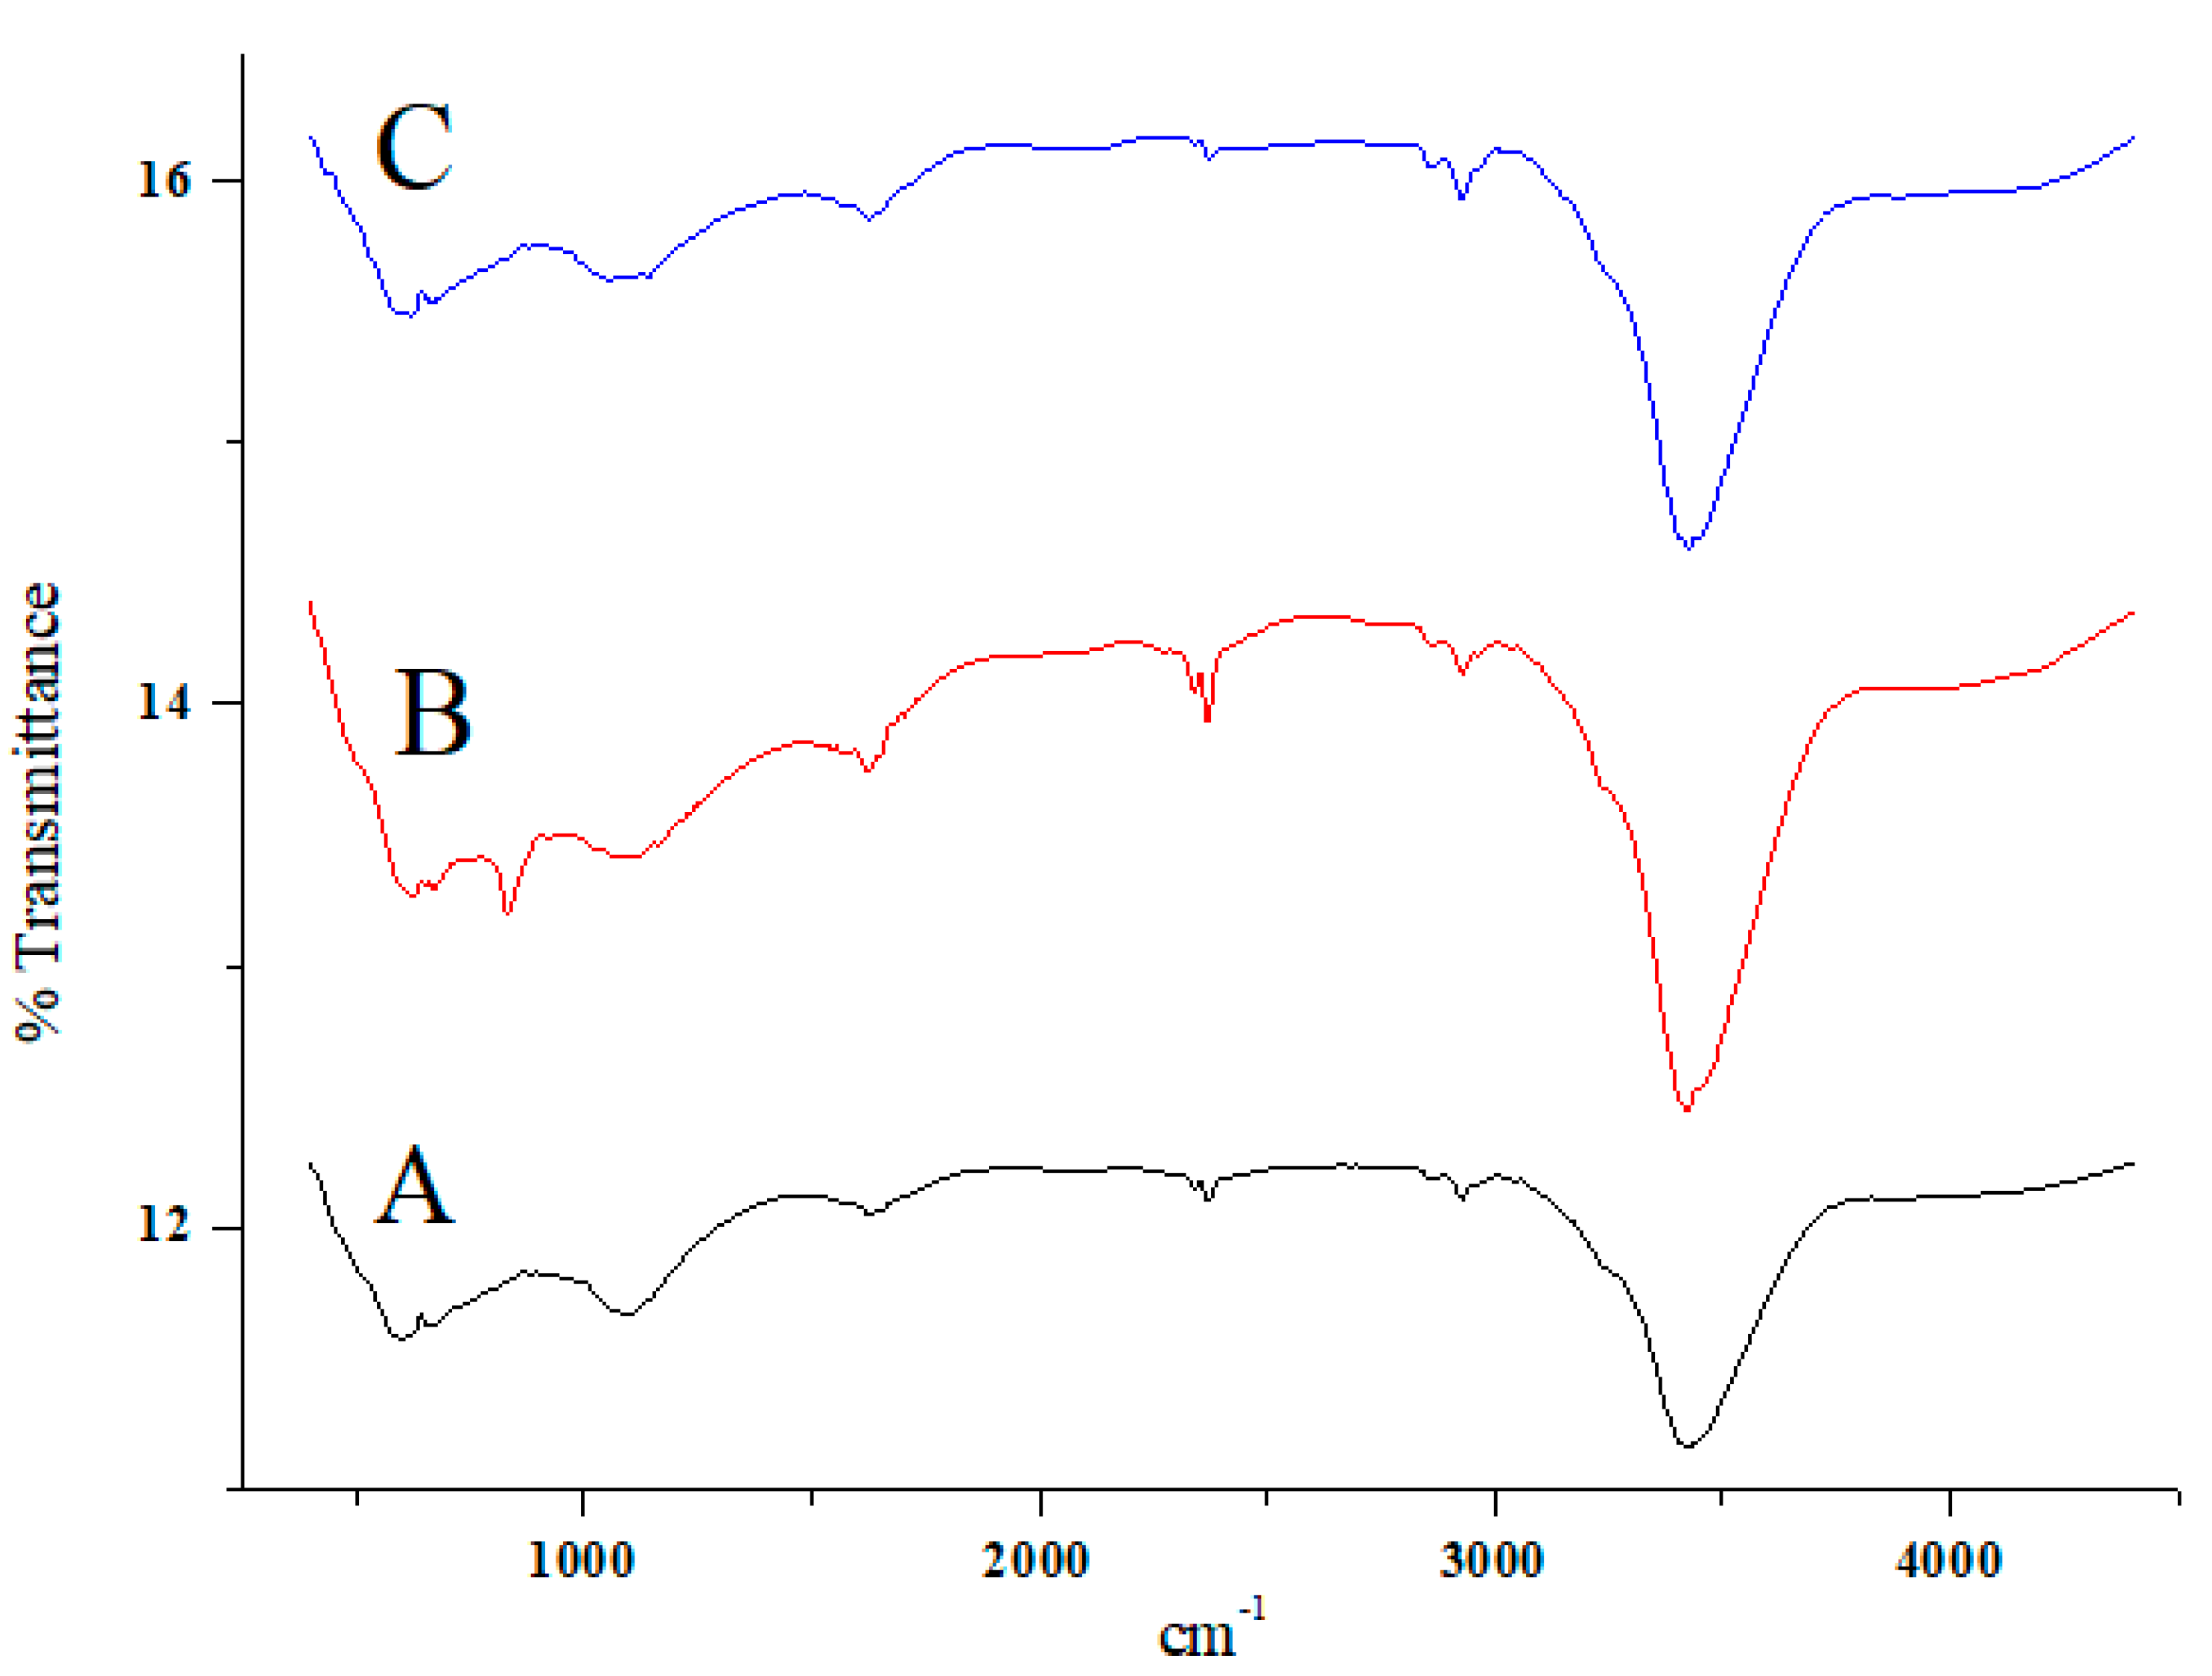
FTIR spectra of FA, FA1, and FA2 were performed to evaluate the mineralogical composition because each mineral possesses its absorption pattern in the IR range (Figure 2) [31]. The bands appearing at around 3400 and 1620 cm−1 are attributed to the stretching and bending vibrations of OH in the H2O molecule, respectively indicating the presence of molecular water [32]. In the FA spectrum, a band at around 1080 cm−1 was identified due to Si-O-Si or Si-O-Al asymmetric stretching vibration [33]. Bands that appear at around 2900 and 1625 cm−1 in all the samples represent the C-H stretching vibration of the organic carbon [34] and the stretching vibration of the C=O carboxylate group of organic matter [35,36,37]. A band at around 1090 cm−1 that appeared in the FA was Si-O-Si asymmetric stretching vibration for quartz [38]. Moreover, the band at 598 cm−1 in the raw FA indicates Si-O-Al vibration that was formed due to structural rearrangements of Si-O-Al in fly ash.
3.3. X-Ray Photoelectron Spectroscopy (XPS) and X-Ray Diffraction (XRD)
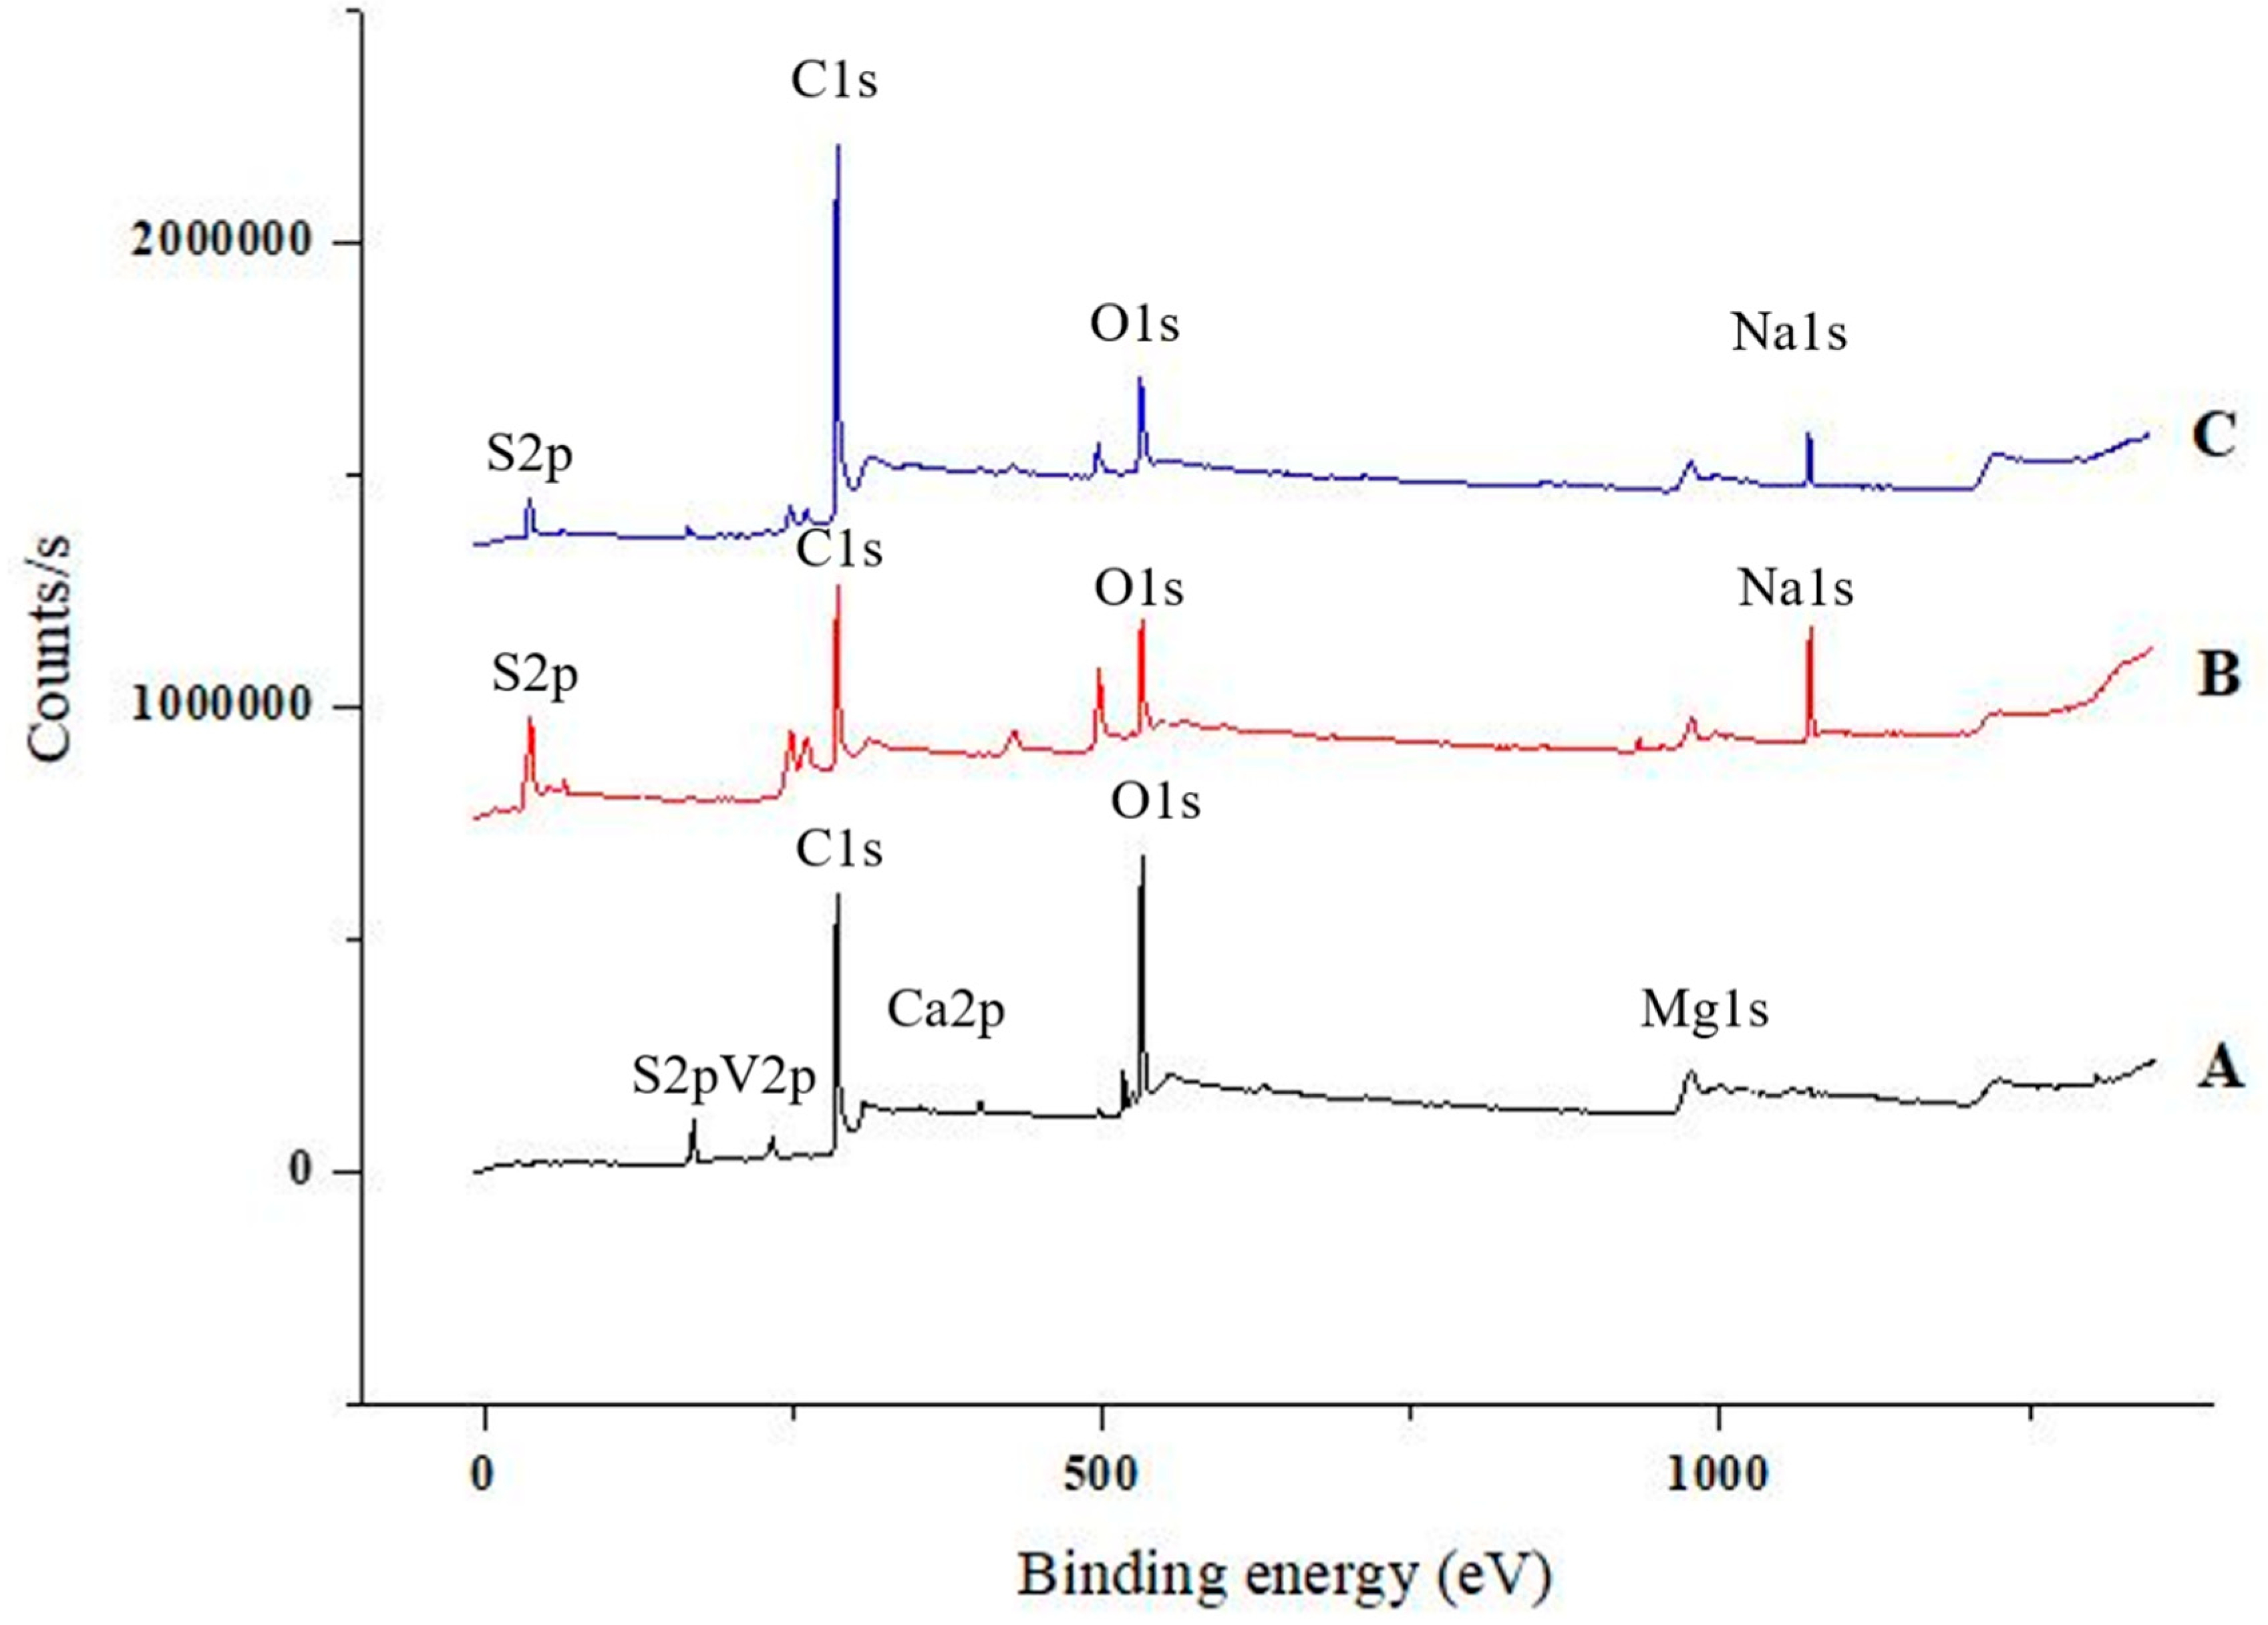
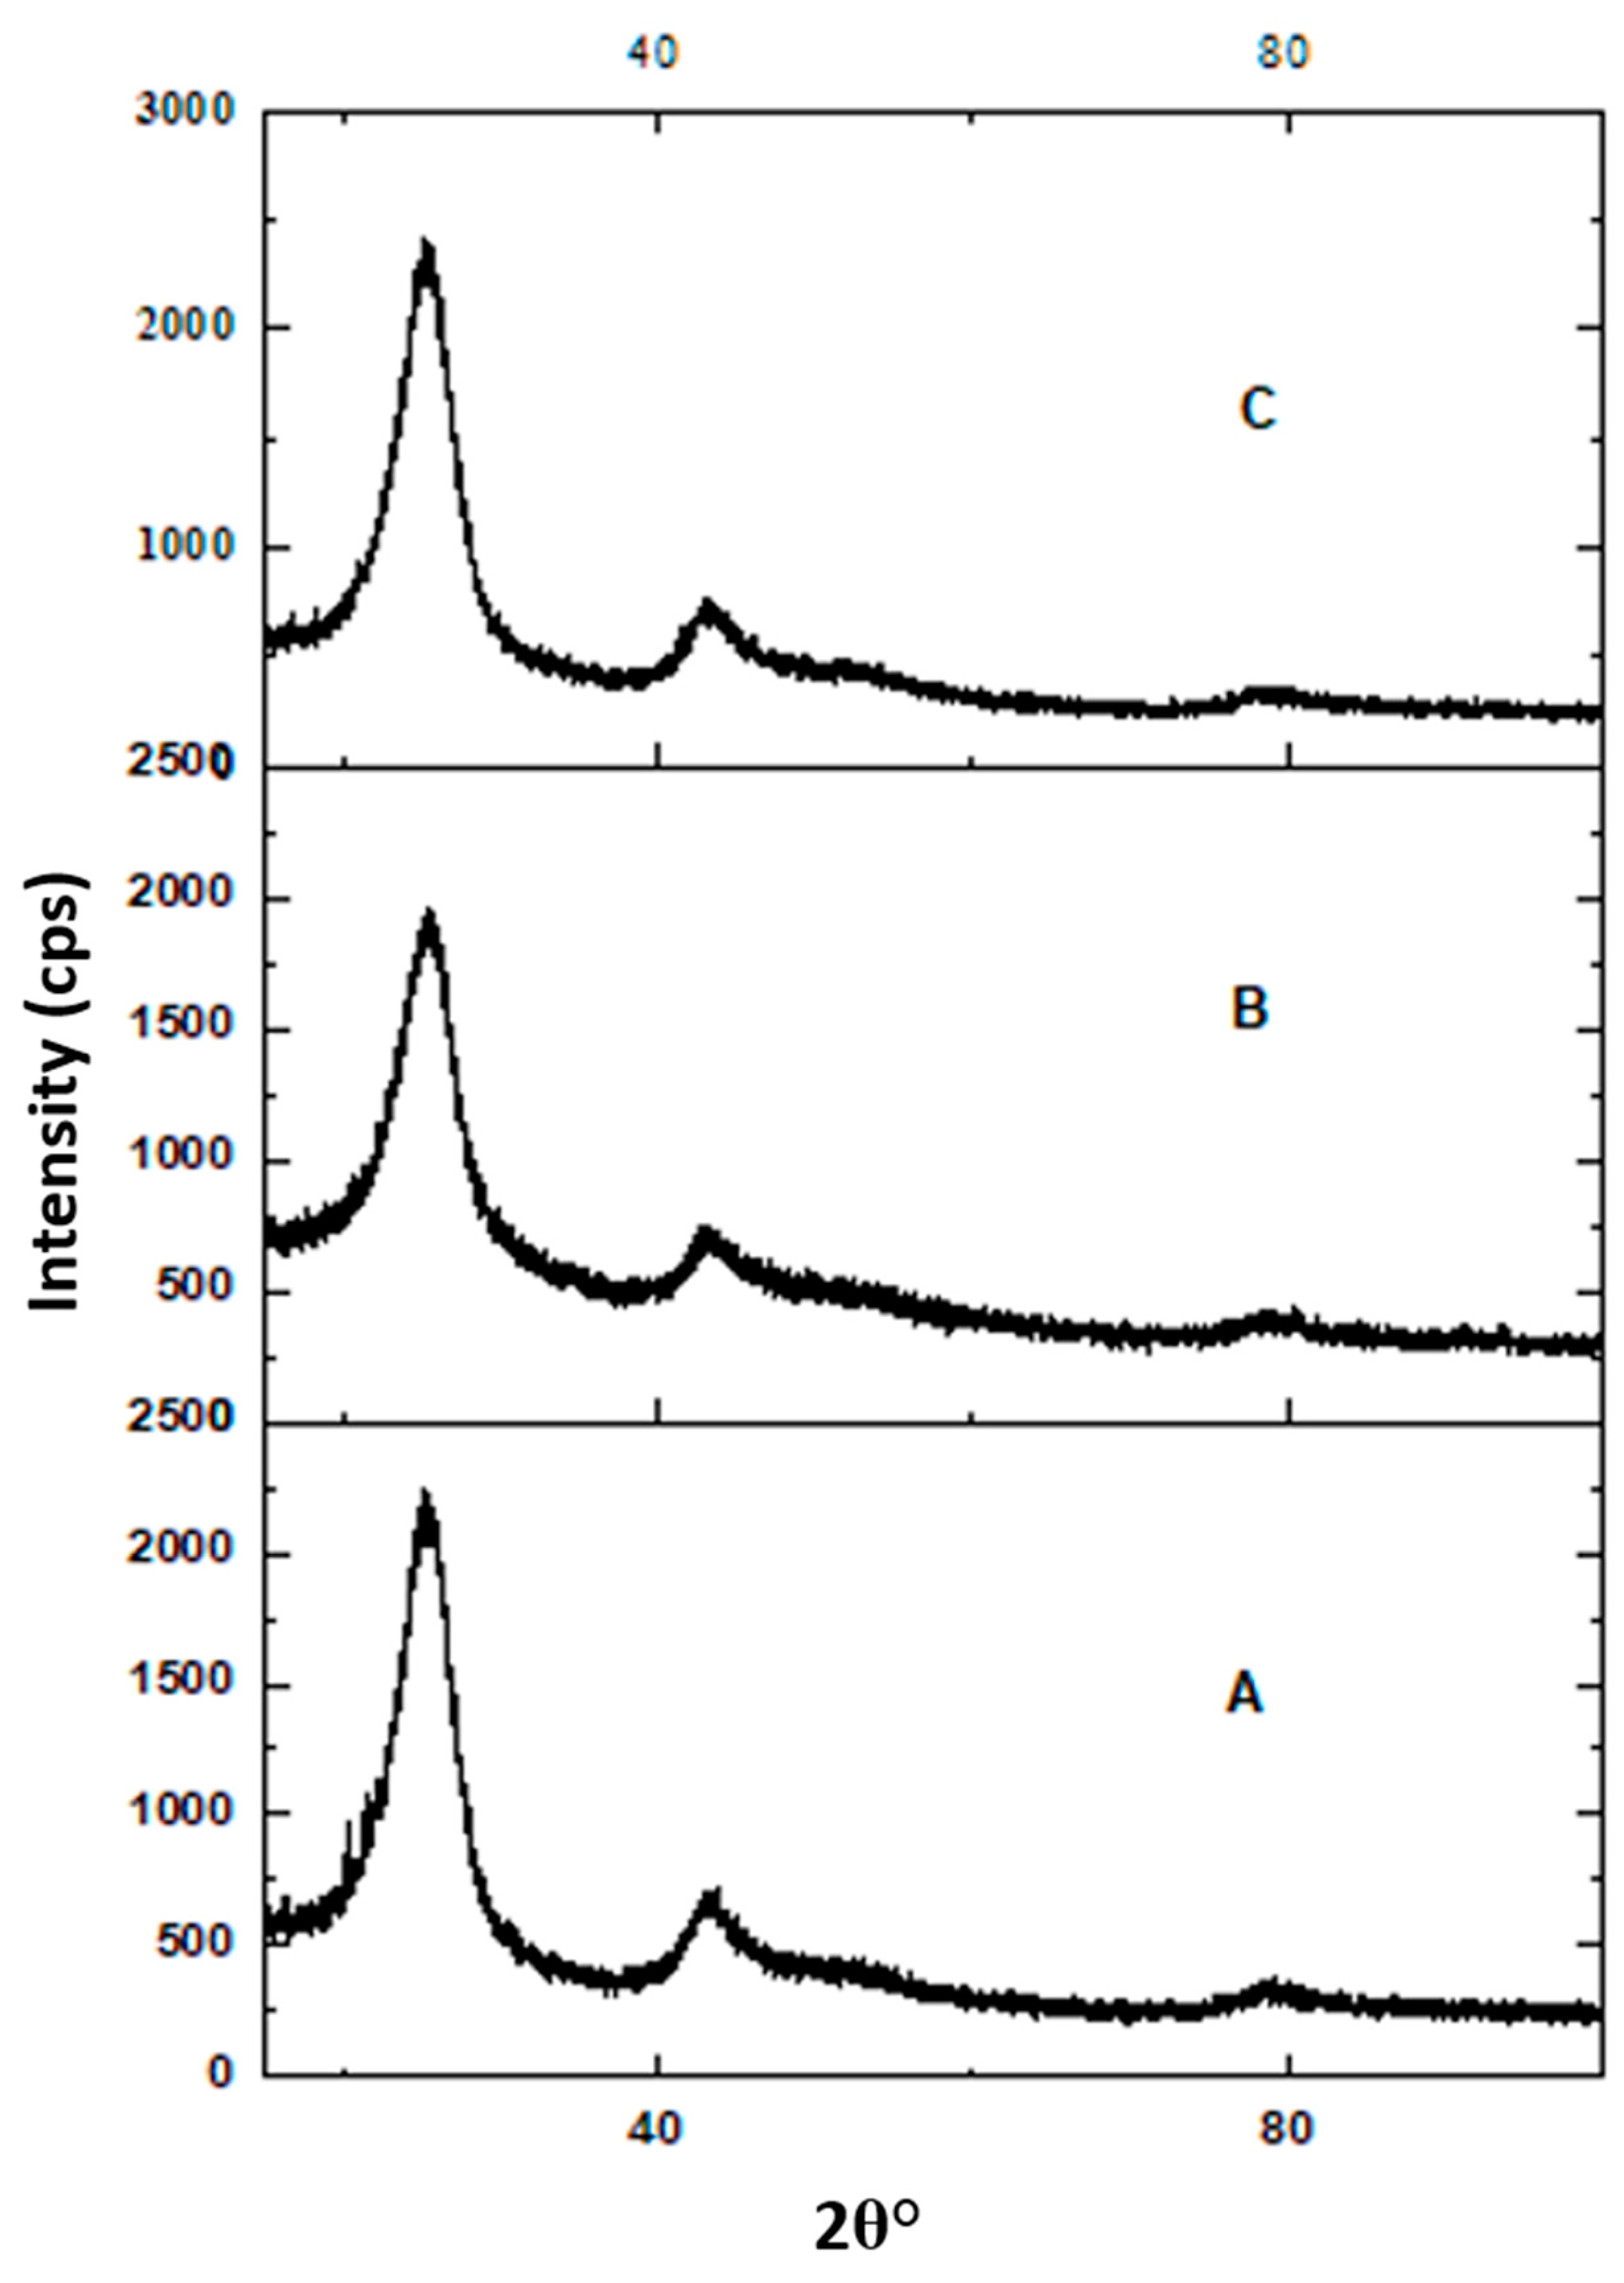
XPS provides information on the elemental composition and the oxidation state of the elements. XPS spectra of FA, FA1, and FA2 were shown in Figure 3. From this spectrum, the primary components of the near-surface region of FA, FA1, and FA2 were carbon, oxygen, and sulfur. In addition to vanadium in the FA, and sodium in the FA1, and FA2. Other elements were present in smaller quantities in FA as the calcium and magnesium. The atomic % of the elements is displayed in Table 1. The carbon % was increased by extending the time of centrifugation, indicating a purified carbon compared to the raw fly ash. Therefore, O1s and S2p were decreased by augmenting the centrifugation time. The Ca2p and Mg1s were present in a minuscule amount in the FA and disappeared in the FA1 and FA2. Moreover, the V2p disappeared in the FA1 and FA2. The Na1s was present in the FA1 by 8.04%, due to its usage during the separation and its amount was cramped in FA2 to 2.26% [34]. The XRD pattern for the FA, FA1, and FA2 were presented in Figure 4. The XRD data revealed that the samples were having both crystalline and amorphous phases. Where the amorphous phase was represented with 2 specific broad peaks at around 43° and 79°, and the crystalline phase by a peak at around 23° at the 2θ position representing the fingerprint of the activated black carbon present in the FA [39,40].
3.4. CHNS Elemental Analysis
Carbon, sulfur, nitrogen, and hydrogen (CHNS) were determined quantitatively in FA, FA1, and FA2 by using elemental analysis (Table 1). The results showed that the C weight % was the highest in the FA2 followed by the FA1, 88.9%, and 83.5%, respectively when compared to FA which was only 82.1%. This serves as a confirmation that increasing centrifugation time ameliorated the separation by reaching high carbon content [41]. However, H% was the highest in the FA1 by 3.8%, while in the FA and FA2 was almost the same. N and S % was almost the same in all three samples [19].
3.5. Scanning Electron Microscopy (SEM) and Energy-Dispersive X-Ray Analyzer (EDXA)
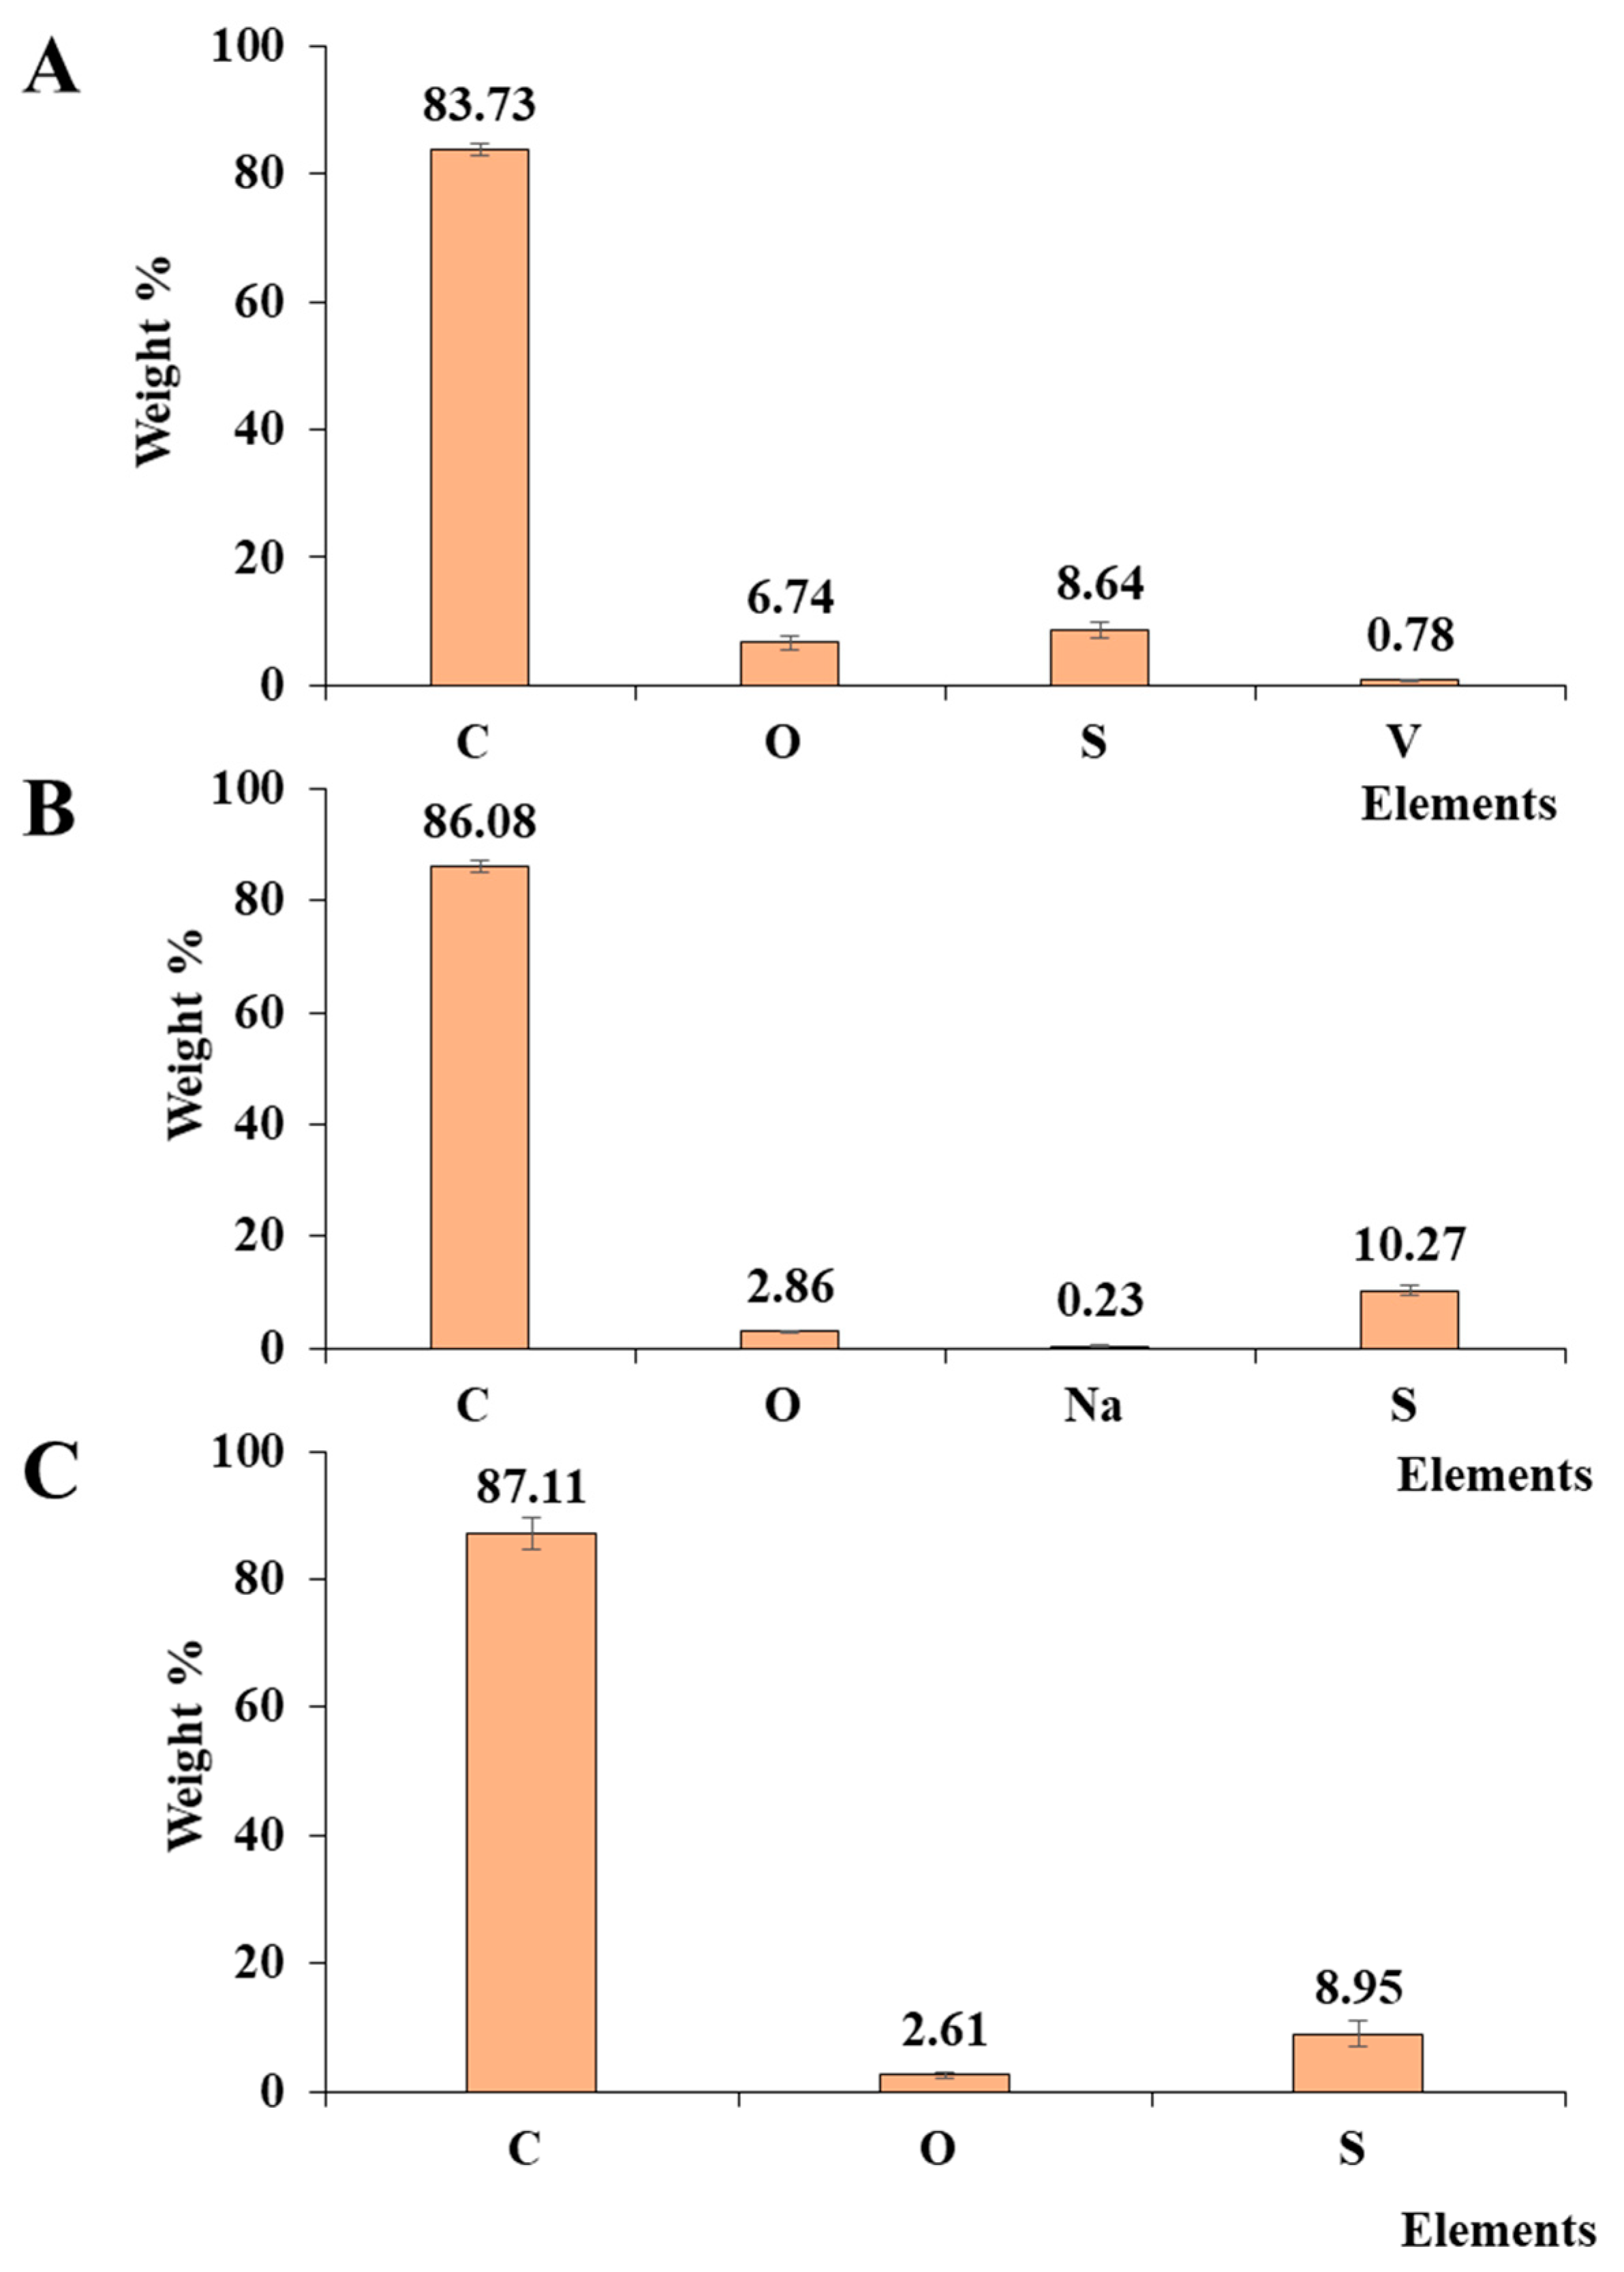
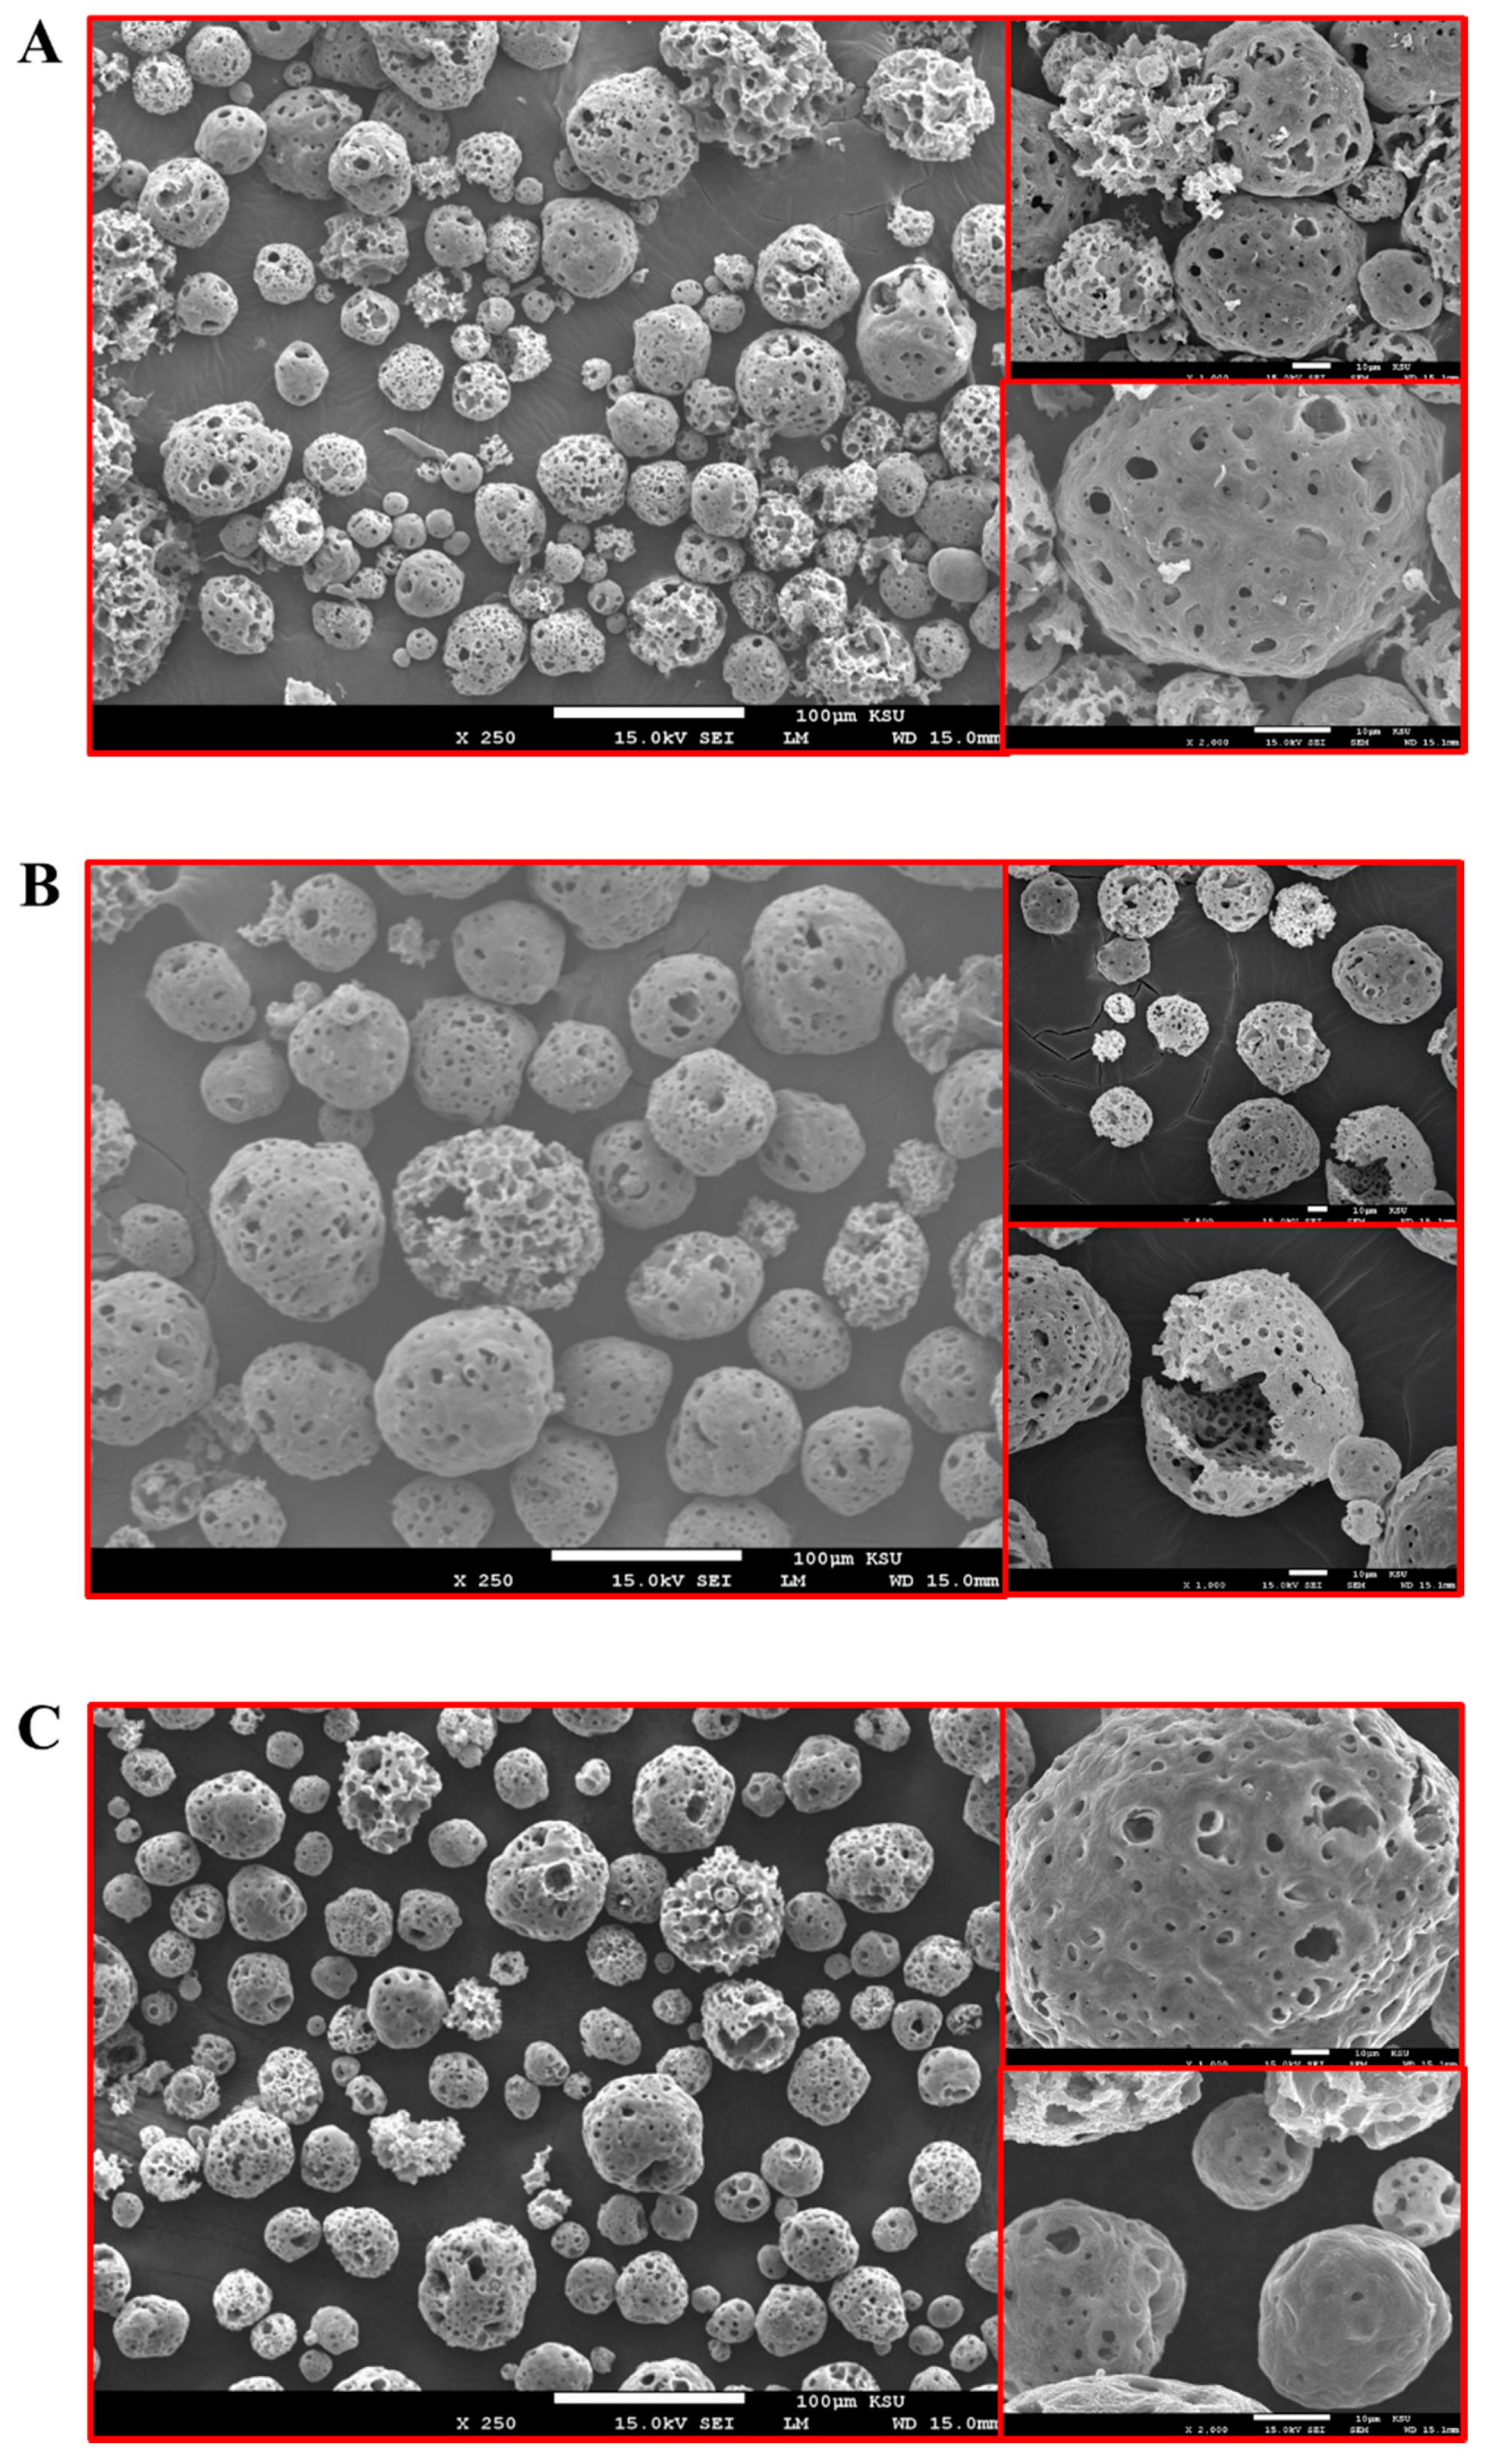
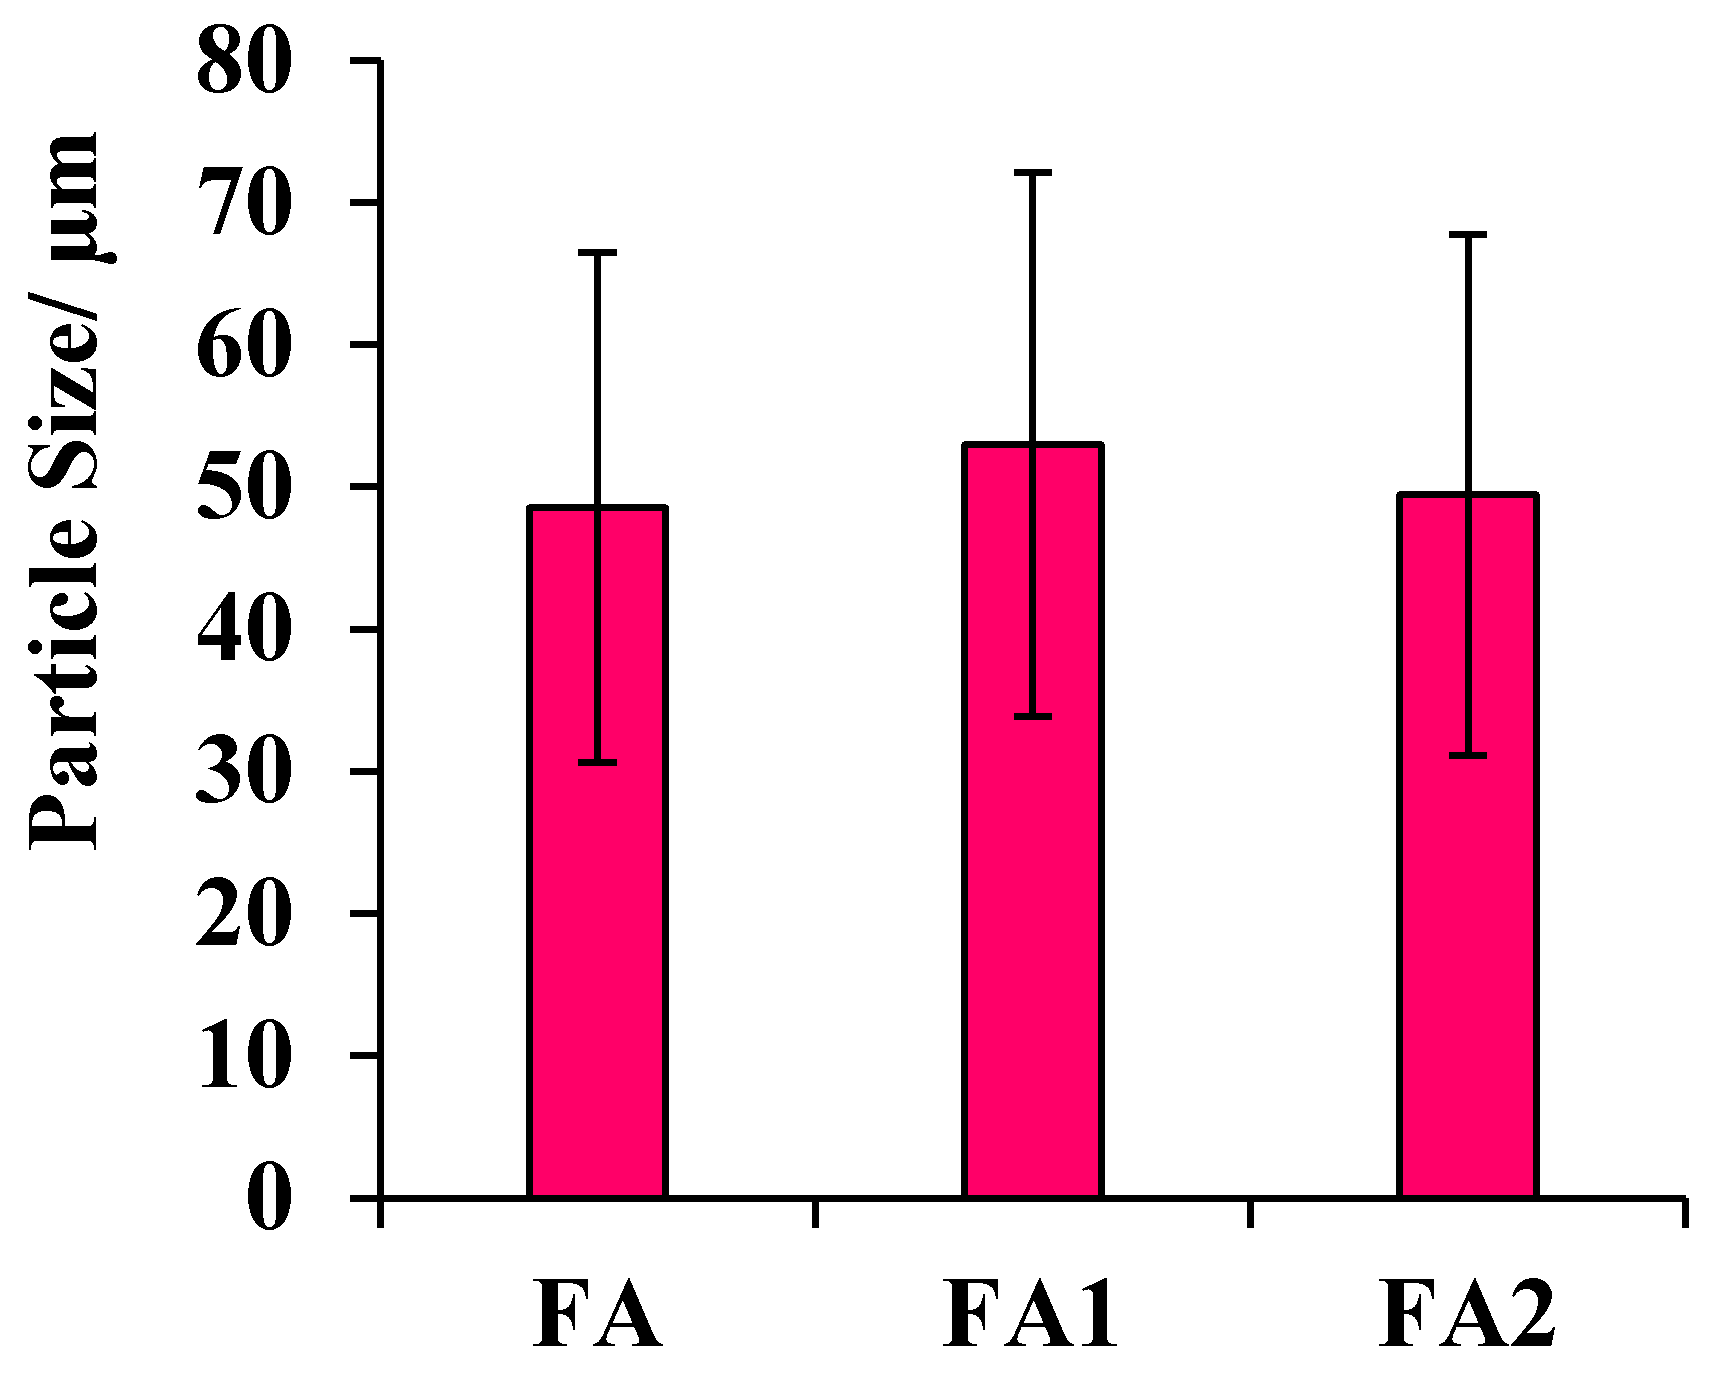
The composition of the amorphous phases of FA, FA1, and FA2 was analyzed with a scanning electron microscope (SEM). An energy-dispersive X-ray analyzer (EDXA) was used to point count amorphous particles. These amorphous particles were identified by measuring circular particles with a built-in measuring tool. These particles were quantitatively investigated for eight elements: calcium, aluminum, iron, sodium, potassium, silicon, oxygen, and carbon (which are visualized in Figure 5. The carbon weight % was found to be the highest in the FA2 (87.11%), followed by FA1 (86.08%), and the least C weight % was that of FA. This asserts the results obtained by the CHNS analysis, emphasizing the success of our separation method. Oxygen weight % started to diminish after increasing the time of centrifugation, by 6.74%, 2.86%, and 2.61% for the FA, FA1, and FA2, respectively. Vanadium was present in the raw FA and die out when the separation started. The Na appearing after 1 h of centrifugation in the FA1 sample may have resulted from remaining traces of the sodium tungstate that have been used for the separation. Thus, the Na vanished by increasing the separation time. The presence of Na confirmed our moisture content results that decreased by increasing the centrifugation time. The SEM micrographs were used to study the morphology and particle size of the FA, FA1, and FA2. A majority of FA particles were various types of microspheres. Two different types were visible (Figure 6): Hollow spheres (cenospheres) and thin-walled hollow microspheres with smaller ones encompassed or minerals within these spheres called plerospheres can be seen. Close examination of the non-spherical oversized particles also revealed the presence of finer particles on their crystalline surfaces. In addition, it was clear that as much as the time of centrifugation increase, the more the smoothness of the microsphere and the clearer surfaces (Figure 6B,C), confirming the removal of the minerals that were detected in the FA sample (Figure 6A) [33,42]. The particle size distribution of the microspheres was measured manually from the SEM micrographs, using ImageJ© to determine the particle diameters where n ≥ 50. The results were expressed as average arithmetic means and plotted (Figure 7) where the microspheres’ sizes range from 48.53 ± 17.90 µm to 52.98 ± 19.4 µm.
3.6. Particle Size Distribution and Zeta Potential
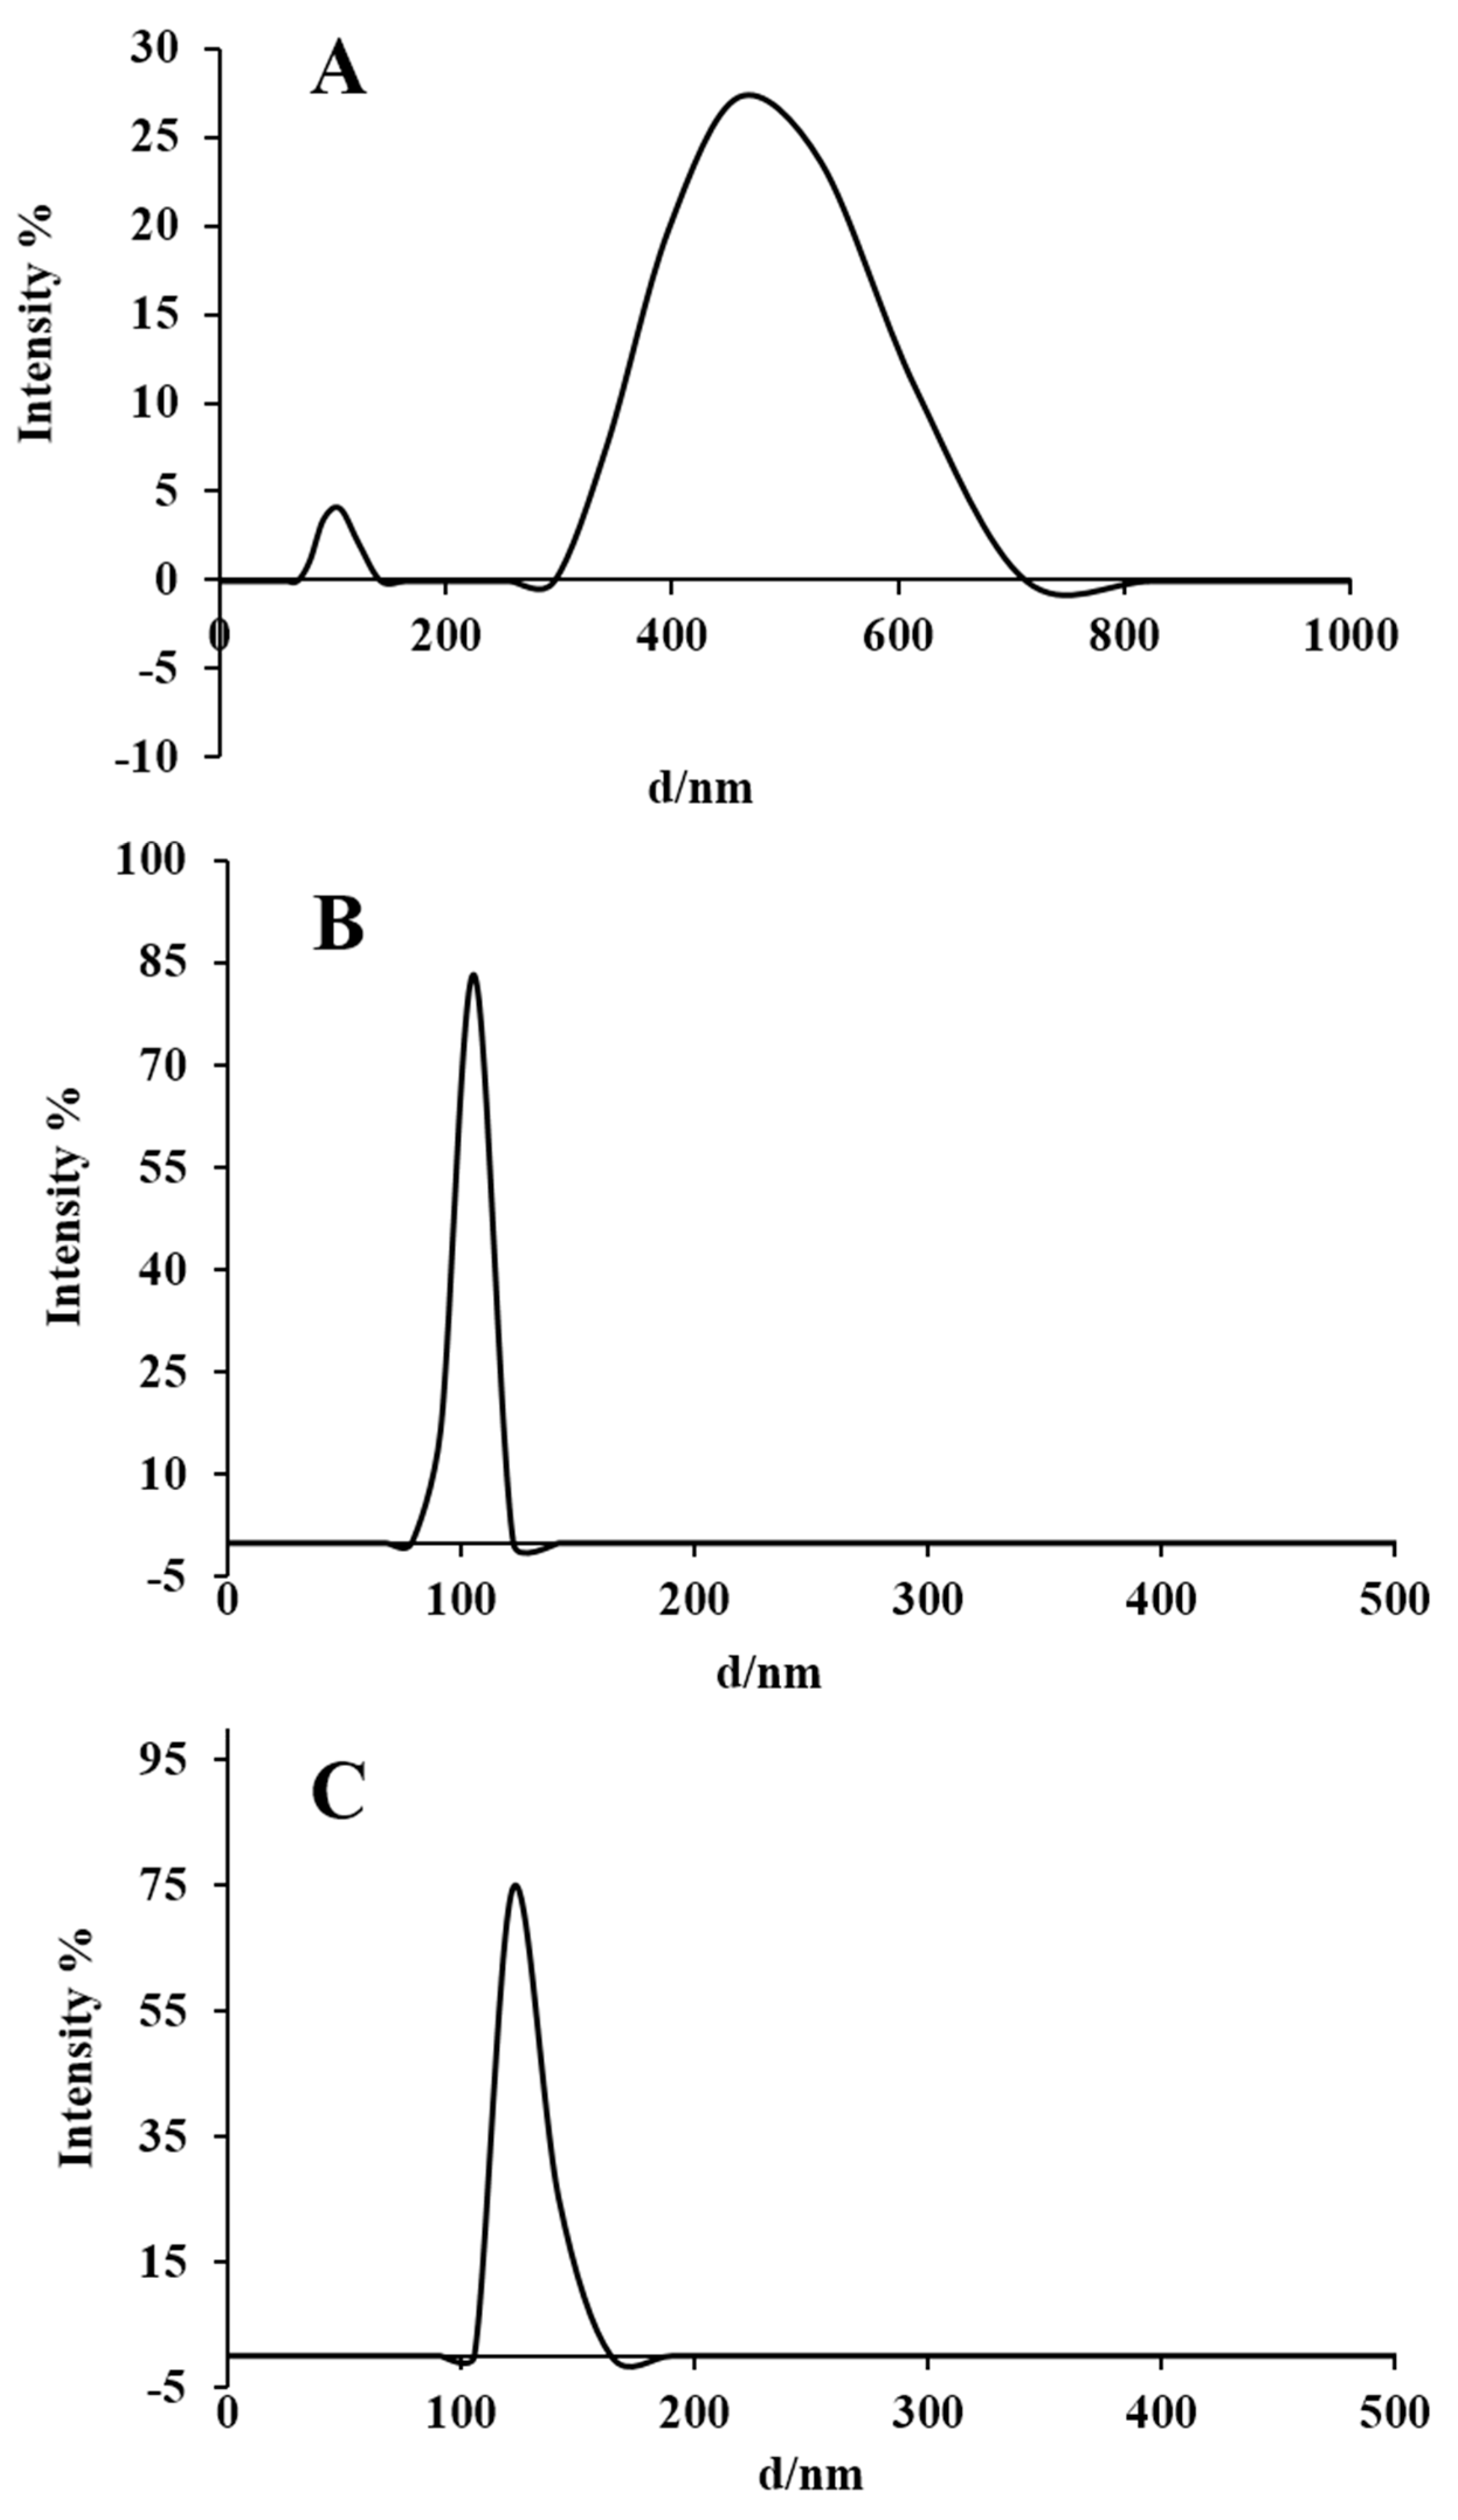
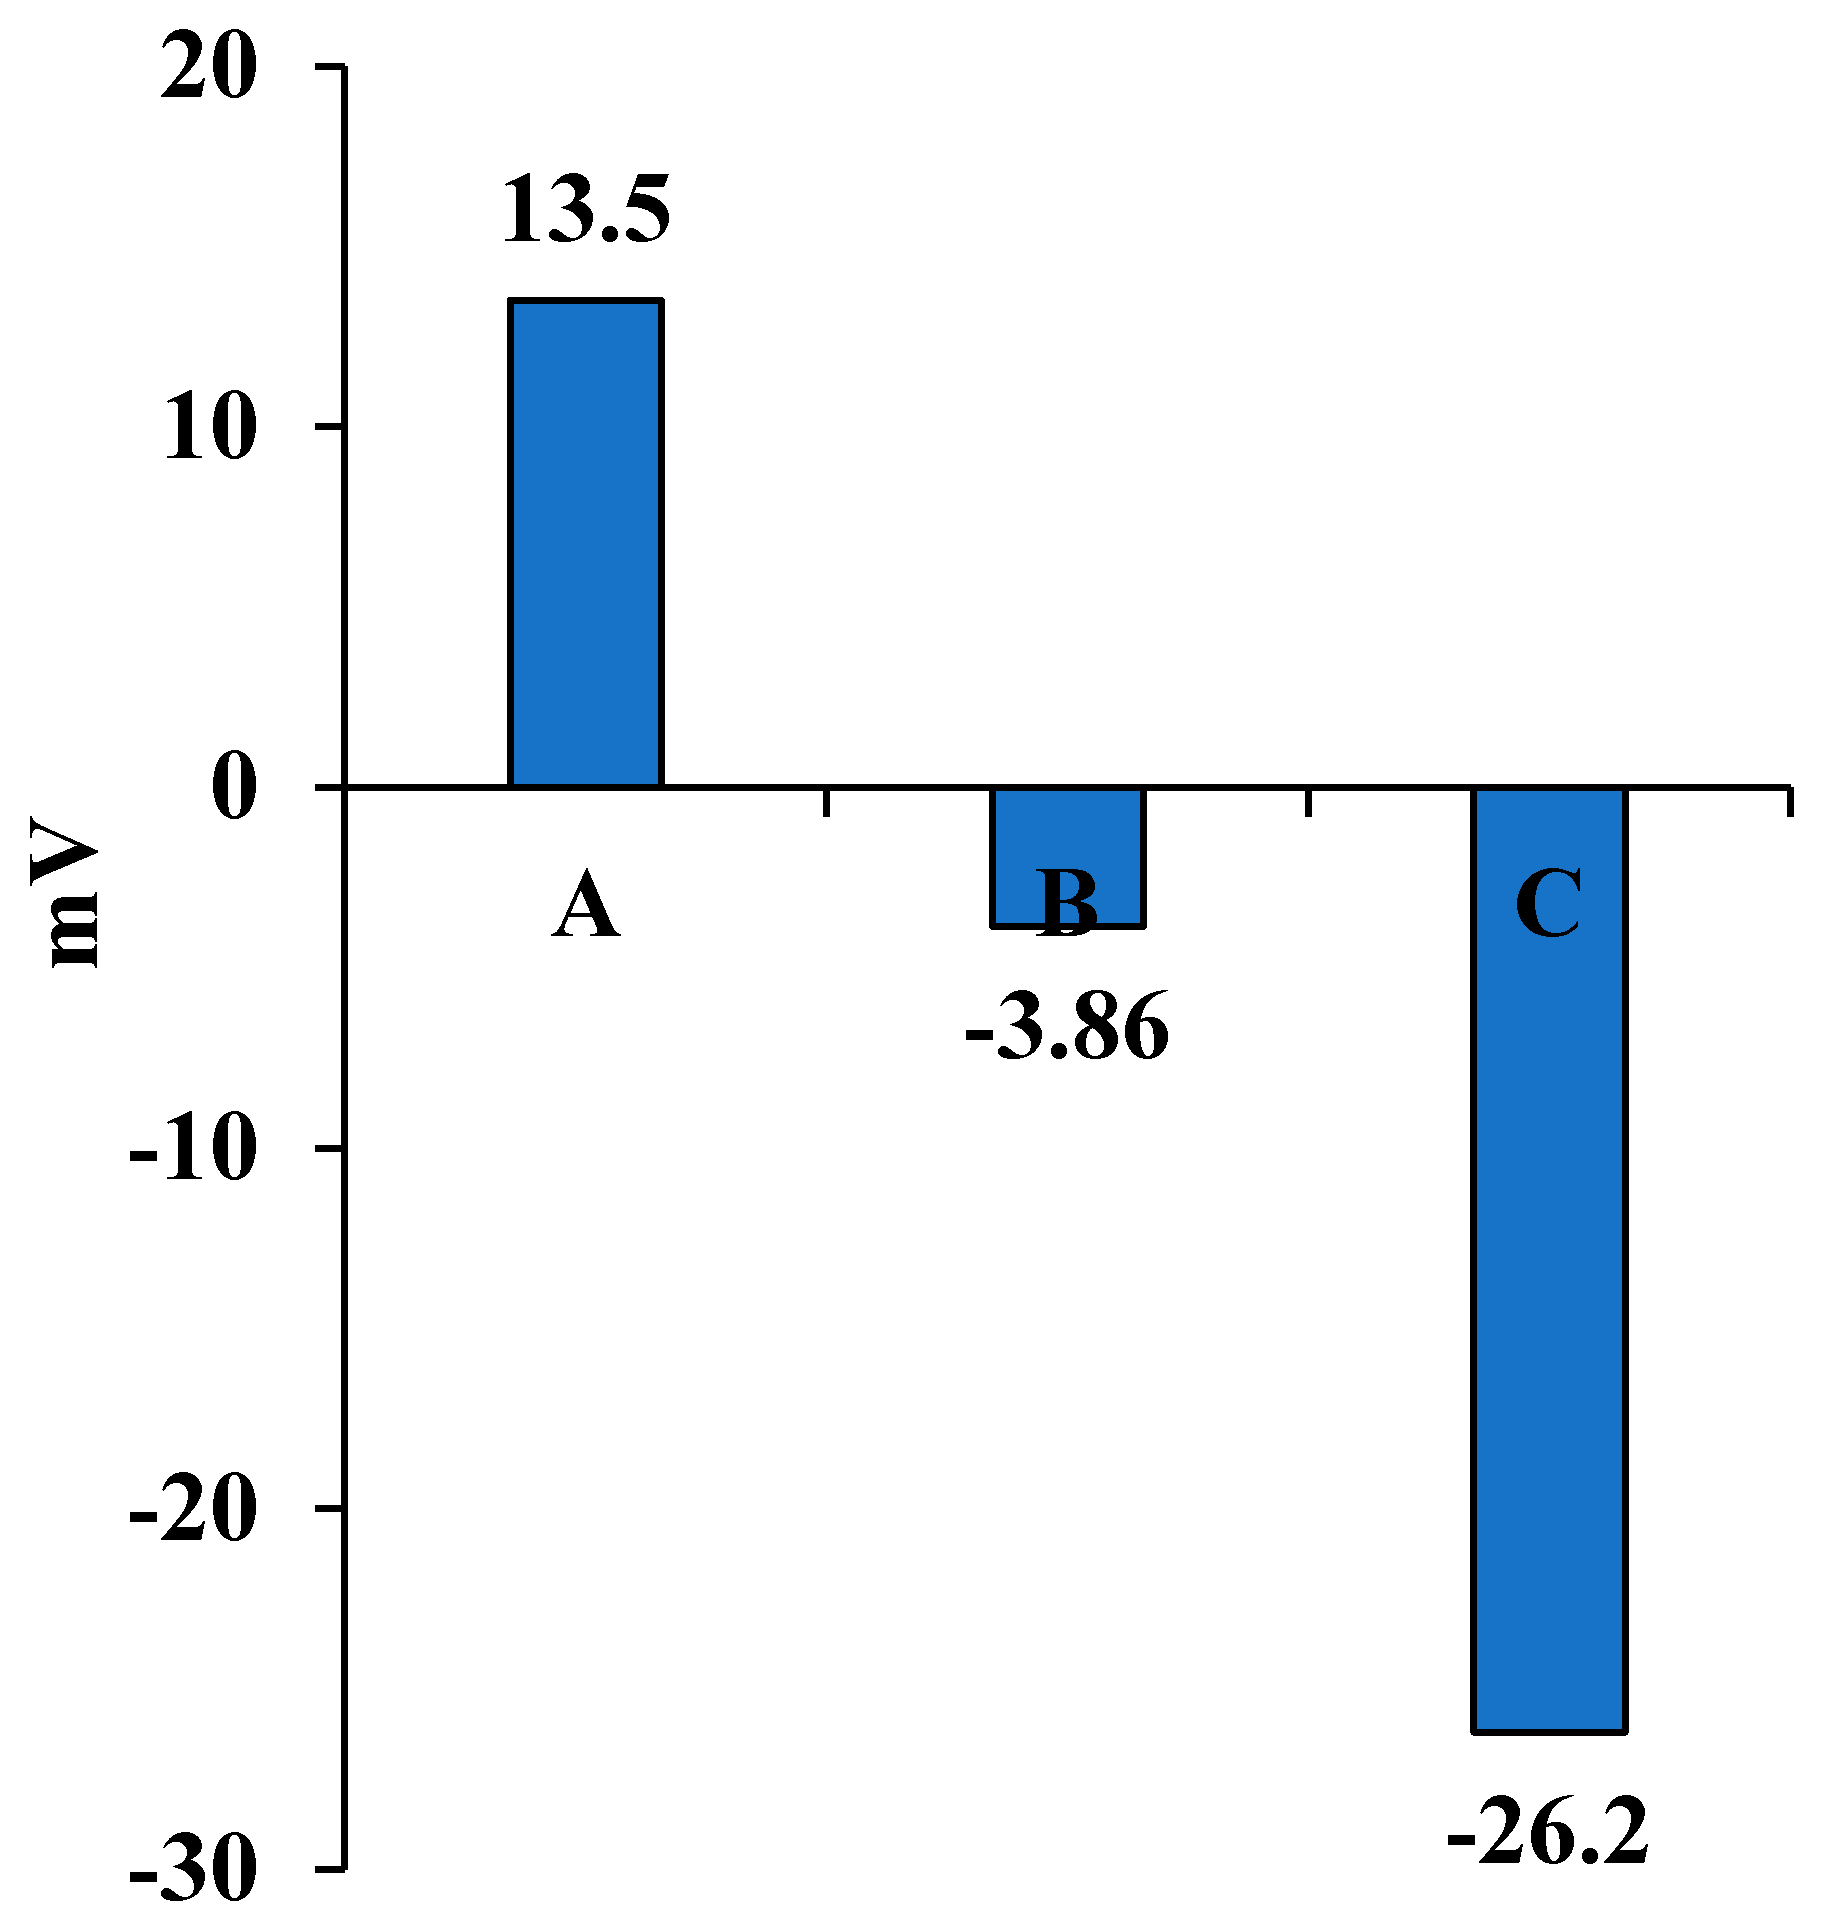
The particle size distribution of FA, FA1, and FA2 resulted from SEM was confirmed using a dynamic laser scattering (DLS) technique. The results were presented in Figure 8. FA was found to be polydispersed and not uniform exhibiting broad and multiple peaks that vary in size from 107.1 to 1027 nm. FA1 and FA2 showed a monodispersed particle size distribution with a size 103.3, and 127.3 nm, respectively. The augmentation of centrifugation time from FA1 to FA2 displays an increase in the particle size from 103.3 to 127.3 nm that may be due to aggregation of the particles back together. However, the zeta potential results (Figure 9) indicate that the FA2 was more stable than the FA.
3.7. BET Analysis
The comparison between the surface areas, pore volume, and pore sizes of FA, FA1, and FA2 revealed that FA before separation had the highest surface area and pore volume (Table 1). This could be attributed to the presence of many elements that were not yet separated [43]. The pore size of the FA and FA2 was almost the same, but their pore volume was different, at 0.042, and 0.024 cc/g, respectively. The FA1 had the least surface area and lowest pore volume, but it had the greatest pore size.
3.8. Antibacterial Activity Testing
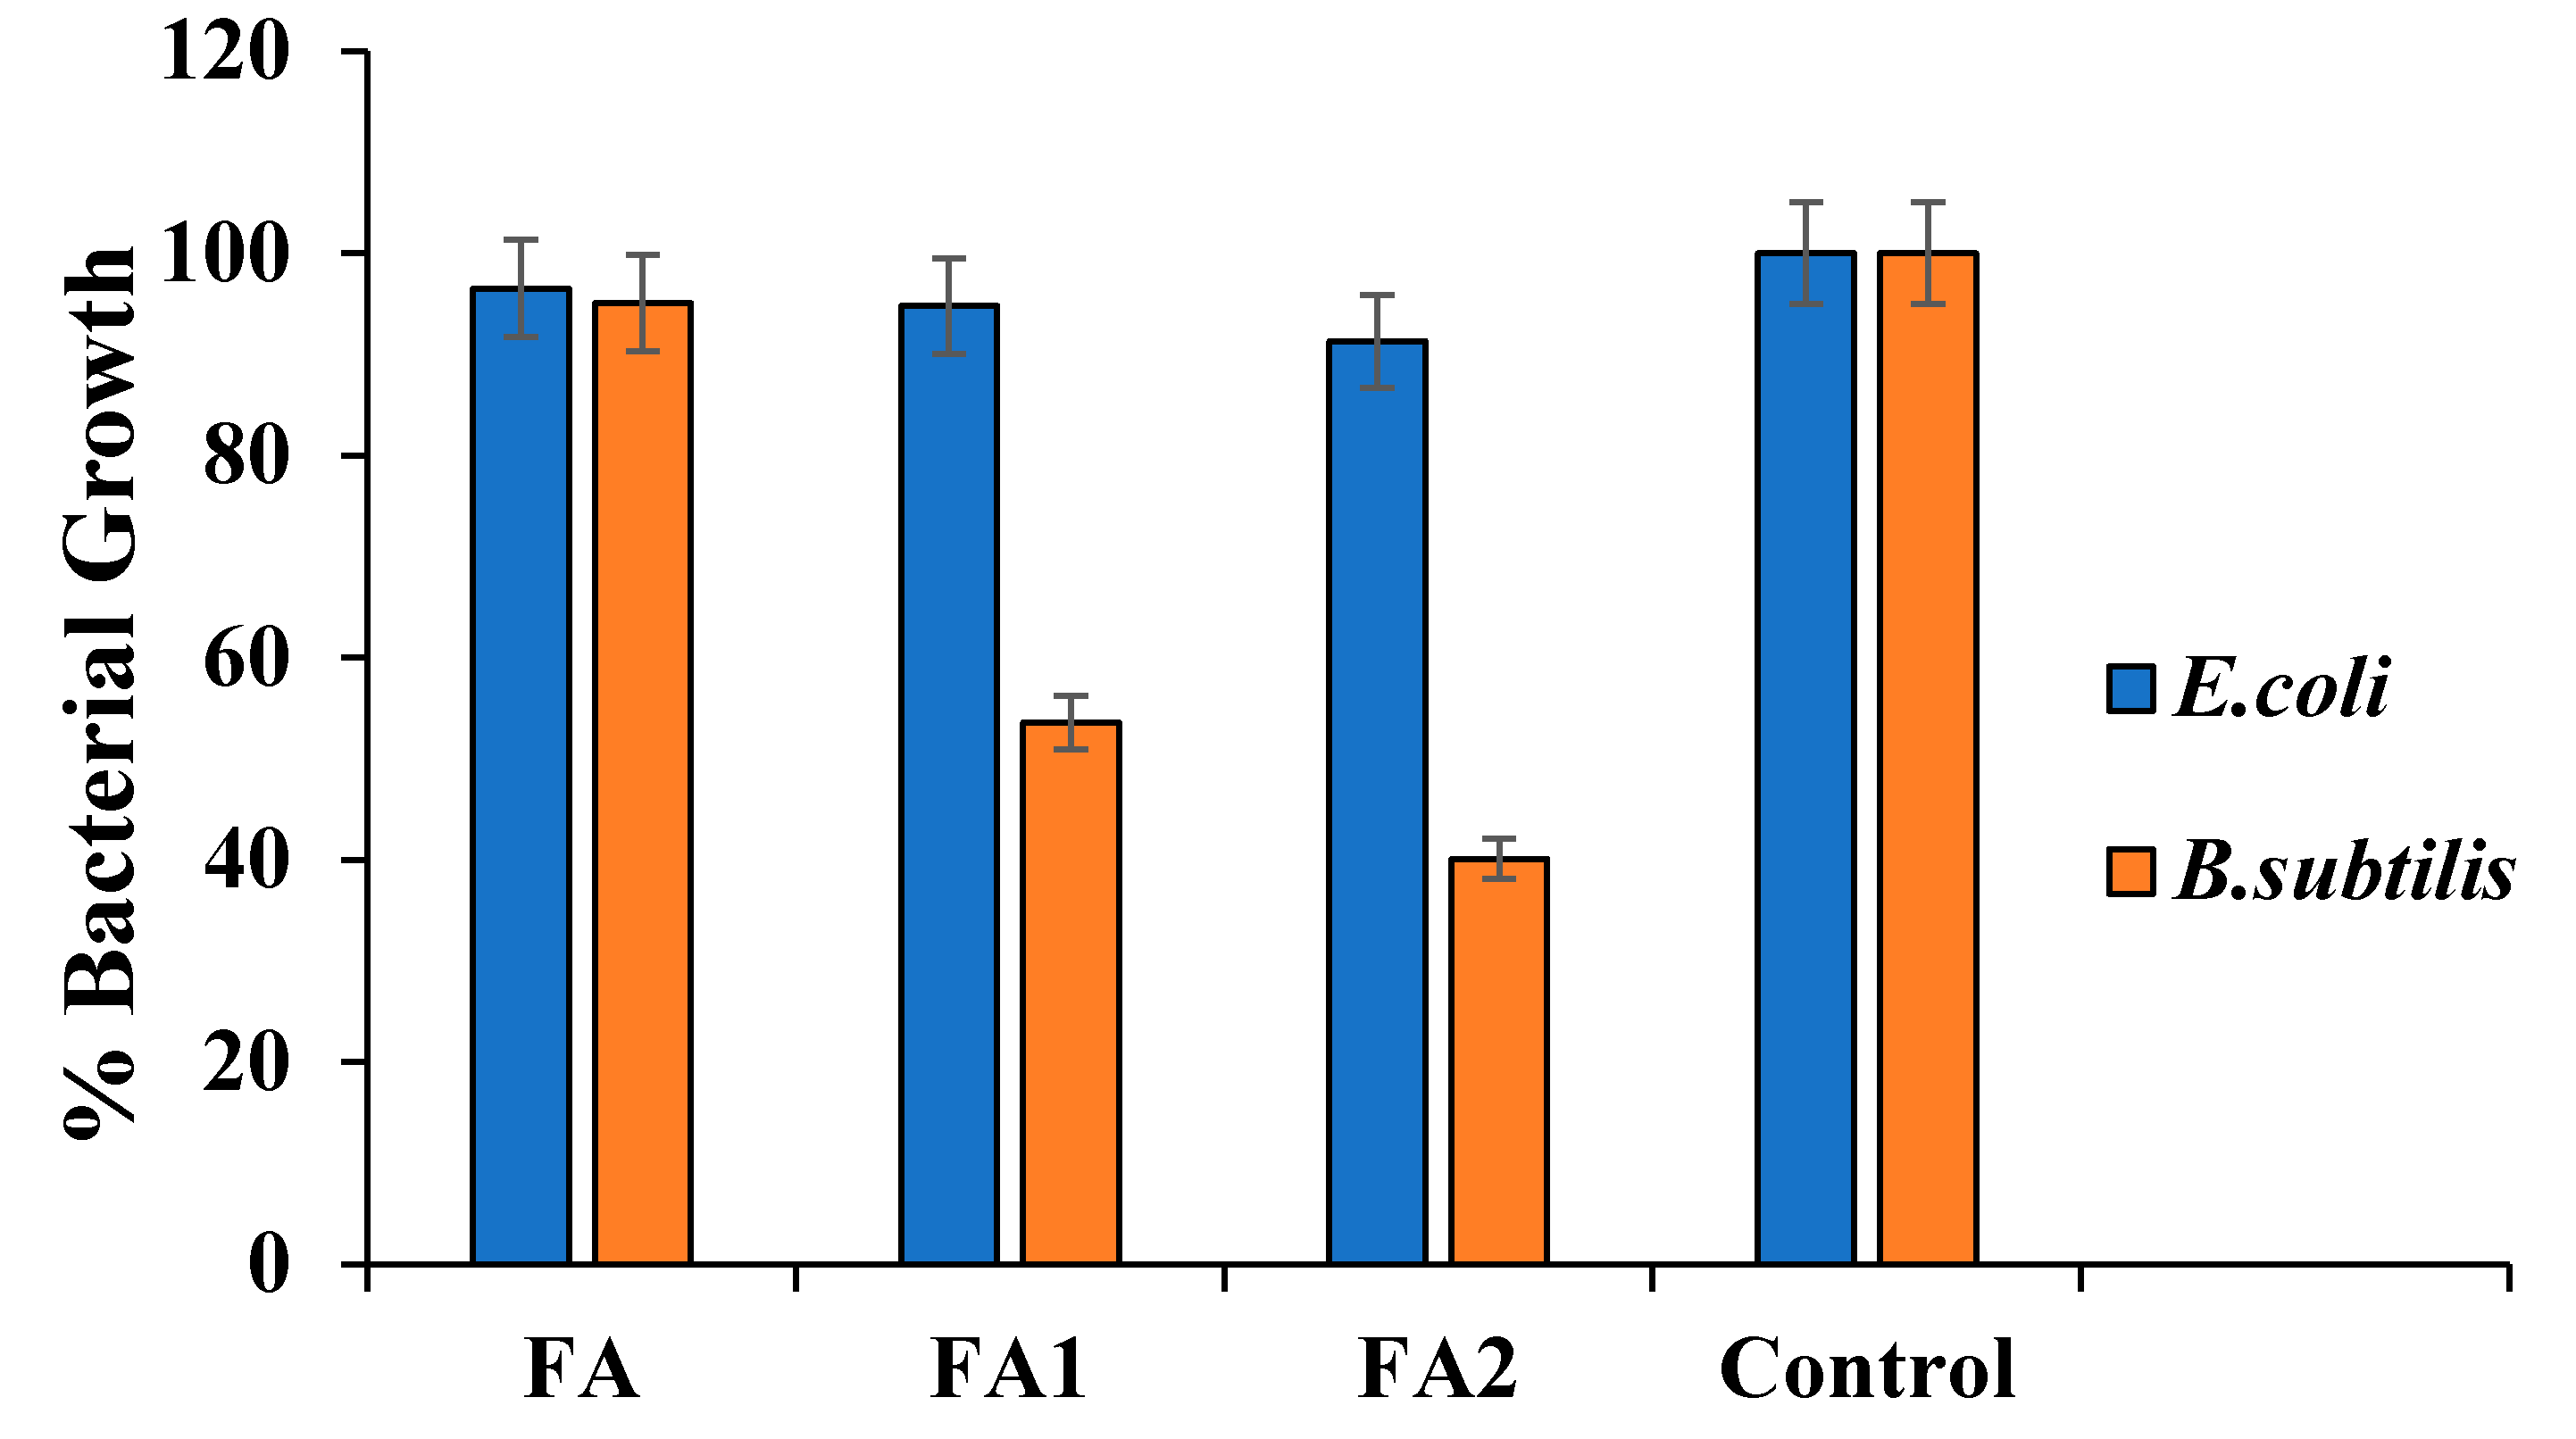
FA2 was found to be very potent against both Gram-positive (B. cereus) and Gram-negative (E. coli) bacteria, showing 59.89% and 8.72% bacterial growth reduction, respectively with only 100 mg concentration. FA2 was followed by FA1. The latter showed 46.42% and 5.22% bacterial growth reduction against B. cereus and E. coli bacteria, respectively. FA showed the least bacterial growth reduction compared to the control (bacteria without any sample), by 4.95% and 3.48% against B. cereus and E. coli bacteria, respectively (Figure 10). Results could be explained by the increase of carbon weight %, as explained in the CHNS elemental analysis, in the samples from FA, FA1, and FA2, at 83.73%, 86.08%, and 81.11%, respectively. These findings are in agreement with previous studies. Veranitisagul et al. reports that the nano-silver-coated carbon black, where the coating with carbon provides potential enhancement against E. coli and C. albicans [44]. Additionally, another research suggests that ZnS enwrapped fly ash exhibits promising antibacterial applications, and as photocatalyst for dye degradation in wastewater treatment when compared with the ZnS or fly ash alone [45]. These results offer the possibility to be an option for antimicrobial applications such as extending life time of textiles, coatings, and stain production [46,47]. The mechanism of inhibiting the bacterial growth by fly ash is not fully understood and need more investigations and research.
4. Conclusions
Fly ash particles are known to be inert and have thermal insulation characteristics, as well as good extender properties. In this work, fly ash was purified, using density gradient centrifugation to obtain high carbon weight %. The effect of centrifugation time was studied after 1 and 6 h of centrifugation, in terms of physicochemical characteristics. The results showed that carbon weight % increased from 83.73% in raw fly ash to 87.11% in fly ash after 6 h of centrifugation. The particles size distribution according to the SEM micrographs showed an increase in size from 48.53 to 52.98 µm, in FA and FA2, respectively. However, size decreased again after 6 h of centrifugation, to 49.44 µm. Moreover, the particles size distribution, using dynamic laser scattering, was polydispersed in FA, but, in FA1 and FA2, it turned to monodispersed. The zeta potential results explained the instability of particle size, showing a decrease from 13.5 mV in FA to −26.2 mV in FA2. Additionally, the antibacterial activity of FA, FA1, and FA2 was evaluated against E. coli and B. cereus. The results revealed that extending the centrifugation time to 6 h in the FA2 sample was potent to both bacterial cells, by reducing bacterial growth to 59.89% in B. cereus and 8.72% in E. coli, as compared to the raw fly ash. However, the specific mechanism that governs the antibacterial activity of fly ash particles and their purification needs to be investigated more and better understood.
Author Contributions
Conceptualization, S.A.; Data curation, N.H.M.; Project administration, S.A.; Resources, S.A.; Supervision, S.A.; Visualization, S.A.; Writing—original draft, N.H.M.; Writing—review & editing, S.A. All authors have read and agreed to the published version of the manuscript.
Funding
This research received no external funding.
Acknowledgments
The authors would like to thank the financial support from Researchers Supporting Project number (RSP-2020/195), King Saud University, Riyadh, Saudi Arabia.
Conflicts of Interest
The authors declare no conflict of interest.
References
- Dai, S.; Zhao, L.; Peng, S.; Chou, C.-L.; Wang, X.; Zhang, Y.; Li, D.; Sun, Y. Abundances and distribution of minerals and elements in high-alumina coal fly ash from the Jungar Power Plant, Inner Mongolia, China. Int. J. Coal Geol. 2010, 81, 320–332. [Google Scholar] [CrossRef]
- Hower, J.C.; Groppo, J.G.; Graham, U.M.; Ward, C.R.; Kostova, I.J.; Maroto-Valer, M.M.; Dai, S. Coal-derived unburned carbons in fly ash: A review. Int. J. Coal Geol. 2017, 179, 11–27. [Google Scholar] [CrossRef]
- Vassilev, S.V.; Vassileva, C.G. A new approach for the classification of coal fly ashes based on their origin, composition, properties, and behaviour. Fuel 2007, 86, 1490–1512. [Google Scholar] [CrossRef]
- Altun, N.E.; Xiao, C.; Hwang, J.-Y. Separation of unburned carbon from fly ash using a concurrent flotation column. Fuel Process. Technol. 2009, 90, 1464–1470. [Google Scholar] [CrossRef]
- American Coal Ash Association. Fly Ash Production and Use with Percent. Available online: https://www.acaa-usa.org/ (accessed on 13 November 2018).
- GlobeNewswire. Fly Ash Market to Reach USD 6.86 Billion by 2026|Reports and Data. Available online: https://www.globenewswire.com/news-release/2019/08/27/1907318/0/en/Fly-Ash-Market-To-Reach-USD-6-86-Billion-By-2026-Reports-And-Data.html (accessed on 27 August 2019).
- Maroto-Valer, M.; Taulbee, D.; Hower, J. Characterization of differing forms of unburned carbon present in fly ash separated by density gradient centrifugation. Fuel 2001, 80, 795–800. [Google Scholar] [CrossRef]
- Manz, O. Worldwide production of coal ash and utilization in concrete and other products. Fuel 1997, 76, 691–696. [Google Scholar] [CrossRef]
- Maroto-Valer, M.M.; Taulbee, D.N.; Schobert, H.H.; Hower, J.C.; Andersen, J. Use of unburned carbon in fly ash as precursor for the development of activated carbons. In Proceedings of the International Ash Utilization Symposium, Lexington, KY, USA, 18–20 October 1999; Paper. University of Kentucky, Center for Applied Energy Research: Lexington, KY, USA, 1999. [Google Scholar]
- Page, A.; Elseewi, A.A.; Straughan, I. Physical and chemical properties of fly ash from coal-fired power plants with reference to environmental impacts. In Residue Reviews; Springer: Berlin/Heidelberg, Germany, 1979; pp. 83–120. [Google Scholar]
- Ghio, A.J.; Silbajoris, R.; Carson, J.L.; Samet, J.M. Biologic effects of oil fly ash. Environ. Health Perspect. 2002, 110, 89–94. [Google Scholar] [CrossRef] [Green Version]
- Styszko-Grochowiak, K.; Gołaś, J.; Jankowski, H.; Koziński, S. Characterization of the coal fly ash for the purpose of improvement of industrial on-line measurement of unburned carbon content. Fuel 2004, 83, 1847–1853. [Google Scholar] [CrossRef]
- Batra, V.S.; Varghese, A.R.; Vashisht, P.; Balakrishnan, M. Value-added products from unburned carbon in bagasse fly ash. Asia-Pac. J. Chem. Eng. 2011, 6, 787–793. [Google Scholar] [CrossRef]
- Gray, T.; Perry, M.; Conrad, P. Management of Coal Waste Disposal for Reduced Environmental Impacts and for Increased Profits. In Preprints-Society of Mining Engineers of Aime; ACAA: Santa Cruz, CA, USA, 1994. [Google Scholar]
- Nayak, A.; Raja, R.; Rao, K.; Shukla, A.; Mohanty, S.; Shahid, M.; Tripathi, R.; Panda, B.; Bhattacharyya, P.; Kumar, A. Effect of fly ash application on soil microbial response and heavy metal accumulation in soil and rice plant. Ecotoxicol. Environ. Saf. 2015, 114, 257–262. [Google Scholar] [CrossRef]
- Cardoso, A.M.; Paprocki, A.; Ferret, L.S.; Azevedo, C.M.; Pires, M. Synthesis of zeolite Na-P1 under mild conditions using Brazilian coal fly ash and its application in wastewater treatment. Fuel 2015, 139, 59–67. [Google Scholar] [CrossRef]
- Meer, I.; Nazir, R. Removal techniques for heavy metals from fly ash. J. Mater. Cycles Waste Manag. 2018, 20, 703–722. [Google Scholar] [CrossRef]
- Mohebbi, M.; Rajabipour, F.; Scheetz, B.E. Reliability of loss on ignition (LOI) test for determining the unburned carbon content in fly ash. In Proceedings of the World of Coal Ash Conference (WOCA), Nashville, TN, USA, 4–7 May 2015; pp. 5–7. [Google Scholar]
- Cobo, M.; Gálvez, A.; Conesa, J.A.; de Correa, C.M. Characterization of fly ash from a hazardous waste incinerator in Medellin, Colombia. J. Hazard. Mater. 2009, 168, 1223–1232. [Google Scholar] [CrossRef] [PubMed]
- Biesinger, M.C.; Payne, B.P.; Grosvenor, A.P.; Lau, L.W.; Gerson, A.R.; Smart, R.S.C. Resolving surface chemical states in XPS analysis of first row transition metals, oxides and hydroxides: Cr, Mn, Fe, Co and Ni. Appl. Surf. Sci. 2011, 257, 2717–2730. [Google Scholar] [CrossRef]
- De Salamanca, A.E.; Diebold, Y.; Calonge, M.; García-Vazquez, C.; Callejo, S.; Vila, A.; Alonso, M.J. Chitosan nanoparticles as a potential drug delivery system for the ocular surface: Toxicity, uptake mechanism and in vivo tolerance. Investig. Ophthalmol. Vis. Sci. 2006, 47, 1416–1425. [Google Scholar] [CrossRef]
- Cohen, S.; Bernstein, H. Microparticulate Systems for the Delivery of Proteins and Vaccines; CRC Press: Boca Raton, FL, USA, 1996; Volume 77. [Google Scholar]
- Klančnik, A.; Piskernik, S.; Jeršek, B.; Možina, S.S.J. Evaluation of diffusion and dilution methods to determine the antibacterial activity of plant extracts. J. Microbiol. Methods 2010, 81, 121–126. [Google Scholar] [CrossRef]
- Hower, J.C. Petrographic examination of coal-combustion fly ash. Int. J. Coal Geol. 2012, 92, 90–97. [Google Scholar] [CrossRef]
- Borowski, G. Using Vitrification for Sewage Sludge Combustion Ash Disposal. Pol. J. Environ. Stud. 2015, 24, 1889–1896. [Google Scholar] [CrossRef]
- French, D.; Smitham, J. Fly Ash Characteristics and Feed Coal Properties; QCAT Technology Transfer Centre: Queensland, Australia, 2007. [Google Scholar]
- Sahu, P. Characterization of Coal Combustion by-Products (ccbs) for Their Effective Management and Utilization. Ph.D. Thesis, National Institutes of Technology, Rourkela, India, 2010. [Google Scholar]
- Lassner, E.; Schubert, W.D.; Lüderitz, E.; Wolf, H.U. Tungsten, tungsten alloys, and tungsten compounds. In Ullmann’s Encyclopedia of Industrial Chemistry; VCH: Weinheim, Germany, 2000. [Google Scholar]
- Bilodeau, A.; Sivasundaram, V.; Painter, K.; Malhotra, V. Durability of concrete incorporating high volumes of fly ash from sources in the USA. Mater. J. 1994, 91, 3–12. [Google Scholar]
- Chen, H.-J.; Shih, N.-H.; Wu, C.-H.; Lin, S.-K. Effects of the Loss on Ignition of Fly Ash on the Properties of High-Volume Fly Ash Concrete. Sustainability 2019, 11, 2704. [Google Scholar] [CrossRef] [Green Version]
- Hahn, A.; Vogel, H.; Andó, S.; Garzanti, E.; Kuhn, G.; Lantzsch, H.; Schüürman, J.; Vogt, C.; Zabel, M. Using Fourier transform infrared spectroscopy to determine mineral phases in sediments. Sediment. Geol. 2018, 375, 27–35. [Google Scholar] [CrossRef]
- Mozgawa, W.; Król, M.; Dyczek, J.; Deja, J. Investigation of the coal fly ashes using IR spectroscopy. Spectrochim. Acta Part A Mol. Biomol. Spectrosc. 2014, 132, 889–894. [Google Scholar] [CrossRef] [PubMed]
- Mollah, M.Y.A.; Hess, T.R.; Cocke, D.L. Surface and bulk studies of leached and unleached fly ash using XPS, SEM, EDS and FTIR techniques. Cement Concr. Res. 1994, 24, 109–118. [Google Scholar] [CrossRef]
- Saikia, B.; Parthasarathy, G.; Sarmah, N.; Baruah, G. Fourier-transform infrared spectroscopic characterization of naturally occurring glassy fulgurites. Bull. Mater. Sci. 2008, 31, 155–158. [Google Scholar] [CrossRef] [Green Version]
- Socrates, G. Infrared and Raman Characteristic Group Frequencies, 3rd ed.; John Wiley & Sons: Hoboken, NJ, USA, 2001. [Google Scholar]
- Matrajt, G.; Borg, J.; Raynal, P.; Djouadi, Z.; d’Hendecourt, L.; Flynn, G.; Deboffle, D. FTIR and Raman analyses of the Tagish Lake meteorite: Relationship with the aliphatic hydrocarbons observed in the diffuse interstellar medium. Astron. Astrophys. 2004, 416, 983–990. [Google Scholar] [CrossRef]
- Langford, H.; Hodson, A.; Banwart, S. Using FTIR spectroscopy to characterise the soil mineralogy and geochemistry of cryoconite from Aldegondabreen glacier, Svalbard. Appl. Geochem. 2011, 26, S206–S209. [Google Scholar] [CrossRef]
- Katara, S.; Kabra, S.; Sharma, A.; Hada, R.; Rani, A. Surface modification of fly ash by thermal activation: A DR/FTIR study. Int. Res. J. Pure Appl. Chem. 2013, 3, 299–307. [Google Scholar] [CrossRef]
- Girgis, B.S.; Temerk, Y.M.; Gadelrab, M.M.; Abdullah, I.D. X-ray diffraction patterns of activated carbons prepared under various conditions. Carbon Lett. 2007, 8, 95–100. [Google Scholar] [CrossRef] [Green Version]
- Bhagath Singh, G.; Subramaniam, K.V.L. Direct decomposition X-ray diffraction method for amorphous phase quantification and glassy phase determination in binary blends of siliceous fly ash and hydrated cement. J. Sustain. Cem. Based Mater. 2017, 6, 111–125. [Google Scholar] [CrossRef]
- Stanmore, B. The formation of dioxins in combustion systems. Combust. Flame 2004, 136, 398–427. [Google Scholar] [CrossRef]
- Liu, H.; Sun, Q.; Wang, B.; Wang, P.; Zou, J. Morphology and composition of microspheres in fly ash from the Luohuang Power Plant, Chongqing, Southwestern China. Minerals 2016, 6, 30. [Google Scholar] [CrossRef] [Green Version]
- Bergna, D.; Varila, T.; Romar, H.; Lassi, U. Comparison of the properties of activated carbons produced in one-stage and two-stage processes. C J. Carbon Res. 2018, 4, 41. [Google Scholar] [CrossRef] [Green Version]
- Veranitisagul, C.; Wattanathana, W.; Wannapaiboon, S.; Hanlumyuang, Y.; Sukthavorn, K.; Nootsuwan, N.; Chotiwan, S.; Phuthong, W.; Jongrungruangchok, S.; Laobuthee, A. Antimicrobial, Conductive, and Mechanical Properties of AgCB/PBS Composite System. J. Chem. 2019, 2019, 3487529. [Google Scholar] [CrossRef]
- Kalpana, K.; Selvaraj, V.J.R.A. Photodegradation and antibacterial studies of ZnS enwrapped fly ash nanocomposite for multipurpose industrial applications. RSC Adv. 2015, 5, 47766–47777. [Google Scholar] [CrossRef]
- Kugel, A.; Stafslien, S.; Chisholm, B.J. Antimicrobial coatings produced by “tethering” biocides to the coating matrix: A comprehensive review. Prog. Org. Coat. 2011, 72, 222–252. [Google Scholar] [CrossRef]
- Rubin, C.A.; Rubin, R.B.; Bullock, K. Water-Resistant and Stain-Resistant, Antimicrobial Treated Textile Fabric. U.S. Patent 6024823A, 15 February 2000. [Google Scholar]
Figure 1.
(A–C) The appearance of fly ash after determining the moisture content (left) and ash content (right), where (A) FA, (B) FA1, and (C) FA2; (D) % moisture content, and (E) loss-of-ignition %. Results were expressed as average arithmetic mean. Error bars represent ±SD where n ≥ 3.
Figure 1.
(A–C) The appearance of fly ash after determining the moisture content (left) and ash content (right), where (A) FA, (B) FA1, and (C) FA2; (D) % moisture content, and (E) loss-of-ignition %. Results were expressed as average arithmetic mean. Error bars represent ±SD where n ≥ 3.

Figure 2.
Fourier transform infrared spectroscopy (FTIR) analysis for (A) FA (raw fly ash), (B) FA1 (fly ash purification after 1 h of centrifugation), and (C) FA2 (fly ash purification after 6 h of centrifugation).
Figure 2.
Fourier transform infrared spectroscopy (FTIR) analysis for (A) FA (raw fly ash), (B) FA1 (fly ash purification after 1 h of centrifugation), and (C) FA2 (fly ash purification after 6 h of centrifugation).

Figure 3.
X-ray photoelectron spectroscopy (XPS) for (A) FA (raw fly ash), (B) FA1 (fly ash purification after 1 h of centrifugation), and (C) FA2 (fly ash purification after 6 h of centrifugation).
Figure 3.
X-ray photoelectron spectroscopy (XPS) for (A) FA (raw fly ash), (B) FA1 (fly ash purification after 1 h of centrifugation), and (C) FA2 (fly ash purification after 6 h of centrifugation).

Figure 4.
X-ray diffraction (XRD) pattern for (A) FA (raw fly ash), (B) FA1 (fly ash purification after 1 h of centrifugation), and (C) FA2 (fly ash purification after 6 h of centrifugation).
Figure 4.
X-ray diffraction (XRD) pattern for (A) FA (raw fly ash), (B) FA1 (fly ash purification after 1 h of centrifugation), and (C) FA2 (fly ash purification after 6 h of centrifugation).

Figure 5.
Energy-dispersive X-ray analyzer (EDXA), showing the compositions of the samples for (A) FA (raw fly ash), (B) FA1 (fly ash purification after 1 h of centrifugation), and (C) FA2 (fly ash purification after 6 h of centrifugation). Results were expressed as average arithmetic mean. Error bars represent ±SD where n ≥ 3.

Figure 6.
Scanning electron microscope (SEM) morphological examination for (A) FA (raw fly ash), (B) FA1 (fly ash purification after 1 h of centrifugation), and (C) FA2 (fly ash purification after 6 h of centrifugation). Left images’ magnification is 100 µm and the two small images on the right have a magnification of 10 µm.

Figure 7.
The particle size distribution difference between the three fly ash samples in µm, using ImageJ©, where (FA) raw fly ash, (FA1) fly ash after 1-h centrifugation, and (FA2) fly ash after 6-h centrifugation. Results were expressed as average arithmetic mean. Error bars represent ±SD where n ≥ 50.

Figure 8.
Particle size distribution for (A) FA (raw fly ash), (B) FA1 (fly ash purification after 1 h of centrifugation), and (C) FA2 (fly ash purification after 6 h of centrifugation).
Figure 8.
Particle size distribution for (A) FA (raw fly ash), (B) FA1 (fly ash purification after 1 h of centrifugation), and (C) FA2 (fly ash purification after 6 h of centrifugation).

Figure 9.
Zeta potential for (A) FA (raw fly ash), (B) FA1 (fly ash purification after 1 h of centrifugation), and (C) FA2 (fly ash purification after 6 h of centrifugation).
Figure 9.
Zeta potential for (A) FA (raw fly ash), (B) FA1 (fly ash purification after 1 h of centrifugation), and (C) FA2 (fly ash purification after 6 h of centrifugation).

Figure 10.
Bacterial growth % of FA, FA1, and FA2 against Gram-positive and Gram-negative bacterial strains. Results were expressed in average arithmetic mean. Error bars represent ±SD where n ≥ 6.
Figure 10.
Bacterial growth % of FA, FA1, and FA2 against Gram-positive and Gram-negative bacterial strains. Results were expressed in average arithmetic mean. Error bars represent ±SD where n ≥ 6.


Table 1.
Physicochemical characterization: carbon, hydrogen, nitrogen, and sulfur (CHNS) elemental analysis, BET analysis, and the atomic % of the elements by XPS analysis for fly ash samples (FA, FA1, and FA2).
Table 1.
Physicochemical characterization: carbon, hydrogen, nitrogen, and sulfur (CHNS) elemental analysis, BET analysis, and the atomic % of the elements by XPS analysis for fly ash samples (FA, FA1, and FA2).
| Physicochemical Characterization | FA | FA1 | FA2 | |
|---|---|---|---|---|
| CHNS | % Carbon | 82.1 | 83.5 | 88.9 |
| % Hydrogen | 3.2 | 3.8 | 3.1 | |
| % Nitrogen | 0.8 | 0.9 | 0.6 | |
| % Sulfur | 7.1 | 6.9 | 6.9 | |
| BET | BET Surface area (m2/g) | 35.6 | 8.75 | 20.73 |
| Pore Volume (cc/g) | 0.042 | 0.012 | 0.024 | |
| Pore Size (A°) | 46.99 | 70.10 | 46.59 | |
| XPS(Atomic % of the elements) | C1s | 60.66 | 66.81 | 84.36 |
| O1s | 21.22 | 18.46 | 12.03 | |
| S2p | 5.66 | 1.64 | 1.34 | |
| V2p | 8 | 0 | 0 | |
| Na1s | 0 | 8.04 | 2.26 | |
| Ca2p | 0.41 | 0 | 0 | |
| Mg1s | 0.83 | 0 | 0 | |
Publisher’s Note: MDPI stays neutral with regard to jurisdictional claims in published maps and institutional affiliations. |
© 2020 by the authors. Licensee MDPI, Basel, Switzerland. This article is an open access article distributed under the terms and conditions of the Creative Commons Attribution (CC BY) license (http://creativecommons.org/licenses/by/4.0/).
Share and Cite
MDPI and ACS Style
Alterary, S.; Marei, N.H. The Impact of Coal Fly Ash Purification on Its Antibacterial Activity. Minerals 2020, 10, 1002. https://0-doi-org.brum.beds.ac.uk/10.3390/min10111002
AMA Style
Alterary S, Marei NH. The Impact of Coal Fly Ash Purification on Its Antibacterial Activity. Minerals. 2020; 10(11):1002. https://0-doi-org.brum.beds.ac.uk/10.3390/min10111002
Chicago/Turabian StyleAlterary, Seham, and Narguess H. Marei. 2020. "The Impact of Coal Fly Ash Purification on Its Antibacterial Activity" Minerals 10, no. 11: 1002. https://0-doi-org.brum.beds.ac.uk/10.3390/min10111002
Note that from the first issue of 2016, this journal uses article numbers instead of page numbers. See further details here.