Geochemical Features of Redox-Sensitive Trace Metals in Sediments under Oxygen-Depleted Marine Environments

 ,
,  and
and 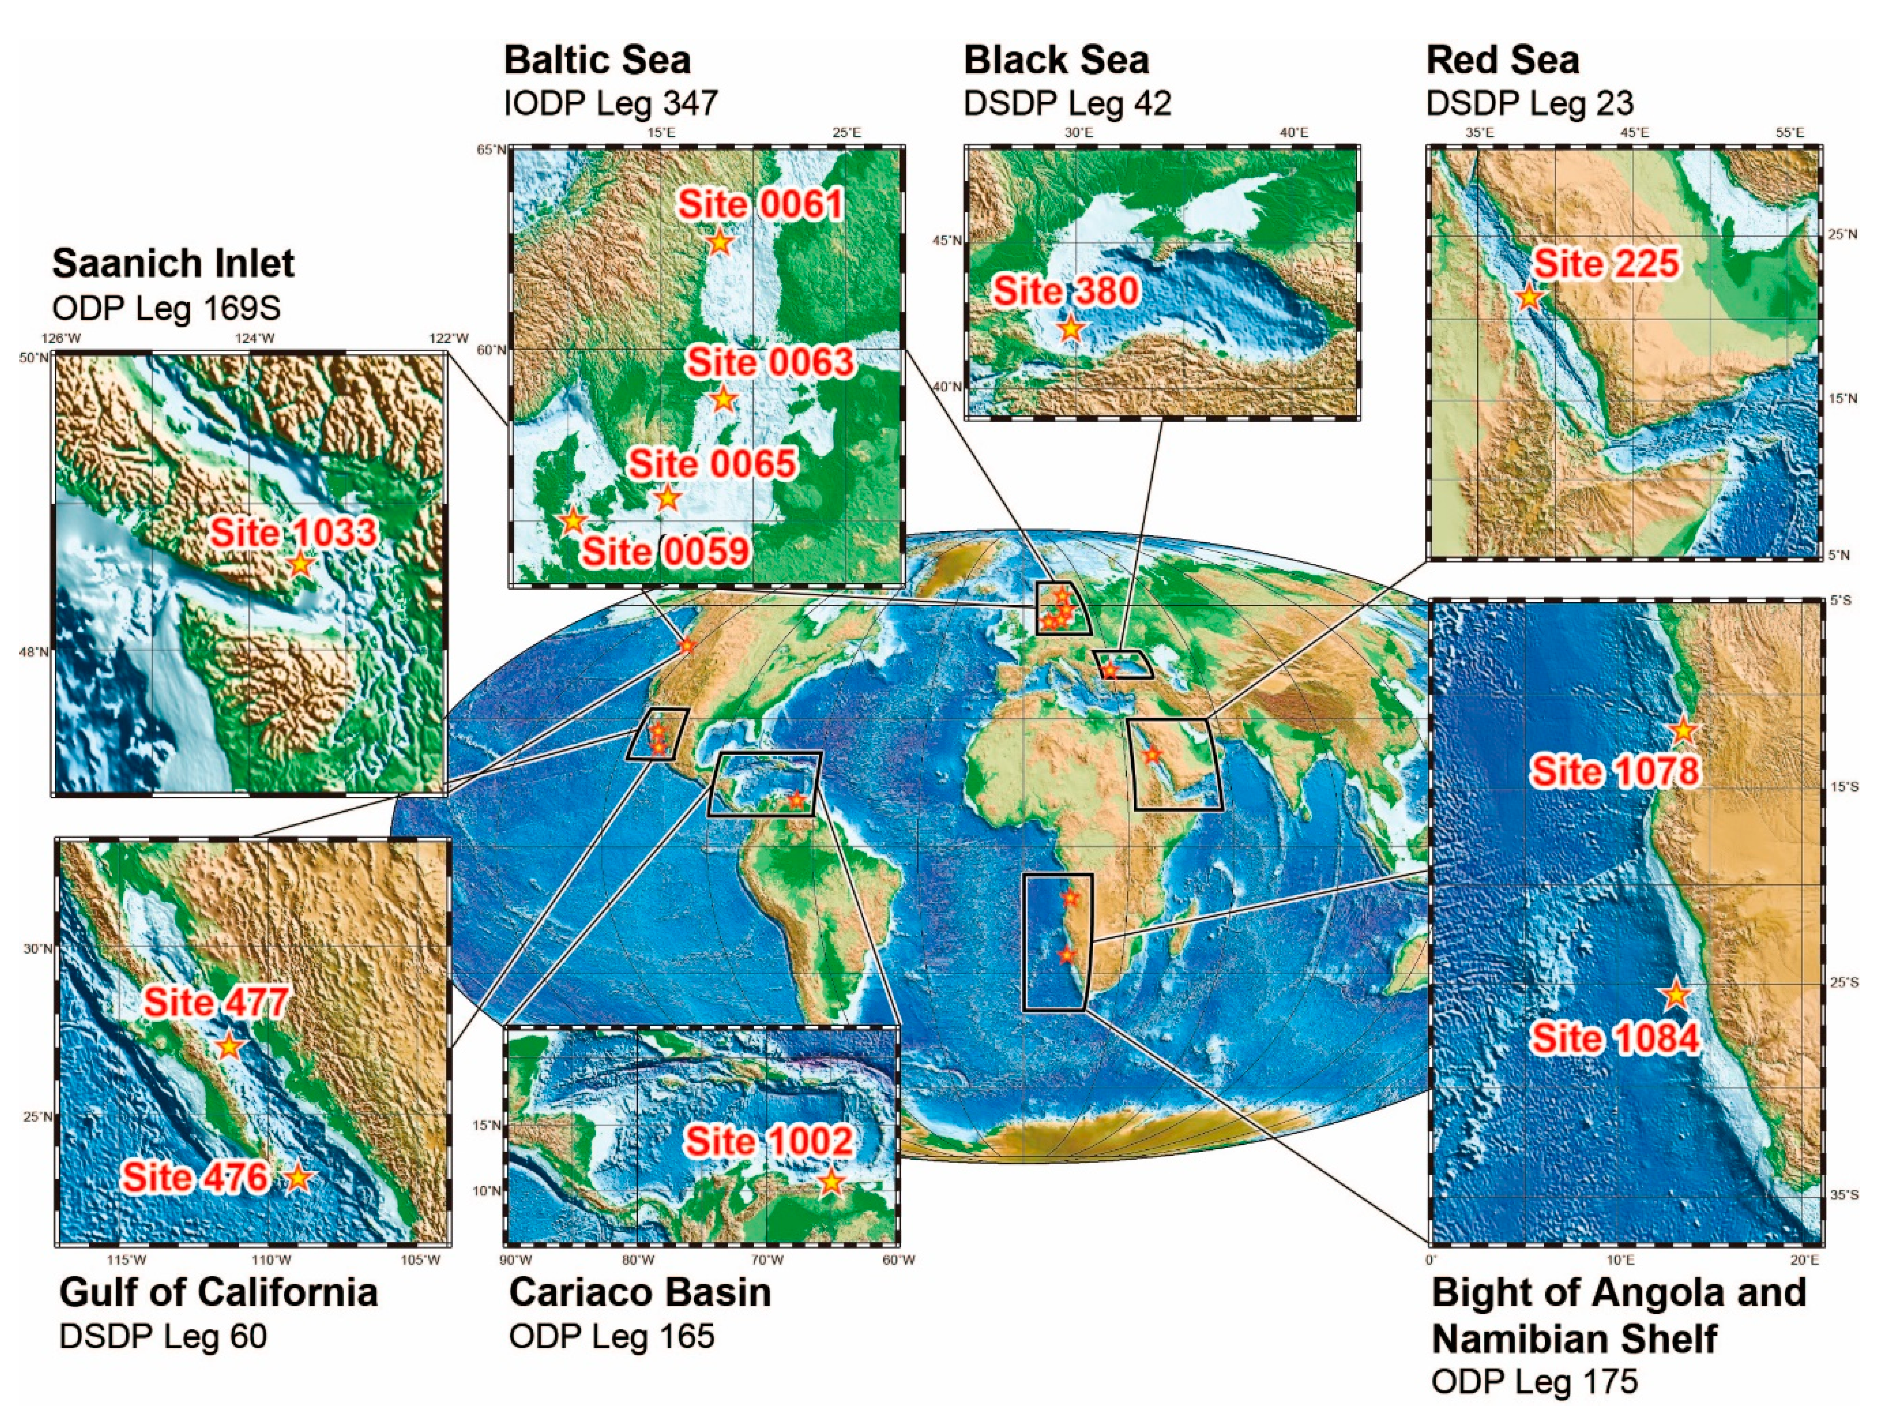
Abstract
:1. Introduction
2. Materials and Methods
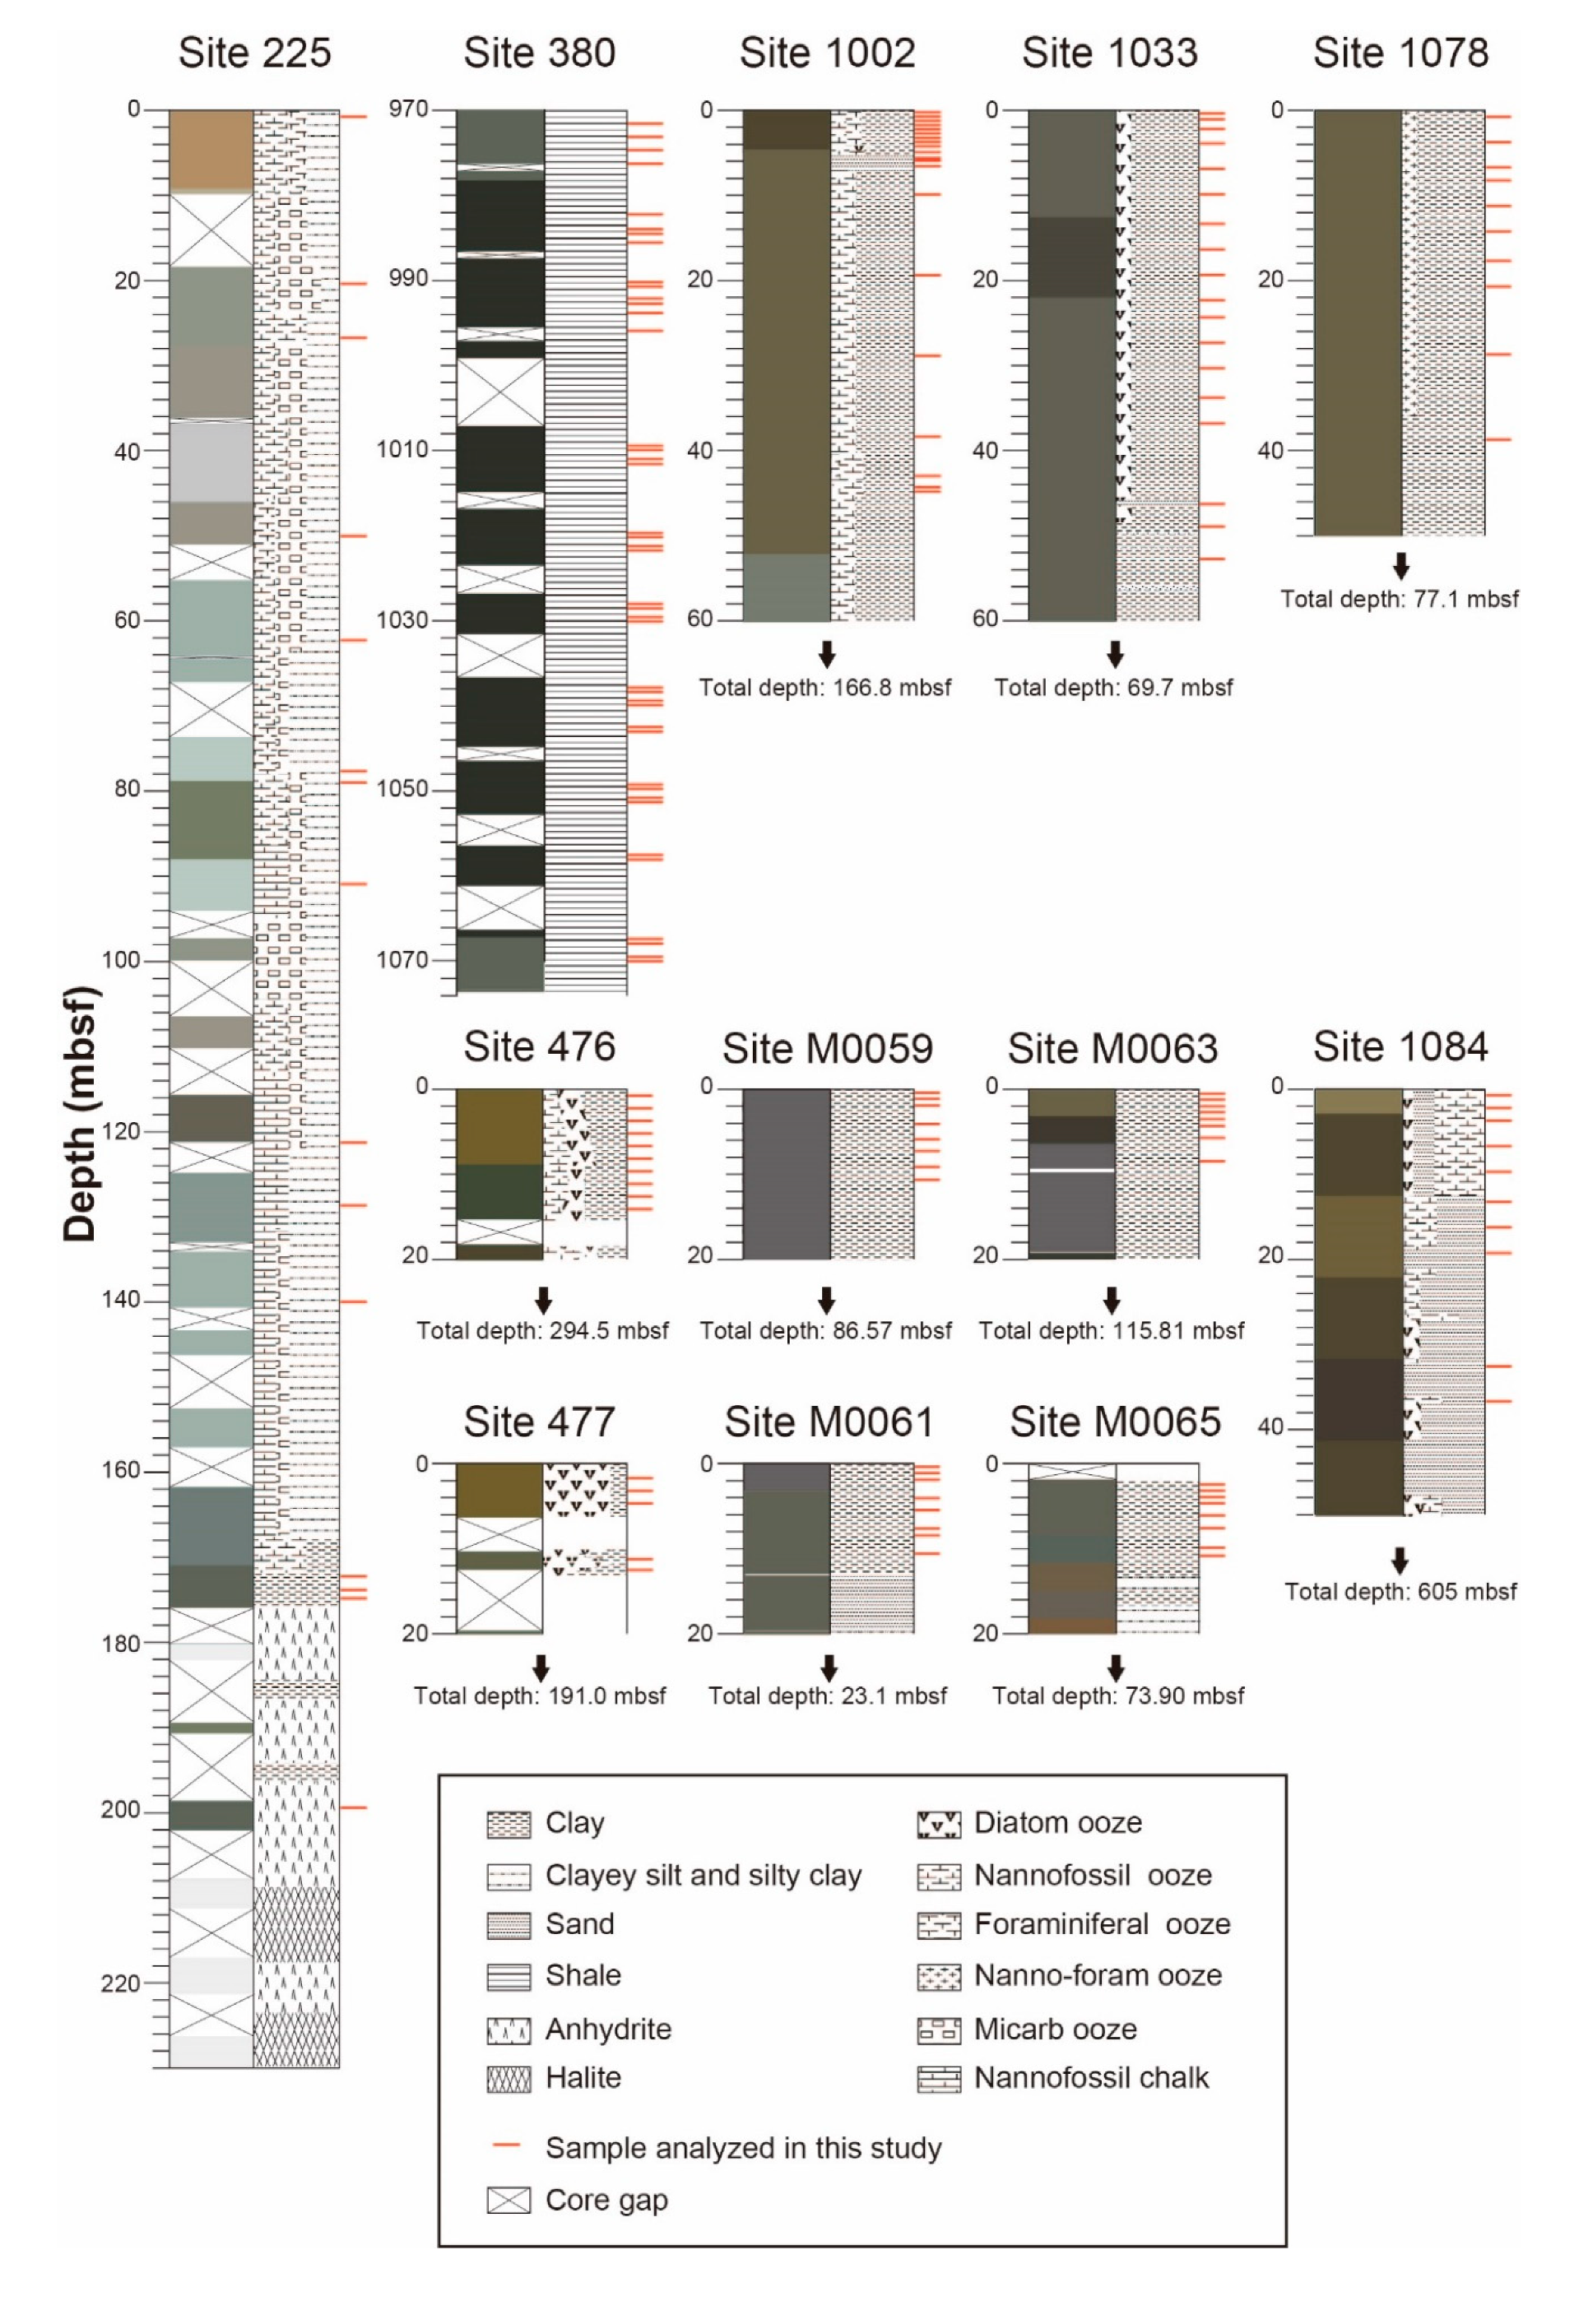
2.1. Geological Settings and Samples
2.2. Sample Processing and Analytical Methods
3. Results and Discussion
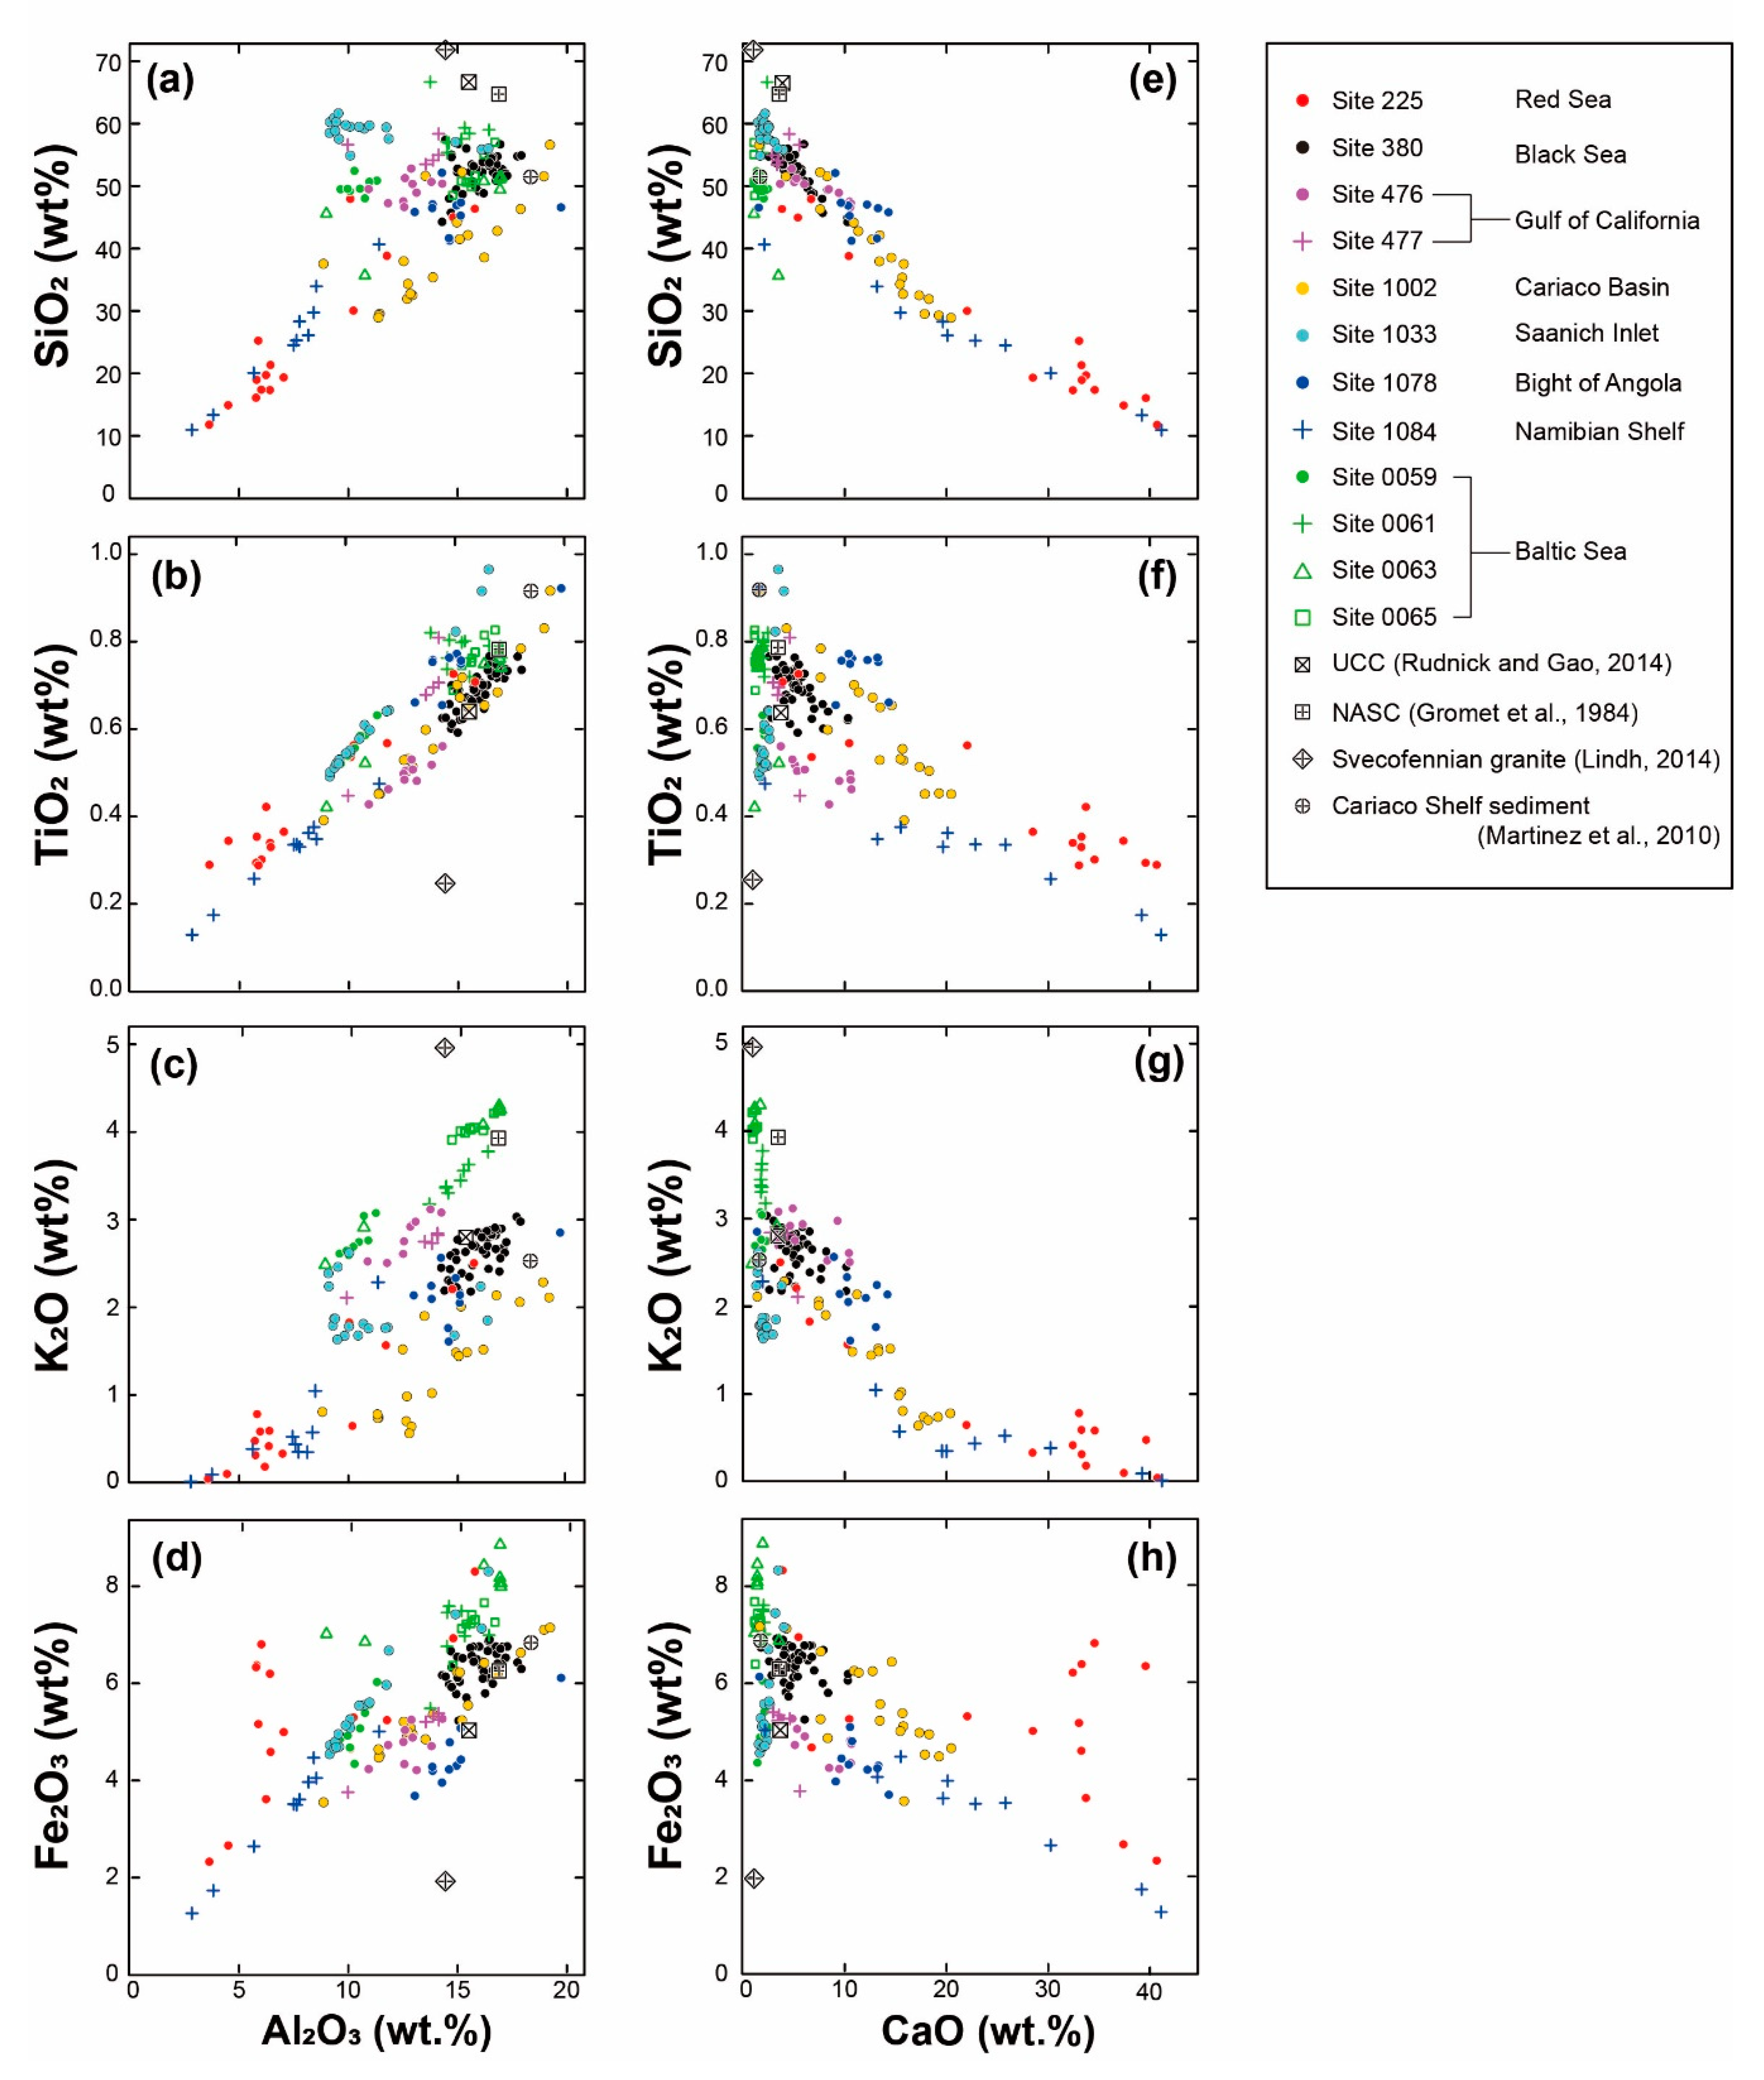
3.1. Geochemical Features of the Sediments Suggested by Major Elements
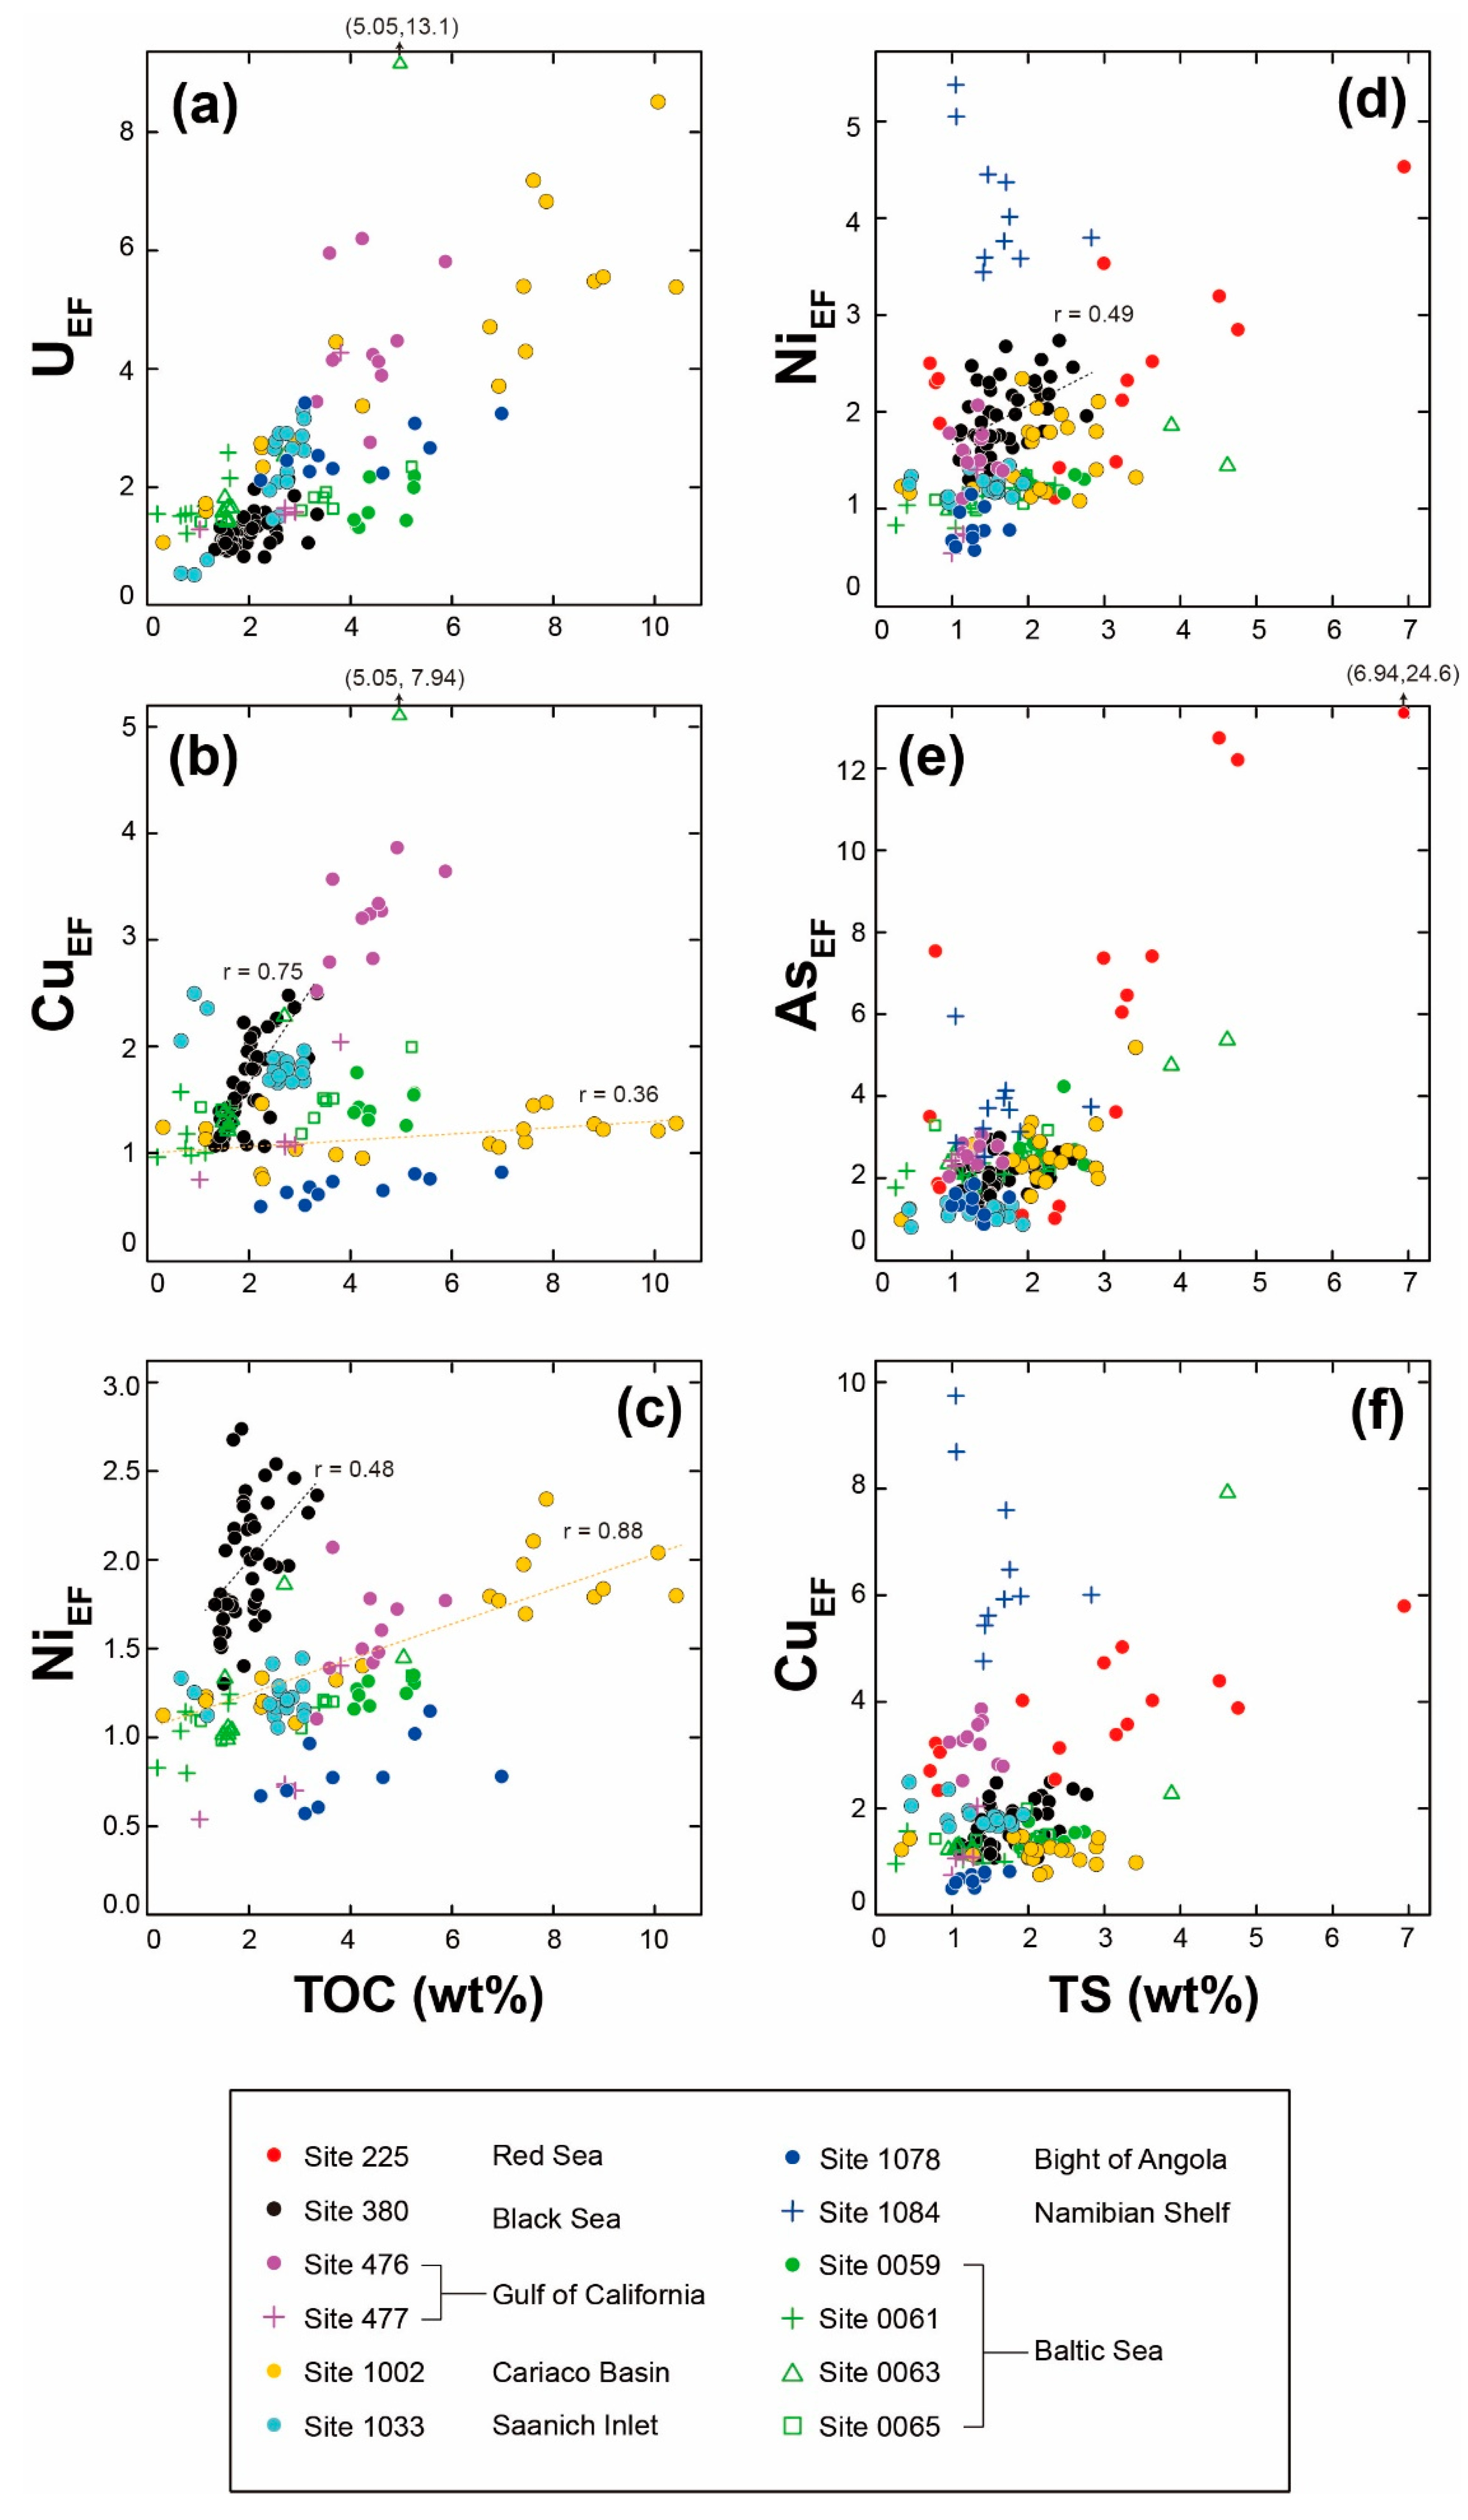
3.2. Relationships between Concentrations of Trace Elements, Total Organic Carbon, and Total Sulfur
3.3. Characteristics of Enrichment Factors for Redox Sensitive Elements
3.4. Variation of Enrichment Factors for Mo–U (MoEF–UEF) and Geographical Conditions
4. Conclusions
Supplementary Materials
Author Contributions
Funding
Acknowledgments
Conflicts of Interest
References
- Vine, J.D.; Tourtelot, E.B. Geochemistry of black shale deposits—A summary report. Econ. Geol. 1970, 65, 253–272. [Google Scholar] [CrossRef]
- Calvert, S.E.; Pedersen, T.F. Geochemistry of Recent oxic and anoxic marine sediments: Implications for the geological record. Mar. Geol. 1993, 113, 67–88. [Google Scholar] [CrossRef]
- Crusius, J.; Calve, S.; Pedersen, T.; Sage, D. Rhenium and molybdenum enrichments in sediments as indicators of oxic, suboxic and sulfidic conditions of deposition. Earth Planet. Sci. Lett. 1996, 145, 65–78. [Google Scholar] [CrossRef]
- Algeo, T.J.; Maynard, J.B. Trace-element behavior and redox facies in core shales of Upper Pennsylvanian Kansas-type cyclothems. Chem. Geol. 2004, 206, 289–318. [Google Scholar] [CrossRef]
- Tribovillard, N.; Algeo, T.J.; Lyons, T.; Riboulleau, A. Trace metals as paleoredox and paleoproductivity proxies: An update. Chem. Geol. 2006, 232, 12–32. [Google Scholar] [CrossRef]
- Rimmer, S.M. Geochemical paleoredox indicators in Devonian—Mississippian black shales, Central Appalachian Basin (USA). Chem. Geol. 2004, 206, 373–391. [Google Scholar] [CrossRef]
- Ocubalidet, S.G.; Rimmer, S.M.; Conder, J.A. Redox conditions associated with organic carbon accumulation in the Late Devonian New Albany Shale, west-central Kentucky, Illinois Basin. Int. J. Coal Geol. 2018, 190, 42–55. [Google Scholar] [CrossRef]
- Algeo, T.J. Can marine anoxic events draw down the trace element inventory of seawater? Geology 2004, 32, 1057–1060. [Google Scholar] [CrossRef] [Green Version]
- Xiang, L.; Zhang, H.; Schoepfer, S.D.; Cao, C.-Q.; Zheng, Q.-F.; Yuan, D.-X.; Cai, Y.-F.; Shen, S.-Z. Oceanic redox evolution around the end-Permian mass extinction at Meishan, South China. Palaeogeogr. Palaeoclimatol. Palaeoecol. 2020, 544, 109626. [Google Scholar] [CrossRef]
- Grasby, S.E.; Beauchamp, B.; Embry, A.; Sanei, H. Recurrent Early Triassic ocean anoxia. Geology 2013, 41, 175–178. [Google Scholar] [CrossRef]
- Kato, Y.; Nakao, K.; Isozaki, Y. Geochemistry of Late Permian to Early Triassic pelagic cherts from southwest Japan: Implications for an oceanic redox change. Chem. Geol. 2002, 182, 15–34. [Google Scholar] [CrossRef]
- Takahashi, S.; Yamasaki, S.; Ogawa, Y.; Kimura, K.; Kaiho, K.; Yoshida, T.; Tsuchiya, N. Bioessential element-depleted ocean following the euxinic maximum of the end-Permian mass extinction. Earth Planet. Sci. Lett. 2014, 393, 94–104. [Google Scholar] [CrossRef]
- Takahashi, S.; Nakada, R.; Watanabe, Y.; Takahashi, Y. Iron-depleted pelagic water at the end-Permian mass extinction inferred from chemical species of iron and molybdenum in deep-sea sedimentary rocks. Palaeogeogr. Palaeoclimatol. Palaeoecol. 2019, 516, 384–399. [Google Scholar] [CrossRef]
- Algeo, T.J.; Kuwahara, K.; Sano, H.; Bates, S.; Lyons, T.; Elswick, E.; Hinnov, L.; Ellwood, B.; Moser, J.; Maynard, J.B. Spatial variation in sediment fluxes, redox conditions, and productivity in the Permian–Triassic Panthalassic Ocean. Palaeogeogr. Palaeoclimatol. Palaeoecol. 2011, 308, 65–83. [Google Scholar] [CrossRef]
- Brennecka, G.A.; Herrmann, A.D.; Algeo, T.J.; Anbar, A.D. Rapid expansion of oceanic anoxia immediately before the end-Permian mass extinction. Proc. Natl. Acad. Sci. USA 2011, 108, 17631–17634. [Google Scholar] [CrossRef] [Green Version]
- Westermann, S.; Stein, M.; Matera, V.; Fiet, N.; Fleitmann, D.; Adatte, T.; Föllmi, K.B. Rapid changes in the redox conditions of the western Tethys Ocean during the early Aptian oceanic anoxic event. Geochimica Cosmochimica Acta 2013, 121, 467–486. [Google Scholar] [CrossRef]
- Hetzel, A.; Böttcher, M.E.; Wortmann, U.G.; Brumsack, H. Paleo-redox conditions during OAE 2 reflected in Demerara Rise sediment geochemistry (ODP Leg 207). Palaeogeogr. Palaeoclimatol. Palaeoecol. 2009, 273, 302–328. [Google Scholar] [CrossRef]
- Broecker, W.S.; Peng, T.H. Tracers in the Sea; Eldigio Press: New York, NY, USA, 1982; pp. 28–40. [Google Scholar]
- Kato, Y.; Fujinaga, K.; Nakamura, K.; Takaya, Y.; Kitamura, K.; Ohta, J.; Toda, R.; Nakashima, T.; Iwamori, H. Deep-sea mud in the Pacific Ocean as a potential resource for rare-earth elements. Nat. Geosci. 2011, 4, 535–539. [Google Scholar] [CrossRef]
- Yasukawa, K.; Liu, H.; Fujinaga, K.; Machida, S.; Haraguchi, S.; Ishii, T.; Nakamura, K.; Kato, Y. Geochemistry and mineralogy of REY-rich mud in the eastern Indian Ocean. J. Asian Earth Sci. 2014, 93, 25–36. [Google Scholar] [CrossRef]
- Yasukawa, K.; Nakamura, K.; Fujinaga, K.; Machida, S.; Ohta, J.; Takaya, Y.; Kato, Y. Rare-earth, major, and trace element geochemistry of deep-sea sediments in the Indian Ocean: Implications for the potential distribution of REY-rich mud in the Indian Ocean. Geochem. J. 2015, 49, 621–635. [Google Scholar] [CrossRef]
- Yasukawa, K.; Nakamura, K.; Fujinaga, K.; Iwamori, H.; Kato, Y. Tracking the spatiotemporal variations of statistically independent components involving enrichment of rare-earth elements in deep-sea sediments. Sci. Rep. 2016, 6, 29603. [Google Scholar] [CrossRef] [PubMed]
- Machida, S.; Fujinaga, K.; Ishii, T.; Nakamura, K.; Hirano, N.; Kato, Y. Geology and geochemistry of ferromanganese nodules in the Japanese Exclusive Economic Zone around Minamitorishima Island. Geochem. J. 2016, 50, 539–555. [Google Scholar] [CrossRef] [Green Version]
- Nozaki, T.; Tokumaru, A.; Takaya, Y.; Kato, Y.; Suzuki, K.; Urabe, T. Major and trace element compositions and resource potential of ferromanganese crust at Takuyo Daigo Seamount, northwestern Pacific Ocean. Geochem. J. 2016, 50, 527–537. [Google Scholar] [CrossRef] [Green Version]
- Azami, K.; Hirano, N.; Machida, S.; Yasukawa, K.; Kato, Y. Rare earth elements and yttrium (REY) variability with water depth in hydrogenetic ferromanganese crusts. Chem. Geol. 2018, 493, 224–233. [Google Scholar] [CrossRef]
- Jenkyns, H.C. Geochemistry of oceanic anoxic events. Geochem. Geophys. Geosyst. 2010, 11, Q03004. [Google Scholar] [CrossRef]
- Iijima, K.; Yasukawa, K.; Fujinaga, K.; Nakamura, K.; Machida, S.; Takaya, Y.; Ohta, J.; Haraguchi, S.; Nishio, Y.; Usui, Y.; et al. Discovery of extremely REY-rich mud in the western North Pacific Ocean. Geochem. J. 2016, 50, 557–573. [Google Scholar] [CrossRef] [Green Version]
- Fujinaga, K.; Yasukawa, K.; Nakamura, K.; Machida, S.; Takaya, Y.; Ohta, J.; Araki, S.; Liu, H.; Usami, R.; Maki, R.; et al. Geochemistry of REY-rich mud in the Japanese Exclusive Economic Zone around Minamitorishima Island. Geochem. J. 2016, 50, 575–590. [Google Scholar] [CrossRef] [Green Version]
- Takaya, Y.; Yasukawa, K.; Kawasaki, T.; Fujinaga, K.; Ohta, J.; Usui, Y.; Nakamura, K.; Kimura, J.-I.; Chang, Q.; Hamada, M.; et al. The tremendous potential of deep-sea mud as a source of rare-earth elements. Sci. Rep. 2018, 8, 5763. [Google Scholar] [CrossRef] [Green Version]
- Yasukawa, K.; Ohta, J.; Mimura, K.; Tanaka, E.; Takaya, Y.; Usui, Y.; Fujinaga, K.; Machida, S.; Nozaki, T.; Iijima, K.; et al. A new and prospective resource for scandium: Evidence from the geochemistry of deep-sea sediment in the western North Pacific Ocean. Ore Geol. Rev. 2018, 102, 260–267. [Google Scholar] [CrossRef]
- Mimura, K.; Nakamura, K.; Yasukawa, K.; Machida, S.; Ohta, J.; Fujinaga, K.; Kato, Y. Significant impacts of pelagic clay on average chemical composition of subducting sediments: New insights from discovery of extremely rare-earth elements and yttrium-rich mud at Ocean Drilling Program Site 1149 in the western North Pacific Ocean. J. Asian Earth Sci. 2019, 186, 104059. [Google Scholar] [CrossRef]
- Ohta, J.; Yasukawa, K.; Machida, S.; Fujinaga, K.; Nakamura, K.; Takaya, Y.; Iijima, K.; Suzuki, K.; Kato, Y. Geological factors responsible for REY-rich mud in the western North Pacific Ocean: Implications from mineralogy and grain size distributions. Geochem. J. 2016, 50, 591–603. [Google Scholar] [CrossRef] [Green Version]
- Ohta, J.; Yasukawa, K.; Nozaki, T.; Takaya, Y.; Mimura, K.; Fujinaga, K.; Nakamura, K.; Usui, Y.; Kimura, J.-I.; Chang, Q.; et al. Fish proliferation and rare-earth deposition by topographically induced upwelling at the late Eocene cooling event. Sci. Rep. 2020, 10, 9896. [Google Scholar] [CrossRef]
- Nakamura, K.; Machida, S.; Okino, K.; Masaki, Y.; Iijima, K.; Suzuki, K.; Kato, Y. Acoustic characterization of pelagic sediments using sub-bottom profiler data: Implications for the distribution of REY-rich mud in the Minamitorishima EEZ, western Pacific. Geochem. J. 2016, 50, 605–619. [Google Scholar] [CrossRef] [Green Version]
- Yasukawa, K.; Ohta, J.; Miyazaki, T.; Vaglarov, B.S.; Chang, Q.; Ueki, K.; Toyama, C.; Kimura, J.-I.; Tanaka, E.; Nakamura, K.; et al. Statistic and isotopic characterization of deep-sea sediments in the western North Pacific Ocean: Implications for genesis of the sediment extremely enriched in rare-earth elements. Geochem. Geophys. Geosyst. 2019, 20, 3402–3430. [Google Scholar] [CrossRef] [Green Version]
- Tanaka, E.; Nakamura, K.; Yasukawa, K.; Mimura, K.; Fujinaga, K.; Iijima, K.; Nozaki, T.; Kato, Y. Chemostratigraphy of deep-sea sediments in the western North Pacific Ocean: Implications for genesis of mud highly enriched in rare-earth elements and yttrium. Ore Geol. Rev. 2020, 119, 103392. [Google Scholar] [CrossRef]
- Hirst, D.M. Geochemistry of Sediments from Eleven Black Sea Cores. In Black Sea-Geology, Chemistry, and Biology; Degens, E.T., Ross, D.A., Eds.; American Association of Petroleum Geologists: Tulsa, OK, USA, 1974; Volume 20, pp. 330–355. [Google Scholar]
- Piper, D.Z.; Dean, W.E.; US Geological Survey. Trace-element Deposition in the Cariaco Basin, Venezuela Shelf, under Sulfate-reducing Conditions—A History of the Local Hydrography and Global Climate, 20 Ka to the Present; Professional Paper; US Geological Survey: Reston, VA, USA, 2002; pp. 1–41. [CrossRef]
- François, R. A study on the regulation of the concentrations of some trace metals (Rb, Sr, Zn, Pb, Cu, V, Cr, Ni, Mn and Mo) in Saanich Inlet sediments, British Columbia Canada. Mar. Geol. 1988, 83, 285–308. [Google Scholar] [CrossRef]
- Skei, J. Geochemical and sedimentological considerations of a permanently anoxic fjord-Framvaren, south Norway. Sediment. Geol. 1983, 36, 131–145. [Google Scholar] [CrossRef]
- Algeo, T.J.; Lyons, T.W. Mo—Total organic carbon covariation in modern anoxic marine environments: Implications for analysis of paleoredox and paleohydrographic conditions. Palaeoceanography 2006, 21, PA1016. [Google Scholar] [CrossRef]
- Algeo, T.J.; Tribovillard, N. Environmental analysis of paleoceanographic systems based on molybdenum–uranium covariation. Chem. Geol. 2009, 268, 211–225. [Google Scholar] [CrossRef]
- Sweere, T.; van den Boorn, S.; Dickson, A.J.; Reichart, G.-J. Definition of new trace-metal proxies for the controls on organic matter enrichment in marine sediments based on Mn, Co, Mo and Cd concentrations. Chem. Geol. 2016, 441, 235–245. [Google Scholar] [CrossRef]
- Whitmarsh, R.B.; Ross, D.A.; Ali, S.; Boudreaux, J.E.; Coleman, R.; Fleisher, R.L.; Girdler, R.W.; Manheim, F.T.; Matter, A.; Nigrini, C.; et al. Initial Reports DSDP; US Government Printing Office: Washington, DC, USA, 1974; Volume 23.
- Ross, D.A.; Neprochnov, Y.; Degens, E.T.; Erickson, A.J.; Hunt, J.M.; Manheim, F.; Percival, S.; Senalp, M.; Stoffers, P.; Supko, P.; et al. Initial Reports DSDP; US Government Printing Office: Washington, DC, USA, 1978; Volume 42.
- Curray, J.R.; Moore, D.G.; Eduardo Aguayo, J.; Aubry, M.-P.; Einsele, G.; Fornari, D.; Gieskes, J.; Guerrero-Garcia, J.; Kastner, M.; Kelts, K.; et al. Initial Reports DSDP; US Government Printing Office: Washington, DC, USA, 1982; Volume 64.
- Sigurdsson, H.; Leckie, R.M.; Acton, G.D.; Abrams, L.J.; Bralower, T.J.; Carey, S.N.; Chaisson, W.P.; Cotillon, P.; Cunningham, A.D.; D’Hondt, S.L.; et al. Proc. Ocean Drilling Program, Initial Reports; Ocean Drilling Program: College Station, TX, USA, 1997; p. 165. [Google Scholar]
- Bornhold, B.D.; Firth, J.V.; Adamson, L.M.; Baldauf, J.G.; Blais, A.P.; Elvert, M.; Fox, P.J.; Hebda, R.; Kemp, A.E.S.; Moran, K.; et al. Proc. Ocean Drilling Program, Initial Reports; Ocean Drilling Program: College Station, TX, USA, 1998; p. 169S. [Google Scholar]
- Wefer, G.; Berger, W.H.; Richter, C.; Adams, D.D.; Anderson, L.D.; Andreasen, D.J.; Brüchert, V.; Cambray, H.; Christensen, B.A.; Frost, G.M.; et al. Proc. Ocean Drilling Program, Initial Reports; Ocean Drilling Program: College Station, TX, USA, 1998; p. 175. [Google Scholar]
- Andrén, T.; Jørgensen, B.B.; Cotterill, C.; Green, S.; Andrén, E.; Ash, J.; Bauersachs, T.; Cragg, B.; Fanget, A.-S.; Fehr, A.; et al. Scientists, Proc. IODP; Andrén, T., Jørgensen, B.B., Cotterill, C., Green, S., The Expedition 347, Eds.; Integrated Ocean Drilling Program: College Station, TX, USA, 2015; p. 347. [Google Scholar]
- Kato, Y.; Ohta, I.; Tsunematsu, T.; Watanabe, Y.; Isozaki, Y.; Maruyama, S.; Imai, N. Rare earth element variations in mid-Archean banded iron formations: Implications for the chemistry of ocean and continent and plate tectonics. Geochim. Cosmochim. Acta 1998, 62, 3475–3497. [Google Scholar] [CrossRef]
- Kato, Y.; Fujinaga, K.; Suzuki, K. Major and trace element geochemistry and Os isotopic composition of metalliferous umbers from the Late Cretaceous Japanese accretionary complex. Geochem. Geophys. Geosyst. 2005, 6, Q07004. [Google Scholar] [CrossRef] [Green Version]
- Irino, T. Quantification of Kosa (Eolian Dust) Contribution to the Sediments and Reconstruction of Its Flux Variation at ODP Site 797, the Japan Sea during the Last 200 Kyr. Ph.D. Thesis, University Tokyo, Tokyo, Japan, 1996. [Google Scholar]
- Aries, S.; Valladon, M.; Polvé, M.; Dupré, B. A routine method for oxide and hydroxide interference corrections in ICP-MS chemical analysis of environmental and geological samples. Geostand. Newslett. 2000, 24, 19–31. [Google Scholar] [CrossRef]
- Makishima, A.; Nakamura, E. Determination of major/minor and trace elements in silicate samples by ICP-QMS and ICP-SFMS applying isotope dilution-internal standardization (ID-IS) and multi-stage internal standardisation. Geostand. Geoanal. Res. 2006, 30, 245–271. [Google Scholar] [CrossRef]
- Takaya, Y.; Hiraide, T.; Fujinaga, K.; Nakamura, K.; Kato, Y. A study on the recovery method of rare-earth elements from REY-rich mud toward the development and the utilization of REY-rich mud. J. MMIJ 2014, 130, 104–114, (In Japanese with English abstract). [Google Scholar] [CrossRef] [Green Version]
- Larson, T.E.; Heikoop, J.M.; Perkins, G.; Chipera, S.J.; Hess, M.A. Pretreatment technique for siderite removal for organic carbon isotope and C:N ratio analysis in geological samples. Rapid Commun. Mass Spectrom. 2008, 22, 865–872. [Google Scholar] [CrossRef]
- Rudnick, R.L.; Gao, S. Composition of the Continental Crust. In Treatise on Geochemistry, 2nd ed.; Holland, H.D., Turekian, K.K., Eds.; Elsevier Ltd.: Amsterdam, The Netherlands, 2014; pp. 1–51. [Google Scholar] [CrossRef]
- Lindh, A.; Lindh, A. Chemical composition of Late Svecofennian granite in the Bothnian Basin, central Sweden. GFF 2014, 136, 483–502. [Google Scholar] [CrossRef]
- Martinez, N.C.; Murray, R.W.; Thunell, R.C.; Peterson, L.C.; Lorenzoni, L.; Astor, Y.; Varela, R. Local and regional geochemical signatures of surface sediments from the Cariaco Basin and Orinoco Delta, Venezuela. Geology 2010, 159–162. [Google Scholar] [CrossRef] [Green Version]
- Gromet, L.P.; Dymek, R.F.; Haskin, L.A.; Korotev, R.L. The “North American shale composite”: Its compilation, major and trace element characteristics. Geochim. Cosmochim. Acta 1984, 48, 2469–2482. [Google Scholar] [CrossRef]
- Garzanti, E.; Andò, S.; Vezzoli, G.; Lustrino, M.; Boni, M.; Vermeesch, P. Petrology of the Namib Sand Sea: Long-distance transport and compositional variability in the wind-displaced Orange Delta. Earth Sci. Rev. 2012, 112, 173–189. [Google Scholar] [CrossRef]
- Huerta-Diaz, M.A.; Morse, J.W. Pyritization of trace metals in anoxic marine sediments. Geochim. Cosmochim. Acta 1992, 56, 2681–2702. [Google Scholar] [CrossRef]
- Morse, J.W.; Luther, G.W. Chemical influences on trace metal-sulfide interactions in anoxic sediments. Geochim. Cosmochim. Acta 1999, 63, 3373–3378. [Google Scholar] [CrossRef]
- Soua, M. Productivity and bottom water redox conditions at the Cenomanian–Turonian Oceanic Anoxic Event in the Southern Tethyan Margin, Tunisia. Revue Méditerranéenne l’Environnement 2010, 4, 653–664. [Google Scholar]
- Hay, W.W.; Brock, J.C. Temporal variation in intensity of upwelling off southwest Africa. Geol. Soc. Spec. Publ. 1992, 64, 463–497. [Google Scholar] [CrossRef]
- Trefry, J.H.; Presley, B.J.; Keeney-Kennicutt, W.L.; Trocine, R.P. Distribution and chemistry of manganese, iron, and suspended particulates in Orca Basin. Geo-Mar. Lett. 1984, 4, 125–130. [Google Scholar] [CrossRef]
- Ho, T.-Y.; Taylor, G.T.; Astor, Y.; Varela, R.; Müller-Karger, F.; Scranton, M.I. Vertical and temporal variability of redox zonation in the water column of the Cariaco Basin: Implications for organic carbon oxidation pathways. Mar. Chem. 2004, 86, 89–104. [Google Scholar] [CrossRef]
- Tribovillard, N.; Algeo, T.J.; Baudin, F.; Riboulleau, A. Analysis of marine environmental conditions based on molybdenum–uranium covariation—Applications to Mesozoic paleoceanography. Chem. Geol. 2012, 324, 46–58. [Google Scholar] [CrossRef]
- Hsü, K.J.; Ryan, W.B.F.; Cita, M.B. Late Miocene desiccation of the Mediterranean. Nature 1973, 242, 240–244. [Google Scholar] [CrossRef]
- Hsü, K.J.; Montadert, L.; Bernoulli, D.; Cita, M.B.; Erickson, A.; Garrison, R.E.; Kidd, R.B.; Mèlierés, F.; Müller, C.; Wright, R. History of the Mediterranean salinity crisis. Nature 1977, 267, 399–403. [Google Scholar] [CrossRef]
- Ryan, W.B.F. Decoding the Mediterranean salinity crisis. Sedimentology 2009, 56, 95–136. [Google Scholar] [CrossRef]
- Van Baak, C.G.C.; Vasiliev, I.; Palcu, D.V.; Dekkers, M.J. A Greigite-based magnetostratigraphic time frame for the Late Miocene to Recent DSDP Leg 42B Cores from the Black Sea. Front. Earth Sci. 2016, 4, 1–18. [Google Scholar] [CrossRef] [Green Version]
- Zheng, Y.; Anderson, R.F.; Van Geen, A.; Fleisher, M.Q. Remobilization of authigenic uranium in marine sediments by bioturbation. Geochim. Cosmochim. Acta 2002, 66, 1759–1772. [Google Scholar] [CrossRef]
- Helz, G.R.; Miller, C.V.; Charnock, J.M.; Mosselmans, J.F.W.; Pattrick, R.A.D.; Garner, C.D.; Vaughan, D.J. Mechanism of molybdenum removal from the sea and its concentration in black shales: EXAFS evidence. Geochim. Cosmochim. Acta 1996, 60, 3631–3642. [Google Scholar] [CrossRef]
- Zheng, Y.; Anderson, R.F.; van Geen, A.; Kuwabara, J. Authigenic molybdenum formation in marine sediments: A link to pore water sulfide in the Santa Barbara Basin. Geochim. Cosmochim. Acta 2000, 64, 4165–4178. [Google Scholar] [CrossRef]
- Barnes, C.E.; Cochran, J.K. Uranium geochemistry in estuarine sediments: Controls on removal and release processes. Geochim. Cosmochim. Acta 1993, 57, 555–569. [Google Scholar] [CrossRef]
- Partin, C.A.; Bekker, A.; Planavsky, N.J.; Scott, C.T.; Gill, B.C.; Li, C.; Podkovyrov, V.; Maslov, A.; Konhauser, K.O.; Lalonde, S.V.; et al. Large-scale fluctuations in Precambrian atmospheric and oceanic oxygen levels from the record of U in shales. Earth Planet. Sci. Lett. 2013, 369–370, 284–293. [Google Scholar] [CrossRef]


Publisher’s Note: MDPI stays neutral with regard to jurisdictional claims in published maps and institutional affiliations. |
© 2020 by the authors. Licensee MDPI, Basel, Switzerland. This article is an open access article distributed under the terms and conditions of the Creative Commons Attribution (CC BY) license (http://creativecommons.org/licenses/by/4.0/).
Share and Cite
Yano, M.; Yasukawa, K.; Nakamura, K.; Ikehara, M.; Kato, Y. Geochemical Features of Redox-Sensitive Trace Metals in Sediments under Oxygen-Depleted Marine Environments. Minerals 2020, 10, 1021. https://0-doi-org.brum.beds.ac.uk/10.3390/min10111021
Yano M, Yasukawa K, Nakamura K, Ikehara M, Kato Y. Geochemical Features of Redox-Sensitive Trace Metals in Sediments under Oxygen-Depleted Marine Environments. Minerals. 2020; 10(11):1021. https://0-doi-org.brum.beds.ac.uk/10.3390/min10111021
Chicago/Turabian StyleYano, Moei, Kazutaka Yasukawa, Kentaro Nakamura, Minoru Ikehara, and Yasuhiro Kato. 2020. "Geochemical Features of Redox-Sensitive Trace Metals in Sediments under Oxygen-Depleted Marine Environments" Minerals 10, no. 11: 1021. https://0-doi-org.brum.beds.ac.uk/10.3390/min10111021