Derivation of Flotation Kinetic Model for Activated and Depressed Copper Sulfide Minerals


1
Nittetsu Mining Co., Ltd., Tokyo 190-0182, Japan
2
Faculty of Science and Engineering, Waseda University, Tokyo 169-8555, Japan
*
Author to whom correspondence should be addressed.
Minerals 2020, 10(11), 1027; https://0-doi-org.brum.beds.ac.uk/10.3390/min10111027
Submission received: 24 October 2020
/
Revised: 14 November 2020
/
Accepted: 16 November 2020
/
Published: 18 November 2020
(This article belongs to the Section Mineral Processing and Extractive Metallurgy)
Abstract
:The wettability and floatability of oxidized chalcocite, bornite, and chalcopyrite with the conditions of sodium hydrosulfide (NaHS) dosages and pHs were studied by contact angle measurements, and single and mixture mineral flotation tests. To evaluate the results of the flotation, the flotation kinetic model for copper sulfide minerals treated by NaHS was derived. In this study, we focused on the activation and depression by NaHS, a well-known activator and depressant of copper minerals. The flotation results showed that there can be a threshold NaHS dosage to activate the mineral surfaces, as evidenced by the depression of the minerals and reduction of recoveries at higher dosages of NaHS. Chalcocite recoveries increased with an increase of NaHS dosage. Bornite recoveries tended to be depressed with a smaller amount of NaHS as pH increased. The recoveries of chalcopyrite increased as pH increased at an optimum NaHS dosage. Moreover, the flotation kinetic model that includes the surface properties and the reaction rate constant between the copper sulfide minerals and NaHS was derived. The trends of the flotation rate constants and mass fractions with NaHS dosages and pHs could quantitatively well-explain the flotation results.
1. Introduction
Copper is a valuable metal and used in various products such as copper wire and electronic devices. Copper sulfide minerals are widely known as a major source of copper resources. Copper sulfide minerals are separated from other gangue minerals by a flotation method. Flotation utilizes the surface wettability property evaluated by a contact angle degree. Law and Zhao [1] demonstrated that the tangential angle at liquid-solid-air interface can quantitatively describe the wetting of a solid surface by a liquid. Contact angle, θ is defined by Young’s equation as follows [2]:
where is the solid surface tension, is the liquid surface tension, is the liquid-solid interfacial tension. It can be understood that the greater the contact angle the greater is the adhesion force between the particle and bubble [3]. The slightly oxidized surface of copper sulfide mineral, chalcopyrite, is hydrophobic with contact angles around 70° because of produced sulfur-rich products ex. sulfur, metal-deficient sulfides, and polysulfides [4,5,6]. Therefore, the slightly oxidized copper sulfide mineral is easy to recover to the froth phase because of their hydrophobic surface property. As the oxidation progresses or surfaces are more strongly oxidized, however, surfaces become hydrophilic because surfaces are covered with oxides and/or hydroxides [4,7,8,9,10,11], and the contact angle becomes low [4]. Thus, it is difficult to recover because of their hydrophilic surface property.
To evaluate these minerals’ flotation results, flotation kinetic models are used. Various models have been investigated to evaluate the flotation kinetics as shown in following Table 1 [12,13,14,15,16,17].
In recent years, secondary sulfide ores (ex. chalcocite) have sometimes been associated with primary sulfide ores (ex. chalcopyrite and bornite), which have been the main ore of copper until now. Secondary sulfide ores and bornite are strongly affected by oxidation, such as on stockpiles and during the grinding process. An activator can be added to increase the recovery of low floatability minerals. Finkelstein [28] and Allison and O’Connor [29] reported the activation of various sulfides by copper ion. Activation of sphalerite by copper ions is widely known as a typical example of copper ion’s activation [30,31]. Moreover, Zhou and Chander [32] indicated that the sulfurizing agent, NaHS, can be used to activate a copper oxide mineral, malachite. By using a sulfurizing agent, an oxidized surface is sulfurized by the following reaction [33].
8CuO + 5S2− + 8H+ ⇄ 4Cu2S + SO42− + 4H2O
CuO + S2− + 2H+ ⇄ CuS + H2O
As a result, the hydrophobicity is increased and the adhesiveness with air bubbles is increased to improve the recovery. On the other hand, NaHS also works as a depressant for chalcopyrite in copper and molybdenum selective flotation [3,34,35].
In this study, we focused on the effect of NaHS as both activator and depressant for oxidized copper sulfide minerals and investigated the quantitative conditions of NaHS activation and depression. Pure mineral specimens of chalcocite, bornite, and chalcopyrite as typical primary and secondary sulfide ores were used for contact angle measurements and single mineral flotation tests. Mixture mineral flotation tests were conducted using Chilean copper ore sample that included chalcocite, bornite, and chalcopyrite. Both of the flotation tests were conditioned at several NaHS dosages and alkaline pHs. Moreover, based on the floatability component model and the surface properties of the copper sulfide minerals, the flotation kinetic model for activated and depressed copper sulfide minerals by NaHS was derived. The derived model was constructed with three components (which were based on copper sulfide minerals’ surface properties) and it included the reaction rate constant between the copper sulfide minerals and NaHS. The model was fitted to the flotation results and their results were discussed.
2. Materials and Methods
2.1. Materials
2.1.1. Preparation of Mineral Specimens for Contact Angle Measurements and Single Mineral Flotation Tests
Mineral specimens of chalcocite (Flambeau Mine, America), bornite (Leonard Mine, America), and chalcopyrite (Kosaka Mine, Japan) were used. The samples were characterized by X-ray fluorescence (Supermini 200, Rigaku Co., Ltd., Tokyo, Japan) (see Table 2).
Each mineral was cut to 1 cm3 for use in contact angle measurements. The minerals were embedded in an epoxy resin (Epofix, Struers, Tokyo, Japan). After solidification, the surface of each sample was polished with SiC #1200, #2000, and #4000 polishing papers, followed by 3 µm and 1/4 µm diamond pastes on MD Sat and MD Dur (Struers, Tokyo, Japan) fine polishing disks placed on a polishing machine (Laboforce-Mini, Struers, Tokyo, Japan).
The samples were ground using an agate mortar to less than 20 µm for use in single mineral flotation tests. To remove oxidized species from the surfaces, 2 g of the minerals were immersed in 20 mL of a 1 M HNO3 solution and sonicated (UT-205S, Sharp Co., Ltd., Osaka, Japan) for 1 min. The minerals were filtered and rinsed three times with pure water to remove nitrates. The samples were freeze-dried (FDU-1200, Tokyo Rikakikai Co., Ltd., Tokyo, Japan) over 12 h and prepared as fresh samples [36].
Before treatment with NaHS, the surfaces of the fresh samples were oxidized slightly in an oven (WFO-520, Tokyo Rikakikai Co., Ltd., Tokyo, Japan) at 90 °C for 12 h for use in contact angle measurements and for 96 h to conduct single mineral flotation tests.
2.1.2. Mixed Copper Sulfide Minerals Ore Sample for Mixture Mineral Flotation Tests
A Chilean copper ore sample that contained chalcocite, bornite, and chalcopyrite was used in the mixture mineral flotation tests. The mineral composition of the sample analyzed using a Mineral Liberation Analyser (MLA 650, FEI, Tokyo, Japan) is shown in Table 3 and Table 4. The copper grade of the sample was 1.0%, and the sample contained bornite, chalcopyrite, and chalcocite as copper sulfide minerals and calcite, orthoclase, albite, and quartz as gangue minerals. The sample was crushed using a jaw crusher (1032-B, Yoshida Seisakusho Co., Ltd., Tokyo, Japan) to −1.7 mm and divided into 480 g sub-samples. The divided samples were ground to P80 = 70 µm with a rod mill and ball mill (1140-A-S, Yoshida Seisakusho Co., Ltd., Tokyo, Japan) for the flotation tests [36].
2.2. NaHS Treatments Before Each Measurement and Test
2.2.1. Contact Angle Measurements
The block minerals in epofix resins were immersed in 100 mL NaHS solutions of varying concentrations of 1.0 × 10⁻⁹ M, 7.0 × 10⁻⁹ M, 1.0 × 10⁻⁸ M, 1.2 × 10⁻⁶ M, and 1.0 × 10⁻³ M at natural pHs for 10 min.
2.2.2. Single Mineral Flotation Tests
The surfaces of mineral specimens after oxidation treatment were treated with NaHS to sulfurize surfaces. The solution (100 mL pure water) was adjusted to pH 8, 9, or 10 using 1% NaOH. NaHS was added to the solution to several concentrations, and the pH was adjusted to the desired pH using 1% H2SO4. Thereafter, 1 g of oxidized pure sample was added to a solution, the pH was adjusted to the desired values, and the NaHS treatments were performed for 5 min [36].
2.2.3. Mixture Mineral Flotation Tests
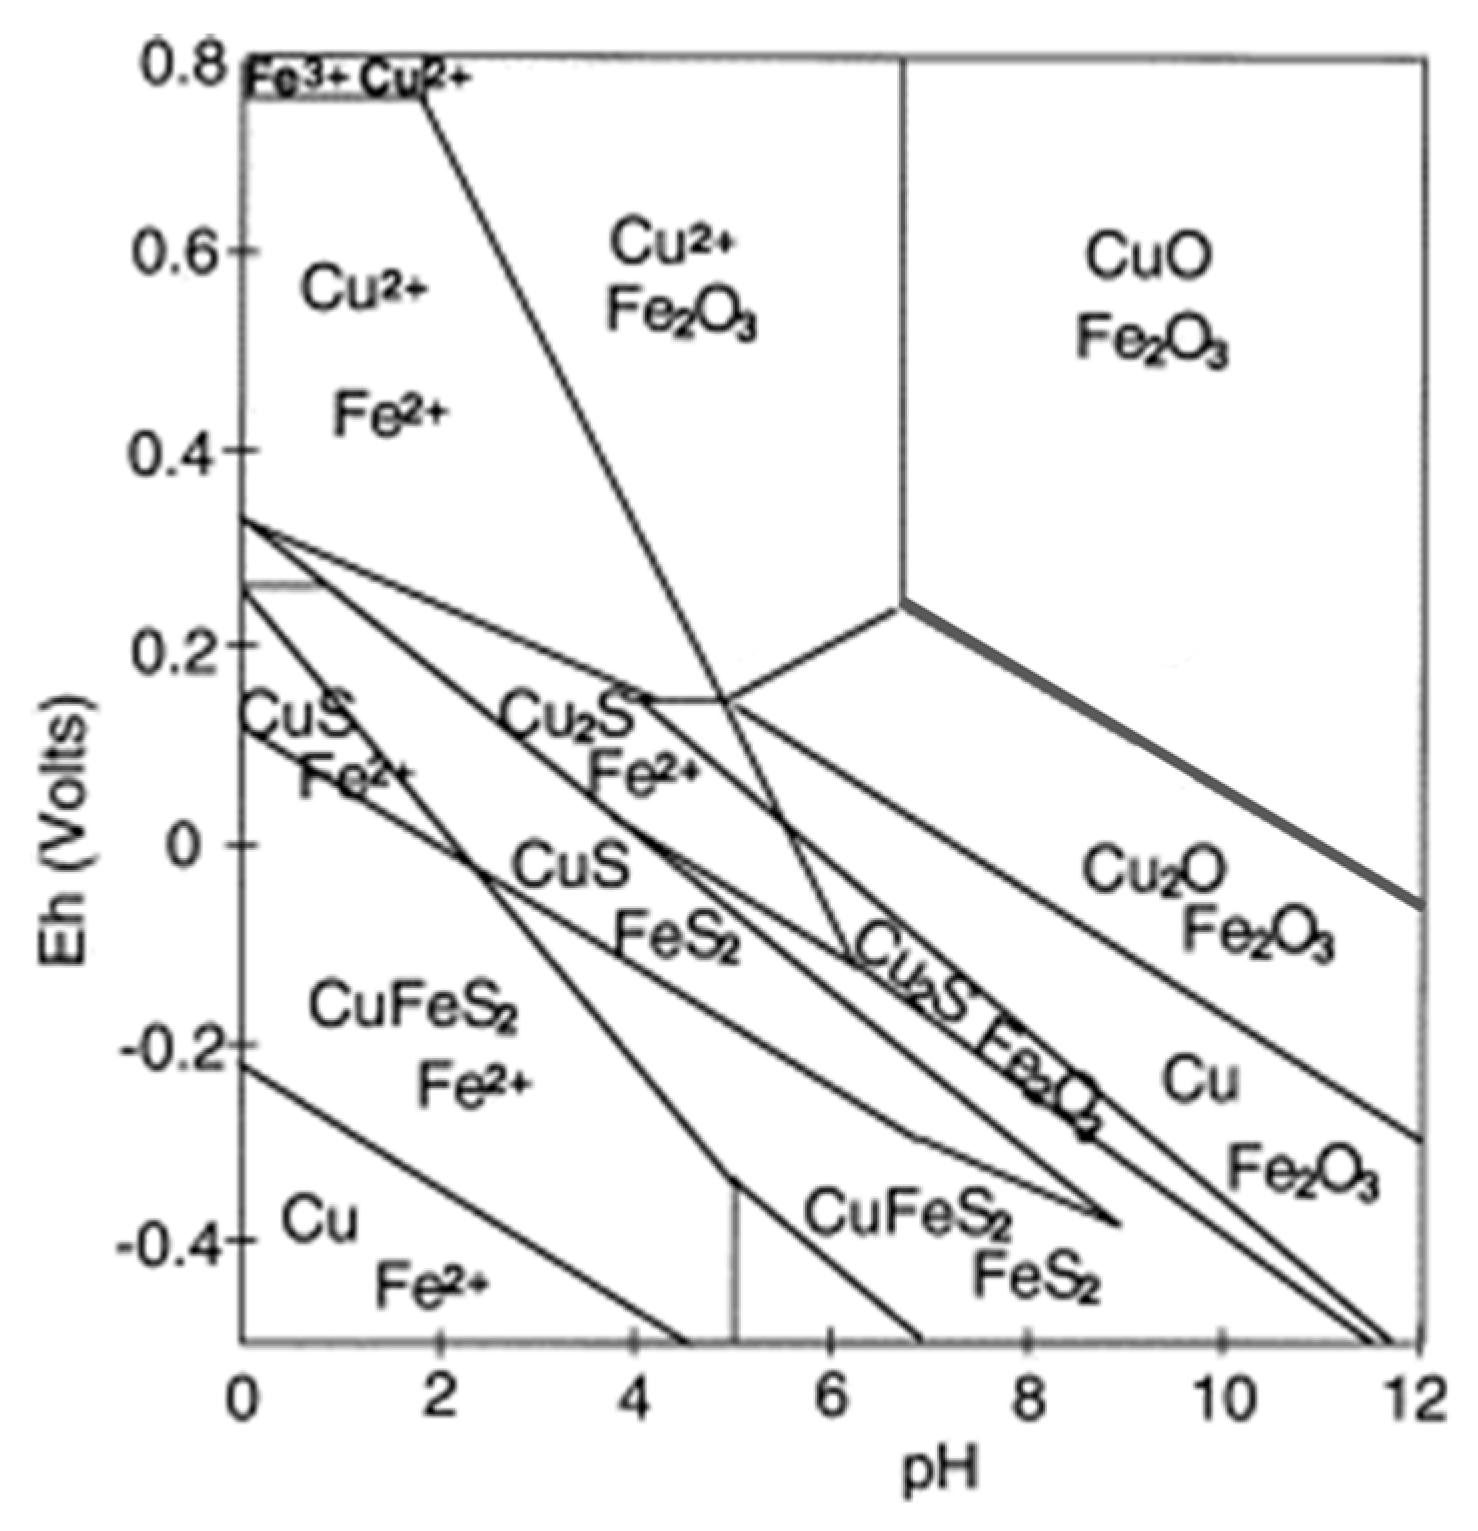
In the conditioning stage, pulps after grinding by the rod mill and ball mill had a 37% pulp concentration in a 1-L Denver-type flotation cell (D-12 Denver, CO, USA). Pulps were agitated using an impeller at 900 rpm. The pH was controlled by Ca(OH)2 and H2SO4 to maintain the pH at 8, 9, or 10. Figure 1 shows that copper and iron existed in the form of oxides on the mineral surfaces at these pHs. After pH adjustment, NaHS dosages of 0 g/t, 50 g/t, 100 g/t, or 200 g/t was added to the cell, and the pH was readjusted to the desired value. Afterward, flotation reagents, the collector diisobutyl dithiophosphate (AERO 3477 promoter, Solvay S.A., Brussels, Belgium), and the frother, methyl isobutyl carbinol (MIBC), were added and conditioned for 5 min [36].
2.3. Contact Angle Measurement
Contact angles were measured following the steps conducted by [38]. After oxidation and NaHS treatments, the contact angles of the mineral surfaces were measured by the captive bubble method in a goniometer (OCA15EC, DataPhysics, San Jose, CA, USA). The air bubble volume was 7.0 µL. The air bubble was generated by a microsyringe and attached to each mineral surface. The contact angles of untreated, oxidized, and NaHS-treated mineral samples were measured at different five points on the mineral surfaces and the average values were reported in this paper.
2.4. Single Mineral Flotation Tests
The single mineral flotation tests were conducted using small column flotation cell to evaluate the floatability of each mineral specimen. The 1 g of the sample treated with NaHS at definite pH and NaHS concentration was added into the small column cell and flotation was conducted for 2 min with 0.3 L/min aeration. After the flotation test, recovered froth and tail samples were dried in an oven at 90 °C for more than 12 h, then their weights were measured and the recoveries were calculated.
2.5. Mixture Mineral Flotation Tests
A Denver-type flotation machine was used for the mixture mineral flotation tests. At impeller speed of 900 rpm, after NaHS treatment at definite pH and NaHS concentration and addition of collector and frother, the air was self-aerated at 1.6 L/min. The froth was recovered at 1, 3, 6, 18, 30, and 45 min and dried in an oven at 90 °C for more than 12 h. The dried froth and tail samples were analyzed by ICP-AES and MLA to obtain copper concentrations and recovery of each copper sulfide mineral.
3. Results and Discussion
3.1. Contact Angle Measurements
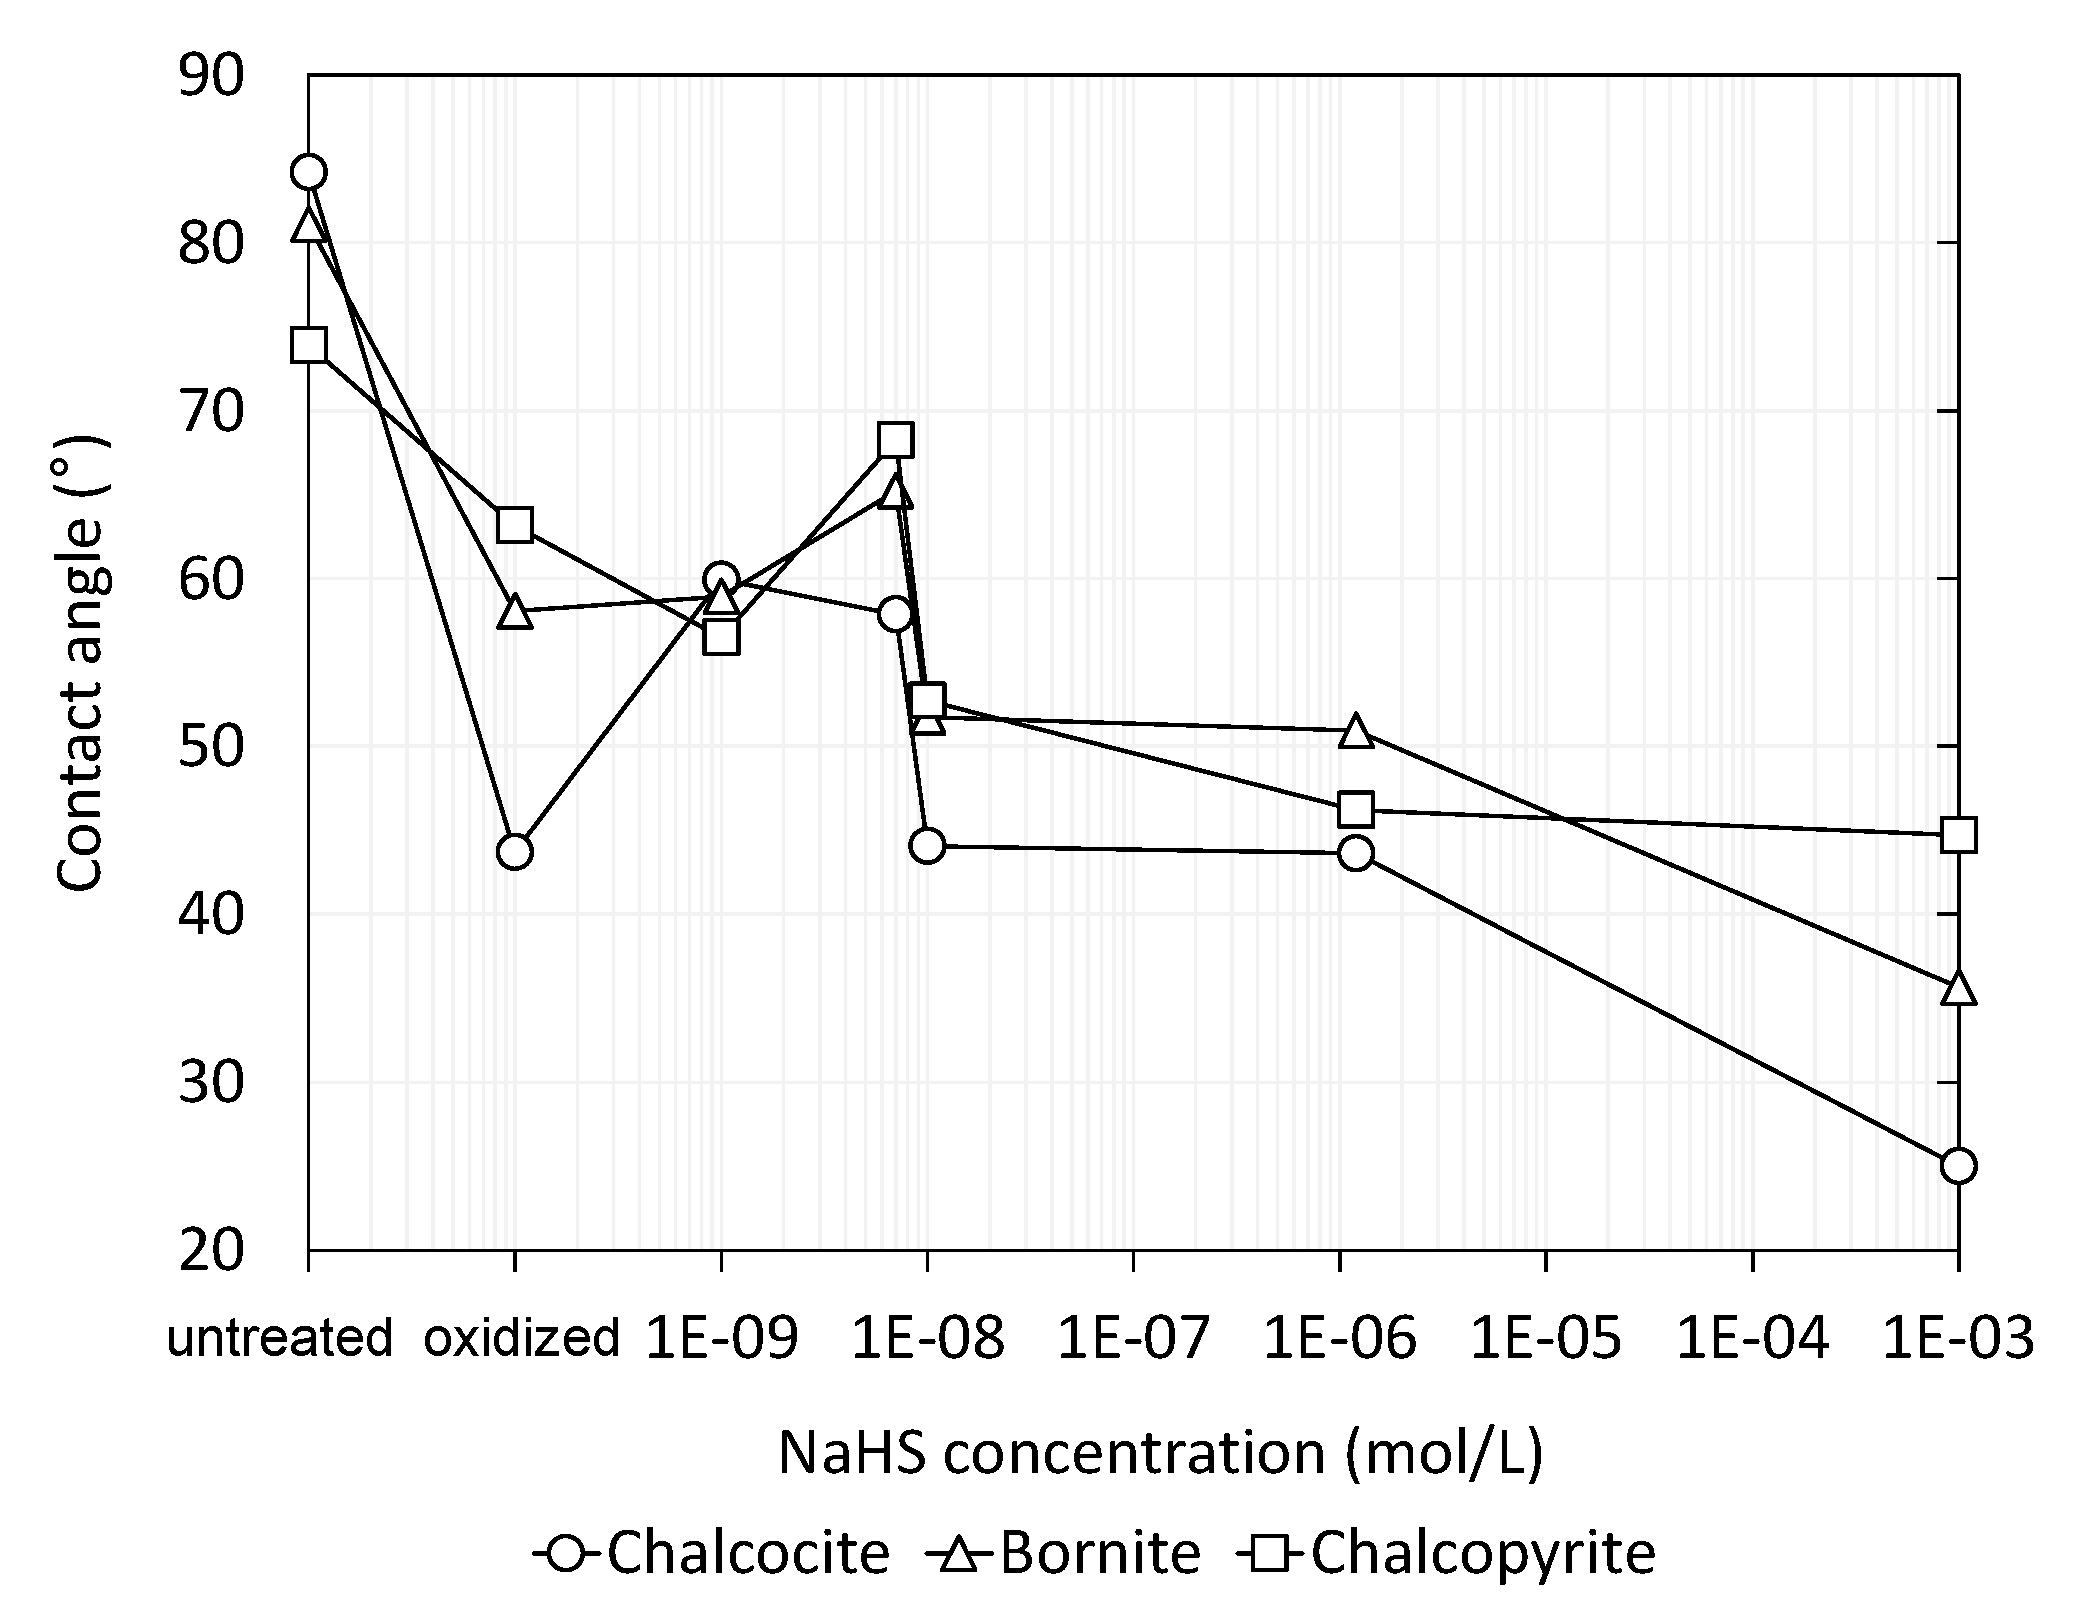
Figure 2 shows the results of contact angle measurements of chalcocite, bornite, and chalcopyrite. The contact angles of untreated chalcocite, bornite, and chalcopyrite were 58.4, 65.3, and 73.9 degrees, respectively. After oxidation treatment, the contact angle of each mineral decreased to 43.7, 58.1, and 63.2 degrees, respectively. The decrease in the contact angle after oxidation treatment indicates that untreated surfaces changed into hydrophilic, i.e., the floatability of these minerals decreased.
After oxidation treatments, NaHS treatments were conducted. At 1.0 × 10⁻⁹ and 7.0 × 10⁻⁹ M NaHS treatment to chalcocite, the contact angle of the surface turned from 43.7 degrees to 59.9 degrees. That is because NaHS activated the chalcocite surface. As the NaHS concentration was increased over 1.0 × 10⁻⁸ M, the effect of activation was not able to be confirmed. Moreover, when NaHS concentration was increased to 1.0 × 10⁻³ M, the contact angle drastically decreased and the surface of chalcocite became hydrophilic. This indicates that high concentration NaHS treatments have a depressive effect on chalcocite flotation. In the case of bornite, after 1.0 × 10⁻⁹ M NaHS treatment, the contact angle value of bornite did not almost change, which indicates that 1.0 × 10⁻⁹ M NaHS treatment did not alter the oxidized bornite surface. As the NaHS concentration was increased to 7.0 × 10⁻⁹ M, the contact angle of the bornite surface increased. The contact angle of the bornite decreased with increasing NaHS concentration similar to chalcocite. In the case of chalcopyrite, it was found that the contact angle trend was almost the same as bornite.
The results of each mineral’s contact angle measurements indicate that NaHS works differently depending on the concentration. Low concentrations of NaHS (i.e., 1.0 × 10⁻⁹ to 1.0 × 10⁻⁸ M) had the effect of activation on the oxidized surfaces of copper sulfide minerals, while high concentrations (i.e., over 1.0 × 10⁻⁸ M) contributed to the depression of minerals.
3.2. Single Mineral Flotation Tests with the Small Column Cell
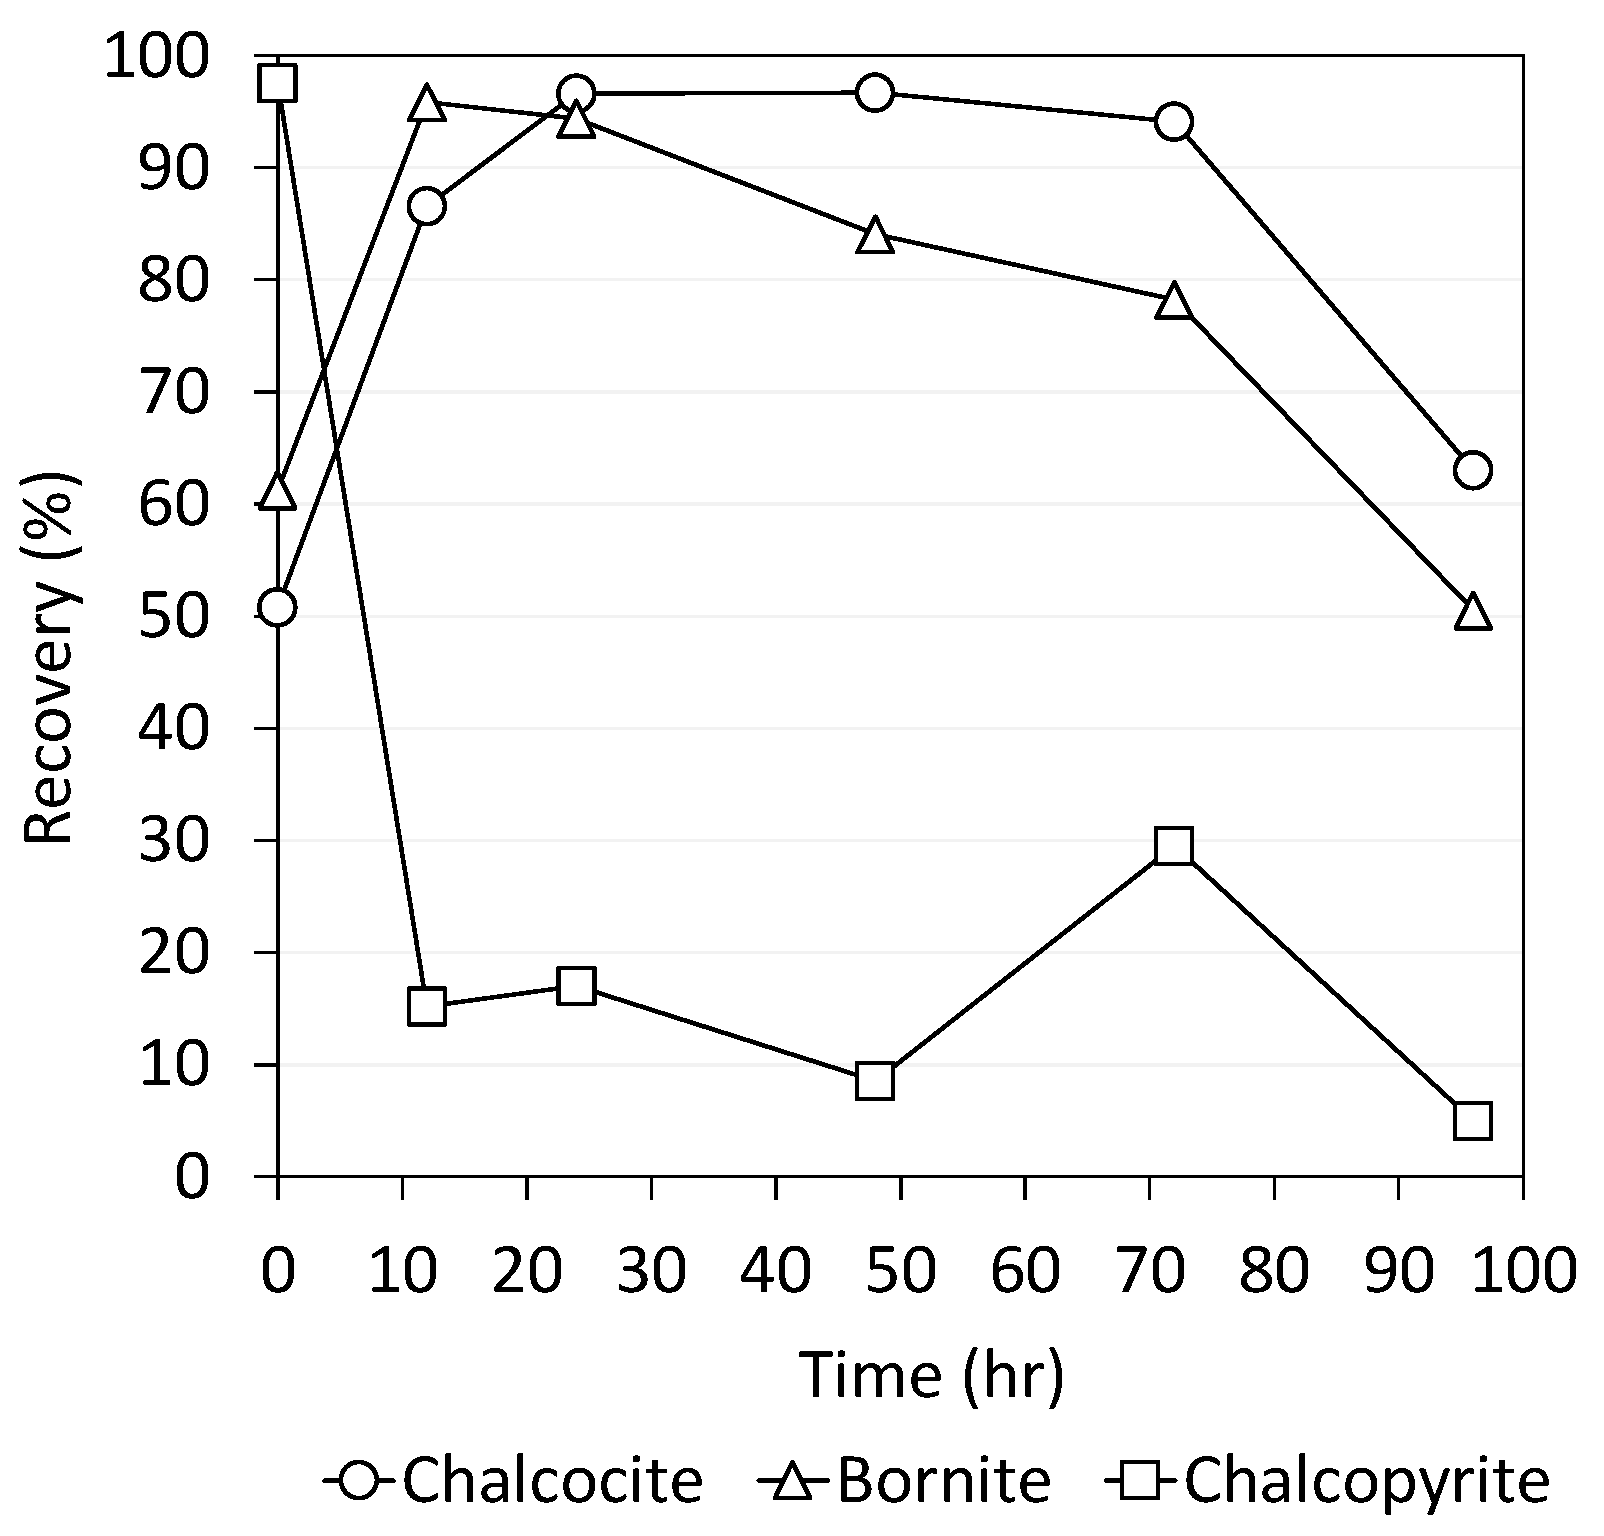
According to Figure 3, flotation tests at several conditions of oxidation time were conducted to decide a condition of oxidation time. The results of chalcocite showed that the recoveries during 12 h to 72 h maintained high recovery, while the recovery suddenly decreased at an oxidation time of 96 h. The recoveries of bornite decreased gradually as oxidation time increased. Surprisingly, the recovery of chalcopyrite was less than 20% at 12 h and kept low recoveries at most of the conditions. The different trends of the minerals’ floatability after oxidation could contribute in the content ratio of iron. Chalcopyrite, which has a high iron content, was oxidized and its surface was covered with large amount of iron oxides. Dissolution of copper oxides and sulfates led to surface exposure of sulfides, but iron oxides remained on surfaces [36]. Therefore, it was considered that the floatability of chalcocite containing no iron was the highest, followed by bornite and chalcopyrite having the highest iron content. Based on Figure 3, the condition for more heavily oxidized copper sulfides, i.e., 96 h, was chosen for use in succeeding flotation tests to evaluate the activation and depression of minerals by NaHS.
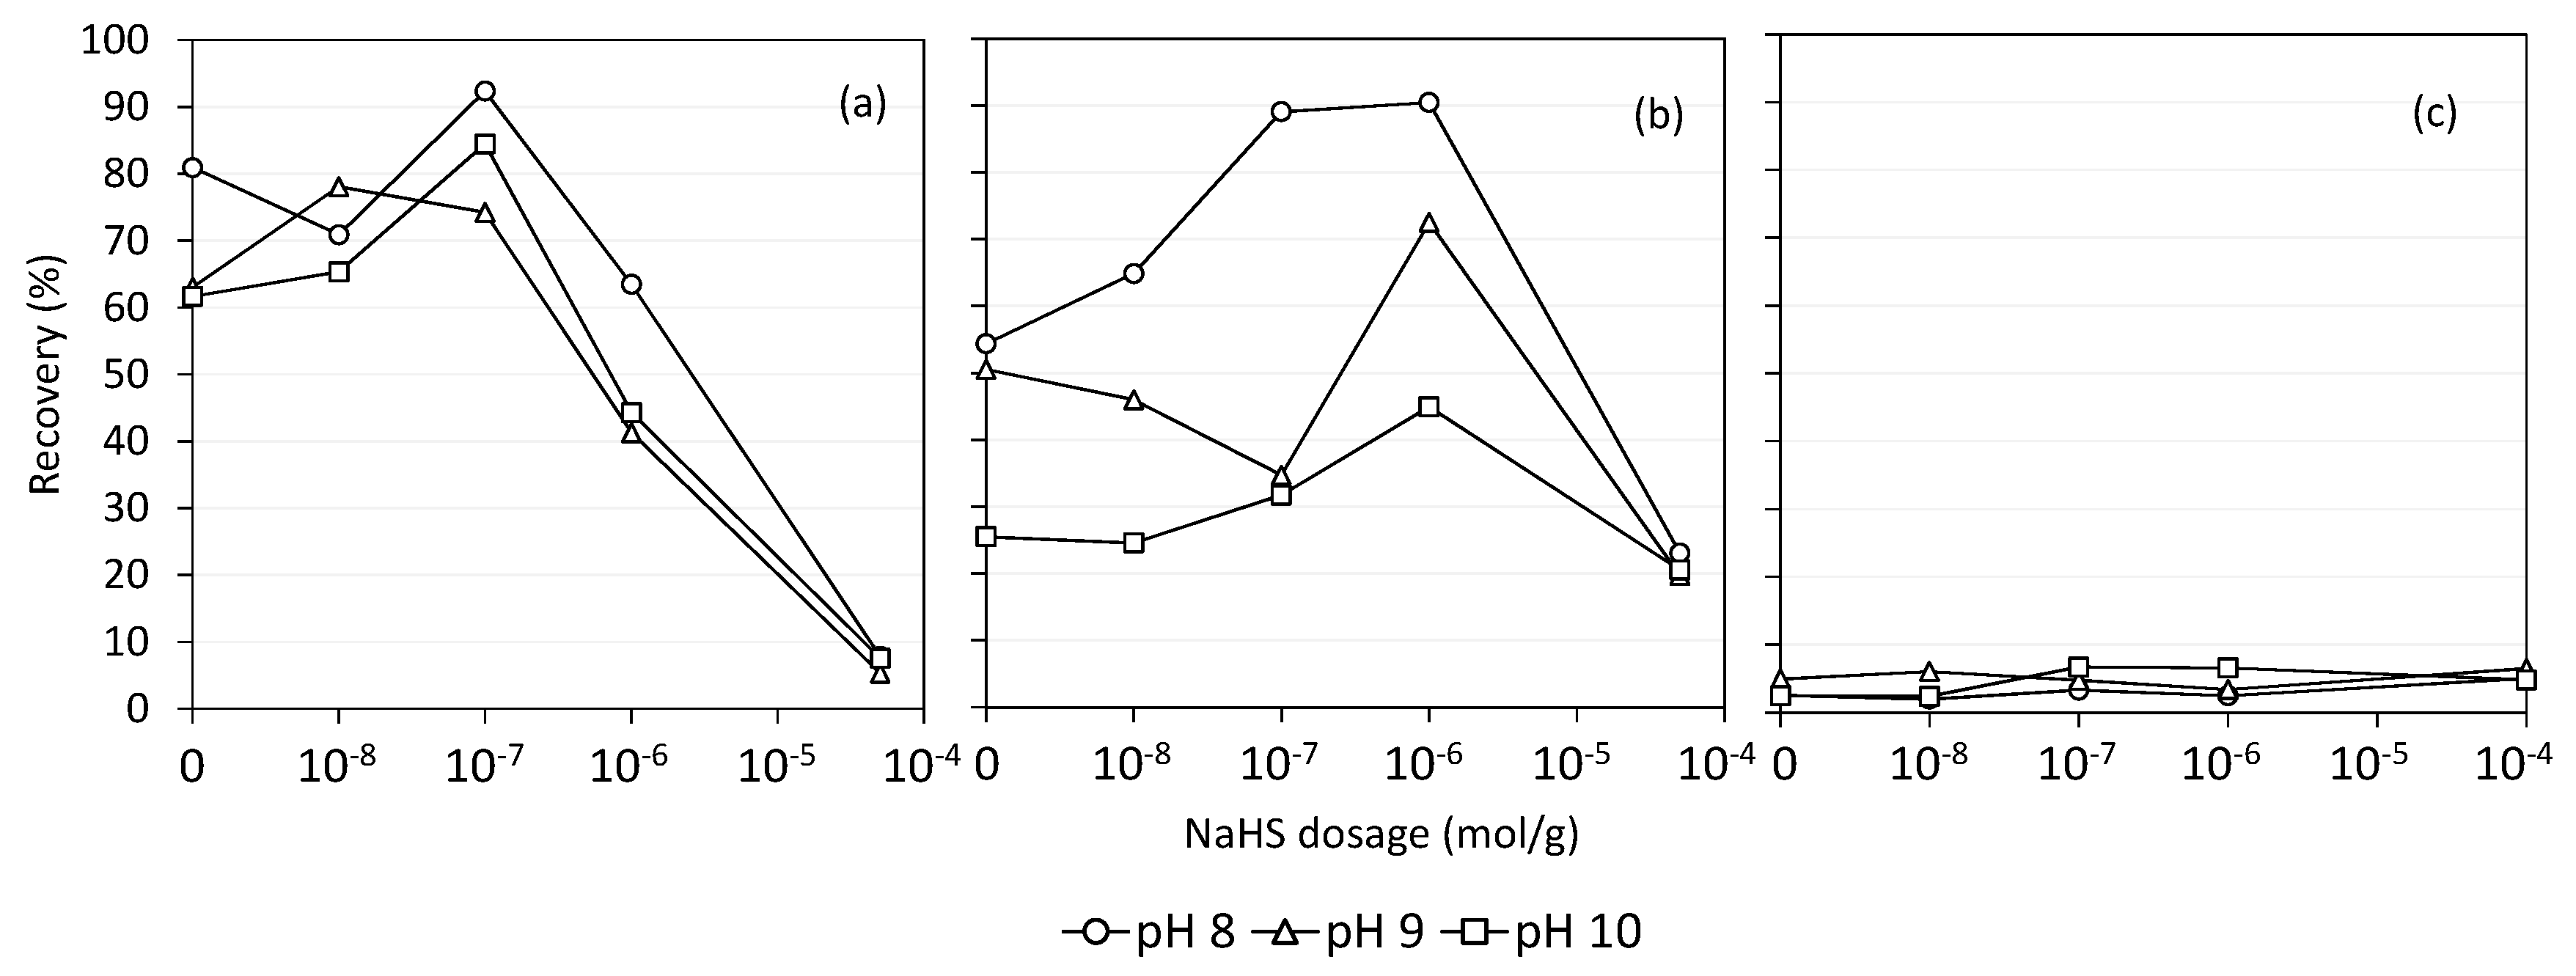
Figure 4 shows the single mineral flotation results of chalcocite, bornite, and chalcopyrite. Compared to the recovery without NaHS (0 mol/g), the recoveries of chalcocite increased at NaHS dosage of 1.0 × 10⁻⁷ mol/g, regardless of pH. On the other hand, as the NaHS dosage further increased, the recoveries decreased sharply. The behaviors of bornite recoveries indicated the dependence on pH. Without NaHS treatment, the recovery at pH 8 was the highest value in all pHs. After NaHS treatments, the recoveries increased within NaHS dosage of 1.0 × 10⁻⁷ to 1.0 × 10⁻⁶ M, and the result at pH 8 showed the highest recovery. Then the recoveries decreased as NaHS dosage increased. The flotation results of chalcopyrite showed that the floatability was completely low at any condition of NaHS dosage and pH. The floatability of chalcocite increased by the addition of a small amount of NaHS because of activation by NaHS, because oxidized copper species produced on the chalcocite surface were reacted with NaHS, and their species changed into copper sulfides [36]. Bornite recoveries also increased at any pH condition by a small dosage of NaHS. Moreover, the effect of pH was confirmed, and it was found that the floatability at low pH (pH 8) was higher than the high pH condition. This can be because of complex ion, Fe(HS)20 [36]. Iron oxidized species were dissolved into solutions as Fe(HS)20 by NaHS addition, and it was stable at a low pH. Therefore, floatability of bornite was high at low pH compare than the condition at high pH. A heavily oxidized chalcopyrite did not have the effect of activation by NaHS, because chalcopyrite surface after oxidation could be covered with large amount of iron oxides and/or hydroxides.
3.3. Mixture Mineral Flotation Tests
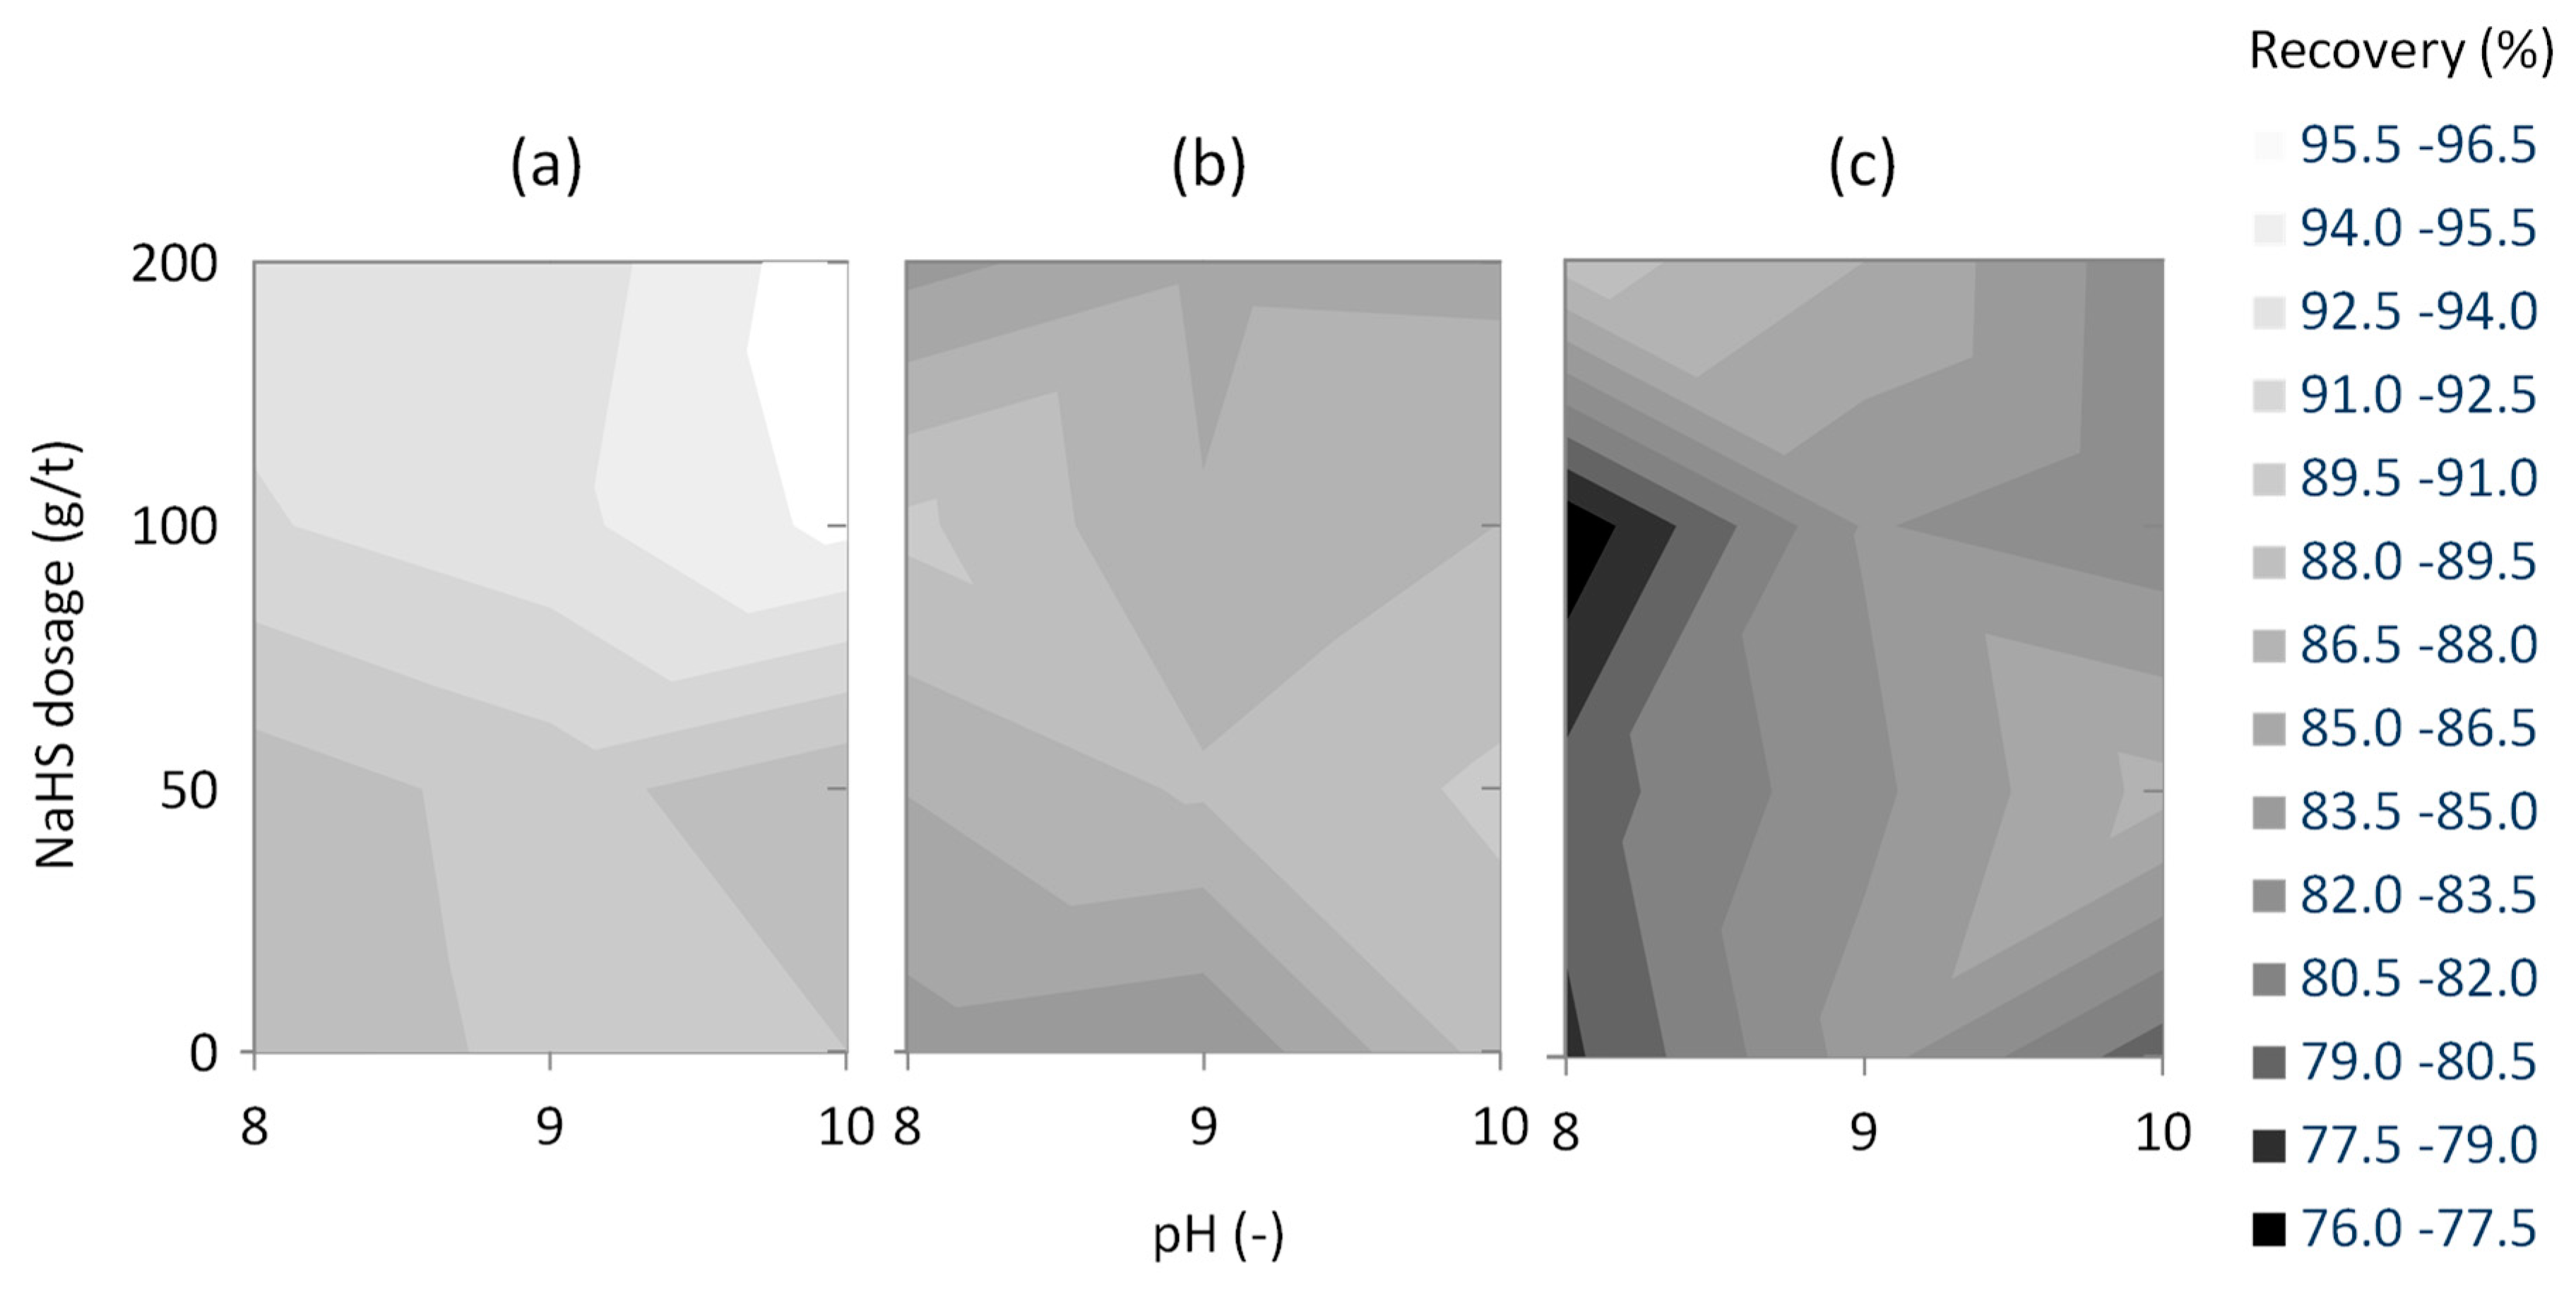
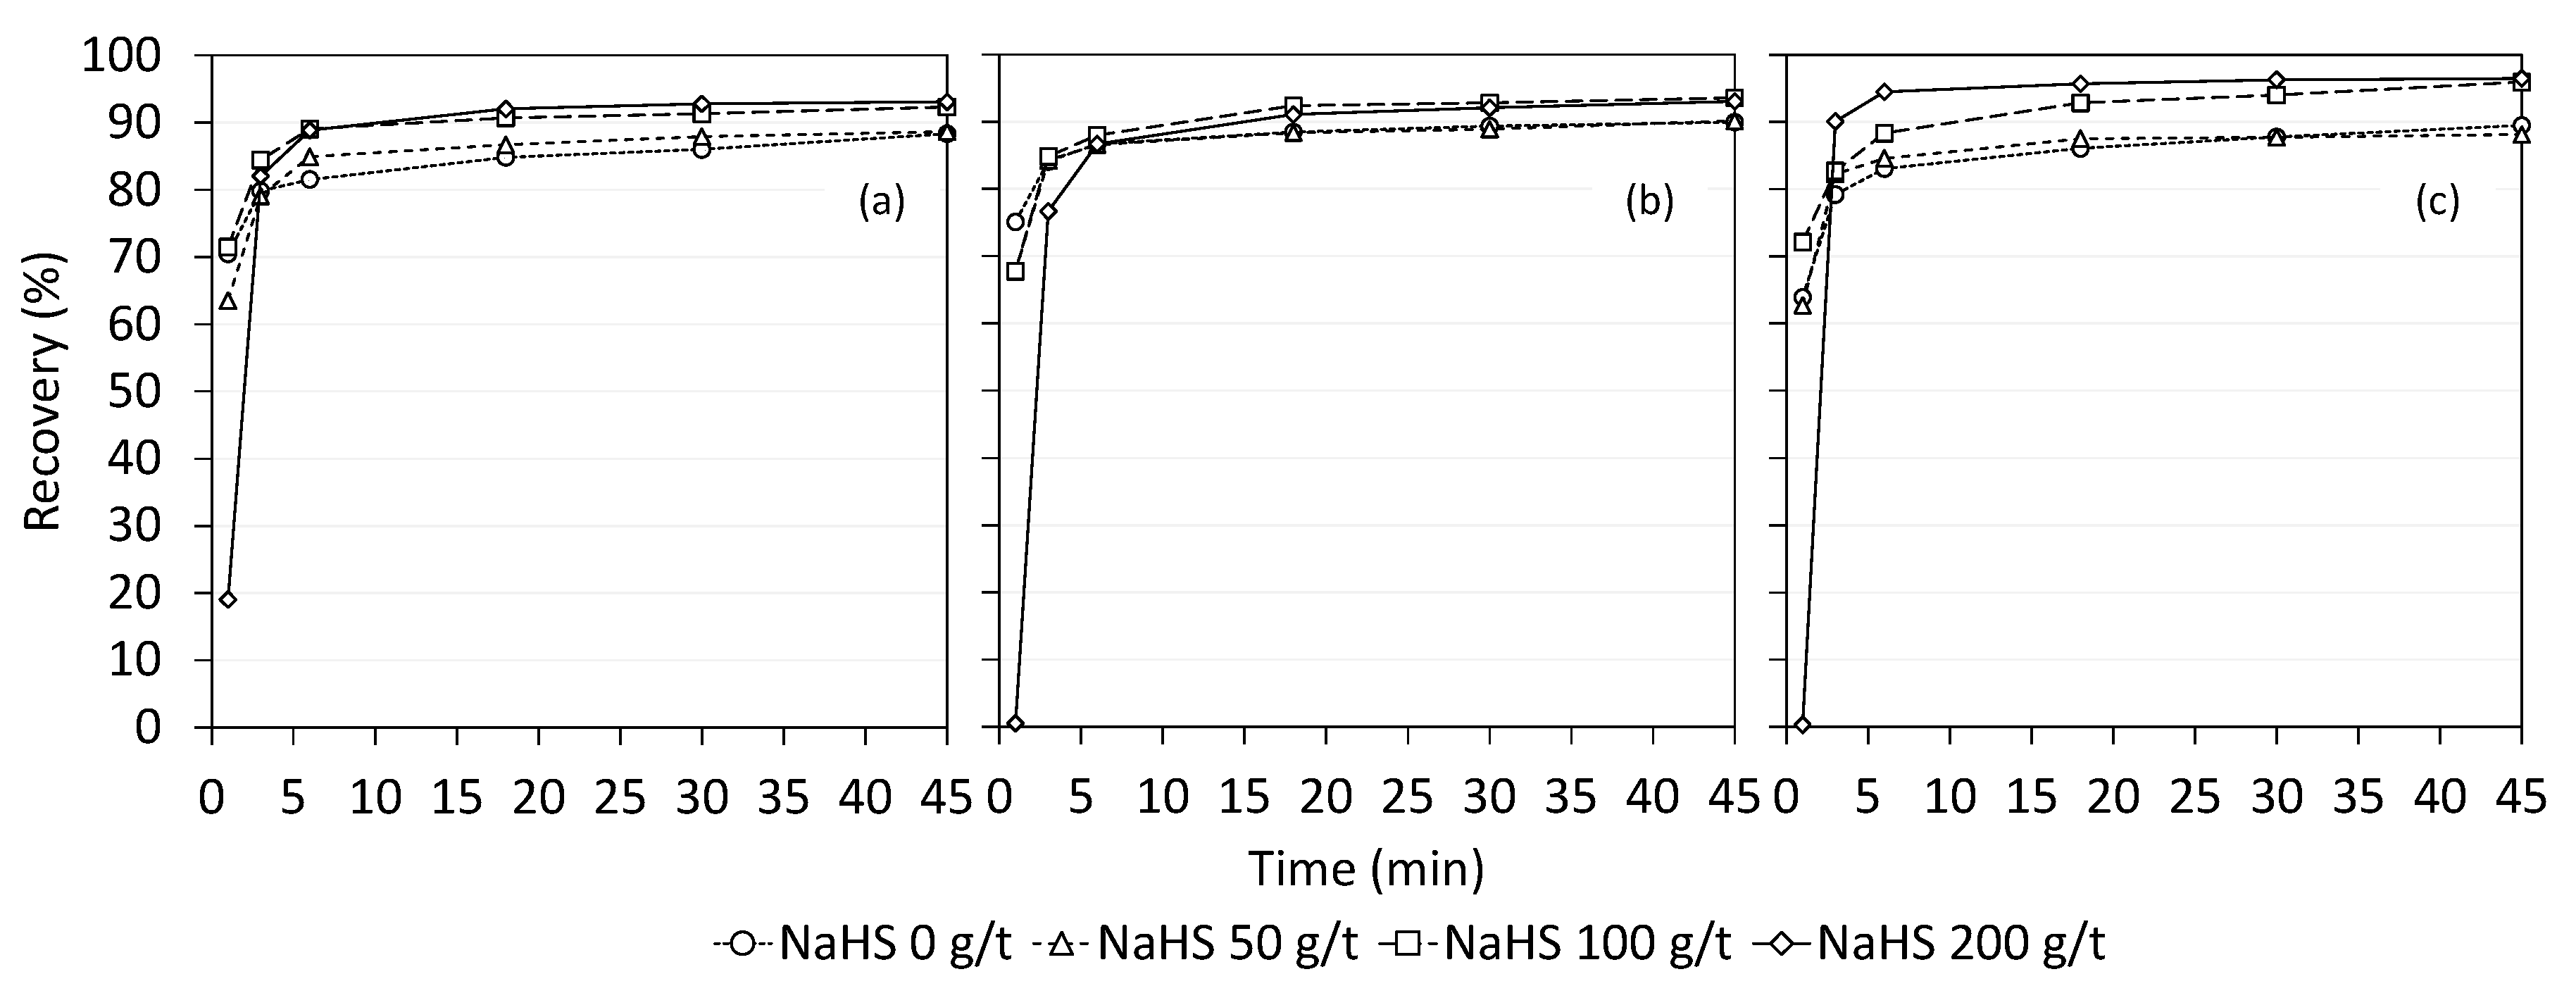
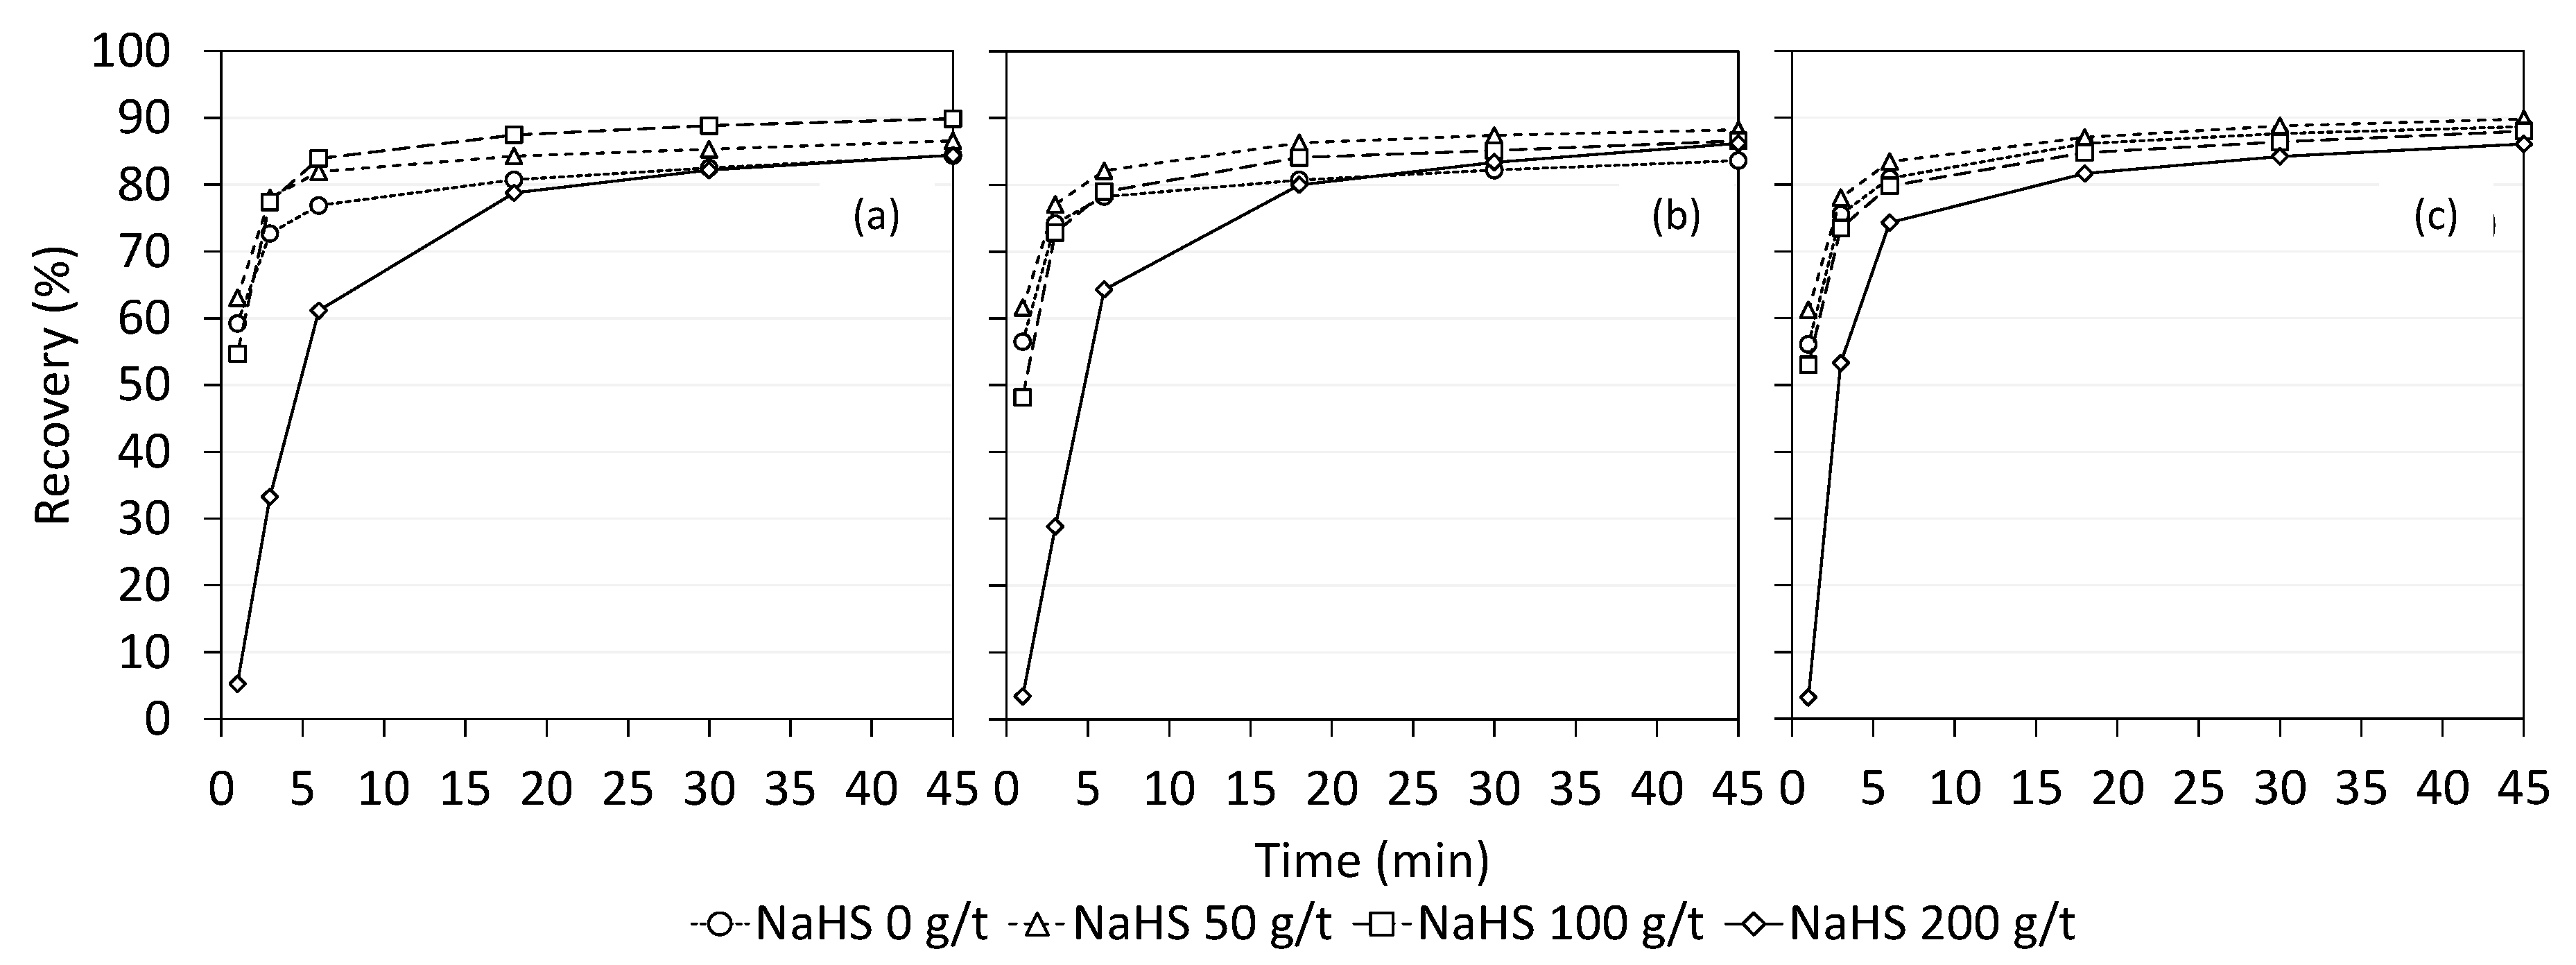
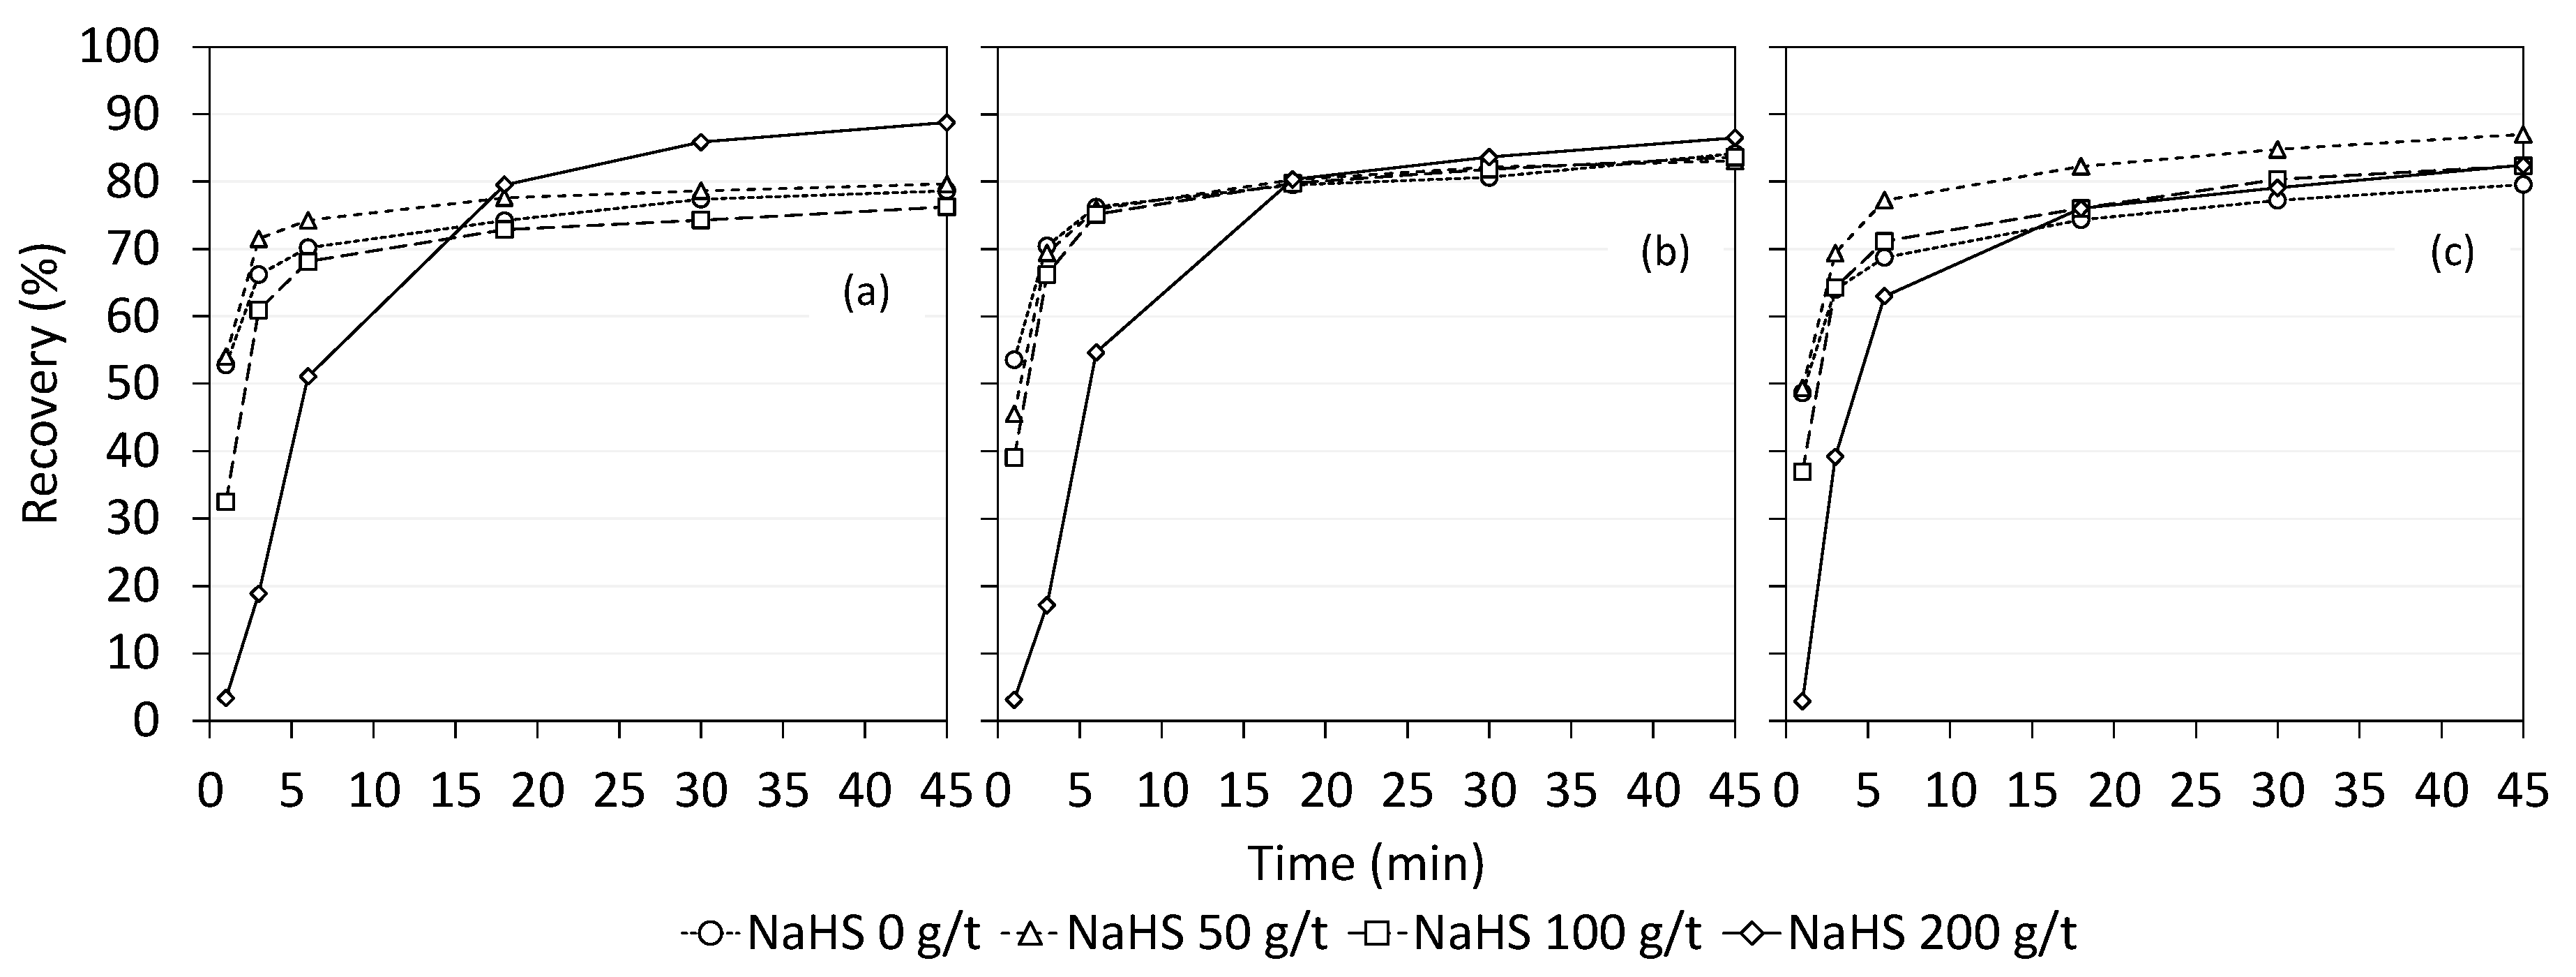
Figure 5a shows that the recoveries of chalcocite increased as pH increased and as the amount of NaHS dosage increased. At NaHS dosage of 200 g/t, the chalcocite recovery was more depressed by NaHS at the initial stage of the flotation as shown in Figure 6. Figure 5b suggested that the bornite was activated at low pH and its recovery increased. On the other hand, as pH increased, the bornite was activated only by a small amount addition of NaHS and tended to be depressed even with a relatively small amount of NaHS. In Figure 7, the depression of bornite occurred at NaHS dosage of 200 g/t. The results of chalcopyrite in Figure 5c indicated that chalcopyrite was activated and its recovery increased at high pH and an optimum NaHS dosage. Figure 8 shows that the initial stage of chalcopyrite recoveries decreased at NaHS dosage of 200 g/t by the depression effect of NaHS. Therefore, it was considered that the pH and the NaHS dosage had significant influences on the activation and depression of each mineral. Compared with the results of single mineral flotation tests, the recoveries of the single mineral flotation tests were lower than that of mixture mineral flotation tests, because of the difference in the progress of oxidation. However, it was considered that the trends of activation and depression by NaHS and effect of pH were same between single and mixture mineral tests. The summarized diagrams are shown in Table 5.
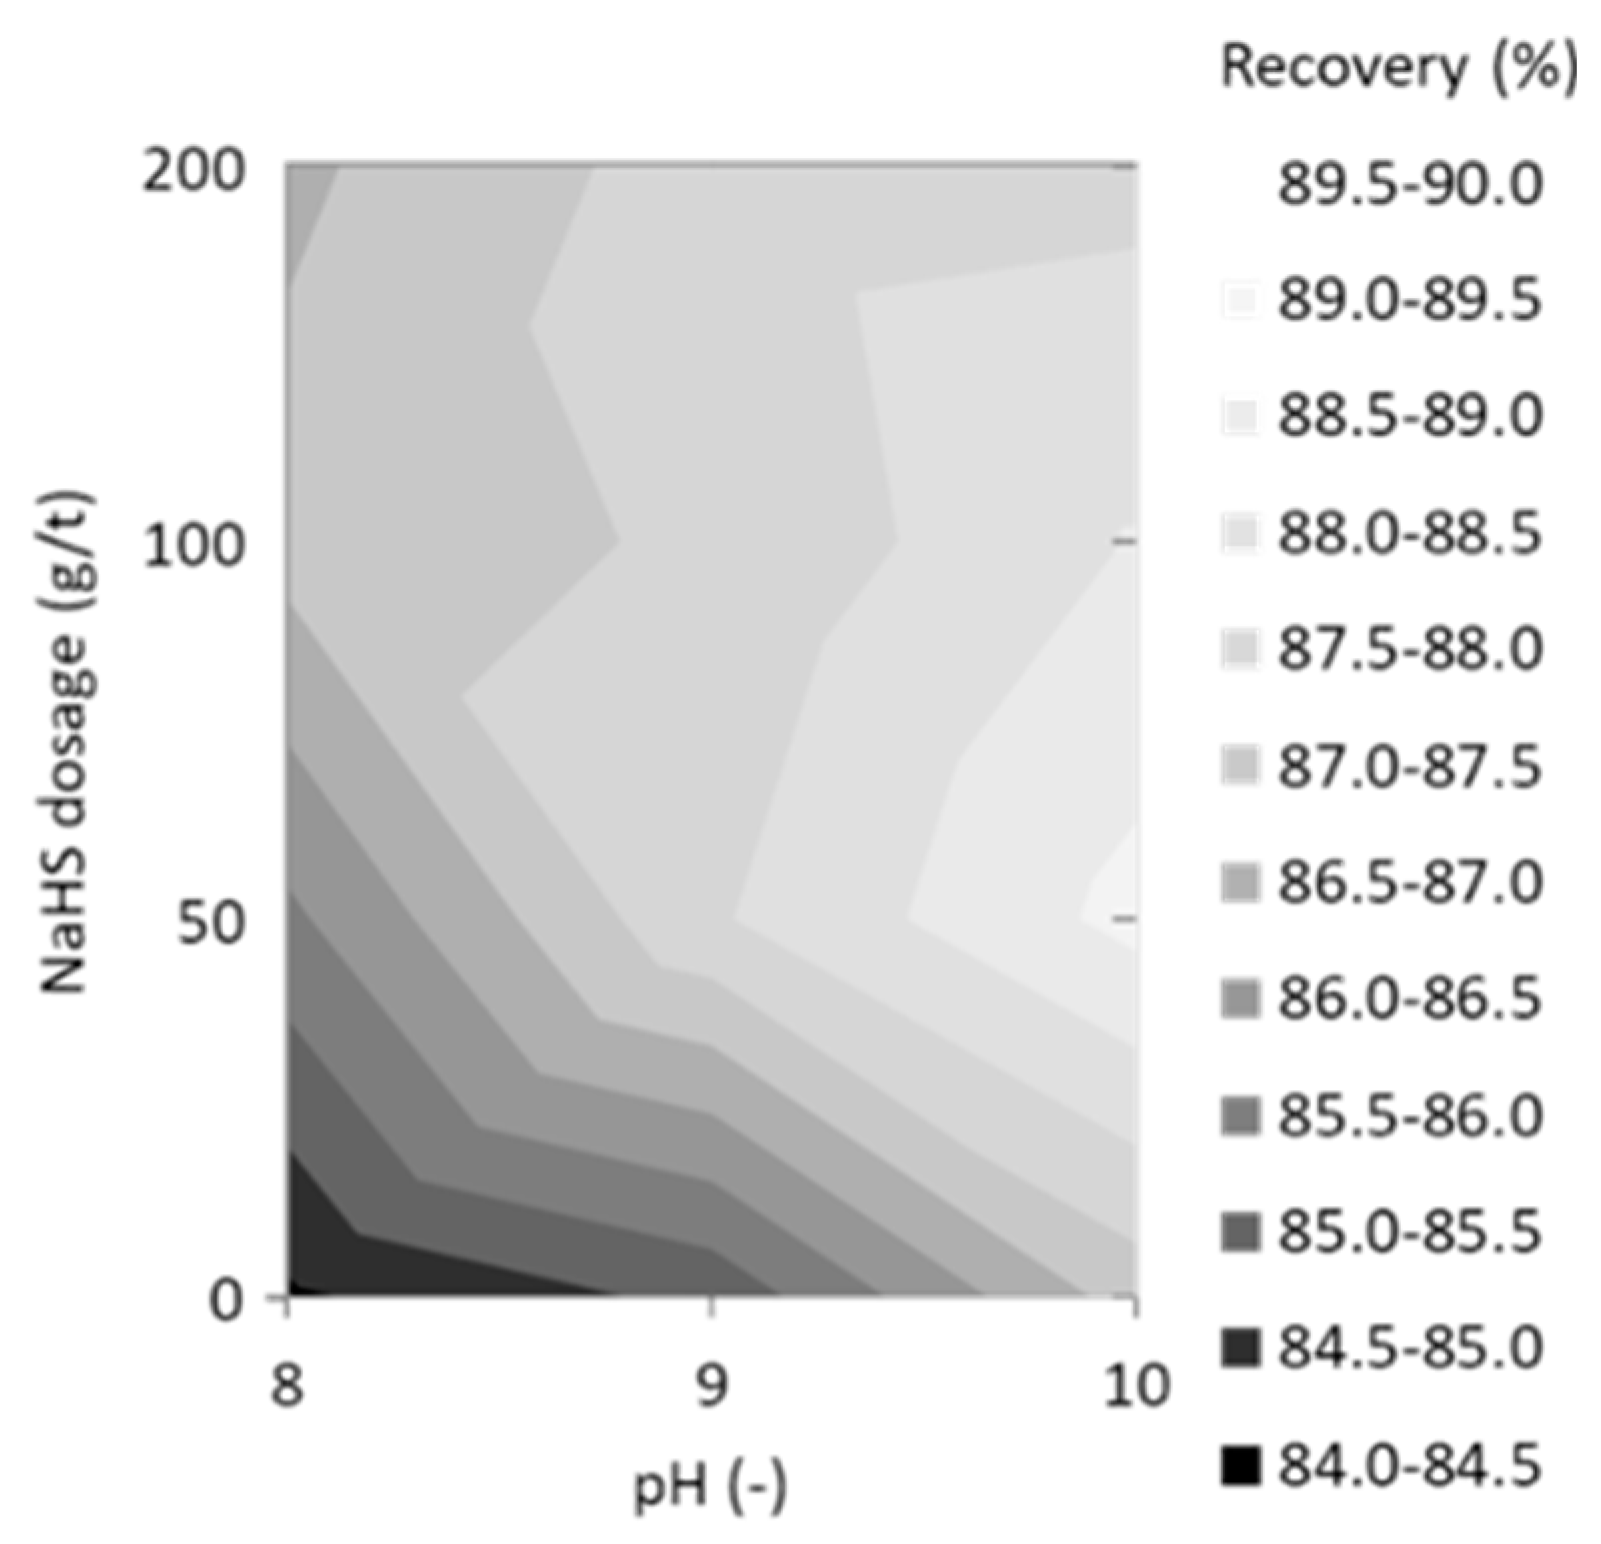
It was considered that the three minerals had in common trends of positive correlation between the activation and the NaHS dosage. One explanation is that the more the NaHS dosages there were, the more amount of copper oxides changed into copper sulfides, and the surfaces became more hydrophobic. On the other hand, there can be a threshold NaHS dosage to activate the mineral surfaces, as evidenced by the depression of the minerals and reduction of their recoveries after an observed increasing recovery with NaHS dosage. In terms of depression, the minerals had in common trends of a positive correlation between the depression and the pH and a positive correlation between the depression and the NaHS dosage. HS− ion could be more stable at higher pH and larger NaHS dosage in a solution. Remaining larger amounts of HS− ion contributed to the depression of minerals by adsorbing to the mineral surfaces [39]. The excess HS− ion after a reaction with the mineral surfaces, which contributed to the depression, is released to the atmosphere with time by the influence of air oxidation, thus the effect of depression was gradually weaker with time. Figure 9 shows the final copper recoveries at any condition of pH and NaHS dosage. The copper recoveries of the sample reflected the mineral compositions of chalcocite, bornite, and chalcopyrite. The sample was rich in bornite and chalcopyrite. Bornite recoveries increased with an optimum NaHS dosage at each pH, and chalcopyrite recoveries increased with a small amount of NaHS dosage at higher pH. Therefore, the copper recoveries increased with NaHS dosage of 50 g/t at pH 10.
3.4. Derivation of Flotation Kinetic Model
In a flotation cell, the rate of disappearance of particle mass (−dW/dt) is proportional to the particle mass in a cell (W), by the following equation [3]:
where k is the flotation rate constant. The first-order model [11] is given by integrating from time 0 to t when mass in the cell decreases from W0 (initial particle mass) to W [3]:
In this experimental system, NaHS was added to modify the surface properties of the minerals. To derive the flotation kinetic model, it was necessary to consider the rate of NaHS decreasing from the flotation system when NaHS reacted with the minerals. Therefore, the rate of NaHS decreasing, which decreased by the reaction with minerals, was substituted into k in Equation (4):
where K is the flotation rate constant, A is defined as the concentration of NaHS times 103, B is the reaction rate constant between the surfaces and NaHS. The calcurated A and B were shown in Supplementary Tables S1 to S3. The surface properties of the copper sulfide minerals reacted with NaHS were analyzed by [36], and the results of surface analyses by X-ray photoelectron spectroscopy showed that fresh copper sulfide minerals, copper sulfides produced by NaHS, and copper and iron oxides and hydroxides precipitates were generated after NaHS treatments. Therefore, the surface properties were focused on, and the three surfaces: (1) the fresh surfaces, (2) the surfaces activated by NaHS, and (3) oxides and/or hydroxides surfaces, were defined as floatability components. These considerations had been reflected in the following models:
where Ki are the flotation rate constants of the three components, Ri are the flotation recovery rates of the three components, φi are the mass fraction of each component. When i = 3, A and B are defined as 0, because oxides and hydroxide were produced by alkalinity of a solution. The equations were fitted to each mineral’s results of batch flotation tests, and each flotation rate constant of chalcocite, bornite, and chalcopyrite is shown in Figure 10, Figure 11, Figure 12, respectively.
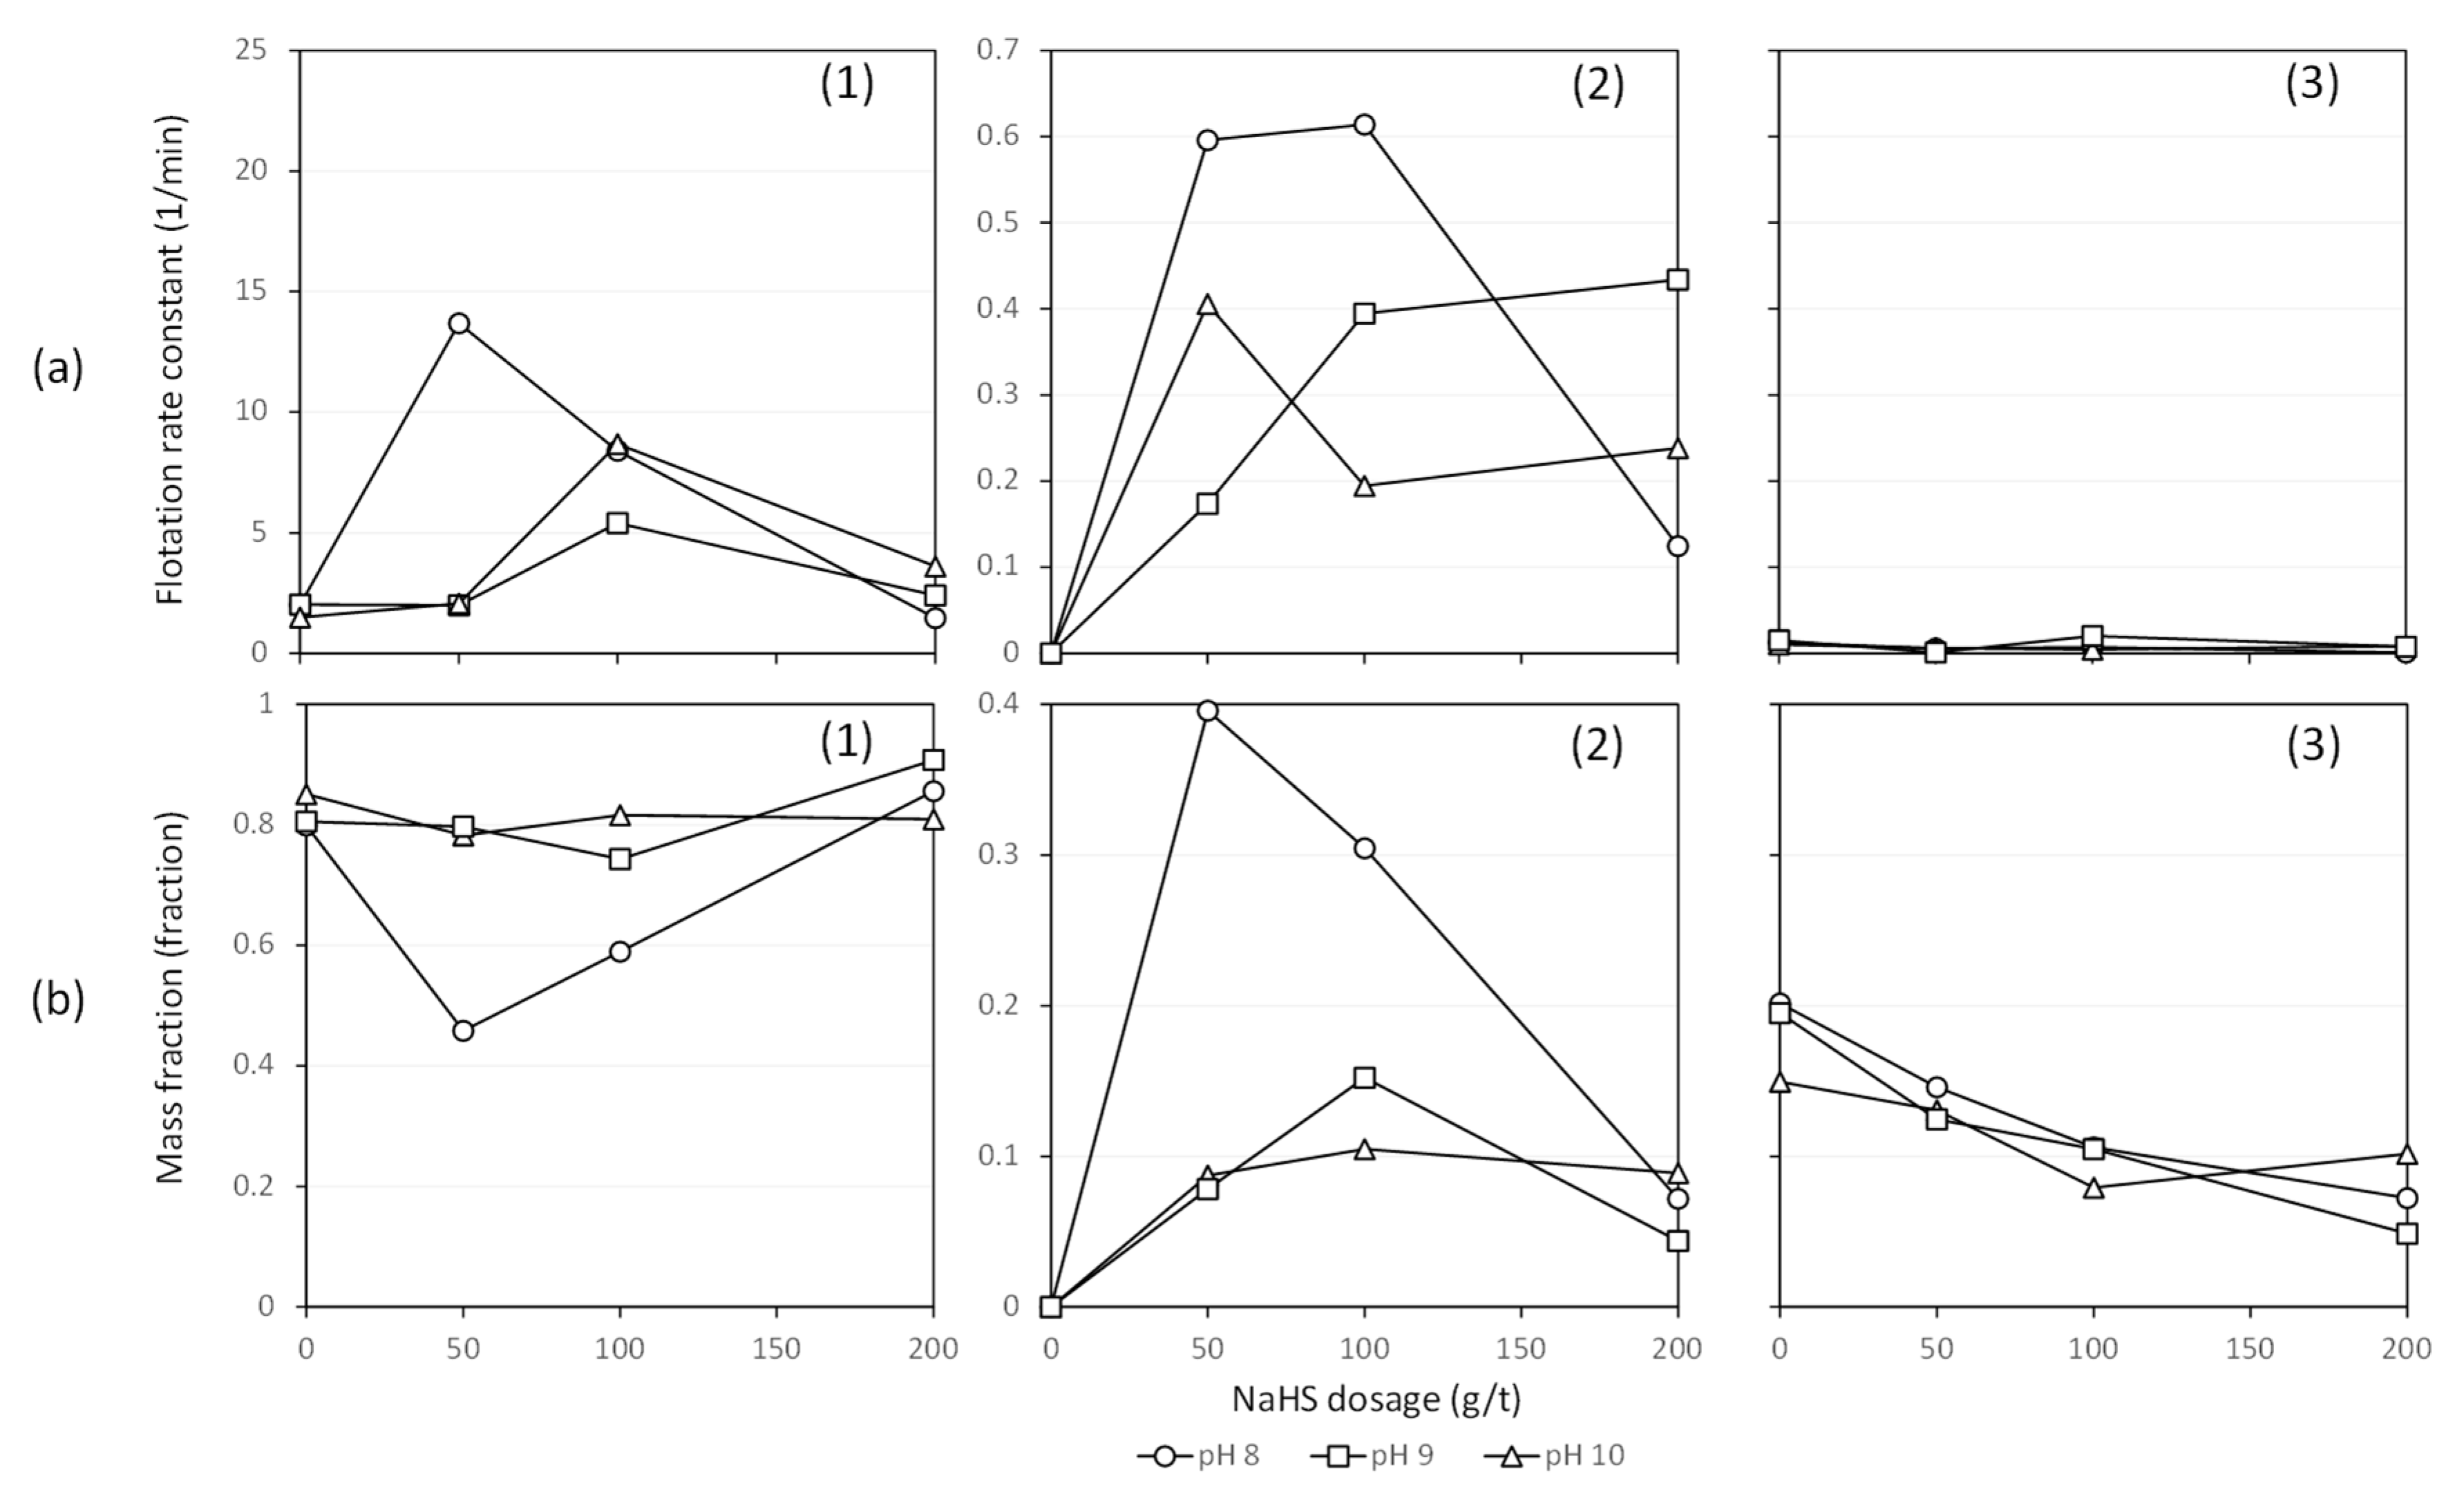
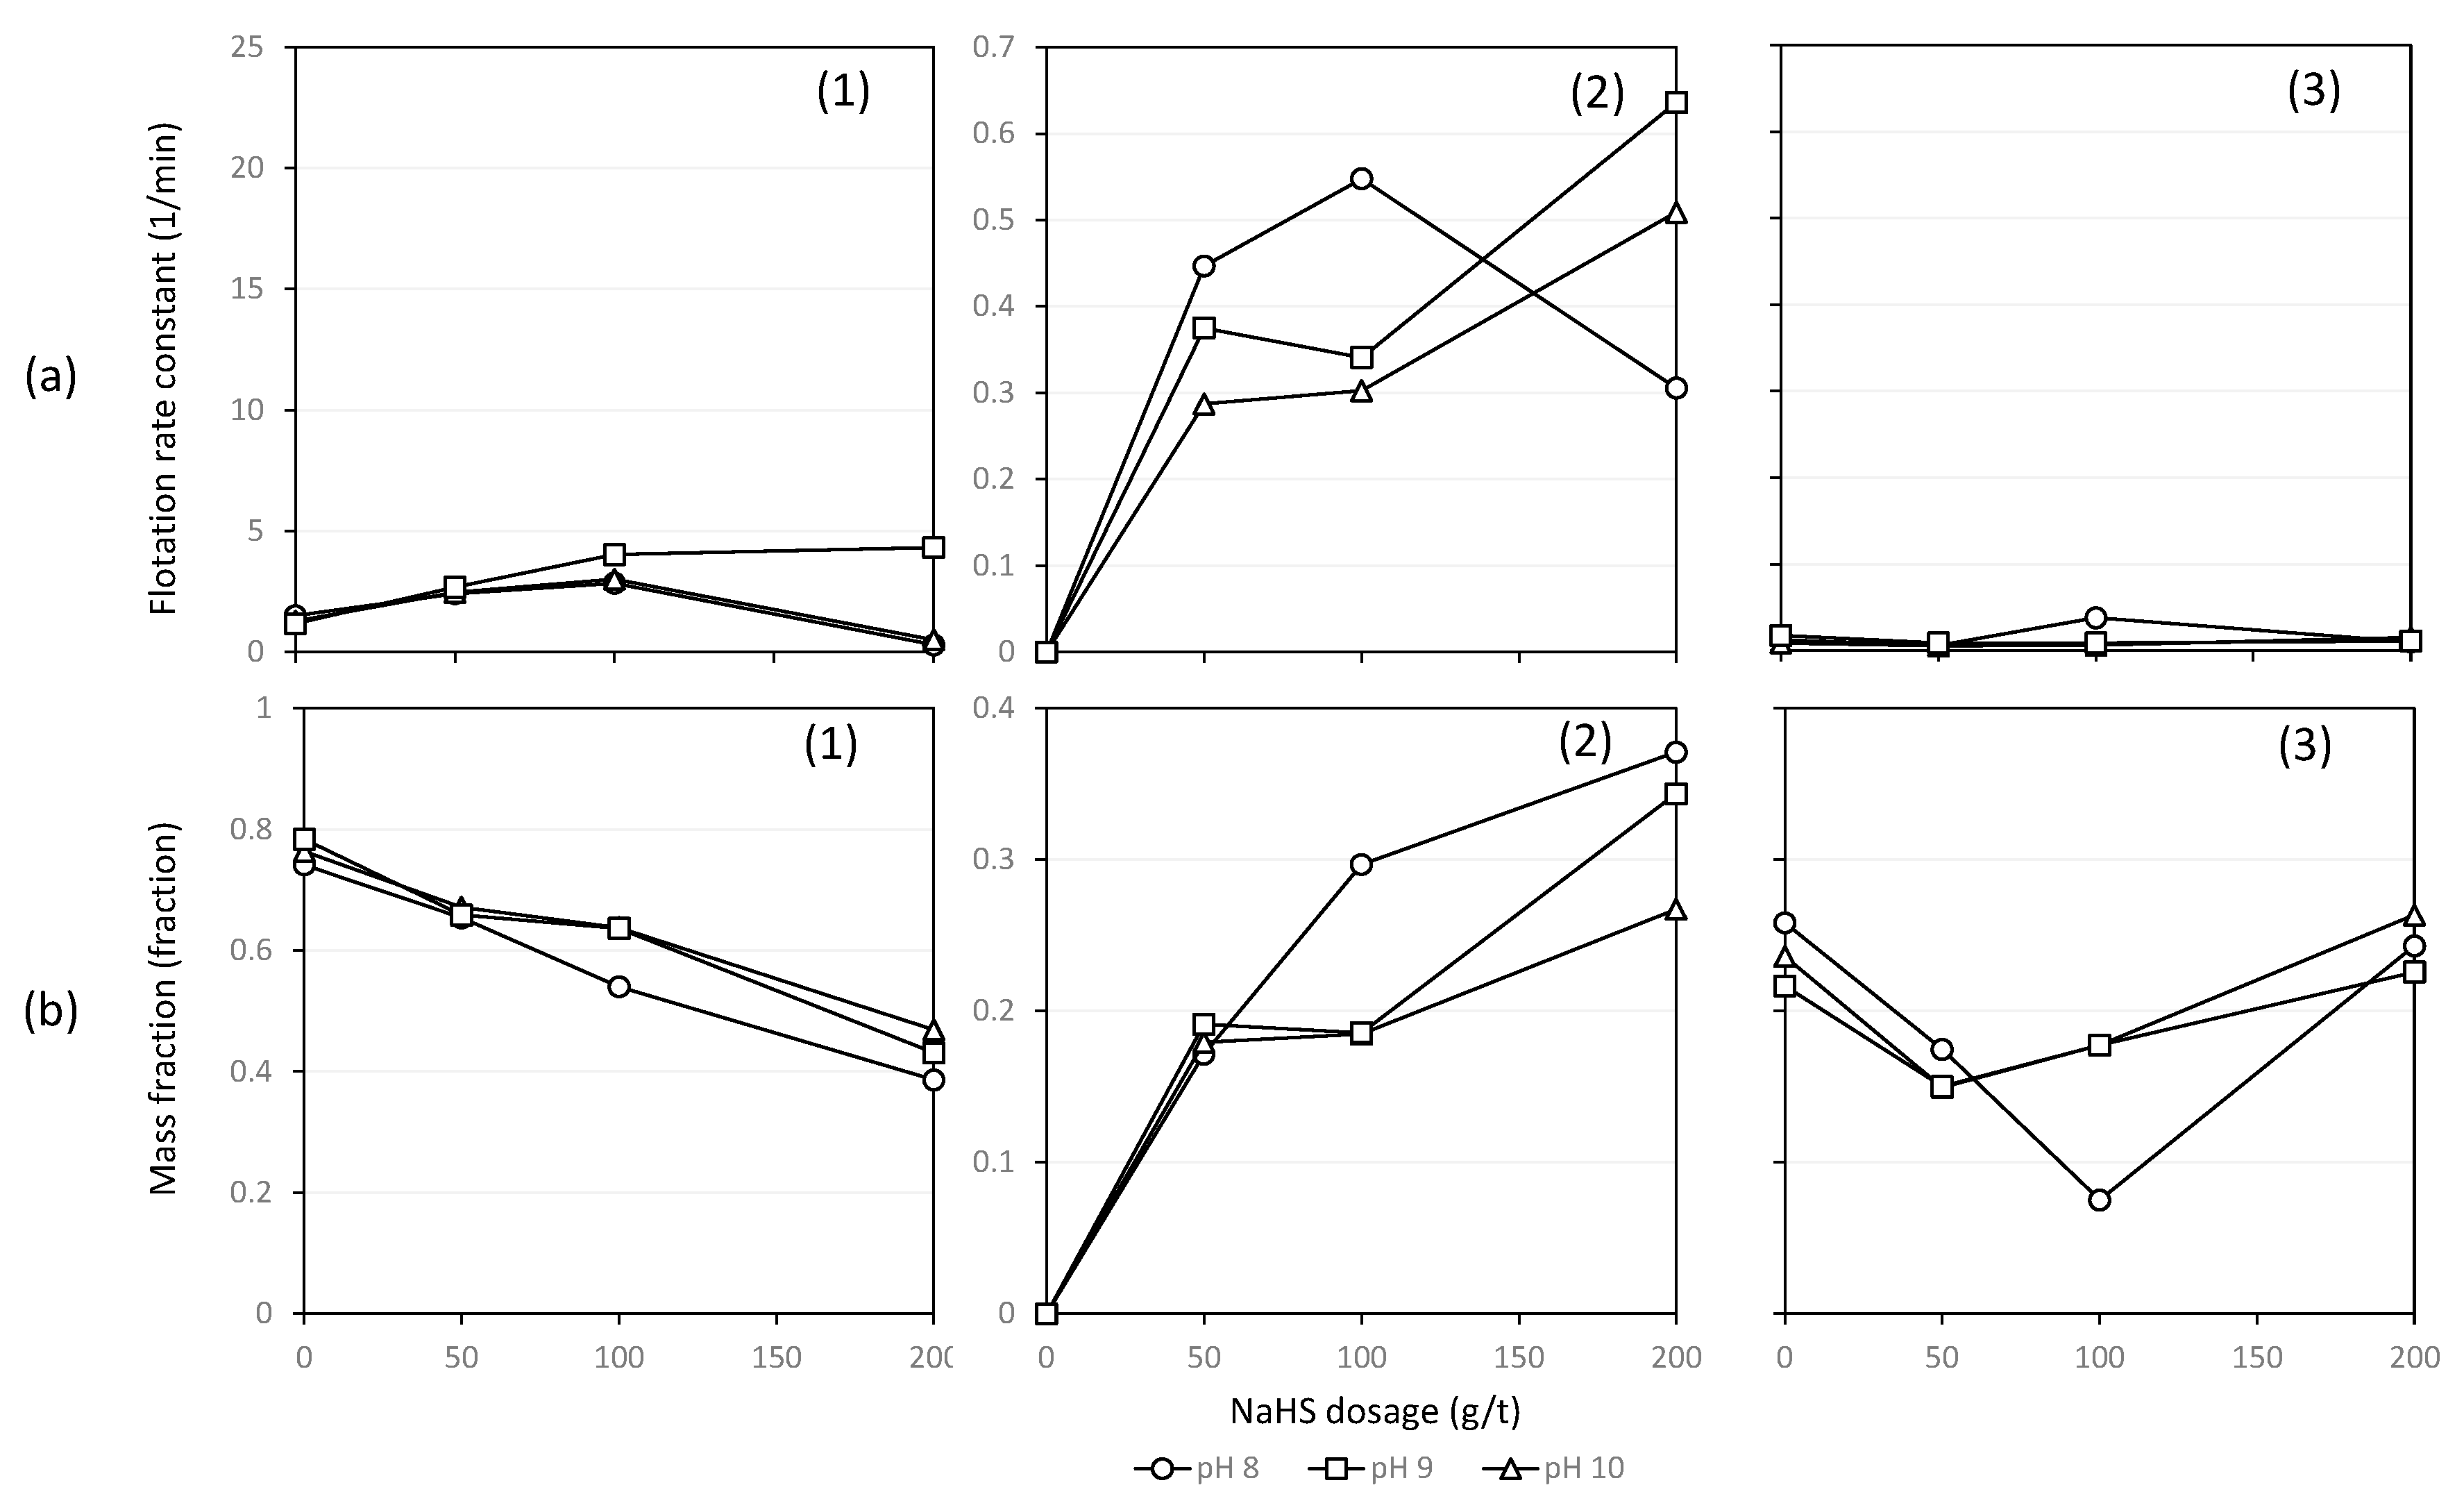
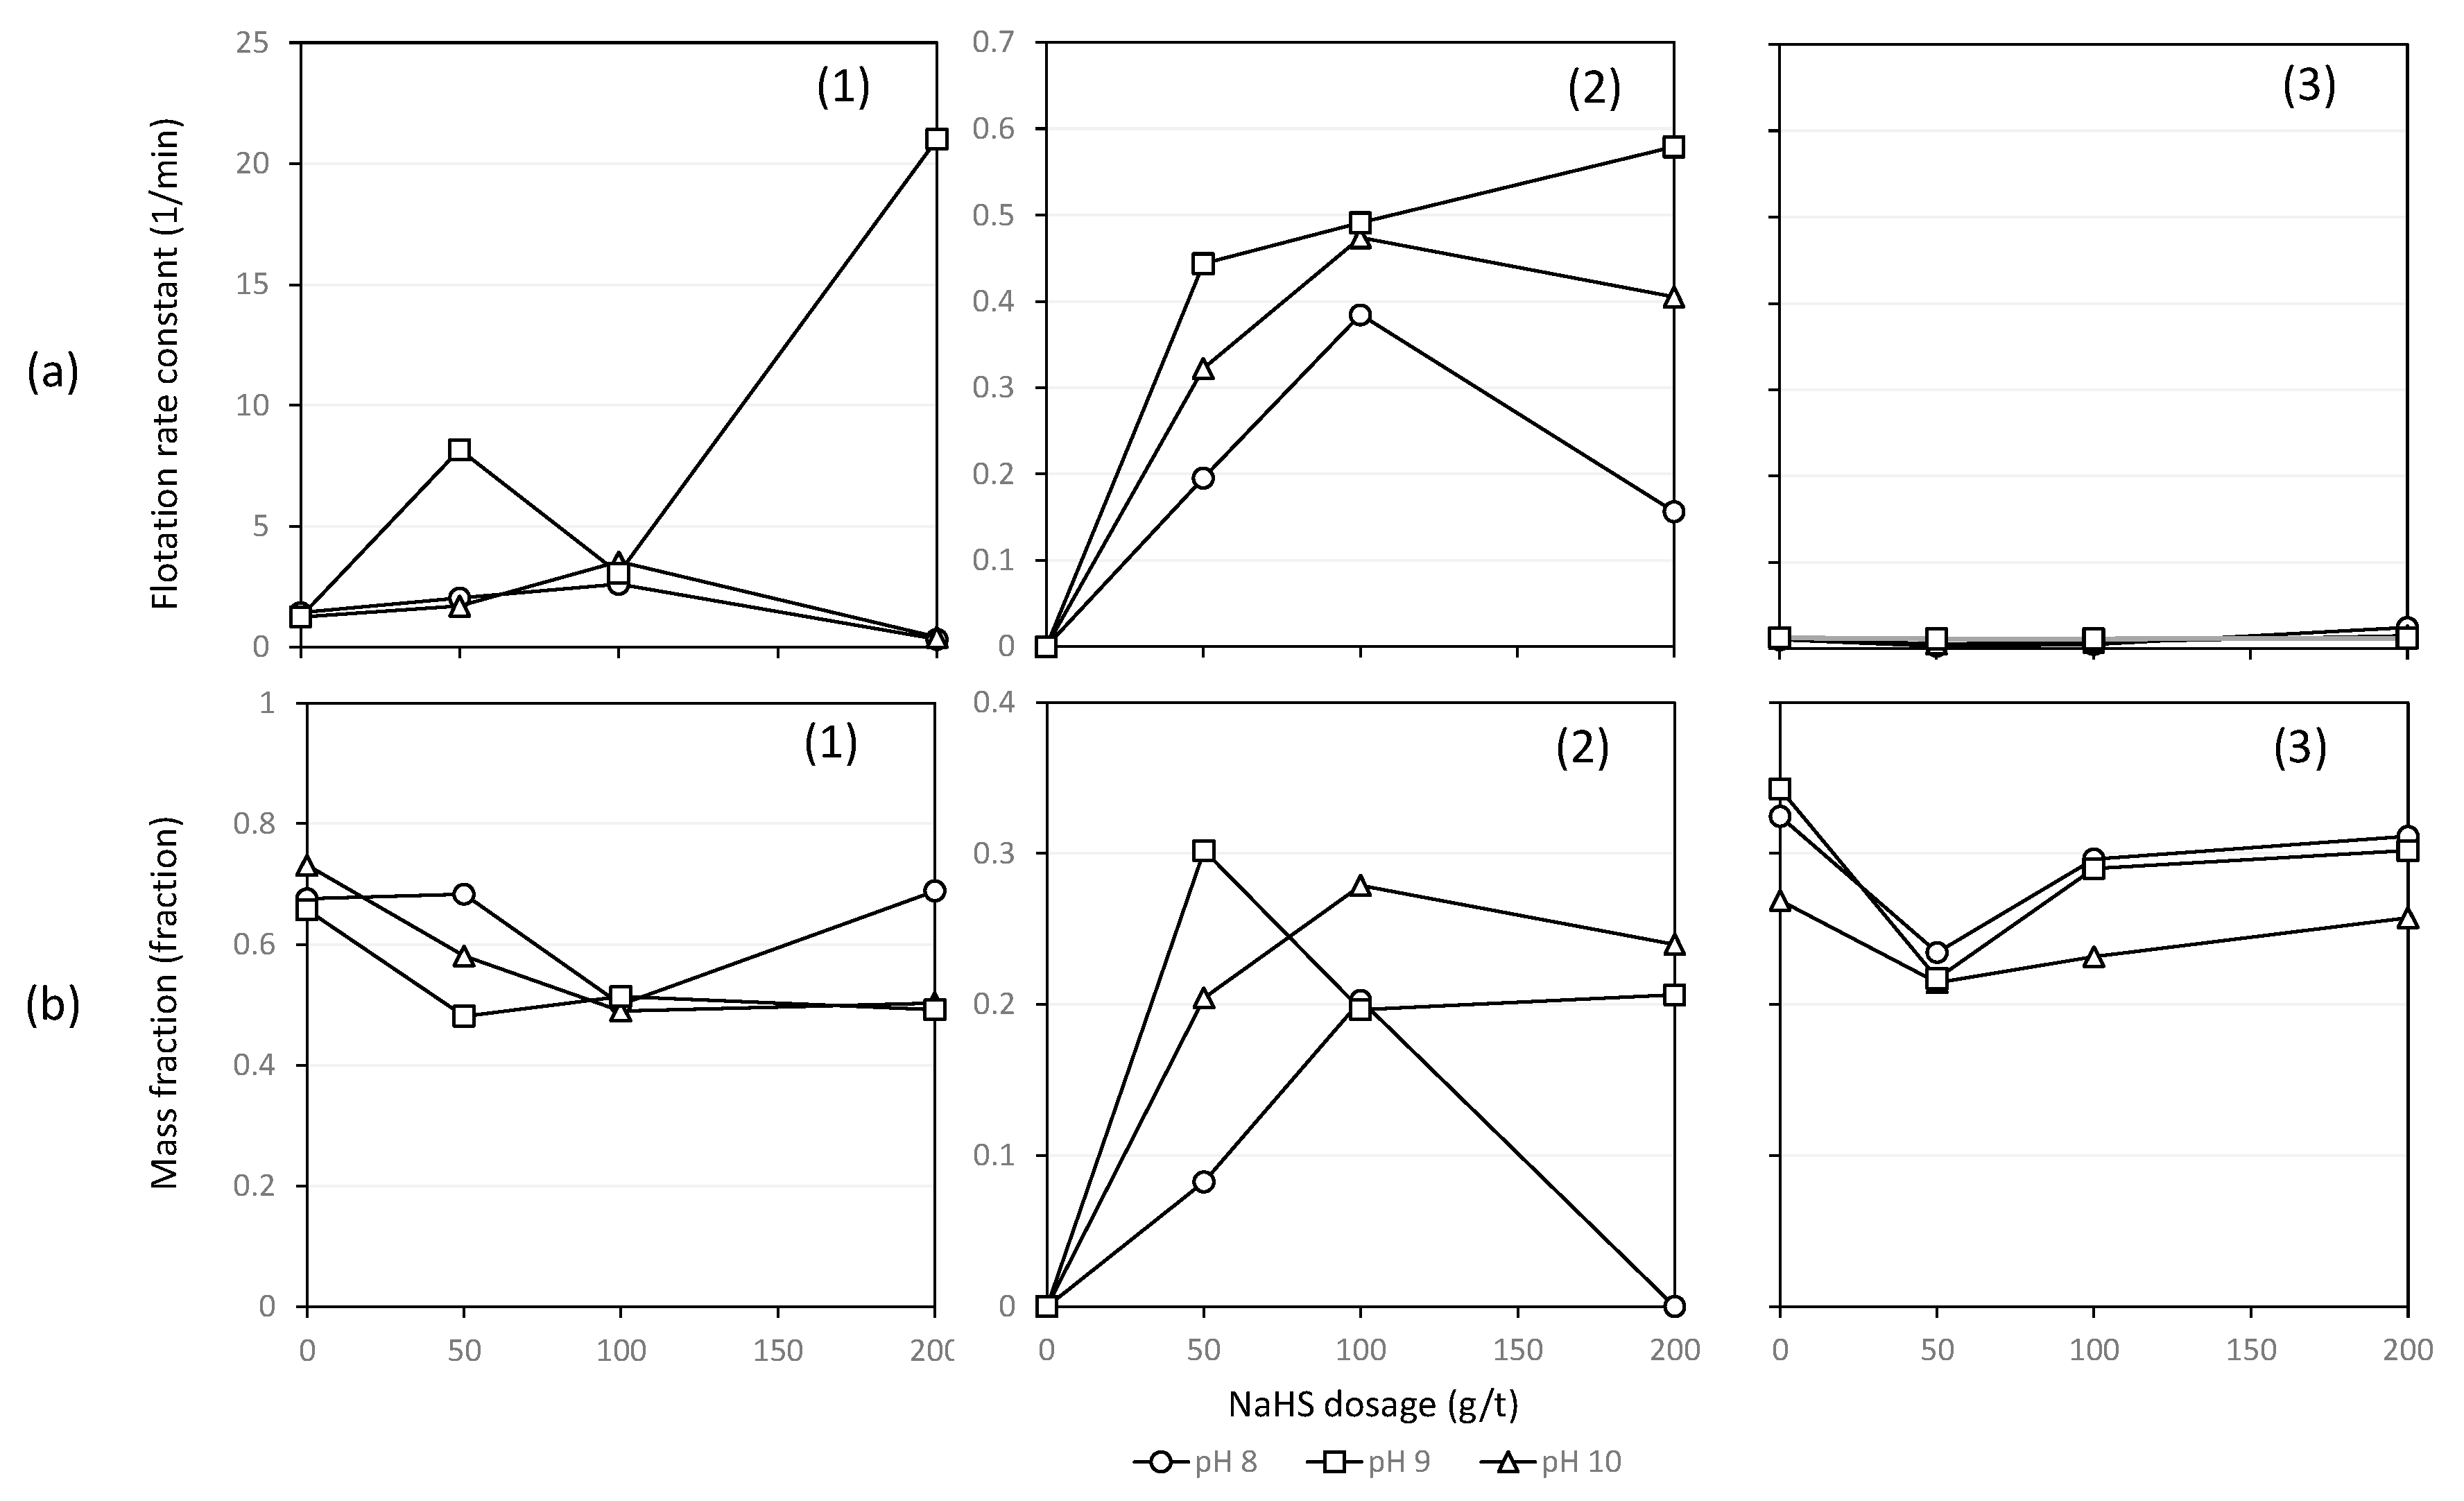
Figure 10(a1,a2) suggested that fresh surface (Cu2S) dominated the floatability of chalcocite. φ2 had a peak at each pH, and the NaHS activation was significantly influenced at pH 8. The correlation trends of all Figure 10(a3) K3 were very low values for all minerals because the floatability of oxides and/or hydroxides was significantly low. Figure 10(b3) shows that φ3 gradually decreased as NaHS dosage increased. This trend suggested that the oxidized surface changed into sulfides by NaHS dosage. Figure 11b shows that φ1 gradually decreased as NaHS dosage increased, while φ2 increased as NaHS dosage increased. This can be because of the activation of the bornite surface by NaHS. Figure 11(a2) indicated that K2 increased from NaHS dosage of 0 g/t to 100 g/t, and at higher dosage decreased at pH 8 but increased at pH 9 and 10. Figure 11(b2) shows that φ2 at pH 8 especially increased with the increase of NaHS dosage 0 g/t to 200 g/t. The amount of activated surface was increased by the increase of NaHS dosage and this explains the trend. Figure 11(b3) shows that φ3 at pH 8 drastically decreased from NaHS dosage of 0 g/t to 100 g/t while it decreased from 0 g/t to 50 g/t at pH 9 and 10. Then, φ3 at pH 8 increased from 100 g/t to 200 g/t whereas at pH 9 and 10 increased from 50 g/t to 200 g/t. This is because the oxidized surface was sulfurized by NaHS until NaHS dosage reached an optimum value, and oxides and/or hydroxides might have increased on the surface after reaching the optimum NaHS dosage. Figure 12(a2,b2) show that chalcopyrite K2 increased with the increase of pH, and φ2 had the highest point depending on pH. This point of φ2 with NaHS dosage of 50 g/t at pH 10 was the highest followed by pH 9 and 8. Figure 12(b3) indicated that φ3 at each pH decreased with NaHS dosage of 50 g/t, and increased as NaHS dosage increased. These trends were similar to the chalcopyrite results of copper ore flotation tests.
4. Conclusions
The surface wettability and floatability of chalcocite, bornite, and chalcopyrite affected by NaHS dosage and pH were investigated. The results of the contact angle measurement showed that NaHS works differently depending on the concentration. The NaHS activation was observed at low concentrations of NaHS, while the depression of each mineral occurred at high concentrations. The floatability of chalcocite was affected by NaHS dosage, and the recoveries increased with the increase of NaHS dosage. The bornite floatability at lower pH was the highest compared to high pHs, and bornite recoveries tended to be depressed with a smaller amount of NaHS as pH increased. The recoveries of chalcopyrite increased as pH increased at an optimum NaHS dosage. Moreover, it was suggested that there can be a threshold NaHS dosage to activate the surface, as evidenced by the depression of the minerals and reduction of recoveries at higher dosages of NaHS. The well-fitted flotation kinetic model to the results of the mixture mineral flotation tests based on the floatability component model and the surface properties of the minerals was generated. The trends of the flotation rate constants and mass fractions with NaHS dosages and pHs could be similar trends with the flotation results. Therefore, considering the surface properties of the copper sulfide minerals affected by NaHS and the reaction rate between NaHS and the minerals, the model which could produce the behavior of activation and depression was created successfully.
Supplementary Materials
The following are available online at https://0-www-mdpi-com.brum.beds.ac.uk/2075-163X/10/11/1027/s1, Table S1: The chalcocite results of the concentration of NaHS, A and the reaction rate constant, B, without NaHS and with NaHS dosages of 50 g/t, 100 g/t, and 200 g/t at pH 8, 9, and 10; Table S2: The bornite results of the concentration of NaHS, A and the reaction rate constant, B, without NaHS and with NaHS dosages of 50 g/t, 100 g/t, and 200 g/t at pH 8, 9, and 10; Table S3: The chalcopyrite results of the concentration of NaHS, A and the reaction rate constant, B, without NaHS and with NaHS dosages of 50 g/t, 100 g/t, and 200 g/t at pH 8, 9, and 10.
Author Contributions
Conceptualization, H.M. and C.T.; methodology, H.M., K.M. and C.T.; validation, H.M. and C.T.; formal analysis, H.M.; investigation, H.M.; writing—original draft preparation, H.M.; writing—review and editing, H.M.; supervision, C.T.; project administration, M.K. All authors have read and agreed to the published version of the manuscript.
Funding
This research received no external funding.
Acknowledgments
The authors would like to thank Satur, J.V. for editing a draft of this manuscript. We also thank Ebisu, Y. for valuable comments for this paper.
Conflicts of Interest
The authors declare no conflict of interest.
References
- Law, K.-Y.; Zhao, H. Surface Wetting: Characterization, Contact Angle, and Fundamentals, 1st ed.; Springer: Cham, Switzerland, 2016. [Google Scholar]
- Young, T. An essay on the cohesion of flui ds. Phil. Trans. R. Soc. Lond. 1805, 95, 65–87. [Google Scholar]
- Wills, B.A. Will’s Mineral Processing Technology: An Introduction to the Practical Aspects of Ore Treatment and Mineral Recovery; Butterworth-Heinemann: Oxford, UK, 2016. [Google Scholar]
- Hirajima, T.; Miki, H.; Suyantara, G.P.W.; Matsuoka, H.; Elmahdy, A.M.; Sasaki, K.; Kuroiwa, S. Selective flotation of chalcopyrite and molybdenite with H2O2 oxidation. Miner. Eng. 2017, 100, 83–92. [Google Scholar] [CrossRef]
- Gardner, J.R.; Woods, R. An electrochemical investigation of the natural flotability of chalcopyrite. Int. J. Miner. Process. 1979, 6, 1–16. [Google Scholar] [CrossRef]
- Yuan, D.; Cadien, K.; Liu, Q.; Zeng, H. Adsorption characteristics and mechanisms of O-Carboxymethyl chitosan on chalcopyrite and molybdenite. J. Colloid Interface Sci. 2019, 552, 659–670. [Google Scholar] [CrossRef] [PubMed]
- Buckley, A.N.; Woods, R. An X-ray photoelectron spectroscopic study of the oxidation of chalcopyrite. Aust. J. Chem. 1984, 37, 2403–2413. [Google Scholar] [CrossRef]
- Pratesi, G.; Cipriani, C. Selective depth analyses of the alteration products of bornite, chalcopyrite and pyrite performed by XPS, AES and RBS. Eur. J. Mineralol. 2000, 12, 397–409. [Google Scholar] [CrossRef]
- Yin, Q.; Kelsall, G.H.; Vaughan, D.J.; England, K. Atmospheric and electrochemical oxidation of the surface of chalcopyrite (CuFeS2). Geochim. Cosmochim. Acta 1995, 59, 1091–1100. [Google Scholar] [CrossRef]
- Yin, Q.; Vaughan, D.J.; England, K.E.R.; Kelsall, G.H.; Brandon, N.P. Surface oxidation of chalcopyrite (CuFeS2) in alkaline solutions. J. Electrochem. Soc. 2000, 147, 2945–2951. [Google Scholar] [CrossRef]
- Rosso, K.M.; Vaughan, D.J. Reactivity of sulfide mineral surfaces. Rev. Mineral. Geochem. 2006, 61, 557–607. [Google Scholar] [CrossRef]
- Agar, G.E.; Chia, J.; Requis, C.L. Flotation rate measurements to optimize an operating circuit. Miner. Eng. 1998, 11, 347–360. [Google Scholar] [CrossRef]
- Zuniga, H.G. Flotation recovery is an exponential function of its rate. Min. Bull. Nat. Soc. Min. Santiago Chile 1935, 47, 83–86. [Google Scholar]
- Jameson, G.J.S.; Nam, S.; Young, M.M. Physical Factors Affecting Recovery Rates in Flotation. Miner. Sci. Eng. 1977, 9, 103–118. [Google Scholar]
- Niemi, A.J. Role of kinetics in modelling and control of flotation plants. Powder Technol. 1995, 82, 69–77. [Google Scholar] [CrossRef]
- Oliveira, J.F.; Saraiva, S.M.; Pimenta, J.S.; Oliveira, A.P.A. Kinetics of pyrochlore flotation from Araxa mineral deposits. Miner. Eng. 2001, 14, 99–105. [Google Scholar] [CrossRef]
- Uçurum, M. Influences of Jameson flotation operation variables on the kinetics and recovery of unburned carbon. Powder Technol. 2009, 191, 240–246. [Google Scholar] [CrossRef]
- Ma, G.; Xia, W.; Xie, G. Effect of particle shape on the flotation kinetics of fine coking coal. J. Clean. Prod. 2018, 195, 470–475. [Google Scholar] [CrossRef]
- Sutherland, K.L. Physical chemistry of flotation. XI. Kinetics of the flotation process. J. Phys. Colloid Chem. 1948, 52, 394. [Google Scholar] [CrossRef]
- Bayat, O.; Ucurum, M.; Poole, C. Effects of size distribution on flotation kinetics of Turkish sphalerite. Miner. Process. Extr. Metall. 2013, 113, 53–59. [Google Scholar] [CrossRef]
- Dowling, E.C.; Klimpel, R.R.; Aplan, F.F. Model discrimination in the flotation of a porphyry copper ore. Miner. Metall. Process. 1985, 2, 87–101. [Google Scholar] [CrossRef]
- Welsby, S.D.D.; Vianna, S.M.S.M.; Franzidis, J.-P. Assigning physical significance to floatability components. Int. J. Miner. Process. 2010, 97, 59–67. [Google Scholar] [CrossRef]
- Runge, K.C.; Harris, M.C.; Frew, J.A.; Manlapig, E.V. Floatability of streams around the Cominco Red Dog lead cleaning circuit. In Sixth Mill Operators Conference, AusIMM, Madang, Papua New Guinea; Australasian Institute of Mining and Metallurgy: Carlton, Australia, 1997; pp. 157–163. [Google Scholar]
- Zhang, H.; Liu, J.; Cao, Y.; Wang, Y. Effects of particle size on lignite reverse flotation kinetics in the presence of sodium chloride. Powder Technol. 2013, 246, 658–663. [Google Scholar] [CrossRef]
- Chaves, A.P.; Ruiz, A.S. Considerations on the kinetics of froth flotation of ultrafine coal contained in tailings. Coal Prep. 2009, 29, 289–297. [Google Scholar] [CrossRef]
- Saleh, A.M. A Study on the Performance of Second Order Models and Two Phase Models in Iron Ore Flotation. Physicochem. Probl. Miner. Process. 2010, 44, 215. [Google Scholar]
- Yuan, X.M.; Palsson, B.I.; Forssberg, K.S.E. Statistical interpretation of flotation kinetics for a complex sulphide ore. Miner. Eng. 1996, 9, 429–442. [Google Scholar] [CrossRef]
- Finkelstein, N.P. The activation of sulphide minerals for flotation: A review. Int. J. Miner. Process. 1997, 52, 81–120. [Google Scholar] [CrossRef]
- Allison, S.A.; O’Connor, C.T. An investigation into the flotation behaviour of pyrrhotite. Int. J. Miner. Process. 2011, 98, 202–207. [Google Scholar] [CrossRef]
- Reddy, G.S.; Reddy, C.K. The chemistry of activation of sphalerite—A review. Miner. Proc. Extract. Metall. Rev. 1988, 4, 1–38. [Google Scholar] [CrossRef]
- Gerson, A.R.; Lange, A.G.; Prince, K.E.; Smart, R.St.C. The mechanism of copper activation of sphalerite. Appl. Surf. Sci. 1999, 137, 207–223. [Google Scholar] [CrossRef]
- Zhou, R.; Chander, S. Kinetics of sulfidization of malachite in hydrosulfide and tetrasulfide solutions. Int. J. Miner. Process. 1993, 37, 257–272. [Google Scholar] [CrossRef]
- Ma, R.; Stegemeier, J.; Levard, C.; Dale, J.G.; Noack, C.W.; Yang, T.; Brown, G.E., Jr.; Lowry, G.V. Sulfidation of copper oxide nanoparticles and properties of resulting copper sulfide. Environ. Sci. Nano 2014, 1, 347–357. [Google Scholar] [CrossRef]
- Bulatovic, S. Handbook of Flotation Reagents: Chemistry, Theory and Practice: Volume 1: Flotation of Sulfide Ores; Elsevier: Amsterdam, The Netherlands, 2007. [Google Scholar]
- Ansar, A.; Pawlik, M. Floatability of chalcopyrite and molybdenite in the presence of lignosulfonates. Part II. Hallimond tube flotation. Miner. Eng. 2007, 20, 609–616. [Google Scholar] [CrossRef]
- Matsuoka, H.; Mitsuhashi, K.; Kawata, M.; Kato, T.; Tokoro, C.; Haga, K.; Shibayama, A. Surface properties of copper-sulfide minerals with sodium-hydrosulfide activation. Miner. Eng. 2020, 156, 106530. [Google Scholar] [CrossRef]
- Fairthorne, G.; Fornasiero, D.; Ralston, J. Effect of oxidation on the collectorless flotation of chalcopyrite. Int. J. Miner. Process. 1997, 49, 31–48. [Google Scholar] [CrossRef]
- Hirajima, T.; Mori, M.; Ichikawa, O.; Sasaki, K.; Miki, H.; Farahat, M.; Sawada, M. Selective flotation of chalcopyrite and molybdenite with plasma pretreatment. Miner. Eng. 2014, 66–68, 102–111. [Google Scholar] [CrossRef]
- Zhao, Q.; Liu, W.; Wei, D.; Wang, W.; Cui, B.; Liu, W. Effect of copper ions on the flotation separation of chalcopyrite and molybdenite using sodium sulfide as a depressant. Miner. Eng. 2018, 115, 44–52. [Google Scholar] [CrossRef]
Figure 1.
pH-Eh diagram for the Cu–Fe–S–H2O system with the preponderant copper and iron species shown in each domain [37].
Figure 1.
pH-Eh diagram for the Cu–Fe–S–H2O system with the preponderant copper and iron species shown in each domain [37].

Figure 2.
The results of contact angle measurements on untreated, oxidized, and NaHS-treated chalcocite, bornite, and chalcopyrite at several NaHS concentrations.
Figure 2.
The results of contact angle measurements on untreated, oxidized, and NaHS-treated chalcocite, bornite, and chalcopyrite at several NaHS concentrations.

Figure 3.
The flotation recoveries of chalcocite, bornite, and chalcopyrite after oxidation treatments at 0, 12, 24, 48, 72, 96 h at pH 9.
Figure 3.
The flotation recoveries of chalcocite, bornite, and chalcopyrite after oxidation treatments at 0, 12, 24, 48, 72, 96 h at pH 9.

Figure 4.
The recoveries of the minerals versus several NaHS dosages for (a) chalcocite, (b) bornite, and (c) chalcopyrite at pH 8, 9, and 10 with the small column cell (NaHS 0 M means only oxidation treatment was conducted.).
Figure 4.
The recoveries of the minerals versus several NaHS dosages for (a) chalcocite, (b) bornite, and (c) chalcopyrite at pH 8, 9, and 10 with the small column cell (NaHS 0 M means only oxidation treatment was conducted.).

Figure 5.
Final recoveries of (a) chalcocite, (b) bornite, and (c) chalcopyrite without NaHS and with NaHS dosages of 50 g/t, 100 g/t, and 200 g/t at pH 8, 9, and 10.
Figure 5.
Final recoveries of (a) chalcocite, (b) bornite, and (c) chalcopyrite without NaHS and with NaHS dosages of 50 g/t, 100 g/t, and 200 g/t at pH 8, 9, and 10.

Figure 6.
Chalcocite recoveries without NaHS and with NaHS dosages of 50 g/t, 100 g/t, and 200 g/t at (a) pH 8, (b) pH 9, and (c) pH 10.
Figure 6.
Chalcocite recoveries without NaHS and with NaHS dosages of 50 g/t, 100 g/t, and 200 g/t at (a) pH 8, (b) pH 9, and (c) pH 10.

Figure 7.
Bornite recoveries without NaHS and with NaHS dosages of 50 g/t, 100 g/t, and 200 g/t at (a) pH 8, (b) pH 9, and (c) pH 10.
Figure 7.
Bornite recoveries without NaHS and with NaHS dosages of 50 g/t, 100 g/t, and 200 g/t at (a) pH 8, (b) pH 9, and (c) pH 10.

Figure 8.
Chalcopyrite recoveries without NaHS and with NaHS dosages of 50 g/t, 100 g/t, and 200 g/t at (a) pH 8, (b) pH 9, and (c) pH 10.
Figure 8.
Chalcopyrite recoveries without NaHS and with NaHS dosages of 50 g/t, 100 g/t, and 200 g/t at (a) pH 8, (b) pH 9, and (c) pH 10.

Figure 9.
Final copper recoveries without NaHS and with NaHS dosages of 50 g/t, 100 g/t, and 200 g/t at pH 8, 9, and 10.
Figure 9.
Final copper recoveries without NaHS and with NaHS dosages of 50 g/t, 100 g/t, and 200 g/t at pH 8, 9, and 10.

Figure 10.
The chalcocite results of (a) flotation rate constants, (1) K1, (2) K2, (3) K3, and (b) mass fraction, (1) φ1, (2) φ2, (3) φ3, without NaHS and with NaHS dosages of 50 g/t, 100 g/t, and 200 g/t at pH 8, 9, and 10.
Figure 10.
The chalcocite results of (a) flotation rate constants, (1) K1, (2) K2, (3) K3, and (b) mass fraction, (1) φ1, (2) φ2, (3) φ3, without NaHS and with NaHS dosages of 50 g/t, 100 g/t, and 200 g/t at pH 8, 9, and 10.

Figure 11.
The bornite results of (a) flotation rate constants, (1) K1, (2) K2, (3) K3, and (b) mass fraction, (1) φ1, (2) φ2, (3) φ3, without NaHS and with NaHS dosages of 50 g/t, 100 g/t, and 200 g/t at pH 8, 9, and 10.
Figure 11.
The bornite results of (a) flotation rate constants, (1) K1, (2) K2, (3) K3, and (b) mass fraction, (1) φ1, (2) φ2, (3) φ3, without NaHS and with NaHS dosages of 50 g/t, 100 g/t, and 200 g/t at pH 8, 9, and 10.

Figure 12.
The chalcopyrite results of (a) flotation rate constants, (1) K1, (2) K2, (3) K3, and (b) mass fraction, (1) φ1, (2) φ2, (3) φ3, without NaHS and with NaHS dosages of 50 g/t, 100 g/t, and 200 g/t at pH 8, 9, and 10.
Figure 12.
The chalcopyrite results of (a) flotation rate constants, (1) K1, (2) K2, (3) K3, and (b) mass fraction, (1) φ1, (2) φ2, (3) φ3, without NaHS and with NaHS dosages of 50 g/t, 100 g/t, and 200 g/t at pH 8, 9, and 10.


Table 1.
Seven kinds of flotation kinetic models (adapted from [18]).
Table 1.
Seven kinds of flotation kinetic models (adapted from [18]).
| Name of the Model | Formula |
|---|---|
| Classical first-order model [19] | |
| First-order model with rectangular distribution of floatability [20,21] | |
| Floatability component model [22,23] | |
| Fully mixed reactor model [24] | |
| Improved gas and solid adsorption model [25] | |
| Second-order model with rectangular distribution of floatability [26,27] |
R = recovery; k1, 2, 3, 4, 5, 6 = rate constant; kf = fast floating rate constant; ks = slow floating rate constant; φf = fast floating mass fraction.
Table 2.
Chemical composition of chalcocite, bornite, and chalcopyrite samples.
| Element | Cu | Fe | S | Si | As | Ag | Pb |
|---|---|---|---|---|---|---|---|
| (Mass%) | |||||||
| Chalcocite, Cu2S | 83.9 | 1.64 | 14.3 | 0.04 | 0.03 | - | - |
| Bornite, Cu5FeS4 | 71.5 | 8.78 | 19.3 | 0.12 | - | 0.19 | - |
| Chalcopyrite, CuFeS2 | 38.2 | 31.6 | 28.4 | 0.05 | - | - | 1.64 |
Table 3.
Mineral composition of the Chilean copper ore sample.
| Minerals | Content Ratio (Mass %) |
|---|---|
| Calcite | 69.3 |
| Orthoclase | 11.2 |
| Albite | 6.4 |
| Quartz | 5.7 |
| Copper sulfides | 2.0 |
| Others | 5.4 |
Table 4.
Distribution of bornite, chalcopyrite, and chalcocite in the copper sulfides of the sample.
Table 4.
Distribution of bornite, chalcopyrite, and chalcocite in the copper sulfides of the sample.
| Copper-Sulfide Minerals | Content Ratio (Mass %) |
|---|---|
| Bornite | 53.9 |
| Chalcopyrite | 27.7 |
| Chalcocite | 18.4 |
Table 5.
The relationship between the minerals and the conditions of pH and NaHS dosage. “+” means positive correlation, “−” means negative correlation.
Table 5.
The relationship between the minerals and the conditions of pH and NaHS dosage. “+” means positive correlation, “−” means negative correlation.
| Minerals | pH | NaHS | |
|---|---|---|---|
| Chalcocite | Activation | + | + |
| Depression | + | + | |
| Bornite | Activation | − | + |
| Depression | + | + | |
| Chalcopyrite | Activation | + | + |
| Depression | + | + | |
Publisher’s Note: MDPI stays neutral with regard to jurisdictional claims in published maps and institutional affiliations. |
© 2020 by the authors. Licensee MDPI, Basel, Switzerland. This article is an open access article distributed under the terms and conditions of the Creative Commons Attribution (CC BY) license (http://creativecommons.org/licenses/by/4.0/).
Share and Cite
MDPI and ACS Style
Matsuoka, H.; Mitsuhashi, K.; Kawata, M.; Tokoro, C. Derivation of Flotation Kinetic Model for Activated and Depressed Copper Sulfide Minerals. Minerals 2020, 10, 1027. https://0-doi-org.brum.beds.ac.uk/10.3390/min10111027
AMA Style
Matsuoka H, Mitsuhashi K, Kawata M, Tokoro C. Derivation of Flotation Kinetic Model for Activated and Depressed Copper Sulfide Minerals. Minerals. 2020; 10(11):1027. https://0-doi-org.brum.beds.ac.uk/10.3390/min10111027
Chicago/Turabian StyleMatsuoka, Hidekazu, Kohei Mitsuhashi, Masanobu Kawata, and Chiharu Tokoro. 2020. "Derivation of Flotation Kinetic Model for Activated and Depressed Copper Sulfide Minerals" Minerals 10, no. 11: 1027. https://0-doi-org.brum.beds.ac.uk/10.3390/min10111027
Note that from the first issue of 2016, this journal uses article numbers instead of page numbers. See further details here.