Mineralogy, Geochemistry and Genesis of Agate—A Review

1
Institute of Mineralogy, TU Bergakademie Freiberg, Brennhausgasse 14, 09599 Freiberg, Germany
2
Helmholtz-Zentrum Dresden-Rossendorf, Hemholtz Institute Freiberg for Resource Technology, Chemnitzer Str. 40, 09599 Freiberg, Germany
3
Department of Geological Sciences, University of Saskatchewan, Saskatoon, SK S7N 5E2, Canada
*
Author to whom correspondence should be addressed.
Minerals 2020, 10(11), 1037; https://0-doi-org.brum.beds.ac.uk/10.3390/min10111037
Submission received: 18 September 2020
/
Revised: 10 November 2020
/
Accepted: 17 November 2020
/
Published: 20 November 2020
(This article belongs to the Special Issue Agates: Types, Mineralogy, Deposits, Host Rocks, Ages and Genesis)
Abstract
:Agate—a spectacular form of SiO2 and a famous gemstone—is commonly characterized as banded chalcedony. In detail, chalcedony layers in agates can be intergrown or intercalated with macrocrystalline quartz, quartzine, opal-A, opal-CT, cristobalite and/or moganite. In addition, agates often contain considerable amounts of mineral inclusions and water as both interstitial molecular H2O and silanol groups. Most agate occurrences worldwide are related to SiO2-rich (rhyolites, rhyodacites) and SiO2-poor (andesites, basalts) volcanic rocks, but can also be formed as hydrothermal vein varieties or as silica accumulation during diagenesis in sedimentary rocks. It is assumed that the supply of silica for agate formation is often associated with late- or post-volcanic alteration of the volcanic host rocks. Evidence can be found in association with typical secondary minerals such as clay minerals, zeolites or iron oxides/hydroxides, frequent pseudomorphs (e.g., after carbonates or sulfates) as well as the chemical composition of the agates. For instance, elements of the volcanic rock matrix (Al, Ca, Fe, Na, K) are enriched, but extraordinary high contents of Ge (>90 ppm), B (>40 ppm) and U (>20 ppm) have also been detected. Calculations based on fluid inclusion and oxygen isotope studies point to a range between 20 and 230 °C for agate formation temperatures. The accumulation and condensation of silicic acid result in the formation of silica sols and proposed amorphous silica as precursors for the development of the typical agate micro-structure. The process of crystallisation often starts with spherulitic growth of chalcedony continuing into chalcedony fibers. High concentrations of lattice defects (oxygen and silicon vacancies, silanol groups) detected by cathodoluminescence (CL) and electron paramagnetic resonance (EPR) spectroscopy indicate a rapid crystallisation via an amorphous silica precursor under non-equilibrium conditions. It is assumed that the formation of the typical agate microstructure is governed by processes of self-organization. The resulting differences in crystallite size, porosity, kind of silica phase and incorporated color pigments finally cause the characteristic agate banding and colors.
Keywords:
agate; quartz; chalcedony; silica minerals; micro-structure; trace elements; O-isotopes; paragenetic minerals1. Introduction
Agates belong to the most fascinating mineral objects in nature because of their wide spectrum of colors and spectacular morphologies. Therefore, they play a dominant role as gemstones and cut stone since antiquity. The name “Agate” can be dated back to ca. 350 B.C. (Theophrast) and was probably related to the discovery of agates in the river Achates (recently Drillo) in Sicily. Today, agate deposits and agate treatments are known from historical and recent sites all over the world [1,2,3,4].
Both in historic and recent times, many speculations have been made about the processes leading to the formation of agates. First descriptive reports and discussions about agates are known from the 18th century [5,6]. Serious scientific investigations concerning chemical composition, properties and genesis of agates started in the middle of the 19th century [7]. As a result of these numerous studies, a wide spectrum of theories, both serious and speculative, about the formation of agates exists today (see compilations in e.g., [1,8]).
Early theories hypothesizing a formation of agates from circulating SiO2-rich solutions in volcanic rocks, assume that the characteristic agate banding is the result of rhythmic silica supply to natural voids and cavities (“outer rhythm” [7]). Several years later, Daubrée [9] published interesting experiments about the alteration of silicate glasses by alkaline solutions (>400 °C, 1000 atm). These reactions resulted in concentric chalcedony layers, similar to observed structures in natural agates. Comparable results were later published by Nacken [10]. Liesegang [11,12] presented his fundamental results about the formation of rhythmic color bands due to diffusion processes of metal ions in silica gels. He concluded that a zonation and banding can be created by “inner processes” such as simple chemical reactions. However, later studies revealed that banding and color distribution in agates are not always identical [8]. The characteristic color banding in agates seems to be more likely related to the micro-structure and the distribution of finely dispersed color pigments within the SiO2 matrix.
Recent mineralogical and geochemical investigations during the last decades significantly increased our knowledge about the mineralogy and genesis of agates. Numerous publications about certain agate occurrences or specific aspects of agate formation have been published (e.g., [1,8,13,14,15,16,17,18,19,20,21,22,23,24,25,26,27,28,29,30,31,32,33,34,35,36,37,38,39,40,41,42,43,44,45,46,47,48,49,50,51,52,53,54,55,56,57,58,59,60]).
According to these recent studies, agates can be regarded as banded chalcedony, which is intergrown or intercalated with other silica phases. Moreover, agates often contain considerable amounts of mineral inclusions and water (1–2 wt%) as both interstitial molecular H2O and silanol groups [13,21,40]. These impurities may form spectacular internal structures or may be responsible for the different coloration of agates [13,29,40,61].
The chemical and mineralogical complexity of agate is a result of its complex formation history. In principle, agates occur in practically all rock types however, their formation in volcanic rocks is the most abundant. Therefore, the majority of agate deposits worldwide is related to SiO2-poor (andesites, basalts) and SiO2-rich (rhyolites, rhyodacites) volcanic rocks. Other types of agate may occur as hydrothermal vein agate or due to silica accumulation in sediments and sedimentary rocks [1,8,15,49]. The chemical composition of agates as well as the presence of specific paragenetic minerals (carbonates, clay minerals, zeolites, iron compounds) indicate that the formation of volcanic agates seems to be associated with late- or post-volcanic alteration processes within the host rocks (e.g., [24,37,62,63]).
Although general ideas concerning the formation of agates exist, the origin of agate remains incompletely understood. The discussions are controversial especially due to the fact that no one has unambiguously documented agate formation in real time and agates have never been successfully synthesized in the laboratory. Only certain silica mineralization in active geothermal regions or at the sea-floor (white smokers) is comparable to agates [64].
The present paper provides a global review of what is known on agate properties, based on the literature and completed by numerous additional data. On this basis, an attempt is made to establish a preliminary model of agate formation.
2. Materials and Methods
In the present paper results of extensive studies on agate samples of different origin and type are summarized and compared with data from literature. The analyzed material includes more than 300 agate samples from all over the world and from different parent rocks (basic and acidic volcanic rocks, hydrothermal vein agates, agates from sedimentary host rocks—see Table S1). The agate samples as well as the surrounding host rocks were visually described and documented, and selected aliquots prepared for further investigations.
The mineral and chemical composition of the agate host rocks was generally analyzed by a combination of X-ray diffraction (XRD) and X-ray fluorescence (XRF) measurements on selected and prepared sample material. The qualitative and quantitative phase compositions were analyzed using an URD 6 (Seifert/Freiberger Präzisionsmechanik, Freiberg, Germany) with Co Kα-radiation in the range 5–80° (2θ). Data evaluation was realized using Analyse RayfleX v.2.352 software (GE Sensing & Inspection Technologies GmbH, Ahrensburg, Germany) and subsequent Rietveld refinement with Autoquan v.2.7.00 (GE Sensing & Inspection Technologies GmbH, Ahrensburg, Germany) [65]. XRF measurements on powdered samples mixed with Li-tetraborate were carried out with a PANalytical Axios Minerals spectrometer and WROXI package (PANalytical, Almelo, The Netherlands) [37].
The identification of different SiO2 phases in the agate samples was done by a combination of X-ray diffraction and Raman spectroscopy [29]. Additional results were obtained from microscopic investigations by polarizing, cathodoluminescence (CL) and scanning electron microscopy (SEM) on polished thin sections (30 μm). Conventional polarizing microscopy was made with a Zeiss Axio Imager A1m microscope (ZEISS, Thornwood, NY, USA). These investigations were completed by SEM studies using a JEOL 6400 SEM with EDX detector (JEOL Ltd., Akishima, Japan). CL measurements were made with an optical CL microscope HC1-LM (LUMIC, Bochum, Germany) on carbon-coated, polished thin sections [66]. CL microscopy and spectroscopy was performed with a Peltier cooled digital video-camera (OLYMPUS DP72, OLYMPUS Deutschland GmbH, Hamburg, Germany) and an Acton Research SP-2356 digital triple-grating spectrograph with a Princeton Spec-10 CCD detector (OLYMPUS Deutschland GmbH, Hamburg, Germany), respectively [67].
The paramagnetic centers of powder agate samples were analyzed by electron paramagnetic resonance (EPR) spectroscopy using a Bruker EMX spectrometer (Saskatchewan Structural Science Centre, Saskatoon, Canada). The equipment operated with microwave frequencies of ~9.63 GHz and 9.39 GHz at 295 K and 85 K, respectively. Experimental conditions included modulation frequency of 100 kHz, modulation amplitude of 0.1 mT, and microwave powers from 0.2 to 20 mW to obtain optimal conditions for different center types. The spectral resolutions were ~0.146 mT for wide scans from 50 to 650 mT and 0.024 mT for narrow scans from 300 to 350 mT.
Trace-elements in agates were analyzed by instrumental neutron activation analysis (INAA—XRAL Laboratories, Mississauga, ON, Canada), inductively coupled plasma mass spectrometry (ICP-MS) and laser ablation ICP-MS (LA-ICP-MS), respectively [30,68]. Additional sections perpendicular to the agate banding were prepared for selected agate samples to analyze the spatial distribution of trace elements. The thick sections were analyzed using a Thermo Finnigan Element 2 mass spectrometer with a DUV 193 laser ablation system [69] and alternatively with a double-focusing sector field mass spectrometer ELEMENT XR with a NewWave 193 nm excimer laser probe (Thermo Scientific, Waltham, MA, USA) [70]. Additional measurements were made with conventional ICP-MS using a Perkin Elmer Sciex Elan 5000 quadrupole instrument with a cross-flow nebulizer and a rhyton spray chamber (Perkin Elmer Inc., Baesweiler, Germany) [71] to facilitate the quantification of the very low contents of REE and some other elements in the agate samples.
Isotope and fluid inclusion studies on quartz and chalcedony samples were carried out to get information about the formation temperatures of the agates. The oxygen isotope composition of SiO2 phases was examined by a laser-based micro-analytical method in the Stable Isotope Laboratory of the University Lausanne, Lausanne, Switzerland. Separate chalcedony and macrocrystalline quartz pieces were prepared, chemically treated and analyzed with a Thermo Fisher Scientific MAT 253 mass spectrometer [72]. Fluid inclusions in macrocrystalline quartz of the agates (polished 100 µm thick sections) were investigated using a Linkam THMS 600 heating-freezing stage. For the calibration of homogenization and freezing measurements, two synthetic fluid inclusion standards (SYN FLINC; pure H2O, mixed H2O-CO2) were used [37]. In addition, the composition of gaseous and liquid fluids in the SiO2 matrix of the agates was analyzed using a thermogravimetry-mass-spectrometry system (NETZSCH STA 409; Netsch, Selb, Germany), which was coupled to a QMS 403/5 quadrupole mass spectrometer (Pfeiffer Vacuum, Aßlar, Germany) [73].
Last but not least, the investigations included mineralogical and geochemical studies on paragenetic minerals and organic materials in agates to get more detailed information about alteration, accumulation and crystallisation processes. In general, associated minerals were identified by a combination of polarizing and scanning electron microscopy (SEM), X-ray diffraction and Raman spectroscopy. Raman measurements were carried out using a confocal Jobin Yvon (Horiba) LabRam-HR spectrometer (Horiba, Bensheim, Germany) on an Olympus BX41 optical microscope, with an 1800-lines-per-millimeter diffraction grating and a Peltier-cooled, Si-based CCD detector. The analyses were complemented by Infrared (IR) absorption spectra acquired using a Bruker Hyperion microscope interfaced to a Bruker Tensor 27 Fourier transform infrared spectrometer [35].
The trace-element and isotopic composition of paragenetic calcite in certain agates was analyzed because of its ubiquitous occurrence with agates in the form of intergrowths and pseudomorphs. Trace elements were measured by INAA (XRAL Laboratories, Toronto, ON Canada). The C and O isotope composition of paragenetic calcite was analyzed with the method of acid digestion using a Finnigan MAT 252 mass spectrometer in the Stable Isotope Laboratory of the University of Lausanne (Lausanne, Switzerland) [74].
3. Geological Occurrences and Types of Agates
In general, agate occurrences are distributed around the world on all continents, and agates have already been formed very early in the Earth’s history. The oldest known occurrence, the Warrawoona agate in Western Australia, was found in 3.48 Ga old metamorphosed rhyolitic tuffs [75]. More than one billion years old agates are also known from the basalts of the Lake Superior region in the USA and Canada.
A closer view reveals that agate occurrences are in particular connected with geological periods of strong volcanic activities such as huge basaltic lava flows or eruptions of acidic lava from Permian to Tertiary. Chemical and mineralogical analyses of the host rocks show that most global agate occurrences are related to both SiO2-poor (andesites, basalts) and SiO2-rich (rhyolites, rhyodacites) volcanic rocks (Figure 1).
In acidic volcanics, agates originate from the infill of silica into cavities of spheroidal aggregates, so called lithophysae (thundereggs), whereas agate formation in basic volcanic rocks happens in former vesicular cavities (Figure 2a–d). The occurrences of volcanic agates are in particular a result of alteration processes of the volcanic host rocks. Therefore, they are preferentially formed in the marginal parts of volcanic bodies and ignimbrite layers, which are enriched in water and other volatiles [22,37].
It is very likely that the process of agate formation in many cases already started during the volcanic activities. Several investigations indicated the participation of residual magmatic fluids in the agate formation and the heating of meteoric fluids, which are necessary for the alteration of the rocks and the release of silica and other chemical elements forming secondary minerals (e.g., [22,24,37]). However, in certain occurrences such as the Paraná Continental Flood Basalt Province, Brazil or the Deccan Trap Province, India strong indications were found that the agate formation took place remarkably later than the emplacement of the surrounding volcanic host rocks [76,77,78].
Besides the preferred formation in volcanic rocks, agates can also be formed by other processes and in other rock types. In different host rocks, vein agates and agate-like structures occur in breccia, cracks and fissures, which are often mineralized by hydrothermal solutions. Hydrothermal vein agates can be found in mm- and cm-sized veins (Figure 2e) but can also reach thicknesses of several dm and lengths of several hundreds of meters. The vein agates are often related to hydrothermal ore deposits. The formation of vein agates is not restricted to volcanic host rocks but can also be found in igneous and metamorphic host rocks.
The formation of agates in sedimentary environments is relatively rare compared to that in volcanic host rocks. Sedimentary agates have been found especially as irregular forms in stratigraphic sequences of carbonate rocks and clastic sediments (Figure 2f). In addition, silicification of residues of animals and plants is common in the surface region of certain sediments and volcano-sedimentary units. Agate structures are well known from silicified wood remains worldwide and silicified dinosaur bones from Utah, USA or silicified corals from Florida, USA [79,80,81]. Another common feature is the secondary deposition and redistribution of agates from primary deposits. Agates in clastic sediments (river gravel and marine sediments) are known from the surroundings of many agate occurrences worldwide (Figure 2g).
4. Agate Properties
4.1. Mineralogy and Micro-Structure of Agates
4.1.1. SiO2 Phases in Agate
Numerous mineralogical investigations have shown that most agates consist of more than one silica phase [23,29,40,82]. The most common mineral in agate is trigonal α-quartz. It is present both as macrocrystalline and granular micro-crystalline variety, as well as in form of the disordered fibrous quartz varieties chalcedony (length-fast) and quartzine (length-slow).
Chalcedony is the common and dominant form of silica in agates. One of the most conspicuous features under the polarizing microscope is the presence of characteristic chalcedony “fibers” (Figure 3a), which was first reported by Brewster [83]. Investigations by X-ray diffraction confirmed the assumption that these structures consist of α-quartz, and the dimensions of the “fibers” were measured with diameters of 0.1–1 µm and lengths of up to several mm [84].
However, electron microscopic studies could not confirm such a fiber structure of chalcedony at high magnification [8,18,85]. Instead, the chalcedony “fibers” represent an intergrowth of quartz microcrystals of ca. 0.1 up to 3 µm in size (Figure 3b), which are oriented with the c-axis perpendicular to the “fiber” direction (length-fast), whereas their orientations are parallel to the c-axis in quartzine (length-slow). The fibrous “chalcedony crystals” are polysynthetically twinned according to the Brazil-twin law, with the c-axis slightly twisted around the fiber axis [23,86].
Heaney [23] developed a model of “dislocation growth “, which can explain the formation of the fibrous structure of chalcedony and the high frequency of defects, Brazil twinning and twisting in the chalcedony “fibers”. Accordingly, the formation of dislocations in the crystal structure during crystal growth promotes the arrangement of atoms/molecules into spiral layers, which is energetically favoured compared to the incorporation into plane crystal faces. Such dislocations can be initiated by point defects or incorporated impurity ions in the crystal structure. The varying torsion of the c-axis (the optical axis) of the quartz crystallites causes different optical orientation and results in the formation of so called “Runzelbänderung” in polarized light (Figure 3a).
Quartzine is rare in agates and occurs only on the outer edge of the geodes or as interlayers between chalcedony and macrocrystalline quartz (Figure 4). Folk and Pittmann [87] concluded that the presence of quartzine may point to a deposition in sulphate-rich solutions or evaporitic conditions. However, up to now the specific conditions leading to the formation of quartzine are not completely understood.
Recent studies have shown that opal-CT, opal-C, cristobalite and moganite are also common in many agates worldwide [29,40,45,54]. Opal-CT represents an intermediate stage between pure amorphous and crystalline silica. It often occurs as tiny spherical aggregates (lepispheres) formed by thin crystal blades [82]. The crystal structure consists of fine interlayers of crystalline cristobalite and tridymite sometimes intergrown with amorphous opal-A (Figure 5). Opal-CT was detected e.g., in agates from the Richardson Ranch, Oregon (USA), Los Indios (Cuba), Sidi Rahal (Morocco) and Jalgaon/Savda, India [45,49].
Moganite was first described by Flörke et al. [88] from ignimbrites of the Mogan formation, Gran Canaria. The crystal structure of this monoclinic SiO2 modification is characterized by alternate stacking of layers of right- and left-handed quartz, with a periodic twinning according to the Brazil-twin law at the unit-cell scale [86]. Although the occurrence of pure moganite is rare, the intergrowth of chalcedony with moganite is frequent in agates, chert and flint [29,54,59,82,89,90].
Because of the similar optical properties and the narrow intergrowth with chalcedony it is difficult to reveal the presence of moganite in agate. However, Raman spectroscopic studies showed that moganite and quartz can be distinguished based on their different spectral characteristics [91]. Using these results, Götze et al. [29] first documented the variations in moganite content in different parts of agates and even within the chalcedony banding. Accordingly, Raman profiles or Raman mapping [92] can provide detailed information about the quantitative spatial distribution of moganite in agates (Figure 6).
In contrast to the microcrystalline SiO2 species, amorphous opal-A is rare in agate. Previously it was concluded that agates contain about 10% of opal-A [93,94]. However, Flörke [95] first suggested that most agates do not contain any opal-A. It can be assumed that most of the identified amorphous silica reported in the older literature is likely caused by the powder preparation process for XRD measurements. Amorphous opal-A is mainly restricted to recent siliceous sinters, where it relatively rapidly converts to opal-CT [96].
The presence and spatial distribution of different silica phases is not only a result of the primary crystallisation processes but can also be influenced by secondary processes such as ageing, metamorphosis and/or temperature. These secondary processes can significantly change the primary phase composition, especially due to the conversion of unstable or metastable silica phases (opal-A, opal-CT, moganite) into quartz. The comparison of natural agate samples with synthetically treated agates showed that the conversion of metastable silica phases into quartz is accompanied by coarsening of crystallite size and loss of structural water [19,21,75,97,98]. Moxon and Carpenter [61] reported that in 300 to 1100 Ma old agate samples from 9 regions six had moganite contents below 6 wt% and three contained 1 wt% or less. The systematic change in phase composition and structural parameters may have potential to estimate the age of agates.
4.1.2. Microstructure of Agates and Agate Banding
One of the most conspicuous features of almost all agates is the typical agate banding. For the characterization of the general microstructure of agates, at least two types of agate banding have to be distinguished: (I) wall-lining agates (“fortification agates”) with agate banding that is more or less conforming the outline of the host cavity (Figure 7a), and (II) horizontally layered agates (“Uruguay agate”, water line agate) with silica layers parallel to the previous horizontal orientation (Figure 7b). There are certain intermediate states and combinations of these two main agate types (Figure 7c).
The general structure of wall-lining agates often consists of three main parts/zones: 1. outermost layer of either microcrystalline, granular quartz or spherulithic chalcedony (or sometimes quartzine) in many cases including other minerals like e.g., calcite, hematite and/or pseudomorphs, 2. main zone of fibrous chalcedony, which develops from the spherulitic chalcedony, and 3. central part, where chalcedony passed over to macrocrystalline quartz, sometimes containing a hollow centre (Figure 8). Repeated layers with varying crystallite size and/or intercalations of fibrous chalcedony and granular quartz (or quartzine) are possible.
The formation of horizontally layered “Uruguay agates” can be explained by the gravitational sedimentation of sols with flocculated, large SiO2- particles. Under conditions of fast coagulation (flocculation) of the monomeric silicic acid (H4SiO4) horizontal layers are formed [99]. The formation of sol particles requires a high silica concentration and therefore, horizontally layered agates are often characteristic features for specific agate occurrences (Figure 9a). Walger [62] reported that horizontal layers in agates from Permian volcanic rocks in Germany are strictly parallel to the surface and therefore, can be used as geological level. The sporadic presence of discordant silica layers in agates (Figure 9b,c) indicates that the orientation of the nodule has been changed during the formation of the agate bands.
Microscopic investigations with high magnification revealed that visible macroscopic bands may consist of up to 1000 micro-bands per mm. A closer look reveals that agate banding appears due to periodic change in the characteristics of the microscopic sub-particles. Accordingly, the visible banding is caused by variations in the type of silica phases, their crystal size and habit, as well as porosity and the distribution of micro-inclusions of minerals (e.g., Fe-oxides/-hydroxides) within the SiO2 matrix (Figure 10, compare Figure 4 and Figure 6). Holzhey [100] published diameters of the submicroscopic SiO2 particles between 0.07 to 0.7 µm for wall-lining agates and 0.2 to 2.5 µm in horizontally banded agates, which is similar to the diameters of microscopic globules in opal (0.25 to 0.4 µm; [101]).
Beside the characteristic agate banding, additional characteristic microtextures can provide information concerning the physico-chemical conditions of formation. For instance, primary growth textures such as colloform or botryoidal textures indicate precipitation of silica gel in free space, whereas comb-like, crustiform or zonal textures in quartz crystals point to a direct crystallisation from hydrothermal fluids [102]. Growth lines in euhedral quartz crystals, so called “Bambauer lamellae”, are preferentially formed under strongly varying physico-chemical conditions during agate formation [46,52,55,60]. Most of these features can be related to epithermal conditions of formation and frequently occur in hydrothermal vein agates.
Other microtextures (feathery/flamboyant, mosaic/jigsaw-puzzle) are significant indications for their generation during recrystallisation of metastable silica phases such as amorphous silica precursors or chalcedony [46,49,55,60,102]. Replacement textures (lattice-bladed, pseudo-acicular) result from the secondary replacement of soluble phases (e.g., calcite, barite) by quartz. In general, such quartz textures due to the recrystallisation of amorphous silica or replacement textures are good indications of boiling conditions in epithermal environments. An excellent compilation about these microtextures in quartz is given by Dong [102].
4.1.3. Point Defects in Agate
Chalcedony, quartzine and macrocrystalline quartz are the most frequent SiO2-forms in agates. Despite their different structural specifics, all three species show the same basic crystal structure of trigonal, low-temperature alpha-quartz that is composed exclusively of [SiO4]4− tetrahedra with all oxygens joined together in a three-dimensional network. Different factors (e.g., concentration of SiO2 and impurities in the mineralizing solution, temperature, growth velocity, etc.) can result in the formation of defects in the quartz lattice during crystallisation. Besides extended defects such as micro-inclusions of minerals and fluids or twinning and dislocations, defects at the atomic scale of the crystal lattice (zero-dimensional point defects) are present [103,104,105,106].
First investigations of the defect structure of agates from different parent rocks of certain world-wide localities by a combination of electron paramagnetic resonance (EPR) spectroscopy, cathodoluminescence (CL) and trace element analysis showed that defects related to silicon and/or oxygen vacancies are the most frequent point defects in agate [107]. In addition, the substitution of Si atoms by Al, Ge and/or Fe is common. In agate samples from different localities the following paramagnetic centers were detected: O2−, O23−, O3−, E′1, [AlO4]0, [FeO4/M+]0, and [GeO4/M+]0. In contrast, defect centers of the type [TiO4/Li+]0 or [TiO4/H+]0, which were common in quartz of the parent volcanic rocks, were not detected in agate [107]. In general, the abundance of the O2−, O23−, O3−, centers (related to silicon vacancy) and E′1 centers (oxygen vacancy) in chalcedony is remarkably higher than in macrocrystalline quartz. This high defect density indicates rapid growth of silica under non-equilibrium conditions probably with a non-crystalline precursor.
Figure 11a shows the spectra of three selected agate samples from Germany in a wide scan measured at a microwave power of 2 mW. The EPR spectra contain a characteristic oxygen-vacancy electron center E′1 [108] and an orthorhombic Fe3+ center at the effective g value of 4.28 [103,109]. A closer look at the central magnetic region (Figure 11b) shows further multiple species of silicon-vacancy hole centers (e.g., superoxide and ozonide radicals such as B, B′, C, and C′; [110,111,112,113,114,115]). The agate from St. Egidien, Saxony (Germany) is particularly interesting due to abundant B/B′ and C/C′ centers, even more than quartz samples from high-grade uranium deposits [109,115]. Weak signals at g = 1.997 and 1.994 belong to the Ge (B) and Ge E′1 centers [108]. The simulated g values of the [AlO4]0 center are shown in the experimental spectrum in Figure 11c compared with the analyzed spectrum of an agate from Hausdorf (Saxony) containing 709 ppm Al.
The comparison of the EPR spectra of worldwide agate samples shows, that the oxygen-vacancy electron center E′1 is the dominant defect center but in varying concentrations (Figure 12). In particular chalcedony in agates from acidic volcanic rocks is characterized by elevated concentrations of the E′1 center, much more than chalcedony in agates from basic volcanic rocks and macrocrystalline quartz within the agates. In general, quartz in agates has much more abundant oxygen-vacancy electron centers (by several orders of magnitude) than hydrothermal and pegmatite quartz that were measured for comparison (e.g., from Minas Gerais, Brazil, and Sichuan, China).
In addition, EPR spectra of the chalcedony parts of the agates often show high intensities of silicon-vacancy hole centers (Figure 11 and Figure 12), whereas the number of these centers is lower in the macrocrystalline quartz part of the agates (Figure 11d). Nevertheless, the EPR analysis of clear macrocrystalline quartz crystals in agates provided powder-like spectra indicating that the quartz crystals are not really homogeneous but consist of numerous “micro-crystals”.
Luminescence methods are suitable analytical tools for the visualization of point defects and therefore, provide useful information about the defects in the agate structure and their spatial distribution [117]. The common use of UV light (photoluminescence—PL) produces luminescence images, which reveal the heterogeneous microtexture of agates (Figure 13). The frequently observed bright green luminescence is caused by activation due to uranyl ((UO2)2+) ions [36] and therefore, clearly indicates trace amounts of uranium in the SiO2 network (Figure 13b).
Cathodoluminescence microscopy and spectroscopy can also be used to reveal differences in the microstructure of macrocrystalline quartz and chalcedony in the agates. Cathodoluminescence microscopy enables the visualization of zoning and other internal structures in agates and quartz incrustations at the micro-scale, which often markedly different to observations with conventional polarizing microscopy (Figure 14). For instance, most of the apparent homogeneous quartz crystals show a wide variety of internal textures under CL including oscillatory zoning, sector zoning, or skeletal growth (see Figure 14b,f). These irregular internal textures and sector zoning point to silica crystallisation under non-equilibrium conditions.
The visible CL of agates can vary drastically (Figure 14). On one hand, agate samples can exhibit more or less one dominant CL colour, whereas in other agates SiO2 phases exhibit multiple CL colors with different shades of blue, violet, green, yellow, and red. The visible luminescence colours are caused by different CL emission bands from the blue to the red spectral region with variable intensities, which are associated to various structural defects (e.g., oxygen/silicon vacancies or broken bonds) and/or trace elements (e.g., Al, Li, Fe) in the lattice [117]. Moreover, CL can help to visualize different SiO2 generations (Figure 14g) or secondary alteration effects such as radiation damage by the detection of radiation halos (Figure 14h). These characteristic CL properties can often be used to reconstruct specific geological processes.
Information concerning the lattice defects causing the different luminescence colors can be obtained by spectral measurements. Based on the fact that the defects causing the different CL emissions reflect the variable physico-chemical conditions of formation, CL spectra of agates often differ from those of quartz from crystalline rocks [107,118,119]. In the CL spectra of agates at least three broad emission bands can be detected: a dominating red band at 650 nm, a yellow band at about 570 nm and a blue band of mostly low intensity (Figure 15).
The emission bands at 450 nm (2.69 eV) and 650 nm (1.91 eV) are caused by lattice defects [105,118,120]. The 650 nm band (Figure 15a) is the most common CL emission in chalcedony and can be related to the non-bridging oxygen hole center (NBOHC; [121]). The 650 nm emission is very sensitive to electron irradiation resulting in an increase of the band intensity during electron bombardment due to the conversion of different precursors (e.g., silanol groups: Si-O-H, Na impurities: Si-O-Na) into hole centers [105]. The specific CL behavior in chalcedony can be explained by elevated values of silanol groups [13,118].
Another defect induced luminescence is yellow CL (emission band at 570 nm—2.17 eV), which preferentially appears in macrocrystalline quartz and chalcedony of agates in acidic volcanic rocks (Figure 15b). The 570 nm emission band is related to high oxygen deficiency and local structural disorder in quartz. Götze et al. [68] related this specific CL emission to fast crystallisation from a non-crystalline precursor at low-temperature (mostly <250 °C).
The other type of luminescence active defects in agates is attributed to trace elements. Aluminium is the most frequent trace element in quartz and chalcedony (up to a few 1000 ppm). Several studies showed that the alkali (or hydrogen) compensated [AlO4/M+] center is responsible for a transient blue emission band at ~390 nm (3.26 eV) [122,123,124]. The 390 nm emission is very sensitive to electron irradiation and the strong decrease under an electron beam is caused by the dissociation and electromigration of the charge compensating cations out of the interaction volume under the influence of the irradiation induced electrical field.
A striking greenish luminescence in agate is related the uranyl ion (UO22+) and can be excited both by short-wave UV light (<300 nm) or an electron beam [36]. The visible greenish luminescence in agates is characterized by a typical emission line at ~500 nm accompanied by several equidistant lines due to the harmonic vibrations of oxygen atoms in the uranyl complex (Figure 15c). The mechanism of the uranyl luminescence is very effective and can be detected in agates with U contents as low as 1 ppm.
4.2. Geochemistry of Agates
4.2.1. Trace Elements
Trace elements represent impurities in the SiO2 matrix of agates and may be structurally incorporated into the regular lattice, in inter-lattice positions or can be related to micro-inclusions of fluids and minerals [106,125]. The chemical elements were mostly incorporated during agate formation and therefore, are important geochemical indicators of geological processes reflecting the origin of mineral-forming fluids and/or the specific conditions of crystallisation.
Table 1 presents a compilation of trace-element data from the literature representing different kinds of agates from worldwide occurrences. The results show a broad range of trace-element concentrations reflecting the influence of the geological background of the specific locations and the agate type. In principle, trace element concentrations are low and the content in macrocrystalline quartz is mostly lower than that in the associated chalcedony. Only certain elements are relatively enriched in agates. These are in particular Al, Ca, Fe, K and Na, which are probably mobilized and transported together with SiO2 from the host rocks during agate formation. Moreover, elevated concentrations of halogens (up to 380 ppm F and up to 154 ppm Cl; [63]) indicate that these two elements play an important role in fluids of the alteration and transport processes. In contrast, Sc, Nb, Ta, Th, Ti and other immobile elements are present in very low concentrations, often below the detection limit of trace-element analysis; only Powolny et al. [55] reported significant amounts of Zr in agates from Borówno, Poland.
Chemical analyses of separate agate zones or element profiles perpendicular to the banding provided more detailed information concerning the trace-element distribution within the microstructure of the agates [1,26,27,30,31,36,37,58,68,69,126]. The concentration profiles show variations for most elements and only some elements behave relatively constant (compare Figure 16, Table 2).
Results of these studies revealed a remarkable behavior for specific chemical elements. Remarkable high concentrations of Ge (>90 ppm), B (46 ppm) and U (>20 ppm) were detected in agates, which often exceed the average concentration of the Earth’s crust (for Ge = 1.4 ppm, B = 12 ppm) and sometimes the element concentration in the surrounding host rocks (Figure 16). Interestingly, the concentrations of Ge, B and U in macrocrystalline quartz are sometimes higher than in associated chalcedony (Figure 16). High Ge contents can be explained by the similar geochemical character of Si and Ge, which causes the common transport and incorporation of Ge into the quartz structure [125,128]. The occurrence of Ge and B defect centers in quartz of agates was confirmed by recent EPR measurements [68,107].
The observed high concentrations of U within some of the agates are noteworthy. In the literature, U contents of up to 1200 ppm are published for chalcedony in agates from acidic volcanic rocks [129]. The U contents of sedimentary agates from the Dryhead area (Montana, USA) are amongst the highest values (compare Table 1). The location is close to a Uranium deposit, and therefore there is high availability of uranium in the vicinity [31]. The mobility of uranium during the alteration of volcanic rocks was investigated by Zielinski [130], who observed a parallel accumulation of Si and U. Recent investigation showed that a substitution of Si ions in the quartz lattice by U is unlikely due to the different crystal-chemical properties, and instead the incorporation as uranyl silicate complex is favoured [36,131]. First, uranium can be adsorbed from solution by natural silica compounds (silica colloids) and then trapped as uranyl silicate complex in a stable silica matrix [131]. Luminescence studies confirmed the existence of uranyl compounds in quartz and chalcedony of agates [36] (compare Section 4.1.3).
First results were also published for rare earth elements (REE) in agates [30,37,55], which are preferentially bound to fluid inclusions and therefore, reflect the composition of the agate mineralizing fluids. The chondrite normalized REE patterns of different agate zones in Figure 16 are characterized by pronounced negative Eu anomalies and a slight slope of the light REE (La—Sm), whereas the shape of the heavy REE patterns (Gd—Yb) is increasing. Moreover, agates may show slight “tetrad effects”, i.e., a subdivisions of the REE series into four concave-upward groups [132,133]. Such REE distribution patterns can be explained by a primary crustal signature that is overprinted by an enrichment of heavy REE due to the preferred complexation of released HREE by carbonate- and F-complexes during the alteration and transport processes [134]. However, various scenarios for mineralizing SiO2-bearing fluids for agate formation are possible, sometimes also resulting in positive Eu-anomalies [55]. Indications for the mixing of extremely different compounds (e.g., volatiles, meteoric water) are also provided by the presence of Ce anomalies in some agates [34,37,135].
The measured trace-element profiles illustrate, that there can be a wide scatter of concentrations for certain trace elements, whereas others are relatively constant in their spatial distribution. For instance, balanced concentrations at a low level were recorded for the elements Li, Rb, Ba, Sr, Ga or Ti (Table 2). Contrast variations can be detected for Fe concentrations, which are mostly related to the color of the agates (Figure 16). Strongly colored (especially reddish and yellow) chalcedony bands have the highest Fe contents due to micro-inclusions of certain Fe-compounds (e.g., hematite, goethite). These zones can also contain elevated concentrations of other transition elements such as Mn, Ni or Cr [1,30]. Concentrations of up to 400 ppm Ni and 500 ppm Cr are reported by Barsanov et al. [136] for agates from Timan and Caucasus. The elements are probably incorporated in fine-grained iron oxides, where concentrations of up to 14 wt% Mn, >1000 ppm Ni and >550 ppm Cr were measured [1].
The general trend of the lateral trace element distribution from the agate host rock to the center shows a slight decrease in element concentrations within chalcedony without a direct relation between trace-element contents and banding, and with lowest contents of most elements in macrocrystalline quartz. These variations can probably be explained by a “self-purification” process during agate formation. Certain chemical elements are firstly precipitated together with the primary amorphous silica and accordingly are finely dispersed in the silica matrix. The following chalcedony growth may initially incorporate high contents of trace elements. During further crystallisation, the concentration of impurities decreases. Heaney [23] and Merino et al. [27] stated that the formation of frequent defects, Brazil twinning and the typical twisting in chalcedony are caused by the high trace-element contents in silica. Chalcedony fibers in agates may therefore be the result of dislocation growth. The continuous lowering of trace elements in the crystallisation medium may then finally cause the formation of coarse-grained quartz.
4.2.2. Isotope Composition
Isotope data of the SiO2 phases in agates may provide information about the isotopic composition of fluids from which the agates were formed and allow a first estimation of formation temperatures. The composition of the oxygen isotopes (δ18O) in agates from various locations and of different types reveals a rather wide range from 13 to 33‰ (Figure 18). In most cases macrocrystalline quartz from the respective specimens has slightly lower δ18O values than chalcedony of the same sample and more closely matches the values of hydrothermal quartz precipitated by late magmatic fluids [137]. The difference between the δ18O values of chalcedony and quartz can possibly be explained by the lower equilibrium constants in the system quartz–water compared to the systems tridymite–water and cristobalite–water [138,139]. Accordingly, amorphous SiO2, chalcedony, cristobalite and tridymite may have higher δ18O values than quartz formed under the same temperature conditions.
During crystallisation of quartz from a mineral-forming fluid the initial 18O/16O ratio changes due to the preferred incorporation of the heavy 18O-isotope into the quartz lattice [137]. Because of the temperature dependence of this fractionation the measured isotope ratios can be used to calculate formation temperatures on the basis of the fluid oxygen isotopic composition [139]. However, no data exist regarding their oxygen isotope composition, since a direct analysis is mostly not possible because of the extreme small amount of fluid inclusions. Therefore, the temperatures of isotope fractionation were calculated assuming different fluid compositions of meteoric water (−10‰), oceanic water (0‰) and magmatic water (+8‰).
The calculation of agate formation temperatures based on these data provided rather low temperatures between 20 °C and 230 °C [30,31,37,140,141], depending on the isotopic composition of the involved waters. These temperatures cover a broad range between sedimentary origin and hydrothermal formation and have to be discussed in combination with other geochemical data. Fluid inclusion studies provided similar temperatures and confirm the results from the oxygen isotope investigations (see Section 4.2.3).
Results of spatially resolved oxygen isotope analyses of different agate bands reveal strong variations of the δ18O values (partially >10‰) over small scales in some agates, whereas others show a homogeneous isotopic composition (Figure 19). Assuming that the analyzed isotopic compositions are of a primary nature, the variations could be explained either by fluctuations of temperatures resulting in changes of the conditions of isotope fractionation, or variations in the primary isotope composition of the fluids, i.e., participation of fluids of different geochemical composition. Multiple temperature variations are not really likely, whereas the supply of SiO2-bearing solutions by mixing of surface water, heated meteoric water and/or magmatic fluids was discussed by several authors [13,30,37,41]. Different ratios of the participating fluids could then cause variations in the isotope composition.
Alternatively, isotope fractionation under non-equilibrium conditions could explain the observed isotopic variations due to various kinetic processes such as diffusion, adsorption, solution-precipitation, phase transformations or boiling. Kita and Taguchi [148], for instance, found kinetic effects in the fractionation between SiO2 and geothermal waters during precipitation of SiO2 that resulted in variations of the δ18O values of some ‰. Accordingly, the assumption of agate formation from silica-bearing geothermal waters via an amorphous precursor could also explain heterogeneities in the isotopic composition.
Strong variations were also reported for δD values in chalcedony (−130‰ to −40‰) and macrocrystalline quartz (−90‰ to −50‰) in agates from different localities including variations between different agate bands within single agate samples [30,145]. These data support the idea of fluid mixing and non-equilibrium conditions during agate formation. Therefore, the isotope data of agates have to be interpreted with care.
4.2.3. Fluid Inclusions and Water in Agate
Several studies have shown that agates may contain considerable amounts of water and other fluid components [1,13,15,21,34,37,40,73,149]. The H2O content in the agate matrix varies between 0.5 and 3 wt% [13,21,40] and is preferentially present as OH (Si-OH silianol groups). This is in contrast to opal, which may contain up to 10 wt% H2O, predominantly as molecular water. Flörke et al. [13] assumed that the incorporation of OH and H2O in chalcedony is especially related to structurally damaged crystal boundaries.
Frondel [150] first stated that the content of structural water in different agate zones can differ due to variations in the amount of different SiO2 phases and their microstructure within the agates. Graetsch et al. [151] investigated separate parts of chalcedony from Brazilian agates and determined water contents between 0.65 and 1.42 wt% in the wall-lining agate and 0.56 up to 0.92 wt% in horizontal agate layers. The ratio between silanol water and molecular water varied between 0.4 and 1.0. Based on these data they postulated temperatures of agate formation below 250 °C and pressures lower than 50 MPa.
Moxon and Rios [40] and Moxon [21] found a decreasing amount of silanol water with increasing geological age during their investigations of agates from worldwide occurrences in 23 to 2717 million years old parent rocks. The total water content varied in the agates between 0.23 and 1.78 wt% and the average amount of structural silanol water was found to be 76% of the total water content. They concluded that silanol groups were released during the recrystallisation of moganite to chalcedony and therefore, an estimation of the age of agates based on the amount of structural water should be possible. These conclusions supported previous assumptions that agates from Brazil and New Zealand were formed long after their host rocks [21].
Small amounts of gases and liquids from mineral-forming fluids can be incorporated into growing crystals during their formation. The type, frequency and chemical composition of such fluid inclusions can provide valuable information for the reconstruction of the mineral-forming processes. Several fluid inclusion studies in agates have shown that more or less no visible fluid inclusions exist in cryptocrystalline quartz (chalcedony) because of the extreme small crystal size. Therefore, analyses are only possible in macrocrystalline quartz crystals from the agate centers. The frequency of measurable primary inclusions in the quartz crystals of agates is in general very low (Figure 20) and the inclusions are extremely small (<20 µm).
Published homogenization temperatures of quartz from agates scatter in a very broad temperature range between <100 °C and >500 °C [15,37,149,152,153]. However, the interpretation of the measured homogenization temperatures has to be done very carefully. Different degrees of filling in the inclusions (i.e., ratio of gas to liquid phase) provide indications for fluid trapping under heterogeneous conditions. This conclusion is supported by a strong variation of the measured homogenization temperatures. Such heterogenization can be caused by splitting of fluids into an aqueous phase with high salinity and a gaseous phase with low salinity at high temperatures (>375 °C) due to drop of pressure [154,155].
Another possibility is phase separation in the subcritical temperature range (<375 °C) at low pressure due to boiling in an open system (aqueous phase with saturated water vapor). These conditions result in the occlusion of gas/liquid mixtures of varying ratios. Therefore, homogenization temperatures cannot directly be used as trapping temperatures of the fluids [154]. The minimum temperature of trapping is then represented by the lowest measured temperatures of fluid homogenization. Taking into account all these facts, a heterogeneous trapping of inclusions has to be assumed for most of the investigated agates from acidic and basic volcanic rocks. Table 3 summarizes minimum homogenization temperatures for agates of some German occurrences. These data confirm the results concerning agate formation temperatures obtained from oxygen isotope studies (compare Section 4.2.2).
In addition, cryometric measurements provided information concerning the chemical composition of the investigated inclusions. In agates from basic and intermediate rocks, quartz mostly contains inclusions having low salinity (<4 eq% NaCl). In contrast, agates from acidic volcanic rocks sometimes contain inclusions with up to 30 eq% NaCl indicating the involvement of magmatic solutions. Besides NaCl, especially KCl and CaCl2 have been detected as salt phases [37,149]. For instance, eutectic temperatures of −10.5 °C and the absence of salt hydrates in fluid inclusions of agates from Saxonian agates favored KCl as the main salt component in the fluid system [37]. Measurements of the freezing point depression according to Hall et al. [156] revealed salt concentrations of 0.65–2.4 wt% KCl.
To get more information about the geochemistry of the gaseous and liquid fluids involved in the transport of silica, systematic studies of agates were performed by evolved gas analysis (thermogravimetry-mass-spectrometry; [34,73]). The volatile components were released and transferred into a vacuum during heating at various temperatures in the temperature range between 25 and 1450 °C and identified according to their mass-charge-ratio and the corresponding intensity ratios of the detected volatile fragments.
The results provided information regarding the participation of different fluids during agate formation. The detected volatiles consisted of compounds of C, N, S, F and Cl with oxygen and/or hydrogen (e.g., H2O, HF, NO, S, SO, CO, CO32−). In particular in agates from volcanic rocks, several hydrocarbon compounds as well as carbonic acids could be identified [34,44,73]. The incorporation of hydro-carbon compounds into the SiO2 matrix points to co-precipitation of both compounds, probably originating from the same source. Hydrothermal methane and/or other hydro-carbon compounds in the volatiles participating in the silica accumulation could have served as precursors for the detected organic fluids in the agates.
The data emphasize that a transport of elements and chemical compounds in aqueous solutions cannot be the only process governing agate formation. Therefore, the discussion of the agate genesis has to be focused not exclusively on the system SiO2–H2O but has to consider a complex multi-component system including both meteoric water and magmatic fluids (CO2, HF, HCl, hydrocarbons, etc.).
4.3. Paragenetic Minerals in Agates
Many field observations and analytical results document that besides the different silica minerals numerous other mineral phases are formed pre-, syn- and post-genetically with the agates. Depending on the type of host rocks and the time of formation these minerals can occur as mineral inclusions in quartz, paragenetic minerals intergrown with SiO2, or pseudomorphs, and their size can range from microscopic inclusions up to several cm in size. These differences can be related to the different geological background and differences in the conditions of mineralization of the agates.
The compilation of detected minerals in agates in Table 4 illustrates that all mineral classes occur. Furthermore, several organic phases were detected in agates such as carbonaceous material, solid bitumen or disordered graphite-like substances [35,44,45,46]. Carbonates (especially calcite), iron oxides/hydroxides and clay minerals are the most frequent and present in more or less all types of agates, whereas minerals of the zeolite group are typical phases in volcanic agates [1,15,49,78]. It is noteworthy, that certain chemical elements may be present in different chemical compounds in the same agate. For instance, native copper can occur together with copper oxide and copper sulfide, or pyrite/marcasite in association with iron oxides/hydroxides in agate geodes. This is a line of compelling evidence for highly variable physicochemical conditions (especially redox conditions) during mineral formation.
The observed mineral associations (and their stability fields) in volcanic agates indicate a preferred formation under hydrothermal and low temperature conditions. The most frequent mineral phases such as clay minerals, zeolites, iron oxides/hydroxides and carbonates can be related to the alteration processes of the volcanic host rocks and emphasize that besides enormous amounts of SiO2 also Al, Fe, Ca, Na and K are released during these processes. The presence of water- and hydroxyl-bearing minerals, carbonates and fluorite in volcanic agates highlights the role of H2O, CO2 and F-complexes as main volatile compounds for the transport of substances [34].
In contrast to the agates from volcanic rocks, hydrothermal vein agates can be formed within veins and fissures of the crystalline host rocks directly from circulating hydrothermal solutions. Therefore, SiO2 minerals can precipitate and crystallize together with a number of other hydrothermal minerals such as carbonates, sulphates, fluorite and/or certain ore minerals (oxides, sulphides).
In sedimentary rocks, where agates are formed by filling of cavities and empty pore space with SiO2 or the silicification of concretions and pseudomorphism, these processes often take place during sedimentation or early diagenesis, when the sediments contain enough moisture. Characteristic mineral associations commonly include carbonates, sulphates, clay minerals, sulphides and oxides/hydroxides [15,31,42,157,158]. In addition, large crystals of quartz, calcite, celestine or barite can form in the center of the geodes.
Carbonates, especially calcite (CaCO3), belong to the most frequent minerals in volcanic agates [30,38,76,78,159,160]. Coarse-grained calcite has often been formed as overgrowth on quartz or chalcedony in the central part of the agate geodes, but calcite layers intergrown with chalcedony are also possible (Figure 21). A special case is the so called “calcite agate” [38,161,162], an “agate” completely consisting of calcite (Figure 21d). The multiphase character of the calcite formation and several replacement processes can be proven by microscopic investigations (Figure 21b,c).
Geochemical investigations of calcite in agates sometimes showed several carbonate generations and proved a temperature of crystallisation in the range between ca. 20 and 230 °C [1,30,76,77,160], which confirms the estimated temperatures of agate formation. In addition, oxygen and carbon isotope studies of calcite in agates provided indications concerning participation of at least two different fluids during formation. Relatively high δ18O-values (up to +25‰) point to a sedimentary source, whereas δ13C-values between −5 and −15‰ can be related to a primary magmatic origin [1,30,78,159,160]. The isotope signature of calcite can probably be explained by processes of fluid mixing during formation, where carbon inherits its primary magmatic signature (volcanic H2CO3 as the dominant carbon species), whereas the signature of oxygen isotopes is overprinted by the secondary influence of meteoric water (H2O).
Another remarkable feature in worldwide agate occurrences is the appearance of iron-bearing phases in agates, indicating high concentrations of iron in the mineralizing fluids [1,15,30,31,37,47,59,159,163]. Different types of iron oxides and hydroxides in the marginal parts of the agates as well as within the chalcedony matrix cause the typical colorations in red, brown and yellow (Figure 22). In addition, enrichment of iron compounds in the form of crusts or earthy masses in the central parts of agates can be observed.
Microscopic investigations revealed that at least three different types of iron oxides (hydroxides) can be distinguished, which are closely connected with the agate formation (Figure 22). Iron oxides (e.g., hematite) of probably pre- or syngenetic formation often appear at the interface between host rock and agate or in the outermost chalcedony layer. The crystals show spherulitic as well as acicular or dentaloid forms, the latter probably originating from the replacement of former existing carbonates (pseudomorphs).
Other types of iron oxide inclusions have been observed within the agate matrix (Figure 22b). On one hand, laminated and lenticular agglomerates of very small hematite particles (<10 µm) occur. In contrast, the other type is represented by larger, sometimes globular or irregular aggregates of up to several 100 µm in size. The fine-grained particles were probably released from the silica matrix during crystallisation, moved together with the growth front and accumulated along the banding. In contrast, larger iron oxide inclusions show interesting structures consisting of several rounded disks. These structures indicate that the iron oxides neither existed before the crystallisation of the chalcedony, nor have been incorporated later. Most likely, iron oxides and silica precipitated simultaneously from a precursor sol.
The complex processes during agate formation and the accompanied variations of the physico-chemical conditions often result in a wide variety of inclusions and replacements of earlier existing phases in agates (e.g., pseudomorphism and perimorphism). Pseudomorphism of quartz is frequently detectable after carbonates (calcite, aragonite) and sulfates (barite, anhydrite/gypsum), but also after zeolites and pyrite [1,15,28]. The earlier existing minerals have been replaced by SiO2-rich fluids (Figure 23). In most cases the original minerals are completely replaced and the former mineral is at most recognizable on basis of its preserved crystal shape. Therefore, relics of the pre-existing minerals are only detectable using highly advanced analytical methods. Figure 23 shows a sample of agate pseudomorphs from Liebgensmühle near Leisnig, (Saxony, Germany) with pseudomorphs of an elongated shape. Microscopic CL studies under high magnification revealed relics of primary dolomite and inclusions of kaolinite probably from alteration processes (Figure 23c). However, the agate almost completely consists of SiO2. In other cases, interstices between pre-existing minerals can be filled by agate such as in the case of the well-known Paraiba agates in Brazil. In result, the agates develop polygonal outer shapes resembling crystal faces (so called “polygonal agate”; Figure 23d).
5. Discussion
5.1. Origin of Cavities for Agate Formation
A precondition for the formation of agates is the availability of cavities or open spaces, in which silica can be accumulated. Depending on the geological environment, different types of holes and fissures may exist, which significantly influence the appearance and characteristics of the associated agates. The outer shape of an agate is more or less a replica of the former existing cavity (compare Figure 2). Therefore, in different types of rocks the kind of cavities is variable.
In basic volcanic rocks (basalts, andesites), the accumulation of silica and the formation of agates take place in former gas/liquid bubbles of the solidified lava (amygdales). Because of the high temperatures and low viscosities of these basaltic melts, the lava is flowing over large areas and many gas bubbles are formed in the internal, coalescing during ascent and got stuck during cooling of the solidifying basalt (Figure 24a). These gas bubbles often exhibit rounded or drop-like shapes and form vesicular textures. The primary relations are often visible in the outcrop showing vesicles that are arranged in the flow structure of the former lava (Figure 24b).
The formation of cavities in acidic volcanic rocks occurs via several stages. The process starts with the formation of spherical forms of crystallisation, so called high-temperature crystallisation domains (HTCD) [166]. HTCD with one or more cavities are called lithophysae (thundereggs), which exclusively occur in SiO2-rich lavas, ignimbrites or subvolcanic bodies and crystallize above the glass transition temperature Tg [167,168]. The position of the lithophysae within the flow texture of the volcanic rocks often provides evidence concerning their early crystallisation before the final solidification of the melt (Figure 2a). Cavity formation is assumed to be the result of transient tensional stress in the melt close to the HTCD crystallisation front (Figure 25a; [166]).
The complexity of the processes can result in the development of single, double and multiple lithophysae (Figure 25b) as well as in complex structures due to the twofold (or multiple) opening and filling with silica or alteration products such as clay minerals or iron compounds (Figure 25c). Lithophysae normally appear in sizes of several cm or dm, but examples with diameters of more than 4 m (“megaspherulites”) have also been reported from several localities in the USA, Argentina and China [169].
Hydrothermal vein agates represent a completely different genetic type of agates. These agates form directly within veins and fissures in different crystalline host rocks, which have been formed by tectonic processes (Figure 2e). The vein-like structures are often connected with deep-seated faults with ascending hydrothermal solutions. Vein agates and veinlike silica mineralization often occur together with ore mineralization in hydrothermal systems, e.g., with carbonates, sulfates, sulphides or certain gold deposits worldwide (e.g., [102,170]). In the case of sufficient silica supply, the vein structures can be completely filled with agate and quartz. The sealing of the veins during continuous hydrothermal activity can cause increasing pressure in deeper levels and the fracturing of the primary vein structure [171]. These fractures are often filled with a secondary generation of agate or quartz, which is visible by healed brecciation (“brecciated agate” or “Trümmerachat” Figure 26a).
In sedimentary rocks, agates are predominantly formed by silicification of concretions or pseudomorphism due to the replacement of soluble mineral species such as sulphates (e.g., anhydrite) or carbonates (calcite, dolomite) by silica [31,42,157,158,165,173,174]. Residues of plants and animals can also be silicified [79,80,175,176]. The silica originates from circulating pore water, which can precipitate under specific conditions. Geochemical data indicate a preferred silicification in shallow sediments, especially in areas with increased salinity (lagoons, marine shelf) under near-surface conditions and temperatures below 40 °C [177]. Sedimentary agates are often characterized by typical features such as a cauliflower-like surface, the frequent presence of quartzine besides chalcedony or the lack of horizontal banding (Figure 26b,c) [15].
5.2. Temperature of Agate Formation
One key point of scientific discussions concerning agate genesis is the temperature of formation. There is no doubt concerning the hydrothermal nature of most vein agates, and agate formation in sediments is running at relatively low temperatures under surface or diagenetic conditions. However, the arguments about the formation of agates in volcanic rocks are extremely widespread. There exist theories about an agate formation both at high temperatures (>400 °C) [1,15,56,178] and ideas about agate genesis at low temperatures (20–100 °C) in a sedimentary-diagenetic environment (e.g., [14,140,179,180]).
Investigations of active thermal vents such as in the Yellowstone Park or on Iceland, or the recent formation of agate-like structures on the seafloor [64] in so called “white smokers” point to a temperature range below 100 °C. However, recent observations concerning the formation of colloidal silicic acid in high-temperature hydrothermal fluids (300 up to >700 °C) indicate that agate formation at high temperatures in volcanic rocks seems to be possible [181]. Interestingly, experiments concerning the synthesis of chalcedony successfully run under elevated temperatures: White and Corwin [182] produced chalcedony during hydrothermal treatment of silica glass at 400 °C/340 bar, Flörke [183] synthesized chalcedony at temperatures above 400 °C, and Oehler [184] succeeded with syntheses at 100–300 °C and 3 kbar.
Modern analytical methods such as fluid inclusion studies, isotope or trace-element analyses provide useful information for the estimation of the temperatures of mineral-forming processes. In the case of fluid inclusion studies in agates, several limitations have to be taken into account. A direct determination of the temperature in agate (chalcedony) is mostly not possible because of the lack of measurable fluid inclusions. Data are only provided by fluid inclusion studies of the macrocrystalline quartz layers. Moreover, a heterogeneous trapping of inclusions has to be assumed for most of the investigated agates from acidic and basic volcanic rocks.
Taking into account all these facts, minimum homogenization temperatures for agates from volcanic rocks of some German occurrences scatter between ca. 95 °C and 186 °C (compare Table 3). The hydrothermal vein agate from Schlottwitz, Saxony (Germany) provided a temperature of 80 °C. These temperatures are in the same range as crystallisation temperatures calculated from inclusion studies of associated minerals in agates (e.g., calcite) [160].
An estimation of the temperature of formation of agates is also possible by using oxygen isotopes. Oxygen isotope data of agates from worldwide occurrences (Figure 18) are mainly in the range between +20‰ and +30‰ but show a scatter of δ18O values over a broad range between +13‰ and +33‰. The estimated temperatures of agate formation using the fractionation curve of Matsuhisa et al. [139] result in a range between surface temperatures and ca. 230 °C. An exact calculation of temperatures is mostly not possible because of the unknown origin of the primary fluids, but the temperatures are in accordance with the temperatures obtained from fluid inclusion studies.
The results of both methods show relatively high formation temperatures for volcanic agates, which indicate that the mobilization and accumulation of silica started already during a late phase of or soon after the volcanic activity [37]. Considering temperatures obtained from the fluid inclusion homogenization, temperature calculations for different fluid compositions clearly indicate the mixing of dominant amounts of late magmatic (hydrothermal) fluids with smaller amounts of meteoric water [37]. The spatially resolved isotope analyses revealed that the scatter in δ18O-values may be as high as 10‰ even in adjacent chalcedony layers (compare Figure 19) confirming the idea of fluid mixing and/or isotope fractionation under non-equilibrium conditions.
Götze et al. [185] first tried to estimate the temperature of agate formation using the Al concentration in quartz (“Al-geothermometer” of Dennen et al. [186]). The temperatures were calculated from the amount of [AlO4]0 centers determined by EPR measurements [187]. The [AlO4]0 concentrations in macrocrystalline quartz of the agates provide reliable temperatures of formation between 65 and 200 °C, which are very close to the estimated temperatures using fluid inclusions or oxygen isotopes (Figure 27). In contrast, calculated temperatures for chalcedony of up to 655 °C as well as strong variations between different chalcedony bands within one agate sample indicate that these temperatures are invalid. It is assumed that the high temperatures are artifacts, which result from non-equilibrium crystallisation processes.
The evaluation of the different methods applied for a calculation of the temperature of agate genesis illustrates that reliable results in most cases are only possible via the analysis of macrocrystalline quartz from the agates. Direct measurements of chalcedony bands provided only reasonable results for oxygen isotopes. In summary, it can be concluded that the temperature interval of agate formation ranges from surface conditions up to temperatures of ca. 230 °C. These temperatures are confirmed by the stability fields of associated paragenetic minerals, homogenization temperatures of fluid inclusions in paragenetic calcite, the low degree of maturity of carbonaceous matter found as cogenetic inclusions within some agates (e.g., [35,45,46,60]) as well as specific microstructural properties of agates. Results of Götze et al. [68] emphasized that the yellow CL, which can often be detected in agates, is a typical indication for low-temperature hydrothermal environment (mostly <250 °C) and is related to fast crystallisation processes from non-crystalline silica precursors.
The geochemical data indicate a mixing of heated meteoric water with magmatic fluids, which alter the volcanic host rocks and release SiO2. There is no indication for a participation of supercritical fluids, although it cannot be excluded. Additionally, a formation of agate directly from an igneous melt is unlikely.
5.3. Origin and Supply of Silica
The SiO2 sources for agate formation can clearly be related to the geological environment of the agates. Silica in hydrothermal vein agates and sedimentary agates originates from ascending hydrothermal fluids and silica-rich pore solutions, respectively. In contrast, SiO2 in volcanic agates represents a product of late- or post-volcanic alteration/weathering of the volcanic host rocks [24,28,37,41,62,63,180].
The formation of agates in volcanic rocks especially occurs in marginal parts of the volcanic bodies and zones with high activities of fluids and water. Geochemical data indicate that heated meteoric water in interaction with magmatic fluids intensively reacts with the host rocks resulting in certain alteration processes (“autometasomatosis”). These alteration processes are reflected in the chemical composition of the agates showing elevated concentrations of elements from the rock matrix (e.g., Al, Fe, K, Na, Ca; compare Table 1) and the occurrence of characteristic secondary minerals in agates (see Table 4). In particular unstable volcanic glass and minerals (e.g., pyroxene, feldspar) are converted into clay minerals, zeolites, and Fe-oxides/-hydroxides, accompanied by the release of enormous amounts of SiO2 and alkali elements (Table 5). Although the principle processes in basic and acidic volcanics are similar, the specific rock composition and the chemical environment (T, Eh, pH, CO2, SO2, water, etc.) strongly influence the alteration processes [78,188,189,190,191,192,193,194,195].
In mafic volcanic rocks, a greenish layer of sheet silicates (celadonite) can often be observed at the interface between agate geode and host rock. In addition, several minerals of clay and zeolite groups occur as secondary minerals in association with agates [78,196,197]. The process of the rock decomposition and silica release in acidic volcanic rocks is mainly characterized by the formation of sheet silicates such as kaolinite, illite or montmorillonite. Holzhey [63] measured up to 18 wt% illite in the agate-bearing altered rhyolites of the Thuringian forest (Germany). Kryza [198] calculated that the metasomatic processes in 1kg rhyolite can mobilize up to 235 g SiO2. Therefore, these processes significantly contribute to the release of silica for the agate formation.
Sufficient amounts of fluids (H2O, but also CO2 or F) have to be available to enable alteration and transport processes of released silica to the agate cavities. The silica transport in aqueous solution is mainly limited by the extreme low solubility of SiO2 in water. Several factors control silica solubility such as the pH (the solubility strongly increases at pH > 9), the temperature (100–140 mg/L at 20 °C; 300–380 mg/l at 90 °C) [199], and the silica phase which is in equilibrium with the solution. According to Landmesser [8], for instance, a silica concentration of 250 mg/L SiO2 in the solution would require up to 0.5 m3 water to flow in and out a cavity to form an agate of ca. 100 g. Since sufficient pathways for free liquids are lacking in most rocks, the silica supply and accumulation by diffusion processes via intergranular pore space to the cavities is favored.
Due to the larger size (1–100 nm) and rather low diffusion rates of colloidal SiO2 particles, the proposed main process of silica transport silica is via diffusion of monomeric silicic acid (H4SiO4) [8,200]. Recent investigations confirm this hypothesis, showing the release of polymeric and monomeric silicic acid during weathering processes of various silicate minerals. While monomeric silicic acid is the dominating species in a broad range of pH 1–9, polymeric forms including more than ten silicon atoms require higher pH values of above pH 10 [201]. Taking this into account and the fact that most weathering solutions show a pH value <9, the assumed transport mechanism for dissolved silica is via monomeric Si(OH)4 (or oligomer).
The continuous supply of silicic acid results in the accumulation of silica and the filling of the cavities. Subsequent condensation processes lead to the formation of SiO2 sols and amorphous silica. In a first step, condensation processes cause the bridging of molecules of monomeric silicic acid and the development of Si–O–Si siloxane bonds [100].
≡Si–OH + HO–Si≡ → ≡Si–O–Si≡ + H2O
As a result of this process, polymeric silicic acid is formed consisting of up to 10 Si atoms, which are linked via Si–O–Si bonds [201]. Further polycondensation results in the formation of discrete particles (sol). During succeeding reactions, the particles grow, form chains, and finally a three-dimensional network (gel; Figure 28). Even in the case of supersaturation, SiO2 does not precipitate immediately because of the initial formation of di- and polysilicic acid (stable negative sol). These sols are hydrophilic and hardly flocculate due to the water film. Factors which promote the flocculation and the transition from gel to a SiO2 precipitate are the lowering of temperature and pH (e.g., mixing of fluids, contact with ground water, etc.), the presence of positively charged Al- and Fe-hydroxides from the residual solutions of the clay mineral formation, or electrolytic reactions [179]. The formation of agates from such polydisperse colloidal systems can also explain the manifold and partially very complex agate structures.
Paragenetic minerals like e.g., calcite and fluorite and significant concentrations of elements (e.g., B, Ge, U) in agates indicate that the composition of fluids which altering the volcanic rocks and also mobilize and transport the dissolved chemical compounds can vary significantly from “pure” water. CO2, for instance, is essential for the formation of calcite from a fluid phase. In addition, chemical transport reactions (CTR) of gases and liquids are realized most probably by stable fluoride compounds like for example SiF4, BF3, GeF4 or UO2F2 [34]. Si, B, Ge and U transport can be much better explained by CTR than exclusive transport by H4SiO4 in water. Actually, F concentrations of 25 up to 360 ppm have been found in agates of various occurrences [126]. In addition, REE distribution patterns measured in agates indicate that released HREE are preferably incorporated in carbonate- and F-complexes during alteration and transport processes [134]. Pronounced Ce anomalies in certain agates also provide indications for a possible mixing of different fluids from contrasting sources (e.g., magmatic volatiles, meteoric water) [55,135].
5.4. Formation of Agate Banding and Color
The results of the microstructural and geochemical investigations show that visible agate banding appears due to variations of silica phases, their respective crystal size and habit, and porosity. The formation of spherulites from an amorphous (non-crystalline) silica precursor [202] and the following crystallisation characteristics of SiO2 and self-organization of silica and impurities are the most important processes in the development of the characteristic agate microstructure [25,203,204]. Assuming that the initial cavity was filled with a silica sol and/or amorphous silica, the silica’s flocculation and crystallisation process must have been initiated by either changes in the physico-chemical conditions (e.g., T, pH) or reactions of positively charged compounds (e.g., Fe- or Al-hydroxides) with the negatively charged colloidal silica. The crystallisation mostly starts from the wall of the agate chamber with the formation of micro-granular or spherulitic quartz proceeding with fibrous chalcedony inwards to the center of the nodule and often ends up with macrocrystalline quartz (Figure 29). Indications for crystallisation processes of amorphous precursors under non-equilibrium conditions are provided by the results of CL and EPR studies, and are also documented by heterogeneous internal textures of macrocrystalline quartz crystals, which appear homogeneous in the optical microscope (Figure 29b,c).
Wang and Merino [205], Heaney [23] and Merino et al. [27] published crystallisation models describing the formation of agate banding in the light of self-organizing processes. Therefore, the fibrous texture of chalcedony could be explained by the dynamics of silica and impurity (i.e., trace elements) transport in the surrounding environment. It is assumed that the impurities are initially precipitated together with the primary amorphous silica leading to a fine dissemination in the respective matrix. The first emerging chalcedony spherulites therefore may contain relatively high concentrations of trace elements. Because of the interaction of morphologically rather unstable crystallisation fronts of quartz and cation-enhanced quartz growth, a first generation of twisted chalcedony with high impurity content is formed. The ongoing silica release and lowering of trace elements during further crystallisation result in a residual medium of aqueous character with low silica concentration. Consequently, the advancing crystallisation front becomes more and more morphologically stable and macrocrystalline quartz evolves. The interface between chalcedony and quartz is often accompanied by a characteristic drop of both impurities and structural defects. This idea is supported by frequent inclusions of iron compounds and elevated contents of Al in the agates. For instance, Götze et al. [206] measured up to 0.55 wt% Al in early opal-CT of agates from Los Indios (Cuba) in contrast to 8–13 ppm Al in macrocrystalline quartz of the same sample.
Self-organization and Ostwald-ripening result in appropriate crystallisation sequences and the crystallinity of SiO2 increases with proceeding maturity: amorphous SiO2 → opal-CT/cristobalite → moganite → chalcedony (microcrystalline SiO2) → macrocrystalline quartz (Figure 30). The succession of maturation can be explained by the decrease of the chemical potential and the Gibbs free energy ΔG according to the OSTWALD rule. During this process, the initial water content of up to 12% in amorphous silica decreases down to almost 0% in crystalline quartz [21]. The decrease in volume during ageing and dehydration of silica is compensated by fine dispersed pore space. The formation of completely filled nodules requires a continuous supply of silicic acid during the crystallisation and “self-organization” process, which may diffuse/penetrate through the existing layers of the agate. Alternating layers of chalcedony and macrocrystalline quartz indicate possible multi-step processes of silica supply and agate formation [51].
It cannot be excluded that during ripening of amorphous silica certain layers/zones of different constitution (silica and/or water content, accumulation of trace elements, etc.) had already formed as precursors for the formation of a variable agate microstructure due to processes of diffusion and chemical differentiation (segregation; [57,207]). The formation of agate bands could then be related to a nonlinear reaction–diffusion–advection system, where fractal patterns are formed due to Belousov-Zhabotinsky (B-Z) chemically-oscillating reactions, similar to those in other minerals and materials [208,209,210]. Pabian and Zarins [24] proposed the B-Z reaction as a mechanism for agate genesis with an initial silica gel and cyclic chemical effects caused by later contact with alkaline water. However, apart from the continual need of circulating alkaline water, the mechanism fails as any gel would eventually collapse. Nevertheless, the agate formation from polydisperse colloidal systems allows the explanation of the wide spectrum of agate structures.
Up to now, only limited information concerning the timescale of the filling and crystallisation processes are available from technical processes or mathematical calculations. Oehler [184] crystallized silica gel to quartz in the laboratory in between 12 h and 180 days. However, these experiments run under high-pressure/high-temperature conditions, which might not apply for agate formation. Ortoleva et al. [25] calculated a duration of about 5000 a for the crystallisation and growth process of a spherical agate with a diameter of 3 cm. Other calculations indicate that the duration of the processes may range from some hundreds to some ten thousands of years [211]. Of course, the time will strongly be influenced by the specific conditions of formation.
The origin of color(s) and color banding in agates is closely connected with the formation of the agate microstructure. The most common colours in agate are white, grey and blue (Figure 31). These colours are caused by variations in crystallite size, microstructure (including water content) and porosity. SEM studies showed that white agate bands are not fibers but a relatively thick plate edge-like structure, whereas the clear areas are globular and mostly have high porosity [19,21]. These plate edges are able to totally reflect incident light while the non-white area allows some white light to be transmitted. The blue color is caused by the dispersion of light on the micro-particles (Tyndall effect). In particular, blue agate bands are relatively sensible for aging processes. Sometimes they lose their concise banding during several years (Figure 31b). This might be related to the loss of water, since storage in water can at least partly reactivate the blue color (Figure 31c).
Although amethyst and smoky quartz can frequently be observed as macrocrystalline incrustations in the agate center, color centers related to point defects in chalcedony are rare. Up to now there is only evidence for the origin of violet color of chalcedony in “Grape agate” from Pantai Ngalo, Sulawesi (Indonesia) due to the amethyst color center [212]. In most cases, the colorful bands are correlated to the distribution and fixation of impurities in the silica matrix during the crystallisation process and often show conformity to the structural banding. Liesegang [11] tried to explain the formation of color banding by diffusion processes of metal ions in silica gels (Liesegang rings), and he suggested that also the rhythmic crystallisation of the agates is caused and influenced by these impurities. The appearance of Liesegang rings in a gel is indeed very similar to that what we see in a natural agate. However, the formation of differently colored bands and the distribution of color pigments in agates are mainly governed by the self-organizational processes of the silica matrix during crystallisation.
The most frequent color pigments are iron phases; different chemical compounds of manganese were also detected. Certain amorphous and crystalline Fe-oxides and Fe-hydroxides (in particular, hematite and goethite) are mostly responsible for the frequent red and also yellow coloration of agates. Different color shades are caused by different kinds of iron compounds, varying amounts or grain size of the color pigments. The mixture of different compounds also results in varying shades of colors.
The presence of iron oxides within the SiO2 matrix is a result of high iron activity in the initial silica-bearing, mineralizing medium. The accumulation of fine-dispersed pigments along the banding of the chalcedony layers, parallel to the spherulitic structures, is probably a result of “self-purification” of the crystallizing SiO2 phases. The incorporation of iron into the quartz structure is limited and therefore iron is rejected from the emerging quartz crystals. Consequently, it is transported with the crystallisation front and accumulated/adjusted along the banding (Figure 32).
If distinct banding in agates is lacking, color pigments can be distributed randomly in the silica matrix resulting in irregular color distribution (Figure 32 and Figure 33a). Secondary effects due to alteration, weathering or infiltration of impurities along cracks can also change the primary colour banding in agates. In these cases, leaching or oxidation processes result in the formation of coloration or decoloration zones along the rims of the nodules or along secondary cracks (Figure 33b,c). Such secondary color distribution discordant to the agate banding is often called “chromatography” effect.
5.5. Microstructural Peculiarities and Possible Biosignatures in Agates
Some agates may show structural peculiarities, which deviate from the common microstructures. One of the widely discussed aspects is the presence of so called “infiltration channels” (“escape tubes” or “flow channel”; Figure 34a), which predominantly occur in agates of mafic volcanic rocks. The shape and name of these structural features suggest that they represent channels of silica supply during agate formation [211]. Although in some specific cases the real impression of silica inflow exists (Figure 34b), a closer examination shows that in most agates these structures may have formed by deformation of non-solidified silica in a plastic state. Microscopic studies revealed that the primary orientation of chalcedony “fibers“ changes at the interface and the banding is deformed. It is possible that this deformation is caused by increasing pressure during the formation process and central parts of the banding are squeezed outwards. Sometimes, agates even show multiple deformation features (Figure 34c).
The formation of stalactitic fabrics in agates is also a rare anomaly in agates (Figure 34d). It is known only from a few deposits worldwide such as in the USA, Brazil, Uruguay, Germany, Poland, Russia or India. The Baker Egg Mine in New Mexico (USA) is famous for the high amount (up to 10%) of geodes with stalactites [43]. It is assumed that the stalactites have been formed simultaneously with the wall layers from a liquid that had completely filled the cavity. Recent studies on such pseudostalactitic fabrics (sub-surface filamentous fabrics—SFF; [213]) in cavities of the Deccan Trap basalts in India (Figure 34d) revealed that the growth of the SFF is not limited to vertical directions and might be initiated by microbial activities [195]. Residues of organic material (fungal chitin) in the innermost filamentous core as well as the morphometric characteristics of certain filamentous fabrics indicate a biological contribution during an early state of SFF formation. The internal structure of SFF is mostly made up of a core of clay minerals (in particular smectite), celadonite and zeolites, followed by concentric layers of chalcedony. Similar results were obtained for moss agates (Figure 34e), which also show clear indications of biosignatures [33,195,213,214].
Other examples worldwide show that biosignatures and indications of biomineralization processes can be detected in agates and agate-like silica mineralization [33]. Several studies on ancient and modern hydrothermal systems revealed that microorganisms are closely connected with both terrestrial and deep-sea hydrothermal vents [215]. Almost all of the microfossils associated with hydrothermal systems are filamentous. These microorganisms are thermophilic (i.e., the organisms grow best at temperatures > 45 °C, sometimes >100 °C) and often obtain their energy from the oxidation of inorganic compounds (“chemolithoautotroph”) (e.g., [216,217,218,219].
Müller et al. [220] found Fe-rich cryptocrystalline silica masses with agate-like structures in the southern part of the Mátra Mts. (Hungary), in the neighbourhood of the Gyöngyöstarján and Gyönggyösoroszi area (Figure 34f). These agate-like aggregates in fractures and cavities of an andesite consist mainly of quartz, moganite, opal-CT, hematite, goethite (together with calcite, nontronite, celadonite) and show characteristic signatures of microbial activities (Figure 34g).
Because of the general lack of residues of organic materials within agates, the detection of biosignatures is mostly based on morphological criteria indicating former activities of living organisms. However, recent studies have proved that certain chemical pathways exist, that produce inorganic mineral matter resembling living forms [221,222,223,224,225]. The processes resulting in such crystal architectures include a couple of different chemical interactions including the complexation of ions, selective adsorption onto growing crystal surfaces, or temporary stabilization of an amorphous precursor phase [226]. These results emphasized that morphological criteria alone cannot evidence the biogenic origin of mineral matter.
In conclusion, unusual mineral forms and structures in agates can also be related to such inorganic chemical processes, as in the case of “plume agates” (Figure 34g,h). Such plume structures represent the well-known phenomenon of “silica gardens”—i.e., plant-like structures that formed due to the addition of certain metal salts to sodium silicate solutions. Such aggregations of inorganic self-assembly originate from a combination of osmosis, chemical reactions and buoyancy [222,224]. Moreover, carbonates of certain alkaline earth elements can develop highly unusual shapes during crystallisation in a silica-rich environment such as in the case of calcite in silica gel [226]. Laboratory experiments resulted in finger-like structures or bundles resembling the shape of natural sheaf of wheat (Figure 34i). Further studies revealed that these spectacular aggregations consist of numerous calcite rhombohedra that were self-assembled along their c-axis and form laminar aggregates with rhythmically banded patterns [227].
A new kind of agates with unusual features was recently found in volcanic rocks of certain occurrences in the Saar-Nahe region (Germany). These agates include spirals of several tens of µm up to several hundreds of µm in size within the silica matrix (Figure 34k). Because of the specific shape, the conspicuous creations first led to a controversial discussion concerning a possible biogenic origin (microfossils such as foraminifera or snails) or an inorganic formation [228]. However, detailed investigations revealed that the spirals probably developed from an amorphous silica precursor by self-organization growth and polymerization initiated by a screw dislocation (dislocation growth; [39]). The data indicate that agate formation runs through several structural states of SiO2 with amorphous silica as the first solid phase, and the specific conditions can produce manifold spectacular forms making agates a unique product of nature.
6. Conclusions
The present paper provides a comprehensive compilation of mineralogical and geochemical data of agates from worldwide occurrences in different host rocks. Based on these data in combination with field observations and results of laboratory experiments an attempt is made to develop a model concerning the formation of agates. The presented results illustrate that the processes of agate formation are complex and often involve multiple steps. Moreover, agate formation in volcanic rocks, in sedimentary host rocks or the formation of hydrothermal vein agate can run under different conditions and involve divergent processes.
The majority of agates can be related to mafic (basalts, andesites) and acidic (rhyolites, rhyodacites) volcanic host rocks. Many field observations and analytical results indicate that volcanic agates form in a late stage of volcanism or after solidification of the volcanic host rocks. Most of the silica necessary for agate formation is supplied by alteration processes of the surrounding volcanic rocks by heated meteoric water, hydrothermal/magmatic fluids and other volatiles such as CO2 or F-complexes. In vein agates, SiO2 derives from ascending hydrothermal-magmatic solutions, whereas silica in sedimentary agates is mostly accumulated by SiO2-rich pore solutions.
The transport of silica in the form of monomeric silicic acid H4SiO4 or oligomers is predominantly realized by diffusion processes to cavities in the host rocks. In basic volcanic rocks, vesicular cavities form from included gases and liquids during the solidification of the lava, whereas in acidic volcanics lithophysae (high-temperature crystallisation domains) are formed above Tg in the cooling melt as host for the agates. Vein agates can be formed in fissures and veins within different types of host rocks, where a free movement of silica-bearing mineralizing fluids through a system of cracks is possible. In sedimentary rocks, formation of agates is often accompanied by replacement of pre-existing soluble minerals (sulfates, carbonates) by silica.
The accumulation and condensation of silicic acid result in the formation of silica sols and amorphous silica as precursors for the development of the typical agate structures. The process of crystallisation often starts with the spherulitic growth of chalcedony or micro-granular silica continuing into chalcedony fibres. Macrocrystalline quartz crystallizes when the SiO2 concentration in the mineralizing fluid is low. The abundance of lattice defects and elevated concentrations of certain trace elements in agates as well as heterogeneous internal textures and sector zoning in macrocrystalline quartz crystals provide clear indications for crystallisation under non-equilibrium conditions. The formation of the typical agate microstructure is most likely governed by processes of self-organization. Depending on the specific physico-chemical conditions (e.g., T, pH, SiO2 concentration, trace-element contents), these crystallisation processes may proceed in a very complex way and result in characteristic structures, SiO2 phases, colors and inclusions. Oxygen isotopes, Al concentrations and fluid inclusion studies provided a temperature range for agate formation between ca. 20 and 230 °C.
During agate genesis not only silica minerals are formed, but also numerous other mineral phases. The spectrum of paragenically formed minerals can significantly vary in dependence on the genetic type of agate. These differences can be related to the different types of host rocks and differences in the conditions of mineralization. The most common minerals associated with agates are clay minerals, Fe-oxides/-hydroxides, minerals of the zeolite group and carbonates (especially calcite).
The complex processes of agate formation, often running under non-equilibrium conditions, result in a wide variety of peculiarities such as spectacular internal textures, “moss agates”, “plume agates” or stalactitic aggregations. Moreover, there are compelling indications for microbial activities that are sometimes involved in agate creation, at least in a very early state of formation. These specific features make agates a unique and spectacular product of nature. Although a lot of basic data concerning the formation of agates are now established, several open questions remain.
Supplementary Materials
The following are available online at https://0-www-mdpi-com.brum.beds.ac.uk/2075-163X/10/11/1037/s1, Table S1: Compilation of investigated agate occurrences with references to presented data and relevant published results, respectively.
Author Contributions
J.G., R.M., and Y.P. conducted different analytical measurements, evaluated the mineralogical and geochemical data, and provided appropriate parts of the manuscript. J.G. compiled and wrote the final version of the manuscript. All authors have read and agreed to the published version of the manuscript.
Funding
This research received no external funding.
Acknowledgments
The present publication would not have been possible without the help and promotion of numerous colleagues, students and friends over the last decades. Collaboration during sampling and scientific discussions with Terry Moxon (Doncaster, UK), Gerhard Holzhey (Erfurt, Germany), Johann Zenz (Gloggnitz, Austria), Klaus Schäfer (Vollmersdorf, Germany) successfully supported the preparation of the manuscript. Ulf Kempe (Freiberg, Germany), Reinhard Kleeberg (Freiberg, Germany), Harry Berek (Freiberg, Germany), Lutz Nasdala (Vienna, Austria) and Axel Müller (Oslo, Norway) are gratefully acknowledged for their analytical suppport and the fruitful discussions. We thank Galina Palyanova (Novosibirsk, Russia) for the invitation to write this review article for the special issue “Agates: Types, Mineralogy, Deposits, Host Rocks, Ages and Genesis” and the helpful comments. Reviews of Magdalena Dumańska-Słowik (Kraków, Poland), Terry Moxon (Auckley, Doncaster, UK) and two anonymous reviewers improved the quality of the manuscript significantly.
Conflicts of Interest
The authors declare no conflict of interest.
References
- Blankenburg, H.-J. Achat; VEB Deutscher Verlag für Grundstoffindustrie: Leipzig, Germany, 1988; 203p. [Google Scholar]
- Zenz, J. Achate/Agate; Bode-Verlag: Haltern, Germany, 2005; 656p. [Google Scholar]
- Zenz, J. Achate/Agates II; Bode-Verlag: Haltern, Germany, 2009; 656p. [Google Scholar]
- Zenz, J. Achate/Agates III; Bode-Verlag: Haltern, Germany, 2011; 656p. [Google Scholar]
- Brückmann, U.F.B. Abhandlung von Edelsteinen; Waisenhaus-Buchhandlung: Braunschweig, Germany, 1773. [Google Scholar]
- Collini, C. Tagebuch Einer Reise, Welches Verschiedene Mineralogische Beobachtungen, Besonders Über Die Achate und Den. Basalt Enthält; C.F. Schwan: Mannheim, Germany, 1776; 582p. [Google Scholar]
- Noeggerath, M. On the porosity and colouring of agates, chalcedonies, etc. Edinb. New Philos. J. 1850, 58, 166–172. [Google Scholar]
- Landmesser, M. Das Problem der Achatgenese. Mitt. Pollichia 1984, 72, 5–137. [Google Scholar]
- Daubrée, A. Synthetische Studien zur Experimental-Geologie; Vieweg-Verlag: Braunschweig, Germany, 1880; 122p. [Google Scholar]
- Nacken, R. Über die Nachbildung von Chalzedon-Mandeln. Nat. und Volk. 1948, 78, 2–8. [Google Scholar]
- Liesegang, R.E. Die Entstehung der Achate. Zent. für Mineral. 1910, 11, 593–597. [Google Scholar]
- Liesegang, R.E. Die Achate; Verlag von Theodor Steinkopff: Dresden/Leipzig, Germany, 1915; 122p. [Google Scholar]
- Flörke, O.W.; Köhler-Herbertz, B.; Langer, K.; Tönges, I. Water in Microcrystalline Quartz of Volcanic Origin: Agates. Contrib. Mineral. Petrol. 1982, 80, 324–333. [Google Scholar] [CrossRef]
- Fallick, A.E.; Jocelyn, J.; Donnelly, T.; Guy, M.; Behan, C. Origin of agates in volcanic rocks from Scotland. Nature 1985, 313, 672–674. [Google Scholar] [CrossRef]
- Godovikov, A.A.; Ripinen, O.I.; Motorin, S.G. Agaty; Nedra: Moskva, Russia, 1987; 368p. [Google Scholar]
- Macpherson, H.-G. Agates; The Natural History Museum and the National Museums of Scotland: London, UK, 1989; 72p. [Google Scholar]
- Moxon, T. On the origin of agate with particular reference to fortification agate found in the Midland Valley, Scotland. Chem. der Erde 1991, 51, 251–260. [Google Scholar]
- Moxon, T. Agate: Microstructure and Possible Origin; Terra Publications: Doncaster, UK, 1996; 106p. [Google Scholar]
- Moxon, T. Agates: A study of ageing. Eur. J. Mineral. 2002, 14, 1109–1118. [Google Scholar] [CrossRef]
- Moxon, T. Studies on Agate—Microscopy, Spectroscopy, Growth, High Temperature and Possible Origin; Terra Publications: Doncaster, UK, 2009; 102p. [Google Scholar]
- Moxon, T. A re-examination of water in agate and its bearing on the agate genesis enigma. Mineral. Mag. 2017, 81, 1223–1244. [Google Scholar] [CrossRef]
- Holzhey, G. Vorkommen und Genese der Achate und Paragensemineralien in Rhyolithkugeln aus Rotliegendvulkaniten des Thüringer Waldes. Ph.D. Thesis, TU Bergakademie, Freiberg, Germany, 1993; 132p. [Google Scholar]
- Heany, P.J. A proposed mechanism for the growth of chalcedony. Contrib. Mineral. Petrol. 1993, 115, 66–74. [Google Scholar] [CrossRef]
- Pabian, R.K.; Zarins, A. Banded Agates—Origins and Inclusions; Educational Circular No. 12; University of Nebraska: Lincoln, RI, USA, 1994; 32p. [Google Scholar]
- Ortoleva, P.; Chen, Y.; Chen, W. Agates, Geodes, Concretions and Orbicules: Self-Organized Zoning and Morphology; Kruhl, J.H., Ed.; Springer: Heidelberg, Germany, 1994; pp. 283–305. [Google Scholar]
- Heaney, P.J.; Davis, A.M. Observation and origin of self-organized textures in agates. Science 1995, 269, 1562–1565. [Google Scholar] [CrossRef]
- Merino, E.; Wang, Y.; Deloule, E. Genesis of agates in flood basalts: Twisting of chalcedony fibers and trace-element geochemistry. Am. J. Sci. 1995, 295, 1156–1176. [Google Scholar] [CrossRef]
- Cross, B.L. The Agates of Northern Mexico; Burgess Publishing Division: Edina, MI, USA, 1996; 130p. [Google Scholar]
- Götze, J.; Nasdala, L.; Kleeberg, R.; Wenzel, M. Occurrence and distribution of “moganite” in agate/chalcedony: A combined micro-Raman, Rietveld, and cathodoluminescence study. Contrib. Mineral. Petrol. 1998, 133, 96–105. [Google Scholar] [CrossRef]
- Götze, J.; Tichomirowa, M.; Fuchs, H.; Pilot, J.; Sharp, Z. Geochemistry of agates: A trace element and stable isotope study. Chem. Geol. 2001, 175, 523–541. [Google Scholar] [CrossRef]
- Götze, J.; Möckel, R.; Kempe, U.; Kapitonov, I.; Vennemann, T. Origin and characteristics of agates in sedimentary rocks from the Dryhead area, Montana/USA. Mineral. Mag. 2009, 73, 673–690. [Google Scholar] [CrossRef]
- Götze, J.; Martins, M.S.; Czarnobay, J.C. Achate aus Brasilien. Veröff. Mus. für Nat. Chemnitz 2010, 33, 63–78. [Google Scholar]
- Götze, J.; Müller, A.; Polgári, M.; Pál-Molnár, E. Biosignaturen in Achat/Chalcedon–die Rolle von Mikroorganismen bei der Bildung von SiO2. Mineralienwelt 2011, 22, 90–96. [Google Scholar]
- Götze, J.; Schrön, W.; Möckel, R.; Heide, K. The role of fluids in the formation of agate. Geochemistry 2012, 72, 283–286. [Google Scholar] [CrossRef]
- Götze, J.; Nasdala, L.; Kempe, U.; Libowitzky, E.; Rericha, A.; Vennemann, T. Origin of black colouration in onyx agate from Mali. Mineral. Mag. 2012, 76, 115–127. [Google Scholar] [CrossRef]
- Götze, J.; Gaft, M.; Möckel, R. Uranium and uranyl luminescence in agate/chalcedony. Mineral. Mag. 2015, 79, 983–993. [Google Scholar] [CrossRef]
- Götze, J.; Möckel, R.; Vennemann, T.; Müller, A. Origin and geochemistry of agates from Permian volcanic rocks of the Sub-Erzgebirge basin (Saxony, Germany). Chem. Geol. 2016, 428, 77–91. [Google Scholar] [CrossRef]
- Götze, J.; Möckel, R.; Eulitz, B. “Karbonat-Achat” von Krásný Dvoreček. Mineralienwelt 2018, 4, 82–87. [Google Scholar]
- Götze, J.; Berek, H.; Schäfer, K. Micro-structural phenomena in agate/chalcedony: Spiral growth. Mineral. Mag. 2019, 83, 281–291. [Google Scholar] [CrossRef]
- Moxon, T.; Rios, S. Moganite and water content as a function of age in agate: An XRD and thermogravimetric study. Eur. J. Mineral. 2004, 4, 693–706. [Google Scholar] [CrossRef]
- Petránek, J. Entstehung von gravitations und adhäsionsgebänderten Achaten in Raum und Zeit und in Abhängigkeit vom Klima. Der Aufschluss 2006, 57, 129–150. [Google Scholar]
- Petránek, J. Sedimentäre Achate. Der Aufschluss 2009, 60, 291–302. [Google Scholar]
- Colburn, R.P. The Formation of Thundereggs; Geode Kid Productions: Deming, NM, USA, 2008. [Google Scholar]
- Dumańska-Słowik, M.; Natkaniec-Nowak, L.; Kotarba, M.J.; Sikorska, M.; Rzymełka, J.A.; Łoboda, A.; Gaweł, A. Mineralogical and geochemical characterization of the “bituminous” agates from Nowy Kościół (Lower Silesia, Poland). Neues Jahrbuch für Mineralogie Abhandlungen 2008, 184, 255–268. [Google Scholar]
- Dumańska-Słowik, M.; Natkaniec-Nowak, L.; Weselucha-Birczyńska, A.; Gaweł, A.; Lankosz, M.; Wróbel, P. Agates from Sidi Rahal, in the Atlas Mountains of Morocco: Gemmological characteristics and proposed origin. Gems Gemol. 2013, 49, 148–159. [Google Scholar]
- Dumańska-Słowik, M.; Powolny, T.; Sikorska-Jaworowska, M.; Gaweł, A.; Kogut, L.; Poloński, K. Characteristics and origin of agates from Płóczki Górne (Lower Silesia, Poland): A combined microscopic, micro-Raman, and cathodoluminescence study. Spectrochim. Acta Part. A Mol. Biomol. Spectrosc. 2018, 192, 6–15. [Google Scholar]
- Clark, R. South. Dakota’s State Gemstone—Fairburn Agate; Silverwind Agates: Appleton, CT, USA, 2009; 130p. [Google Scholar]
- Lyashenko, E.A. Agates of Russia. Mineral. Alm. 2010, 15, 6–27. [Google Scholar]
- Götze, J. Agate–Fascination between Legend and Science. In Agates III; Zenz, J., Ed.; Bode-Verlag: Haltern, Germany, 2011; pp. 19–133. [Google Scholar]
- Hurst, J.T. Dryhead Agate; Agate Treasures-Schatzkammerachate Publishing: Boulder, CO, USA, 2012; 90p. [Google Scholar]
- French, M.W.; Worden, R.H.; Lee, D.R. Electron backscatter diffraction investigation of length-fast chalcedony in agate: Implications for agate genesis and growth mechanisms. Geofluids 2013, 13, 32–44. [Google Scholar] [CrossRef]
- Richter, S.; Götze, J.; Niemeyer, H.; Möckel, R. Mineralogical investigation of agates from Cordón de Lila, Chile. J. Andean Geol. 2015, 42, 386–396. [Google Scholar]
- Ottens, B.; Götze, J. Achatwelt China; extralapis 51; Christian Weise Verlag: München, Germany, 2016; 110p. [Google Scholar]
- Natkaniec-Nowak, L.; Dumańska-Słowik, M.; Pršek, J.; Lankosz, M.; Wróbel, P.; Gaweł, A.; Kowalczyk, J.; Kocemba, J. Agates from Kerrouchen (The Atlas Mountains, Morocco). Minerals 2016, 6, 77. [Google Scholar] [CrossRef]
- Powolny, T.; Dumańska-Słowik, M.; Sikorska-Jaworowska, M.; Wójcik-Bania, M. Agate mineralization in spilitized Permian volcanics from “Borówno” quarry (Lower Silesia, Poland)—Microtextural, mineralogical, and geochemical constraints. Ore Geol. Rev. 2019, 114, 103–130. [Google Scholar] [CrossRef]
- Kigai, I.N. The genesis of agates and amethyst geodes. Can. Mineral. 2019, 57, 867–883. [Google Scholar] [CrossRef]
- Howard, C.B.; Rabinovitch, A. A new model of agate geode formation based on a combination of morphological features and silica sol-gel experiments. Eur. J. Mineral. 2017, 30, 97–106. [Google Scholar] [CrossRef]
- Gliozzo, E.; Cairncross, B.; Vennemann, T. A geochemical and micro-textural comparison of basalt-hosted chalcedony from the Jurassic Drakensberg and Neoarchean Ventersdorp Supergroup (Vaal River alluvial gravels), South Africa. Int. J. Earth Sci. 2019, 108, 1857–1877. [Google Scholar] [CrossRef]
- Zhang, X.; Ji, L.; He, X. Gemological characteristics and origin of the Zhanguohong agate from Beipiao, Liaoning province, China: A combined microscopic, X-ray diffraction, and Raman spectroscopic study. Minerals 2020, 10, 401. [Google Scholar] [CrossRef]
- Pršek, J.; Dumańska-Słowik, M.; Powolny, T.; Natkaniec-Nowak, L.; Toboła, T.; Zych, D.; Skrepnicka, D. Agates from Western Atlas (Morocco)—Constraints from mineralogical and microtextural characteristics. Minerals 2020, 10, 198. [Google Scholar] [CrossRef] [Green Version]
- Moxon, T.; Carpenter, M.A. Crystallite growth kinetics in nanocrystalline quartz (agate and chalcedony). Mineral. Mag. 2009, 73, 551–568. [Google Scholar] [CrossRef]
- Walger, E. Das Vorkommen von Uruguay-Achaten bei Flonheim in Rheinhessen, seine tektonische Auswertung und seine Bedeutung für die Frage nach der Achatbildung. Jahresber. Mitt. Oberrh. Geol. Ver. 1954, 36, 20–31. [Google Scholar] [CrossRef]
- Holzhey, G. Herkunft und Akkumulation des SiO2 in Rhyolithkugeln aus Rotliegendvulkaniten des Thüringer Waldes. Geowiss. Mitt. Thüringen 1995, 3, 31–59. [Google Scholar]
- Hopkinson, L.; Roberts, S.; Herrington, R.; Wilkinson, J. Self-organization of submarine hydrothermal siliceous deposits: Evidence from the TAG hydrothermal mound, 26°N Mid-Atlantic Ridge. Geology 1998, 26, 347–350. [Google Scholar] [CrossRef]
- Taut, T.; Kleeberg, R.; Bergmann, J. Seifert software: The new Seifert Rietveld program BGMN and its application to quantitative phase analysis. Mater. Struct. 1998, 5, 57–66. [Google Scholar]
- Neuser, R.D.; Bruhn, F.; Götze, J.; Habermann, D.; Richter, D.K. Kathodolumineszenz: Methodik und Anwendung. Zentralblatt für Geologie und Paläontologie Teil I 1995, 1, 287–306. [Google Scholar]
- Götze, J.; Kempe, U. A comparison of optical microscope (OM) and scanning electron microscope (SEM) based cathodoluminescence (CL) imaging and spectroscopy applied to geosciences. Mineral. Mag. 2008, 72, 909–924. [Google Scholar] [CrossRef]
- Götze, J.; Pan, Y.; Stevens-Kalceff, M.; Kempe, U.; Müller, A. Origin and significance of the yellow cathodoluminescence (CL) of quartz. Am. Mineral. 2015, 100, 1469–1482. [Google Scholar] [CrossRef]
- Möckel, R.; Götze, J.; Sergeev, S.A.; Kapitonov, I.N.; Adamskaya, E.V.; Goltsin, N.A.; Vennemann, T. Trace-element analysis by laser ablation inductively coupled plasma mass spectrometry (LA-ICP-MS): A case study for agates from Nowy Kościoł, Poland. J. Sib. Federal Univ. Eng. Technol. 2009, 2, 123–138. [Google Scholar]
- Flem, B.; Müller, A. In situ analysis of trace elements in quartz using Laser ablation inductively coupled plasma mass spectrometry. In Quartz: Deposits, Mineralogy and Analytics; Götze, J., Möckel, R., Eds.; Springer Geology: Heidelberg, Germany, 2012; pp. 219–236. [Google Scholar]
- Monecke, T.; Bombach, G.; Klemm, W.; Kempe, U.; Götze, J.; Wolf, D. Determination of trace elements in quartz standard UNS-SpS and in natural quartz by ICP-MS. Geostand. Newsl. 2000, 24, 73–81. [Google Scholar] [CrossRef]
- Venneman, T.W.; Morlok, A.; von Engelhardt, W.; Kyser, K. Stable isotope composition of impact glasses from the Nördlinger Ries impact crater, Germany. Geochim. Cosmochim. Acta 2001, 65, 1325–1336. [Google Scholar] [CrossRef]
- Richter-Feig, J.; Möckel, R.; Götze, J.; Heide, G. Investigation of fluids in chalcedony/quartz of agates using Thermogravimetry-Mass-Spectrometry. Minerals 2018, 8, 72. [Google Scholar] [CrossRef] [Green Version]
- Spötl, C.; Vennemann, T.W. Continuous-flow isotope ratio mass spectrometric analysis of carbonate minerals. Rapid Commun. Mass Spectrom. 2003, 17, 1004–1006. [Google Scholar] [CrossRef]
- Moxon, T.; Nelson, D.R.; Zhang, M. Agate recrystallization: Evidence from samples found in Archaean and Proterozoic host rocks, Western Australia. Aust. J. Earth Sci. 2008, 53, 235–248. [Google Scholar] [CrossRef]
- Gilg, H.A.; Morteani, G.; Kostitsyn, Y.; Preinfalk, C.; Gatter, I.; Strieder, A.J. Genesis of amethyst geodes in basaltic rocks of the Serra Geral Formation (Ametista do Sul, Rio Grande do Sul, Brazil): A fluid inclusion, REE, oxygen, carbon, and Sr isotope study on basalt, quartz, and calcite. Miner. Depos. 2003, 38, 1009–1025. [Google Scholar] [CrossRef]
- Gilg, H.A.; Krüger, Y.; Taubald, H.; van den Kerkhof, A.M.; Frenz, M.; Morteani, G. Mineralisation of amethyst-bearing geodes in Ametista do Sul (Brazil) from low-temperature sedimentary brines: Evidence from monophase liquid inclusions and stable isotopes. Miner. Depos. 2014, 49, 861–877. [Google Scholar] [CrossRef]
- Ottens, B.; Götze, J.; Schuster, R.; Krenn, K.; Hauzenberger, C.; Zsolt, B.; Vennemann, T. Exceptional multi-stage mineralization of secondary minerals in cavities of flood basalts from the Deccan Volcanic Province, India. Minerals 2019, 1019, 351. [Google Scholar] [CrossRef] [Green Version]
- Lund, E.H. Chalcedony and quartz crystals in silicified coral. Am. Mineral. 1960, 45, 1304–1307. [Google Scholar]
- Rössler, R. Der Versteinerte Wald Von Chemnitz; Museum für Naturkunde Chemnitz: Chemnitz, Germany, 2001; 252p. [Google Scholar]
- Rich, P.V.; Rich, T.H.; Fenton, M.A.; Fenton, C.L. The Fossil Book—A Record of Prehistoric Life; Dover Publications: Mineola, NY, USA, 2020; 740p. [Google Scholar]
- Graetsch, H. Structural characteristics of opaline and microcrystalline silica minerals. Silica Rev. Mineral. 1994, 29, 209–232. [Google Scholar]
- Brewster, D. Über die Ursachen der Farben des irisierenden Achats. Ann. Phys. und Chem. 1844, 137, 134–138. [Google Scholar] [CrossRef] [Green Version]
- Braitsch, O. Über die natürlichen Faser- und Aggregationstypen beim SiO2, ihre Verwachsungsformen, Richtungsstatistik und Doppelbrechung. Heidelb. Beiträge Mineral. Petrogr. 1957, 5, 331–372. [Google Scholar]
- Lange, P.; Blankenburg, H.-J.; Schrön, W. Rasterelektronenmikroskopische Untersuchungen an Vulkanitachaten. Z. Geol. Wiss. 1984, 12, 667–681. [Google Scholar]
- Miehe, G.; Graetsch, H.; Flörke, O.W. Crystal structure and growth fabric of length-fast chalcedony. Phys. Chem. Miner. 1984, 10, 197–199. [Google Scholar] [CrossRef]
- Folk, R.L.; Pittman, J.S. Length-slow chalcedony; A new testament for vanished evaporates. J. Sediment. Petrol. 1971, 41, 1045–1058. [Google Scholar]
- Flörke, O.W.; Jones, J.B.; Schmincke, H.-U. A new microcrystalline silica from Gran Canaria. Z. Krist. 1976, 143, 156–165. [Google Scholar] [CrossRef]
- Heaney, P.J.; Post, J.E. The widespread distribution of a novel silica polymorph in microcrystalline quartz varieties. Science 1992, 255, 441–443. [Google Scholar] [CrossRef]
- Heaney, P.J.; Veblen, D.R.; Post, J.E. Structural disparities between chalcedony and macrocrystalline quartz. Am. Mineral. 1994, 79, 452–460. [Google Scholar]
- Kingma, K.J.; Hemley, R.J. Raman spectroscopic study of microcrystalline silica. Am. Mineral. 1994, 79, 269–273. [Google Scholar]
- Nasdala, L.; Götze, J.; Gaft, M.; Hanchar, J.; Krbetschek, M. Luminescence techniques in Earth Sciences. In EMU Notes in Mineralogy; Beran, A., Libowitzky, E., Eds.; Eötvös University Press: Budapest, Hungary, 2004; Volume 6, pp. 1–49. [Google Scholar]
- Correns, C.W.; Nagelschmidt, G. Über Faserbau und optische Eigenschaften von Chalcedon. Z. für Krist. A 1933, 85, 199–213. [Google Scholar]
- Hoffmann, S. Untersuchungen über den Opalgehalt der Achate; Schweizerbart: Stuttgart, Germany, 1942; pp. 238–276. [Google Scholar]
- Flörke, O.W. Untersuchungen an amorphem und mikrokristallinem SiO2. Chem. der Erde 1962, 22, 91–110. [Google Scholar]
- Jones, B.; Renaut, R.W. Microstructural changes accompanying the opal-A to opal-CT transition: New evidence from the siliceous sinters of Geysir, Haukadalur, Iceland. Sedimentology 2007, 54, 921–948. [Google Scholar] [CrossRef]
- Moxon, T.; Reed, S.J.B. Agate and chalcedony from igneous and sedimentary hosts aged from 13 to 3480 Ma: A cathodoluminescence study. Mineral. Mag. 2006, 70, 485–498. [Google Scholar] [CrossRef]
- Moxon, T.; Reed, S.J.B.; Zhang, M. Metamorphic effects on agate found near the Shap granite, Cumbria, England: As demonstrated by petrography, X-ray diffraction and spectroscopic methods. Mineral. Mag. 2007, 71, 461–476. [Google Scholar] [CrossRef]
- Iler, R.K. The Chemistry of Silica: Solubility, Polymerization, Colloid and Surface Properties and Biochemistry; John Wiley & Sons: New York, NY, USA, 1979; p. 866. [Google Scholar]
- Holzhey, G. Mikrokristalline SiO2-Mineralisationen in rhyolithischen Rotliegendvulkaniten des Thüringer Waldes (Deutschland) und ihre Genese. Chem. der Erde 1999, 59, 183–205. [Google Scholar]
- Tennyson, C. “Struktur” und Farbenspiel des Edelopals. Lapis 1979, 4, 13–15. [Google Scholar]
- Dong, G.; Morrison, G.; Jaireth, S. Quartz textures in epithermal veins, Queensland—Classification, origin, and implication. Econ. Geol. 1995, 90, 1841–1856. [Google Scholar] [CrossRef]
- Weil, J.A. A review of electron spin spectroscopy and its application to the study of paramagnetic defects in crystalline quartz. Phys. Chem. Miner. 1984, 10, 149–165. [Google Scholar] [CrossRef]
- Weil, J.A. A review of the EPR spectroscopy of the point defects in α-quartz: The decade 1982–1992. In Physics and Chemistry of SiO2 and the Si-SiO Interface 2; Helms, C.R., Deal, B.E., Eds.; Plenum Press: New York, NY, USA, 1993; pp. 131–144. [Google Scholar]
- Stevens-Kalceff, M.A. Cathodoluminescence microcharacterization of point defects in a-quartz. Mineral. Mag. 2009, 73, 585–606. [Google Scholar] [CrossRef]
- Götze, J. Chemistry, textures and physical properties of quartz—Geological interpretation and technical application. Mineral. Mag. 2009, 73, 645–671. [Google Scholar] [CrossRef]
- Götze, J.; Plötze, M.; Fuchs, H.; Habermann, D. Defect structure and luminescence behaviour of agate—Results of electron paramagnetic resonance (EPR) and cathodoluminescence (CL) studies. Mineral. Mag. 1999, 63, 149–163. [Google Scholar] [CrossRef]
- Mashkovtsev, R.I.; Li, Z.; Mao, M.; Pan, Y. 73Ge, 17O and 29Si hyperfine interactions of the Ge E′1 center in crystalline SiO2. J. Magn. Reson. 2013, 233, 7–16. [Google Scholar] [CrossRef]
- SivaRamaiah, G.; Lin, J.R.; Pan, Y. Electron paramagnetic resonance spectroscopy of Fe3+ ions in amethyst: Thermodynamic potentials and magnetic susceptibility. Phys. Chem. Miner. 2011, 38, 159–167. [Google Scholar] [CrossRef]
- Pan, Y.; Hu, B. Radiation-induced defects in quartz. IV. Thermal properties and implications. Phys. Chem. Miner. 2009, 36, 421–430. [Google Scholar] [CrossRef]
- Botis, S.; Nokhrin, S.M.; Pan, Y.; Xu, Y.; Bonli, T. Natural radiation-induced damage in quartz. I. Correlations between cathodoluminescence colors and paramagnetic defects. Can. Mineral. 2005, 43, 1565–1580. [Google Scholar] [CrossRef] [Green Version]
- Nilges, M.J.; Pan, Y.; Mashkovtsev, R.I. Radiation-induced defects in quartz. I. Single-crystal W-band EPR study of an electron irradiated quartz. Phys. Chem. Miner. 2008, 35, 103–115. [Google Scholar] [CrossRef]
- Nilges, M.J.; Pan, Y.; Mashkovtsev, R.I. Radiation-induced defects in quartz. III. EPR, ENDOR and ESEEM characterization of a peroxy radical. Phys. Chem. Miner. 2009, 36, 63–71. [Google Scholar] [CrossRef]
- Pan, Y.; Nilges, M.J.; Mashkovtsev, R.I. Radiation-induced defects in quartz. II. W-band single-crystal EPR study of natural citrine. Phys. Chem. Miner. 2008, 35, 387–397. [Google Scholar] [CrossRef]
- Pan, Y.; Nilges, M.J.; Mashkovtsev, R.I. Multifrequency single-crystal EPR characterization and DFT modeling of new peroxy radicals in quartz. Mineral. Mag. 2009, 73, 517–535. [Google Scholar] [CrossRef]
- Walsby, C.J.; Lees, N.S.; Claridge, R.F.C.; Weil, J.A. The magnetic properties of oxygen-hole aluminum centres in crystalline SiO2. VI: A stable AlO4/Li centre. Can. J. Phys. 2003, 81, 583–598. [Google Scholar] [CrossRef]
- Götze, J. Application of cathodoluminescence (CL) microscopy and spectroscopy in geosciences. Microsc. Microanal. 2012, 18, 1270–1284. [Google Scholar] [CrossRef] [Green Version]
- Götze, J.; Plötze, M.; Habermann, D. Cathodoluminescence (CL) of quartz: Origin, spectral characteristics and practical applications. Mineral. Petrol. 2001, 71, 225–250. [Google Scholar] [CrossRef]
- Götze, J.; Hanchar, J. Atlas of Cathodoluminescence (CL) Microtextures; GAC Miscellaneous Publication No. 10; Geological Association of Canada: St. John’s, NL, Canada, 2018; 248p.
- Ramseyer, K.; Baumann, J.; Matter, A.; Mullis, J. Cathodoluminescence colours of alpha-quartz. Mineral. Mag. 1988, 52, 669–677. [Google Scholar] [CrossRef]
- Siegel, G.H.; Marrone, M.J. Photoluminescence in as-drawn and irradiated silica optical fibers: An assessment of the role of non-bridging oxygen defect centres. J. Non-Cryst. Solids 1981, 45, 235–247. [Google Scholar] [CrossRef]
- Alonso, P.J.; Halliburton, L.E.; Kohnke, E.E.; Bossoli, R.B. X-ray induced luminescence in crystalline SiO2. J. Appl. Phys. 1983, 54, 5369–5375. [Google Scholar] [CrossRef]
- Luff, B.J.; Townsend, P.D. Cathodoluminescence of synthetic quartz. J. Phys. Condens. Matter 1990, 2, 8089–8097. [Google Scholar] [CrossRef]
- Perny, B.; Eberhardt, P.; Ramseyer, K.; Mullis, J. Microdistribution of aluminium, lithium and sodium in quartz: Possible causes and correlation with short-lived cathodoluminescence. Am. Mineral. 1992, 77, 534–544. [Google Scholar]
- Götze, J.; Plötze, M.; Graupner, T.; Hallbauer, D.K.; Bray, C. Trace element incorporation into quartz: A combined study by ICP-MS, electron spin resonance, cathodoluminescence, capillary ion analysis and gas chromatography. Geochim. Cosmochim. Acta 2004, 68, 3741–3759. [Google Scholar] [CrossRef]
- Blankenburg, H.-J.; Schrön, W. Zum Spurenelementchemismus der Vulkanitachate. Chem. Erde 1982, 41, 121–135. [Google Scholar]
- Mason, B. Cosmochemistry, Part. I. Meteorites. In Data of Geochemistry; Fleischer, M., Ed.; U.S. Geological Survey Professional Paper: Reston, VA, USA, 1979. [Google Scholar]
- Walenzak, Z. Geochemistry of minor elements dispersed in quartz (Ge, Al, Ga, Fe, Ti, Li and Be). Arch. Mineral. 1969, 28, 189–335. [Google Scholar]
- Konstatinov, W.M. Uranium bearing lithophysae in acidic extrusive rocks. Izvestiya Akademii Nauk SSSR Seria Geologika 1968, 7, 43–49. (In Russian) [Google Scholar]
- Zielinski, R.A. Uranium mobility during interaction of rhyolitic obsidian, perlite and felsite with alkaline carbonate solution: T = 120 °C, P = 210 kg/cm2. Chem. Geol. 1979, 27, 47–63. [Google Scholar] [CrossRef]
- Pan, Y.; Li, D.; Feng, R.; Wiens, E.; Chen, N.; Götze, J.; Lin, J. Uranyl binding mechanism in microcrystalline silicas: A potential missing link for uranium mineralization by direct uranyl co-precipitation and environmental implications. Geochim. Cosmochim. Acta 2021, 292, 518–531. [Google Scholar] [CrossRef]
- Peppard, D.F.; Mason, G.W.; Lewey, S. A tetrad effect in the liquid–liquid extraction ordering of lanthanide(III). J. Inorg. Nucl. Chem. 1969, 31, 2271–2272. [Google Scholar] [CrossRef]
- Monecke, T.; Dulski, P.; Kempe, U. Origin of convex tetrads in rare earth element patterns of hydrothermally altered siliceous igneous rocks from the Zinnwald Sn–W deposit, Germany. Geochem. Cosmochim. Acta 2007, 71, 335–353. [Google Scholar] [CrossRef]
- Wood, S.A. The aqueous geochemistry of the rare-earth elements and yttrium. 2. Theoretical predictions of speciation in hydrothermal solutions to 350 °C at saturation water vapor pressure. Chem. Geol. 1990, 88, 99–125. [Google Scholar] [CrossRef]
- Kempe, U.; Götze, J.; Belyatsky, B.V.; Plötze, M. Ce anomalies in monazite, fluorite and agate from Permian volcanics of the Saxothuringian (Germany). J. Czech. Geol. Soc. 1998, 42, 38. [Google Scholar]
- Barsanov, G.P.; Plyusnina, I.I.; Jakovleva, M.E. Specific features of the chemical composition, physical properties and the structure of chalcedony. In New Data of Minerals; Nauka: Moscow, Russia, 1981; Volume 28, pp. 3–33. (In Russian) [Google Scholar]
- Hoefs, J. Stable Isotope Geochemistry, 4th ed.; Springer: Heidelberg, Germany, 1997; 201p. [Google Scholar]
- Ingerson, E.; Weshow, R.L. Oxygen isotope fractionation in the system quartz–water. Geochem. Int. 1965, 2, 691–707. [Google Scholar]
- Matsuhisa, Y.; Goldsmith, J.R.; Clayton, R.N. Oxygen isotopic fractionation in the system quarz-albite–anorthite-water. Geochim. Cosmochim. Acta 1979, 43, 1131–1140. [Google Scholar] [CrossRef]
- Harris, C. Oxygen-isotope zonation of agates from Karoo volcanics of the Skeleton Coast, Namibia. Am. Mineral. 1989, 74, 476–481. [Google Scholar]
- Strauch, G.; Nitzsche, H.-M.; Holzhey, G. Isotopenuntersuchungen an Rhyolithen und Achatbildungen. Neues Jahrb. für Mineral. Abh. 1994, 165, 103–104. [Google Scholar]
- Blankenburg, H.J.; Pilot, J.; Werner, C.D. Erste Ergebnisse der Sauerstoffisotopenuntersuchungen an Vulkanitachaten und ihre genetische Interpretation. Chem. der Erde 1982, 41, 213–217. [Google Scholar]
- Harris, C. Oxygen isotope geochemistry of a quartz-agate geode from north-western Namibia. Commun. Geol. Surv. S.W. Afr. Namib. 1988, 4, 43–44. [Google Scholar]
- Holzhey, G. Contribution to petrochemical-mineralogical characterization of alteration processes within the marginal facies of rhyolitic volcanics of lower Permian Age, Thuringian Forest, Germany. Chem. Erde 2001, 61, 149–186. [Google Scholar]
- Fallick, A.E.; Jocely, J.; Hamilton, P.J. Oxygen and hydrogen stable isotope systematics in Brazilian agates. In Geochemistry and Mineral Formation in the Earth Surface; Rodriguez-Clemente, R., Tardy, Y., Eds.; Editorial CSIC: Madrid, Spain, 1987; pp. 99–117. [Google Scholar]
- Duarte, L.C.; Hartmann, L.A.; Ronchi, L.H.; Berner, Z.; Theye, T.; Massonne, H.J. Stable isotope and mineralogical investigation of the genesis of amethyst geodes in the Los Catalanes gemological district, Uruguay, southernmost Paraná volcanic province. Miner. Depos. 2011, 46, 239–255. [Google Scholar] [CrossRef]
- Rezaei-Kahkhaei, M.; Ansarifar, O.; Ghasemi, H. Geochemistry and oxygen stable isotopes of Reza Abad agates, SE Shahrood, Central Iran: An approach to temperature and formation process. J. Econ. Geol. 2019, 11, 3. [Google Scholar]
- Kita, I.; Taguchi, S. Oxygen isotopic behaviour of precipitating silica from geothermal water. Geochem. J. 1986, 20, 153–157. [Google Scholar] [CrossRef] [Green Version]
- Blankenburg, H.-J.; Thomas, R.; Klemm, W.; Leeder, O. Interpretation der Ergebnisse von Einschlußunersuchungen an den Quarzinkrustaten aus Vulkanitachaten. Z. Geol. Wiss. 1990, 18, 81–85. [Google Scholar]
- Frondel, C. Structural hydroxyl in chalcedony (Type B quartz). Am. Mineral. 1982, 67, 1248–1257. [Google Scholar]
- Graetsch, H.; Flörke, O.W.; Miehe, G. The nature of water in chalcedony and opal-C from Brazilian agate geodes. Phys. Chem. Miner. 1985, 12, 300–306. [Google Scholar] [CrossRef]
- Thomas, R.; Blankenburg, H.-J. Erste Ergebnisse über Einschlussuntersuchungen an Quarzen aus Achatmandeln und –kugeln basischer und saurer Vulkanite. Z. Geol. Wiss. 1981, 9, 625–633. [Google Scholar]
- Commin-Fischer, A.; Berger, G.; Polvė, M.; Dubois, M.; Sardini, P.; Beaufort, D.; Formoso, M. Petrography and chemistry of SiO2 filling phases in the amethyst geodes from the Serra Geral Formation deposit, Rio Grande do Sul, Brazil. J. South. Am. Earth Sci. 2010, 29, 751–760. [Google Scholar] [CrossRef]
- Ramboz, C.; Pichavant, M.; Weisbrod, A. Fluid immiscibility in natural processes: Use and misuse of fluid inclusion data. Chem. Geol. 1982, 37, 29–48. [Google Scholar] [CrossRef]
- Roedder, E. Fluid Inclusions; Reviews in Mineralogy 12; Mineralogical Society of America: Reston, VA, USA, 1984; 645p. [Google Scholar]
- Hall, D.L.; Sterner, S.M.; Bodnar, R.J. Freezing point depression of NaCl–KCl–H2O solutions. Econ. Geol. 1988, 83, 197–202. [Google Scholar] [CrossRef]
- Tripp, R.B. The mineralogy of Warsaw Formation geodes. Iowa Acad. Sci. Proc. 1959, 66, 350–356. [Google Scholar]
- Hayes, J.B. Geodes and concretions from the Mississippian Warsaw Formation. Keokuk region, Iowa, Illinois, Missouri. Sediment. Petrol. 1964, 34, 123–133. [Google Scholar]
- Holzhey, G. Die Paragenese von Mineralen in Rhyolithkugeln (Lithophysen) aus Rotliegendvulkaniten des Thüringer Waldes. Semana 2016, 31, 25–50. [Google Scholar]
- Schmitt-Riegraf, C. Magmenentwicklung und spät- bis post-magmatische Alterationsprozesse permischer Vulkanite im Nordwesten der Nahe-Mulde. Münstersche Forsch. zur Geol. und Paläontologie 1996, 80, 1–251. [Google Scholar]
- Walger, E. Zur Entstehung des Calcitachates. Fortschr. Mineral. 1961, 39, 360. [Google Scholar]
- Landmesser, M. Calcitachat: Zur Deutung eines verblüffenden mineralogischen Phänomens. Mainz. Nat. Arch. 1996, 34, 9–43. [Google Scholar]
- Blankenburg, H.-J.; Unterricker, S.; Eichler, B.; Starke, R.; Stolz, W.; Rösler, H.J. Natürliche Radioaktivität, chemische und Phasenzusammensetzung der Eisenoxide aus Vulkanitachaten. Chem. Erde 1986, 45, 159–166. [Google Scholar]
- Rosemeyer, T. Copper-banded agates from the Kearsarge copper-bearing amygdaloidal lode Houghton county, Michigan. Rocks Miner. 2012, 87, 352–365. [Google Scholar] [CrossRef]
- Moxon, T. Agate in thin section. Rocks Miner. 2014, 89, 328–339. [Google Scholar] [CrossRef]
- Breitkreuz, C. Spherulites and lithophysae—200 years of investigation on hightemperature crystallization domains in silica-rich volcanic rocks. Bull. Volcanol. 2013, 75, 705–720. [Google Scholar] [CrossRef]
- Sakka, S.; MacKenzie, J.D. Relationship between apparent glass transition temperature and liquidus temperature for inorganic glasses. J. Non-Cryst. Solids 1971, 6, 145–162. [Google Scholar] [CrossRef]
- Lofgren, G. Spherulitic textures in glassy and crystalline rocks. J. Geophys. Res. 1971, 76, 5635–5648. [Google Scholar] [CrossRef]
- Breitkreuz, C.; Götze, J.; Weißmantel, A. Mineralogical and geochemical investigation of megaspherulites from Argentina, Germany and USA. Bull. Volcanol. 2020. accepted for publication. [Google Scholar]
- Herrington, R.J.; Wilkinson, J.J. Colloidal gold and silica in mesothermal vein systems. Geology 1993, 21, 539–542. [Google Scholar] [CrossRef]
- Jebrag, M. Hydrothermal breccias in vein-type ore deposits: A review of mechanisms, morphology and size distribution. Ore Geol. Rev. 1997, 12, 111–134. [Google Scholar] [CrossRef]
- Haake, R.; Fischer, J.; Reißmann, R. Über das Achat-Amethyst-Vorkommen von Schlottwitz im Osterzgebirge. Mineralienwelt 1991, 2, 20–24. [Google Scholar]
- Chowns, T.M.; Elkins, J.E. The origin of quartz geodes and cauliflower cherts through the silification of anhydrite nodules. J. Sediment. Petrol. 1974, 44, 885–903. [Google Scholar]
- Tucker, M.E. Quartz replaced anhydrite nodules (“Bristol diamonds”) from the Triassic of the Bristol District. Geol. Mag. 1976, 113, 569–574. [Google Scholar] [CrossRef]
- Jacka, A.D. Replacement of fossils by length-slow chalcedony and associated dolomitization. J. Sediment. Petrol. 1974, 44, 421–427. [Google Scholar]
- Landmesser, M. Zur Entstehung von Kieselhölzern. ExtraLapis 1994, 7, 49–80. [Google Scholar]
- Milliken, K.L. The silicified evaporate syndrome: Two aspects of silicification history of former evaporate nodules from Southern Kentucky and Northern Tennessee. J. Sediment. Petrol. 1979, 49, 245–256. [Google Scholar]
- Shaub, B.M. The Origin of Agates, Thundereggs, and Other Nodular Structures; Agate Publishing Company: Northampton, MA, USA, 1989; 105p. [Google Scholar]
- Landmesser, M. Zur Geothermometrie und Theorie der Achate. Mitt. Pollichia 1992, 79, 159–201. [Google Scholar]
- Harder, H. Agates-formation as a multi component colloid chemical precipitation at low temperatures. Neues Jahrb. Mineral. Mon. 1993, H.1, 31–48. [Google Scholar]
- Williamson, B.J.; Wilkinson, J.J.; Luckham, P.F.; Stanley, C.J. Formation of coagulated colloidal silica in high-temperature mineralizing fluids. Mineral. Mag. 2002, 66, 547–553. [Google Scholar] [CrossRef]
- White, J.F.; Corwin, J.F. Synthesis and origin of chalcedony. Am. Mineral. 1961, 46, 112–119. [Google Scholar]
- Flörke, O.W. Transport and deposition of SiO2 with H2O under supercritical conditions. Krist. Tech. 1972, 7, 159–166. [Google Scholar] [CrossRef]
- Oehler, J.H. Hydrothermal crystallization of silica gel. Geol. Soc. America Bull. 1976, 87, 1143–1152. [Google Scholar] [CrossRef]
- Götze, J.; Plötze, M.; Tichomirowa, M.; Fuchs, H.; Pilot, J. Aluminium in quartz as an indicator of the temperature of formation of agate. Mineral. Mag. 2001, 65, 407–413. [Google Scholar] [CrossRef]
- Dennen, W.H.; Blackburn, W.H.; Quesada, A. Aluminum in quartz as a geothermometer. Contrib. Mineral. Petrol. 1970, 27, 332–342. [Google Scholar] [CrossRef]
- Agel, A.; Petrov, I. Im Quarzgitter substituiertes Aluminium als Indikator für dessen Bildungstemperatur. Eur. J. Miner. 1990, 2, 144. [Google Scholar]
- Correns, C.W. The experimental weathering of silicates. Clay Miner. Bull. 1961, 4, 249–265. [Google Scholar] [CrossRef]
- Wirsching, U. Experimente zum Einfluß des Gesteinsglas-Chemismus auf die Zeolithbildung durch hydrothermale Umwandlung. Contrib. Mineral. Petrol. 1975, 49, 117–124. [Google Scholar] [CrossRef]
- Seyfried, W.E.; Bischo, J.L. Low temperature basalt alteration by seawater: An experimental study at 70 °C and 150 °C. Geochim. Cosmochim. Acta 1979, 43, 1937–1947. [Google Scholar] [CrossRef]
- Giggenbach, W.F. Mass transfer in hydrothermal alteration systems—A conceptual approach. Geochim. Cosmochim. Acta 1984, 48, 2693–2711. [Google Scholar] [CrossRef]
- Duplay, J.; Paquet, H.; Kossovskaya, A.; Tard, Y. Estimation de la température de formation des paragenèses saponite-céladonite et glauconite-nontronite dans les altérations sous-marines de basalte, par la méthode des corrélations entre éléments au sein de populations monominérales. CR Acad. Sci. Paris 1989, 309, 53–58. [Google Scholar]
- Klammer, D. Mass change during extreme acid-sulphate hydrothermal alteration of a Tertiary latite, Styria, Austria. Chem. Geol. 1997, 141, 33–48. [Google Scholar] [CrossRef]
- Polgári, M.; Hein, J.R.; Németh, T.; Pál-Molnár, E.; Vigh, T. Celadonite and smectite formation in the Úrkút Mn-carbonate ore deposit (Hungary). Sediment. Geol. 2013, 294, 157–163. [Google Scholar] [CrossRef] [Green Version]
- Götze, J.; Hofmann, B.; Machałowski, T.; Tsurkan, M.V.; Jesionowski, T.; Ehrlich, H.; Kleeberg, R.; Ottens, B. Biosignatures in subsurface filamentous fabrics (SFF) from the Deccan Volcanic Province, India. Minerals 2020, 10, 540. [Google Scholar] [CrossRef]
- Sukheswala, R.N.; Avasia, R.K.; Gangopadhyay, M. Zeolites and associated secondary minerals in the Deccan Traps of western India. Mineral. Mag. 1974, 39, 658–671. [Google Scholar] [CrossRef] [Green Version]
- Mattioli, M.; Cenni, M.; Passaglia, E. Secondary mineral assemblages as indicators of multistage alteration processes in basaltic lava flows: Evidence from the Lessini Mountains, Veneto Volcanic Province, Northern Italy. Period. Di Mineral. 2016, 85, 1–24. [Google Scholar]
- Kryza, R. Bilans chemiczny dla stref mineralizacji agatowej w wulkanitach rejonu Nowego Kośioła (Góry Kaczawskie). Arch. Mineral. 1983, 39, 125–132. [Google Scholar]
- Krauskopf, K.B. Dissolution and precipitation of silica at low temperatures. Geochim. Cosmochim. Acta 1956, 10, 1–26. [Google Scholar] [CrossRef]
- Landmesser, M. Mobility by metastability: Silica transport and accumulation at low temperatures. Chem. Erde 1995, 55, 149–176. [Google Scholar]
- Dietzel, M. Dissolution of silicates and the stability of polysilicic acid. Geochim. Et Cosmochim. Acta 2000, 64, 3275–3281. [Google Scholar] [CrossRef]
- Gránásy, L.; Pusztai, T.; Tegze, G.; Warren, J.A.; Douglas, J.F. Growth and form of spherulites. Phys. Rev. 2005, 72, 11605–11619. [Google Scholar] [CrossRef] [Green Version]
- Krug, H.-J.; Jacob, K.-H. Genese und Fragmentierung rhytmischer Bänderungen durch Selbstorganisation. Z. Dtsch. Geol. Ges. 1994, 144, 452–460. [Google Scholar]
- Bryxina, N.A.; Sheplev, V.S. Auto-oscillation in agate crystallization. Math. Geol. 1999, 31, 297–309. [Google Scholar] [CrossRef]
- Wang, Y.; Merino, E. Self-organizational origin of agates: Banding, fiber twisting, composition, and dynamic crystallizationmodel. Geochim. Cosmochim. Acta 1990, 54, 1627–1638. [Google Scholar] [CrossRef]
- Götze, J.; Stanek, K.; Orozco, G. Auf Achatsuche in Kuba. Mineralienwelt 2020, 3, 56–63. [Google Scholar]
- Goldbaum, J.; Howard, C.; Rabinovitch, A. Spatial Chirp of agate bands. Minerals 2019, 9, 634. [Google Scholar] [CrossRef] [Green Version]
- Mikhailov, A.S.; Showalter, K. Control of waves, patterns and turbulence in chemical systems. Phys. Rep. 2006, 425, 79–194. [Google Scholar] [CrossRef]
- Kumar, D.K.; Steed, J.W. Supramolecular gel phase crystallisation: Orthogonal self-assembly under non-equilibrium conditions. Chem. Soc. Revs. 2014, 43, 2080–2088. [Google Scholar] [CrossRef] [Green Version]
- Papineau, D. Chemically oscillation reactions in the formation of botryoidal malachite. Am. Mineral. 2020, 105, 447–454. [Google Scholar] [CrossRef]
- Walger, E.; Mattheß, G.; Von Seckendorff, V.; Liebau, F. The formation of agate structures: Models for silica transport, agate layer accretion, and for flow patterns and flow regimes in infiltration channels. Neues Jahrb. Mineral. Abh. 2009, 186, 113–152. [Google Scholar] [CrossRef]
- Laurs, B.M.; Rossman, G.R. Grape-like “Manakarra” quartz from Sulawesi, Indonesia. J. Gemmol. 2018, 36, 101–102. [Google Scholar]
- Hofmann, B.A. Subsurface filamentous fabrics. In Encyclopedia of Geobiology; Reitner, J., Thiel, V., Eds.; Springer: Berlin/Heidelberg, Germany, 2011; pp. 851–853. [Google Scholar]
- Thewalt, U.; Dörfner, G. Wie kommt das Moos in den Achat und wie nicht? Der Aufschluss 2012, 63, 1–16. [Google Scholar]
- Reysenbach, A.-L.; Cady, S.L. Microbiology of ancient and modern hydrothermal systems. Trends Microbiol. 2001, 9, 79–86. [Google Scholar] [CrossRef]
- Jones, B.; Renault, R.W. Influence of thermophilic bacteria on calcite and silica precipitation in hot springs with water temperatures above 90 °C: Evidence from Kenya and New Zealand. Can. J. Earth Sci. 1996, 33, 72–83. [Google Scholar] [CrossRef]
- Konhauser, K.O.; Phoenix, V.R.; Bottrell, S.H.; Adams, D.G.; Head, I.M. Microbial-silica interaction in Icelandic hot spring sinter: Possible analogues for some Precambrian siliceous stromatolites. Sedimentology 2001, 48, 415–433. [Google Scholar] [CrossRef]
- Ferris, F.G.; Beveridge, T.J.; Fyfe, W.S. Iron-silica crystallite nucleation by bacteria in a geothermal sediment. Nature 1986, 320, 609–611. [Google Scholar] [CrossRef]
- Parenteau, M.N.; Cady, S.L. Microbial biosignatures in iron-mineralized phototrophic mats at Chocolate Pots Hot Springs, Yellowstone National Park, United States. PALAIOS 2010, 25, 97–111. [Google Scholar] [CrossRef]
- Müller, A.; Polgári, M.; Gucsik, A.; Pál-Molnár, E.; Koós, M.; Veres, M.; Götze, J.; Nagy, S.; Cserháti, C.; Németh, T.; et al. Cathodoluminescent features and Raman spectroscopy of Miocene hydrothermal biomineralization embedded in cryptocrystalline silica varieties, Central Europe, Hungary. In Micro-Raman Spectroscopy and Luminescence Studies in the Earth and Planetary Sciences; Gucsik, A., Ed.; American Institute of Physics: Houston, TX, USA, 2009; pp. 207–218. [Google Scholar]
- Yang, H.; Coombs, N.; Ozin, G.A. Morphogenesis of shapes and surface patterns in mesoporous silica. Nature 1997, 386, 692–695. [Google Scholar] [CrossRef]
- Glaab, F.; Kellermeier, M.; Kunz, W.; Morallon, E.; Garcia-Ruiz, J.M. Formation and evolution of chemical gradients and potential differences across self-assembling inorganic membranes. Angew. Chem. 2012, 124, 4393–4397. [Google Scholar] [CrossRef]
- Moxon, T.; Petrone, C.M.; Reed, S.J.B. Characterization and genesis of horizontal banding in Brazilian agate: An X-ray diffraction, thermogravimetric and electron microprobe study. Mineral. Mag. 2013, 77, 227–248. [Google Scholar] [CrossRef] [Green Version]
- Haudin, F.; Cartwright, J.H.E.; Braua, F.; De Wit, A. Spiral precipitation patterns in confined chemical gardens. Proc. Natl. Acad. Sci. USA 2014, 111, 17363–17367. [Google Scholar] [CrossRef] [Green Version]
- Noorduin, W.L.; Grinthal, A.; Mahadevan, L.; Aizenberg, J. Rationally designed complex, hierarchical microarchitectures. Science 2013, 340, 832–837. [Google Scholar] [CrossRef] [Green Version]
- Kellermeier, M.; Cölfen, H.; García-Ruiz, J.M. Silica Biomorphs: Complex biomimetic hybrid materials from “sand and chalk”. Eur. J. Inorg. Chem. 2012, 32, 5123–5144. [Google Scholar] [CrossRef]
- Dominguez-Bella, S.; Garcia-Ruiz, J.M. Textures in induced morphology crystal aggregates of CaCO3: Sheaf of wheat morphologies. J. Cryst. Growth 1986, 79, 236–240. [Google Scholar] [CrossRef]
- Lenz, G.; Schäfer, K. Spiralen im Achat—Ein biologisches oder ein mineralogisches Phänomen? Lapis 2008, 1, 21–24. [Google Scholar]
Figure 1.
Streckeisen diagram showing the field (red) of agate-bearing volcanic rocks.

Figure 2.
Compilation showing the different main agate types; (a) lithophysa (thunderegg) within the flow texture of the rhyolitic host rock from Nesselhof, Thuringia (Germany); (b) large thunderegg with agate from rhyolitic ignimbrite of St. Egidien (Saxony, Germany); (c) andesitic host-rock with both empty and agate-filled vesicles at the Rancho Coyamito (Chihuahua, Mexico); (d) finely banded agate from a trachyandesitic host-rock of Xuanhua (Hebei province, China); (e) hydrothermal vein agate in metamorphic host rocks (gneisses) from Röthenbach (Saxony, Germany); (f) sedimentary banded microcrystalline granular quartz from a clay seam in carbonate host-rocks from Dulcote (Mendip, UK); (g) clastic agate pebble from river sediments of the Yangtze river near Nanjing (Jiangsu province, China); Scale bar is 5 cm.

Figure 3.
(a) Micrograph of an agate from Schlottwitz, Germany in transmitted light (crossed polars) showing chalcedony “fibers” with the characteristic “Runzelbänderung” caused by twisting of the optical axis of the quartz crystallites oriented with their c-axes perpendicular to the “fiber” axis; the inset schematically shows the formation of chalcedony “fibers”; (b) SEM micrograph of the same area revealing numerous quartz microcrystals <1 µm in size.

Figure 4.
Agate from Xuanhua (Hebei province, China) in transmitted light (crossed polars) (a) and with λ compensator (b) showing alternating bands of fibrous chalcedony (blue) and quartzine (yellow).
Figure 4.
Agate from Xuanhua (Hebei province, China) in transmitted light (crossed polars) (a) and with λ compensator (b) showing alternating bands of fibrous chalcedony (blue) and quartzine (yellow).

Figure 5.
(a) SEM migrographs of spherical opal-CT aggregates within a chalcedony matrix in an agate from El Picado, Cuba; (b) close-up of (a) showing lepispheres of opal-CT consisting of radially arranged crystal blades.
Figure 5.
(a) SEM migrographs of spherical opal-CT aggregates within a chalcedony matrix in an agate from El Picado, Cuba; (b) close-up of (a) showing lepispheres of opal-CT consisting of radially arranged crystal blades.

Figure 6.
(a) Raman spectra of α-quartz (dotted line) and moganite-bearing chalcedony showing the characteristic peaks at 464 cm−1 and 502 cm−1, respectively; (b) Raman mapping revealing the moganite distribution in an agate from St. Egidien (Saxony, Germany) based on the intensity ratio of the two characteristic Raman bands (modified after Nasdala et al. [92]—courtesy Lutz Nasdala).

Figure 7.
Examples for different types of banding in agates; (a) wall-lining (“fortification”) agate from Ojo Laguna (Chihuahua, Mexico); (b) horizontal banding (“Uruguay agate”) in an agate from Bightbridge, Simbabwe; (c) mixed type with both wall-lining and horizontal banding as well as macrocrystalline amethyst in the center from Tres Pinheiros-Fontoura Xavier (Rio Grande do Sul, Brazil); Scale bar is 2 cm.

Figure 8.
Cross section of a wall-lining agate from Wiederau (Saxony, Germany) from margin (left) to the center (right) in transmitted light (crossed polars) representing the general textural succession of spherulitic and micro-granular chalcedony—fibrous chalcedony—macrocrystalline quartz (width of the micrograph is 10 mm).

Figure 9.
(a) Transmitted light (crossed polars) micrograph of an “Uruguay agate” from the Richardson Ranch (Oregon, USA, see inset); the different horizontal layers show strong variations in crystallite size (b,c) agate from Gröppendorf (Saxony, Germany) as original sample (b) and in transmitted light (crossed polars, (c)) with tilted horizontal layers and ongoing re-crystallisation of quartz replacing former horizontal bands (see arrows).

Figure 10.
(a) Micrograph in transmitted light (crossed polars, λ-compensator) of an agate from the Whale Bay, Iceland showing a sequence of microcrystalline, granular quartz (1) quartzine (2) opal-C (3) fibrous chalcedony (4); (b) SEM micrograph of an agate from St. Egidien (Saxony, Germany); the high magnification reveals significant variations in crystal size and porosity in the different chalcedony layers; (c) transmitted light micrograph of an agate from Wiederau (Saxony, Germany); fine-dispersed Fe-oxides/-hydroxides are aligned along the micro-banding and cause the visible color banding.

Figure 11.
Powder EPR spectra of agate samples from Hausdorf, St. Egidien and Chemnitz (Saxony, Germany); (a) wide scans (microwave power of 2 mW and 295 K) showing a rhombic Fe3+ center as well as a pronounced E′1 center in all samples; (b) narrow scan for the central magnetic field region (microwave power of 20 mW and 295 K) showing multiple species of silicon-vacancy hole centers (B/B′, C/C′, and #3); (c) narrow scan of the central magnetic field region (microwave power of 20 mW and 85 K) showing the [AlO4]0 center and silicon-vacancy hole centers in the agate from Hausdorf; also shown for comparison is a simulated spectrum of the [AlO4]0 center (data from Walsby et al. [116]); (d) wide scans (microwave power of 2 mW and 295 K) showing that the E′1 center in chalcedony part of the agate sample from St. Edigien has a markedly higher intensity than its counterpart in macrocrystalline quartz from the center of the agate geode.

Figure 12.
Relative abundances of silicon-vacancy hole centers (O2−, O23−, O3−) and the oxygen-vacancy electron center E′1 in chalcedony of agates from acidic and basic volcanic rocks, respectively, as well as macrocrystalline quartz in agates (data from Götze et al. [107]).
Figure 12.
Relative abundances of silicon-vacancy hole centers (O2−, O23−, O3−) and the oxygen-vacancy electron center E′1 in chalcedony of agates from acidic and basic volcanic rocks, respectively, as well as macrocrystalline quartz in agates (data from Götze et al. [107]).

Figure 13.
Agates from the Richardson Ranch, Oregon (USA, (a,b)) and from Idar-Oberstein (Germany, (c,d)) in day light (left) and under short-wave UV excitation (Photoluminescence, right); scale bar is 2 cm; the green luminescence is caused by uranyl ions (UO22+), whereas the dominant reddish PL can be related to structural defects in the SiO4-network.

Figure 14.
Micrographs of various agates in transmitted light (crossed polars) and cathodoluminescence (CL); (a,b) agate in liparite from Beipiao (Liaoning province, China) with multiple luminescence colors; note the heterogeneous internal CL textures of quartz crystals (b) appearing homogeneous in polarized light (a); (c,d) hydrothermal vein agate from Halsbach (Saxony, Germany) exhibiting spectacular microtextures in CL (d) not visible in polarized light (c); (e,f) agate from Gröppendorf (Saxony, Germany); the macrocrystalline quartz crystals appear homogeneous in polarized light (e) and show remarkable oscillatory as well as sector zoning in CL (f); (g) agate in rhyolite from Gehlberg (Thuringia, Germany); CL reveals a flow channel crosscutting the agate banding (arrow); (h) CL micrograph of an agate from Chemnitz (Saxony, Germany); the arrows point to a growth zone with numerous radiation halos due to radioactive micro-inclusions.

Figure 15.
CL micrographs and related CL spectra of agates from different locations and host rocks; the circles mark the analytical spots of spectral measurements; (a) sedimentary “Dryhead agate” from the Pryor mountains, Montana (USA) showing growth zones with variable CL dominated by the 650 nm emission (non-bridging oxygen hole center, NBOHC); (b) agate in ignimbrite from St. Egidien (Saxony, Germany) with yellow CL; the spectra exhibit a broad emission band around 570 nm (self-trapped exciton, STE) with varying intensities; (c) agate in basalt from Soledade, Rio Grande do Sul (Brazil) showing greenish CL; the visible CL color results from the overlapping of a broad band at 650 nm (NBOHC) and multiple peaks between 500 and 600 nm of the uranyl ion (UO22+); note the radiation halos around U-bearing inclusions (arrows).

Figure 16.
(a) Trace-element data from ICP-MS analyses of different zones (1, 3 = chalcedony; 2, 4 = macrocrystalline quartz) in an agate from St. Egidien, Saxony (Germany) compared to the composition of the rhyolitic host rock (the circles mark the areas of chemical analyses; nd—not detected); (b) chondrite-normalized REE distribution patterns (normalization according to data of Mason [127]) of the same agate zones shown in (a).

Figure 17.
Micrograph of an agate from St. Egidien, Saxony (Germany) with a profile showing the analytical spots (spot numbers relate to analytical data in Table 2) of trace element analysis by LA-ICP-MS.
Figure 17.
Micrograph of an agate from St. Egidien, Saxony (Germany) with a profile showing the analytical spots (spot numbers relate to analytical data in Table 2) of trace element analysis by LA-ICP-MS.

Figure 18.
Compilation of oxygen isotope data (δ18O) of agates from different origins (SHR = sedimentary host rock; HVA = hydrothermal vein agate); data are compiled from [14,30,31,37,58,101,140,141,142,143,144,145,146,147].

Figure 19.
Hydrothermal vein agate from Schlottwitz, Germany (a) and agate from mafic lavas of the Ardownie quarry, Scotland (b) with results of spatially resolved oxygen-isotope analyses (circles).
Figure 19.
Hydrothermal vein agate from Schlottwitz, Germany (a) and agate from mafic lavas of the Ardownie quarry, Scotland (b) with results of spatially resolved oxygen-isotope analyses (circles).

Figure 20.
Primary two-phase (gas-liquid) inclusions in macrocrystalline quartz of agates from Saxony (Germany): (a) Burgstall, (b) St. Egidien.
Figure 20.
Primary two-phase (gas-liquid) inclusions in macrocrystalline quartz of agates from Saxony (Germany): (a) Burgstall, (b) St. Egidien.

Figure 21.
Appearance of calcite in agates: (a) micrograph in transmitted light (crossed polars) of the transition zone between chalcedony and calcite in an agate from Xuanhua, province Hebei (China); note the sharp boundary between the two phases and the spherulitic growth of calcite; (b,c) micrographs in transmitted light (crossed polars, (b)) and CL (c) of an agate from Agate Point, Canada showing two calcite generations (dark brown, orange CL) in chalcedony matrix (dark); the second calcite generation replaces the banded chalcedony and forms pseudomorphs; (d) “calcite agate” from Krásný Dvoreček (Czech Republic) with the typical banded appearance of agate but consisting completely of carbonate.

Figure 22.
Fe-oxides/hydroxides in agates: (a) “agate” from Xuanhua, province Hebei (China) almost completely consisting of Fe-oxides/-hydroxides (hematite, goethite) showing a spherulitic growth; (b) micrograph in transmitted light of an agate from Xuanhua, province Hebei (China) showing the silica matrix with the distribution of Fe-oxides/-hydroxides: dentritic (1), aligned along the chalcedony banding (2) and large, irregular particles (3); (c) SEM-BSE image showing details of the microtexture of Fe-oxides/-hydroxides in an agate from St. Egidien, Saxony (Germany), which follows the microtexture of the calcedony banding indicating simultaneous crystallisation.

Figure 23.
(a) Pseudomorphic mineral formation in an agate from Liebgensmühle (Saxony, Germany); (b) micrograph in transmitted light showing details of the lath-shaped crystals; (c) CL micrograph of the same area, which reveals relics of dolomite in the core of the lath-shaped crystals as well as tiny kaolinite from alteration processes; (d) agate from Cachoeira dos Índios, Paraiba (Brazil); the polygonal shape developed due to infill of silica into interstices between laminated calcite (or barite) crystals.

Figure 24.
(a) Vesicular trachyandesite in the agate quarry of Dishuya (Hebei province, China); the numerous cavities formed by fluid bubbles that got stuck in the cooling lava; the inset shows an agate-filled cavity (amygdale); (b) agate-filled former bubbles arranged in the flow texture of the solidified andesitic lava from the Steinkaulenberg, Idar-Oberstein (Germany).

Figure 25.
Different kinds of lithophysae with agates in silica-rich volcanic rocks: (a) lithophysa in an ignimbritic pitchstone from Zwickau, Saxony (Germany); the inset shows a lithophysa from Chemnitz, Saxony (Germany) with crystallisation center (arrow) and empty cavity; (b) double-lithophysa with multiple agate cavities from St. Egidien, Saxony, Germany; (c) thunderegg from the Baker Egg Mine, Deming (New Mexico, USA) with multiple crescent-shaped agate cavities; scale bar is 2 cm.

Figure 26.
(a) Hydrothermal vein agate (“Trümmerachat”) from Schlottwitz, Saxony (Germany) showing brecciation and healing by secondary silicification in the lower part; primary agate formation took place in Permian time (263.7 ± 2.2 Ma), whereas brecciation and secondary cementation by silica happened much later during tectonic activities in the Upper Oligocene/Miocene [172]; (b) agate of sedimentary origin from Rutba, Western desert (Iraque); (c) back side of the agate in (b) illustrating the typical cauliflower-like surface; scale bar is 2 cm.

Figure 27.
Temperatures of agate formation calculated from [AlO4]0 concentrations in chalcedony (TAl chalcedony) and macrocrystalline quartz (TAl quartz) compared to temperatures obtained for the same agate samples assuming oxygen isotope equilibration with meteoric (Tmeteoric), oceanic (Toceanic) or magmatic water (Tmagmatic); data from Götze et al. [185].

Figure 28.
Schematic development of silica from monomeric silicic acid to an amorphous precipitate during the transport and accumulation processes.
Figure 28.
Schematic development of silica from monomeric silicic acid to an amorphous precipitate during the transport and accumulation processes.

Figure 29.
(a) Scheme of the formation of agate banding starting with separate spherulites and continuing inwards with fibrous chalcedony layers; (b) micrograph in transmitted light (crossed polars) of an agate from Los Indios (Cuba) showing a smooth transition from fibrous chalcedony to macrocrystalline quartz; (c) Nomarski DIC micrograph of the interface chalcedony/quartz revealing skeletal growth and irregular internal textures of macrocrystalline quartz, which point to rapid crystallisation under non-equilibrium conditions.

Figure 30.
Micrographs showing the development of the band micro-structure in agates: (a) rhythmic banding of granular quartz and fibrous chalcedony in an agate from Los Indios (Cuba); (b) electron backscatter diffraction (EBSD) band contrast image revealing an increase in brightness with increasing SiO2 crystallinity; (c) EBSD micrograph showing the distribution of α-quartz (red colour) in the agate bands; (b,c) demonstrate that the dark band areas consist of amorphous or strongly disordered silica.

Figure 31.
Aging of agate accompanied by loss of distinct banding and blue color demonstrated by an agate sample from Soledade, Rio Grande do Sul (Brazil): (a) freshly cut and polished agate with deep blue color and distinct banding; (b) the same agate after 3 years at room temperature and under natural light; (c) the agate after 6 weeks storage in water.

Figure 32.
Incorporation of iron compounds as color pigments in agate: (a) micrograph in transmitted light of an agate from Hausdorf, Saxony (Germany) with iron oxides aligned along the banding (1) and random distribution in areas without banding (2); (b) agate from Pujiang, province Zhejiang (China) showing yellow color due to incorporation of goethite and red bands caused by hematite inclusions; note that hematite particles are flattened and aligned along the banding.

Figure 33.
(a) Agate from Sierra del Chachahuen, Mendoza (Argentina) without distinct banding and irregular color distribution; (b) secondary discoloration (left side and along cracks, see arrows) in an agate from San Rafael, Mendoza (Argentina); (c) agate from Xuanhua, province Hebei (China) with effects of secondary bleaching and discoloration; scale bar is 2 cm.

Figure 34.
Structural peculiarities in agates: (a) agate from Moctezuma, Chihuahua (Mexico) showing a so called “infiltration channel” (“escape tube”); (b) micrograph of the marginal part of an agate from Zschaitz, Saxony (Germany) resembling the inflow channel of silica into the agate, which cross-cuts the outermost chalcedony layer; (c) agate from Agate Creek, Queensland (Australia) with multiple deformation features; (d) cavity from the Dekkan Trap basalt, India completely filled with quartz stalactites (SFF); (e) green filamentous structure in a moss agate from Jalna, India; (f) Fe-rich agate of probably biogenic origin from the Mátra Mts., Hungary (inset) with filamentous pseudomorphs in the microcrystalline silica matrix; (g) agate from Kardzali (Bulgaria) with plume structures; (h) details of the reddish-brown plume structures in chalcedony matrix; (i) bundle-like structures resembling the shape of natural sheaf of wheat in an agate from the Darrell Friend Ranch near Ashwood, Oregon (USA) (sample courtesy G. Schiecke, photo A. Gabert); the unusual shape is probably caused by calcite traced in silica gel; (k) agate from Berschweiler near Idar-Oberstein (Germany) with inclusions of spiral forms probably developed from an amorphous silica precursor by self-organisation growth.


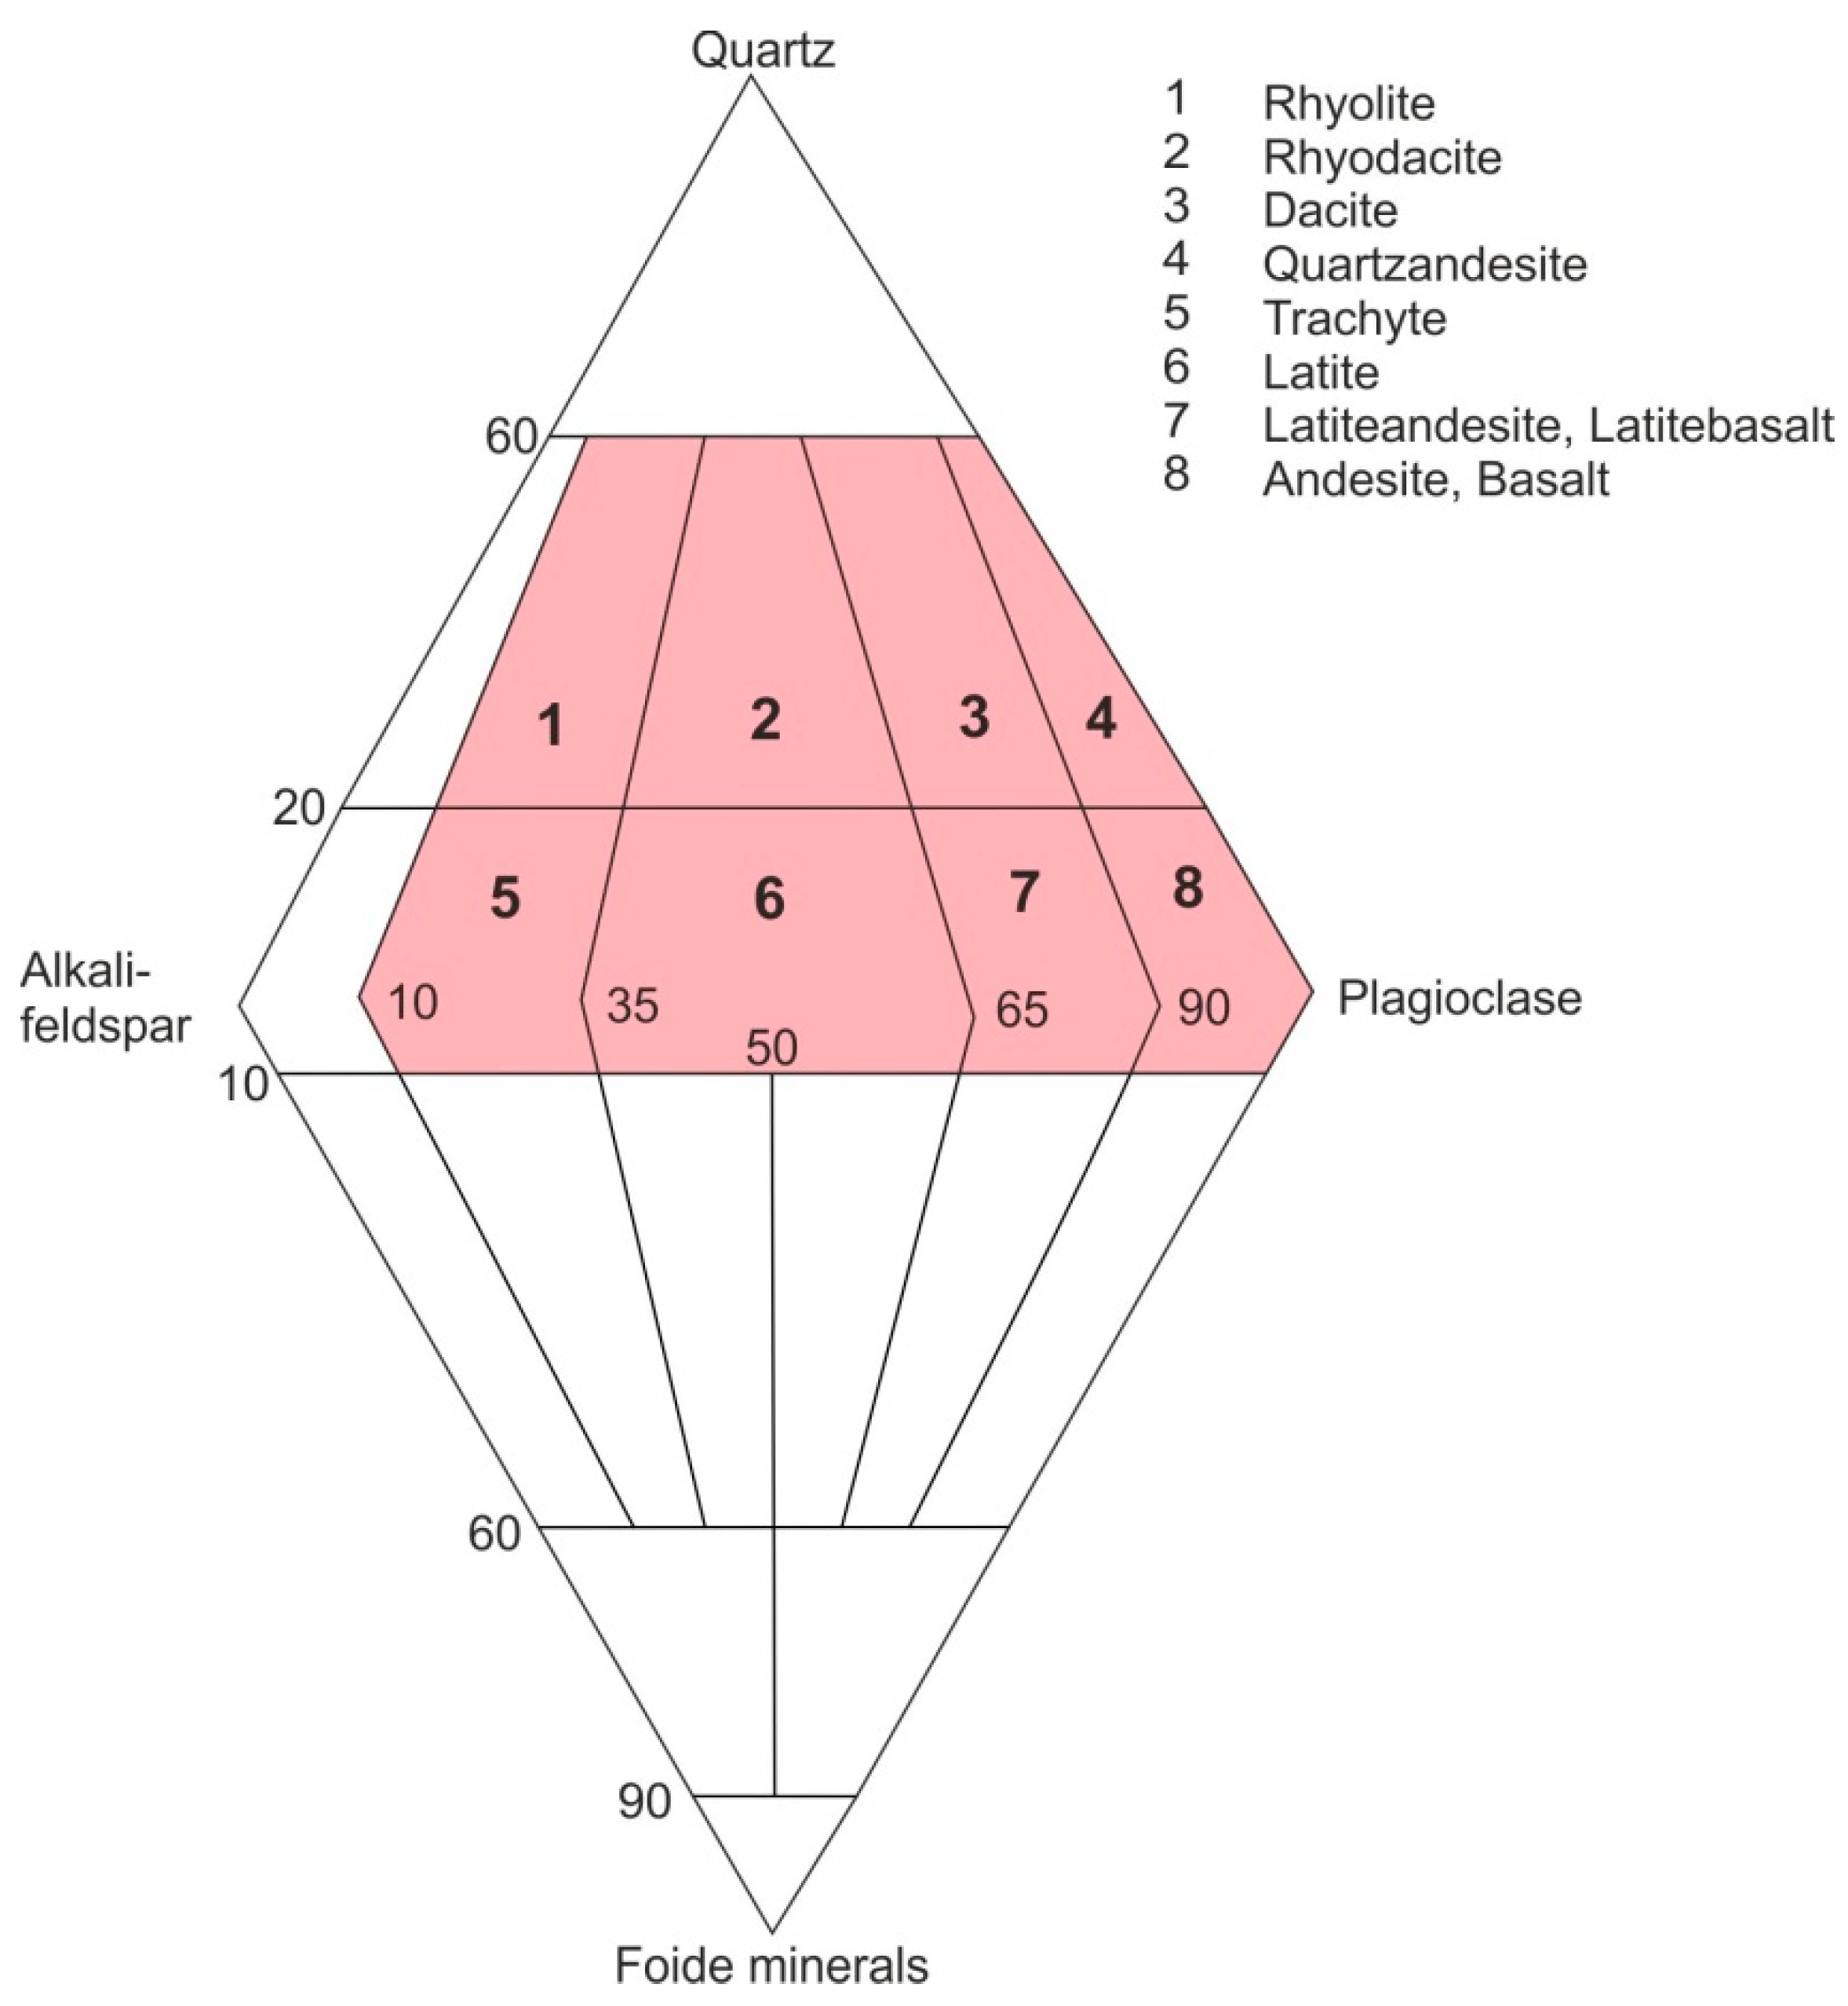
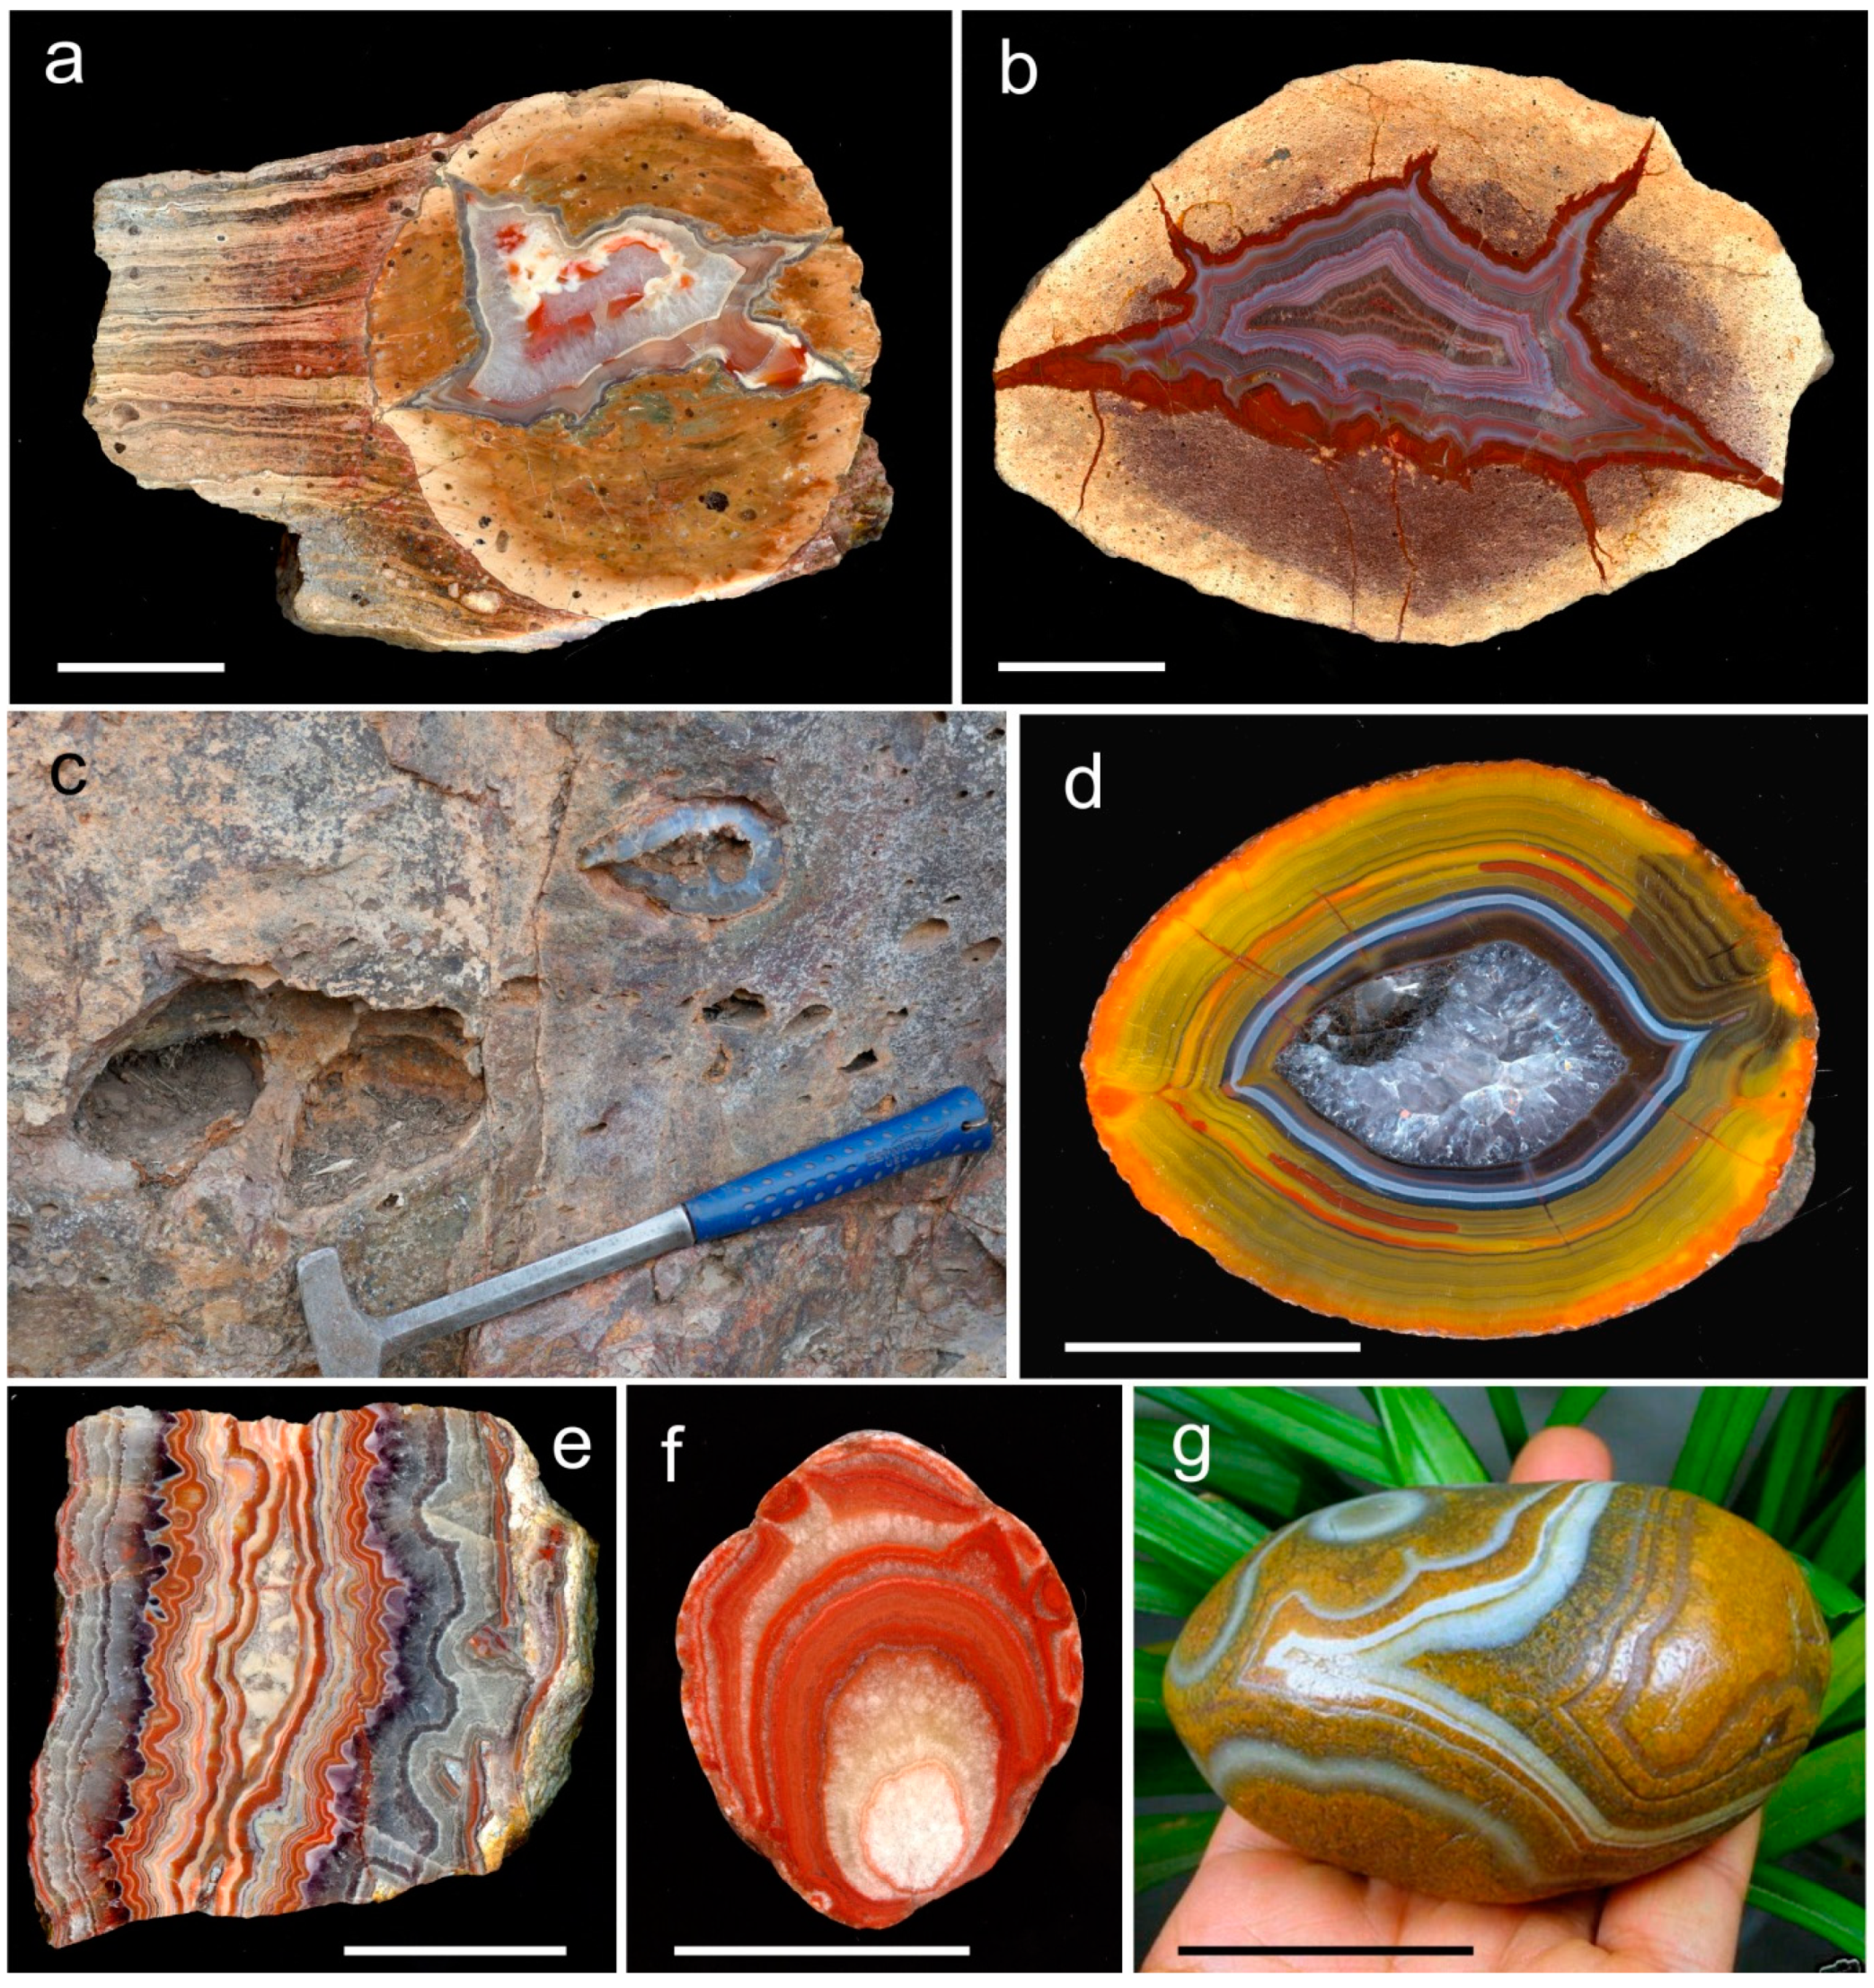
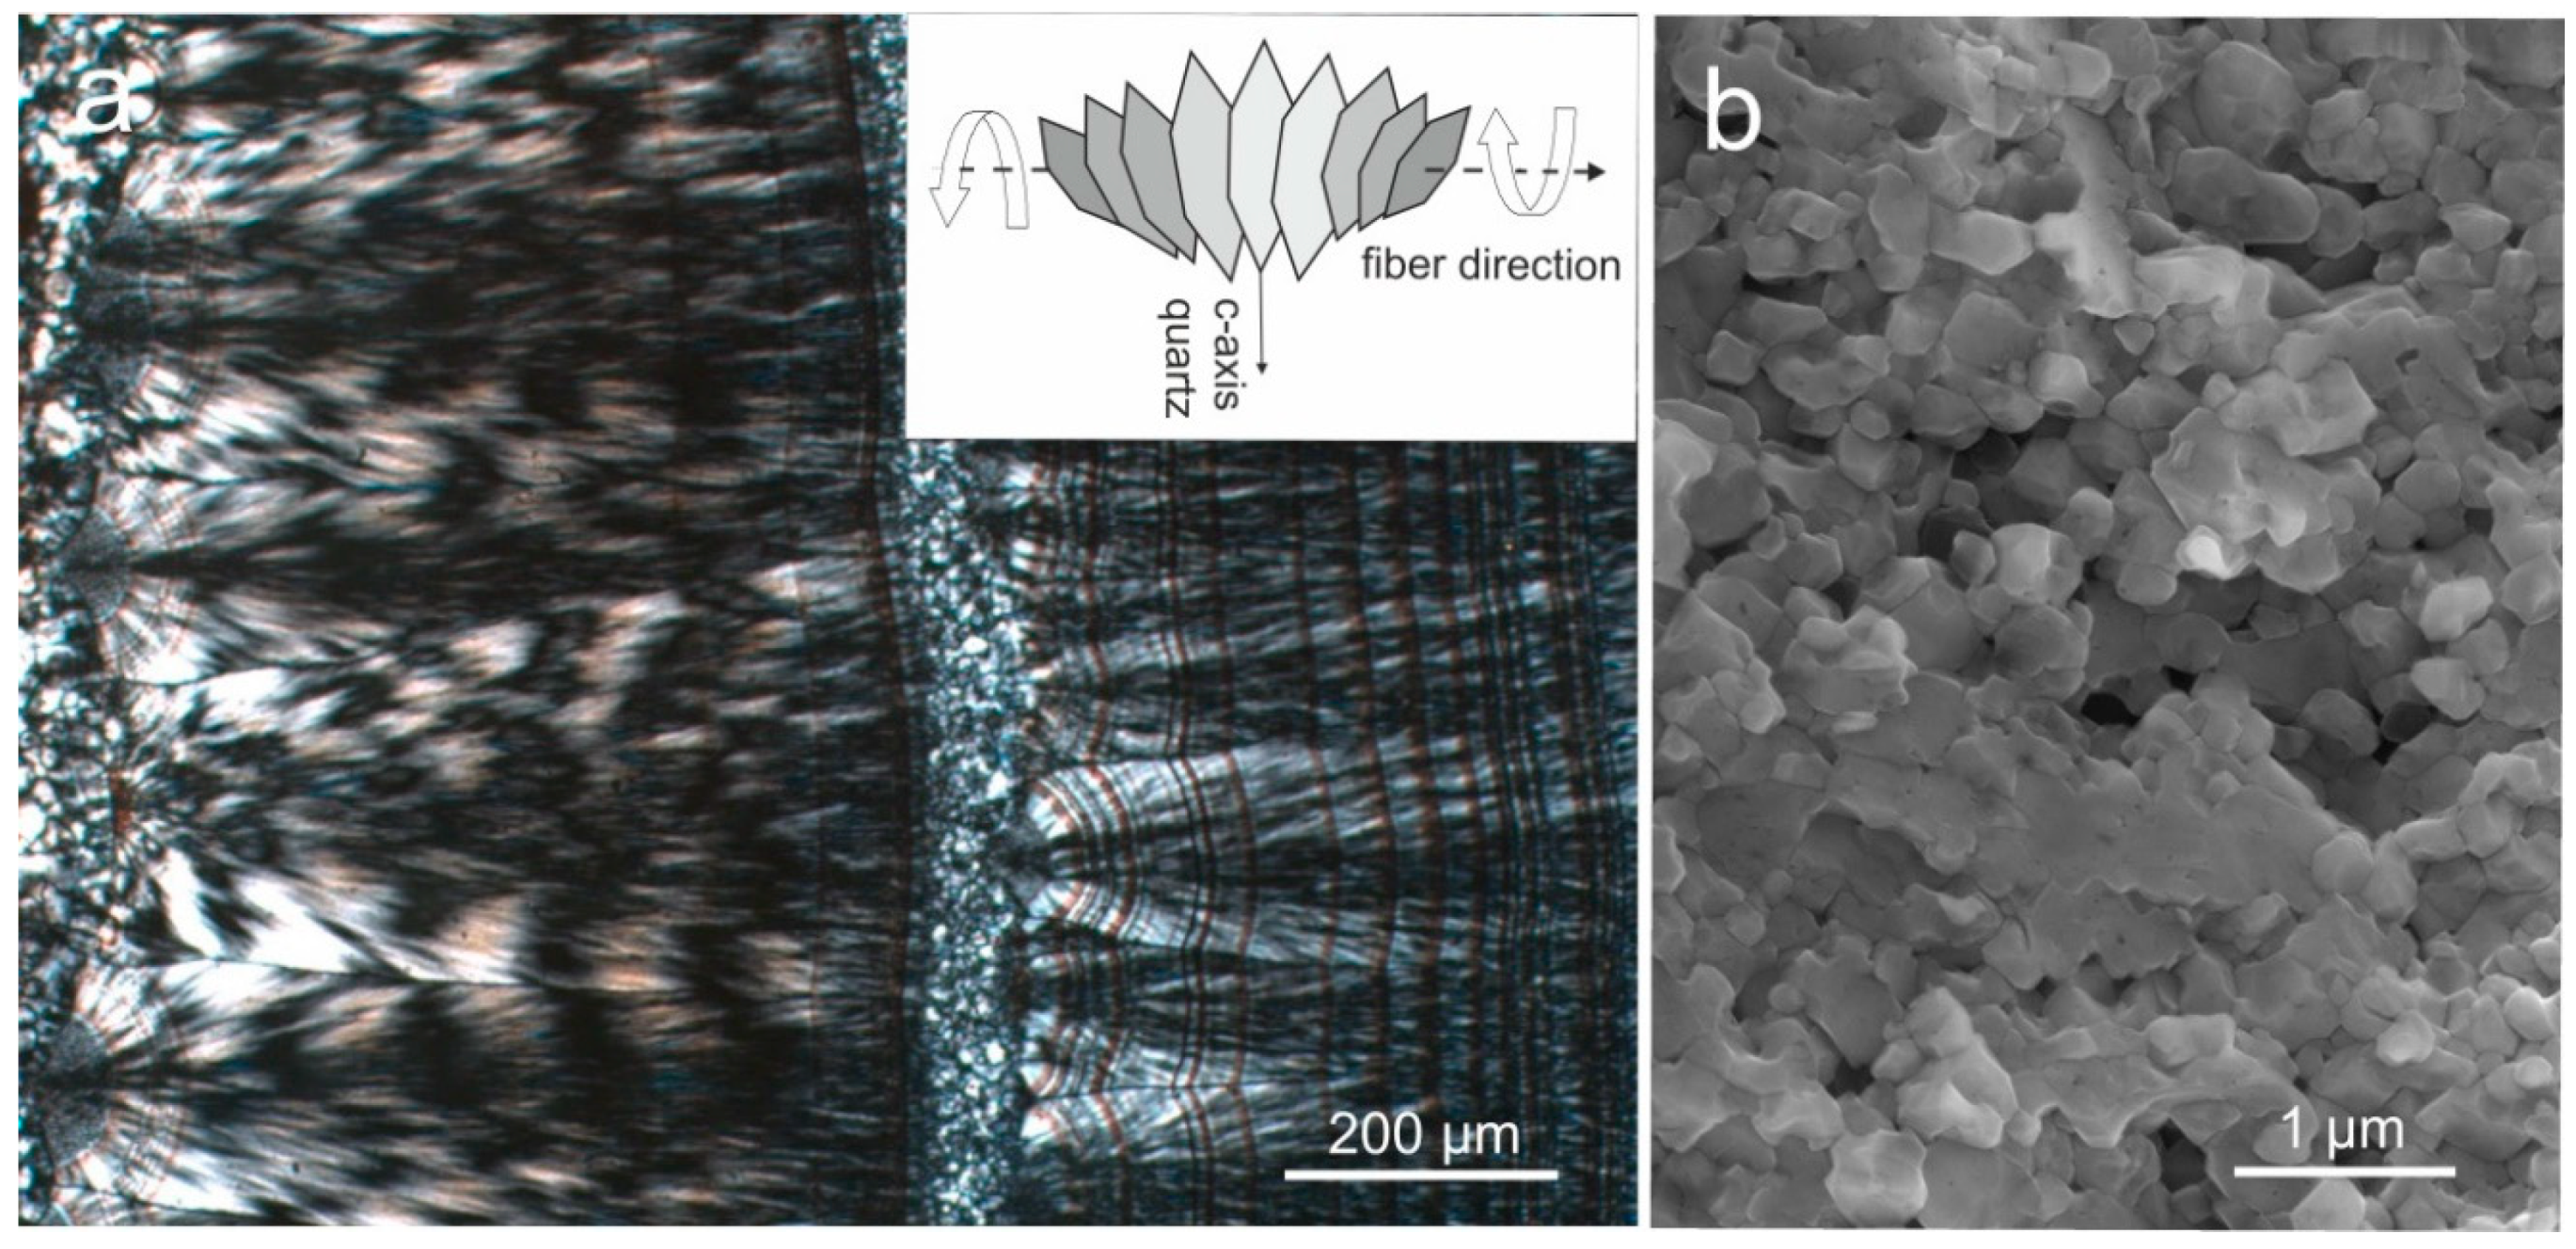
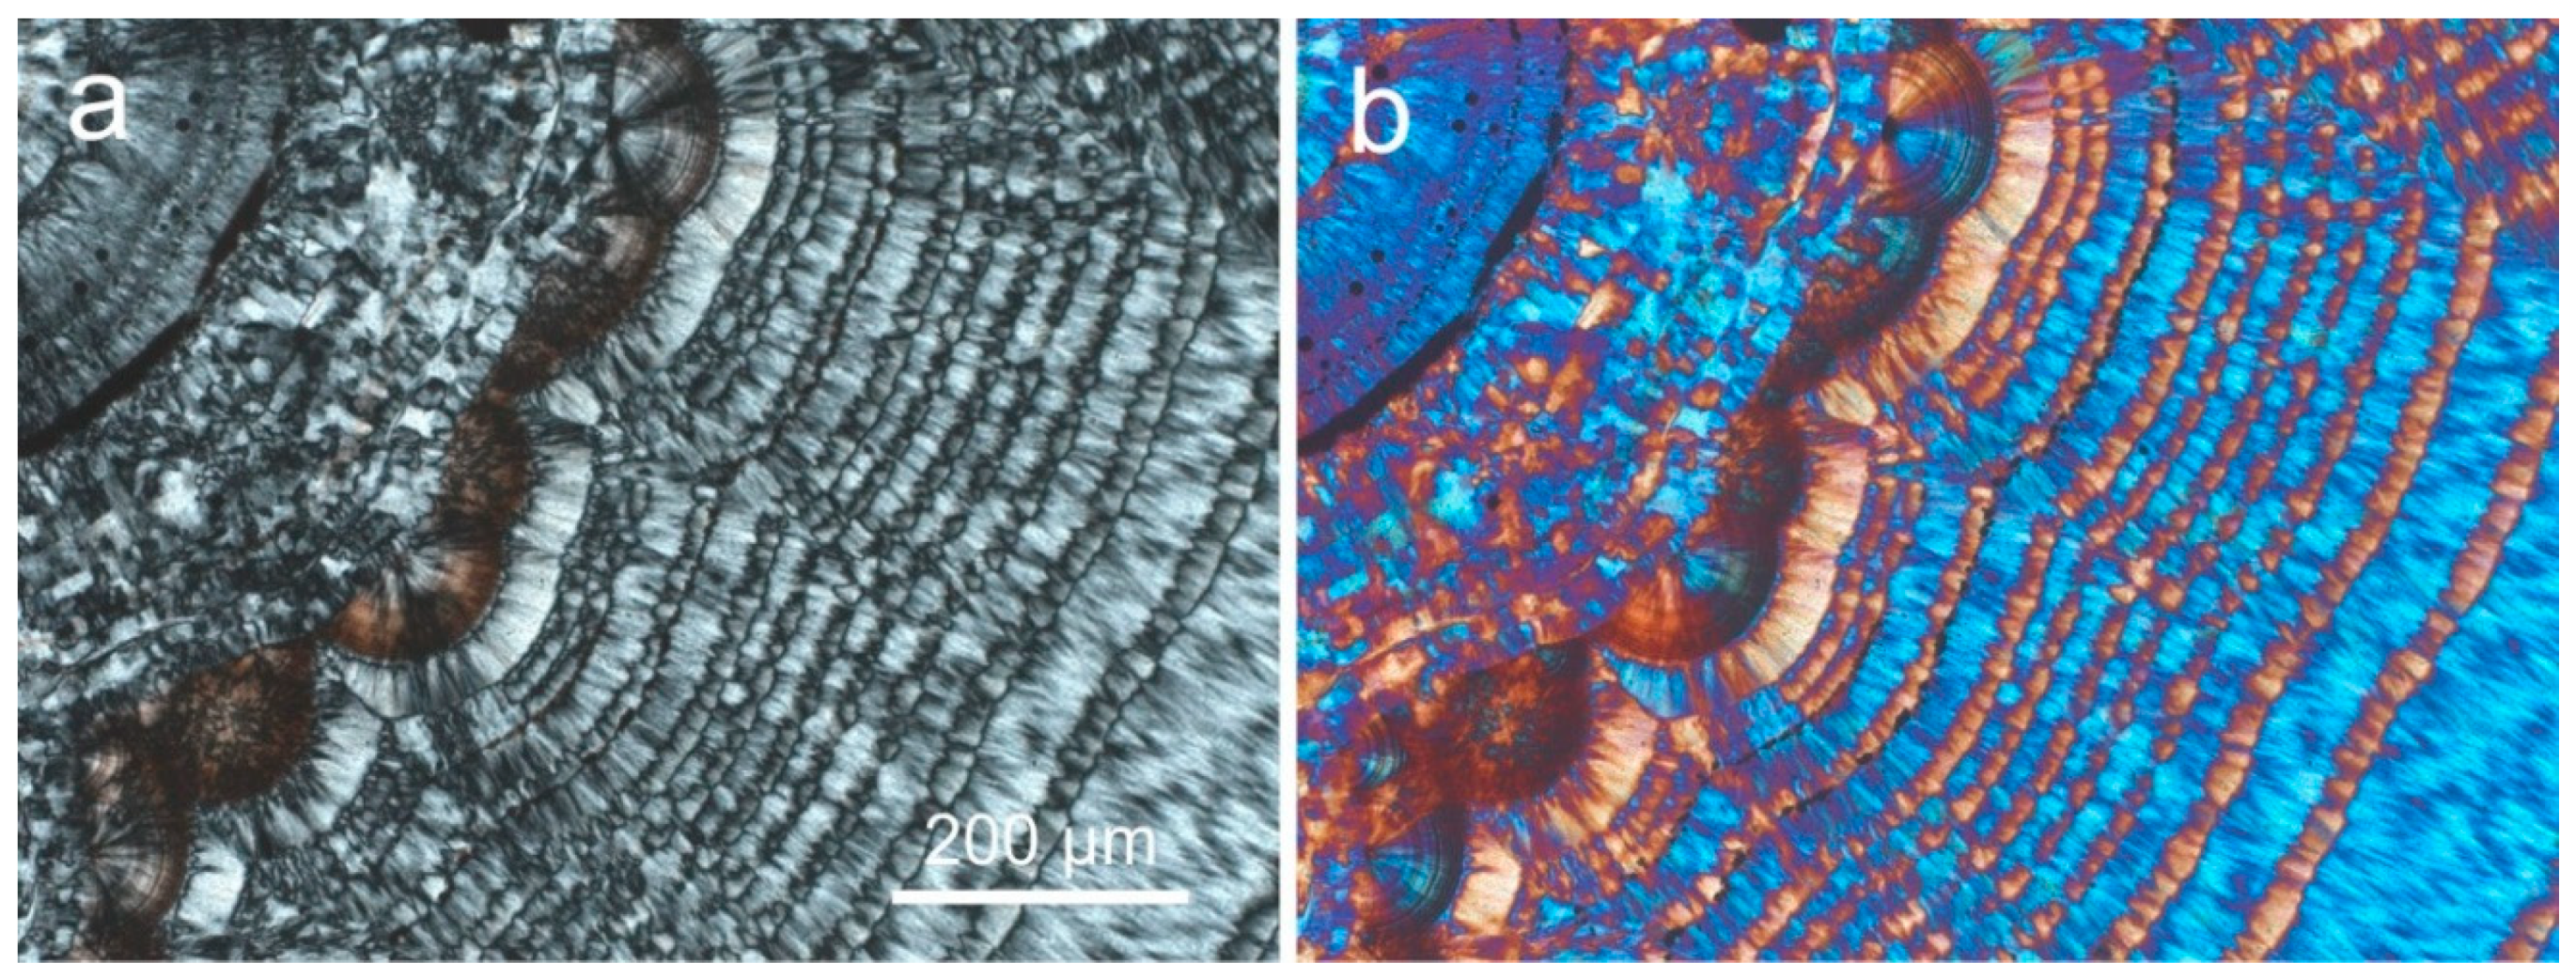
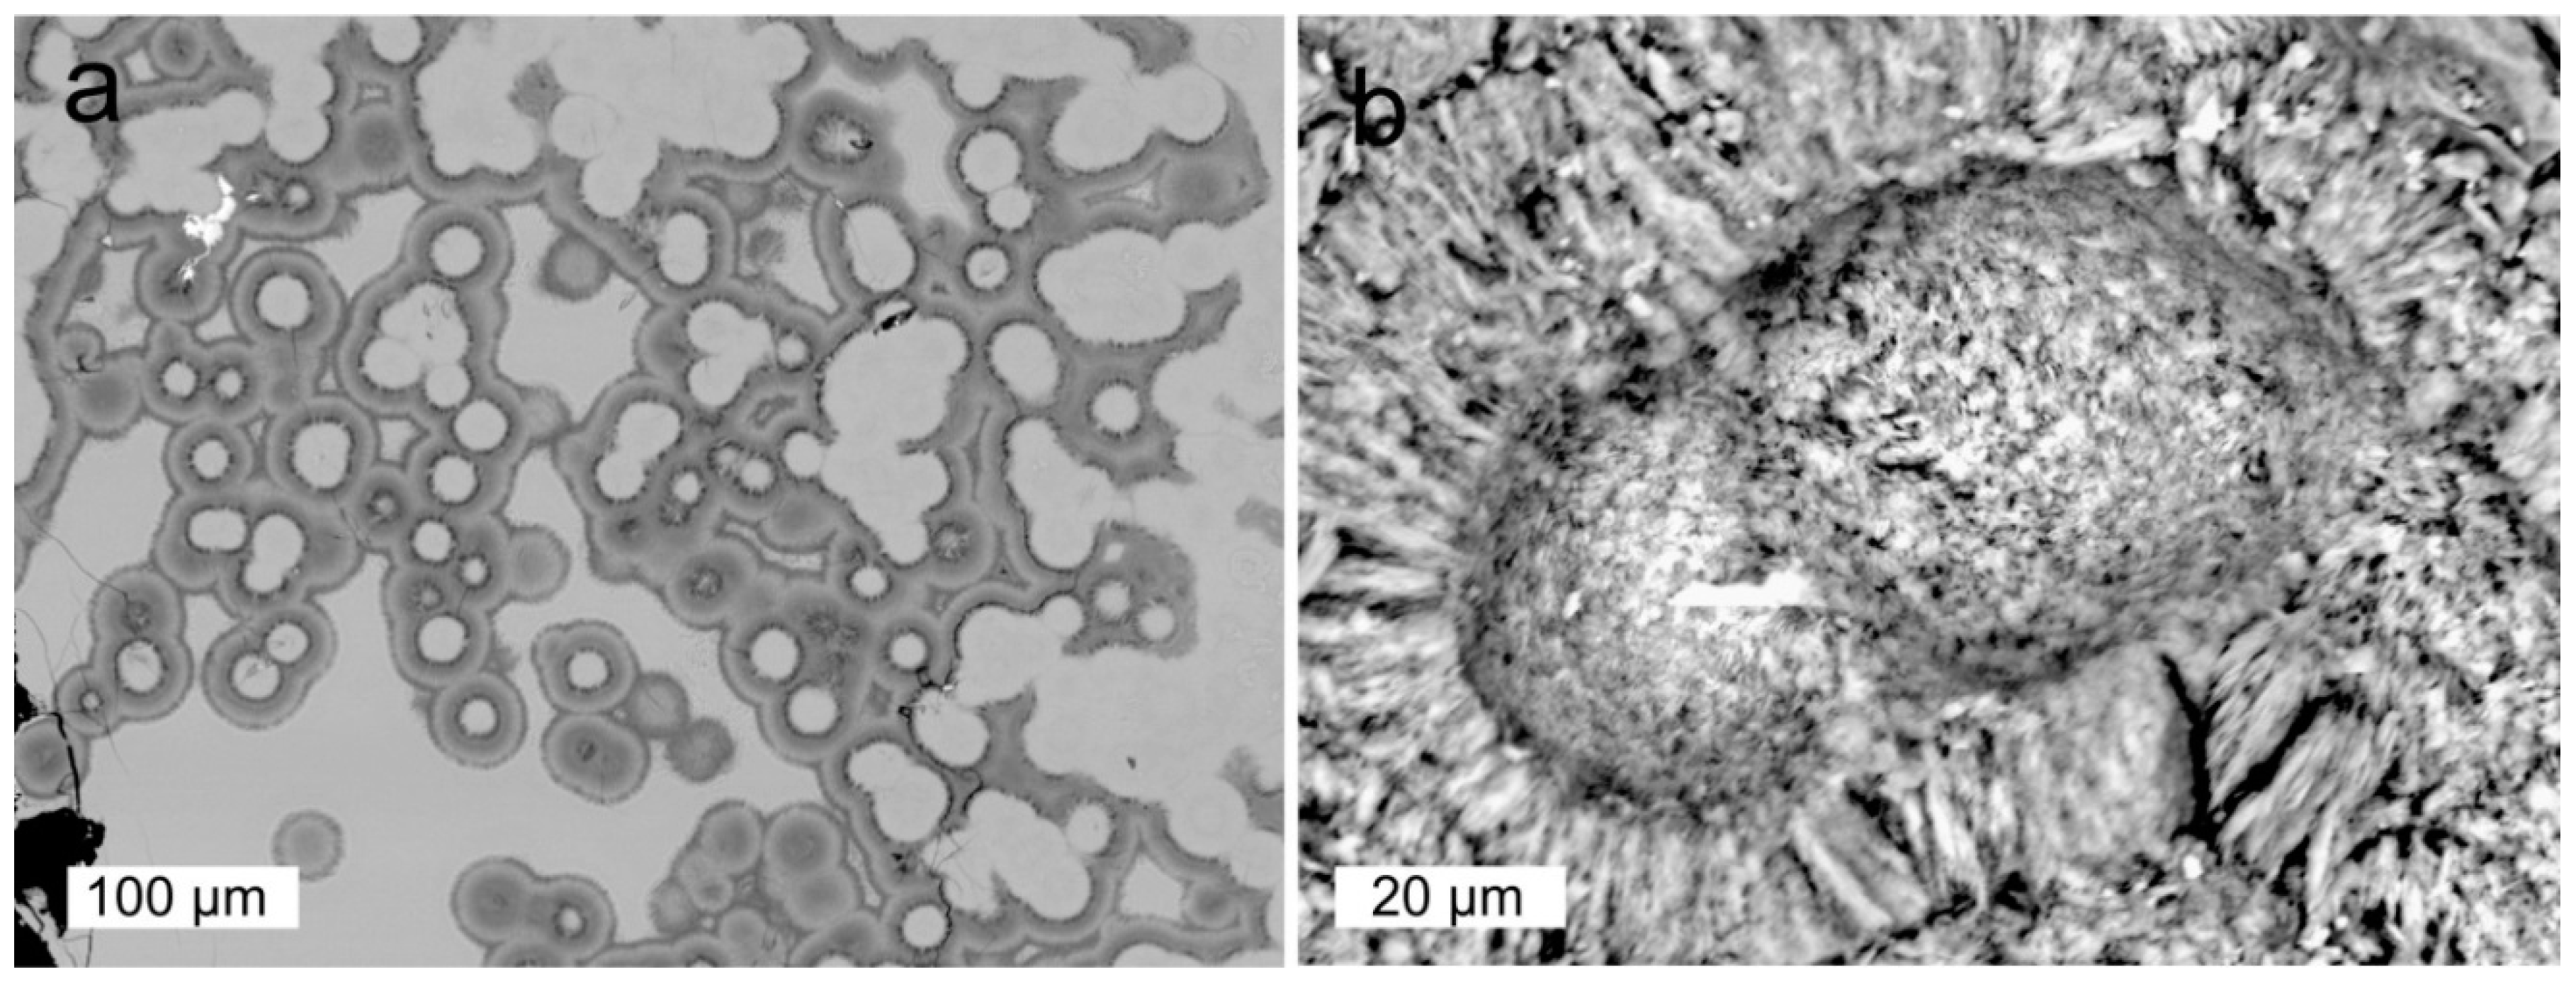
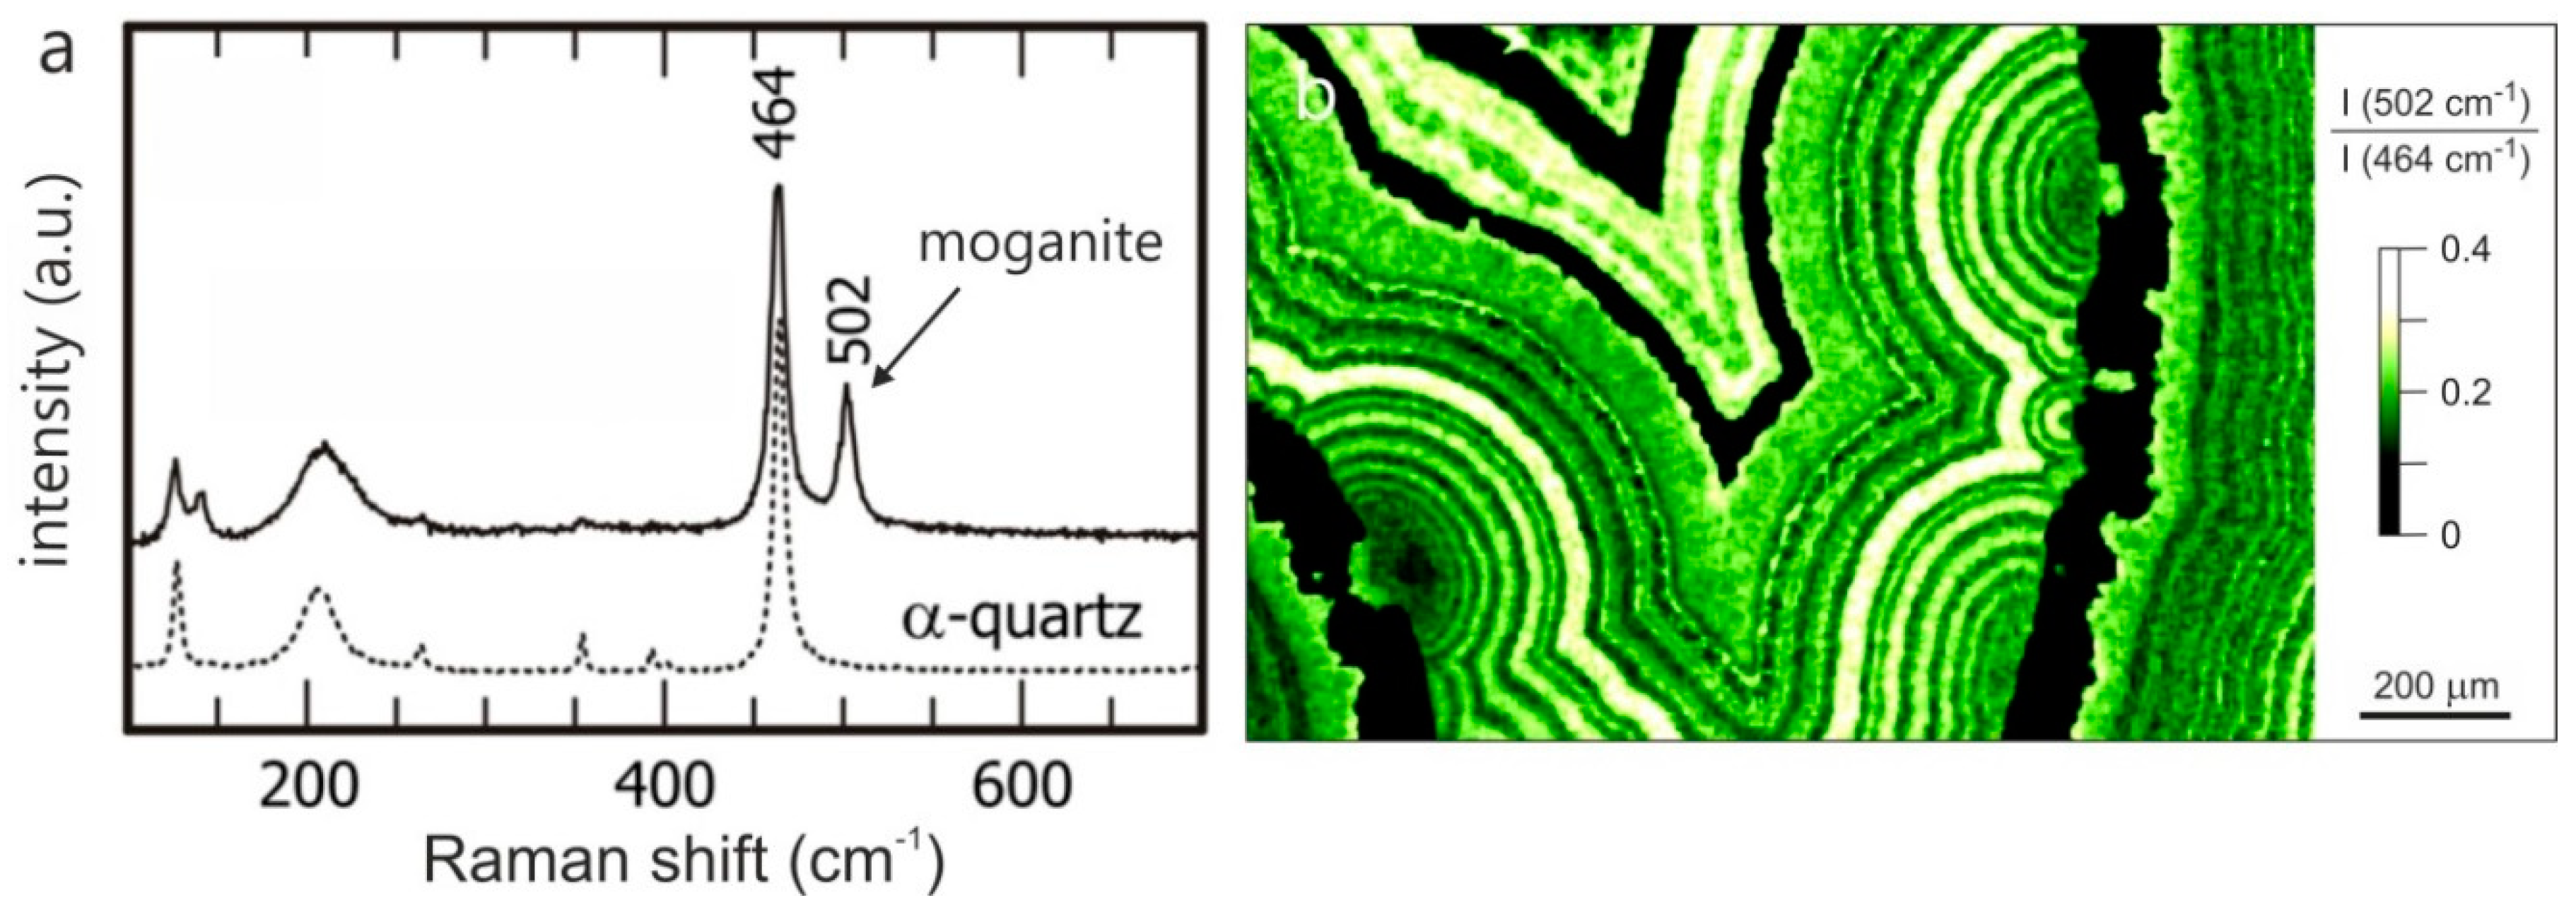
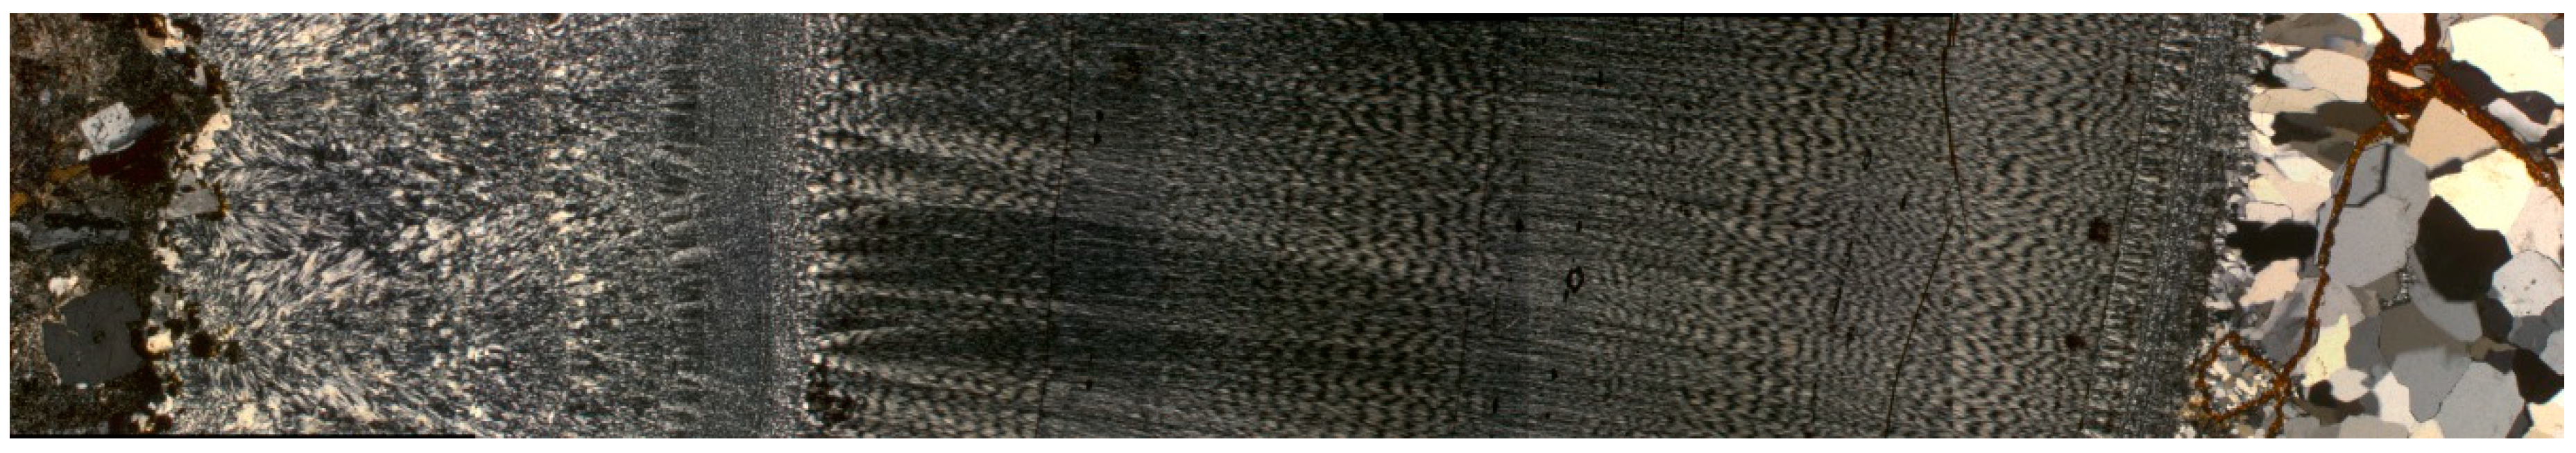
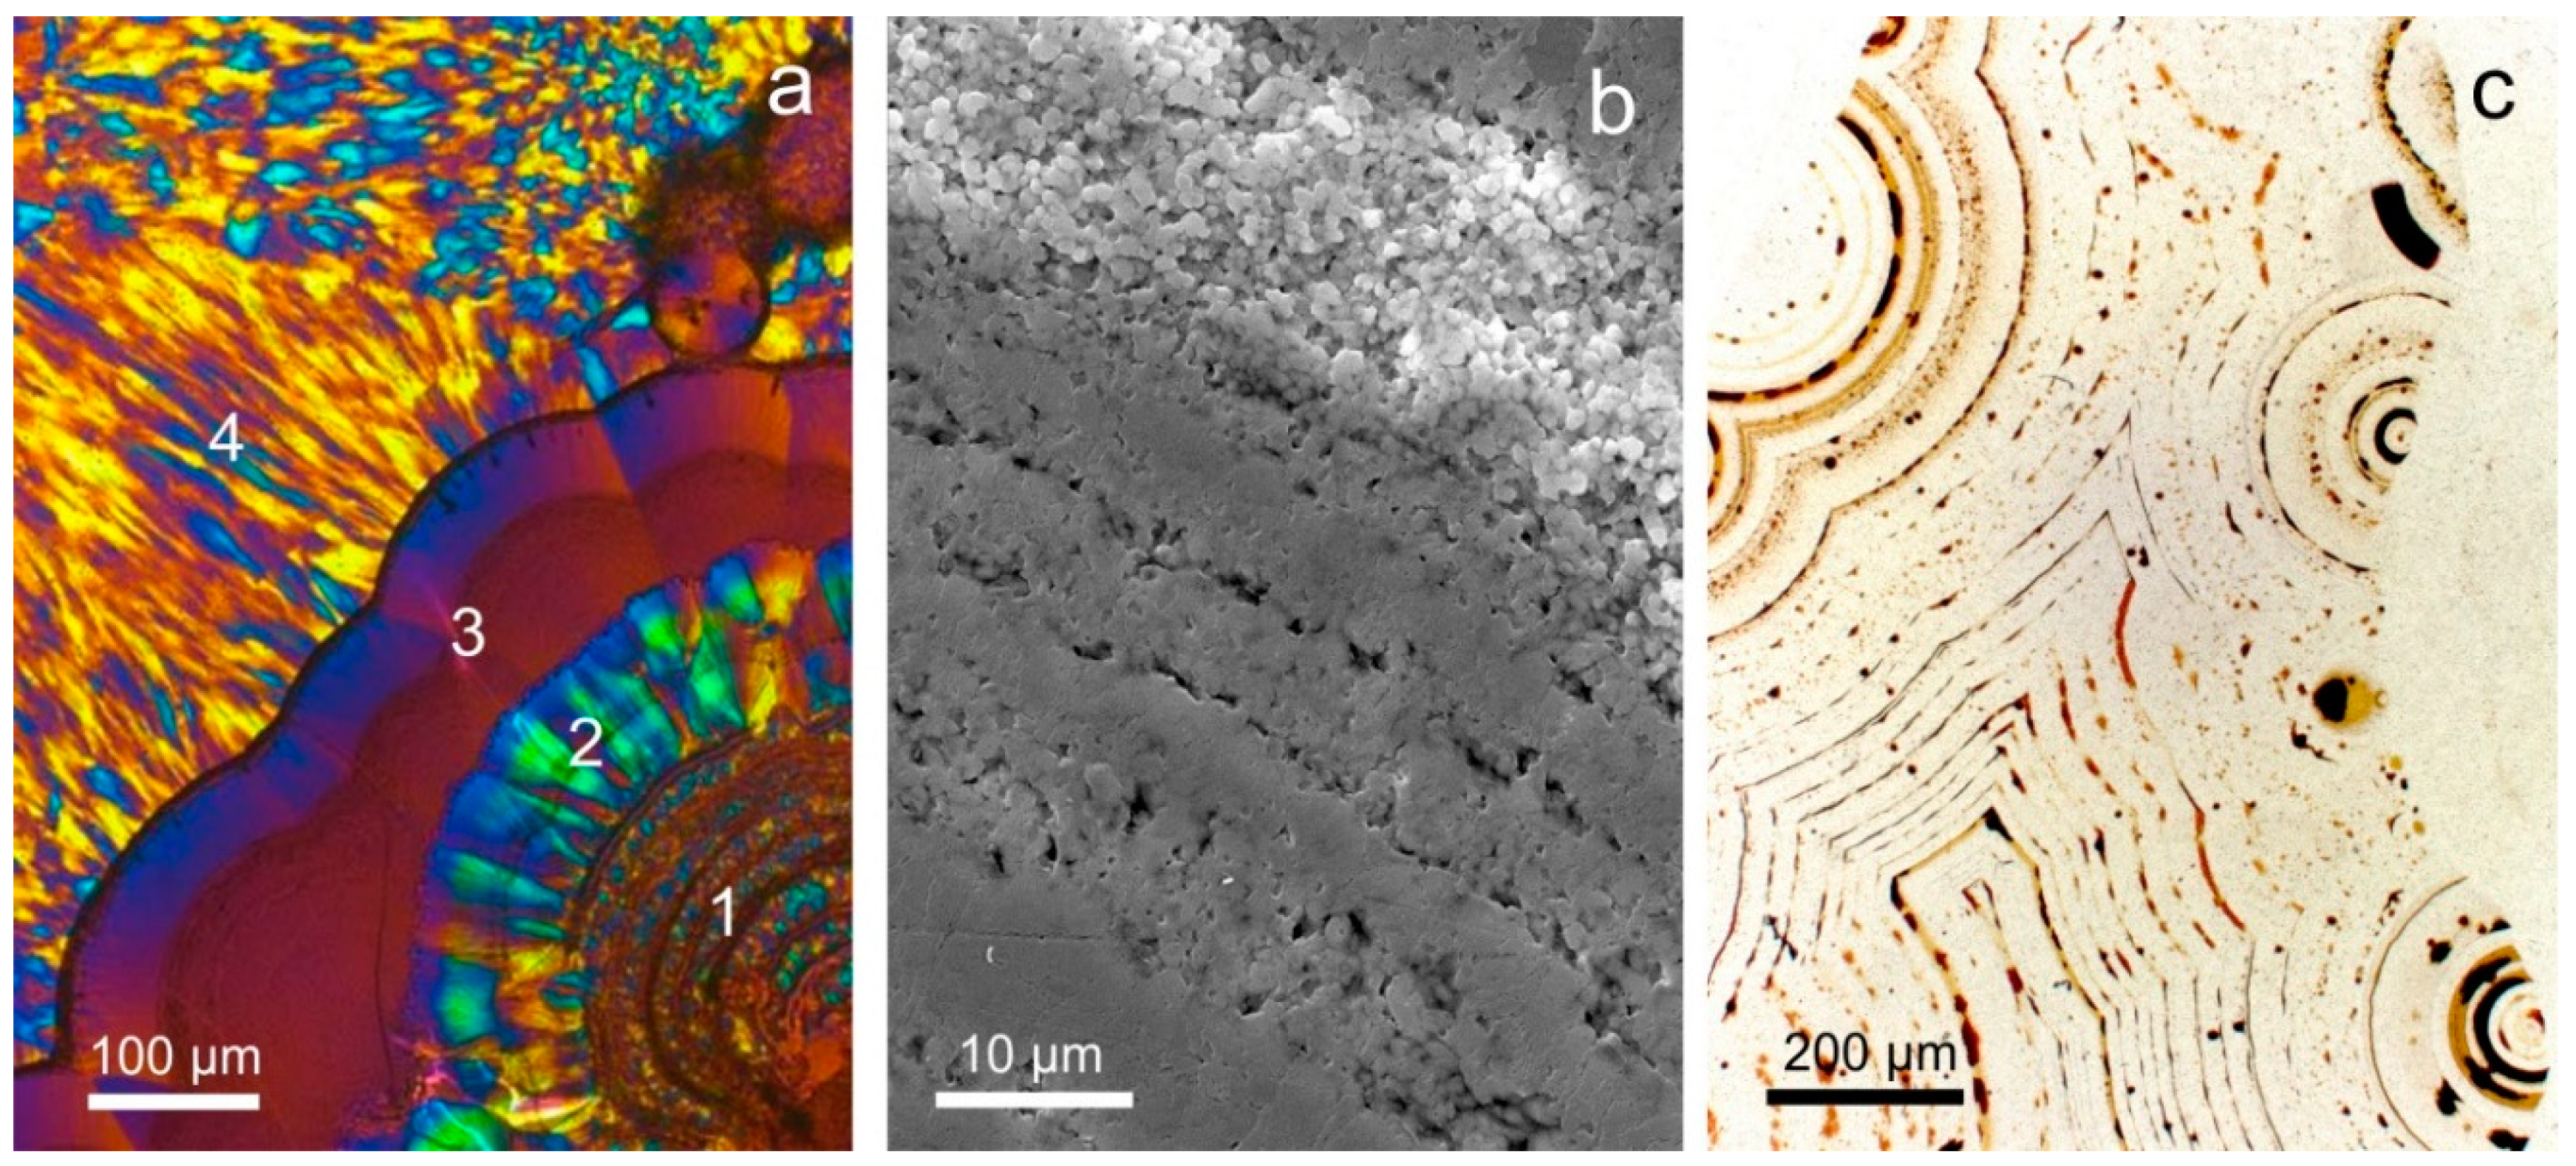
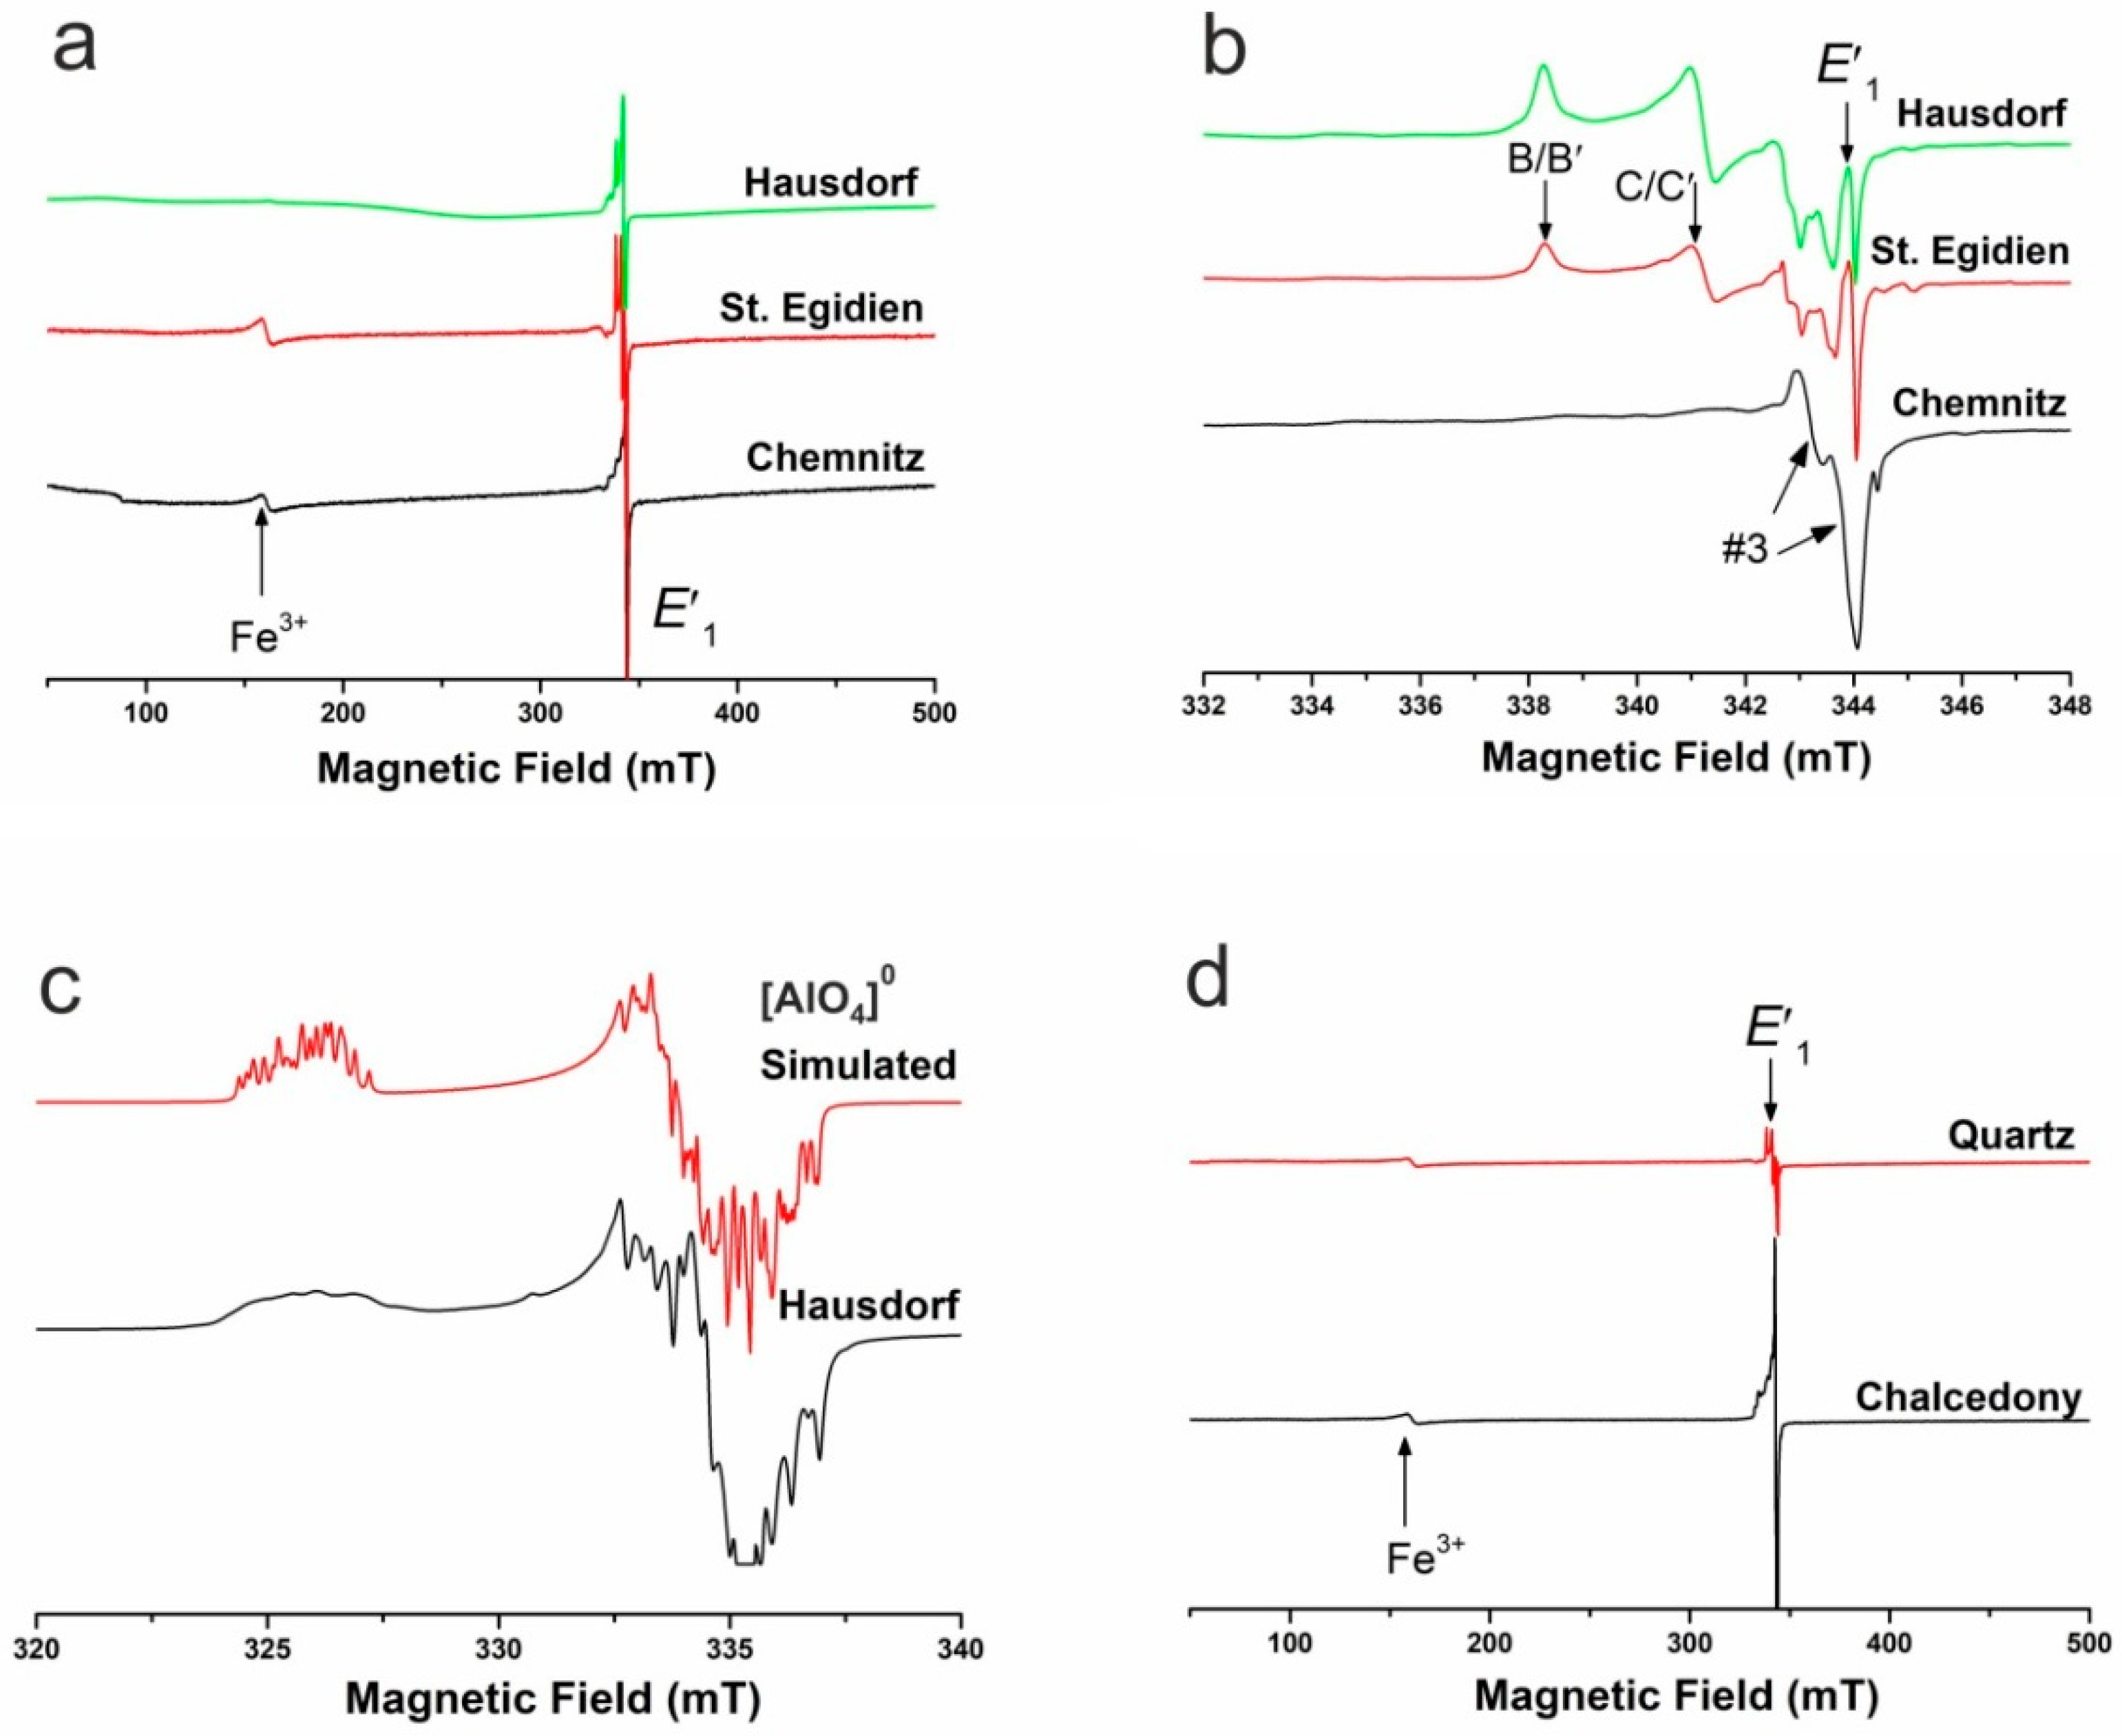
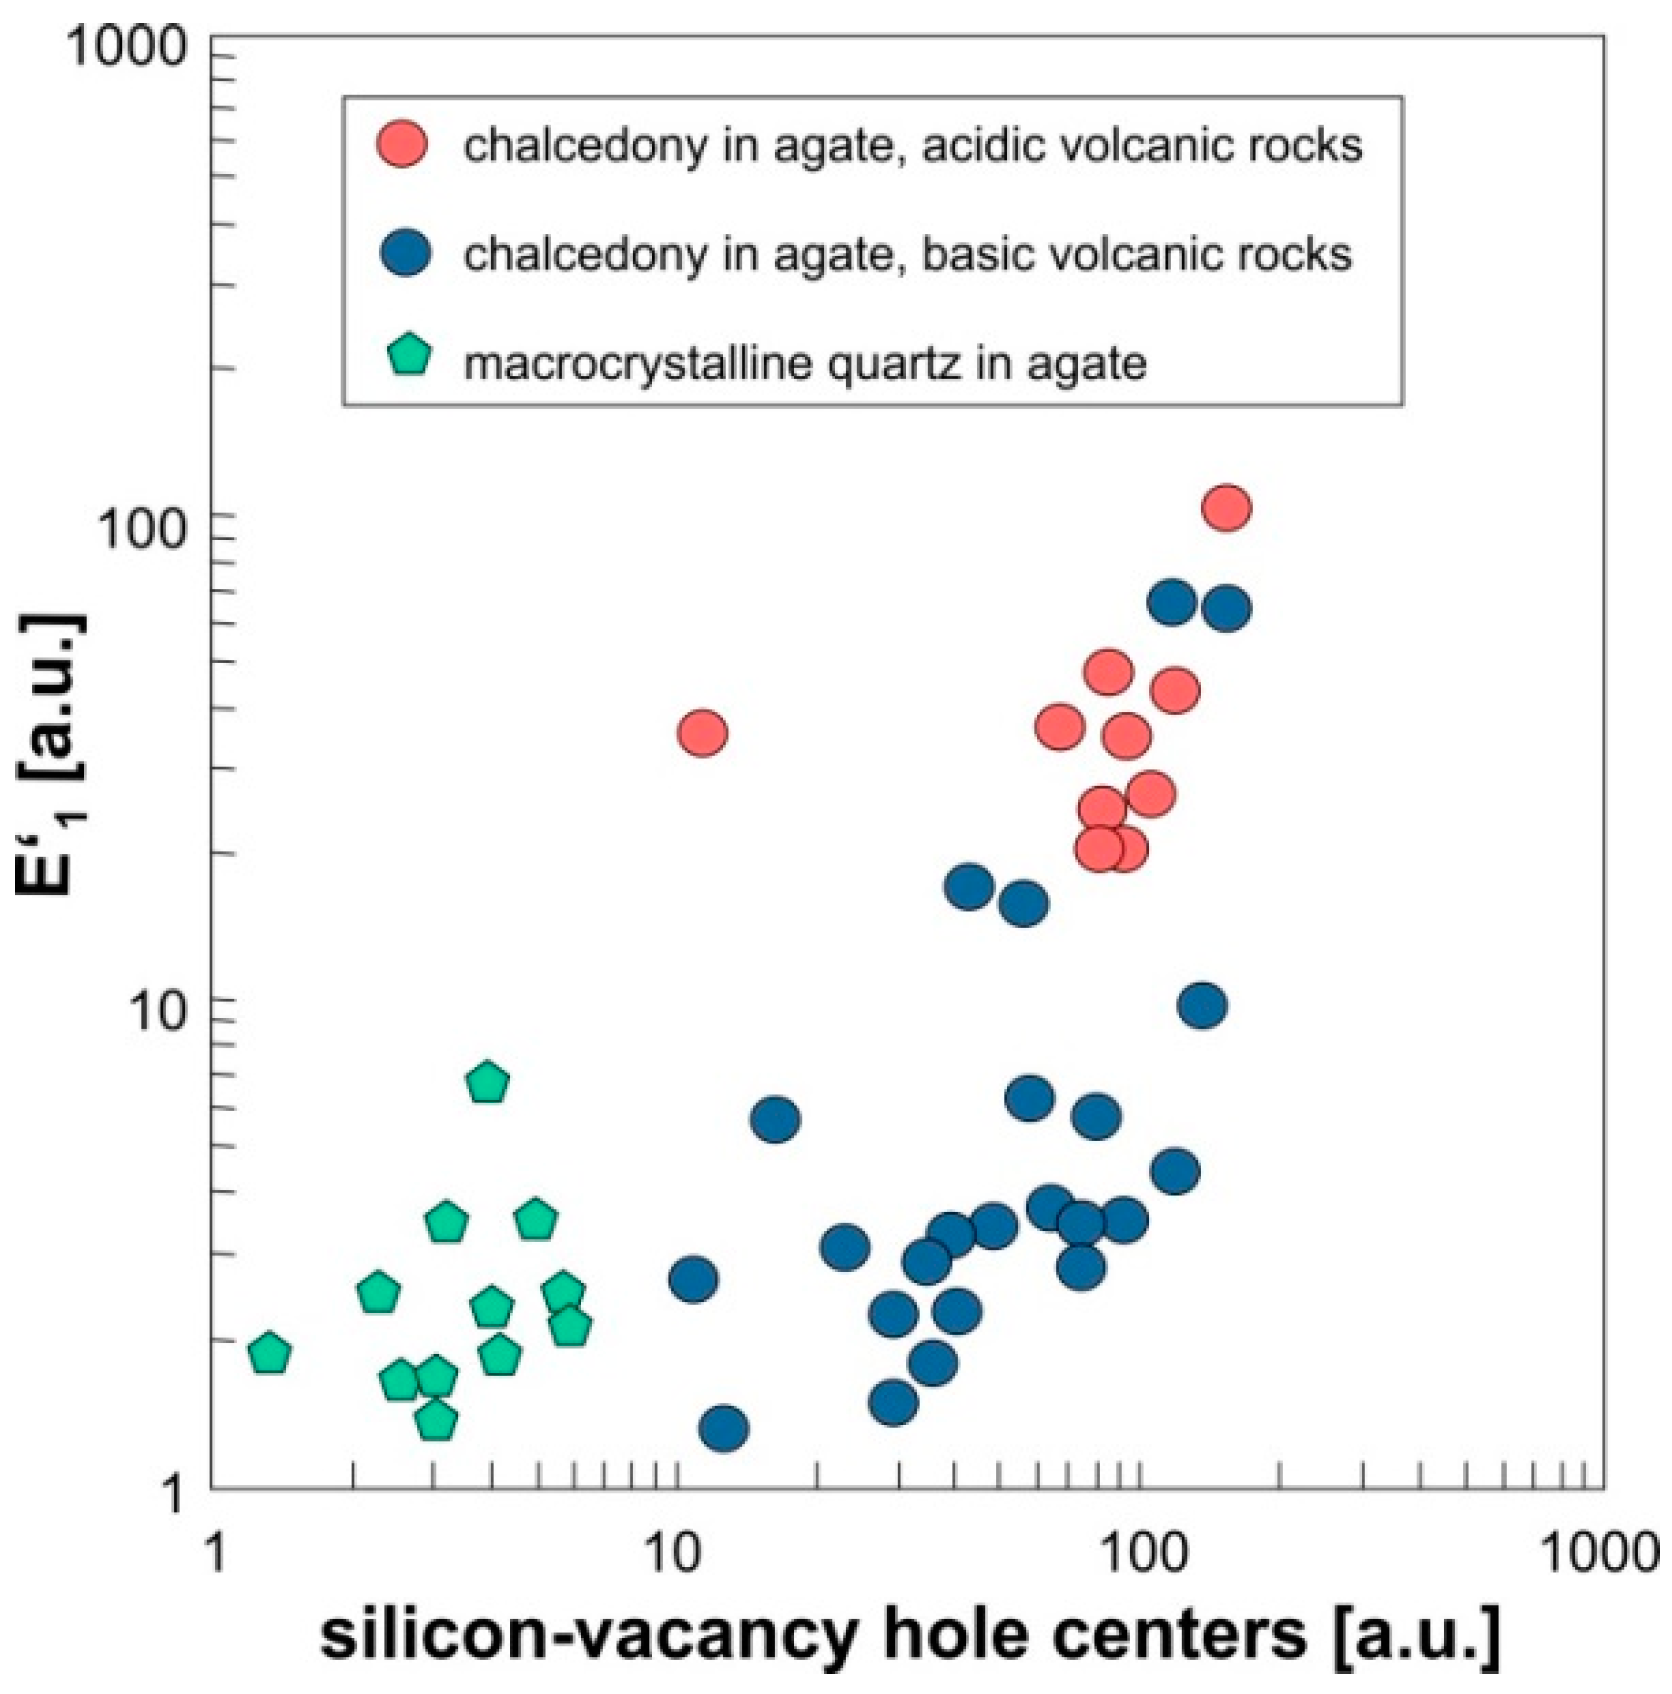
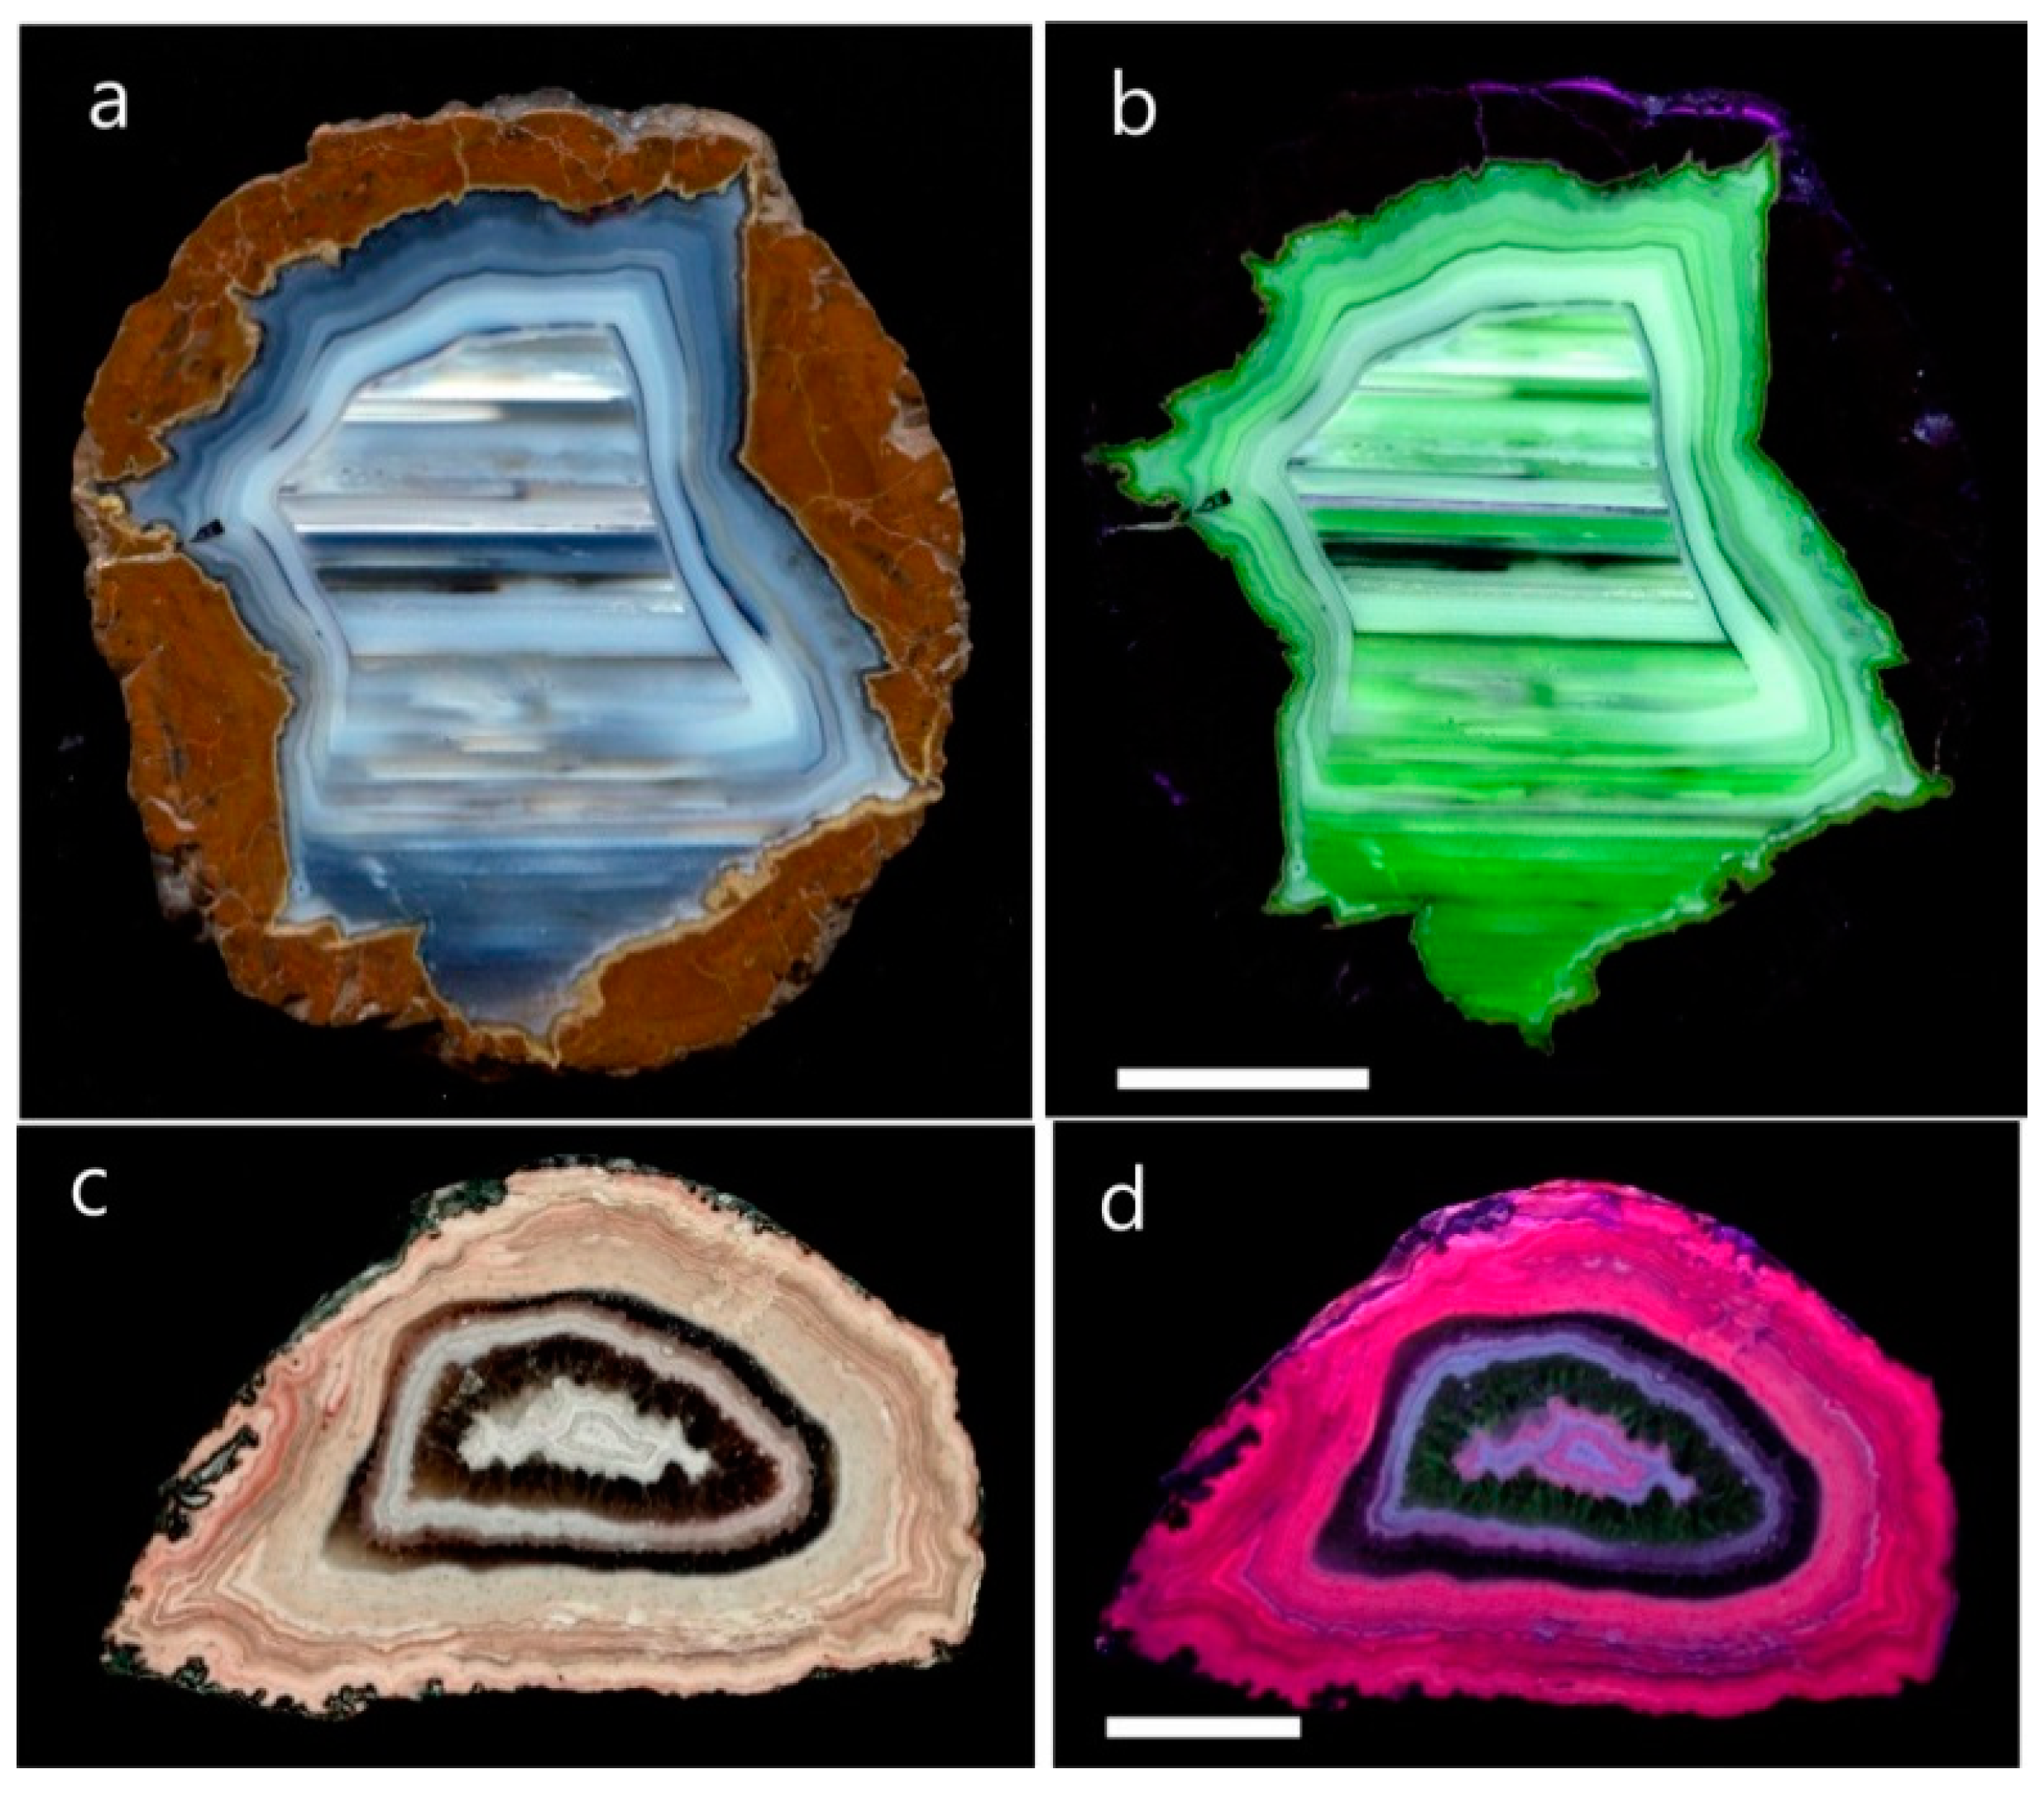
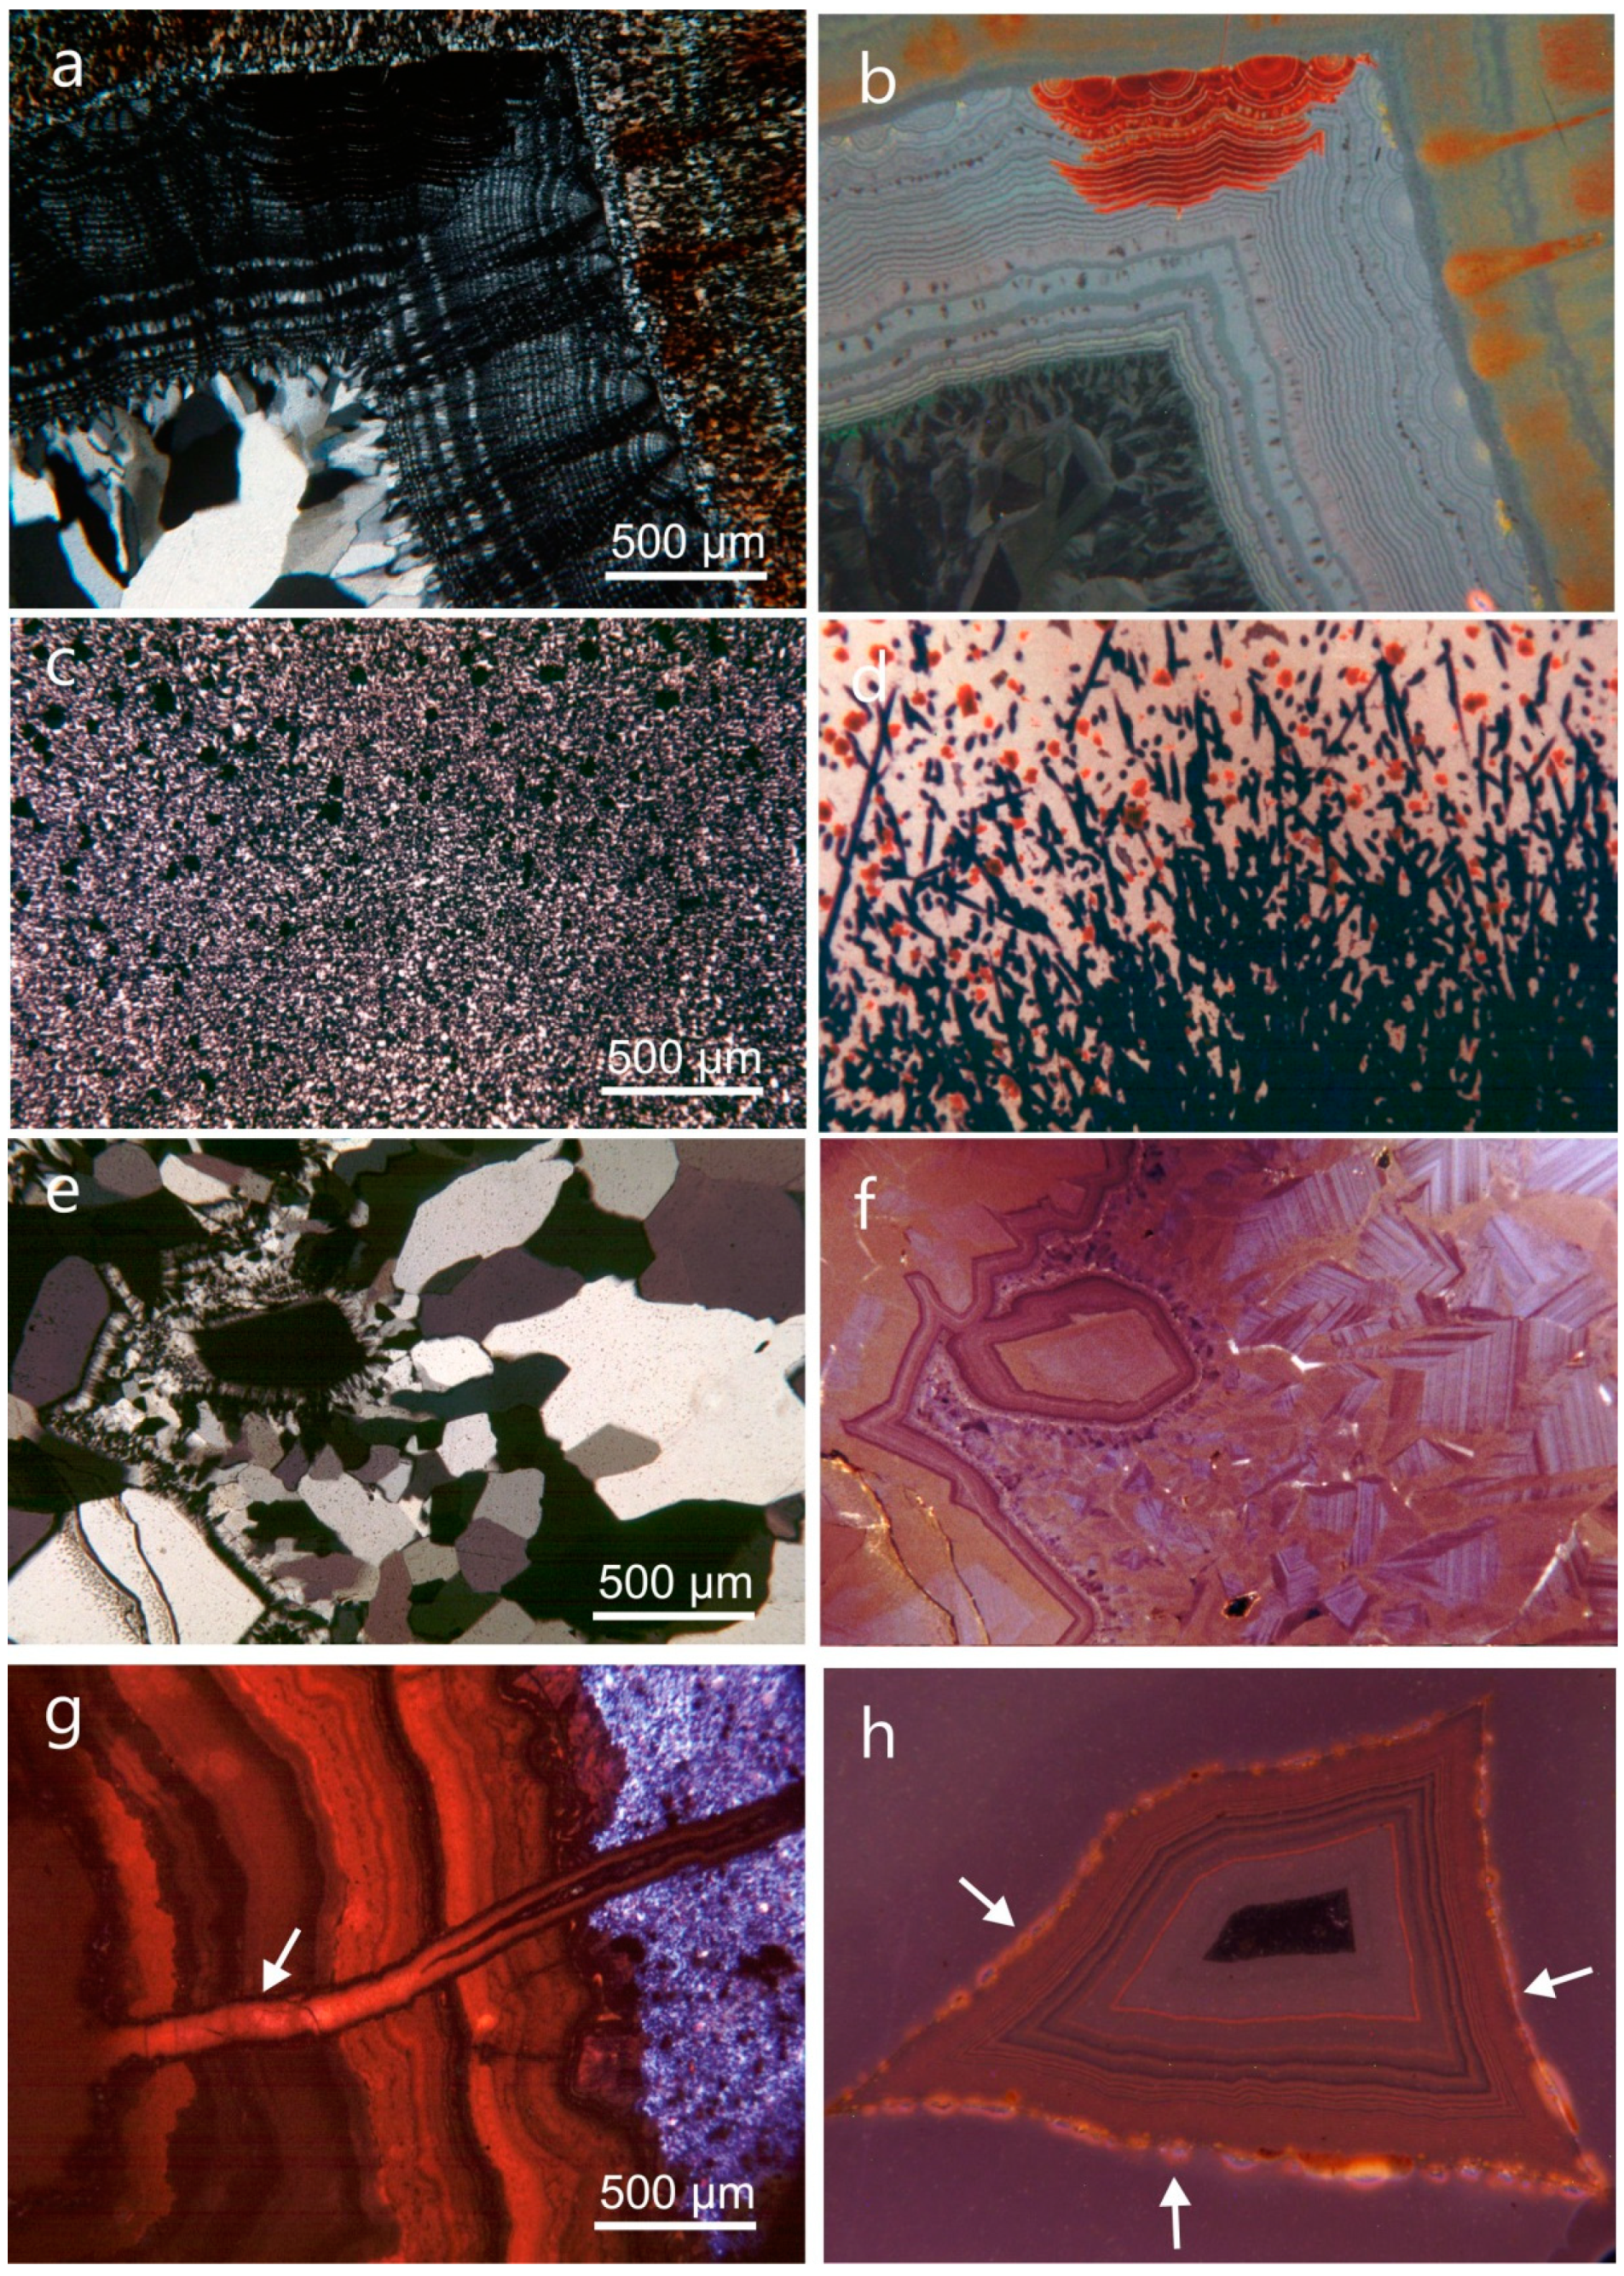
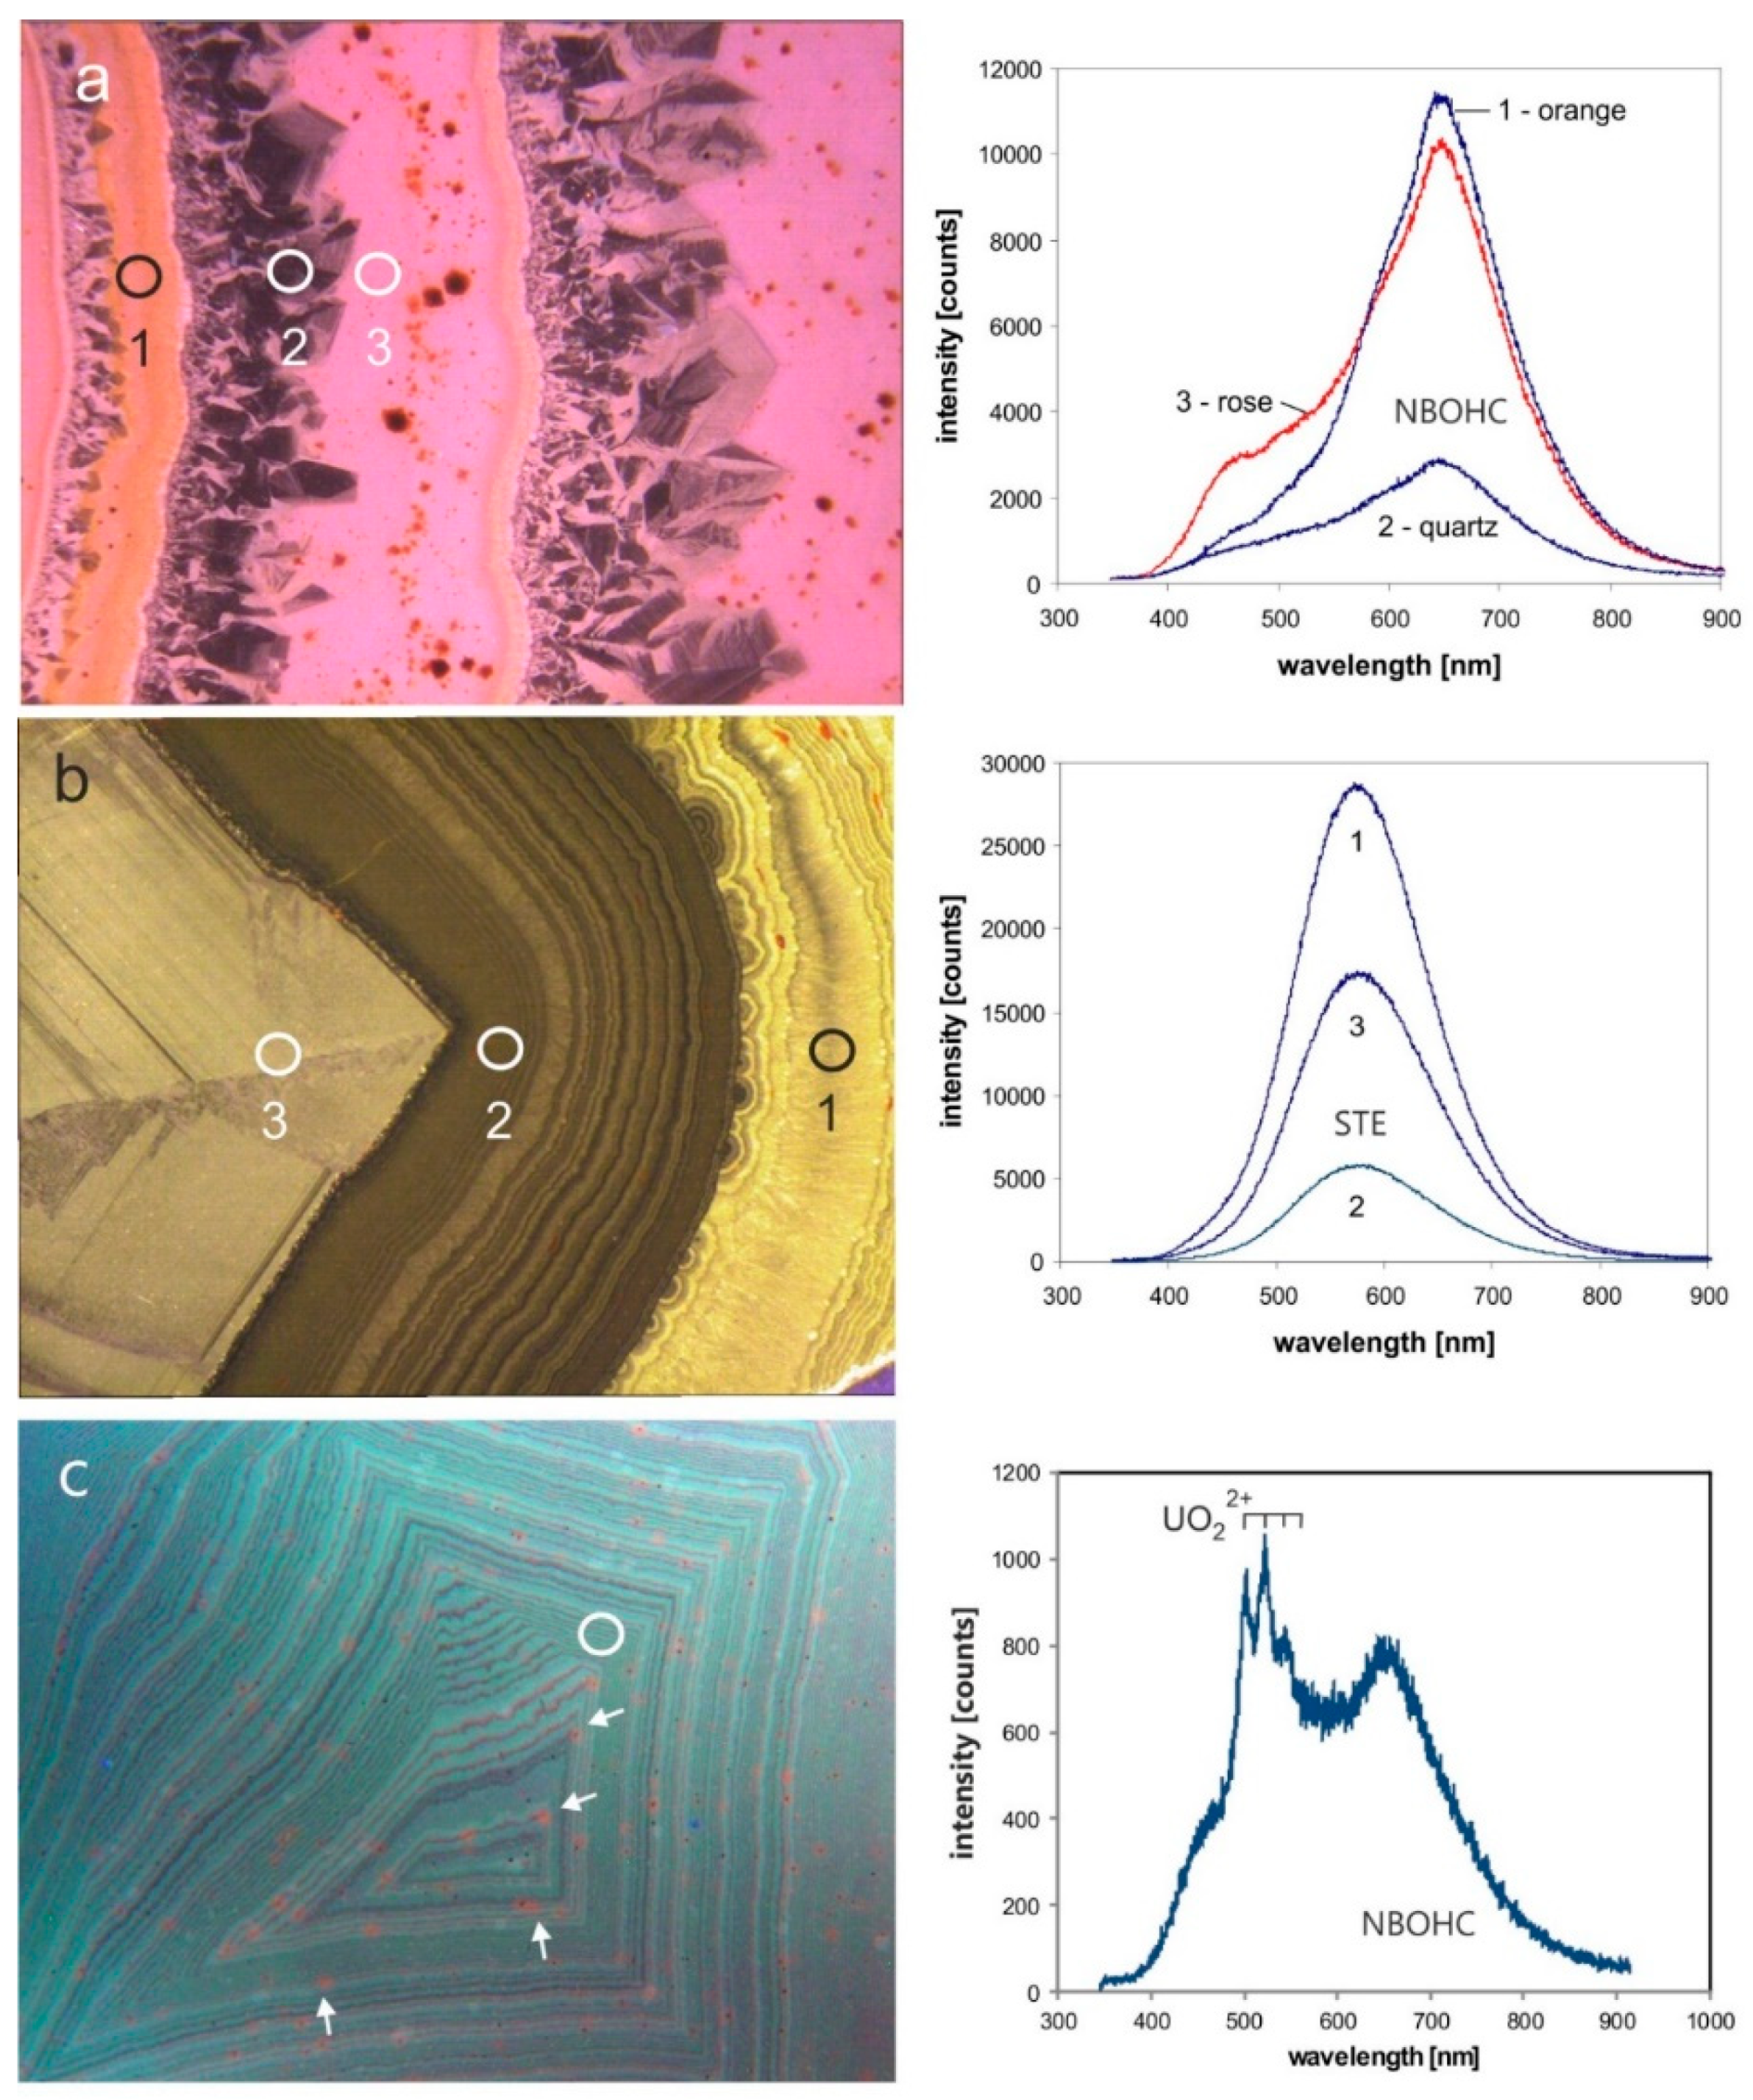
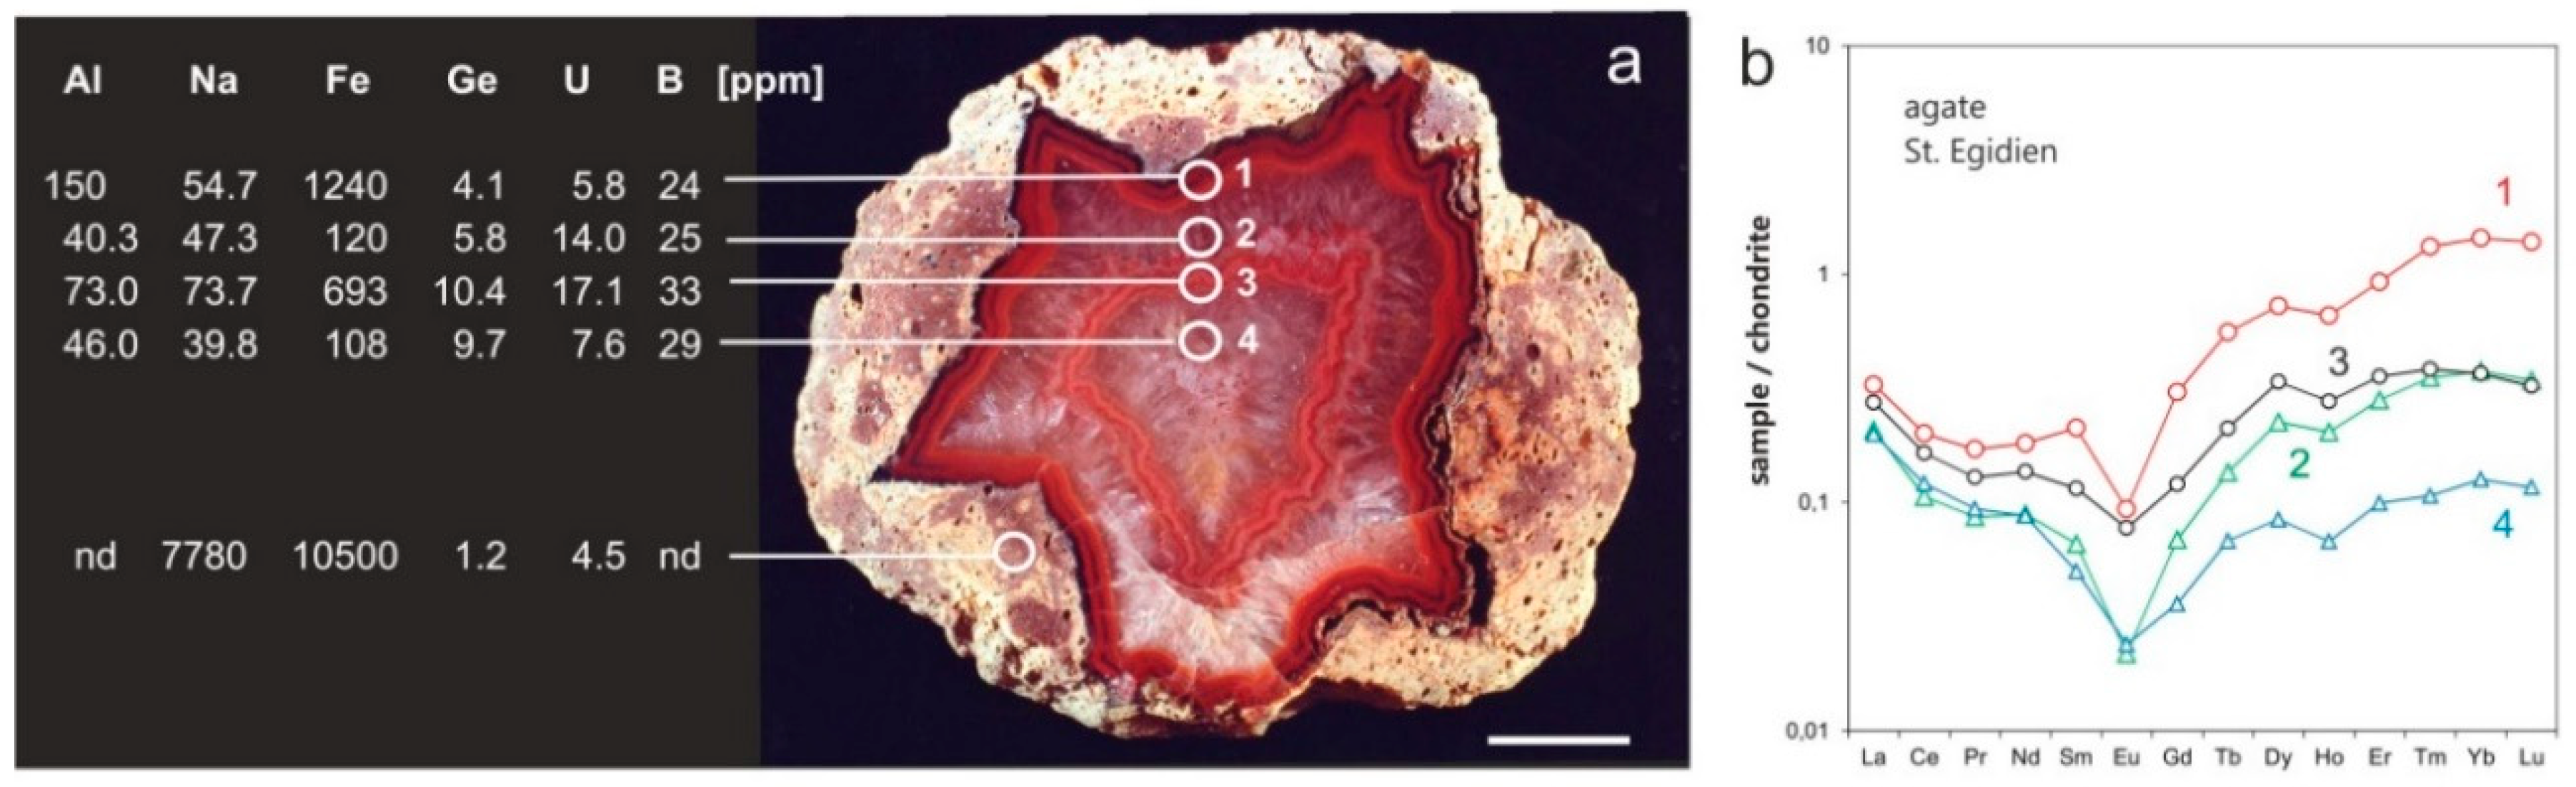
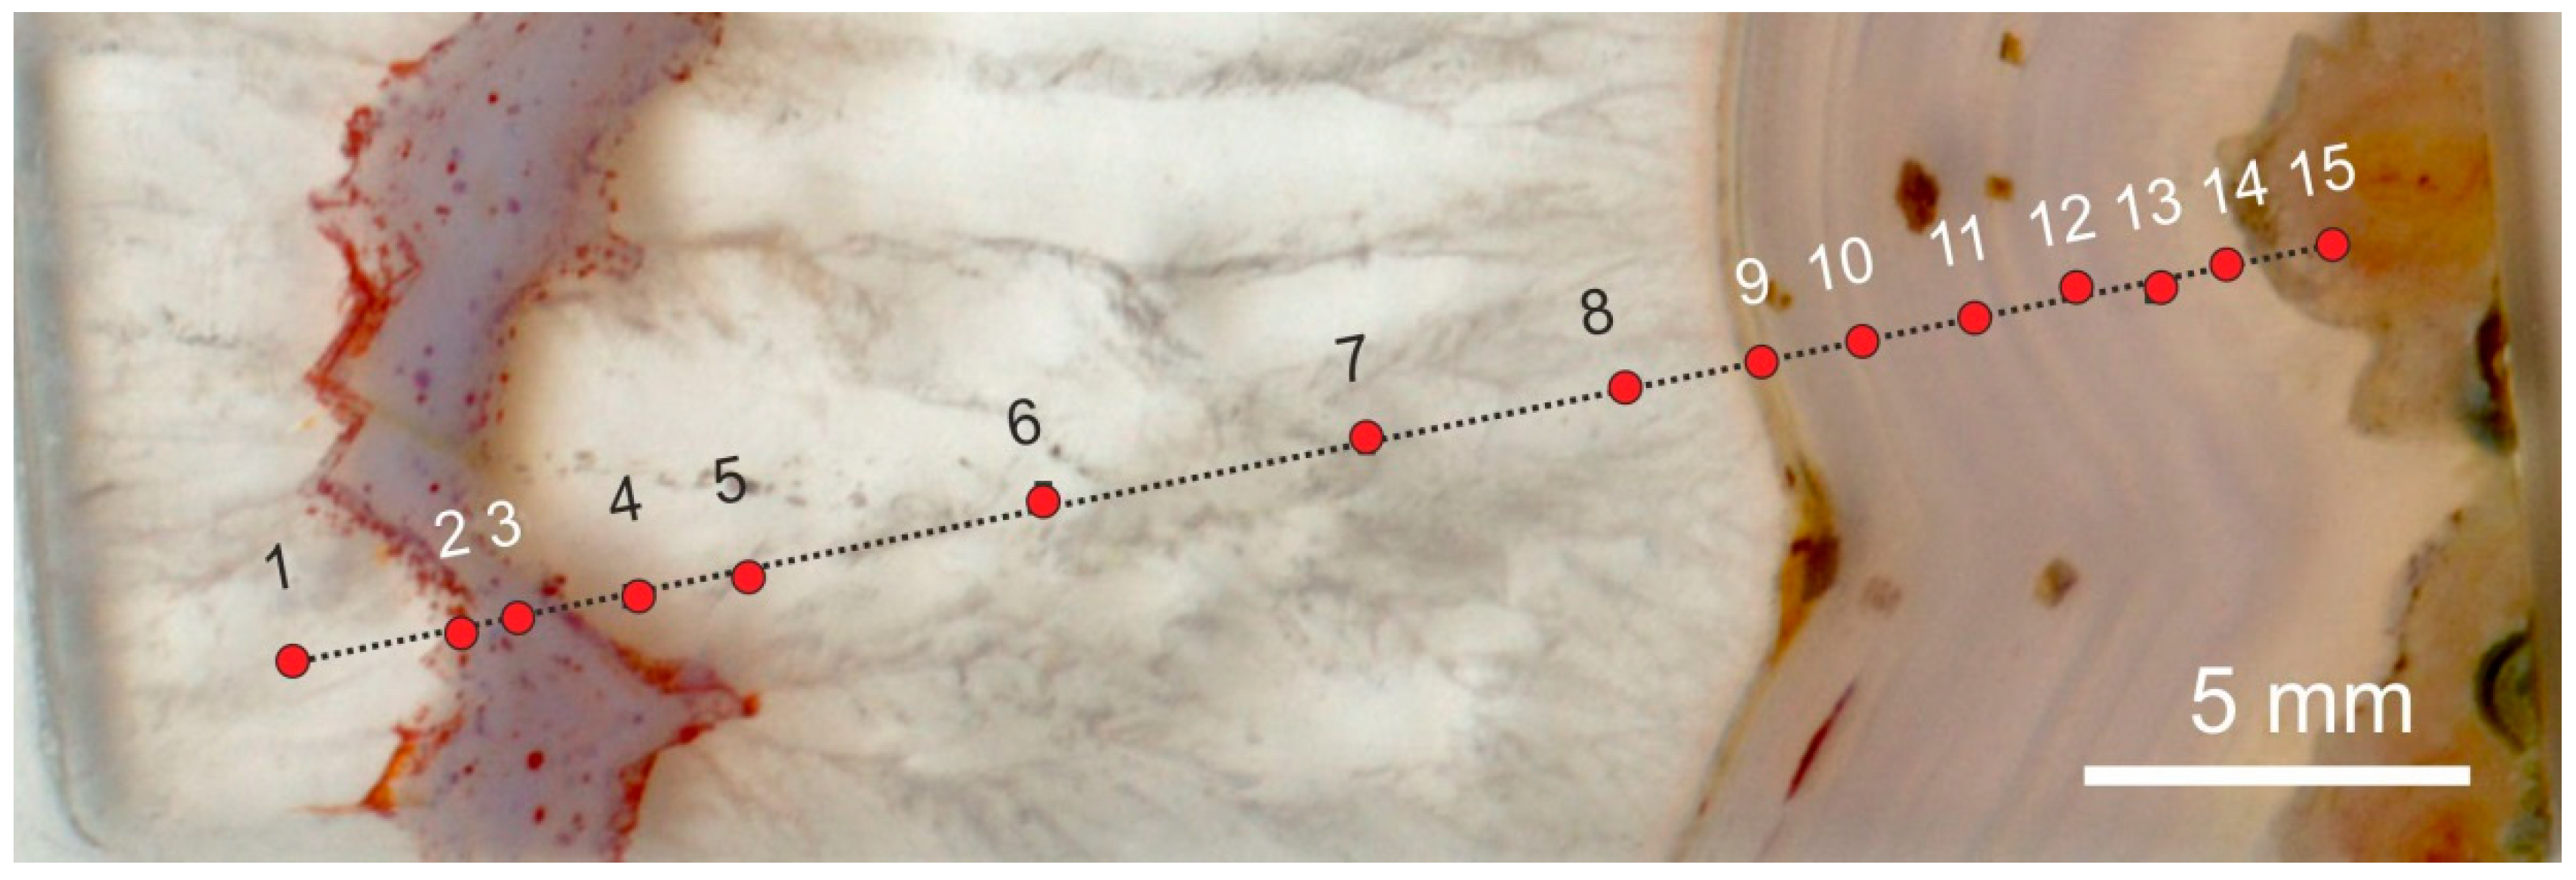
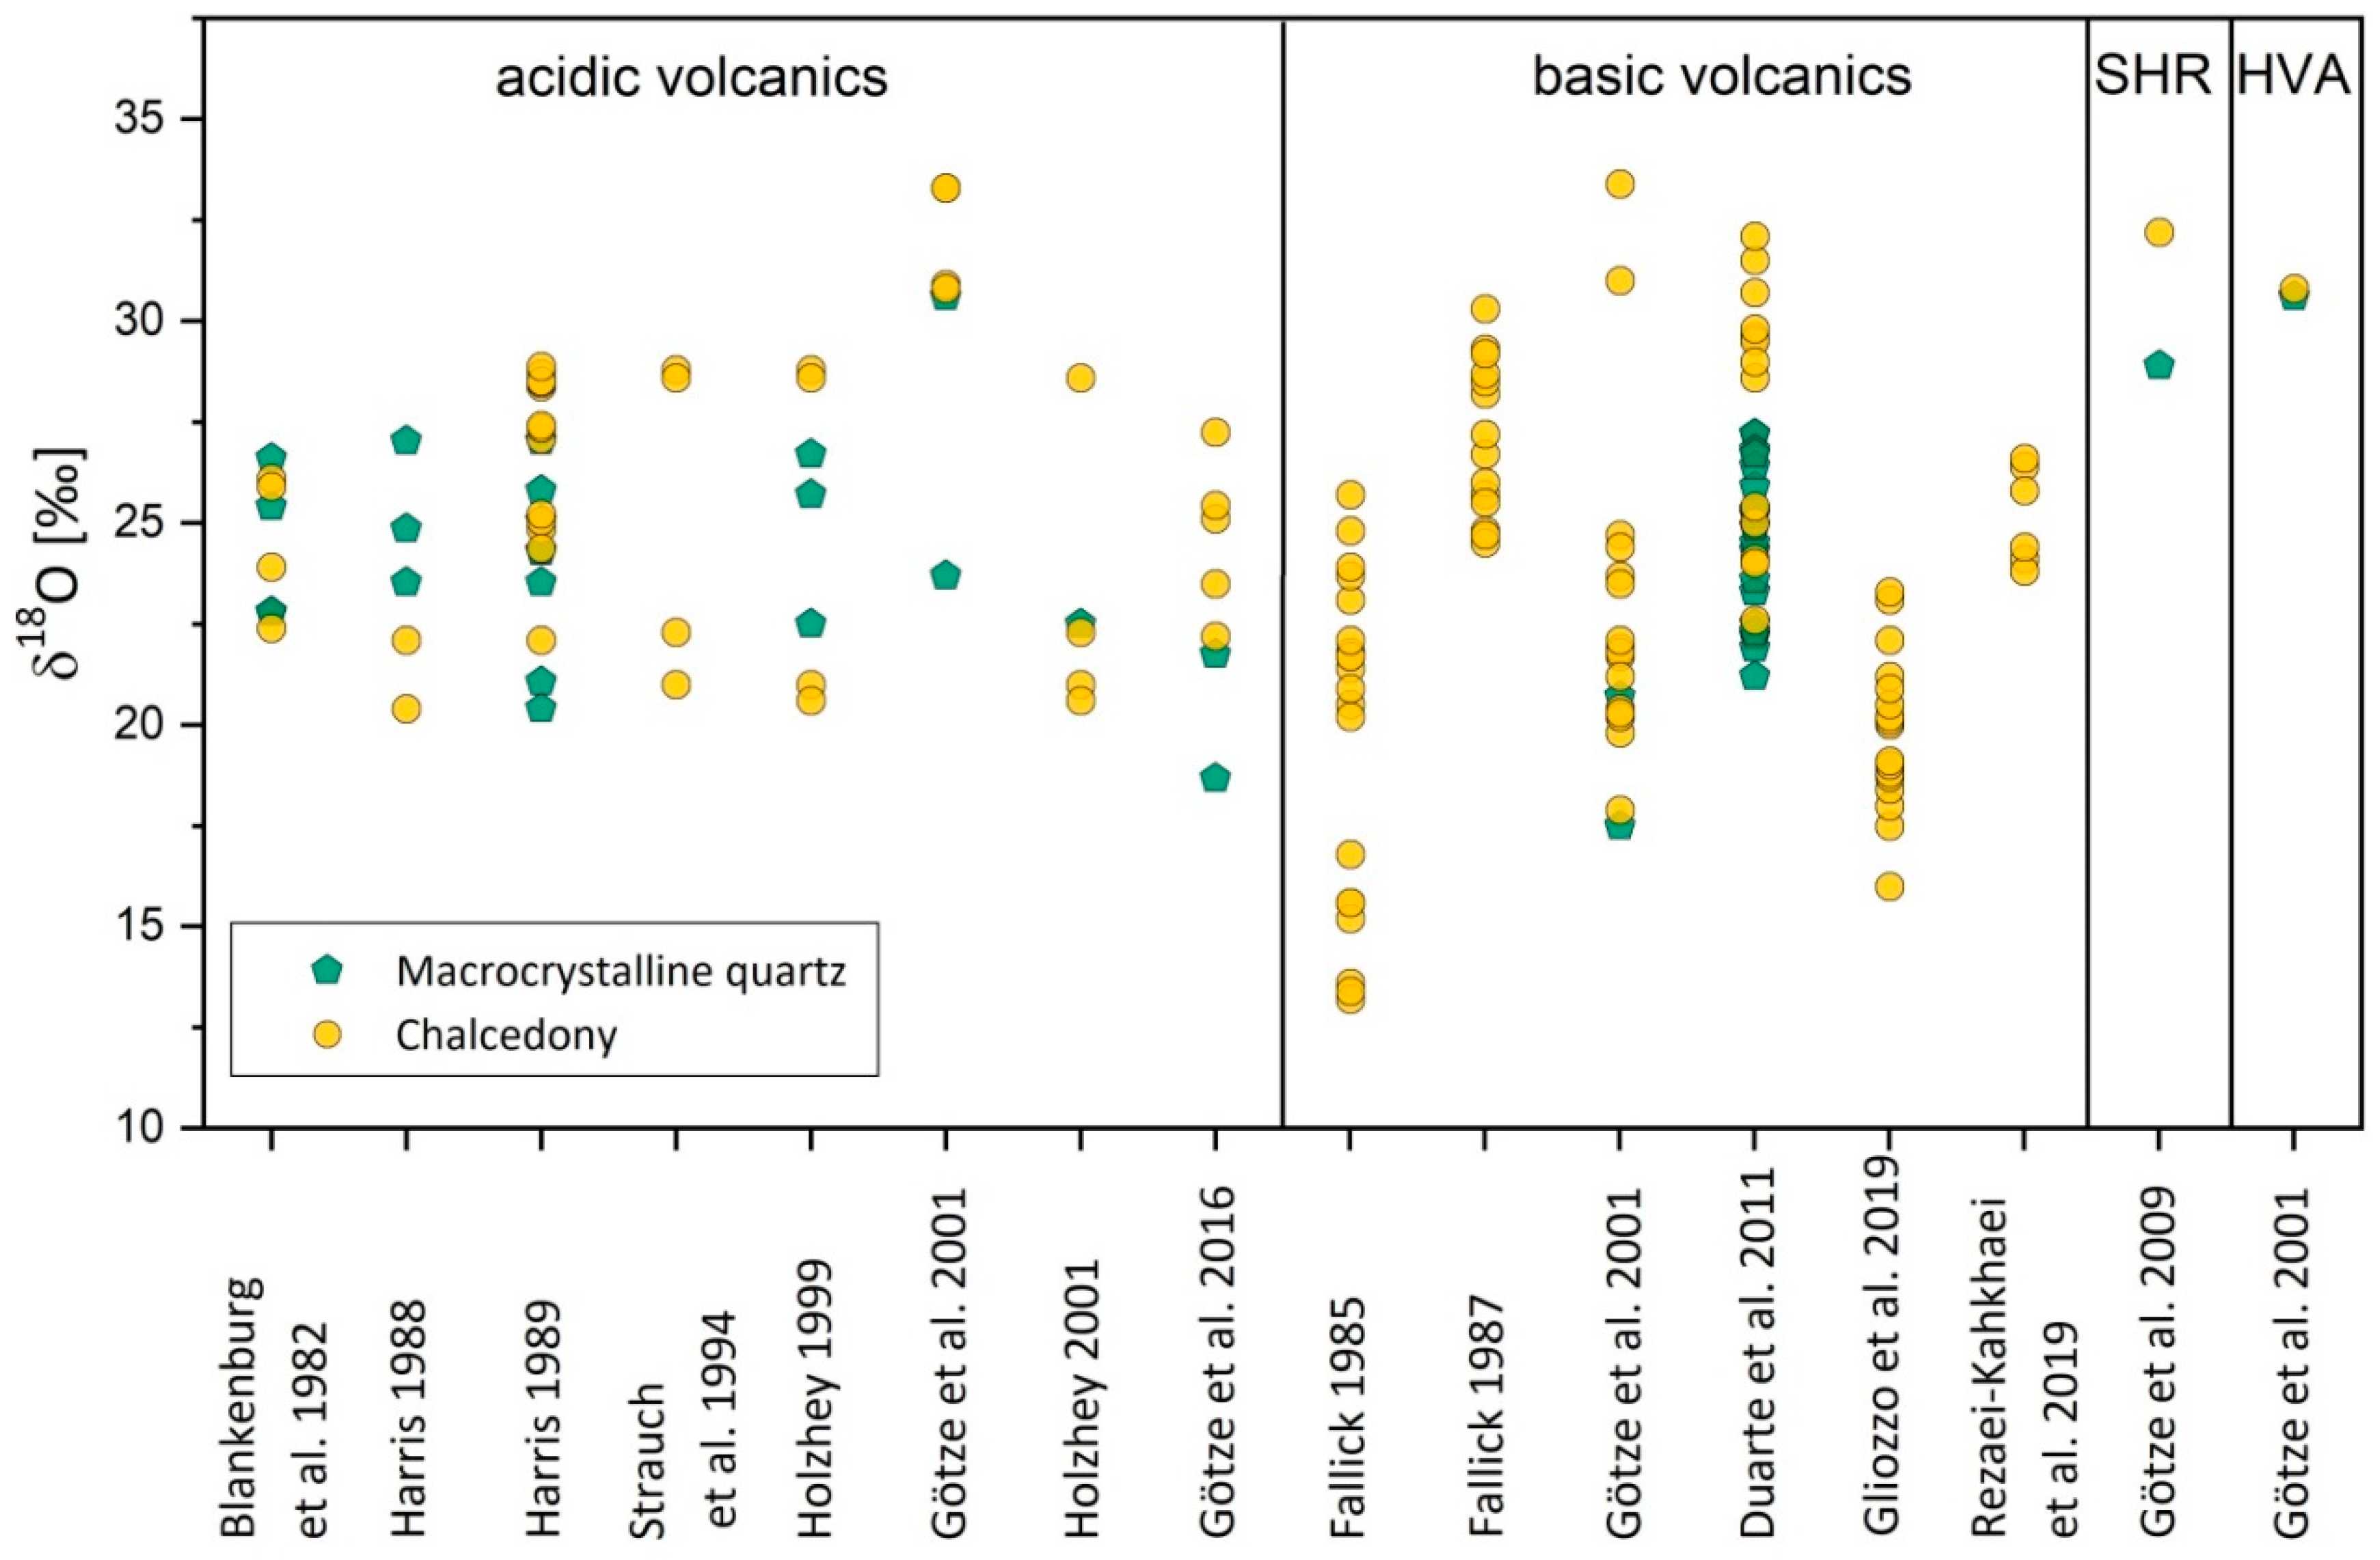
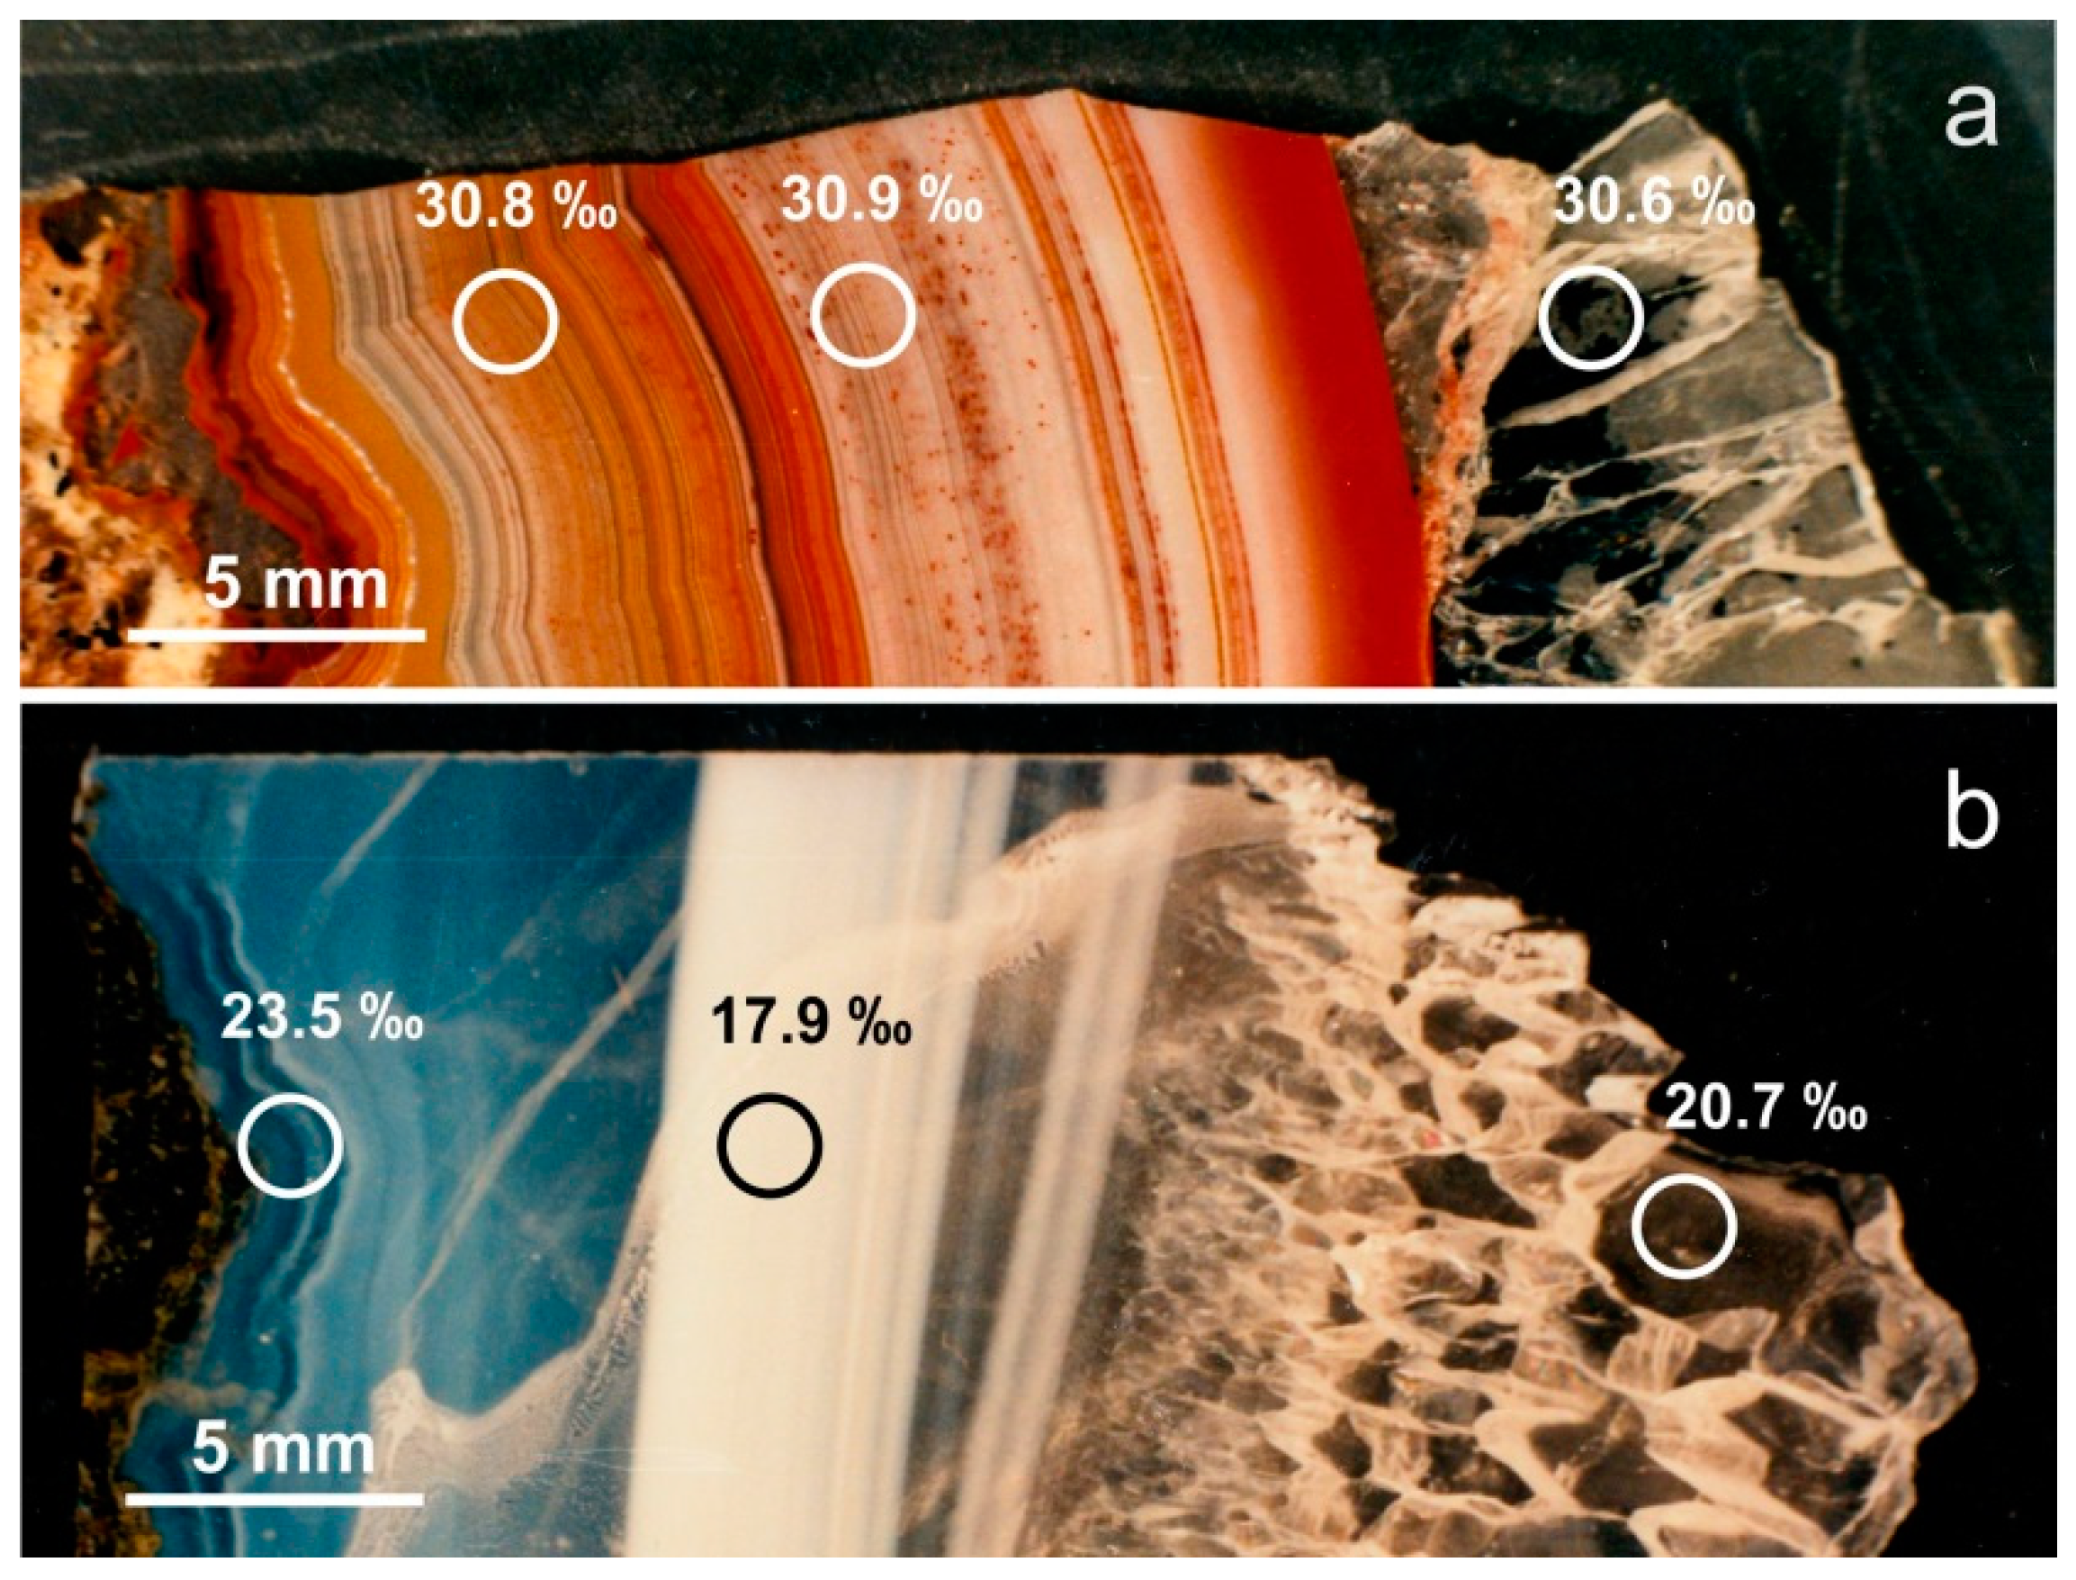
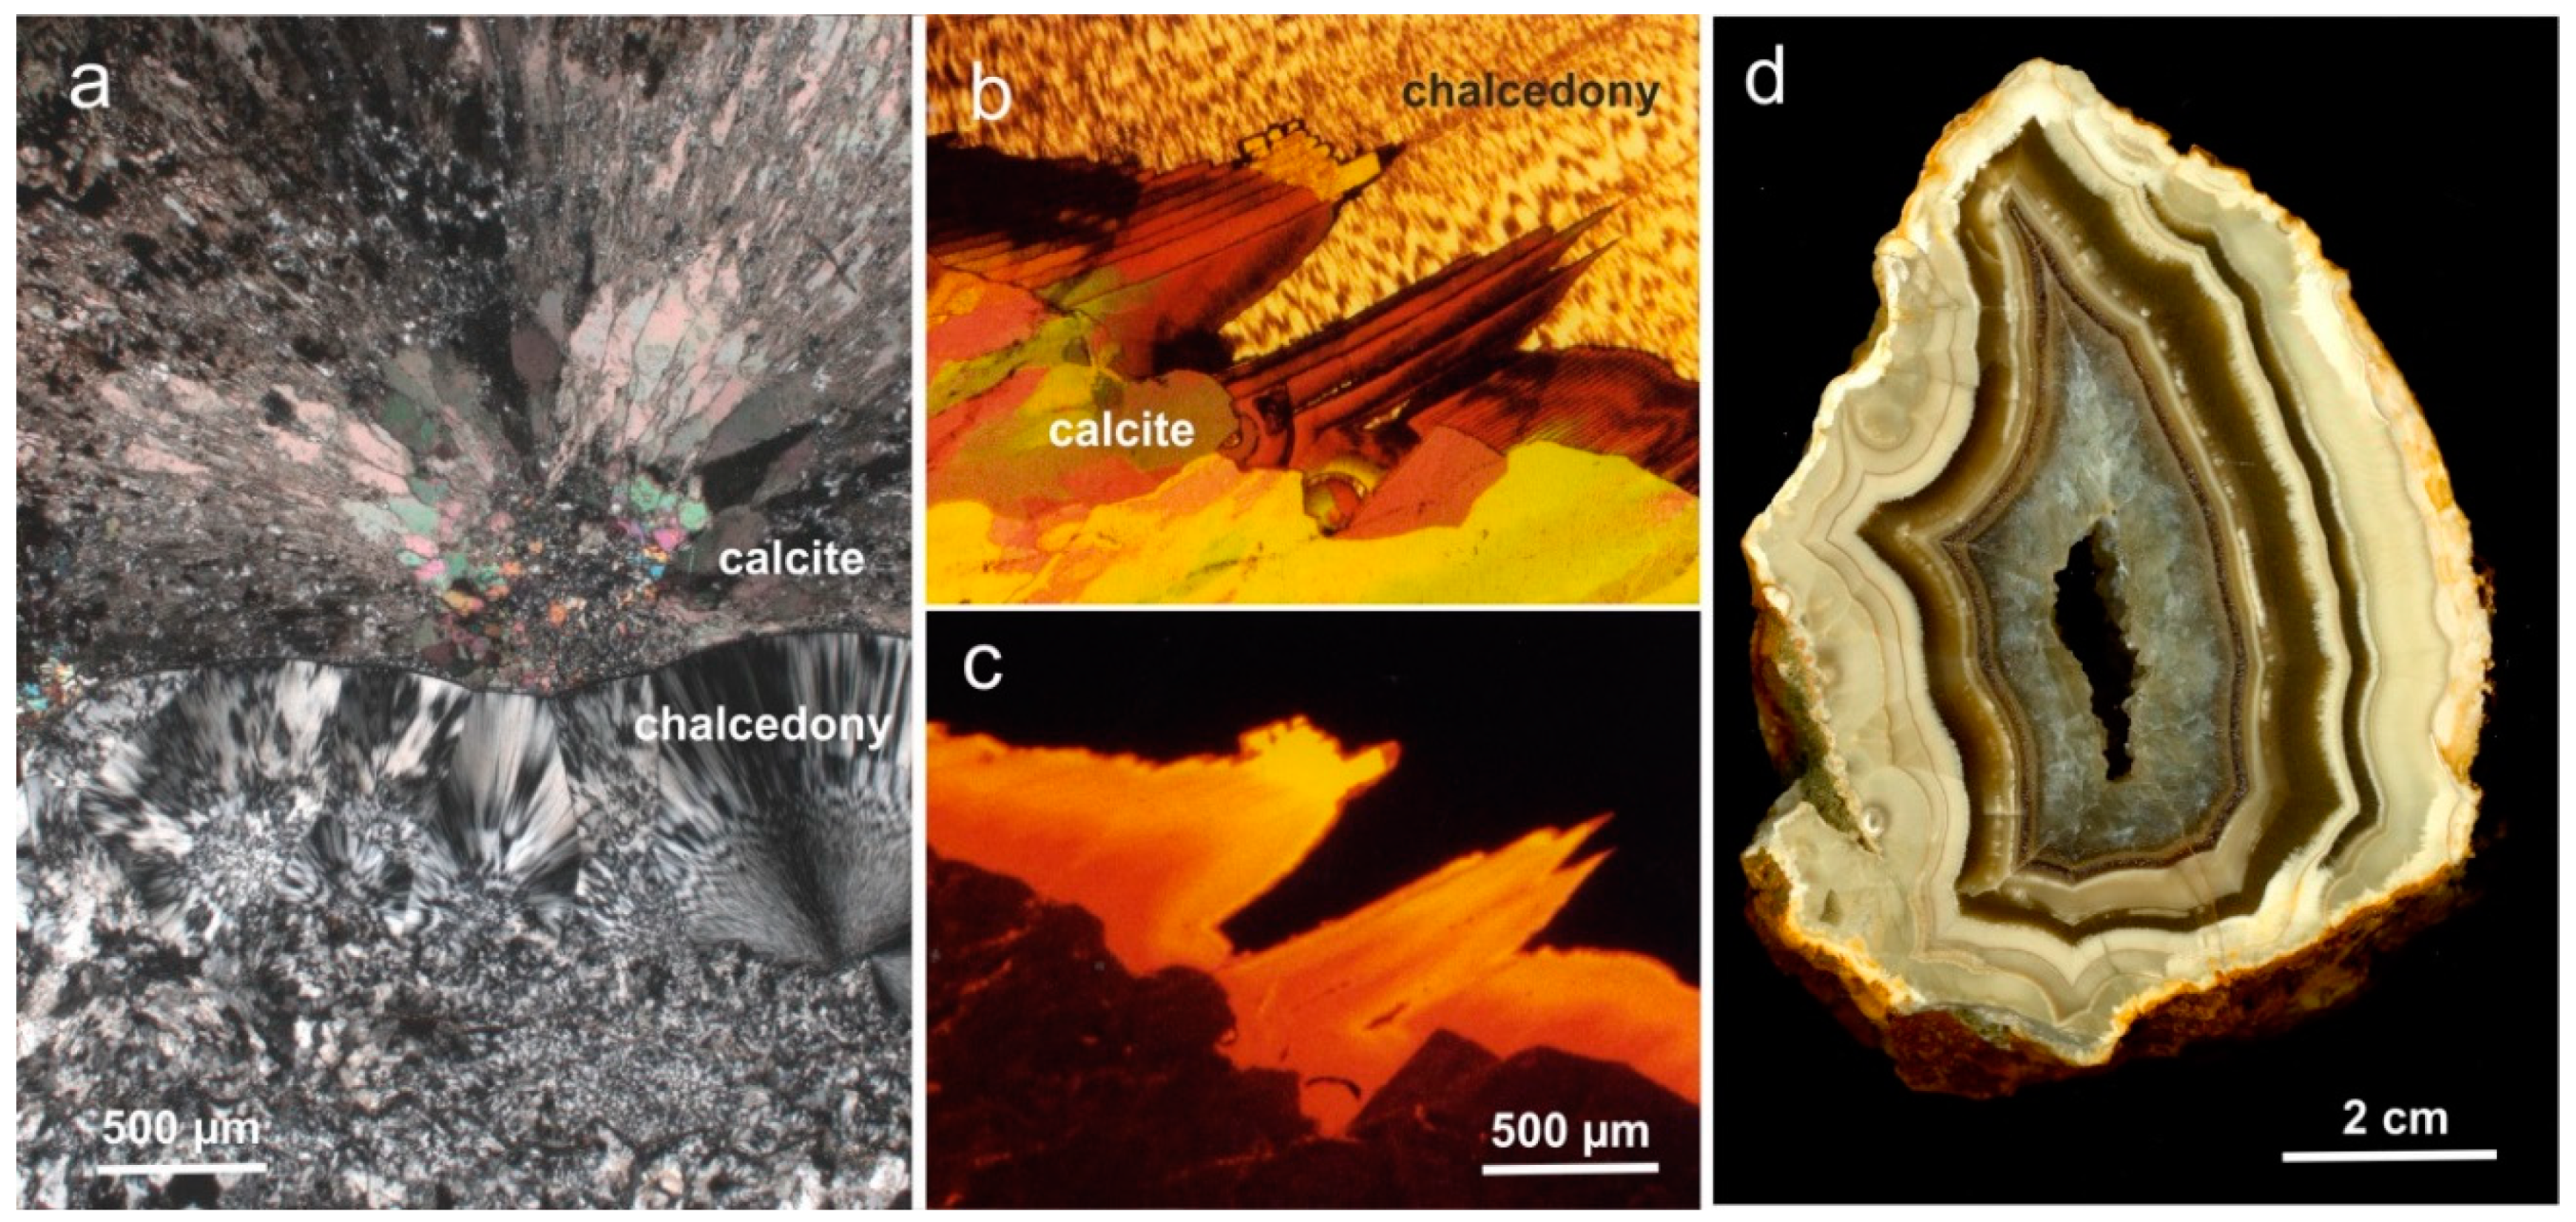
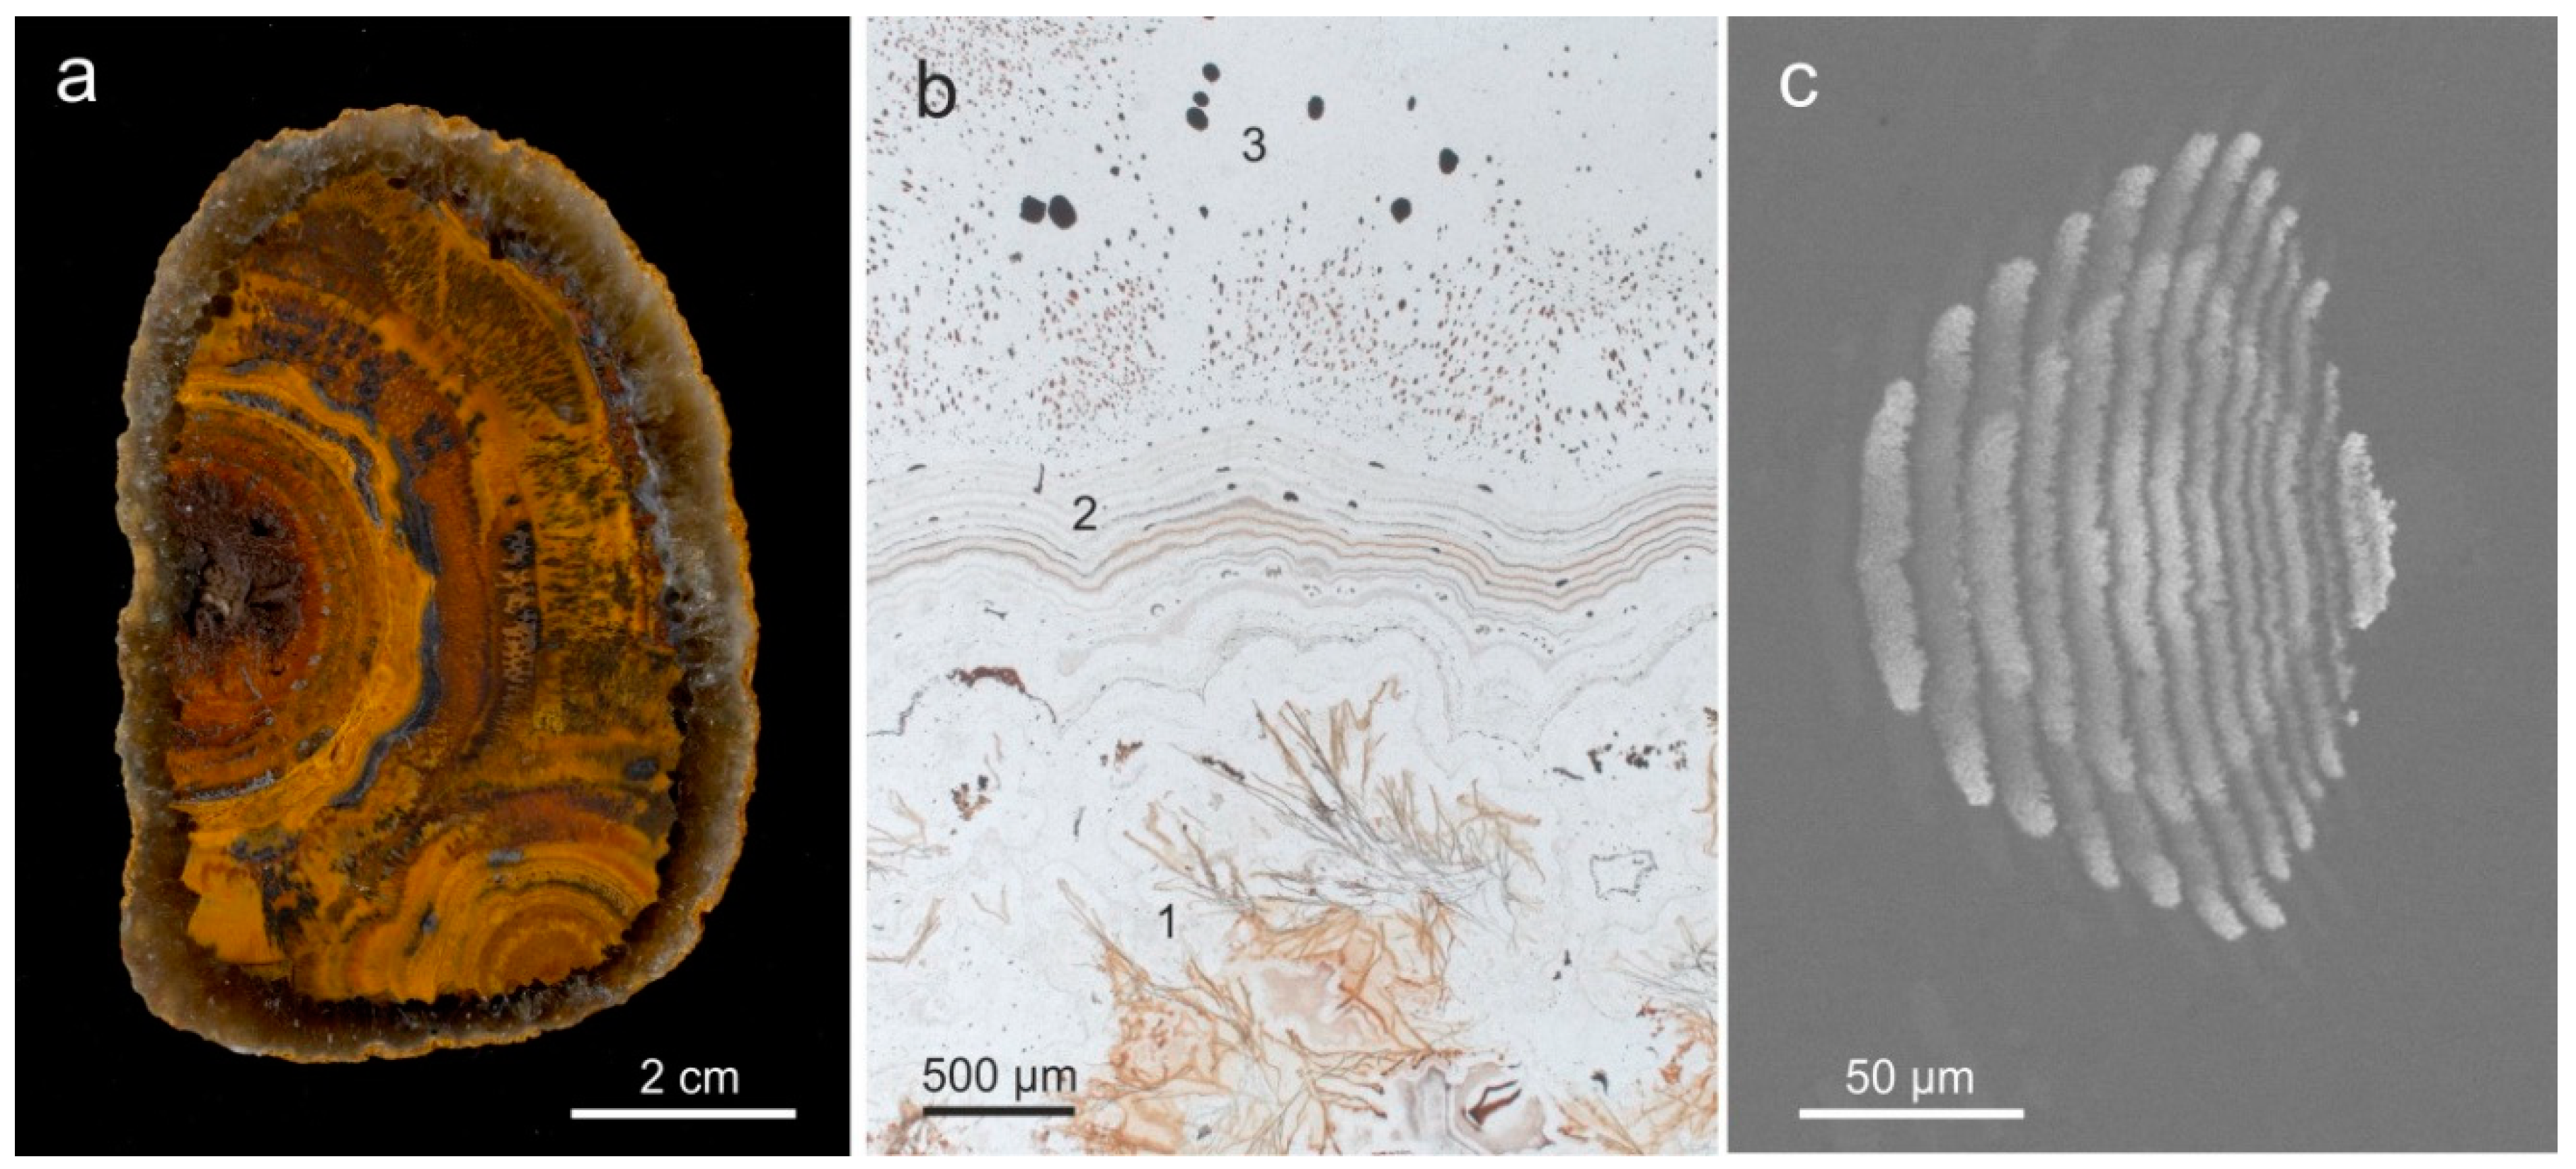
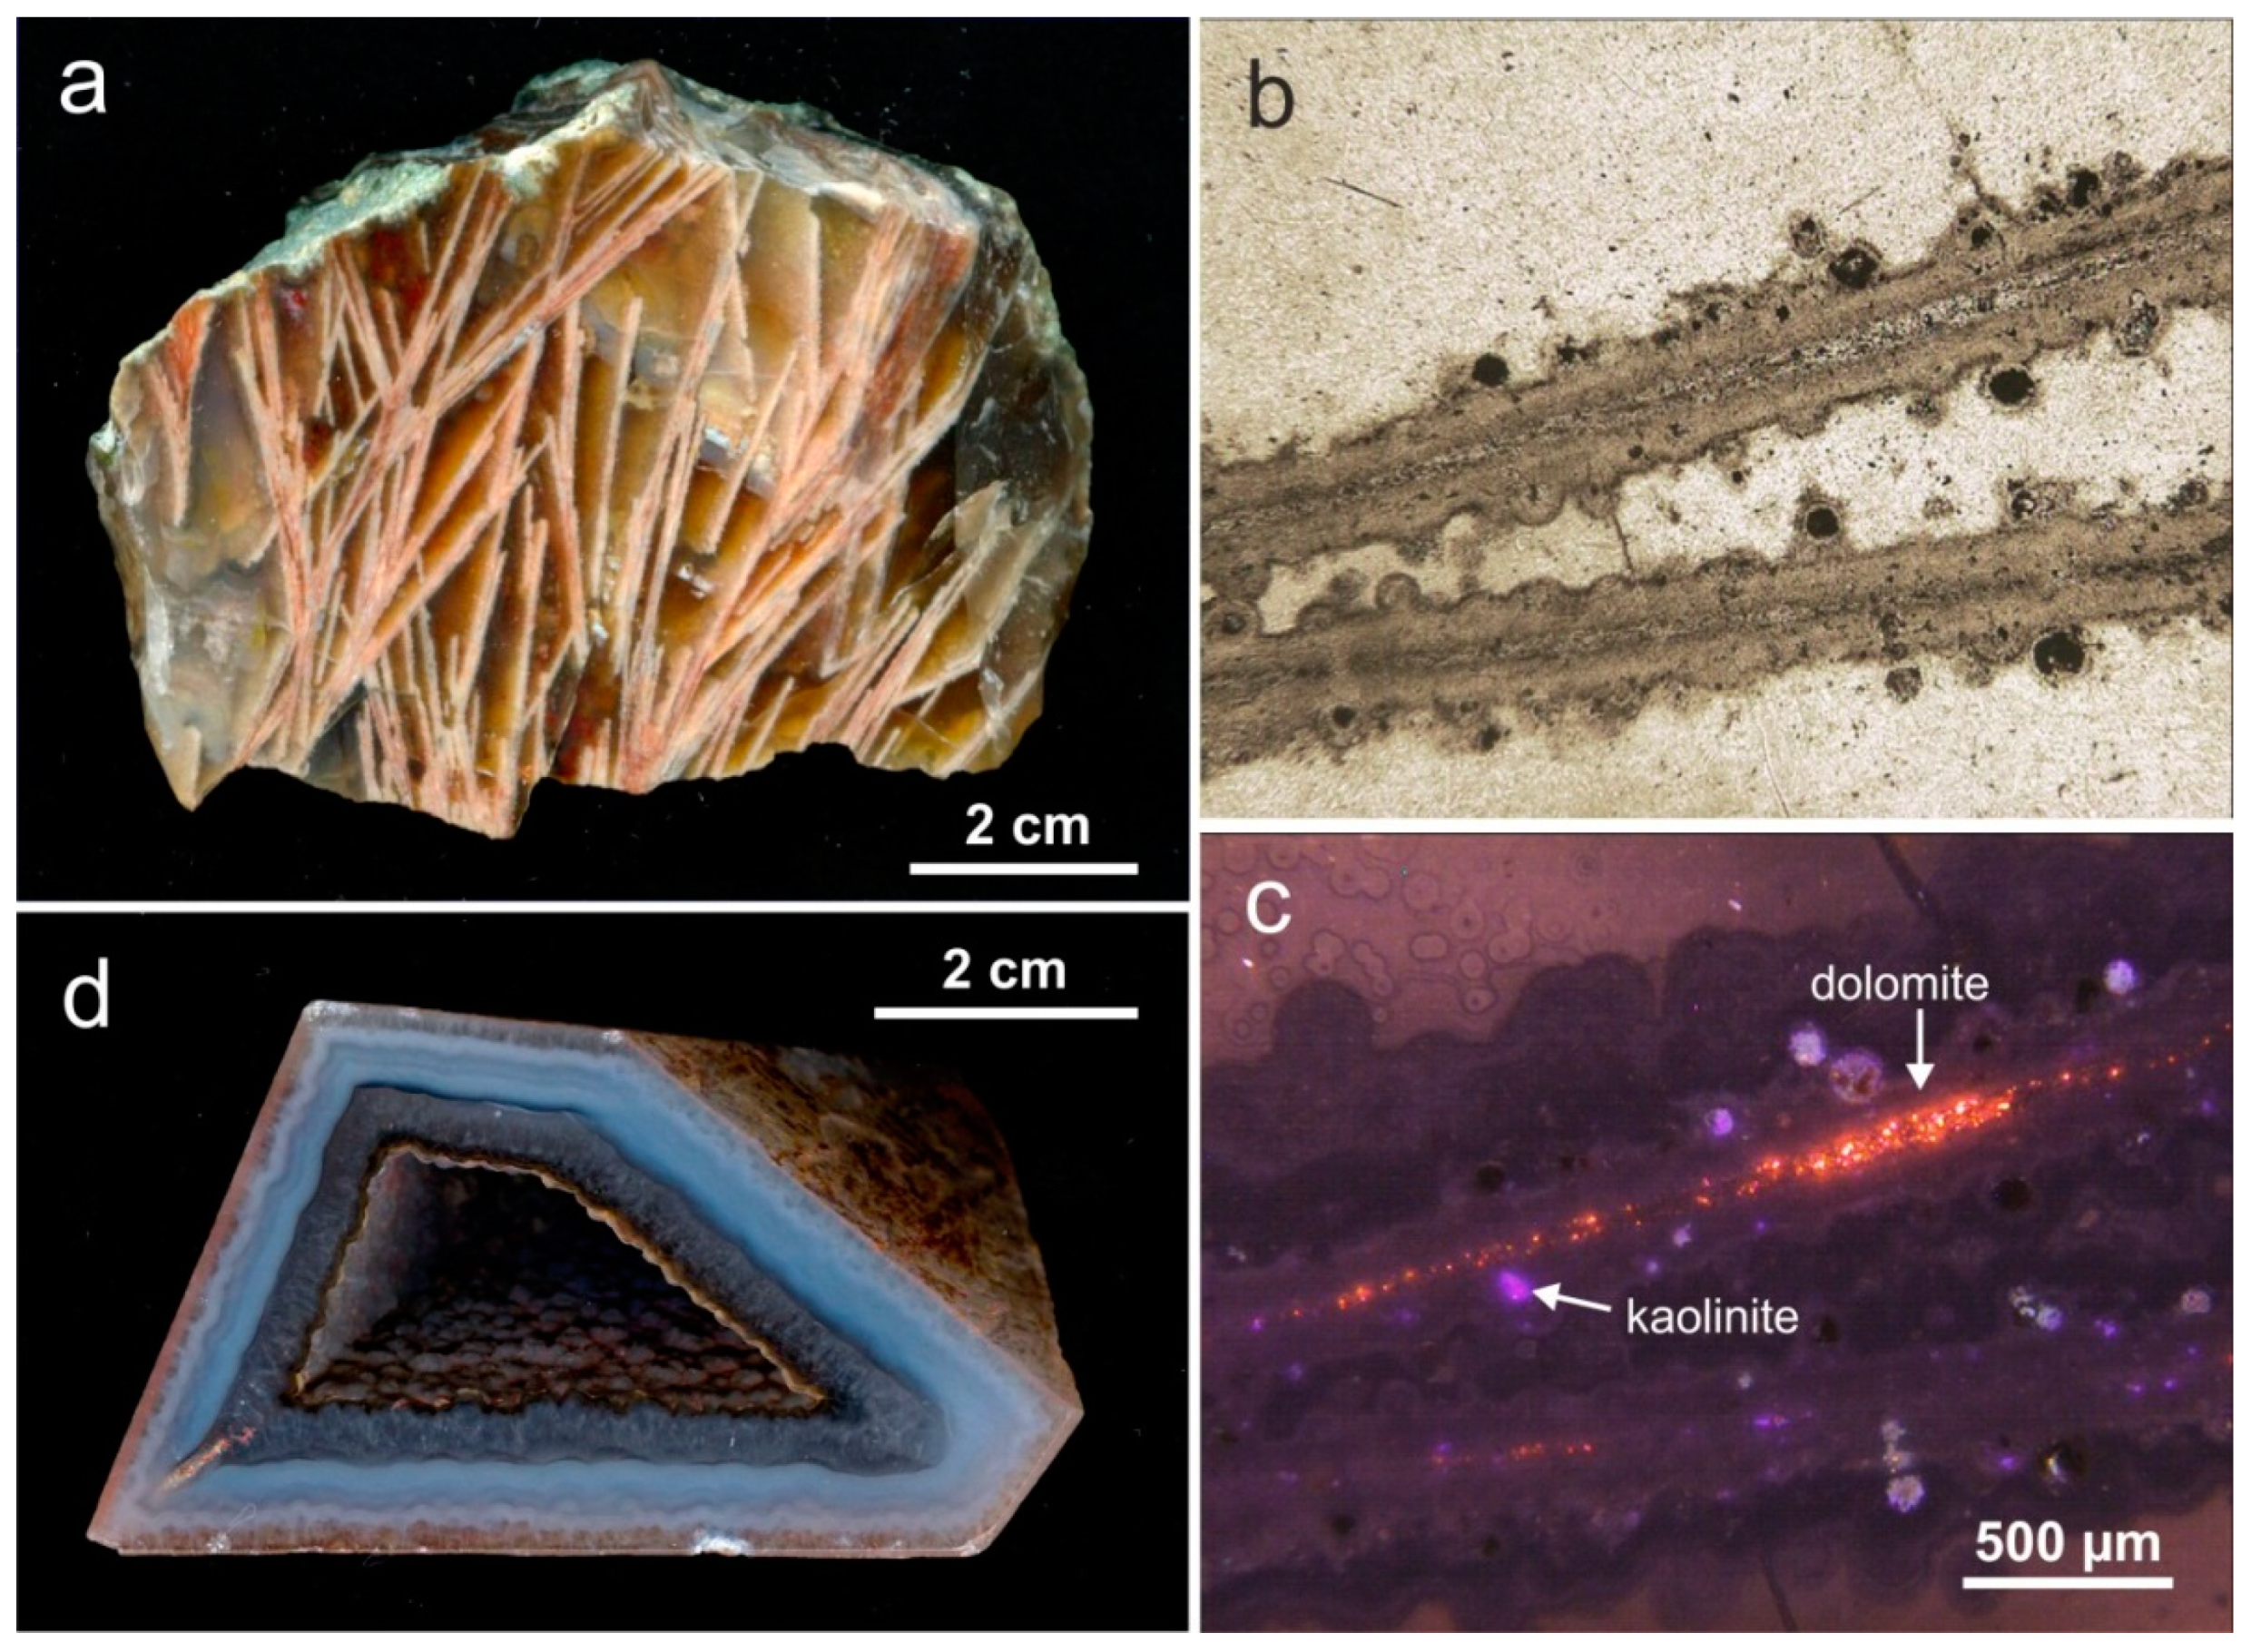
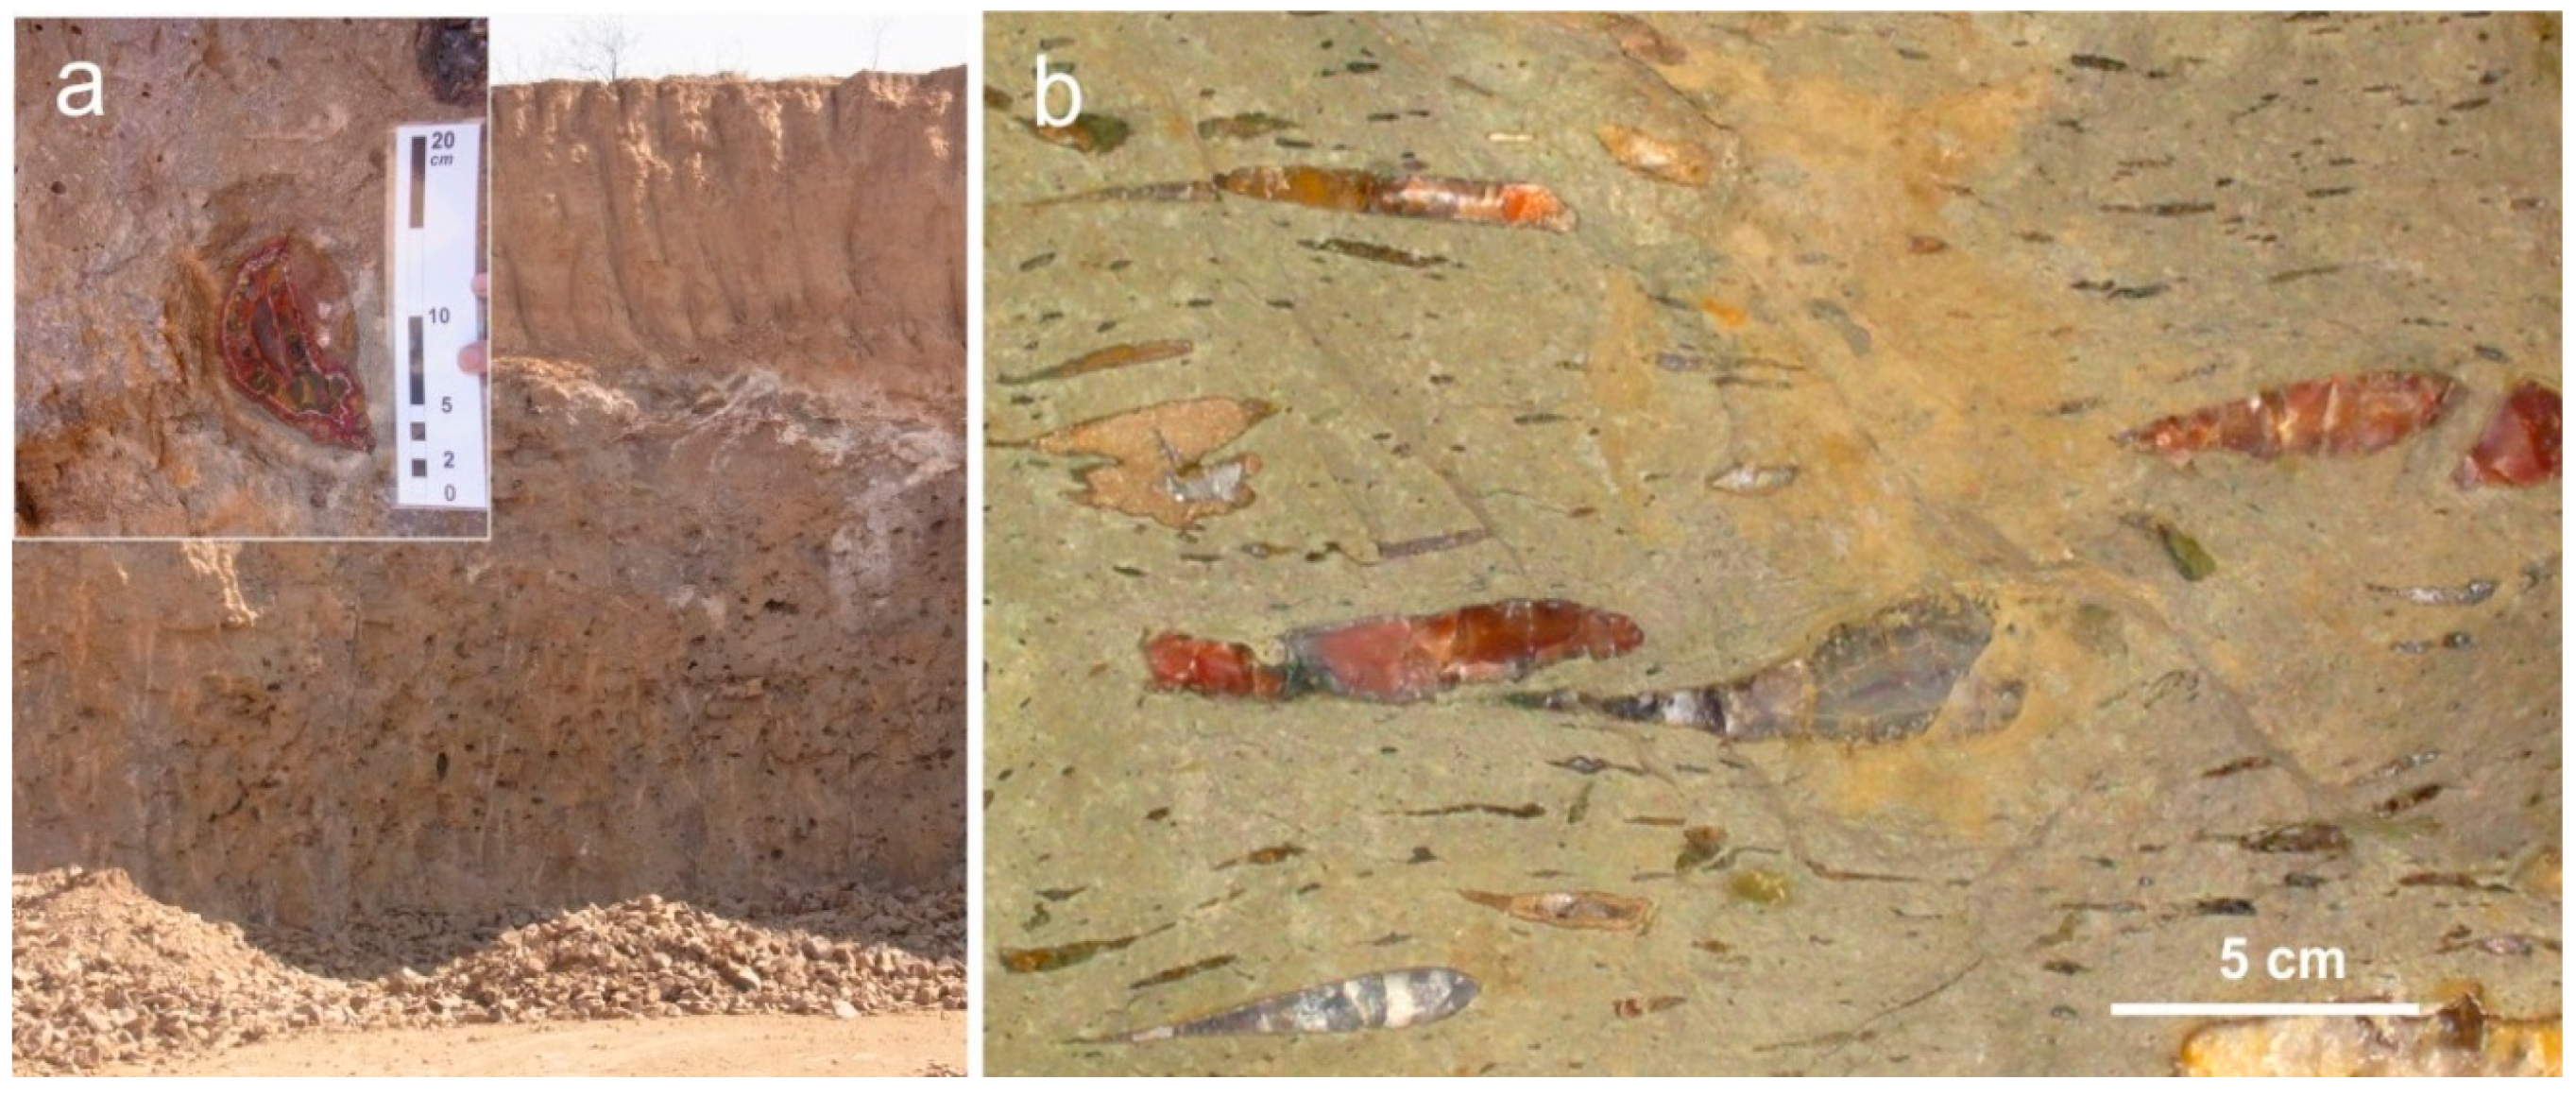
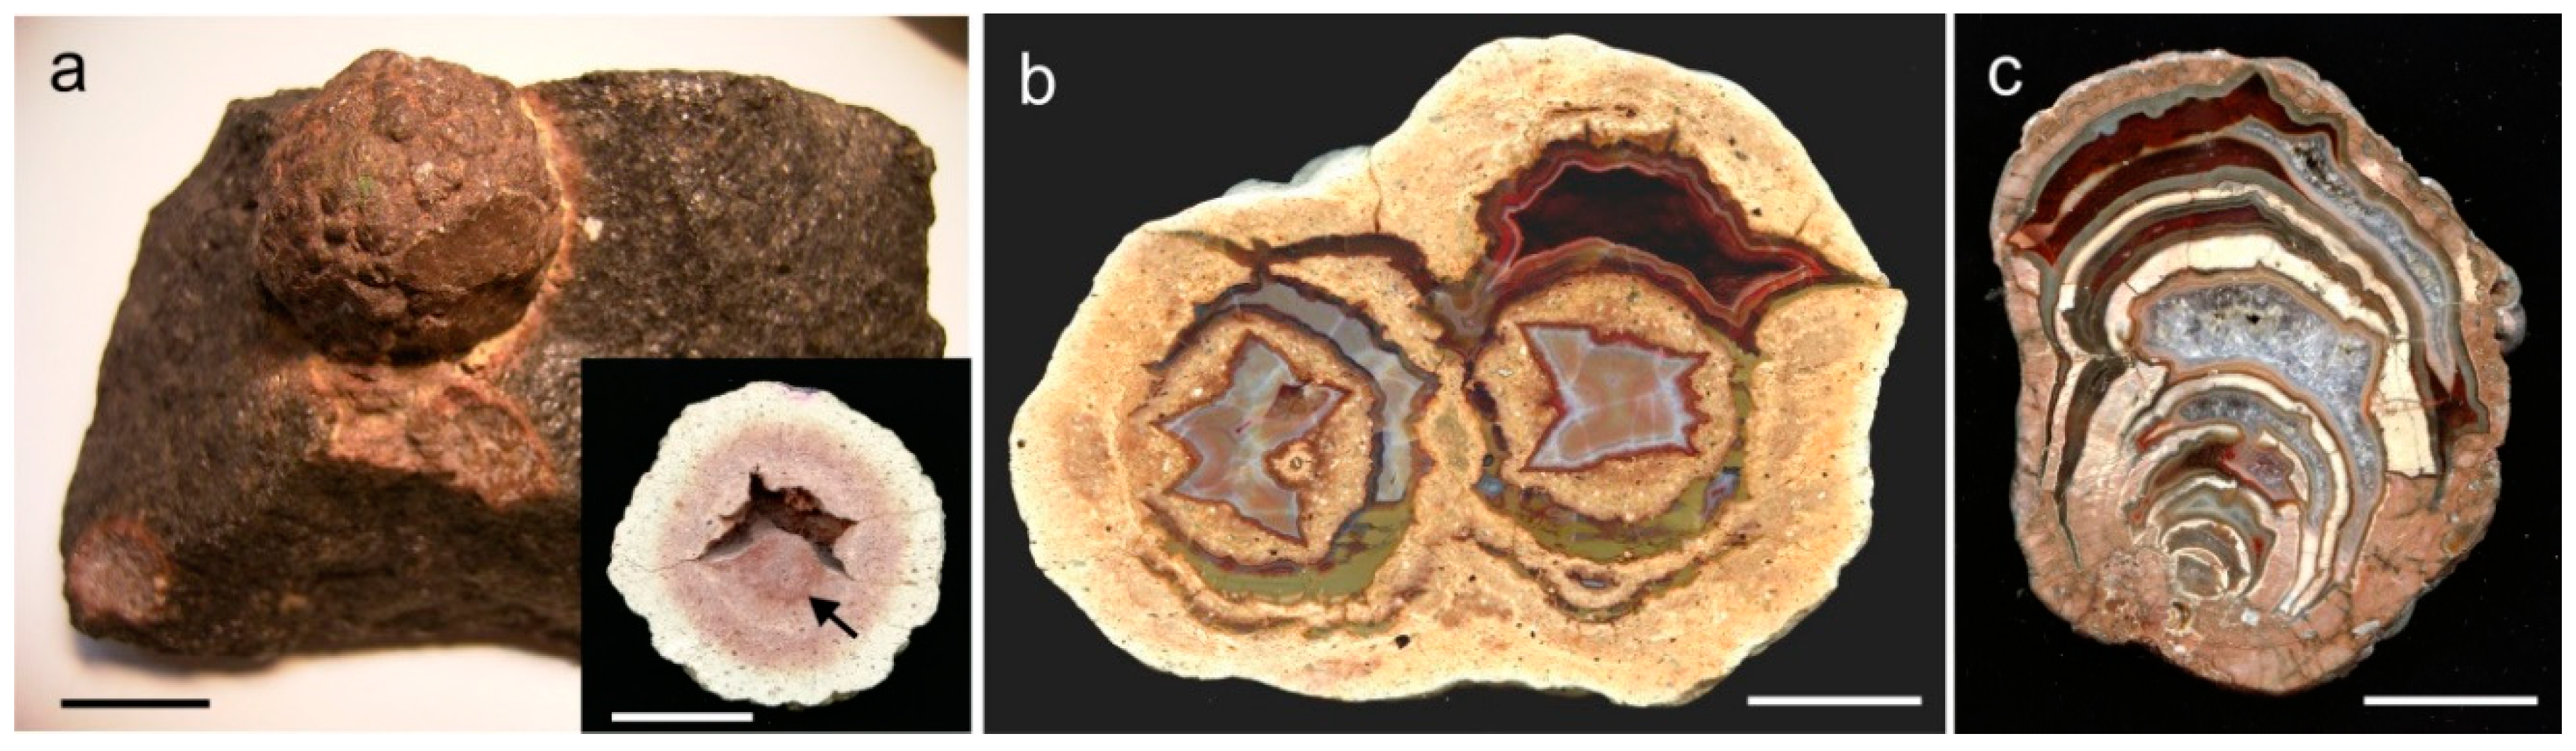
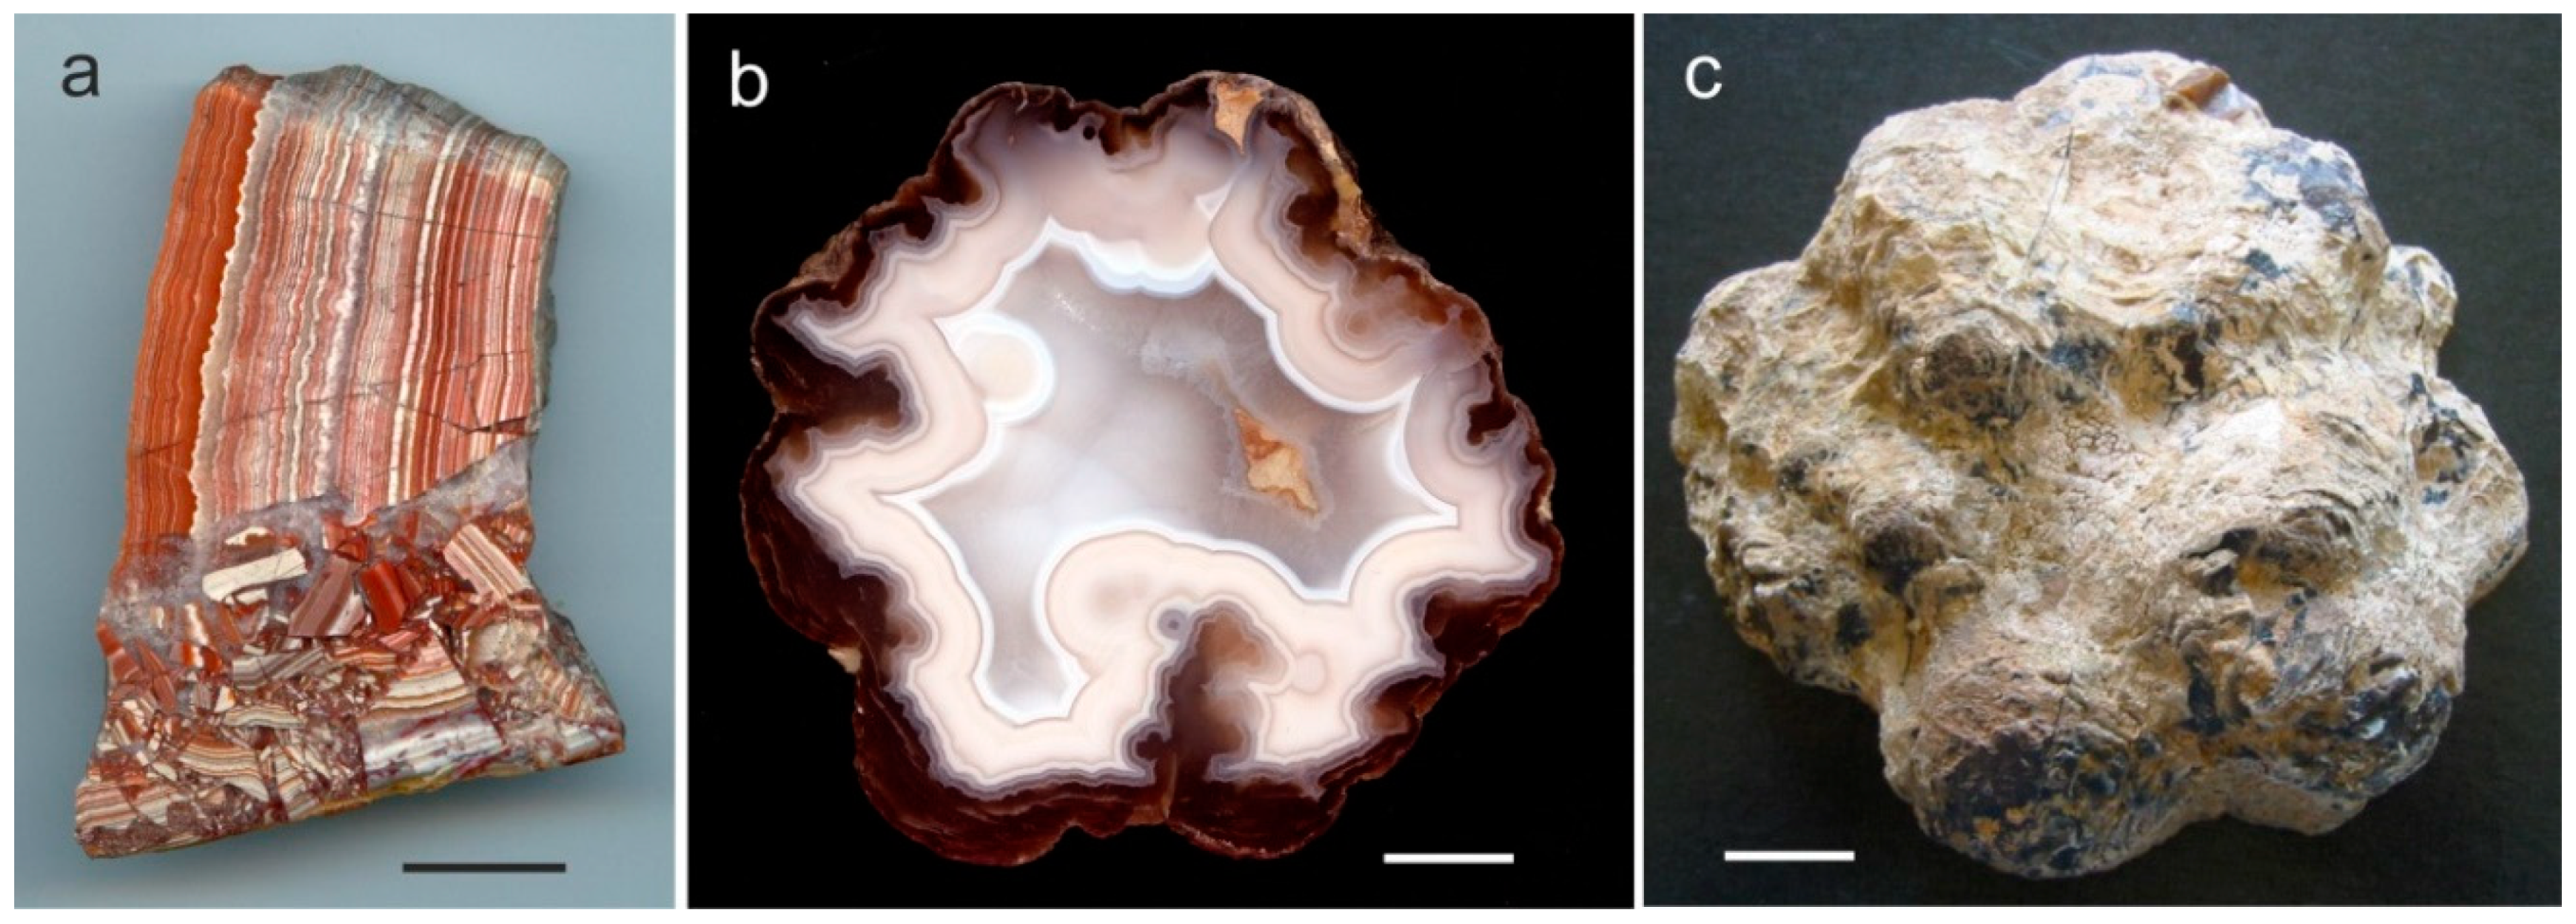
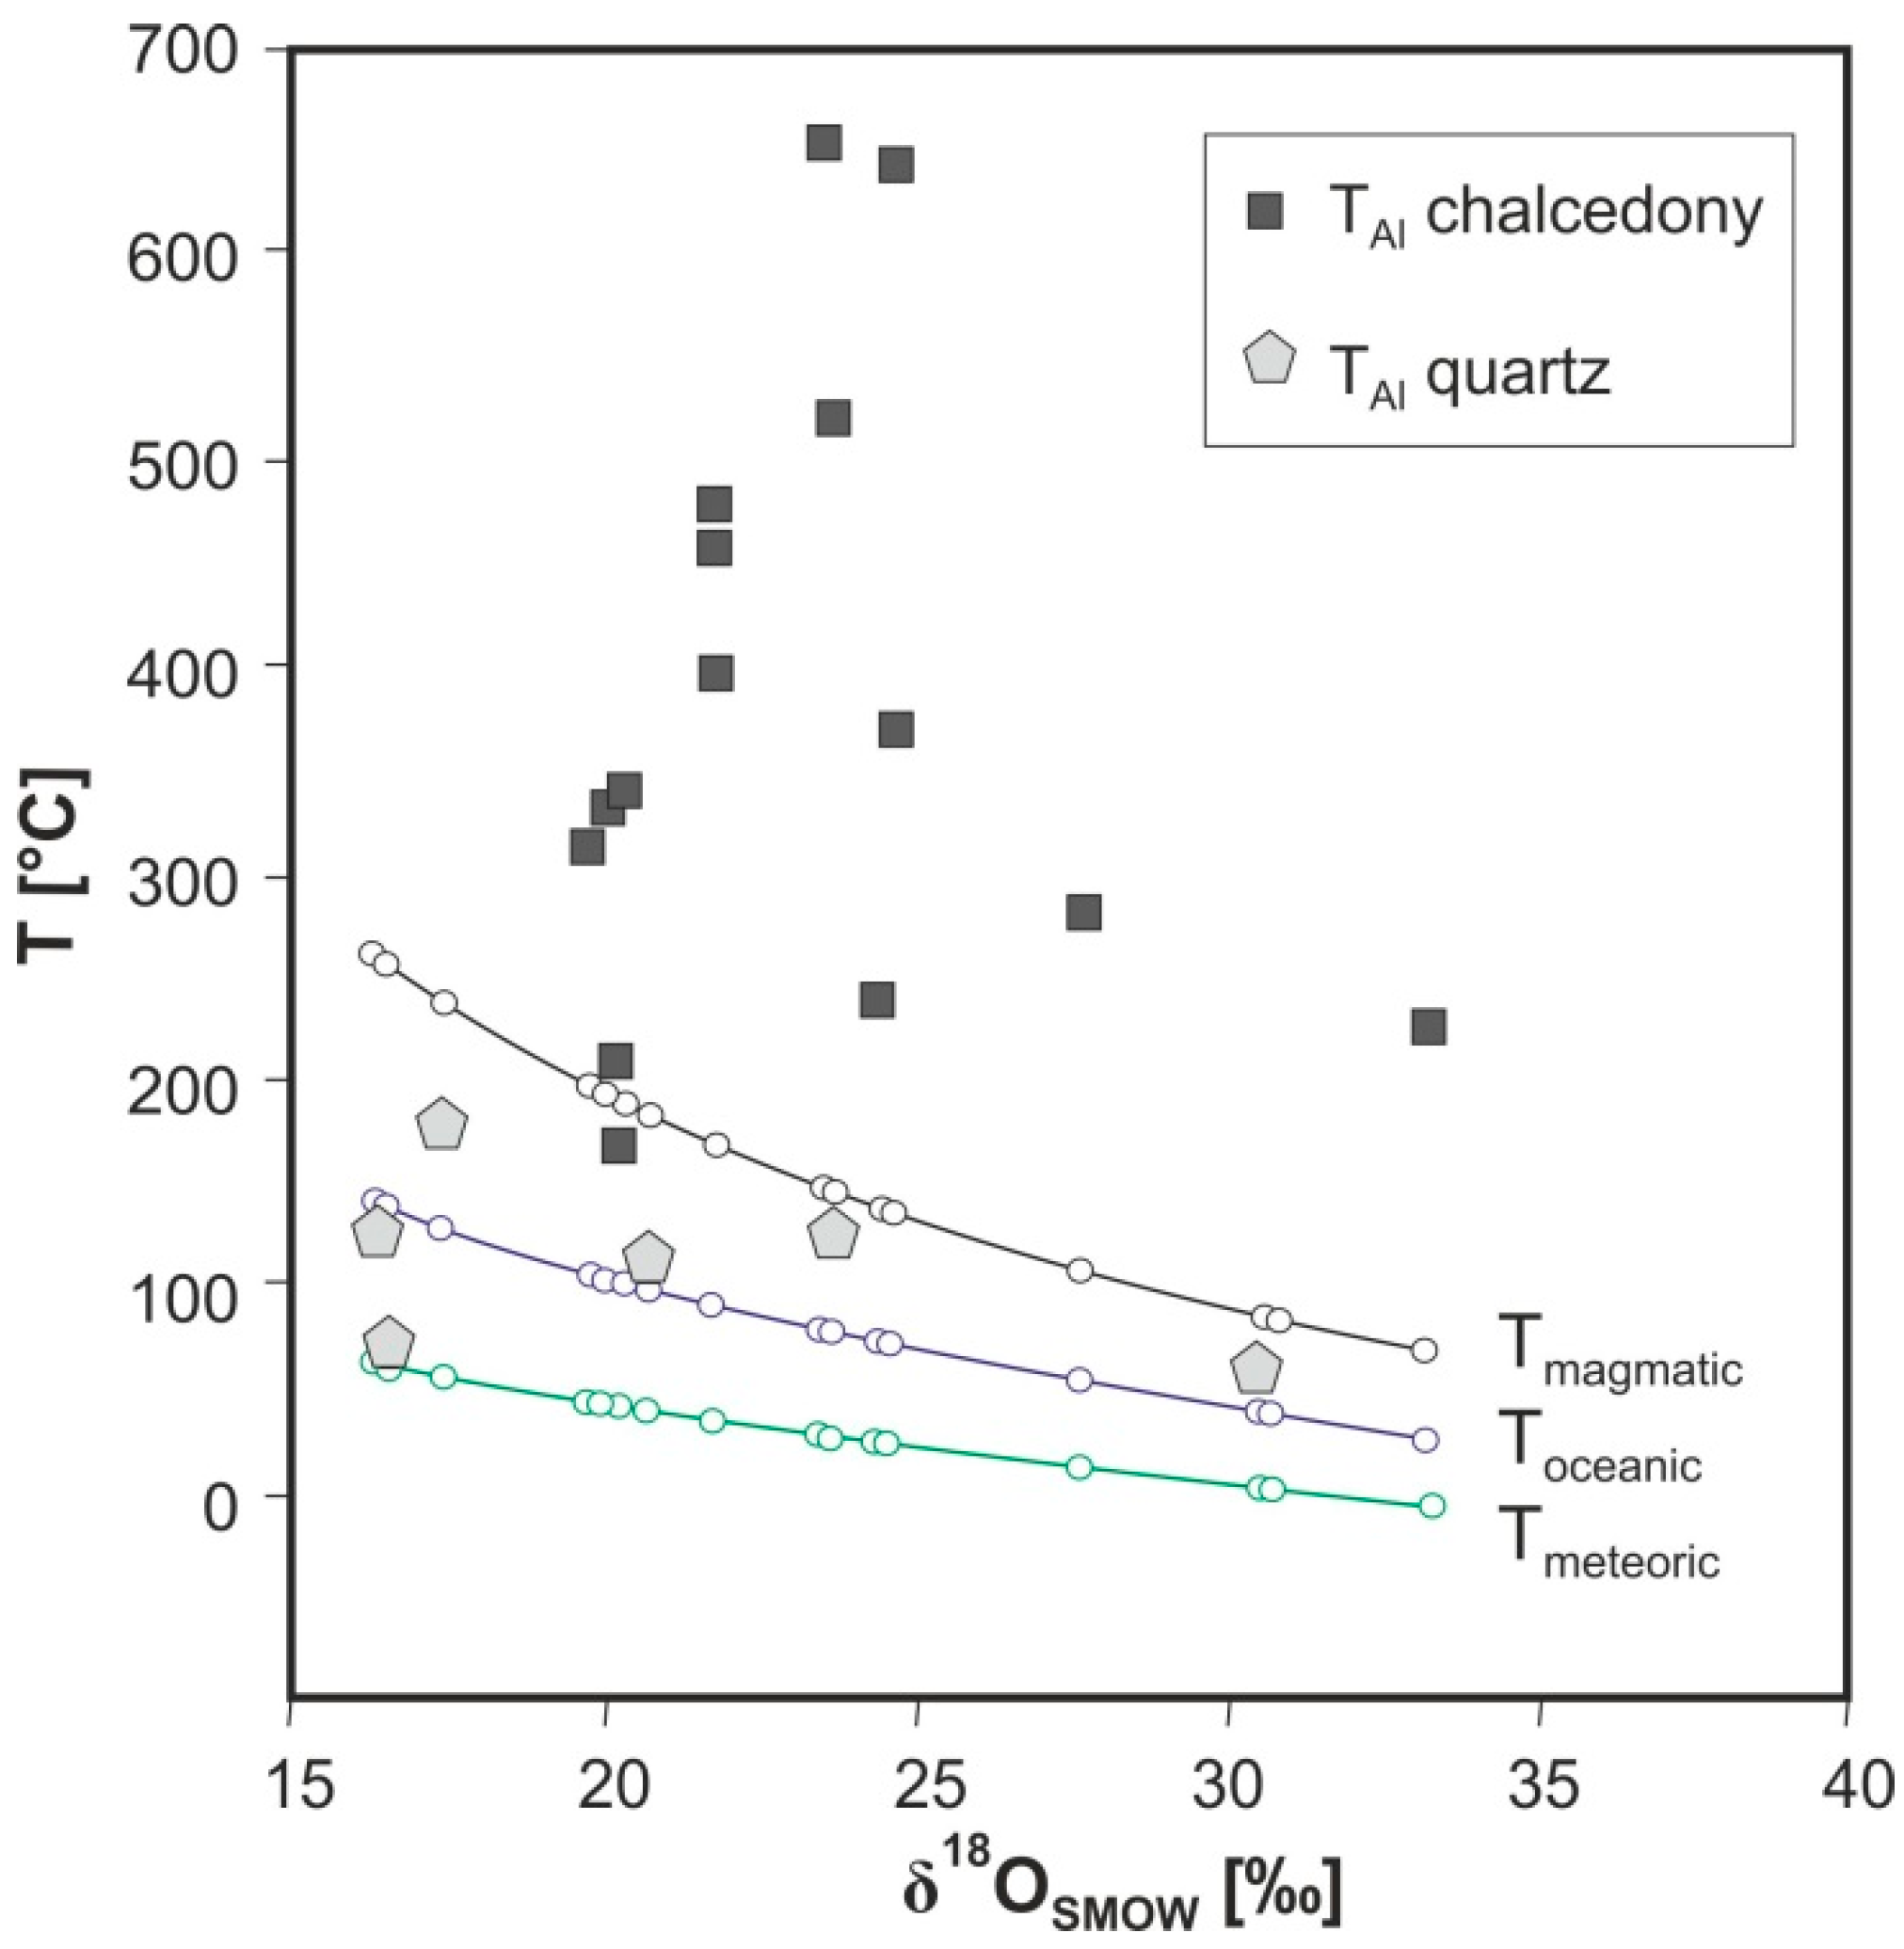
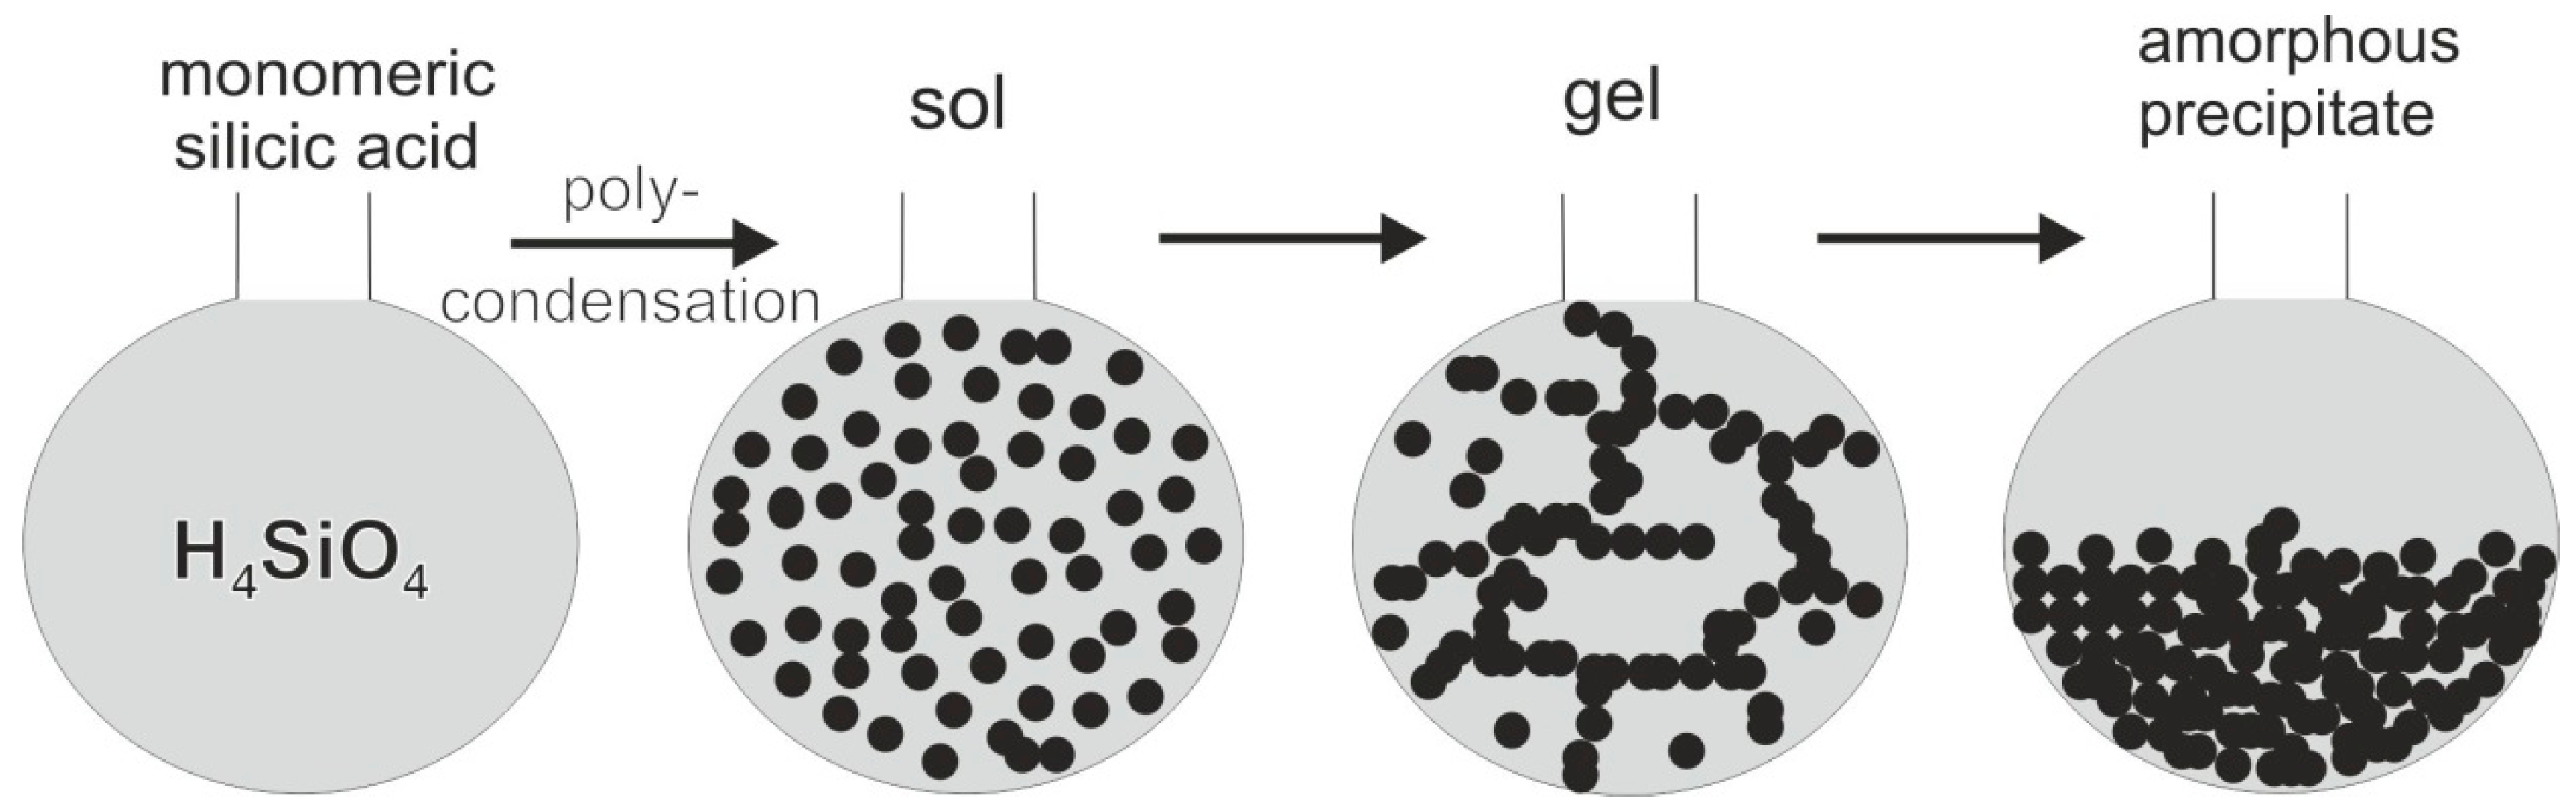
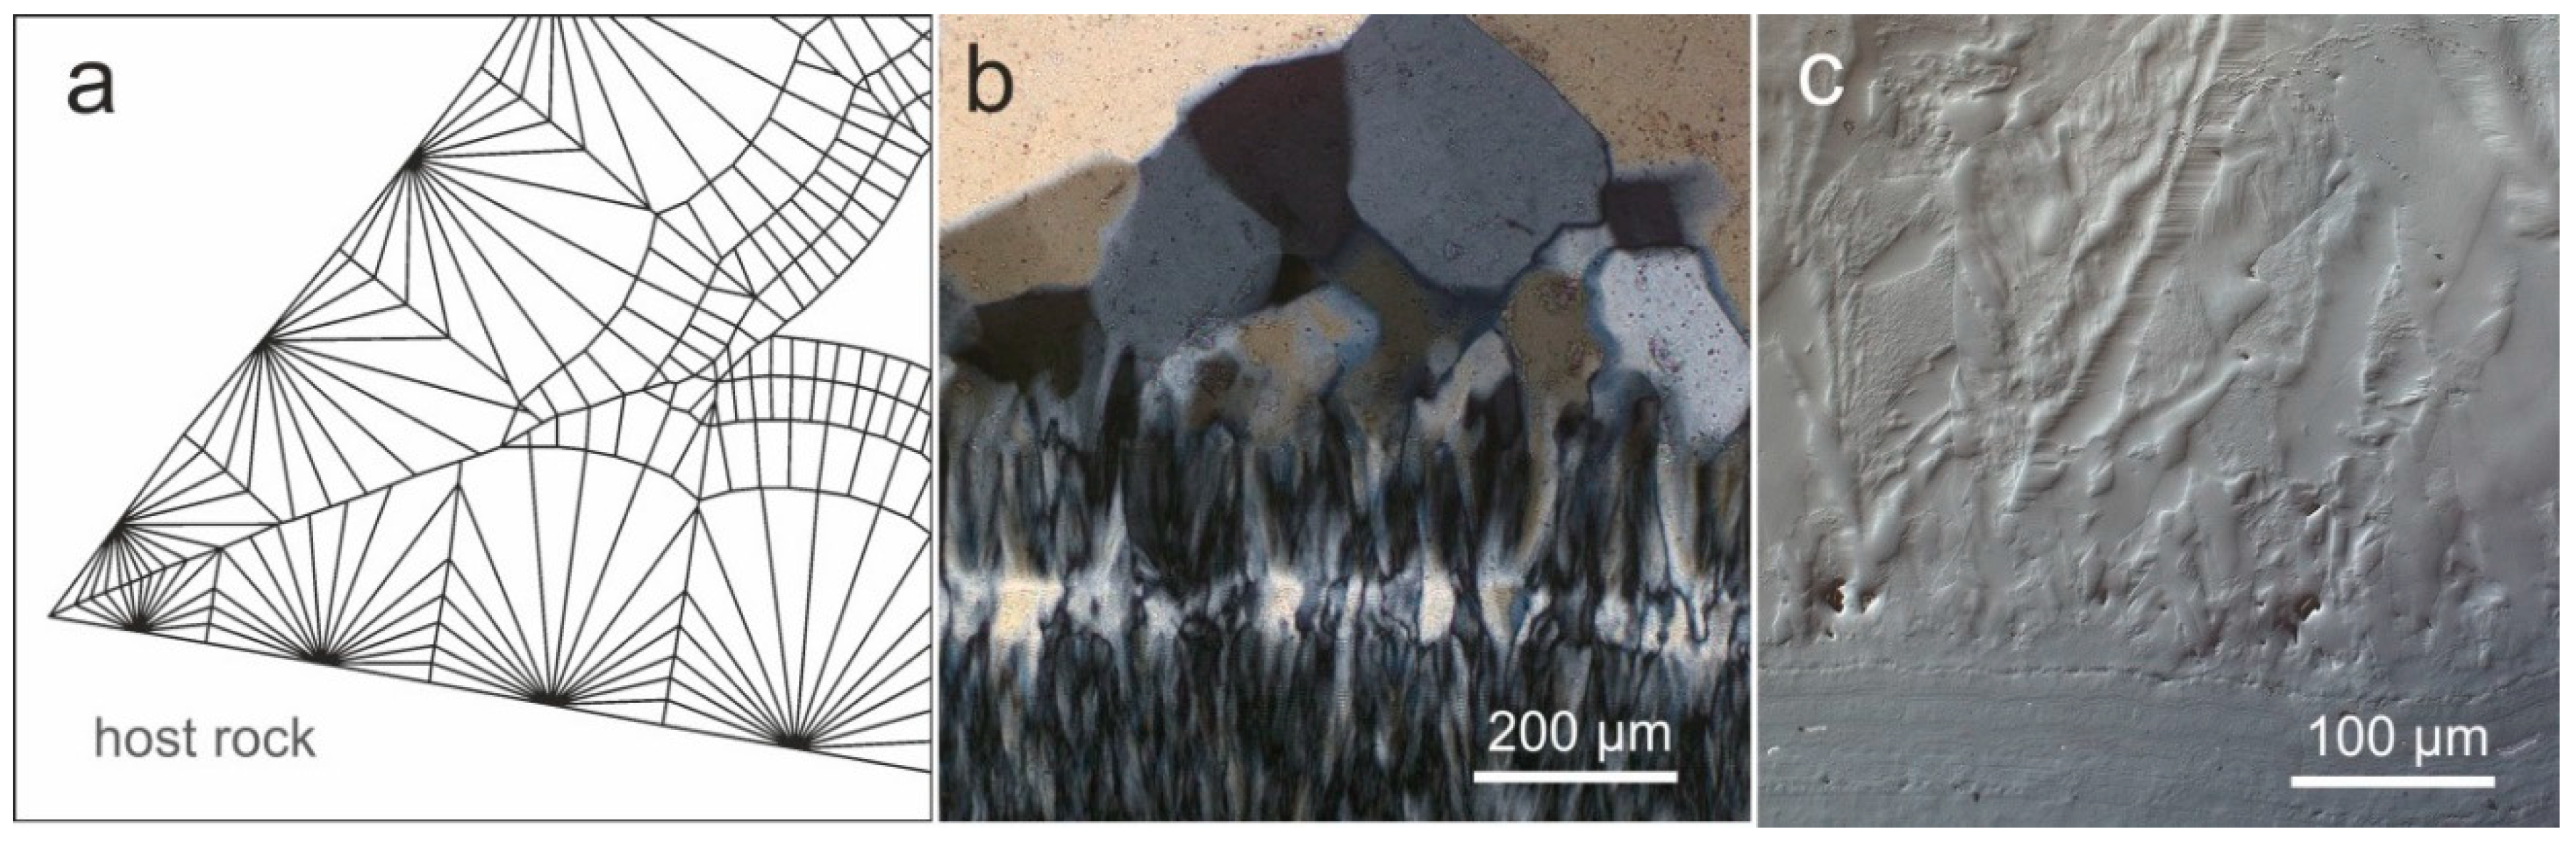
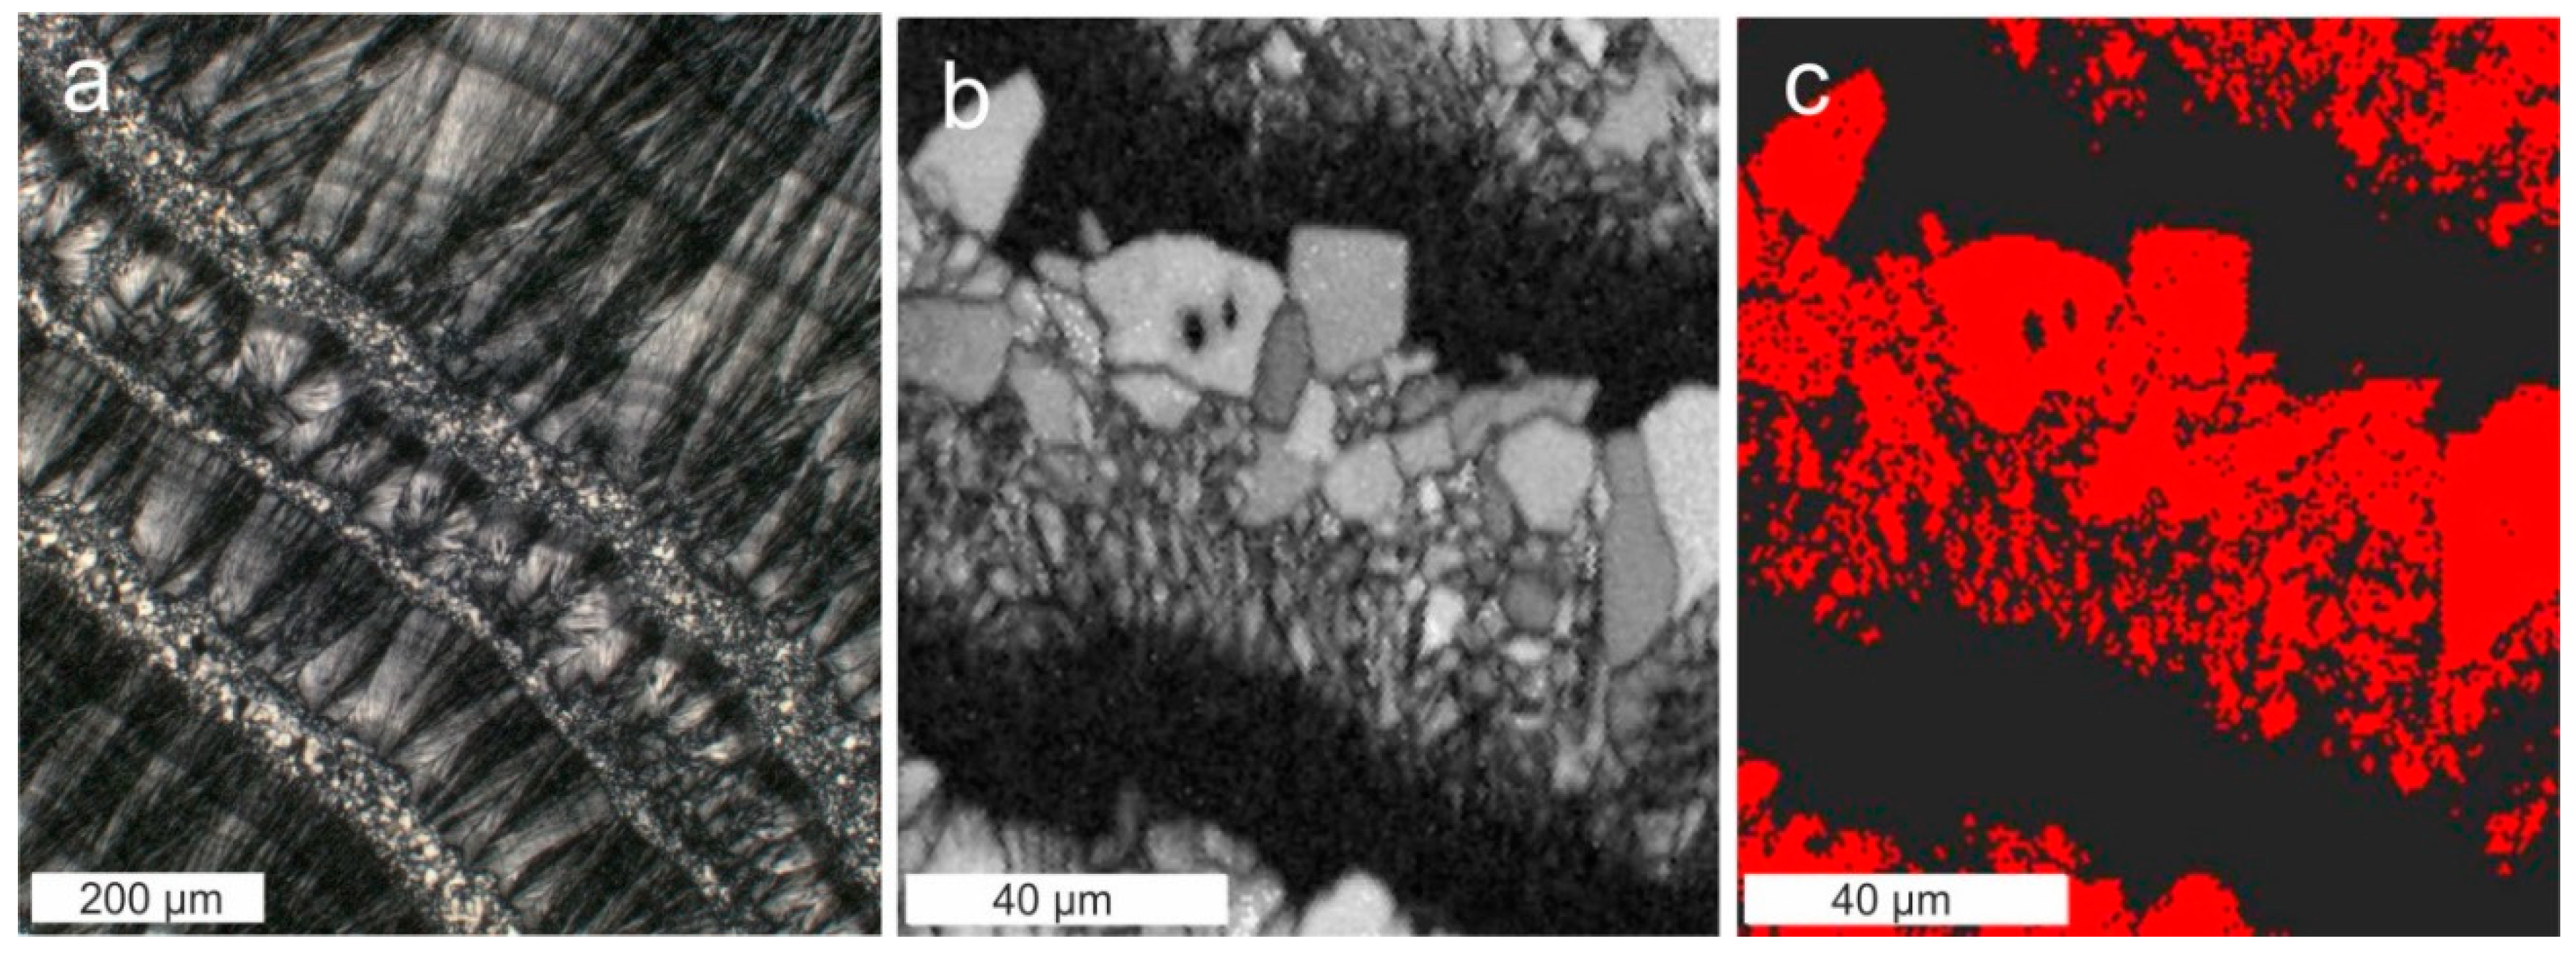
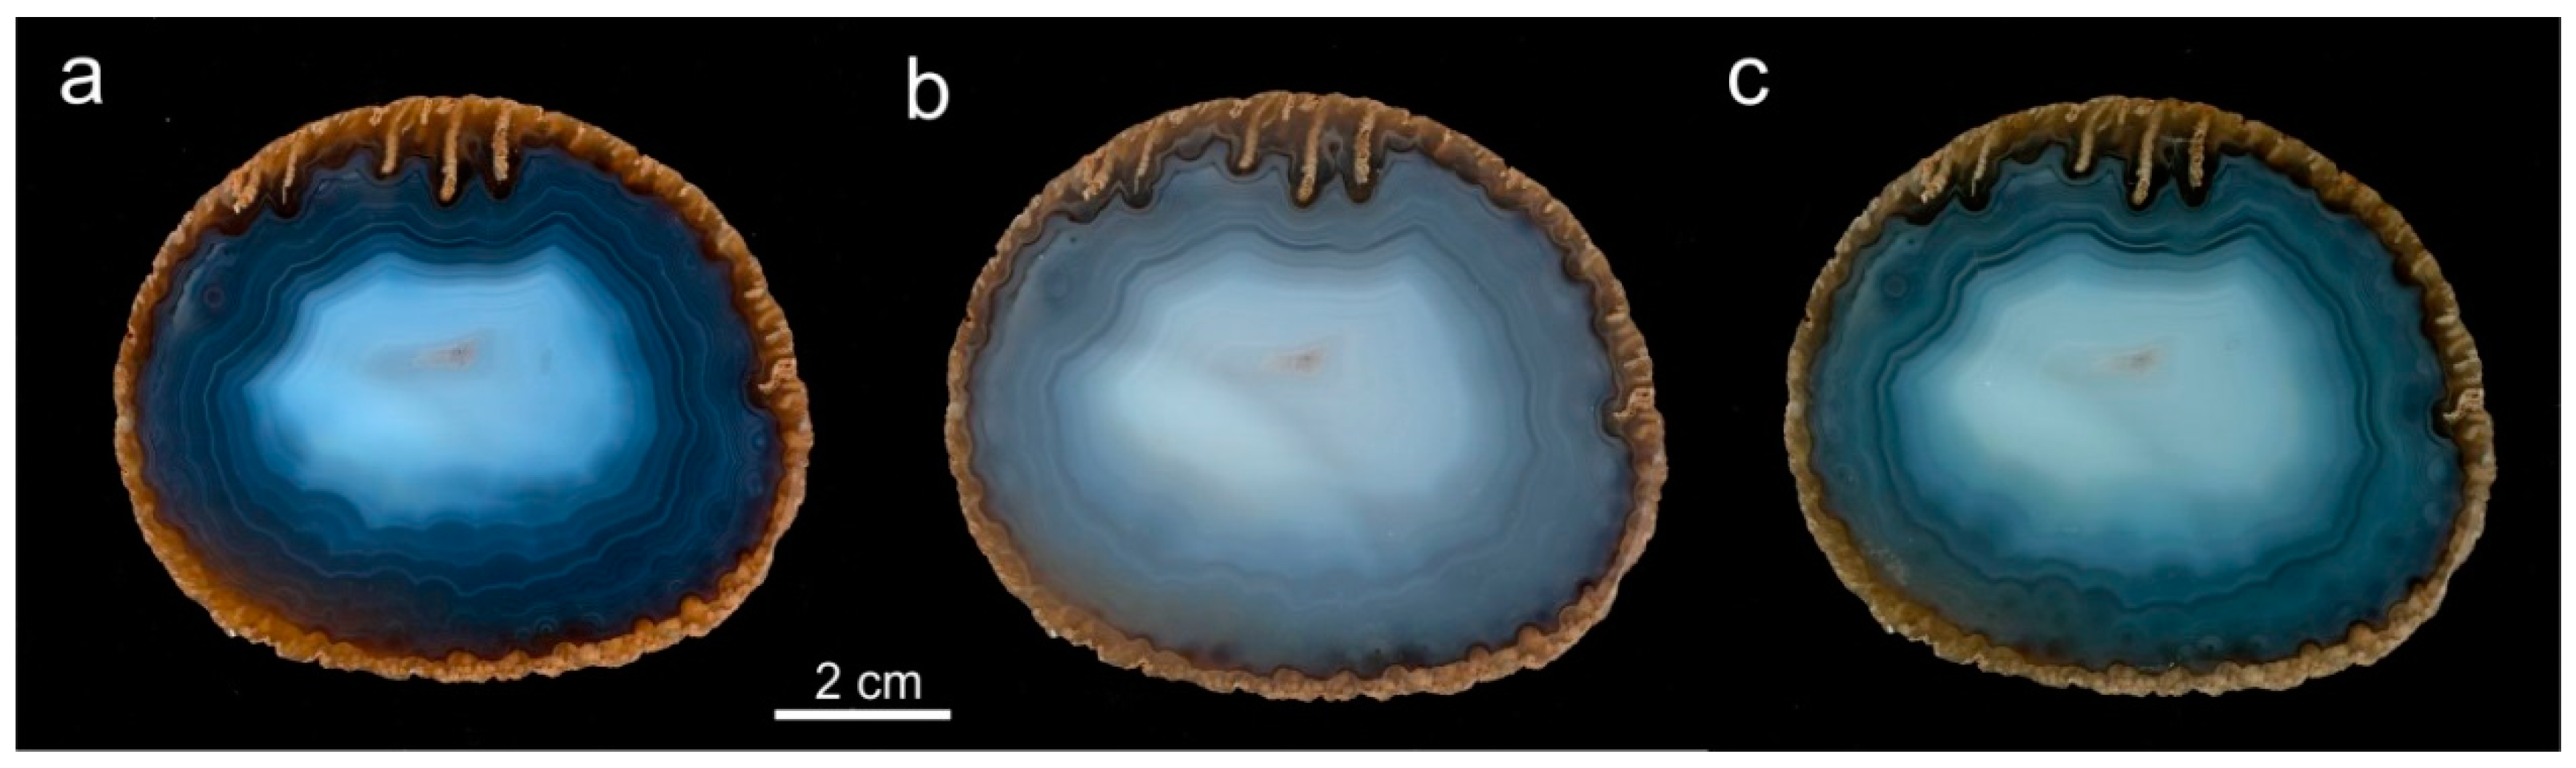
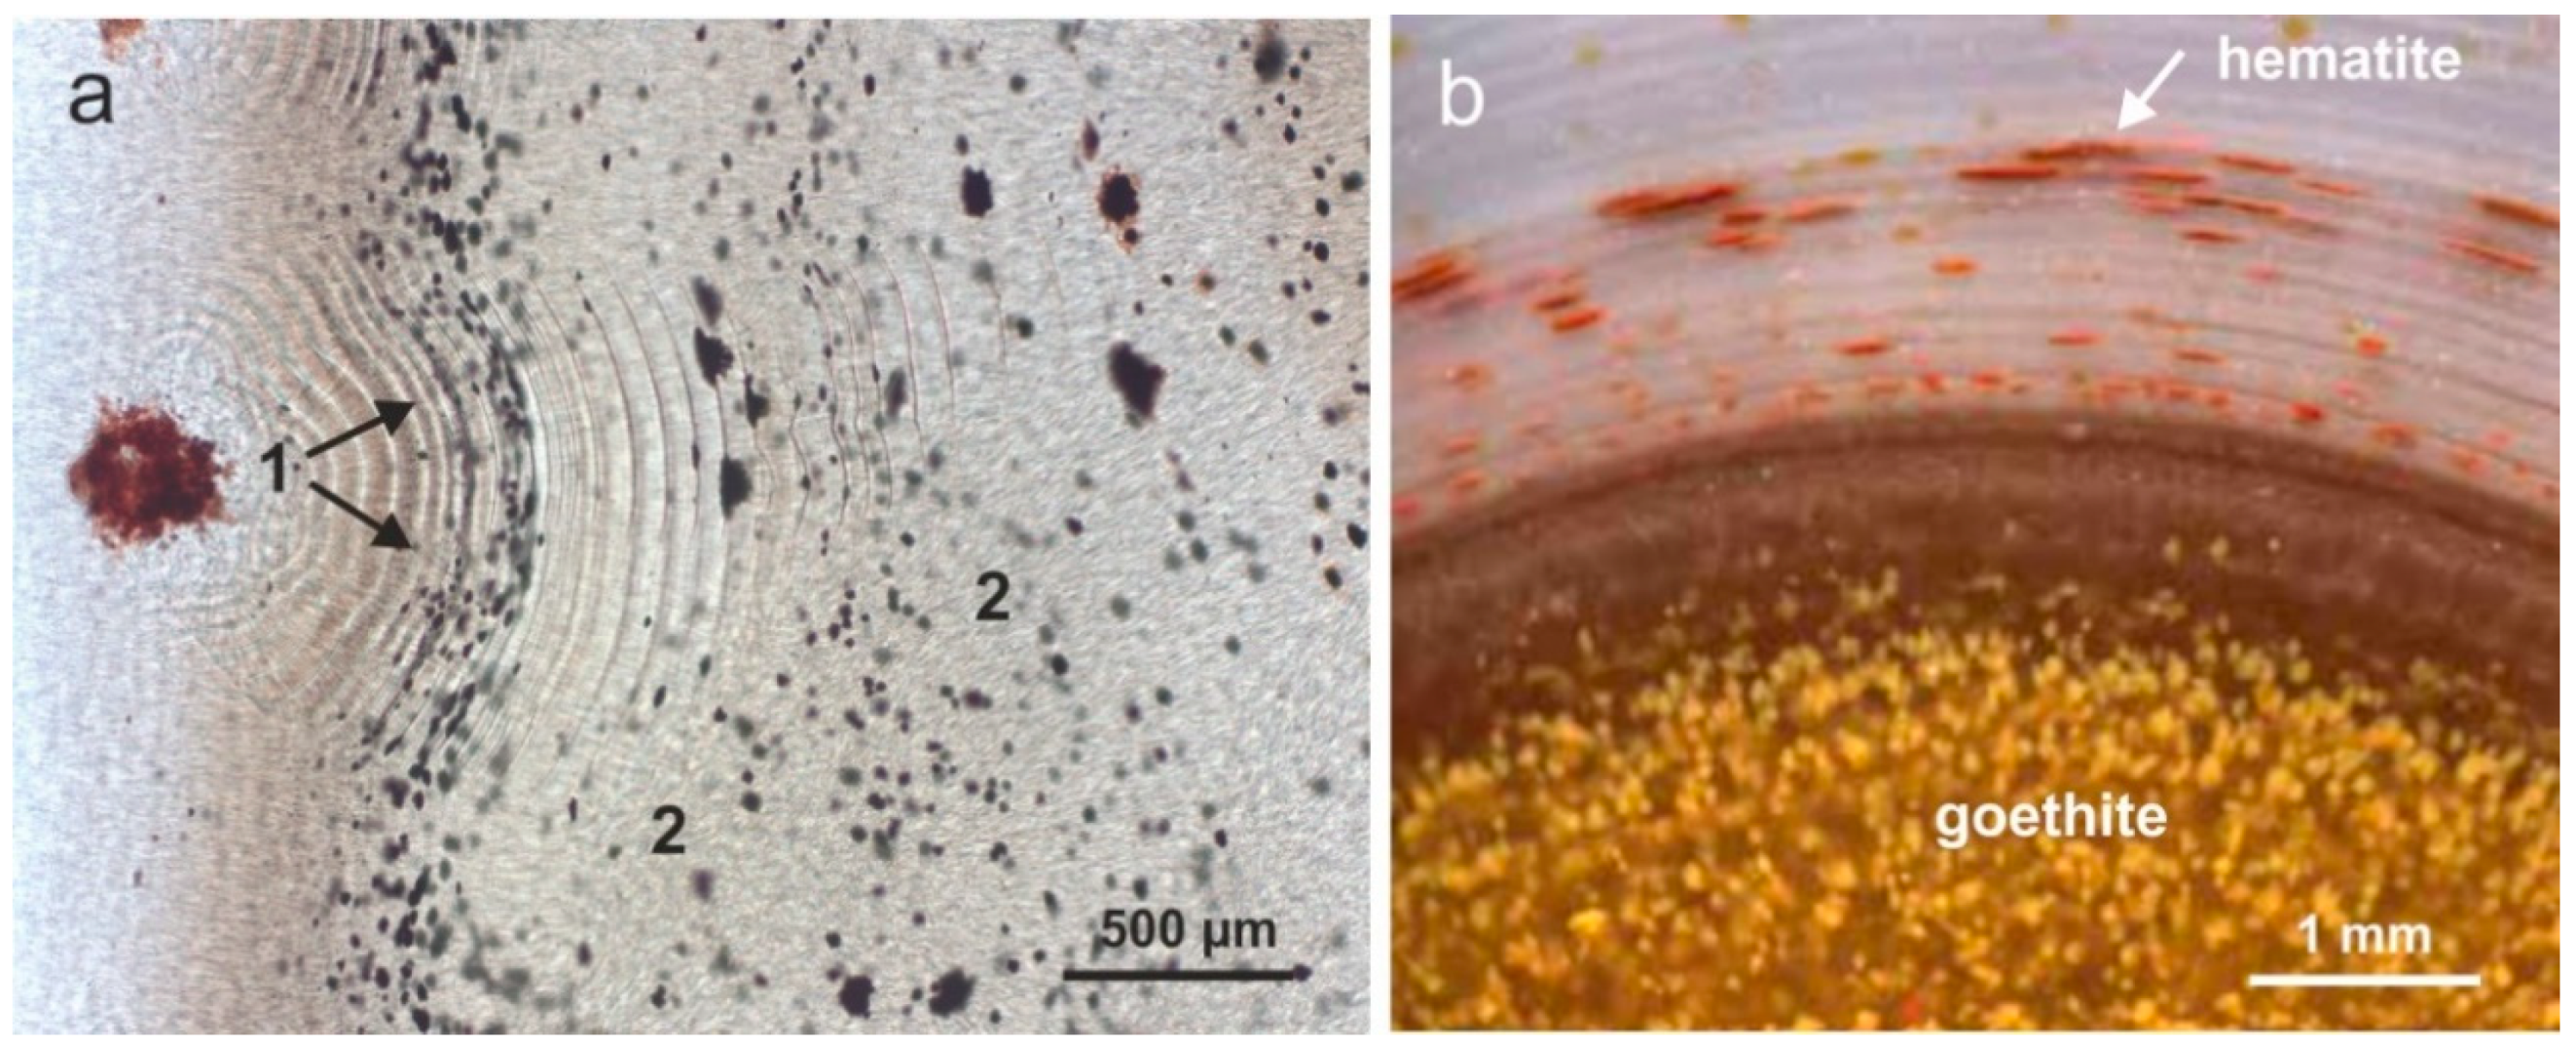
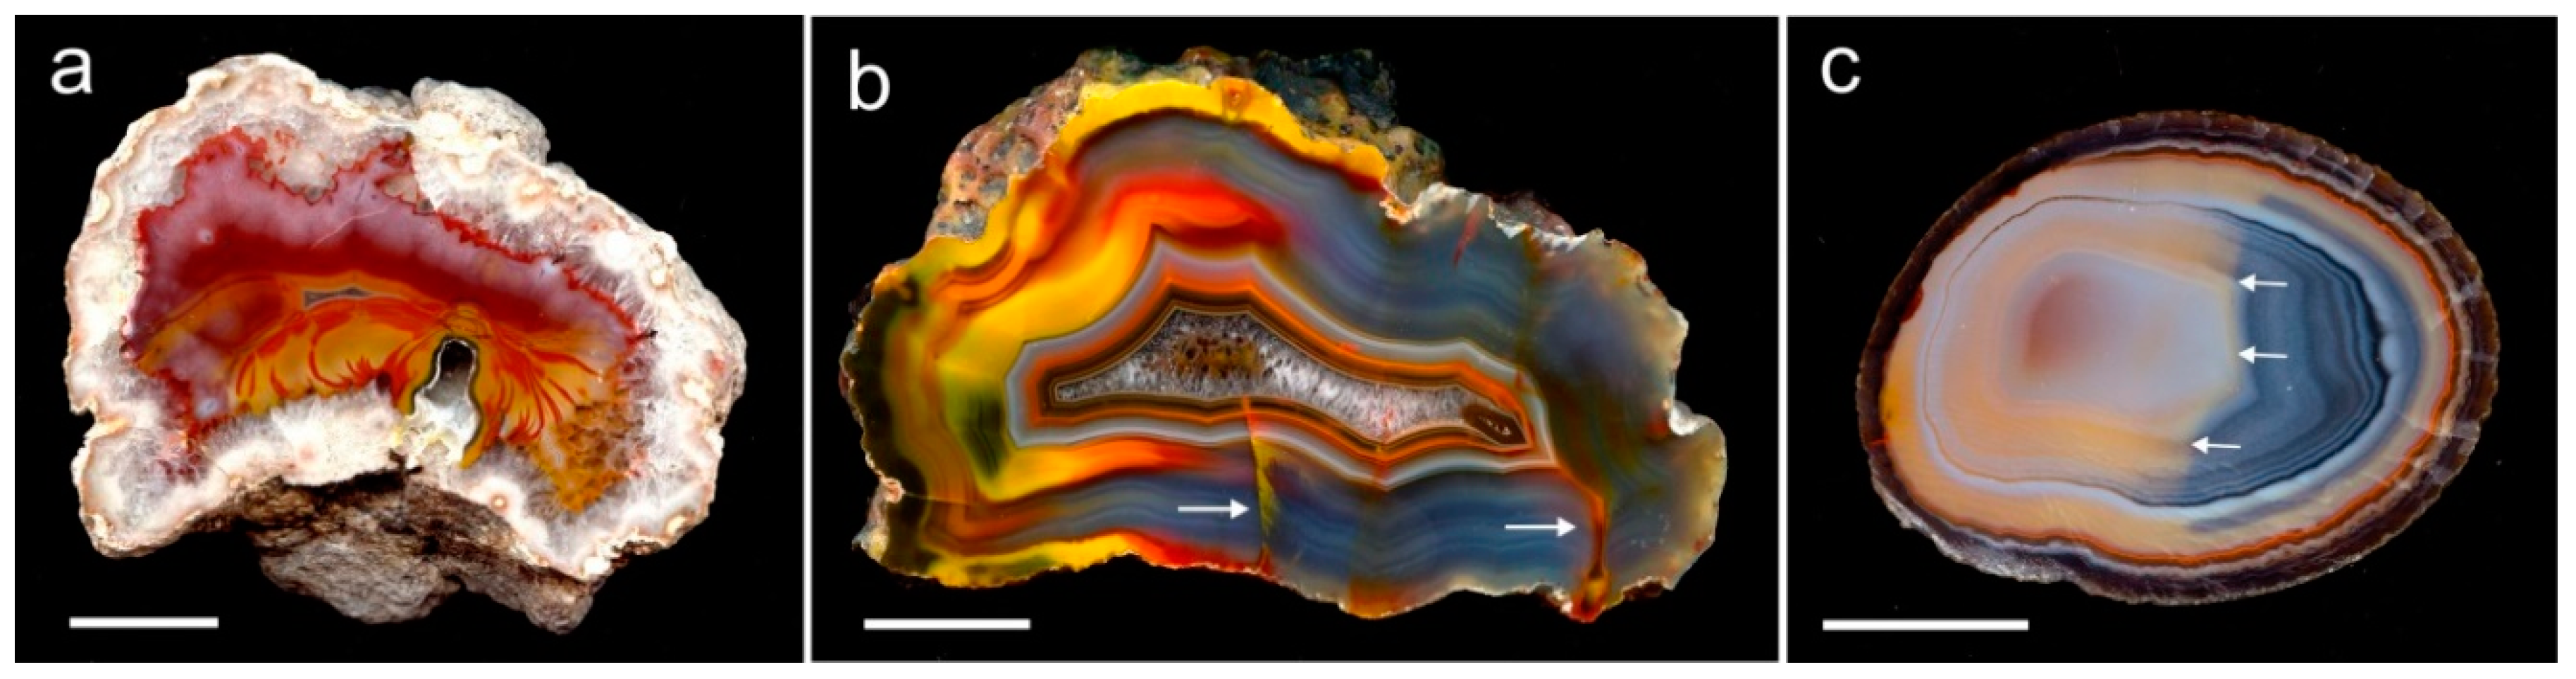
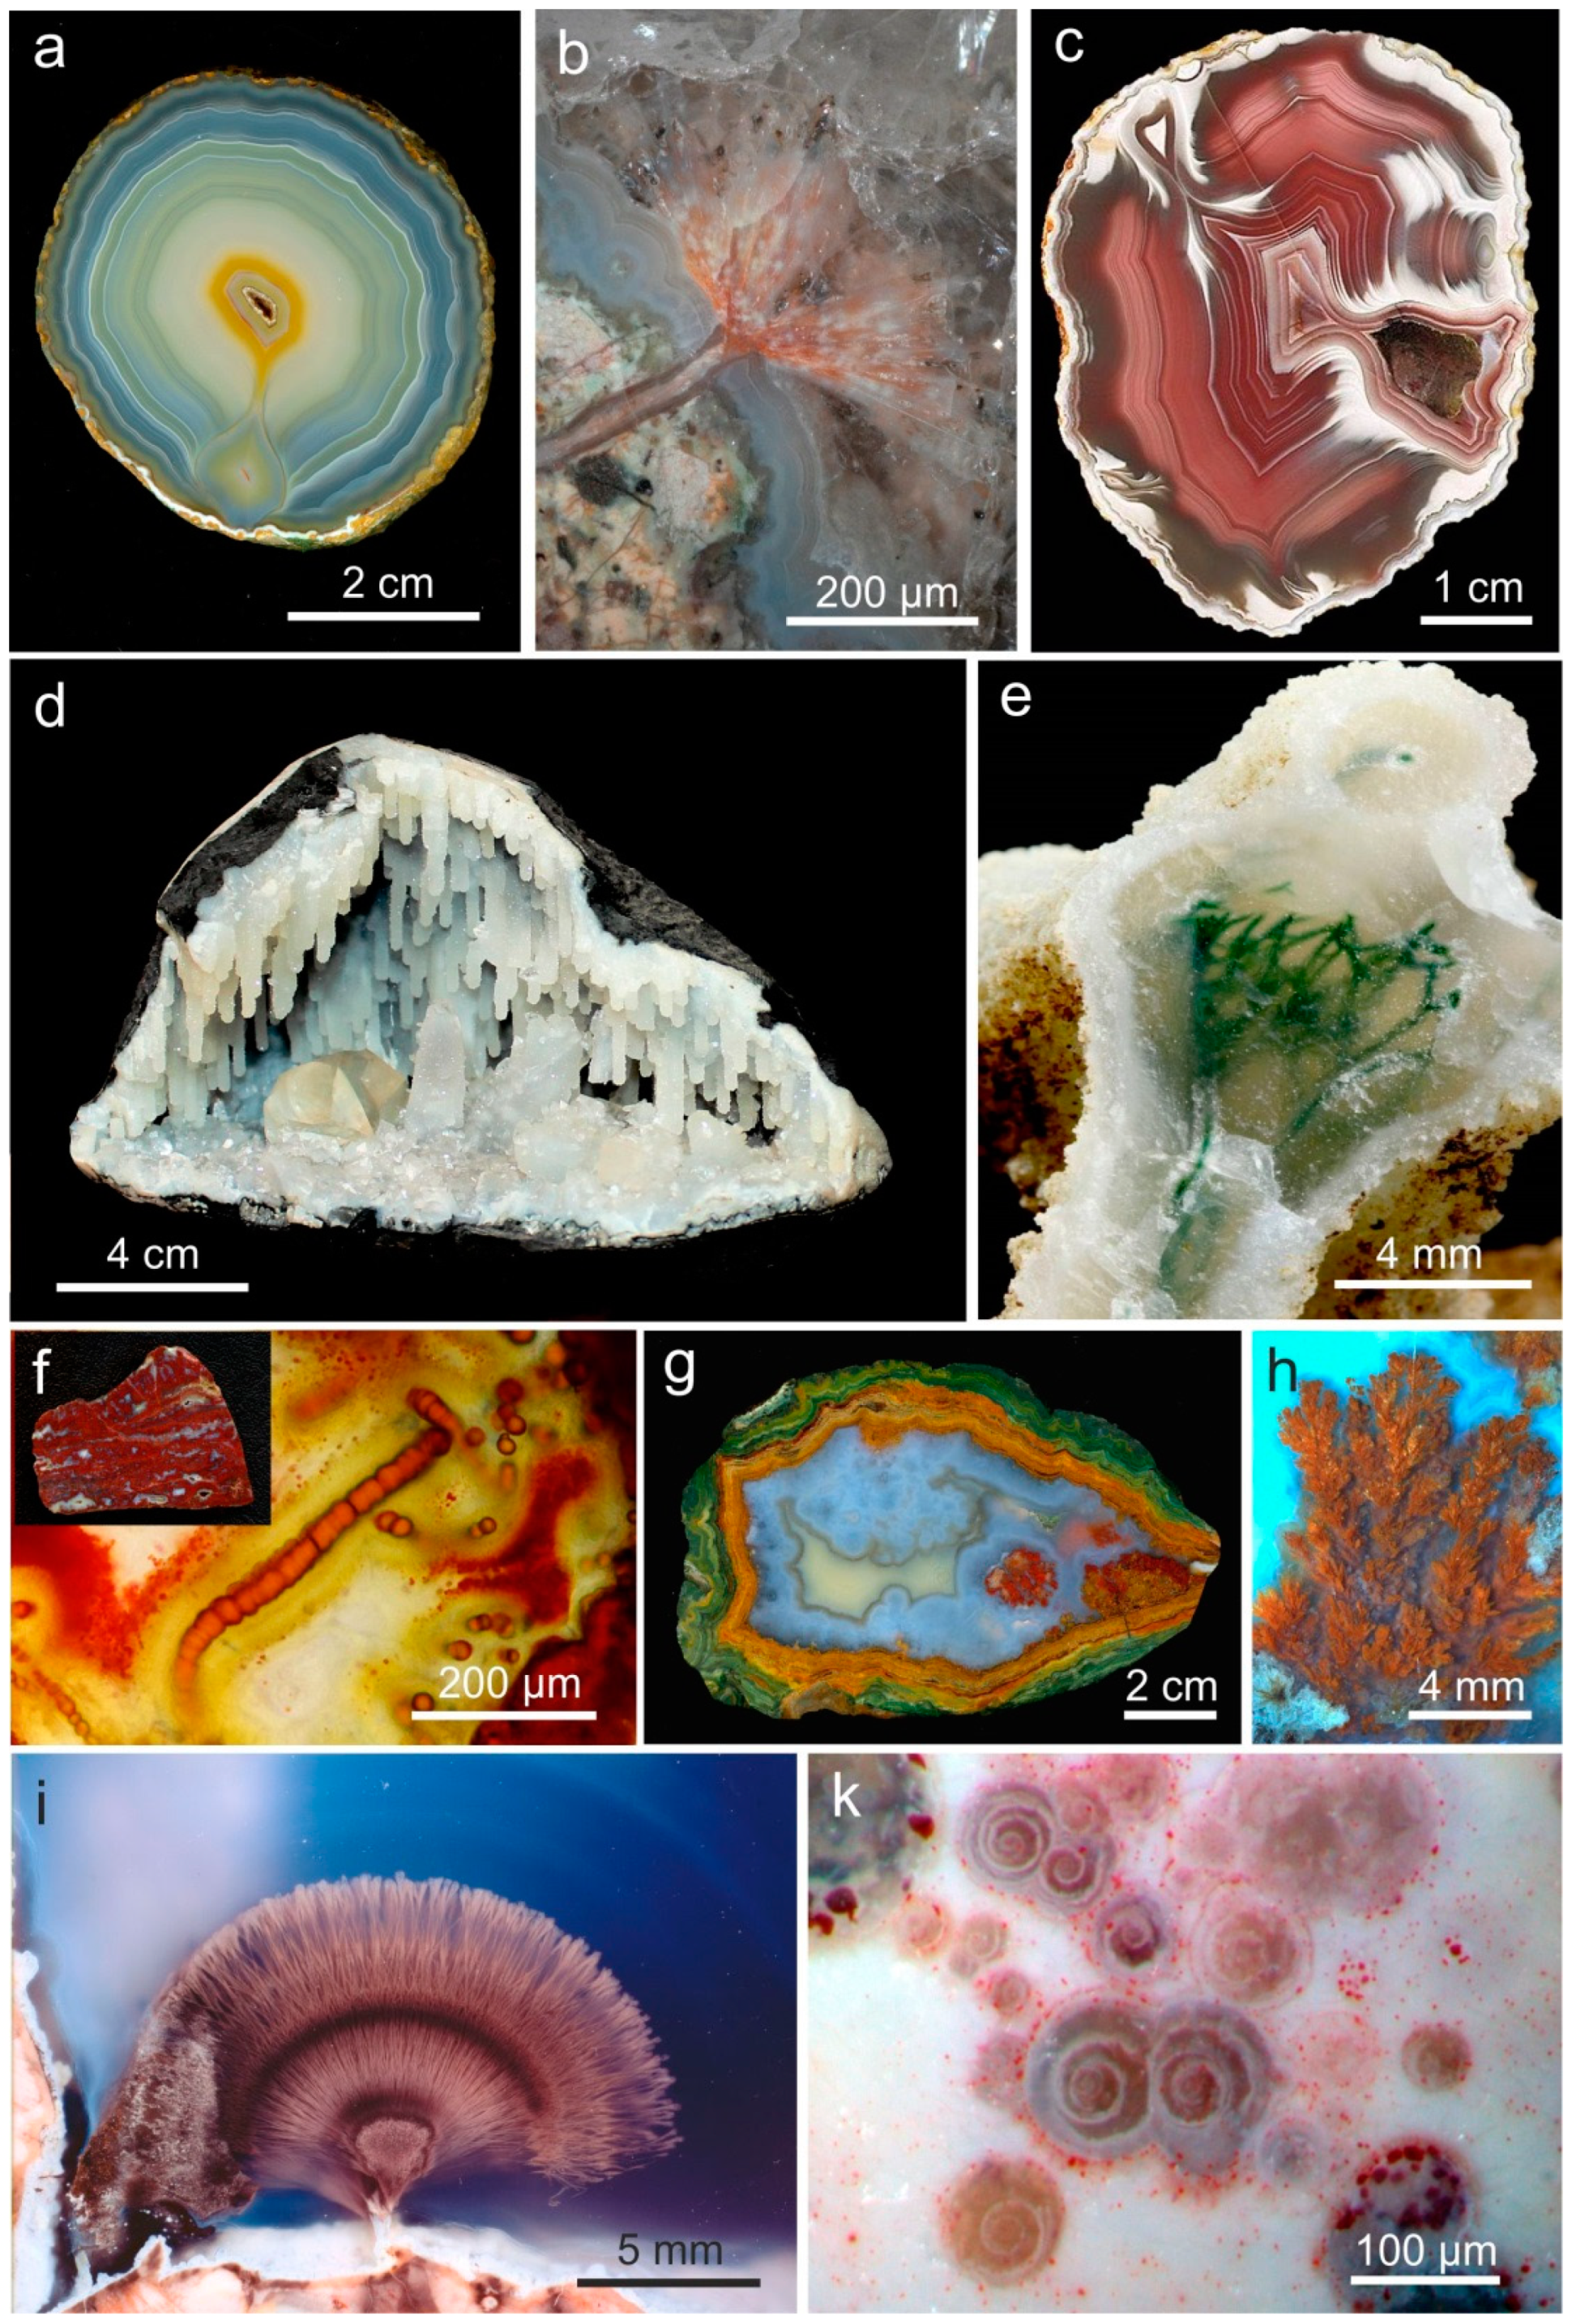
Table 1.
Variations of selected trace-element concentrations (in ppm) of chalcedony and macrocrystalline quartz in agates of different origin (data from [1,26,27,30,31,36,37,58,68,69,126]).
| Element | Agates in Acidic Volcanic Rocks | Agates in Basic Volcanic Rocks | Vein Agates | Agates in Sedimentary Rock | ||||
|---|---|---|---|---|---|---|---|---|
| Chalcedony | Quartz | Chalcedony | Quartz | Chalcedony | Quartz | Chalcedony | Quartz | |
| Al | 109…7300 | 34…1380 | 15…1170 | 30…700 | 640…7000 | 75…546 | 103…809 | 1…13 |
| Ca | <10…540 | <10…27 | <10…710 | <10…120 | 20…400 | <16…45 | 350…1400 | 630…1200 |
| Fe | 30…4500 | <30…978 | 7…3900 | <30…670 | 150…3000 | 150…1700 | 26…1600 | <1…30 |
| Mn | <1…120 | <1…10 | <1…90 | <1…46 | 1…27 | 3…6 | <1 | <1 |
| K | 40…3640 | 30…600 | 20…580 | 66…420 | 150…1360 | 25…480 | na | na |
| Na | 90…850 | 22…600 | 85…750 | 20…140 | 50…350 | 100…240 | 48…323 | 45…158 |
| Mg | 5…556 | 3…70 | 1…364 | 4…287 | 16…220 | 46…105 | na | na |
| F | <25…380 | <25…52 | <25…228 | <25…270 | 79…156 | 31…200 | na | na |
| Ge | 3.2…22 | 0.9…30 | 0.5…8.5 | 0.5…15 | 1.3…4.8 | 0.6…4.5 | <1…2 | <1 |
| B | <10…135 | <2…155 | 3…146 | <2…120 | <2…18 | 6…46 | na | na |
| U | <1…21 | <1…14 | <1…21 | <1…4 | <1…15 | <1…4 | <1…72 | 5…18 |
na = not analyzed.
Table 2.
Concentrations of trace elements (in ppm) from LA-ICP-MS local chemical analyses of a profile across an agate from St. Egidien, Saxony (Germany) (data from Götze et al. [68]); the numbers relate to the analytical points indicated in Figure 17.
| Spot | Ge | Al | Fe | B | Ga | Ca | Li | Na | K | Rb |
|---|---|---|---|---|---|---|---|---|---|---|
| 1 | 77.4 | - | 11.5 | 36 | 0.07 | - | 0.98 | 77.4 | 41.1 | 0.45 |
| 2 | 16.4 | 366 | 46.9 | 34.2 | 0.71 | 62.4 | 1.66 | 101 | 162 | 1.86 |
| 3 | 22.2 | 329 | 48.2 | 33.3 | 0.81 | 58.3 | 1.89 | 67.4 | 168 | 1.5 |
| 4 | 94.9 | - | 11.3 | 33.4 | 0.16 | - | 0.89 | - | 61.8 | 0.5 |
| 5 | 53.5 | - | 12.4 | 23.5 | 0.04 | - | 0.86 | - | 49.2 | 0.32 |
| 6 | 93.6 | - | 14.5 | 31.3 | 0.12 | - | 0.51 | - | 37.4 | 0.44 |
| 7 | 26.8 | - | 18.7 | 8 | 0.14 | - | 0.59 | - | 32 | 0.15 |
| 8 | 68.9 | - | 12.8 | 19.2 | 0.12 | - | 0.47 | - | 33 | 0.24 |
| 9 | 31.6 | 103 | 154 | 28.7 | 0.38 | 9.7 | 0.49 | 37.9 | 89.2 | 0.58 |
| 10 | 36.3 | <6.0 | 47.7 | 29.2 | 0.17 | 9.4 | 0.39 | - | 51.9 | 0.33 |
| 11 | 28.9 | - | 47.8 | 41 | 0.11 | - | 0.49 | - | 55.1 | 0.43 |
| 12 | 20.4 | - | 61.9 | 35.7 | 0.12 | - | 0.59 | - | 60.7 | 0.33 |
| 13 | 13.2 | <6.0 | 55.4 | 45.6 | 0.22 | - | 0.35 | - | 60.2 | 0.31 |
| 14 | 21.2 | 162 | 66.9 | 25.8 | 0.98 | - | 0.30 | - | 149 | 0.97 |
| 15 | 0.5 | - | 1.9 | <1.0 | 0.18 | 53.3 | 0.30 | - | 1.2 | - |
(-) = not detectable; in general Ti < 1.2 ppm, Ba < 0.1 ppm, Sr < 0.1 ppm, Mn < 0.6 ppm.
Table 3.
Minimum homogenization temperatures (Thom) obtained from fluid inclusion studies of agates from different occurrences in Germany.
Table 3.
Minimum homogenization temperatures (Thom) obtained from fluid inclusion studies of agates from different occurrences in Germany.
| Agate Location | Host Rock/Agate Type | Thom |
|---|---|---|
| Gehlberg (Thuringia) | rhyolite/lithophysa | 95 °C |
| Chemnitz (Saxony) | ignimbrite/lithophysa | 176 °C |
| St. Egidien (Saxony) | ignimbrite/lithophysa | 186 °C |
| Mügeln (Saxony) | rhyolite/lithophysa | 177 °C |
| Burgstall (Saxony) | rhyolite/lithophysa | 172 °C |
| Gröppendorf (Saxony) | melaphyre/amygdale | 134 °C |
| Schlottwitz (Saxony) | hydrothermal vein agate | 80 °C |
Table 4.
Compilation of detected minerals in agates (unpublished data and data from [1,15,18,22,24,28,30,31,34,35,38,42,44,45,46,47,49,52,53,54,55,59,60,76,78,157,158,159,160,161,162,163,164,165]); minerals and mineral groups in bold are the most frequent phases in agates.
| Mineral Group | Minerals |
|---|---|
| Elements | copper, lead, sulphur, graphite |
| Sulfides | pyrite, marcasite, sphalerite, galenite, chalkopyrite, covelline |
| Oxides/Hydroxides | hematite, goethite |
| todorocite, ramsdellite, birnessite, pyrolusite, rancieite, hollandite, | |
| cryptomelane/psilomelane, manganite | |
| cuprite, rutile, anatase, spinel (magnesio-chromite) | |
| Carbonates | calcite, aragonite, dolomite, siderite, ankerite, rodochrosite, strontianite, magnesite, smithsonite, malachite, azurite, bastnesite-(Ce) |
| Sulfates | barite, celestine, anhydrite, gypsum |
| Phosphates | apatite, monazite-(Ce), rabdophane-(Ce), xenotime-(Y) |
| Halides | fluorite |
| Silicates | clay minerals (kaolinite, illite, montmorillonite, beidellite, saponite, nontronite) |
| zeolites (mordenite, heulandite/clinoptilolite, harmotome, chabasite, natrolite, analcime, scolezite, mesolite, stilbite, thomsonite, laumontite, brewsterite, philipsite) | |
| glauconite–celadonite series, chlorite, serpentine, talc, prehnite, | |
| datolithe, epidote, apophyllite, chrysocolle, orthoclase, albite, plagioclase |
Table 5.
Mineral composition (in wt%) of a relatively fresh agate-bearing pitchstone from Chemnitz, Saxony (Germany) in comparison to the surrounding altered rock.
Table 5.
Mineral composition (in wt%) of a relatively fresh agate-bearing pitchstone from Chemnitz, Saxony (Germany) in comparison to the surrounding altered rock.
| Phase | Pitchstone | Altered Pitchstone |
|---|---|---|
| Amorphous (glass) | 63.7 ± 2.2 | - |
| Plagioclase | 16.1 ± 0.9 | 14.3 ± 1.0 |
| K-feldspar | 5.5 ± 0.5 | 8.7 ± 0.9 |
| Quartz | 1.7 ± 0.2 | 9.6 ± 0.7 |
| Biotite | 1.1 ± 0.9 | - |
| Magnetite | 0.8 ± 0.2 | - |
| Ilmenite | 0.5 ± 0.2 | - |
| Montmorillonite | 10.6 ± 1.9 | 62.0 ± 1.4 |
| Klinoptilolite | - | 5.4 ± 1.0 |
Publisher’s Note: MDPI stays neutral with regard to jurisdictional claims in published maps and institutional affiliations. |
© 2020 by the authors. Licensee MDPI, Basel, Switzerland. This article is an open access article distributed under the terms and conditions of the Creative Commons Attribution (CC BY) license (http://creativecommons.org/licenses/by/4.0/).
Share and Cite
MDPI and ACS Style
Götze, J.; Möckel, R.; Pan, Y. Mineralogy, Geochemistry and Genesis of Agate—A Review. Minerals 2020, 10, 1037. https://0-doi-org.brum.beds.ac.uk/10.3390/min10111037
AMA Style
Götze J, Möckel R, Pan Y. Mineralogy, Geochemistry and Genesis of Agate—A Review. Minerals. 2020; 10(11):1037. https://0-doi-org.brum.beds.ac.uk/10.3390/min10111037
Chicago/Turabian StyleGötze, Jens, Robert Möckel, and Yuanming Pan. 2020. "Mineralogy, Geochemistry and Genesis of Agate—A Review" Minerals 10, no. 11: 1037. https://0-doi-org.brum.beds.ac.uk/10.3390/min10111037
Note that from the first issue of 2016, this journal uses article numbers instead of page numbers. See further details here.