1. Introduction
The presence of water in historical masonry structures is one of the most prominent conservation problems affecting architectural heritage [
1,
2] and, more generally, ancient buildings. This presence may be ascribed to different origins: accidental causes (infiltration from roof, pipe leakage, etc.), condensation (both on the external surface and inside the masonry), wind driven rainfall [
3,
4], hygroscopic salts [
5], flooding [
6] and capillary rise from ground, where water is supplied by aquifers under clay soils, underground watercourse [
7], poor drainage of rainfalls [
8], etc.
Rising damp is one of the most recurrent and well-known hazards to existing buildings and monuments. As the phenomenon of rising damp is quite slow, the damage of the building materials and structures may become visible only after several years from the construction.
The mechanism behind the phenomenon of rising damp in a wall is capillarity [
9,
10,
11]. Capillary forces are able to move water from the ground to the wall, defying gravity forces. Depending on the material, the rising humidity can reach several meters in height and theoretically can reach up to 15 m. Actually, due to the different porosities of the materials and the evaporation phenomena, the levels of rising humidity are limited to about one or two meter in height [
9].
The danger of dampness in the masonries is mainly related to the damage caused by it. Several effects connected to rising damp can be considered. The exposition of damp building materials to temperature change, freeze–thaw cycles [
12], migration and crystallization of soluble salts [
13], chemical attack in polluted environment [
14,
15] and biological decay [
16] may favor degradation processes of masonry with loss of material, detachment and structural damage. Moreover, damp walls lead to high values of indoor air relative humidity and mould growth on cold surfaces, thus causing uncomfortable indoor conditions [
17,
18] and negatively affecting the air quality. Not least the presence of water within building material pores decreases the mechanical performance of the masonry, negatively affecting also their compressive and shear strength [
19].
Among all, the damage caused by salts represents a serious problem for both historical and modern masonries. In recent decades, much research [
20,
21,
22,
23] has been devoted to explaining the mechanisms of crystal growth and the pressure of crystallization within the pores, as well as their relationship with the propagation of cracks in materials such as natural stone, brick, mortar and cement. However, the effect of the salts on the structural behavior of the masonry has not been completely clarified.
Probably some types of stone are more vulnerable than other types to salt damage, as well as some salts may cause more damage than others. Some studies have shown how different contaminants behave differently depending on the porous material (bricks, plaster and stone,) with which they come into contact, and, in turn, bricks, stones and mortars react differently to the harmful action of salts and pollutants [
24]. Because of the serious effects associated with the increase of moisture in masonries, the capillary rise of water is rightly considered a key factor for heritage conservation.
The complexity of the problem requires an accurate diagnosis of the deteriorations caused by humidity. Two phases of considerable importance are identified: The first aimed to define the current status of the artifact, is a diagnostic monitoring and is dedicated to the qualitative and quantitative study of the extent of moisture caused damages. A second stage is then dedicated to the study of the path of water and its distribution through the wall; this is done in order to determine the ways by which water triggers and accelerates damage [
25] and to support the choice of the most appropriate intervention [
26]. In the context of this work, we focus on the diagnostic monitoring phase.
It must be said that good diagnostics necessarily relies on the direct or indirect quantitative measurement of the water content in the masonry, nevertheless, this measurement is seldom an absolute quantity especially if the measure is related to the interior layer of masonry [
27]. Indeed, absolute quantitative measurement techniques of deep humidity are very limited; among these, the gravimetric method, although destructive, represents the reference methodology due to its characteristics of being well-known, reliable and frequently used. However, it has the great disadvantage of being a destructive method, making it often infeasible from a practical point of view, especially when monitoring the distribution of humidity in large masonry areas for a prolonged time (2 years or more). This is obviously due to the excessive number of points to sample in masonry of high historical and artistic value, which, on the other hand, must be treated in the best possible way. These reasons, therefore, force the use of non-invasive techniques, so as to allow rapid and low-cost repeated measurements over time, which can be applied both in the preliminary phase and during monitoring over time.
With the aim of investigating the effects of water, both at the surface and in the innermost layers of the masonry, in this study, a combination of several techniques was proposed and applied to the church San Nicola in Carcere, located in the center of Rome in close proximity of the Tiber River. As part of the ADAMO Project (Analysis, Diagnostic and Monitoring Technologies for the conservation and restoration of cultural heritage) [
28,
29,
30], a campaign of measures was carried out by a multidisciplinary non-invasive approach for the evaluation of the content and moisture distribution in the lower part of the apse of the church of San Nicola in Carcere in Rome, as well as the presence of water-related effects. The choice of the site for the activities of the ADAMO project was made for the presence of important water infiltrations in the apse and for the restoration works started in 2018 and that involved the entire church.
All the deployed techniques are well-known, reliable and non-invasive; some of them have a general consensus in the scientific community for the qualitative and quantitative determination of humidity content in masonry, namely the Infrared Thermography (IRT) and the portable Unilateral Nuclear Magnetic Resonance (NMR) [
31]. IRT has been used for many years to qualitatively map the distribution of moisture on the masonry structure [
25]. Variations in moisture content can be detected by IRT because they cause changes in surface temperature. It is known that moist areas may have a lower temperature due to the endothermic nature of the water evaporation but other physical phenomena can occur such as reduced thermal resistance and greater heat storage capacity of the moist material. IRT can therefore be useful for identifying the extent of a moisture problem, but only the combination with different techniques can reduce the uncertainty of assessing the in situ moisture of surfaces.
As the NMR is concerned, several studies allowed the validation of portable NMR technique as an analytical and non-invasive tool for mapping in situ the quantitative distribution of moisture in wall painting within the first centimeter of masonry [
32,
33,
34]. Other techniques were also applied which, although not specifically developed for the measurement of humidity in masonry, proved to be a valid aid for the definition of structural damage providing useful complementary views, i.e., the contactless Acoustic Imaging (AI), Acoustic Tomography (AT) and remote diagnostics by Laser-Induced Fluorescence (LIF). Indeed, the latter techniques do not directly assess moisture, however they can still give indirect information on the effects of water on the materials of the masonry and thus provide a complete overview of the problems caused by water infiltration on the masonry.
Recently, acoustic diagnostic techniques, developed to evaluate the structural damage of different types of multilayer structures in a non-invasive way, are now finding application to evaluate the effects of humidity in the ancient masonry [
28]. The AI is a technique applied on several artifacts and for studying different degradation causes, to evaluate structural damages due to instability of the ground or buildings, as well as cycles of absorption and evaporation of water [
35,
36,
37].
The Laser-Induced Fluorescence (LIF) Spectroscopy is a suitable tool for the identification of materials characterized by an intense emission spectrum [
38,
39]. Specifically, the diagnostic technology used is based on the measurement of the spectral and temporal characteristics of laser-induced autofluorescence, which allows for the determination of the materials used, as well as the detection of various degradation species [
40].
Romani et al. [
41] report the application of the LIF combined with other spectroscopic analyzes, in the church of San Nicola in Carcere. Their purpose is to characterize the materials found in the apse wall, painted by Vincenzo Pasqualoni, and to provide the restorers with the necessary knowledge for planning adequate conservation treatments on the paintings. However, the safeguard of the cultural heritage, considered as a single asset, requires an extensive knowledge of the masonry and wall supports, as well; for this reason, this work investigates a non-conventional application of the LIF technique, to evaluate the extent to which this technique can contribute to the definition of the effects caused by humidity.
The integrated approach proposed in this study allowed us to have the multidisciplinary point of view necessary to drive and help formulate an effective restoration intervention based on a sound scientific rationale. Nonetheless, it allowed us to experiment a holistic approach, verifying the potential of a wide range of NDTs available within the context of a restoration yard.
2. Experimental Site and Methodologies
2.1. The Case Study: San Nicola in Carcere Church
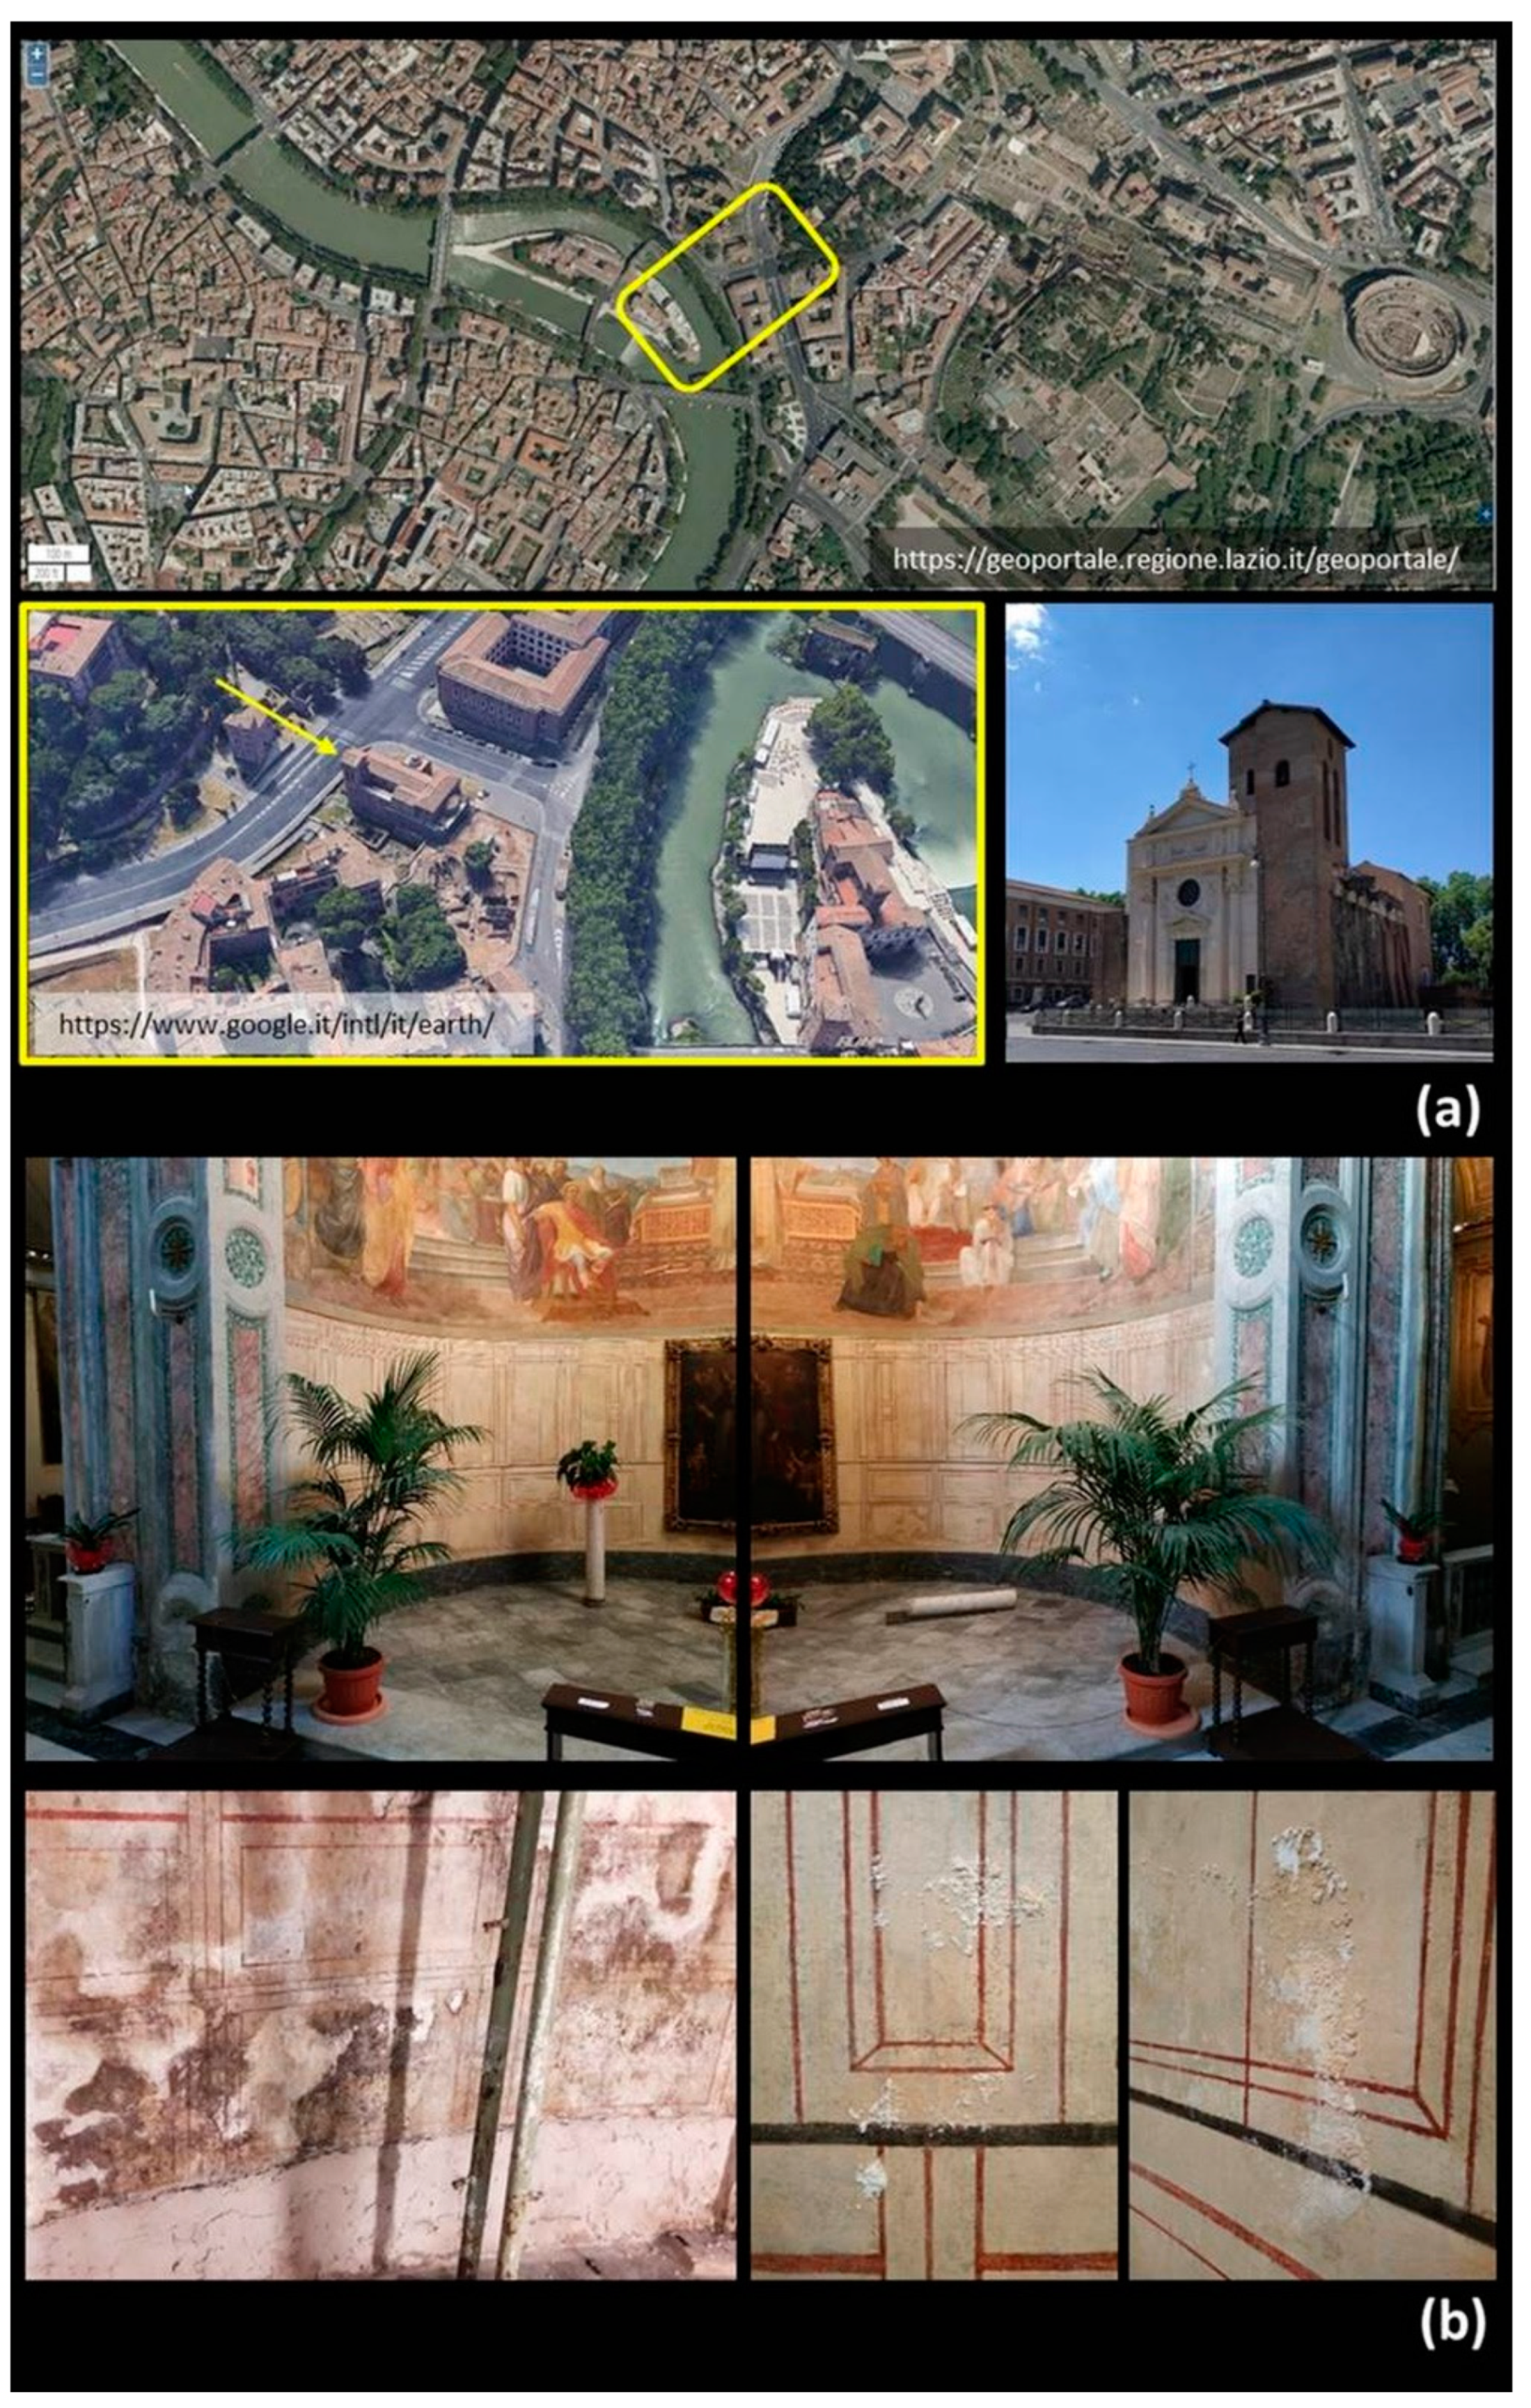
San Nicola in Carcere is one of the minor basilicas in the historic center of Rome, located near the Tiber River. Similar to many Roman buildings, layers of successive periods coexist, covering an interval of nearly 2300 years.
The church, built on the ruins of the Foro Olitorio, shares the base and part of the structures with three underlying Roman temples, whose excavations can be visited under the crypt. Its location near the Tiber River has made it vulnerable since its first construction in 1128, during the Middle Ages. The church was renovated in the late 16th century by the famous architect Giacomo Della Porta, and later in the 19th century. However, only during the first decades of the last century the church and the surrounding area underwent profound changes according to the urban plan of 1931. The neighboring buildings were destroyed and the church remains an isolated building, which shows the columns of the ancient Roman temples along the walls’ external side. With the overlapping layers of masonry structures, like many historic buildings built on Roman foundations near the river, the church undergoes important water infiltrations from the ground, the effects of which overlap with other extreme meteorological phenomena thus producing relevant damage [
42,
43]. The church is oriented to the northeast (see
Figure 1a), with the apse near the river and stands in an area known as Velabrum used as vegetable and fruit market for its proximity to the Tiber River (Tiber port) and placed between the Teatro di Marcello and the Forum Boarium. This area must have been originally swampy and subject to the floods of the Tiber although the Romans were very concerned with the drainage of their territory by building sewers to keep it dry. The high levels of humidity affected the wall of the church (see
Figure 1b), which made it necessary to periodically remake its wall paintings, which, in the latest version, date back to the mid-nineteenth century.
2.2. Methodologies Used in This Work
Table 1 summarizes the methodologies used in this work, highlighting their advantages, disadvantages and preferential fields of application. The techniques are listed according to the depth of measurement, best work conditions, analysis duration, direct contact or not contact modality.
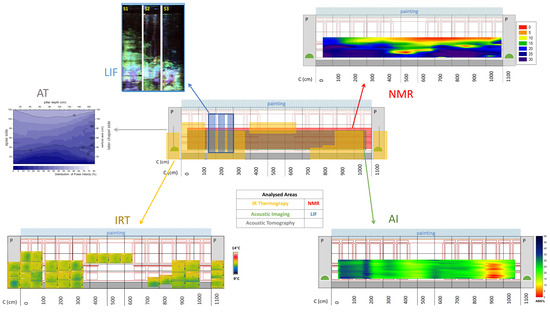
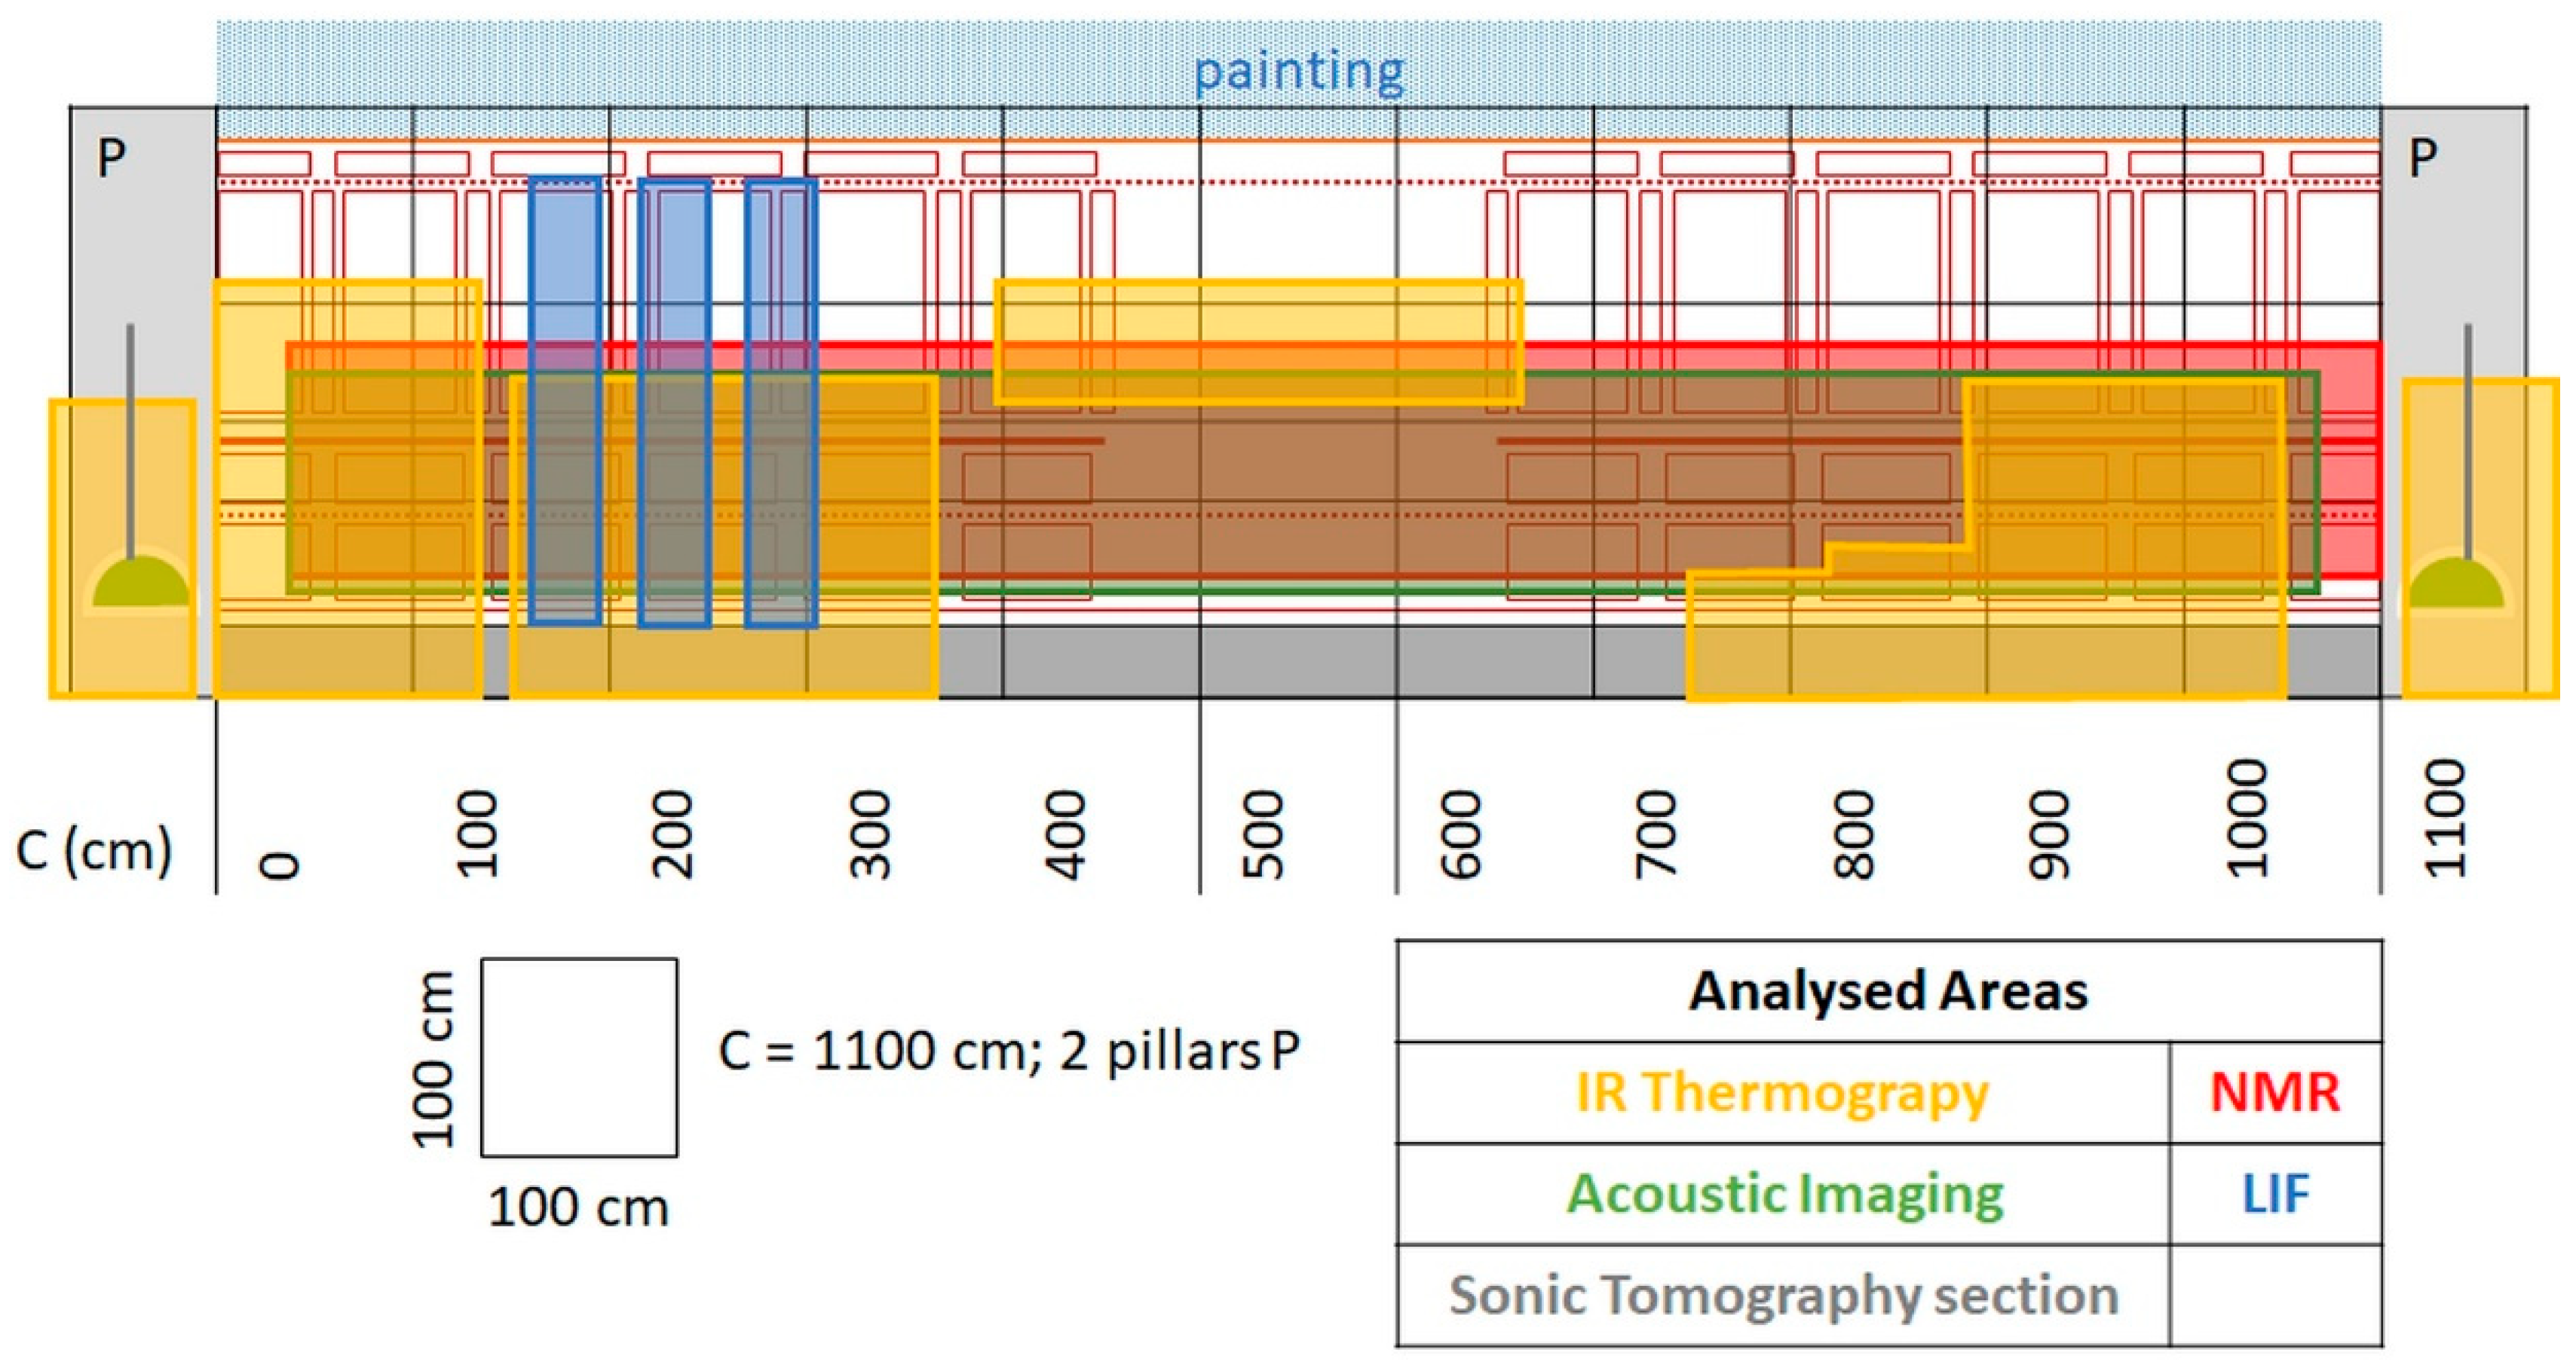
In
Figure 2, a scheme of the apse showing the areas analyzed by different techniques is reported. The analysed areas are identified by different colors depending on the technique used.
The measuring campaign was accomplished in a period of time between the end of February and the beginning of April 2019. During the investigations, the environmental parameters (indoor temperature (T) and relative humidity (RH%)) were monitored in the proximity of the instrumentations by means of a digital thermo-hygrometer (Velleman WS8461 with accuracy T ± 1 °C, RH ± 1%). The IRT, NMR and AI were conducted in sequence over 3 weeks between the end of February and mid-March. In that time period, the temperature inside the church, during the day, was fairly stable, keeping around 10–13 °C, with a relatively high relative humidity of about 80%.
2.3. Infrared Thermography (IRT)
In this study, the thermographic survey aimed to confirm and/or identify the areas or elements in which the degradation phenomena, related to the presence of water, are already in place by analyzing the surface temperature of the wall [
2,
25,
44,
45,
46].
However, thermography can be influenced by several parameters as the environmental conditions and properties of the investigated surfaces that need to be considered when taking measurements and interpreting results. The measurement accuracy is affected by weather conditions (direct sunlight, cloud cover, wind speed, rainfall and air temperature), which vary during the time of day (day or night) and time of year; surface emissivity coefficient (which varies with color and type of material); and presence of heat sources near the measurement area; distance and angle to the surface target [
47,
48]. In addition, thermal images can be acquired in active mode by heating the surface or in passive mode, without heating.
In San Nicola church, the investigations were performed in order to identify the superficial thermal distribution of the masonry, made of brick covered by a layer of mortar (lime and pozzolana), and of the plasters that presented problems of humidity, to assist the restoration of the entire church.
The instrument used to carry out this thermographic survey was a thermal imaging camera, ThermaCAM B4 series (Flir Systems AB, Danderyd, Sweeden), having the following features: thermal camera working in the spectral range of 7.5 to 13 μm, thermal sensitivity of 0.08 °C (30 °C), thermal image of 320 × 240 pixels, calibration for building inspections (from −20 to +100 °C) and microbolometric non-cooled FTA detector (Flir Systems AB, Danderyd, Sweeden). The investigations were carried out in passive mode. The images acquired by the thermal camera were later reprocessed, using the ThermaCAM Quick View™ software version 2.0, 2006 (Flir Systems AB, Danderyd, Sweeden), particularly to create and align infrared images.
The thermographic survey was performed mainly in the lower area of the apse, from the floor up to about 200 cm in height, compatible with the presence of the metal scaffolding that created interference with the acquisition of the thermograms. Each measurement area, from left to right and from bottom to top, was divided into 3 sectors of about 50 cm, with the exception of the second and fourth areas on the left, which were divided into 4 sectors, up to a height of about 200 cm, taking into account the constraint of the presence of the scaffolding during the measurements.
2.4. Unilateral NMR
In this study NMR measurements were performed with a portable NMR instrument [
49,
50,
51,
52,
53] from Bruker Biospin, operating at 17 MHz, at a depth of 0.3 cm from the surface, fully disregarding the signal from the surface. The maximum echo signal corresponding to a π/2 pulse was obtained with a pulse width of 3 μs. The dead time was 15 s. Measurements were carried out lower part of the apse along a matrix of 50 points appropriately chosen to cover an area with a height of 120 cm and a width of about 1100 cm. The first row of point was at a distance of 60 cm from the floor, and the row and column spacing was 60 cm, respectively. Each measurement took about 600 s; each measured point corresponded to an area of 10 cm
2, which is the area that the probe head detects. The matrix of obtained data were interpolated to achieve a contour plot [
30,
50], representing a three-dimensional surface in which the x–y plane shows the dimension of matrix measured on the apse surface, and the z-axis contains the amplitude values of the NMR proton signal. Since the probe head detects the hydrogen signal of moisture at a selected depth inside the wall, the intensity of the NMR detected signal is directly proportional to the water content [
54]. To determine the MC in the apse, a proper calibration of the
1H NMR signal was performed by using 4 model plaster samples prepared to reproduce the same type of mortar used in the wall under investigation.
The calibration between the water content of the model samples, and the NMR signal was performed by using the imbibition coefficient (
ic), according to the following equations [
32,
53]:
where
Api is the amplitude of the NMR signal measured on the vault,
Apmin is the lowest value of the amplitude measured on the apse, and
Aspw and
Aspd are the average values of the amplitude of the NMR signal measured in the dried and water-saturated model plaster samples, respectively.
Psd and
Psw are the weights of the model plaster samples in dried and water-saturated conditions.
The maximum value of the integral of the NMR echo signal measured on the apsidal wall corresponded to about 30% of moisture content. The error was lower than 10% of the nominal value.
2.5. Contactless Acoustic Imaging (AI)
Acoustic and Ultrasonic techniques commonly integrate other well-assessed methods in historical masonry diagnostics (FP5 Onsiteformasonry project) [
55]. For this study, a contactless Audio Frequency Acoustic Imaging (AF-AI) technique [
35,
36,
37] based on the evaluation of acoustic energy absorption was applied to detect the moisture related effects on the apse wall. The technique adopts the acoustic energy absorption coefficient as a proper indicator of structural damage in mural structures, because the dynamics of the wave-material interaction, contributing to the overall acoustic response, is governed by the structural properties of the materials [
56,
57,
58,
59,
60,
61,
62].
The device, named Acoustic Energy Absorption Diagnostic Device (ACEADD) (Laboratory of Acoustics Research applications for Cultural Heritage of INM, Rome, Italy), automatically scans an area, while an acoustic source radiates towards the surface an acoustic wave with audible frequency content. A microphone, placed amid the source and the wall, records both the incident wave
pi(
t) and the reflected wave
pr(
t). The composite acoustic pressure signal
p(
t) is proportional to the so called impulse response,
h(
t-
τ), of the analyzed area centered in the point of measurement, accounting for the time delay
τ at the receiver between the incident and the reflected waves. The impulse response
h(
t-
τ) and its Fourier Transform,
H(
f), determine the acoustic energy reflection and absorption coefficients [
62]. Thus, for each measuring point (i) the total amount of reflected energy Σ is calculated over the entire frequency interval (Equation (3)), while the percentage of acoustic energy absorption
ABS% is calculated with respect to the most reflecting point R (Equation (4)).
For the on-site investigation, the area of interest of the apse horizontally spanned from left to right, from 37 to 1068 cm along the semi-circumference. Fourteen vertical profiles have been analyzed, uniformly distributed within the area of interest, and at the height between 163.5 and 53.5 cm from the ground. The measurement was carried out by employing a broadband signal with audio frequency content in the (1–15) kHz interval, delivered towards the apse wall, and analyzing 23 points in each vertical profile, 5 cm distant from one another. The results are configured as a false-color image displaying the quantity ABS%, over the entire frequency interval, commonly using a 0–100% scale or other reduced range if needed. We expect to reveal differences between ABS%w (wet wall) and ABS%d (dry wall), and to understand if there is a critical weakening of the masonry.
2.6. Acoustic Tomography (AT)
Among the most widely used techniques for Non-Destructive Testing (NDT), the AT is a powerful tool for investigating the inner structure of materials and walls, reconstructing cross-sectional slice images by elaborating data of transmitted acoustic signals [
63], evaluating the good condition of many infrastructures’ components.
The procedure consists in measuring the time of flight of a longitudinal sonic wave, generated by a sound generator and propagating into the object under test. An impact hammer is commonly used to produce a sonic pulse while an accelerometer, placed at a known distance, receives the wave and converts it into an electrical signal. Thus, the pulse velocity is the ratio between the path length across the sample and the measured time of flight; however, it is important to remind that the resulting pulse velocity is indeed an apparent quantity because, for the calculation, the minimum linear distance between the impact point and the receiver is assumed. Unfortunately, this assumption is not always physically meaningful: The sonic stress wave may follow a different and more complex path; hence, in this case the above, pulse velocity underestimates the real propagation velocity [
56,
64]. Nevertheless, the occurrence of defects and heterogeneities is correctly indicated. For each measurement, the acquisition system simultaneously records the impact hammer signal (that is an instrumented hammer with an embedded force sensor) and the accelerometer signal.
In this case study, the AT was applied to the two pillars, whose depth is 172 cm for the right one and 162 cm for the left one, revealing the masonry status in the depth by two cross-sections. The instrument hammer with rubber was positioned on the apse side and the impulse generated by beating on the masonry; while the accelerometer was placed on the other side of the wall, held by a tripod. For each pillar, the measurement line was a vertical axis positioned about 30 cm from the external face, starting from 70 cm from ground extended for 120 cm. Each cross-section consists of 144 measurements resulting from the combination of 12 impact points and 12 accelerometer positions, 10 cm distant from one another, elaborated by means of a proper signal processing. The signal processing is based on the Back Projection (BP) algorithm from the projections of the sound paths, and the tomographic reconstruction is accomplished by a software custom-developed by “Enea Casaccia Research Center”. The processing discretizes the cross-section of the investigated structure, dividing it into N cells with known dimensions, according to the number of projections and the extension of the structure. Each path is characterized by a specific pulse velocity value, while a defined number of paths crosses each cell. The output is a matrix,
V, whose element is the average of the velocity values relative to the paths crossing a specific cell, as expressed in Equation (5):
where
p is the path index, and
L is the number of paths crossing the
ij-cell. The cycle is repeated for all cells, thus constituting the pixels of the tomographic image.
2.7. LIF Measurements
LIF analyses were performed by using a portable scanning hyperspectral system developed at the ENEA center in Frascati: The apparatus performs remote standoff measurements, collecting large area fluorescence images with spectral and spatial resolution. The LIF sensor prototype used in this work is described in detail in previous works [
65,
66,
67]; only a brief description is provided here, to highlight the aspects relevant for the measurements made in the San Nicola church.
The excitation source is a 266 nm Nd: YAG laser that emits pulses of 8 ns duration at a repetition frequency of 20 Hz (ULTRA 30 Quantel). To avoid laser caused damages, the light pulse energy was kept under the damage threshold of 0.1 mJ/cm
2 [
68]. The excited fluorescence signal is collected by an objective (70 mm f#4) and spectrally dispersed by a fixed grating spectrometer (Horiba CP-140) with an input slit of 0.1 mm. The optical sensor (ANDOR model ICCD DH734-18) is positioned in the focal plane of the spectrometer and is sensitive in the spectral range between 250 and 800 nm; the spectral resolution is approximately 5 nm. Data acquisition was performed by time-integrating the fluorescence decay within a temporal window (gate) of programmable duration and delay (the delay is with respect to the laser ignition pulse). The delay is used to investigate the fluorescence temporal response in several points and to compensate the time shift due to the two-way time lag between the acquisition system and the surface under investigation. In this work, 0 and 100 ns were used, respectively, for the gate delay and width: This operation mode assured the time signal integration throughout its decay. All the components, including the motorized scanning system are under the control of a Personal Computer. The experimental apparatus is managed through an ad hoc developed software (LabVIEW 12 by National Instruments). It provides the control of the scanning and of the data acquisition; data preprocessing is also integrated in the control software so that images are readily available in grayscale on a single fluorescence emission band or in RGB false colors, using three freely selectable emission bands [
69].
In the San Nicola apse, three areas were examined with approximate dimensions of 40 cm by 220 cm; the number of horizontal lines was 600, and it corresponds to the number of scanning points along the vertical direction. The 1024 points in each line were decimated to 300 in order to limit the image size and to bring the pixel aspect ratio close to unity. A fluorescence spectrum was stored for each scan point.
3. Results
3.1. Infrared Thermography (IRT)
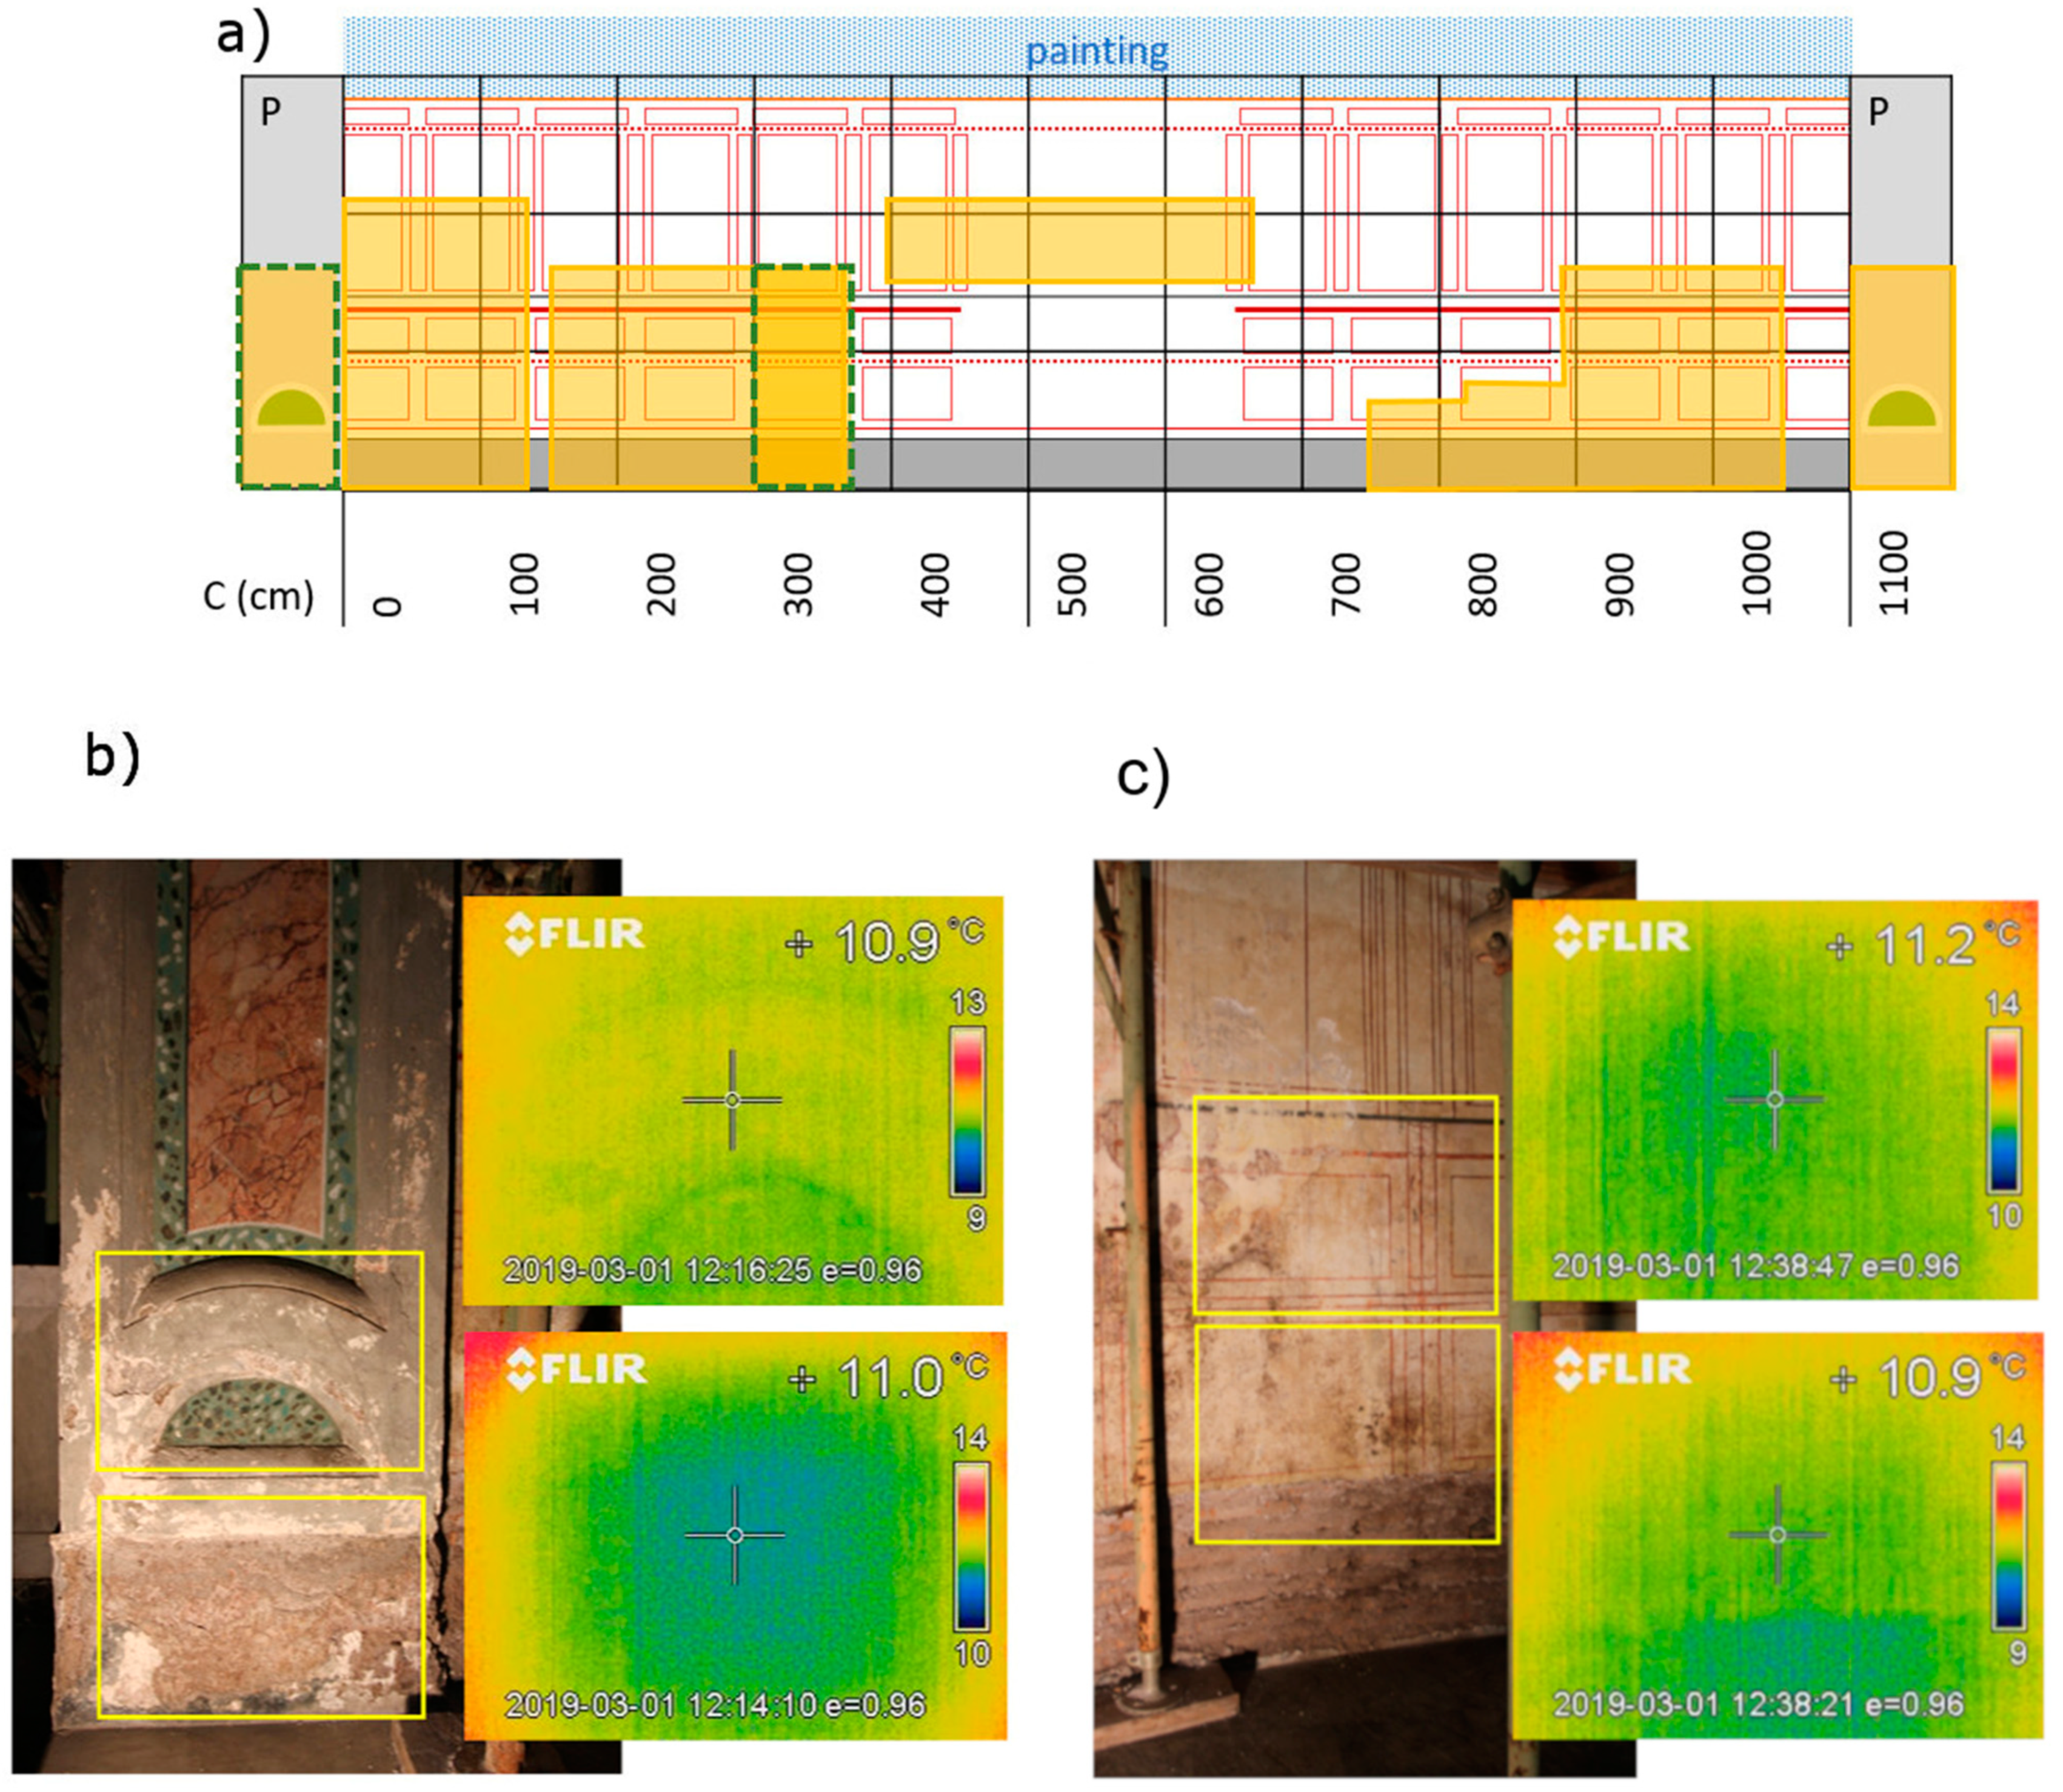
In this study the measurements were carried out inside the church of San Nicola, precisely in the lower apse area, where a difference in behavior was identifiable between the left and the right side and from the bottom to the top of the apsidal walls from a first visual examination. The presence of moisture in the masonry has caused obvious chromatic alterations (real patches of humidity, as well as the presence of consistent saline efflorescence in the plaster). The acquired thermograms allowed us to detect the presence of high humidity in the lower part of the masonry both of the pillars and of the apse (about up to 50 cm, detected temperature equal to 10–11 °C). Throughout the low perimeter area of the apse, the brick blocks appear without the mortar layer, the plaster was recently removed to allow moisture to drain away. In accordance with the visual and NMR investigations, the thermographic images (
Figure 3) well show the presence of humidity since the colder areas are restituted in blue color, as in the case of the brick blocks area and in the left plastered pillar. Surface characteristics are known to be a key factor for IRT, but the high and very similar values of emissivity of these masonry materials allow for an accurate measurement of their temperature. Then, going back towards the top of the masonry, the thermographic analysis detects warmer areas restituted in green and yellow color, which indicate that the wall is drier.
The presence of humidity mostly characterizes the lower area of the apse and the pillars as well as the left part of the apse up to about 200 cm in height.
Finally, the investigation at the top of the apse with the wall painting was made to dispel any doubts to the restoration company, confirming that in this zone there are no traces of damp due to infiltration through the ancient roof.
3.2. Unilateral NMR
The portable NMR was first used in 2007 [
52], to assess the moisture content in the frescoes, but subsequently, in 2009, a multidisciplinary study allowed for the validation of the portable NMR as an analytical and non-invasive tool to map, in situ, the quantitative distribution of humidity in wall painting within the first centimeter of masonry [
32]. This study consisted in combining the NMR technique with techniques already in use for the assessment of humidity in masonry such as IRT and gravimetric tests. Afterwards, the portable NMR was also compared with other surface techniques and with techniques capable of investigating more internal layers of masonry [
33,
34]. This comparison highlighted the techniques based on their reliability and feasibility for field use, working conditions and costs associated with the use of tests.
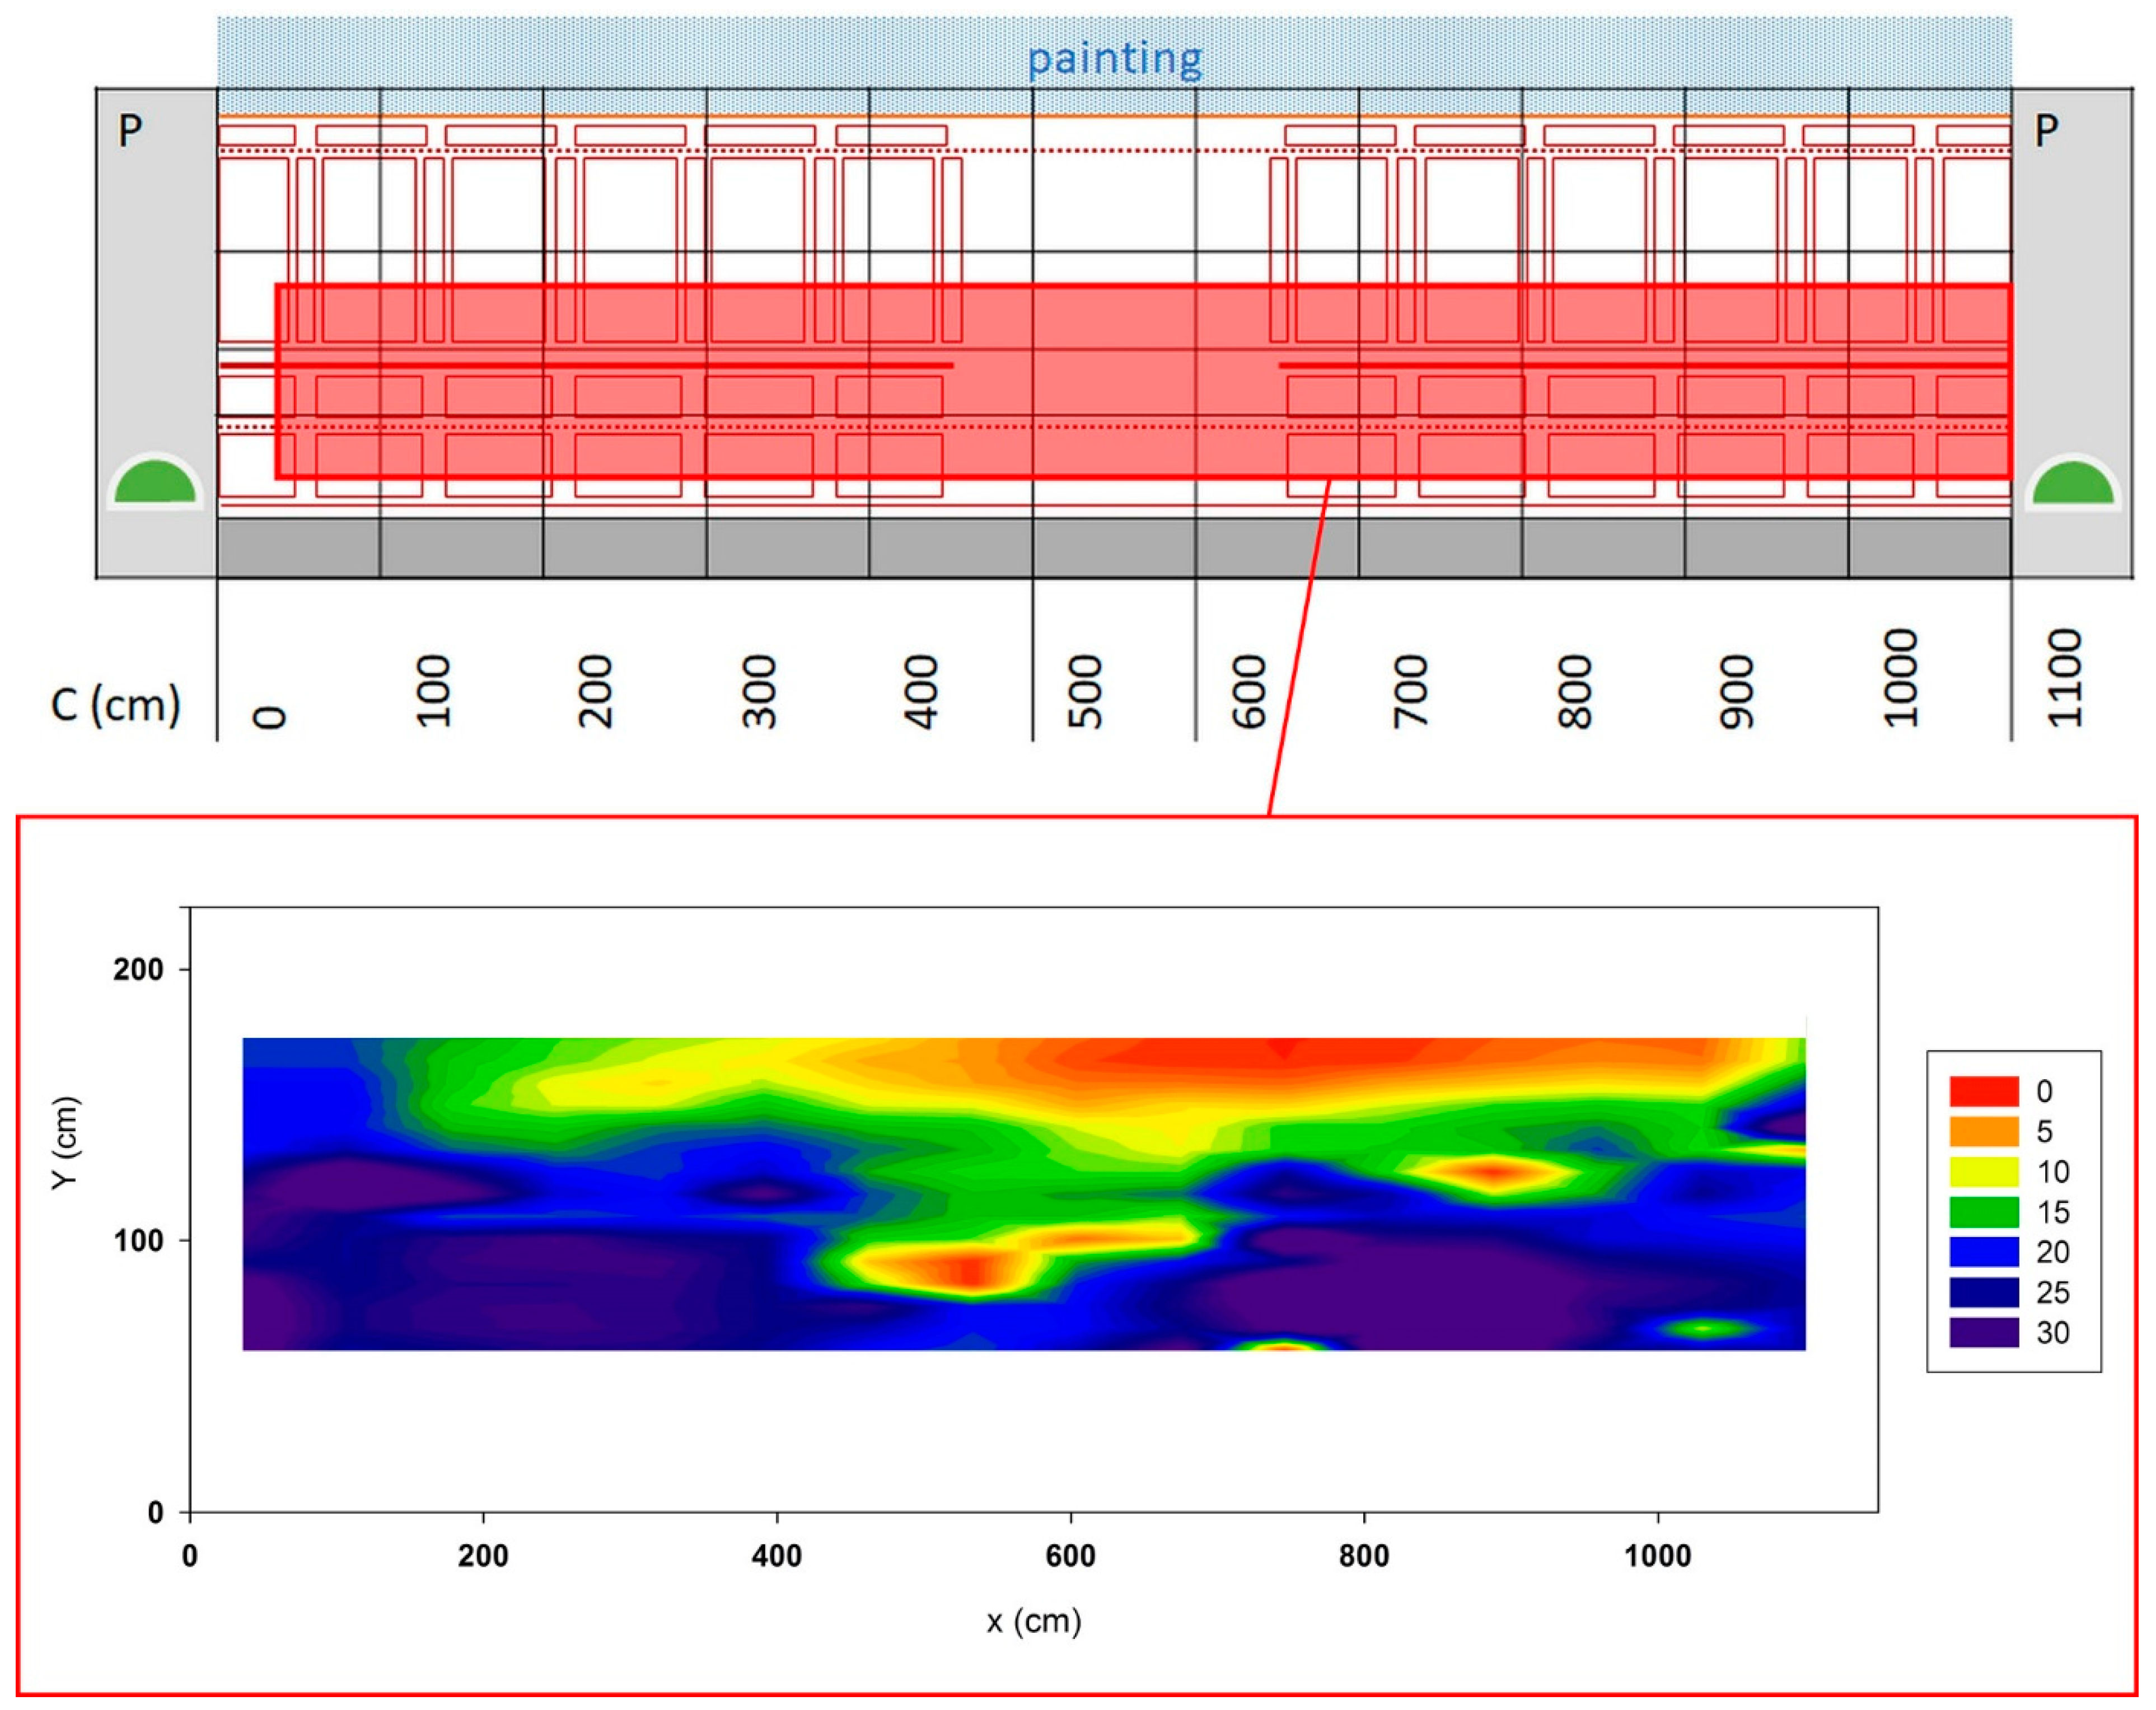
The moisture distribution map obtained in San Nicola by Unilateral NMR data processing is reported in
Figure 4, together with the scheme of apse where the area analyzed is shown. Contour plots obtained allowed an easy visualization of the detailed distribution of the moisture in the masonry. In these maps, the difference in the moisture level was represented as a gradient of color: Dark red indicates the lowest moisture content, whereas dark blue indicates the highest moisture content. As shown in
Figure 4, the distribution of the moisture gives a clear image of the front of the rising damp. The wetter areas were found on the left and right sides of the apse, where the wet front reaches a height of about 1800 and 1500 cm respectively, while at the center the humidity does not rise beyond 70–80 cm.
By carrying out an appropriate calibration of the NMR signal, as previously reported [
32,
53], it was possible to quantify the moisture content in the masonry. Specifically, in the most humid region, an MC
NMR value of 30% was found. In fact, according to the calibration assessment, the maximum amplitude of the NMR proton signal, measured in model samples, corresponded to 30% of the water content absorbed by masonry of apse.
3.3. Acoustic Images
Different mechanisms concur to produce acoustic energy absorption. Materials and structures under the action of an external acoustic pressure field, resonant parts or porosity, or simply poor elastic properties, result in a weak acoustic reflection. Assuming an acoustic wave crossing the surface of a wall at normal incidence, at the interface between the air and the wall, the incoming wave is partially reflected back, and partially transmitted within the wall. The acoustic energy absorption coefficient, α, accounts for that fraction of incident energy that is not reflected back by the wall. Since α cumulates the effects of the different mechanisms, the integration of other information is helpful. Vibrations at specific frequencies are the typical mechanism identifying detachments and delaminations, since a subsurface cavity is well represented by a resonating mass-spring model, as treated in detail in previous publications [
35,
36,
37].
At an initial visual and manual inspection, the apse wall did not present any relevant detachments but in a limited central portion, which provides a different sonic response to the traditional method used by the restorers by gently tapping the surface. Furthermore, in this central part mould was not visible, suggesting that moisture effects at the surface were not relevant in this zone. These simple observations indicate that the San Nicola’s apse could be a useful case study where the acoustic absorption due to light detachments could be separated from the acoustic absorption due to moisture content. The validity of this last consideration is restricted to the present case study and should be confirmed by the multiplicity of applied methods. While, for a more general statement regarding the ability of AI method to discriminate acoustic absorption due to detachments and to wet masonry, as well as the AI sensitivity to moisture content, a much wider and focused analysis is required which is beyond the scope of this work.
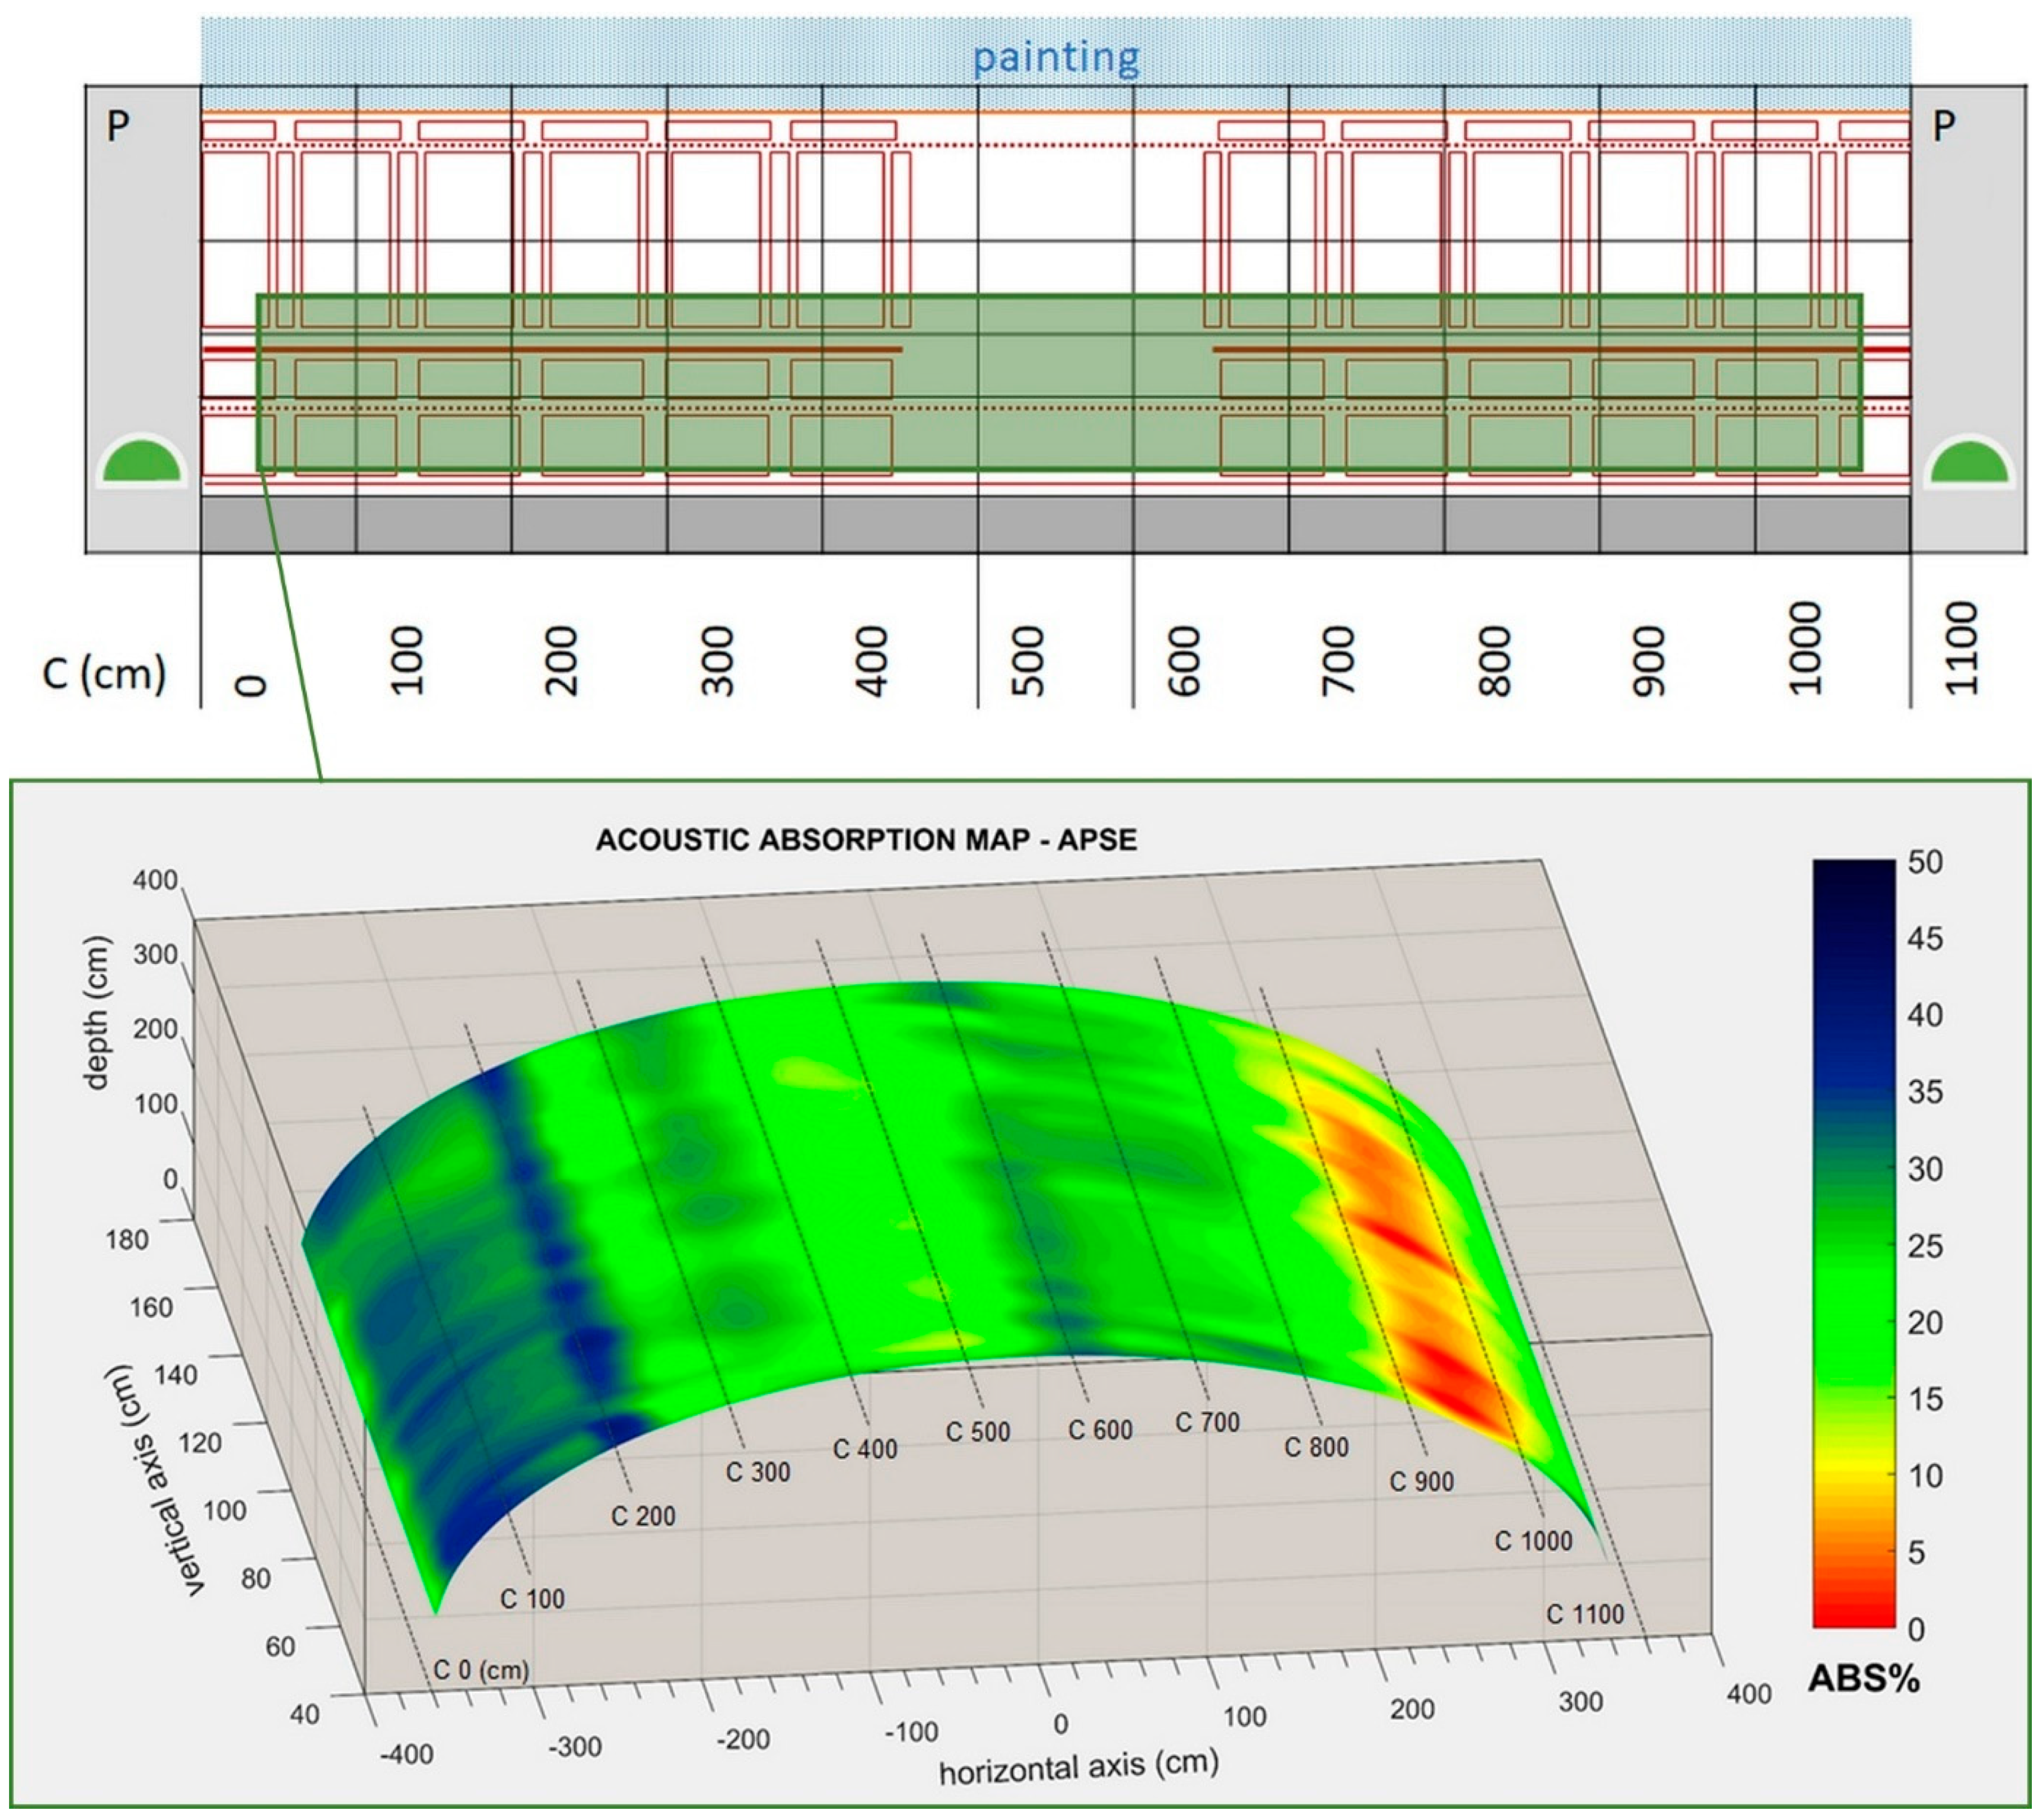
Figure 5 shows the experimental data as an acoustic map reproduced on the 3D geometry of the apse, a semi-cylindrical shape with a radius of 350 cm, giving an extended view of the wall under study. The apse geometry also provides the coordinate along the semi-circumference,
C, in centimeters, having its origin in the left-end corner near the left pilaster.
The acoustic absorption percentage, ABS%, is displayed as a surface enhanced by the false-color scale, ranging between 0% and 50%. The areas with the highest acoustic energy absorption (up to 40%) are depicted in blue, while the most reflecting points (down to 0%) are depicted in red.
The sectors on the left, C (50–250) cm and C (300–400) cm, present the highest absorption values found in the investigation; this evidence indicates a potential weakening effect of the wall structure in these sectors. In the right-center sector, C (550–800) cm, the investigation reveals a lightly absorption area, evidenced in light blue. This zone is mainly related to a detachment and not to the moisture content, in agreement with the initial visual inspection. The right sectors, C (900–1100) cm, appear to be in a good state, and the measured points present the lowest absorption values.
These data qualitatively complete the evaluation of of the decay in the apse with the evidence of a wall weakening process due to a modification of elastic properties of the first layers of masonry mainly in the left-end sector. The quantitative assessment is one of the aspects needing further insight, in order to better understand a potential calibration procedure for the moisture related problems.
3.4. Acoustic Tomography (AT)
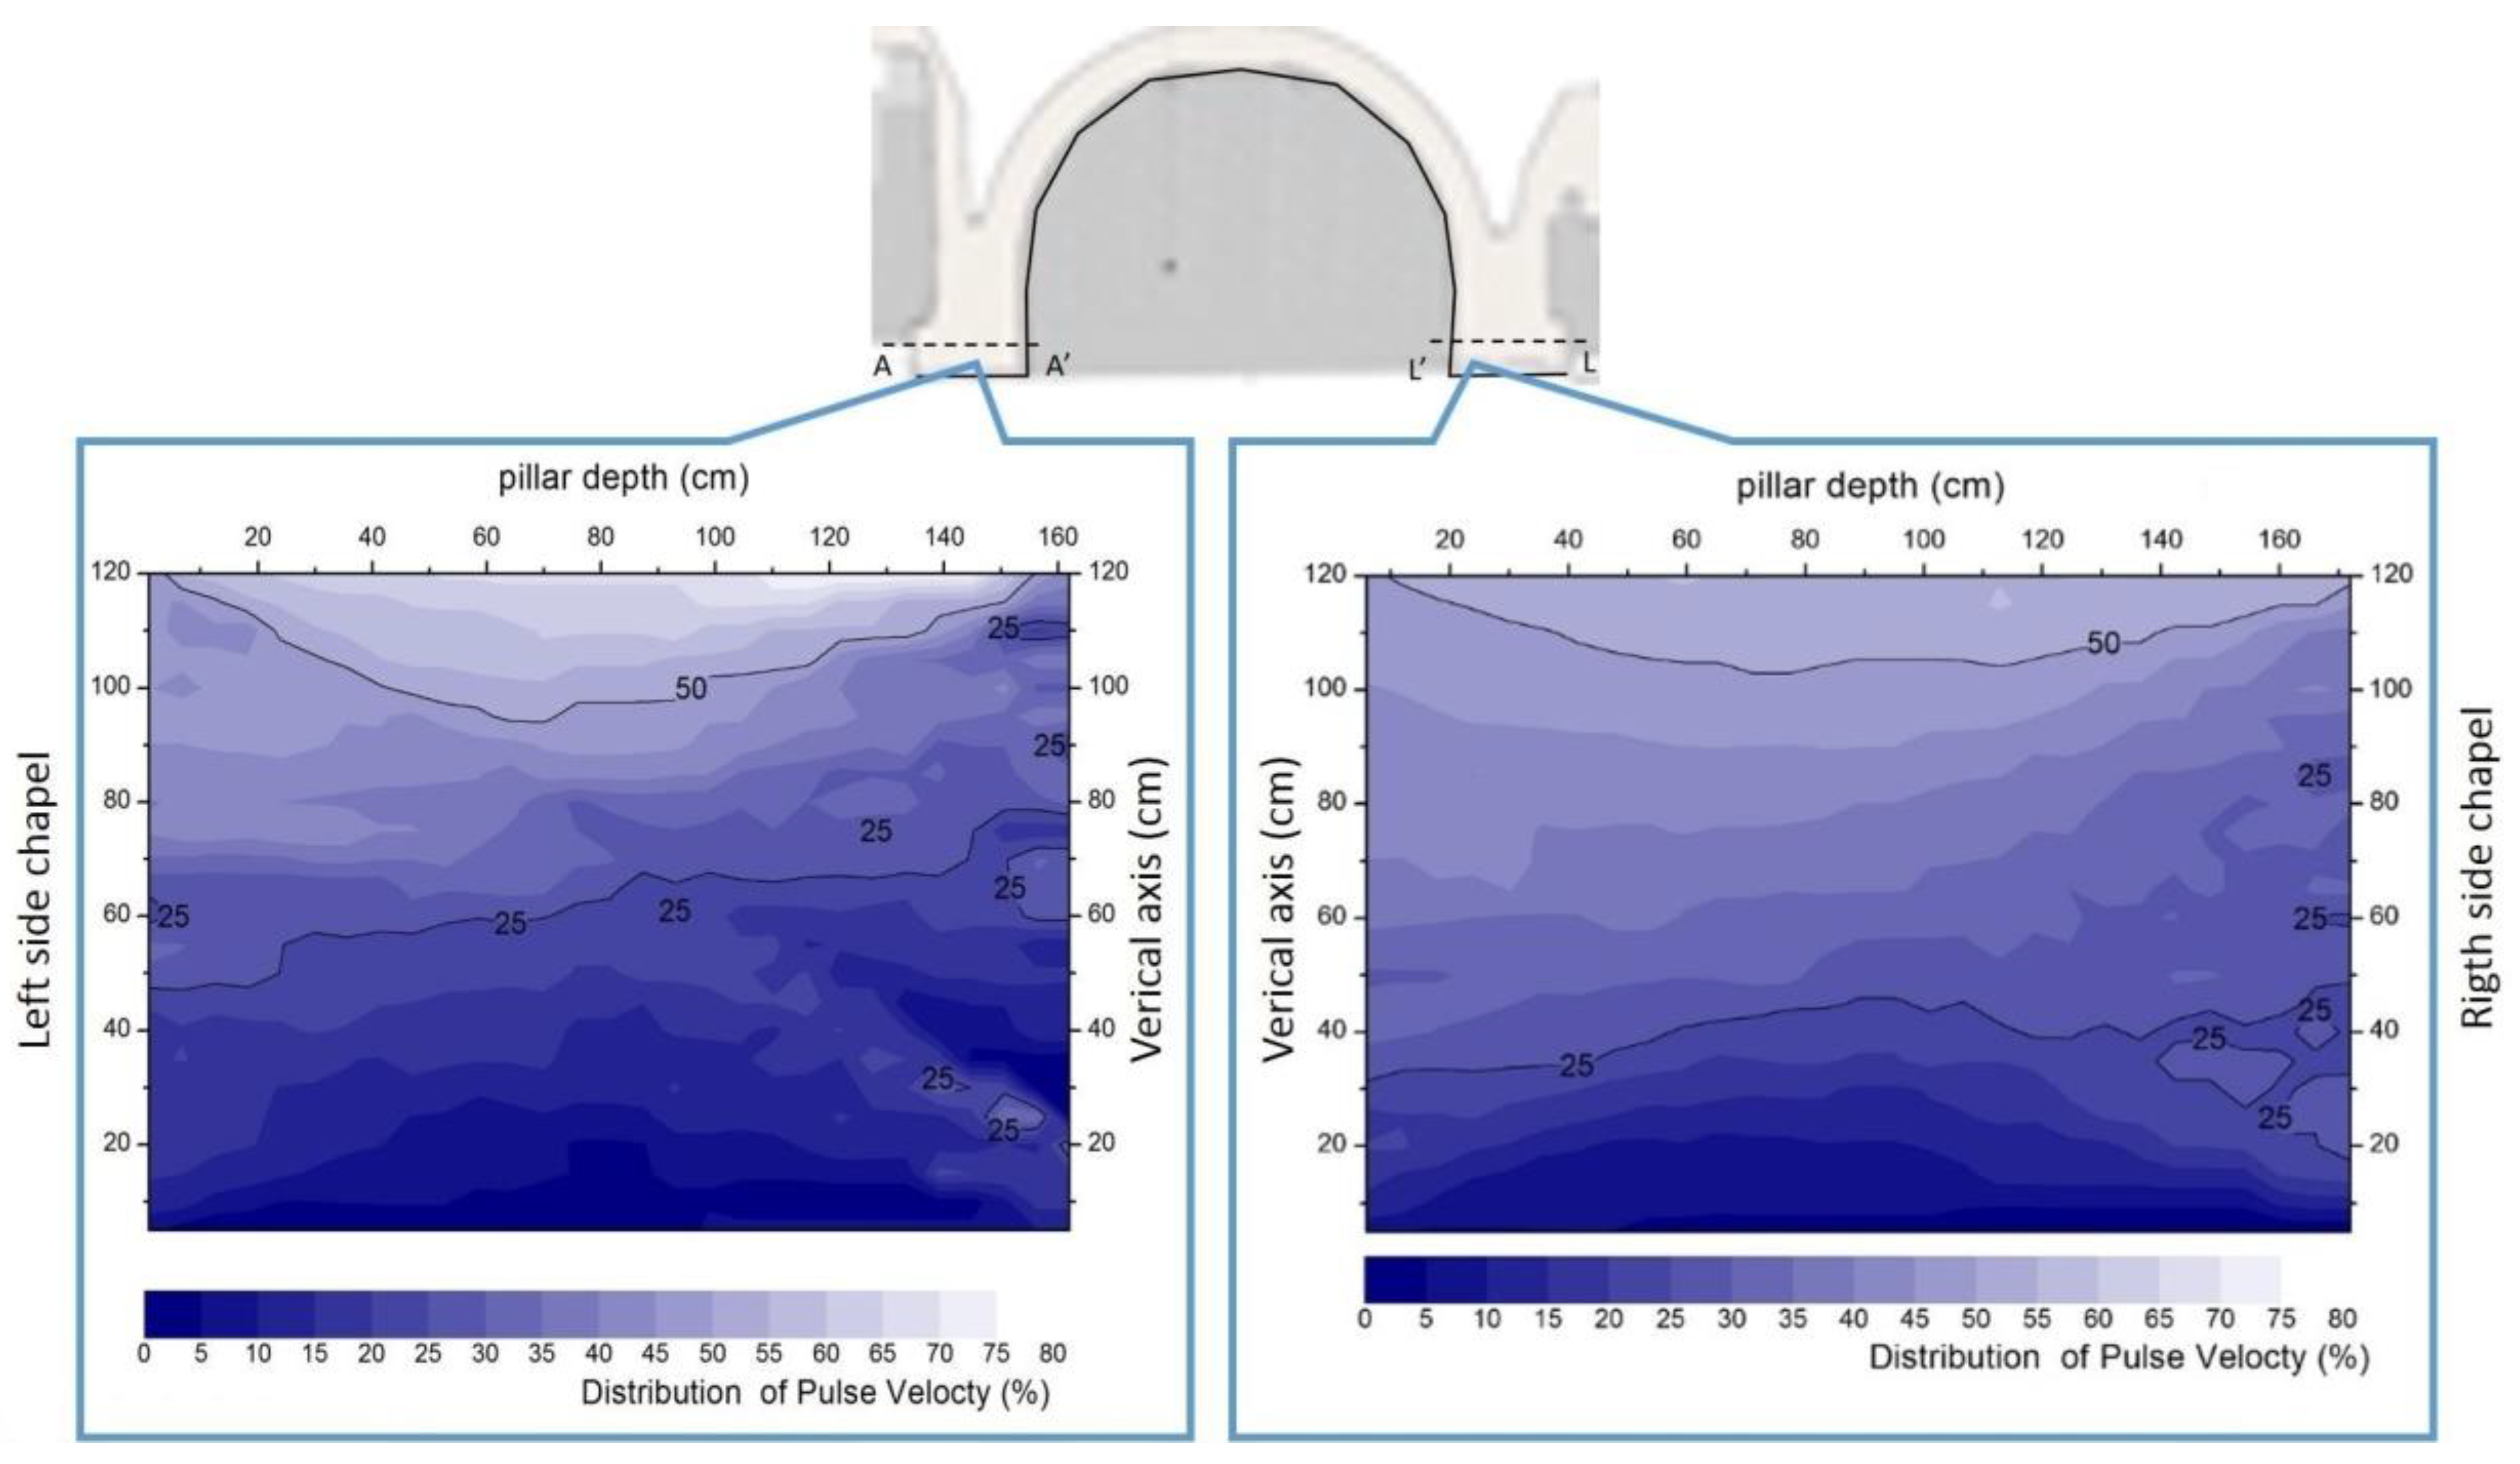
The AT results, as reported in
Figure 6, are displayed as 2D maps providing the distribution of pulse velocity inside the masonry, whose values are expressed as relative variation with respect to the point of maximum velocity in order to emphasize the velocity gradient. The cross-sectional slice image of pulse velocity usually highlights the internal morphology of different materials, indicating the degree of homogeneity, the presence of defects and discontinuities or lack of adhesion. Indeed, the sonic velocity of a material depends on its physical conditions of density, porosity, humidity and other chemical–physical parameters [
70].
In both the pillars the measured velocity values resulted very low (below 750 m/s), suggesting an internal inhomogeneous structure with potential discontinuities [
71]. The left side showed a velocity gradient that decreased upwards, up to about 66%. Similarly, on the right side the velocity gradient decreases upwards up to about 56%. These gradients in the velocity distribution are related to the structure masonry of the pillars but could be correlated to the gradient of humidity too. The ultrasonic velocity of a material depends on its physical conditions of density, porosity, humidity and other chemical parameters. The presence of humidity in the masonry has increased its acoustic impedance compared to a dry masonry. The impedance of water is about 500 times that of air. To confirm this hypothesis, laboratory tests were carried out on two samples consisting of a tile and a thick layer of plaster that simulates the conditions of the church. One sample was left dry the other was subjected to a water bath. The wet sample was left to dry for 30 days, while retaining the humidity inside. The results obtained confirm the hypothesis that the velocity is higher in the wet sample than in the dry one. On the masonry this velocity variation is visible both on the vertical and between the pillars. Such low velocity values could mean brickwork that is sack and not full. However, it should be considered that the AT results are very complex to interpret when the technique is applied to historical masonries, which have undergone various changes over the centuries and poor information about the materials and the structure of masonry (for instance sack masonry) are available.
3.5. LIF Measurements
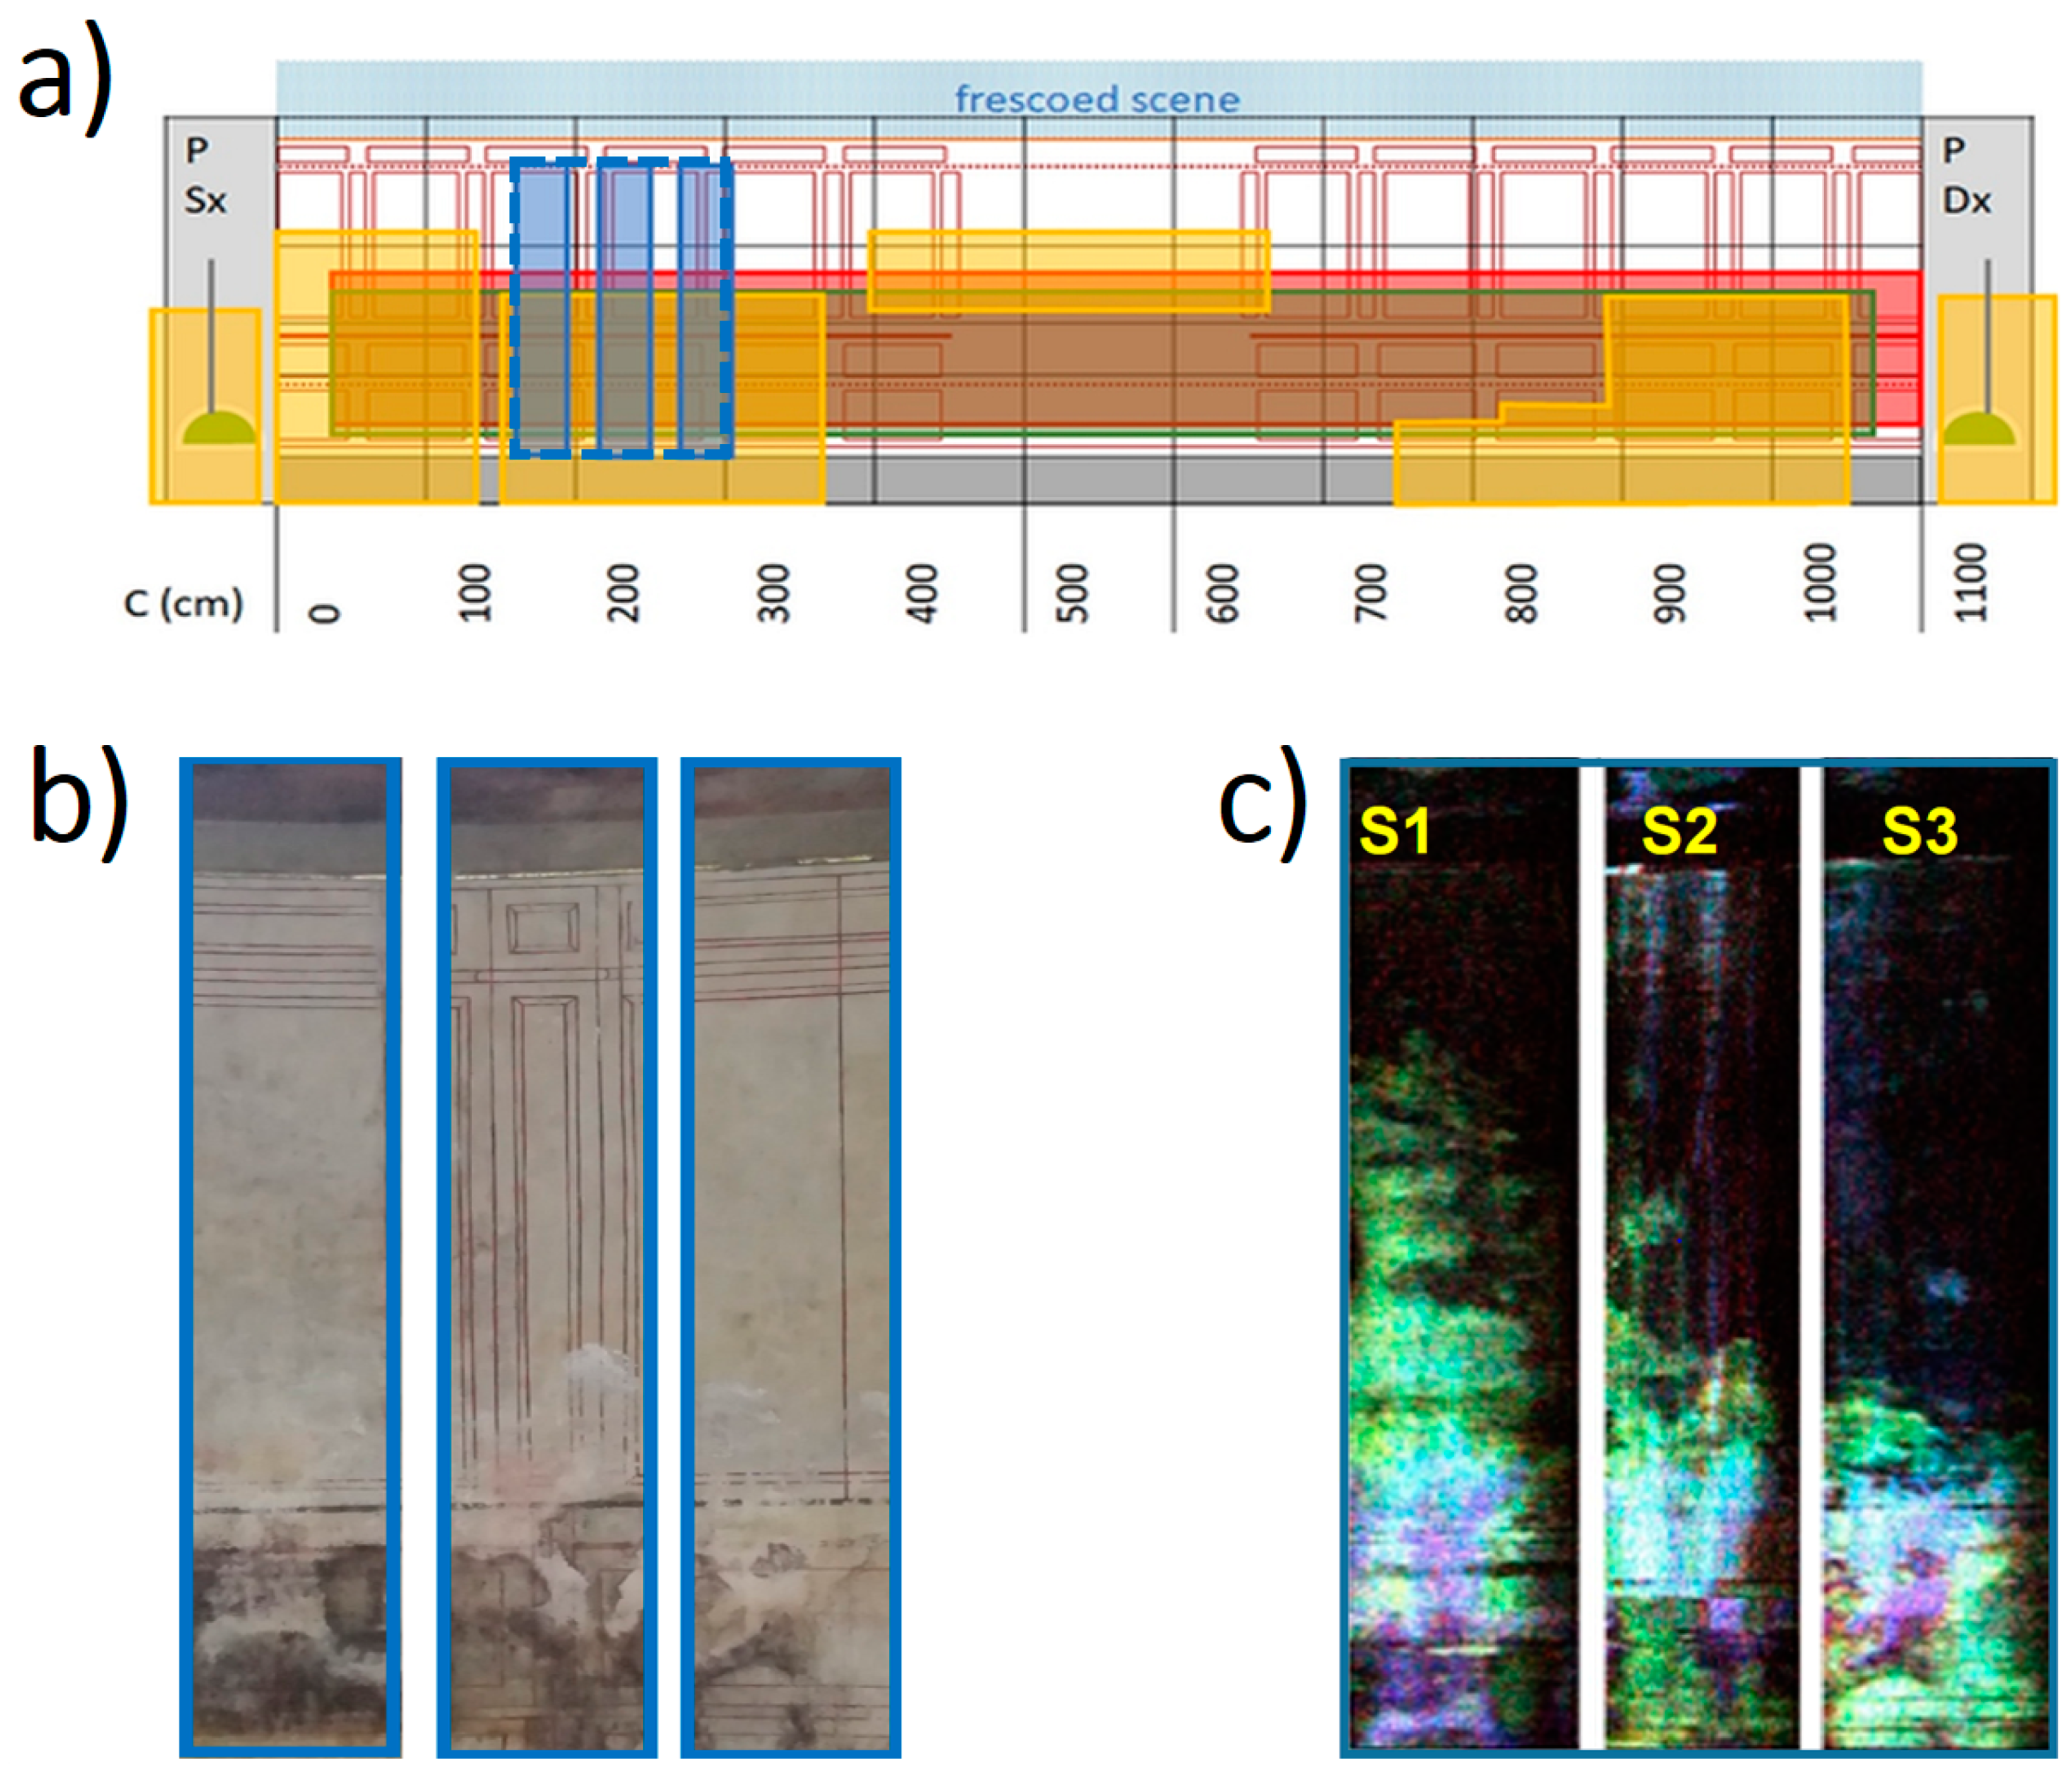
The LIF analyses were performed in the lower left part of the apse masonry, following the indications of the restorers.
Figure 6 shows the scanned areas identified with labels S1, S2 and S3, from left to right. Few portions of the apse’s wall in San Nicola church show peeling that leaves the underlying mortar uncovered; the mortar fluorescence spectrum was measured to be of considerable intensity (quantum yield > 1–5%) with prominent bands in the 400–600 nm region. The scans shown in
Figure 7 are the RGB false color obtained by combining the normalized bands emission intensity at 340, 420 and 550 nm.
The wall finishing in the scanned area has a uniform covering, upon which a geometric pattern is outlined, presumably related to the presence of wooden chairs now removed. With exceptions due to the geometric drawing, a homogeneous fluorescence intensity is therefore expected, corresponding to the spectral signature of the wall painted substrate. Indeed, the upper right part of the images shown in
Figure 7 is rather uniform and almost black, i.e., with little or no fluorescence at all: This result is consistent with the use of a non-fluorescent pigment (e.g., ocher or the like). Other features highlighted in
Figure 7, are the lighter vertical stripes characterized by a slightly higher fluorescence signal in the 400–550 nm band; this is attributed to the partial removed of the pigment caused by water drip from the upper part of the wall, occasionally witnessed in this church. On the lower part of the image of
Figure 7, a large inhomogeneity shows up, which is attributed to the diffuse deterioration, somewhere visible also to the naked eye on the investigated areas. In this region large chromatic unevenness is evidenced. In situ inspection on this area revealed different kinds of deterioration: The areas characterized by a greenish color are affected by a high moisture content, and the brighter parts mainly occur where water infiltrations and efflorescence are observed. Furthermore, some portions likely subject to a biological attack, are restituted in
Figure 7 as blue/violet colored areas; these are characterized by intense emission in the 320–330 nm band which is attributed to protein-like substances [
69]. However, protein-type substances are more likely, since, to our best knowledge, no restorations or consolidation treatments were realized in the investigated area.
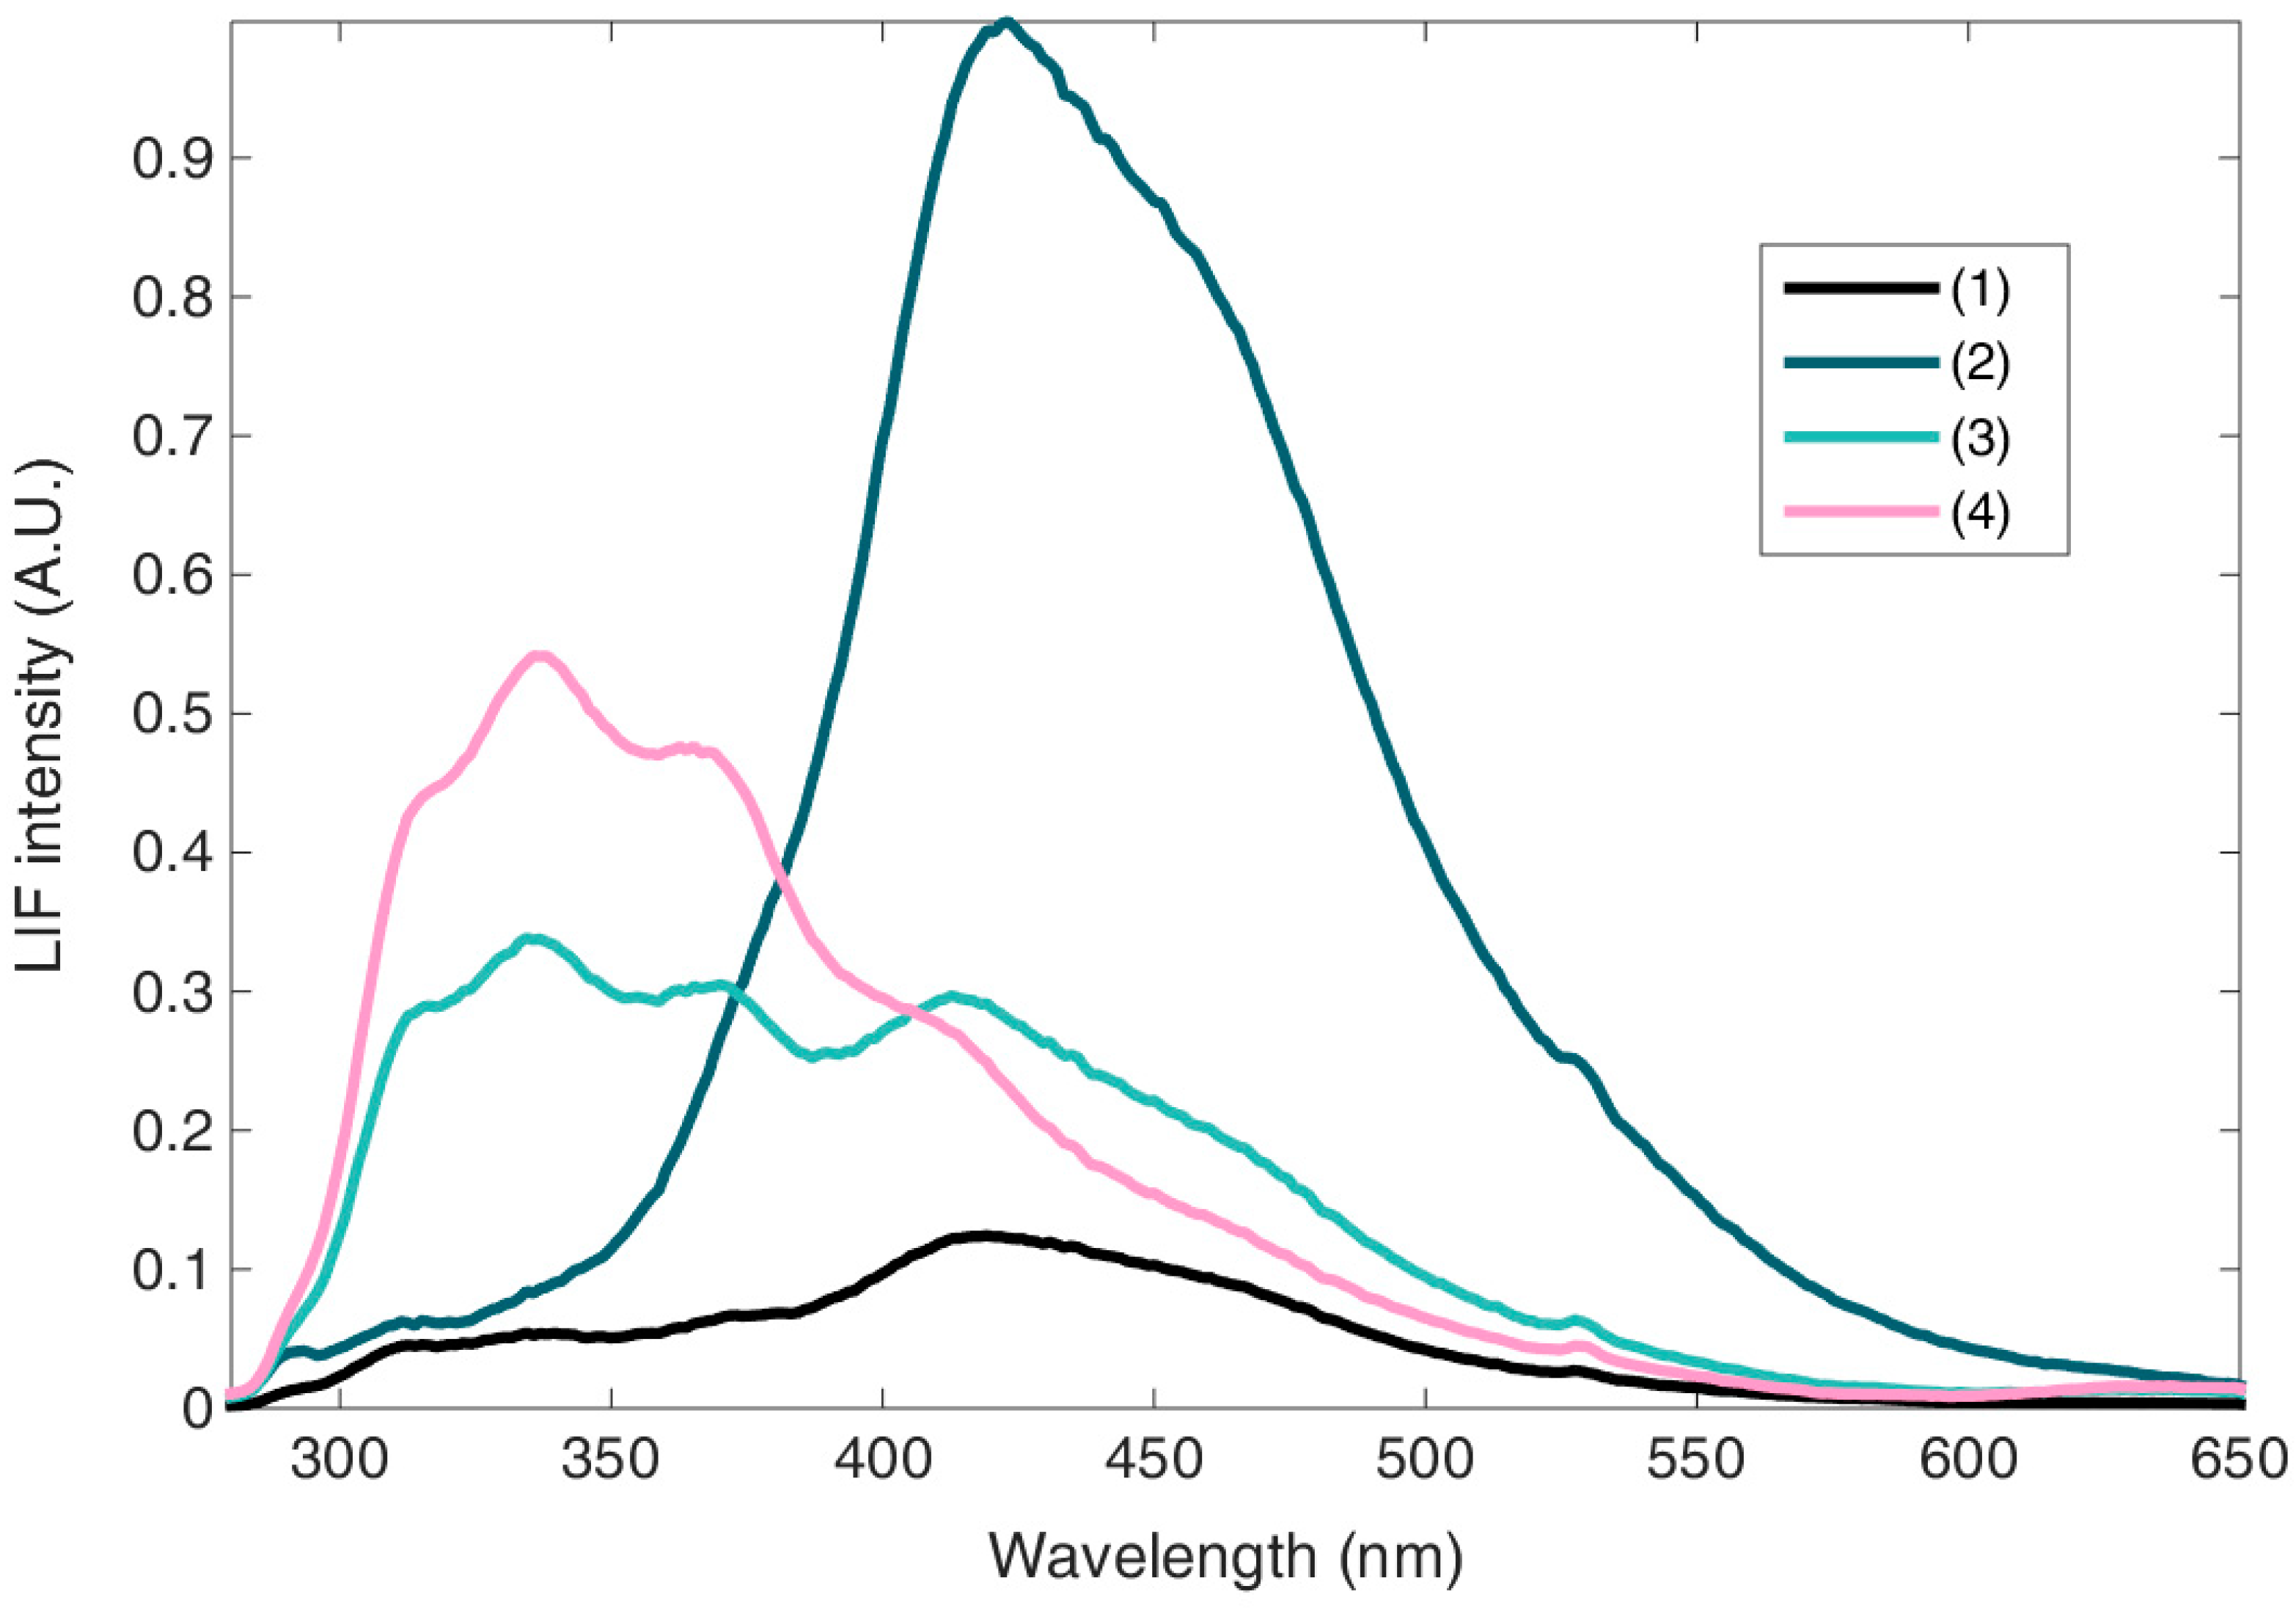
To obtain statistically significant spectra, the entire LIF dataset has been categorized by k-mean analysis. The processing was performed with Euclidean distance and a number of means able to explain at least 80% of the variance: Four centroids were used in the study case; the data-analysis result is shown in
Figure 8. The centroid (1—black line) corresponds to a low intensity spectrum broadband in the region 350–450 nm without any prominent spectral features. The centroid (2—dark green line) is a spectrum with the most intense band centered at 420 nm; a univocal assignment of this spectrum is made difficult by the great variability of the sample examined, to which is added the fact that the k-means method provides average values rather than the single constituents contribution; despite these difficulties, it is possible to identify in this spectrum the prevailing contributions of calcium carbonates–based minerals [
72]. The centroid (3—light green line) is a broadband shifted towards the UV region (320–420 nm) with intermediate emission intensity; and the centroid (4—pink line) is a spectrum with a prominent band at 330–360 nm with prevailing contributions from protein-like substances.
4. Discussion
The plurality of the experimental results described till now needs to be integrated within a useful synthesis, as suggested in
Table 2.
In
Table 2, the first three columns on the left group the surface-sensitive techniques, while the last two columns on the right concern techniques depth-sensitive techniques offering a further level of reading. Furthermore, we have to consider that the NMR is the only direct measurement of the water content, and both the NMR and the IRT techniques are commonly used for humidity assessment in masonry structures, therefore these represent an important point of reference for the other no conventional techniques used in this study.
In general, the conservation status presents different situations in the left, central and right sectors of San Nicola apse and pillars, where the left sector was found the most critical part by all the techniques applied. In the lower part of the wall surface deteriorations such as surface pigment removal, and biological attack were characterized by LIF. In addition, in the same part of the wall a higher humidity content was found by NMR. When integrating also the evidence of the AI in the apse, we can improve the general understanding by correlating the superficial information with the evidences in the depth: While the left side appears critical on the surface (NMR, IRT and LIF) and in the depth showing a structural weakening (AI), instead the water content in the right side might be more confined to the surface (NMR) and less in the depth, where the (AI) reveals good elastic properties. A similar reading is done for the two pillars, where the IRT offers a surface indication while the AT provides structural information in the depth.
To highlight the most relevant effects related to the presence of water in the masonry, a comparison is made in the following, between some of the experimental techniques here used (LIF, AI and AT) and NMR and IRT, the latter two being by far more specific for the determination and quantification of humidity in masonry. The use of statistical tools is in this context necessary to highlight the correlations between data of different nature [
73]. In a first qualitative attempt, a comparison has been done between the moisture content obtained by Unilateral NMR results and the k-means categorized LIF data; subsequently a correlation between humidity and spectral intensity was sought.
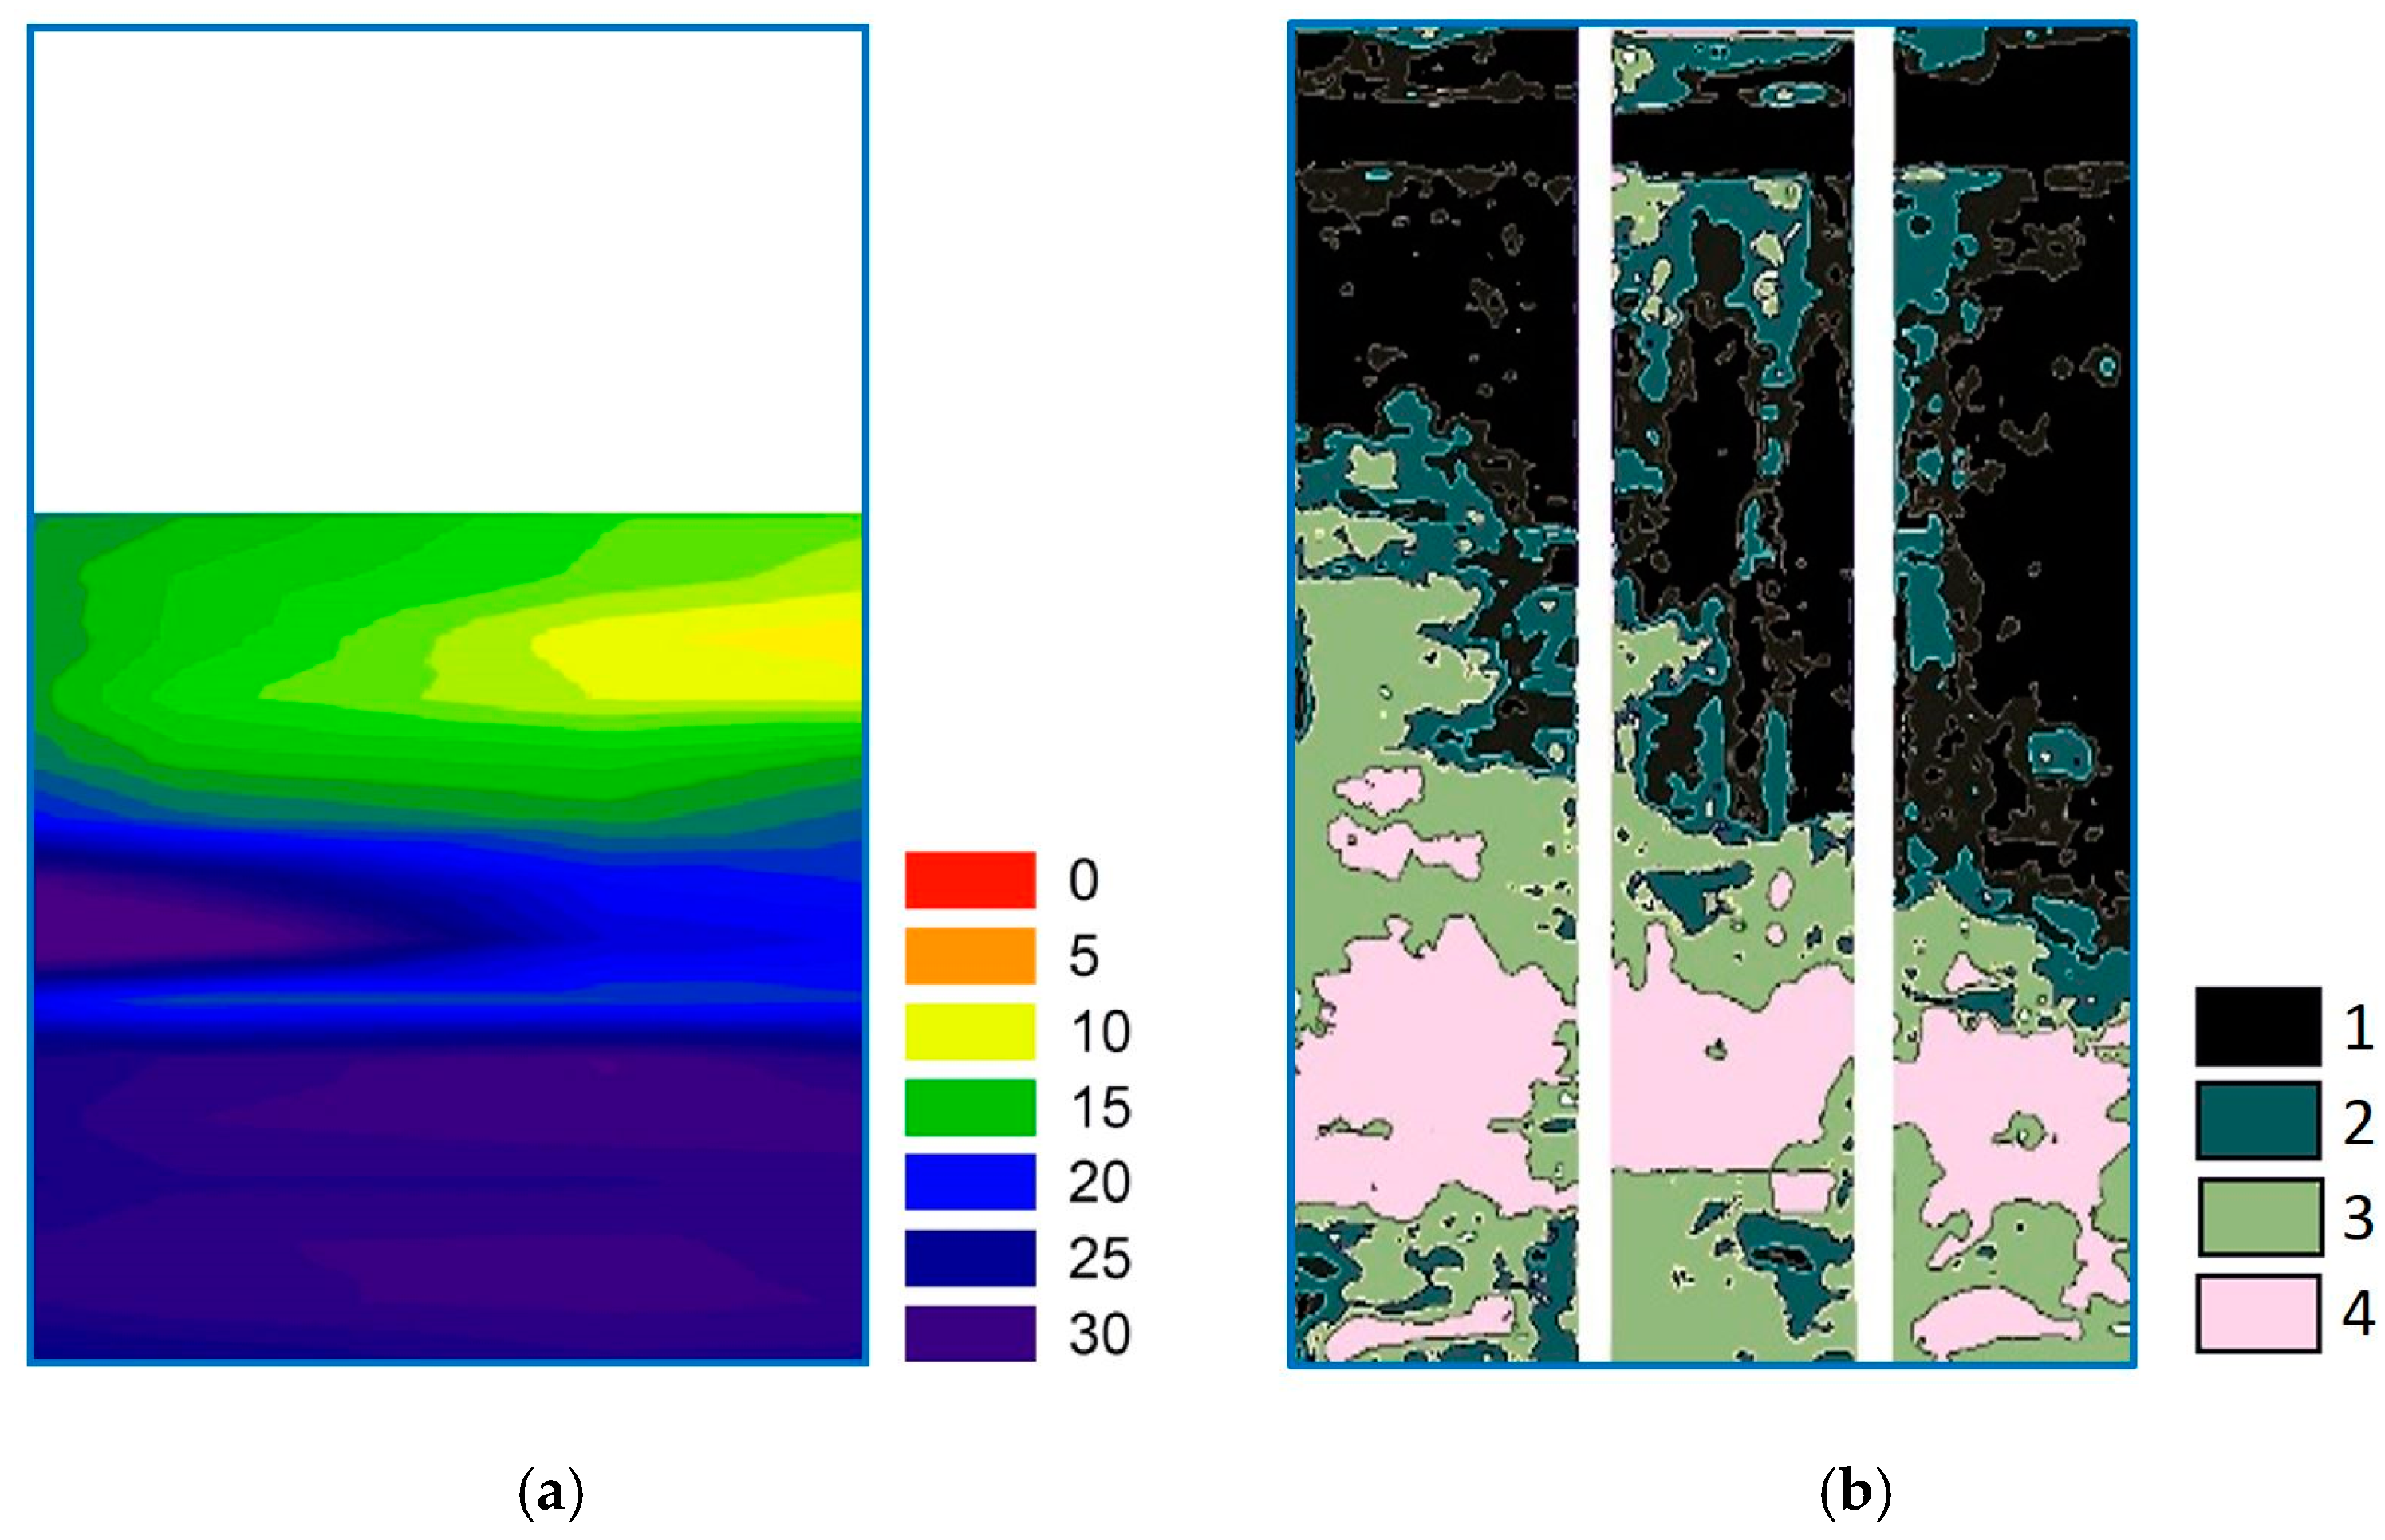
Figure 9 compares different views on a portion of the apse, namely the NMR moisture content map and the categorized LIF data. Direct visual observation confirms the interpretation of the mean spectra based on the state of the surface and its moisture content. The occurrence of type-three and -four spectra, consistently found in areas with highest humidity content, as shown in
Figure 9, indicates a correlation between humidity and a broad band fluorescent emission shifted towards the UV region (320–420 nm).
This result is also consistent with the thermographic data reported in
Figure 9; indeed, the lower part of the masonry shows a humidity gradient decreasing from the left to the right. In the upper part in general, the thermographic survey detects a drier wall.
To highlight the various factors that influence the NMR and LIF measurements, the correlation between the percentage of humidity and the absolute intensity of the fluorescent emission at 340, 420 and 550 nm was calculated. The calculation was performed by partitioning the scanned areas into congruent portions, and calculating the correlation between the average humidity value and the corresponding average fluorescence absolute emission on the indicated wavelengths. The rows of
Table 3 report data relative to different portions of the scanned area (respectively upper, central, lower and entire image). The correlation on the entire image (fourth row) is greater than 0.6 for all the considered bands: This is explained since areas with high humidity (>20%) are more deteriorated and/or subject to discoloration and efflorescence; in these areas, the fluorescence intensity is generally high on all the considered bands and with pronounced UV emission.
Conversely, in the upper area of the scanned surface, corresponding to the first row of
Table 3, there is a significant reduction in the correlation to arrive at uncertain or negative correlation. Causes can be found to superficial pigment removal which are observed along vertical paths well highlighted in the right side of
Figure 9. In this case, the humidity played an essential role as well; indeed, the probable cause of these discoloration paths is an occasional high water content in the masonry, sometimes resulting in water-drop dripping.
Considering the painted surface of the apse wall, we remind the reader that water can produce a loss of materials, such as the binders, and cause a density reduction also in the depth or a lack of adherence between adjacent layers, such as detachments and delaminations. It is important to underline that the results obtained are not indicative of common physical causes, i.e., a direct causal link between the humidity and the fluorescence emission: they only indicate the presence of common factors influencing both techniques. Despite this limitation, the correlation study is worth the effort, as it highlights the indirect effects that humidity causes on fluorescent emissions.
This work suggests that these water-related effects might be effectively detected by means of acoustic absorption diagnostics. However, in order to correctly interpret the experimental evidence, we must consider and discriminate the different mechanisms concurring to produce acoustic energy absorption: Vibration, porosity and poor elastic properties of materials and structures produce a weak acoustic response detected as absorption. Unfortunately, different materials behave in a different way in the presence of water: For instance, sandstone and wood are weakened, while concrete and granite are hardened [
56,
57,
58,
59,
60,
61]. Specifically, the weakening of the material may produce apparent acoustic absorption, while the hardening may result in a stronger reflection.
Interestingly, in those areas of the painted surface where NMR and IRT detects high amount of water, the AI shows a weakening of structural properties mainly in the left side of the apse, (see
Figure 3,
Figure 4 and
Figure 5). In the right side, the integration of these techniques suggests a different interpretation because NMR and IRT reveal similar amount of water in the lower part, while the AI detects good structural properties. This discrepancy, evident up to about 1 m from the ground, may be explained as a water content that persists at the surface, while its effect on the structure are not present deeper inside the wall. Indeed, since acoustic diagnostics is more sensitive to the bulk of the wall than NMR and IRT techniques, the integration of the three techniques should be considered qualitative.
5. Conclusions
The results obtained in this study demonstrate the considerable potential for integration of a multidisciplinary approach for evaluating both the causes of degradation and the state of conservation in historic masonries. In conclusion, IRT is a non-contact and non-destructive test technique that can be used for the rapid diagnostic of large surfaces, allowing for repeated measurements, over time, to monitor the phenomena of rising water from the ground due to the capillary movement of water in the porous materials. This technique can therefore be used for a preliminary moisture mapping and for selecting areas that need to be further analyzed by other techniques. Furthermore, IRT maps provide a useful guide where other techniques not yet conventionally used in this field can be successfully applied.
Unilateral NMR is a non-invasive and non-destructive technique which is very useful to map the distribution of moisture content and by a proper calibration a quantitative evaluation of moisture content can be obtained. However, it should be considered that since NMR is a time-consuming technique, it is advisable to use it on restricted areas, i.e., where IRT reveals greater criticality.
Regarding the LIF technique and its capability to detect the moisture content, the obtained results show that the water content does not significantly alter the emission spectrum of the investigated artifacts. In fact, a promising correlation between fluorescence and the effects (i.e., discoloration and biological stains) that alter the surface material was provided.
The potential variation of the elastic properties of the constituent materials and of the wall structure is highlighted by the acoustic techniques (AI and AT). In particular, the contactless acoustic technique AI is applied for the first time to assess the decay processes due to water absorption. This is particularly useful for antique structures where precious paintings may be present and contact must be avoided. The AT measurements on the pillars reveal more information on the masonry structure than the humidity presence.
Overall, the study carried out in the San Nicola in Carcere church allowed us to map the humidity present in the walls and in the two pillars of the apse responsible for the deterioration processes of the painted plaster, such as saline efflorescence, discoloration and biodeterioration.
It should be emphasized that the IRT and NMR produce results on the current condition of the masonry water content, i.e., take a snapshot of the actual state. These data are completed by the integration of the acoustic and fluorescence analysis which are able to document the damages due to the humidity effects at the present time and occurred in the past as well. This allows us to have a complete picture of the artefacts under study and organize conservation interventions having a global vision, also allowing the recovery of damages received during the history of the cultural heritage.
The multidisciplinary approach showed in this study represents a useful tool for professionals (conservators and restorers). This methodological approach should be preferred every time a conservation work for built heritage is planned. The successful preservation of an historic building should be based on diagnostics before, during and after the restoration works, providing a help to plan the subsequent monitoring of the asset. The next step in this research will be to make these methodologies more accessible to conservators and restorers also providing for the development of a software that, through the integration of data acquired with these techniques, is able to provide models to evaluate and monitor the humidity in the historic walls over time and increase knowledge.


 ,
, 


