Article

First Steps towards Understanding the Non-Linear Impact of Mg on Calcite Solubility: A Molecular Dynamics Study

by
Janou A. Koskamp
1,
Sergio E. Ruiz Hernandez
1,
Nora H. De Leeuw
1,2 and
Mariette Wolthers
1,*
1
Department of Earth Sciences, Utrecht University, 3584 CB Utrecht, The Netherlands
2
School of Chemistry, University of Leeds, Leeds LS2 9JT, UK
*
Author to whom correspondence should be addressed.
Submission received: 26 January 2021 / Revised: 29 March 2021 / Accepted: 6 April 2021 / Published: 13 April 2021

Abstract

:
Magnesium (Mg2+) is one of the most common impurities in calcite and is known to have a non-linear impact on the solubility of magnesian calcites. Using molecular dynamics (MD), we observed that Mg2+ impacts overall surface energies, local free energy profiles, interfacial water density, structure and dynamics and, at higher concentrations, it also causes crystal surface deformation. Low Mg concentrations did not alter the overall crystal structure, but stabilised Ca2+ locally and tended to increase the etch pit nucleation energy. As a result, Ca-extraction energies over a wide range of 39 kJ/mol were observed. Calcite surfaces with an island were less stable compared to flat surfaces, and the incorporation of Mg2+ destabilised the island surface further, increasing the surface energy and the calcium extraction energies. In general, Ca2+ is less stable in islands of high Mg2+ concentrations. The local variation in free energies depends on the amount and distance to nearest Mg in addition to local disruption of interfacial water and the flexibility of surface carbonate ions to rotate. The result is a complex interplay of these characteristics that cause variability in local dissolution energies. Taken together, these results illustrate molecular scale processes behind the non-linear impact of Mg2+ concentration on the solubility of magnesium-bearing calcites.

1. Introduction

Calcium carbonate minerals, and in particular calcite, are extensively found in nature, for example as the main component in marble, limestone and chalk, and it is therefore one of the most abundant non-silicate minerals at the Earth’s surface. Furthermore, calcite has proven its functionality and usability in different contexts in both natural and industrial processes [1]. To enhance the understanding of the mechanisms behind observations on the formation or dissolution of calcite, theoretical models describe calcite growth and dissolution processes at many different scales. Pore-scale and continuum scale models are becoming more and more sophisticated, yet there are still important discrepancies between model outcomes and experimental observations, e.g., [2,3,4,5]. Similarly, statistical (e.g., [6]), kinetic (e.g., [7]) and ion-by-ion (e.g., [8,9,10,11]) models have also revealed discrepancies between model and experimental observations. Possible reasons for those discrepancies are further elucidated using atomistic-scale approaches and ab initio models, for example in [12,13,14].
Impurities are more the rule than the exception in natural calcite and are commonly found not only in different concentrations but also in a range of different types of impurities [15]. One of the most common impurities found in calcite crystals is the magnesium ion, Mg2+. Magnesium carbonate (magnesite) is isomorphic with calcite and a wide range of solid solutions are therefore formed between these end-members. Generally, two categories are employed to differentiate between low and high Mg2+ concentrations, with arbitrary limits [16,17,18,19], i.e., low-Mg2+ calcite in which a maximum of 2% of the Ca2+ is replaced by Mg2+, and high-Mg2+ calcite with 8% to 40% of Mg2+ substituted for Ca2+ [20]. Beyond 40% we cannot speak of calcite anymore, but should consider the mineral as dolomite or huntite instead.
According to computer simulations, the incorporation of magnesium impurities into the step edges of a calcite surface is initially thermodynamically very favourable and is independent of the growth site’s topography (obtuse or acute edges) [21,22]. It has been shown experimentally that during calcite growth Mg2+ incorporates more into acute edges than obtuse steps [23], although in more recent computer simulations it was found that Mg2+ is randomly distributed over the calcite crystal [24]. Surface studies have also shown that high concentrations of impurities in the growth edge will poison the edge and thereby inhibit further crystal growth [21,22,25]. Furthermore, it was shown that it is thermodynamically unfavourable to sequentially incorporate CaCO3 units next to a MgCO3 edge corner in a growing calcite crystal [21,22]. In contrast, a mechanism that was shown to be thermodynamically feasible is to incorporate magnesium via diffusion of Mg2+ towards the surface, followed by Ca2+–Mg2+ exchange with an existing surface calcium site [25]. Experimental work has shown an increase in initial growth rate when a metallic (Mn2+, Zn2+, Co2+ and Cd2+) ion was adsorbed or exchanged at the calcite surface [26]. Other studies concluded that calcium units were dissolving faster than Mg2+ units [27,28], resulting in non-stoichiometric (incongruent) dissolution. Other, more recent, experimental work has concluded that the dissolution rate of calcite is strongly but non-linearly dependent on the Mg2+ concentration in the crystal [29].
Arguably one of the most difficult variables to capture with dissolution rate laws is the impact of impurity ions such as Mg2+ in the solution and in the dissolving calcite crystal. Experimental work using atomic force microscopy (AFM) [30,31,32,33] has shown alterations in crystal geometries as a result of variations in dissolution velocities of calcite due to the incorporated magnesium and its distinct preference for (interactions with) different surface sites. Additionally, the effect of salt ions on water structure and dynamics [34] and the consequence for calcite dissolution, with an increase in water viscosity and a resulting decrease in diffusion coefficients [12,35], has been widely suggested as an explanation for observed variations in dissolution behaviour.
Molecular dynamics (MD) simulations have been used extensively to study reactivity of calcite crystals under different conditions. Among others, these studies have investigated the importance of variability in reactivity of edges and kink sites on a { 10 1 ¯ 4 } surface and defined rate equations in up-scaled models [36,37,38,39,40] or the impact of confinement and solution composition [12,41,42,43]. Moreover, MD was used to study the free energy landscape of adsorption and dissolution of metal and carbonate ions on calcite surfaces [38,39,44]. As in experiments [10,11,45] and unbiased MD simulations [22,36,37,46], free energy studies do not show consensus in their observations on the acute and obtuse edges [38,40,47].
The aim of this work is to provide atomistic insight into the non-linear impact of Mg2+ on the solubility of calcite, and to contribute to the understanding of the mechanism(s) in place and responsible for the variable reactivity with Mg concentration in calcite. In the literature, the focus has been on explaining the reactivity of Mg2+ and its poisoning effect on the reactivity [21,22,48,49,50]. Using molecular dynamics, simulating Mg2+ rich systems is complicated due to the slow exchange rates of water around this cation, necessitating timescales beyond what is currently feasible to gather statistically meaningful data. Consequently, we describe the reactivity of the crystal surface in terms of stability of the surface calcium ions instead. We have studied the residence time of water coordinated to surface Ca2+, interfacial water structure, the water diffusion, the deformation of the crystal, the surface energies and eventually the free energy profiles of the extraction of surface calcium ions. Our results reveal that Mg2+ incorporation at a low concentration does lead to a local stabilisation of surface Ca2+, whereas a higher Mg concentration disturbs the crystal structure, leading to local variabilities in the crystal surface, which are expressed in local destabilisation of Ca2+, thereby facilitating the dissolution of an adjacent CO32− and enhancing dissolution [39] compared to pure calcite. At the macroscopic scale, these observations imply a lower solubility than pure calcite when the concentration of Mg in calcite is low (<2%) and a higher solubility with increasing Mg, in agreement with the non-linear solubility observed experimentally.

2. Methods

We simulated two different calcite { 10 1 ¯ 4 } crystal surfaces in contact with pure water. One of the crystals had an island of 16 crystal cation-anion units adsorbed onto the flat { 10 1 ¯ 4 } surface and an edge pit of the same size on the opposite side of the crystal slab, whereas the other surface was atomically flat. Since the edges of the small pit are prone to interact [36], we have focused on the edges of an island that can also represent the edges of a bigger pit. Both crystals were simulated with and without 30% magnesium randomly distributed over the entire crystal slab, representing the high Mg2+ calcite system. In addition, we simulated a flat { 10 1 ¯ 4 } surface with one magnesium impurity in the surface, representing the low Mg2+ calcite. In total we thus had five different molecular systems. The classical molecular dynamics (MD) simulations were performed in the large-scale atomic/molecular massively parallel simulator (LAMMPS) [51]. We used the velocity-Verlet integrator [52,53] and the Nosé-Hoover thermostat [52,53] to integrate the equations of motion with a time step of 1 fs and to maintain the temperature at 300 K. The simulations were carried out in constant number of particles, volume and temperature (NVT) ensemble with a relaxation time for the thermostat of 0.1 ps. The unbiased simulation time was 10 ns with 1 ns of equilibration period.
System details. The calcite slab was 3.3 nm thick, which corresponds to 12 atomic layers of material, and was previously shown to be thick enough to have no interactions between the surfaces through the crystal slab [14]. A surface of 4.8 nm by 4.0 nm was exposed to a water column of 6.5 nm ensuring bulk-like water behaviour in the centre of the column. After an initial equilibration period, eight out of the twelve layers in the centre of the crystal were immobilised and kept in the same position, for two reasons: (i) to speed up the calculations; and (ii) to simulate the bulk crystal and prevent the box from deviating from its reference point, so comparison of the different Mg-doped systems was facilitated. Initially, we exchanged a randomly selected single Ca2+ by a Mg2+ in the surface of the material, to be used as a reference of low Mg2+ concentrations (LMg). Based on previous computer simulations, there is no preference position for Mg2+ in a calcite crystal [24]. For the high-Mg calcite, we therefore randomly distributed Mg2+ over the entire crystal, replacing 30% of the Ca2+ ions with Mg2+ (from here on referred as high Mg2+ or HMg). In the slab with an island on top, the cations in the acute and obtuse corners were kept as Ca2+, and Mg2+ was disseminated on the island around the corners. The flat surface under the island maintained a 30% random distribution of Mg2+. An image of our defective surface model can be seen in Figure 1.
Force field. As described previously [34,54], the simple point-charge flexible water (SPC/fw) in combination with a Buckingham potential [44,55] provided the best water dynamics around calcium in solution when compared to ab initio calculations. For comparison with more recent work on calcite surfaces [12,37,38,41,56,57], the force field to describe the inter- and intra-molecular interactions was taken from Raiteri et al. [58], including the SPC/fw water description [59]. An 0.9 nm cut-off was used for the van der Waals forces, except for the SPC/fw-tail force field, in which the cut-off was defined at 0.9 nm, but with a tail from 0.6 nm [58]. The exact values used in our simulations can be found in Table S1.
Coordination number. The number of molecules directly coordinated to a central ion was reported as the coordination number. The coordination number is determined from the integral of the radial distribution function (RDF). To include the whole first coordination shell, the cut-off distance was set at 0.35 nm as this distance included the full first peak in the RDF (whether or not split in the case of oxygen in the carbonate (Oc) in the high Mg2+ calcite), unless stated otherwise.
Surface energy. An estimation of the surface energy was obtained by simulating bulk pure calcite, LMg and HMg at zero K (a “dry run” using T = 10 K using the energy of the minimised structure). The energy of the system was then subtracted from the energy of a zero K simulation of the surfaces, where each surface system was first relaxed with water on top at 300 K for 1 ns before the dry zero K run was conducted to minimise the energy. The energy in J/m2 is the estimated surface energy of the water-relaxed-dry surfaces:
σ = U s U b 2 × A ,
Us is the energy of the crystal with expressed { 10 1 ¯ 4 } surface after relaxation at 0 K, Ub is the energy of the bulk crystal, A is the surface area of one side of the crystal. The surface energy indicates the stability of the surface, with a low positive value indicating a stable surface, whereas the more positive the value, the less stable is the surface. An estimation of the “wet” surface energy was calculated after hydrating the surface by placing a water molecule approximately every 1 nm2. Only the first four layers could relax, as the rest of the slab was fixed according to its energetic minimum of the dry surface. The energy of one water molecule multiplied by the number of water molecules on the surface was subtracted from Us according to Equation (2):
σ = U s U b n U H 2 O 2 × A ,
where U H 2 O is the energy of one liquid water molecule in bulk water, Us is the energy of the configuration excluding the water and Ub is the energy of the bulk crystal.
We have also used Equation (1) to calculate the surface energy, employing the final configuration resulting from the dynamic simulation including water, but excluding the water in the estimation of Us. The standard deviation was calculated to demonstrate the variance of the surface energy and thus, indirectly, the mobility of the ions in each system studied.
Free energy profiles. The free energy calculations were performed to extract information about the reactivity of Mg-calcite surfaces and to compare them to the pure calcite surface. We simulated various single calcium ion extractions from different positions in a crystal surface (with or without an island on top and with different amounts of Mg in the vicinity) into the pure liquid water layer 1.2 nm away from the surface. The PLUMED [60] plug-in for LAMMPS was used to perform all free energy calculations. In a single steered MD simulation, we extracted a specific calcium out of the surface and dissolved it. To have a converged simulation for construction of the energy profile, the frames of the steered MD were used to perform biased umbrella sampling at different heights above the initial surface position. In our exploration of the free energy, we selected the distance perpendicular to the surface as the collective variable (CV), based on the assumption that this distance would affect the free energy the most. Due to convergence issues in the directions parallel to the plane, the energy profile was not stable after 120 ns of simulation and we therefore decided to limit the energy exploration only in the direction orthogonal to the surface, by restricting the movement in the plane parallel to the surface with a strong harmonic spring (spring constant of 5.0 eV/Å2). With this restriction in place, the free energy calculations were carried out for 10 ns. The calculation consisted of more than 61 harmonic umbrella potentials with spring constants of 0.5 eV/Å2, or 5.0 eV/Å2 in positions where necessary to obtain a satisfactory overlap in the sampling along the CV of neighbouring windows (see Section 2 in the Supplementary Materials and Figure S1 for more details). The unbiased free energy profiles were obtained through self- consistent histogram re-weighting, using the weighted histogram analysis method (WHAM) code [61]. For the interpretation of the energy profiles, the ΔGextraction was used, which is defined as the Helmholtz free energy of extraction of a calcium ion from bulk water (~1.3 nm) to its position in the crystal structure. The positive energy indicates that the cation is favoured in the surface position.
Diffusion. The mean square displacement (MSD) was calculated with a modified version of the Fortran code written by W. Smith from the UK Daresbury Laboratory [62]. Thereafter, the self-diffusion coefficient was derived as the slope of the MSD as a function of time divided by the number of dimensions times two (for both positive and negative direction). The self-diffusion coefficient of interfacial water parallel to the calcite surface was calculated by adjusting this code to only account for water molecules present in the interface (e.g., below 0.35 nm from the calcite surface) at the scanned time. Due to the small size of the interfacial water layer, water molecules leave the specified layers within short times. To improve the statistics, we modified the code to consider a linear extrapolation of the MSD when the water molecule entered the interfacial water layer between the time-origin and the remaining simulation time, and in the input file we set the time interval between MSD origins to one frame. In this way, water molecules that stayed longer in the specified interface area had more weight in the MSD, and short visiting molecules could be included without wrongly interfering with the MSD [54].
Vibrational spectrum. The vibrational spectrum at different distances from the surface was built from the sum of all the vibrational density of states (VDOS) of each atom involved [63]. The VDOS can be calculated using the Fourier transformation of the velocity-autocorrelation function (VACF) of the individual atoms in the water molecule. We used the following equation to calculate the VACF:
V A C F ( t ) = 1 N t s t e p s N a t m j = 1 N t s t e p s i = 1 N a t m ν j ( t ) j × v i ( t j + t ) ,
where Ntsteps and Natm are the number of timesteps and the number of atoms, oxygen and hydrogen in this case; νi is the velocity vector of O or H atoms in the ith water molecule.
To produce the vibrational spectrum of interfacial water (<0.35 nm from the surface), the water molecules in the interface were flagged in the starting configuration, which was compared with all configurations (the final 40 ps of the simulation) to make sure that the flagging was still valid (that is, that the water molecules still remained in the interface).
Water density. The water density profile perpendicular to the surface was determined to visualise the layering of water at the interface. The density is calculated based on the distance from the surface to the centre of mass of the water.
g ( x ) = d n x V x ,
where dnx is the number of particles within a water layer with volume Vx. To visualise the water z-density profile above a certain surface position, we only considered the water molecules in the column on top of the position within a rectangular box with width of 0.2 nm by 0.2 nm.
Number of hydrogen bonds between water molecules. Another feature to characterise the interfacial water structure is the number of hydrogen-bonds that a water molecule, coordinated to the surface, forms with other water molecules. This interaction stabilises the configuration and is fundamental to create an intermolecular network at the solid-water interface, as well as in the bulk solution. The coordination distances were defined based on the first minimum in the RDF and was set at 0.28 and 0.40 nm for the cation –oxygen and anion–oxygen, respectively [64]. A hydrogen-bond was defined with a proton–oxygen distance of 0.245 nm and an angle of less than 30 degrees between the oxygen acceptor, oxygen donor and proton donor [64].
Water exchange frequency. To investigate the water dynamics around dissolved calcium ions, the water exchange frequency (Nex) of water molecules in the first hydration shell of the cation was determined, using the “direct method” as described in previous work [54]. The average exchange frequency for the whole surface was calculated by dividing the total number of exchanges by the number of Ca ions in the surface.

3. Results

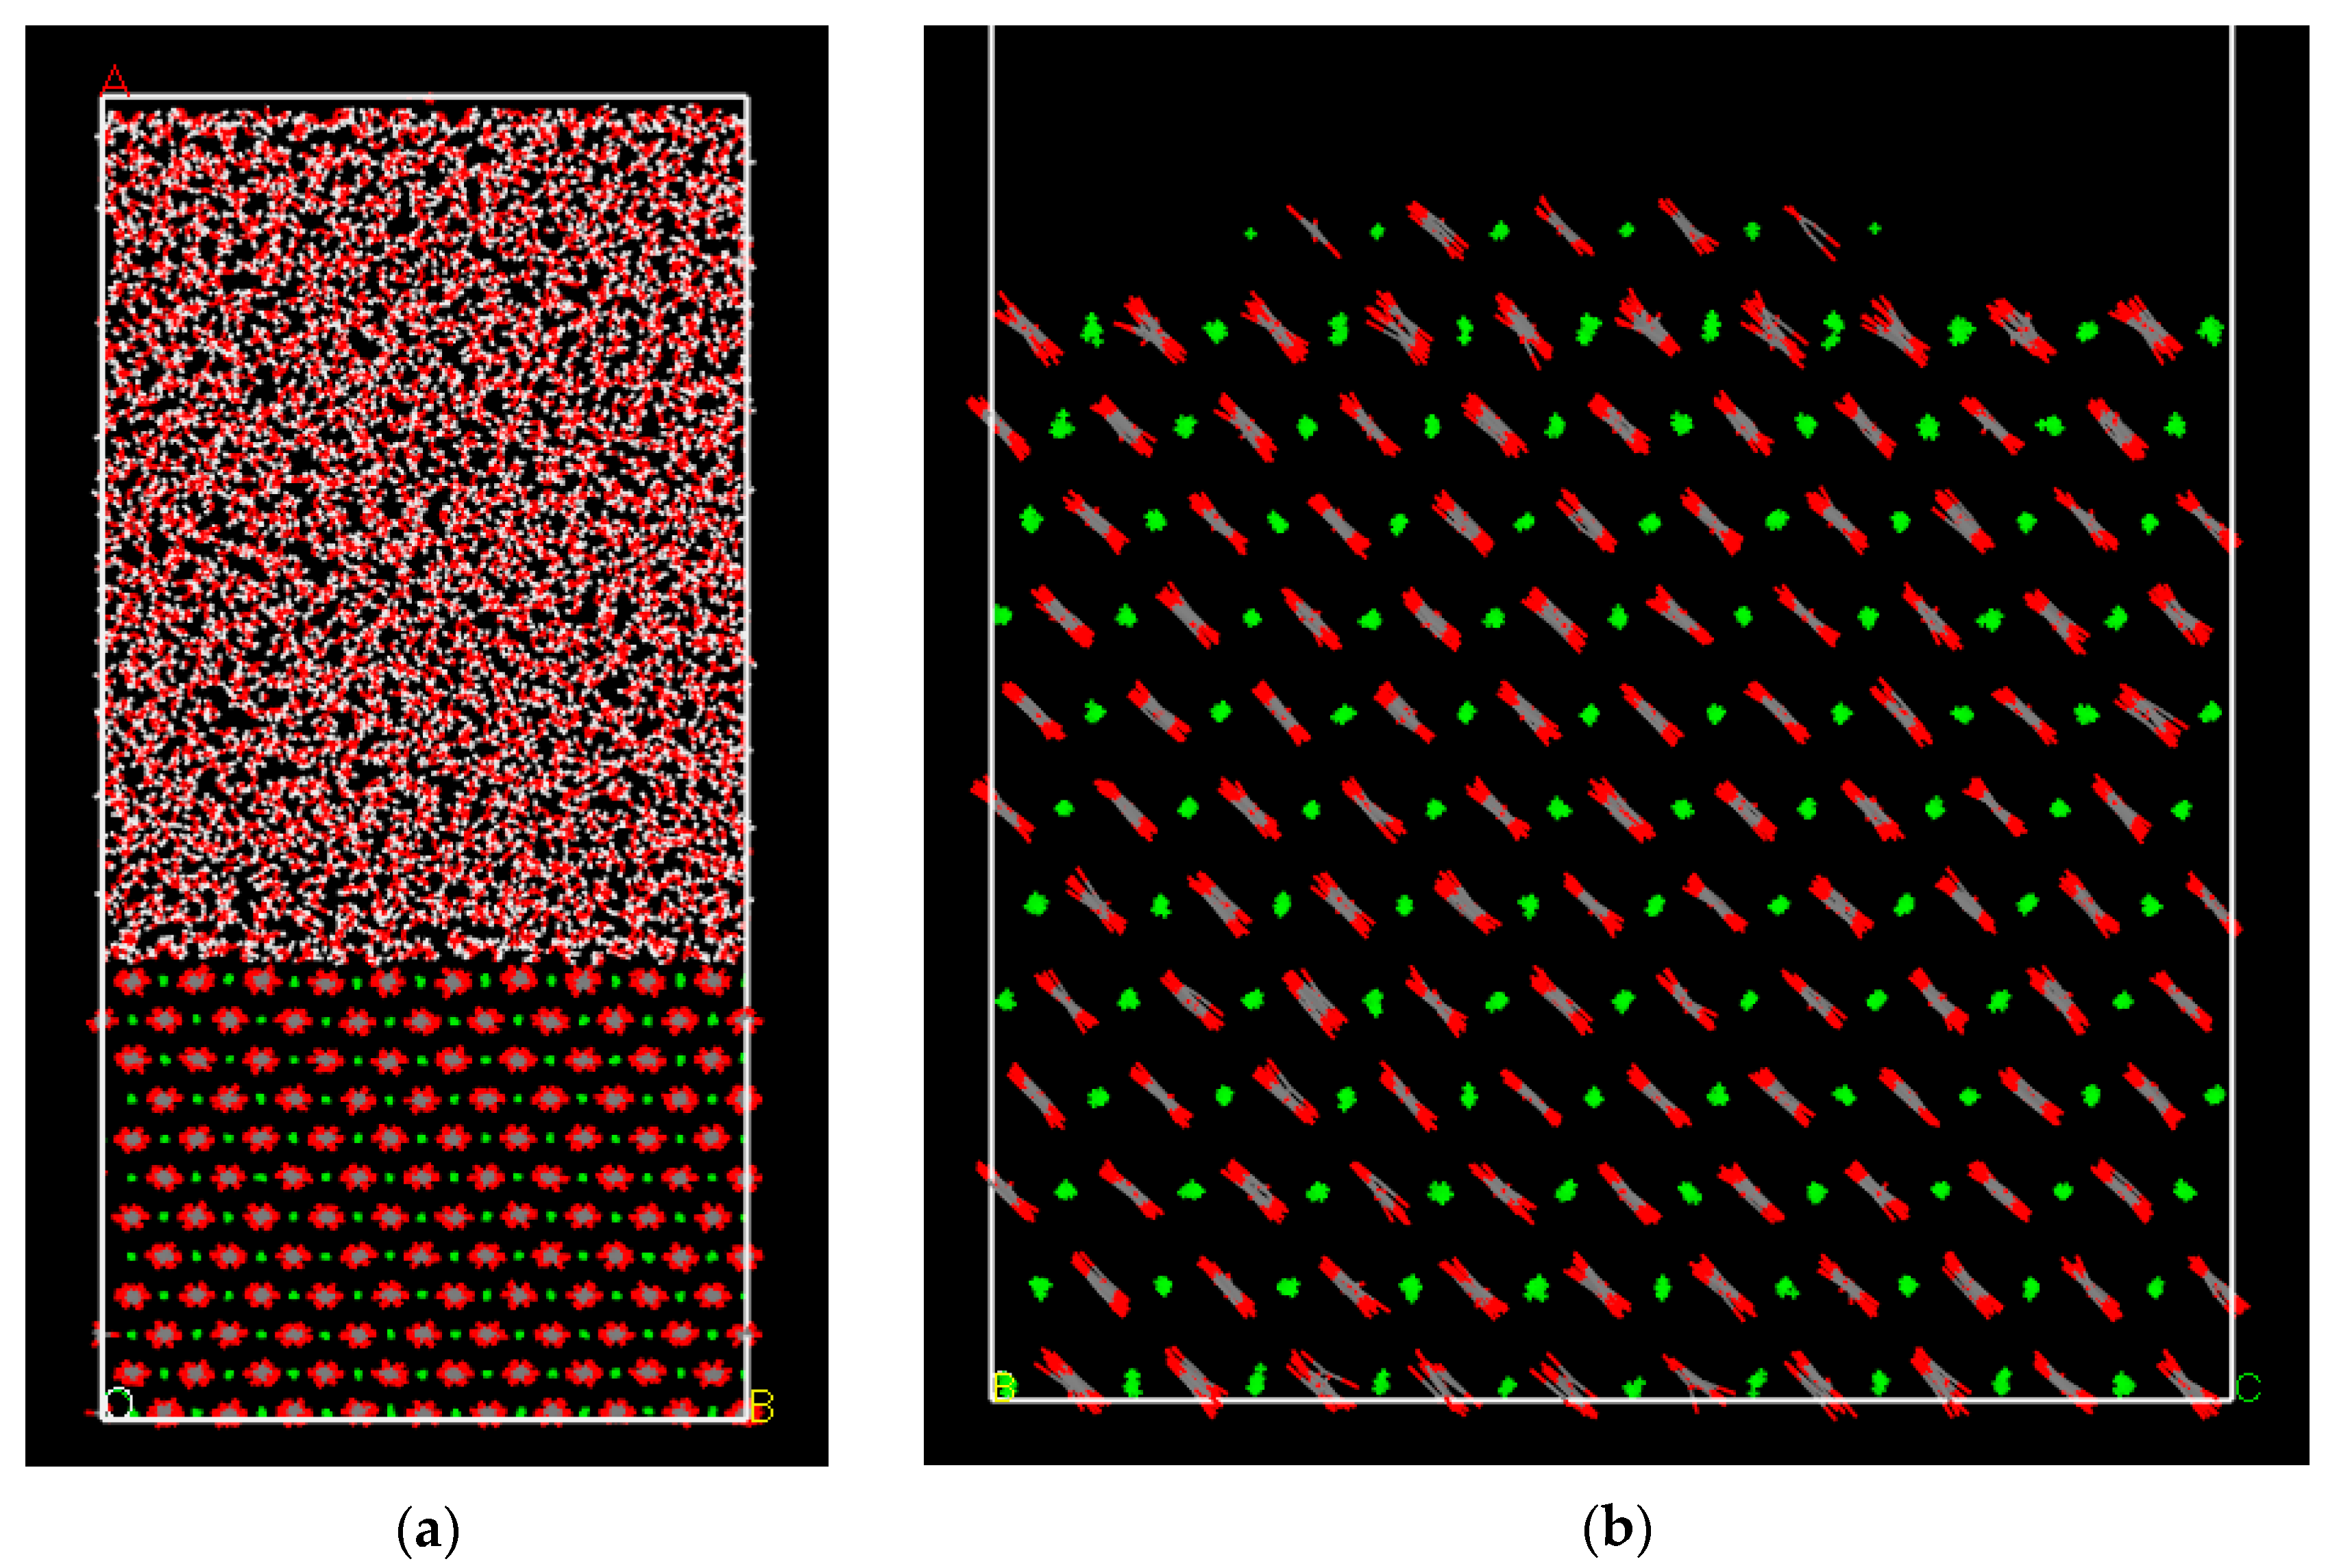
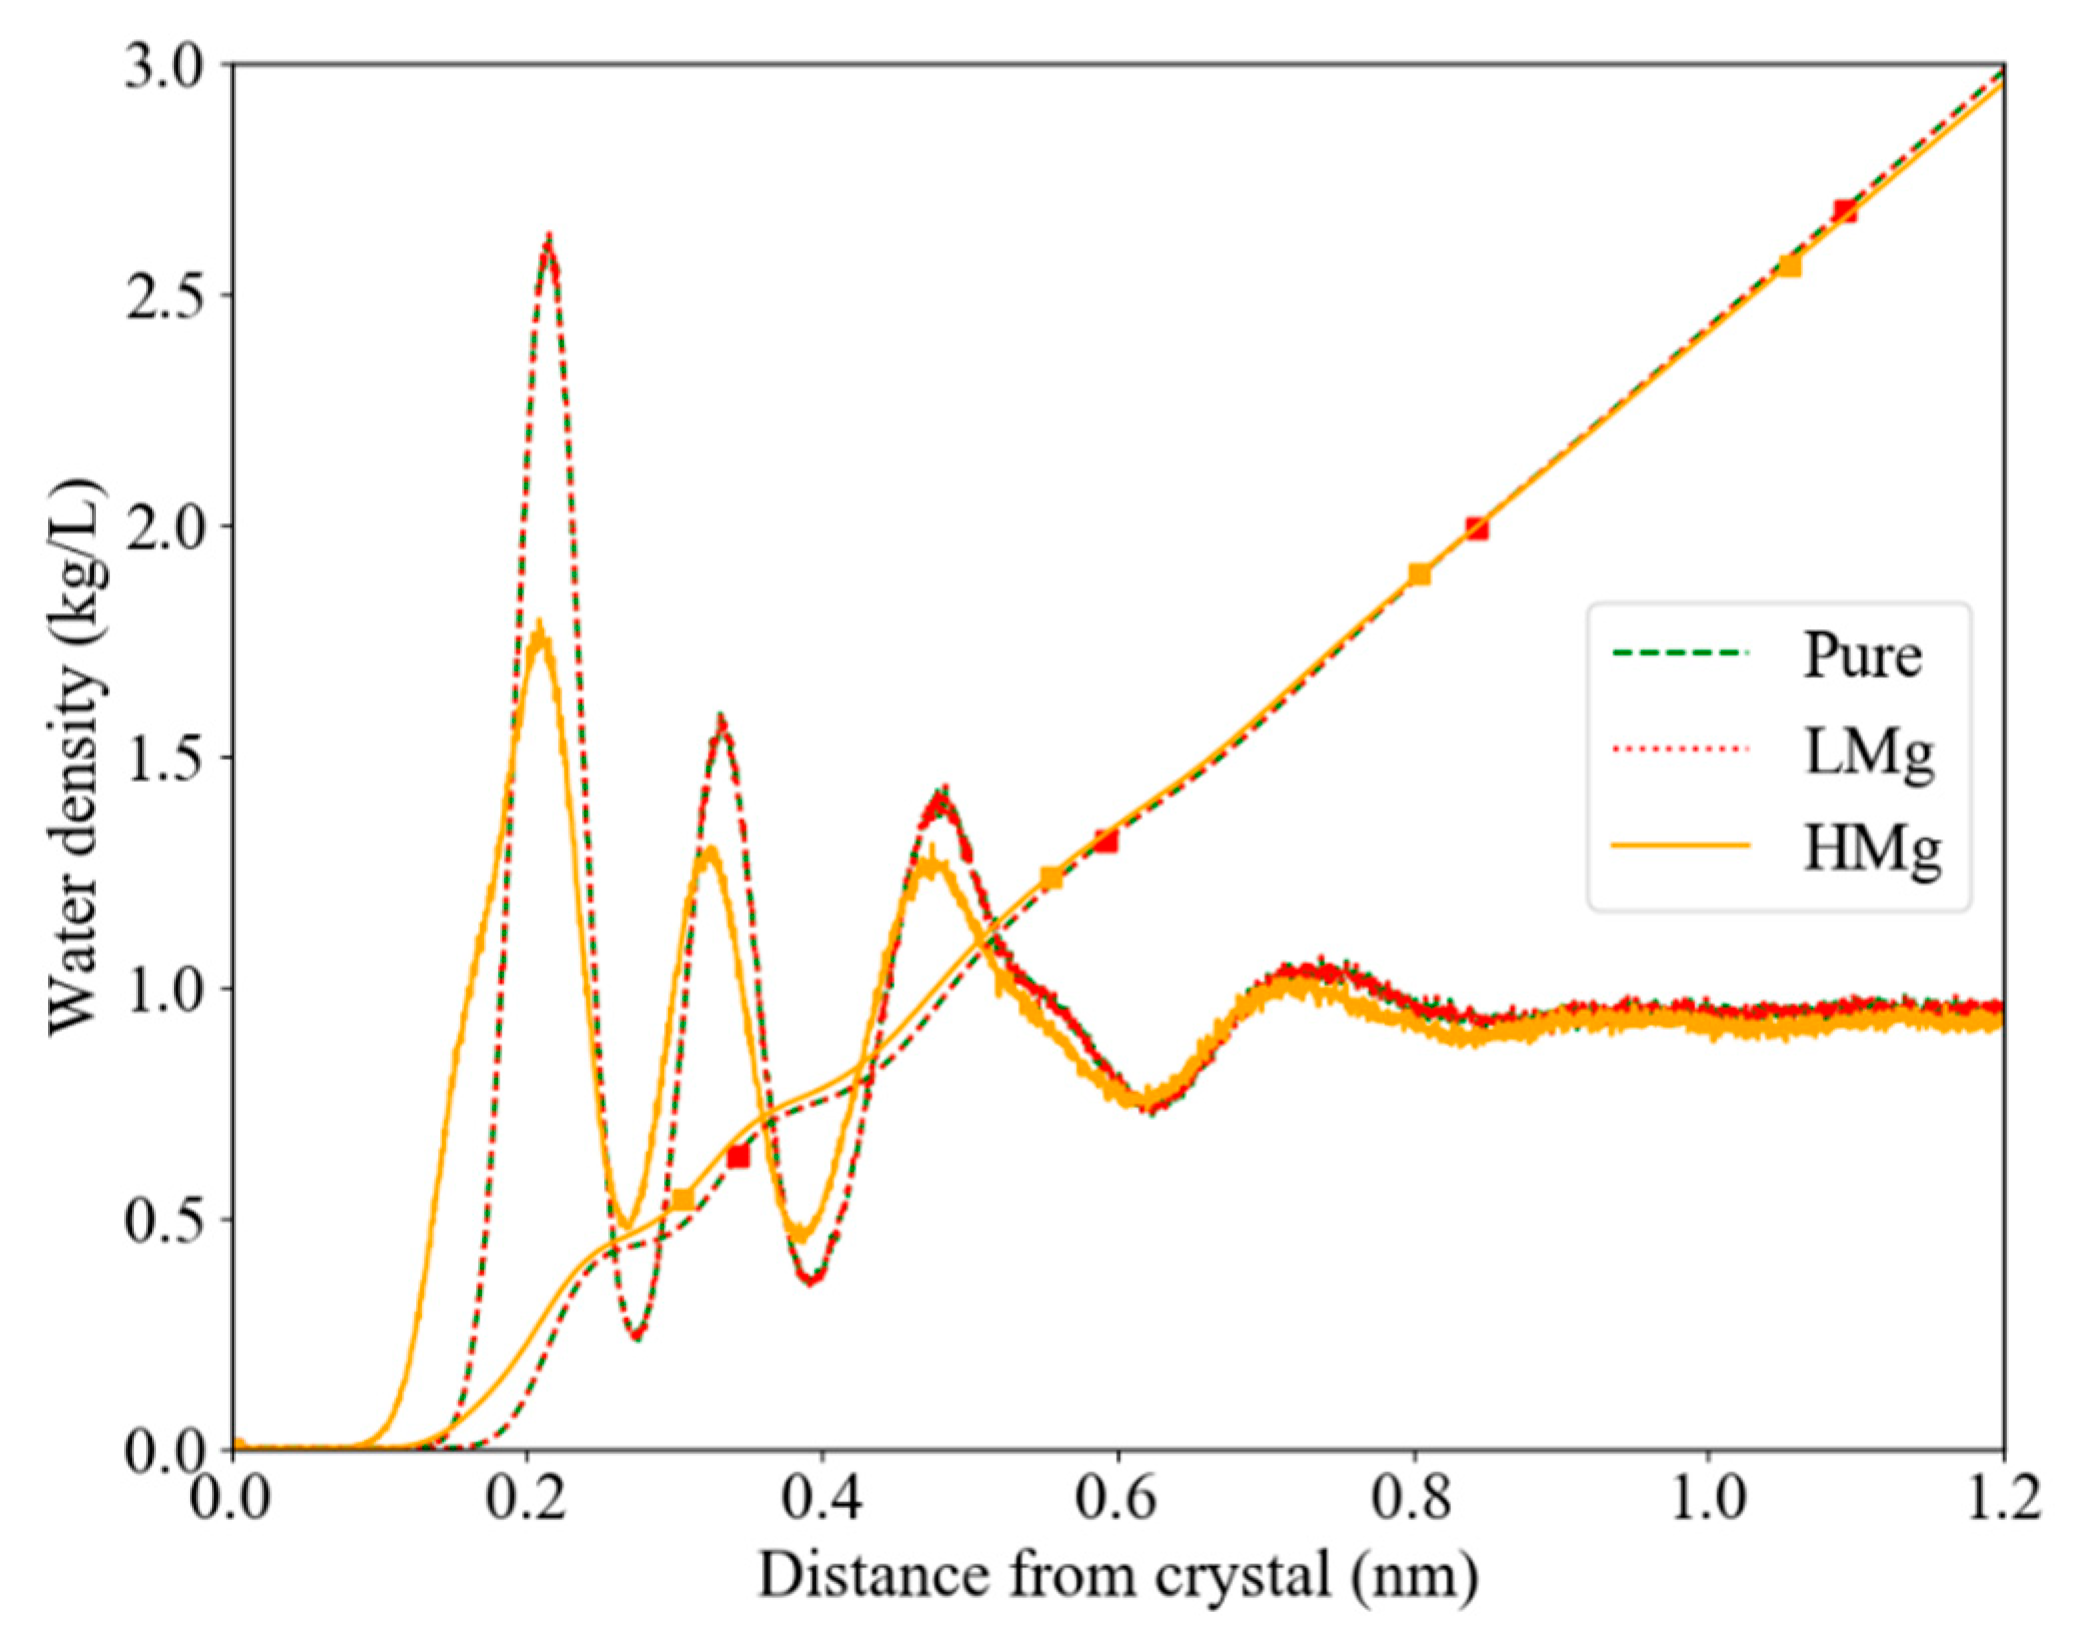
3.1. Water Density, Structure and Dynamics in the Interface

The water z-density profile on top of the pure, low Mg2+ flat surface (LMgF) and high Mg2+ flat surface (HMgF) calcite { 10 1 ¯ 4 } surfaces revealed the layering of the interfacial water (Figure 2). The water profile of LMgF was identical to the profile of water on top of pure calcite, but there was a clear difference observed in the water layering above the HMgF surface compared to the pure and LMgF calcite surfaces. For HMgF, the first peak had a lower intensity and showed a shoulder at shorter distance, indicating higher densities closer to the surface.
The hydrogen-bond network varied with the level of Mg incorporation, while the total number of hydrogen-bonds with water coordinated to Ca was comparable between the different interfaces (Table 1). Our analysis of the interactions between oxygens in water and carbonate molecules showed that water molecules coordinated to Mg2+ form on average 1.37 hydrogen-bonds with Oc, compared to 1.02 for water molecules coordinated to Ca2+. The latter value is irrespective of whether the surface Ca2+ is located in a pure or HMgF calcite. Almost half of the water molecules coordinated to surface Mg (40.8%) showed more than one H-bond to at least one of the neighbouring surface carbonate oxygen (Oc) (Table 1), in contrast to water molecules coordinated to Ca2+, where this was the case for only 15–16%. The lifetime of the formed H-bond on top of Ca2+ on the HMgF calcite was 6.5% longer than on the pure calcite. On top of Mg2+, this was 19.4% shorter compared to a water molecule on top of pure calcite. Furthermore, the water dipole angle with the surface is slightly smaller (0.24°) for water in the interface with HMgF (Section S3 of the Supplementary Materials for further details). The vibrational spectrum (VDOS) showed a difference in the behaviour of the water molecules present in the HMgF interface compared to the water molecules present in the pure calcite interface. The lower intensity of the peaks for intermolecular stretching and intermolecular O–O–O bonding motion (Figures S2 and S3) indicates that there are fewer hydrogen-bonds that vibrate with the same frequency as seen in the pure calcite interface.
The water dynamics were also altered when a high amount of Mg was incorporated. The exchange frequencies for water molecules coordinated to Ca2+ showed a broader range in HMgF than in LMgF and pure calcite (Figures S4 and S5), and the average frequency was slightly higher (31.4 versus 25.7 ns−1 for HMgF versus pure calcite, Table S2), whereas LMgF showed similar dynamics to the pure surface. The translational diffusion coefficient parallel to the interface (Dx/y) was also comparable for LMgF and pure calcite, in contrast to HMgF, which showed an increase of 38.9%. Further details can be found in Section S5 in the Supplementary Materials.

3.2. Surface Energies and Structural Relaxation

The energies of the surfaces are shown in Table 2 (see alternative way of measuring this in Table S3 and literature values in Table S4). LMgF calcite crystals had a slightly higher surface energy compared to the { 10 1 ¯ 4 } surface of pure calcite for both dry and wet surfaces. In contrast HMgF calcite had a slightly lower surface energy for the dry surface and a decrease of 0.1 J/m2 on the wet surface was observed compared to the pure wet calcite surface. Moreover, the surface energy of a surface with an island (PureI and HMgI), and edge pit in the opposite side of the slab, was higher for the dry island. This trend was in contrast with the wet HMgI surface which showed the lowest surface energy (Table 2). To summarise, the overall dry { 10 1 ¯ 4 } surface energy varied according to HMgF < Pure < LMgF < PureI < HMgI and the overall wet surface energy was ordered as HMgF < HMgI < Pure < LMgF < PureI.
Evidence of the degree of relaxation in the surfaces can be seen in the distances between the constituent ions, depicted in Figure 3 (and Figure S6). The average cation-carbon distances (Cc) in the surfaces, observed during the simulations, showed variations depending on the presence of Mg (Figure 3a), in contrast to the cation–Oc distances (Figure S6). In Figure 3a, the second peak (~0.41–0.43 nm) represents the distance between the cation and carbon of the first carbonate along the c-axis of calcite, as illustrated in Figure 3b. This distance was shortened upon Mg incorporation. The RDF of LMg had similar Ca-Cc distances compared to pure calcite and the Mg–Cc distances were the same as in HMg.

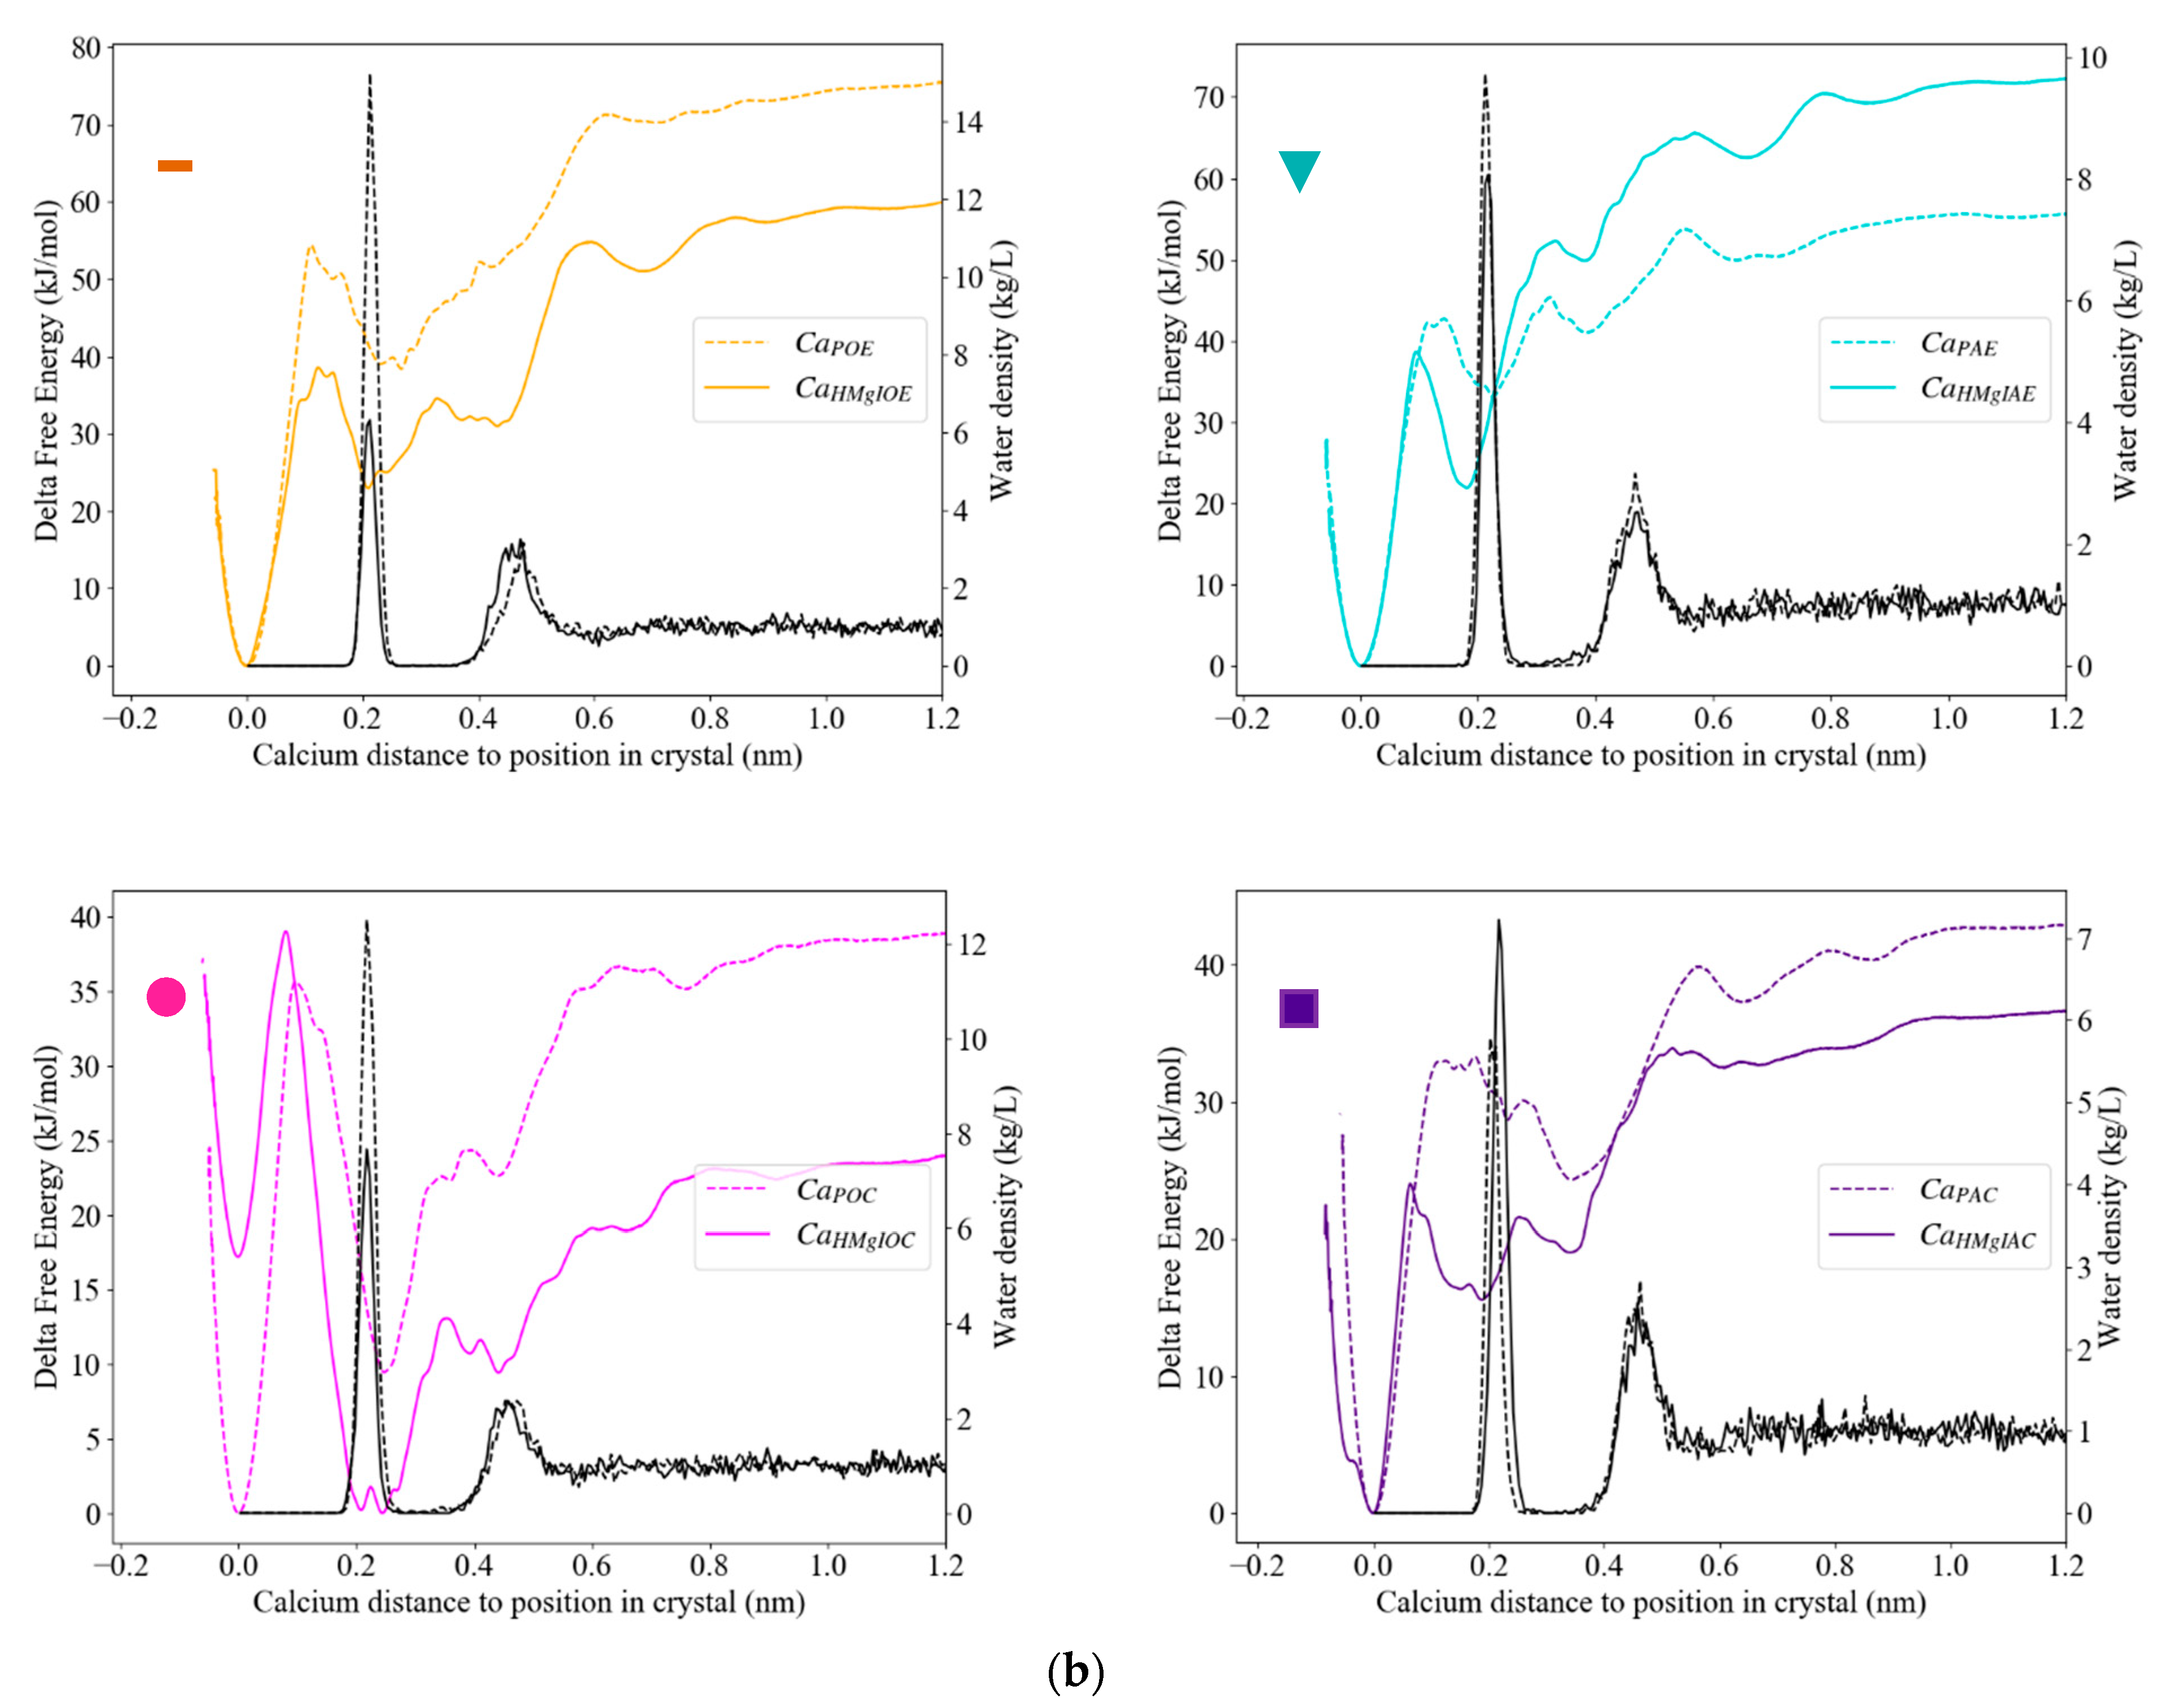
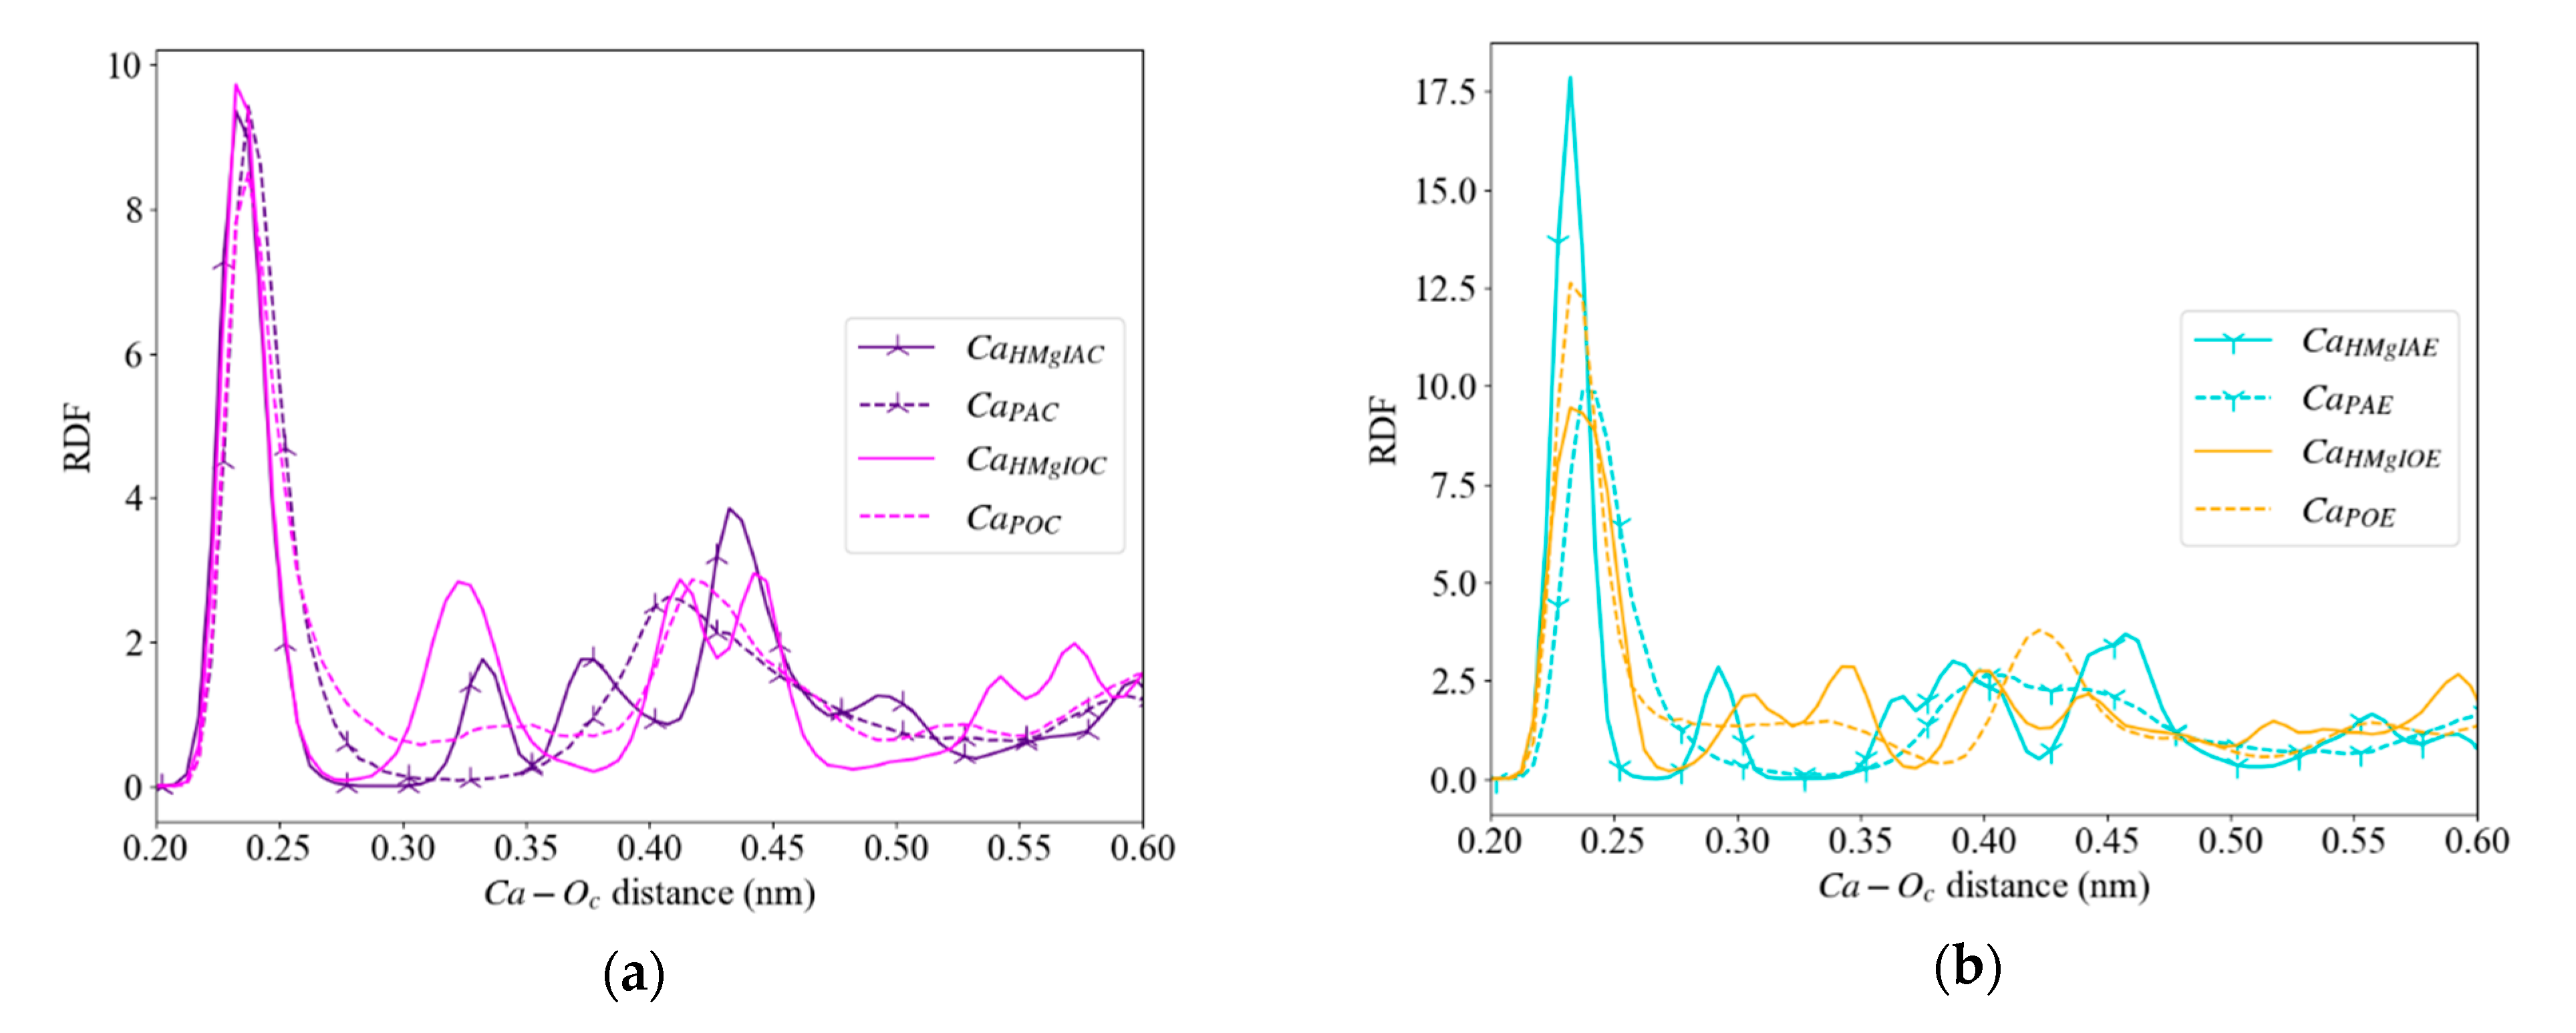
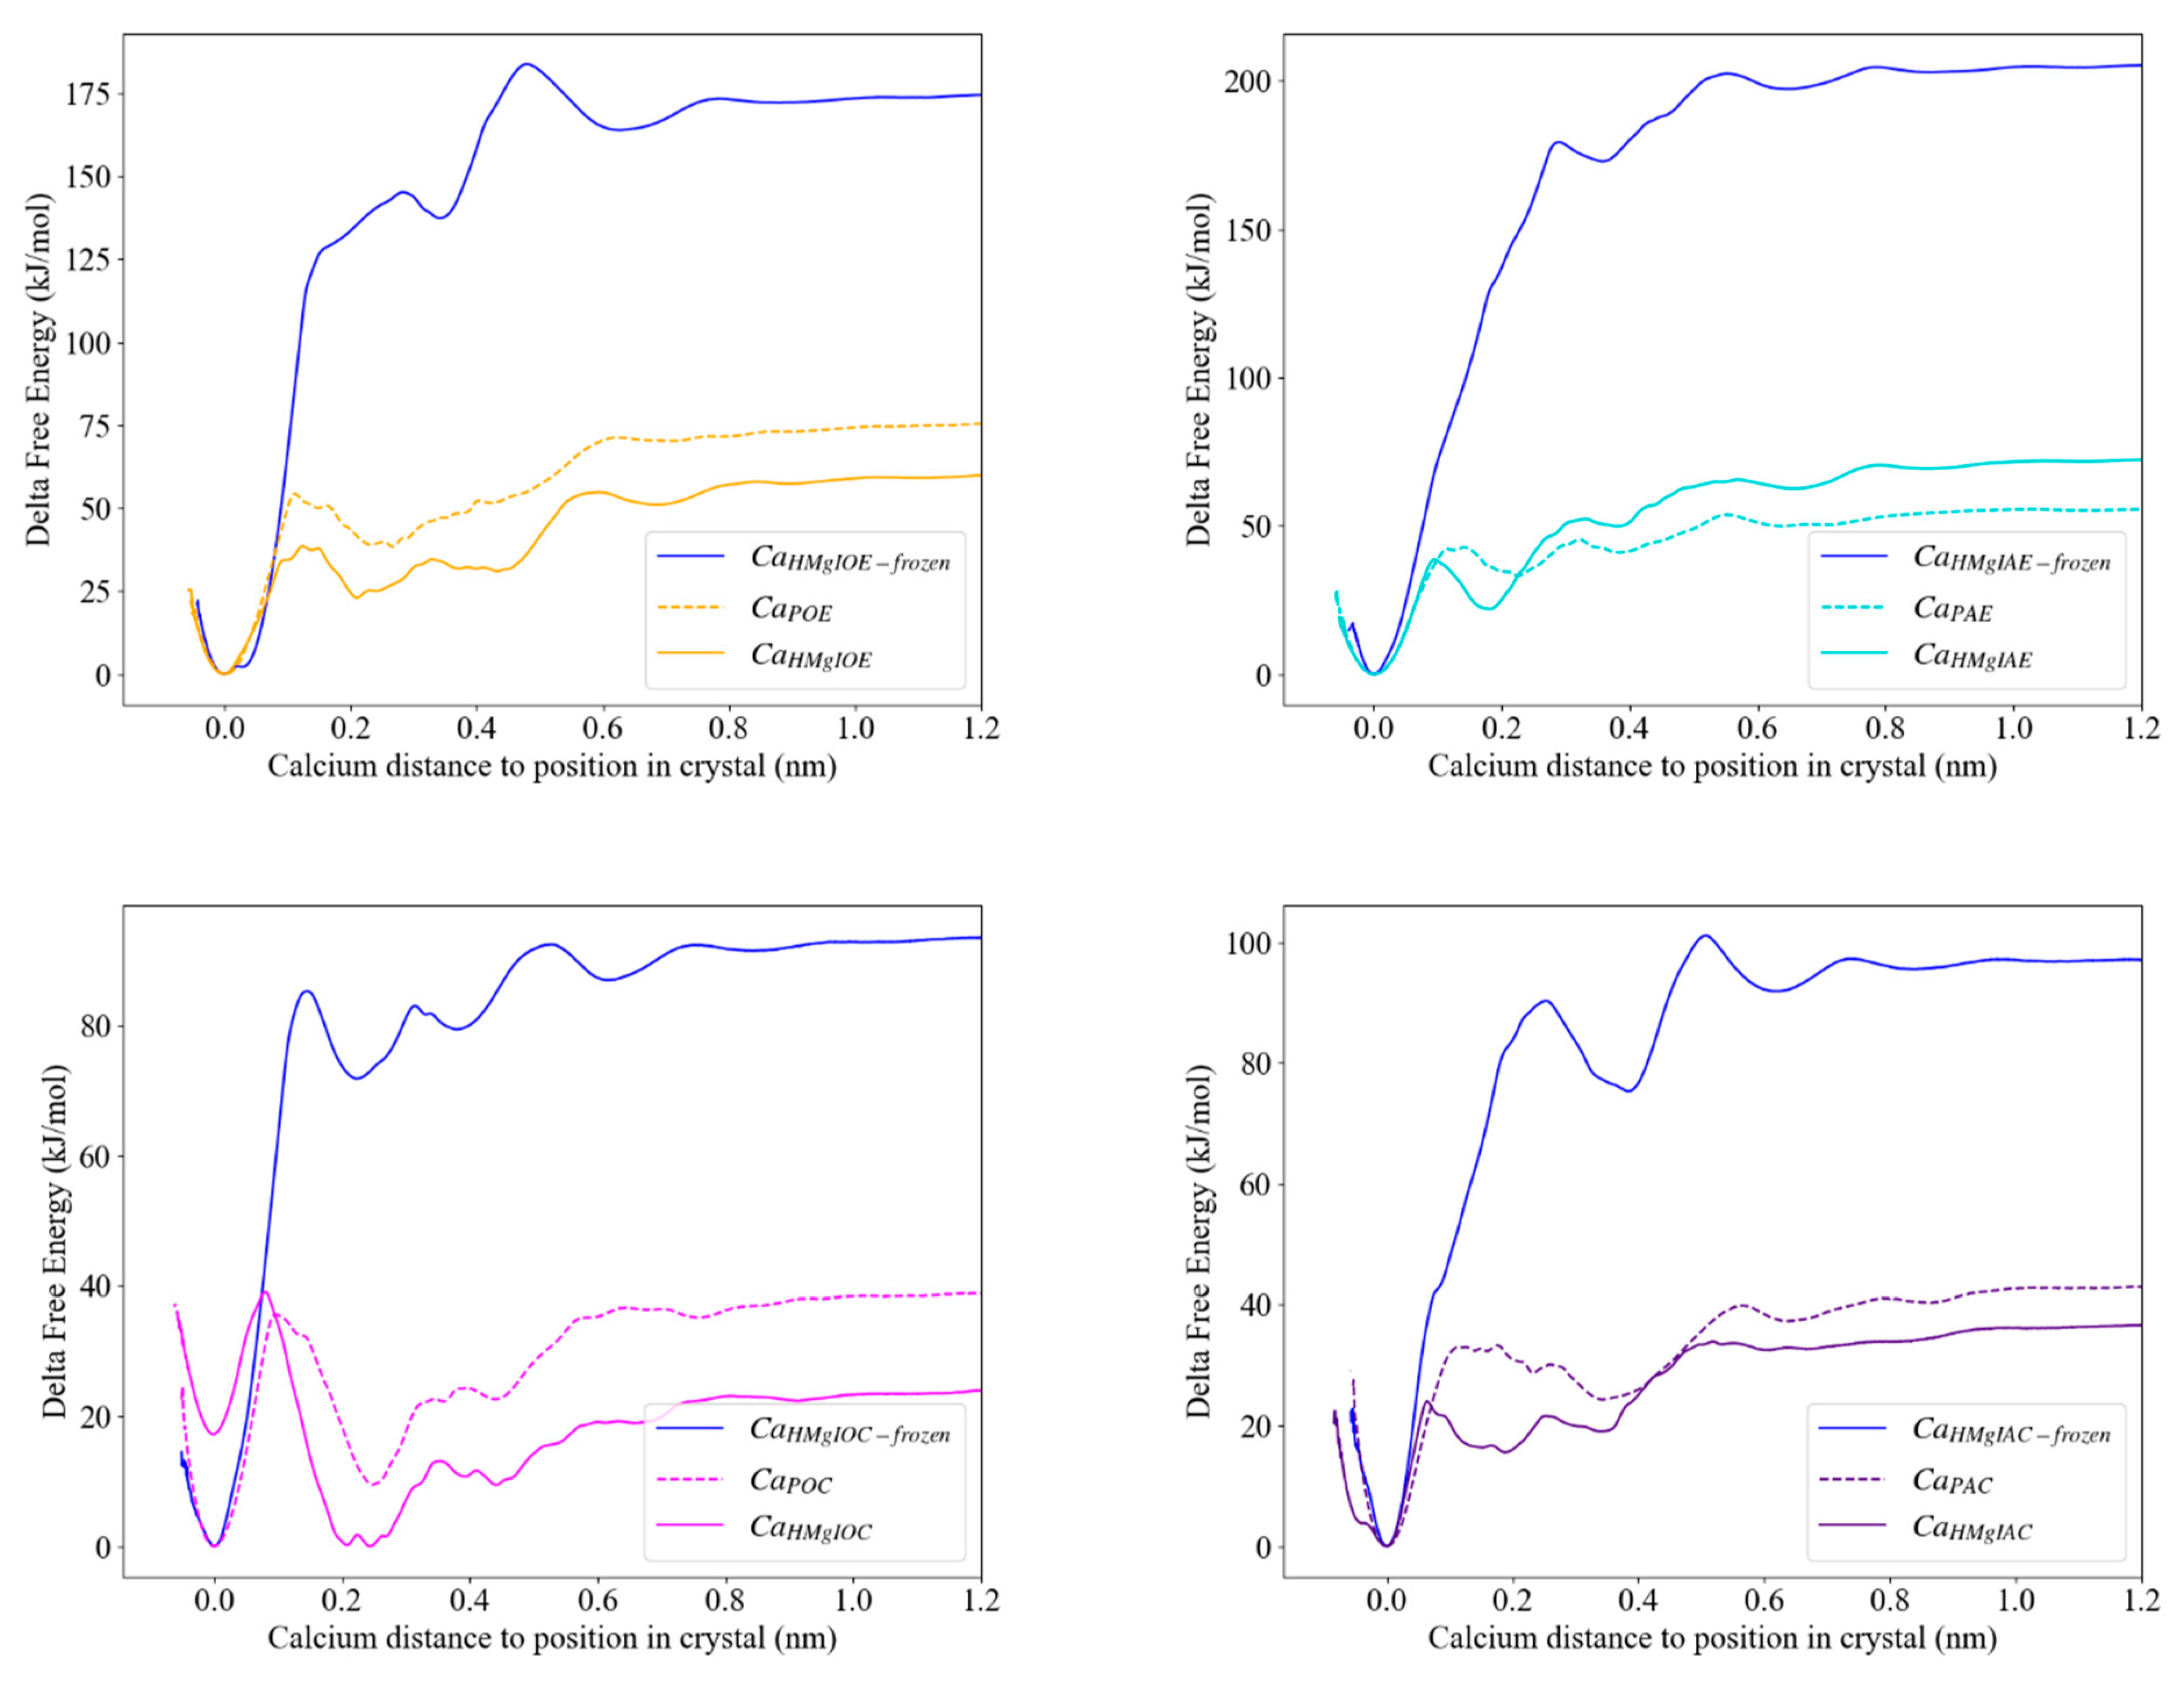
3.3. Free Energy Profiles

The free energy difference between a fully solvated Ca2+ and a Ca2+ in the crystal position, ΔGextraction, was calculated for eight different environments on a flat { 10 1 ¯ 4 } surface, in pure, LMgF and HMgF calcite. The values were in the range ~191–230 kJ/mol, where the ΔGextraction for different crystal positions with respect to Mg2+ ranged from ~197-223 kJ/mol and the ΔGextraction of a Ca2+ from the { 10 1 ¯ 4 } flat calcite crystal surface was 204 kJ/mol (Table 3). The profiles of the different flat surfaces showed a steep increase in free energy until 0.5 nm and converged at around 0.9 nm, corresponding to the second interfacial water layer and the start of bulk water behaviour, respectively. In Figure 4, we present free energy profiles obtained from the extraction of Ca2+ from a pure and LMgF calcite { 10 1 ¯ 4 } surface. All calcium ions in the nearest surroundings of Mg2+, i.e., without another cation in-between, had a higher ΔGextraction compared to the ΔGextraction of Ca2+ in pure calcite. For HMgF, the ΔGextraction for surface calcium varies with the local environment of the crystal between 191 to 230 kJ/mol. Higher energy barriers were found when a Mg2+ ion was in the direct vicinity of the target Ca2+. Two out of three Ca2+ gave a ΔGextraction higher than the energy needed to extract one Ca2+ from a pure system (Figure 5). To describe in more detail the conditions leading to a difference in ΔGextraction, we used the labels in Table 3 to distinguish between the different Ca2+ environments, both with respect to the number of Mg neighbours and the surface topography.

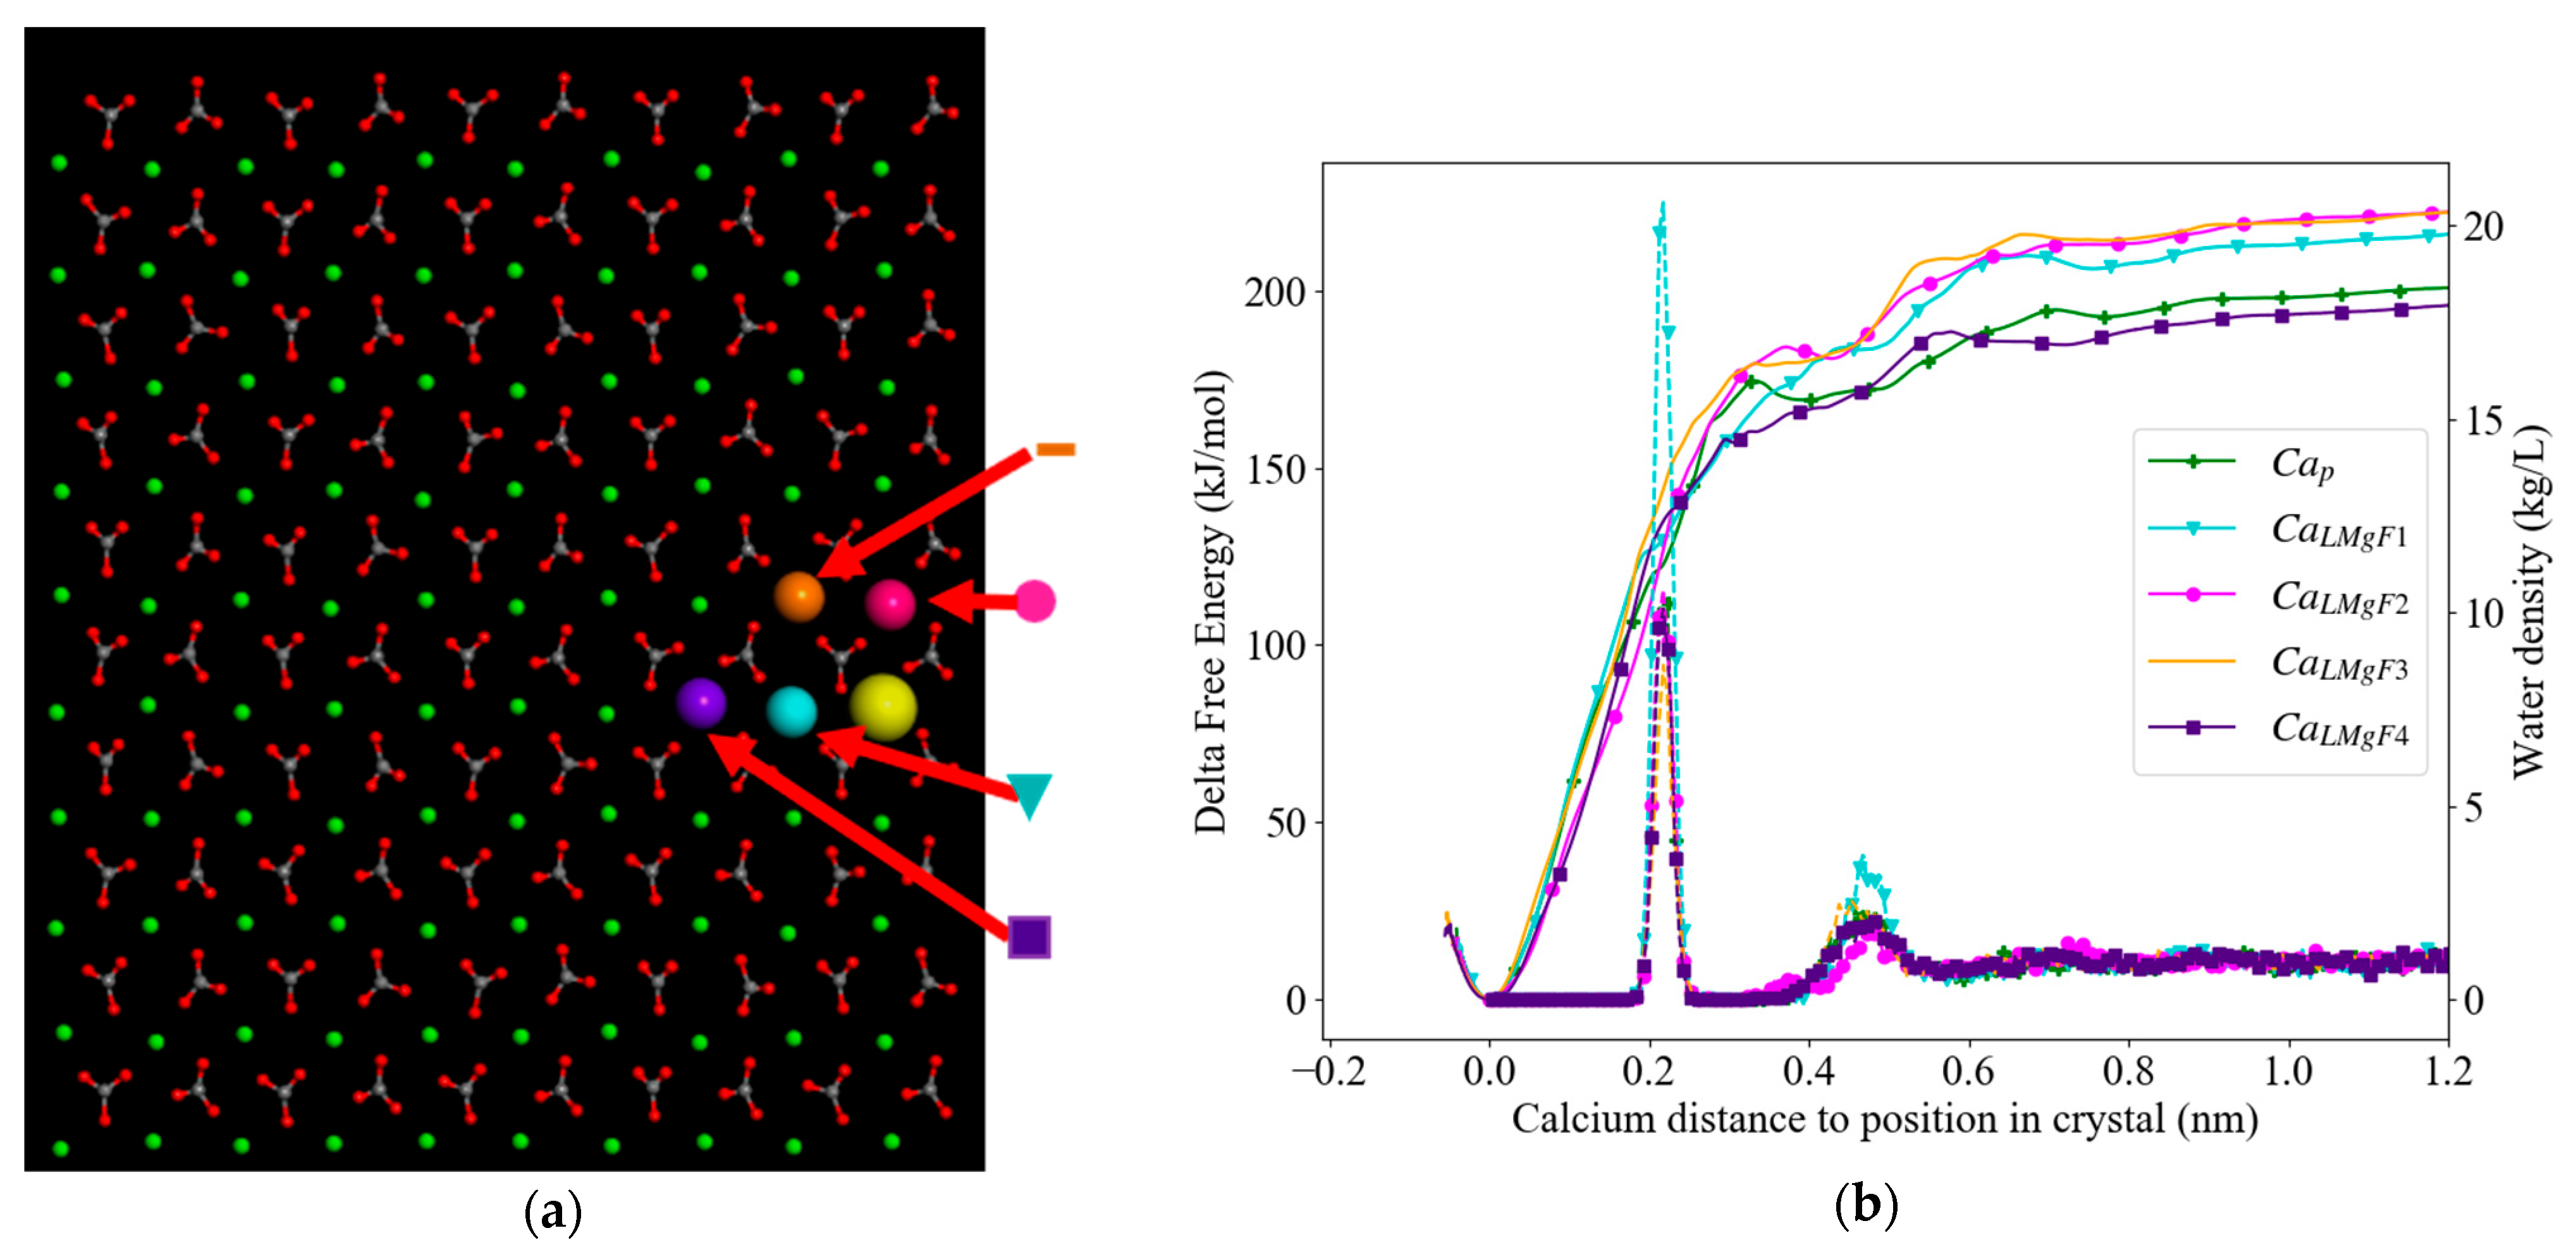
3.3.1. Low Mg2+ Calcite

The ΔGextraction profiles for the LMgF system showed narrower and shallower local minima (Figure 4b) than in the pure calcite (green line, Figure 4b). Furthermore, while the average distances in LMgF were the same as in pure calcite, locally there were small but visible variations (Table S6). Figure 4b illustrates the small local variations in the free energy profiles, water densities and distances for four Ca2+ ions located at a unique distance from the surface Mg2+. Note that the water densities (right axis in Figure 4b) represent the local water z-density of the unbiased simulation, i.e., the water density before calcium extraction. CaLMgF1 had the shortest distance to the Mg2+ and was the only Ca2+ for which the two neighbouring Ca2+ (at ~0.4–0.5 nm) were not at the same distance (the closest at 0.4525 nm and second nearest at 0.4925 nm). The ΔGextraction profile for this surface calcium shows a small dent at the distance where the highest water density is observed (Figure 4b), although there is no strong correlation between the water density and free energy profiles. For CaLMgF2 and CaLMgF3, the free energy profiles, water density profiles and distances to neighbours were comparable (Figure 4b). The three Ca2+ nearest to Mg2+ had ΔGextraction which was higher than pure calcite. For CaLMgF4, the second Ca2+ distance was slightly longer than the other distances and it was the only site with lower ΔGextraction than pure calcite.

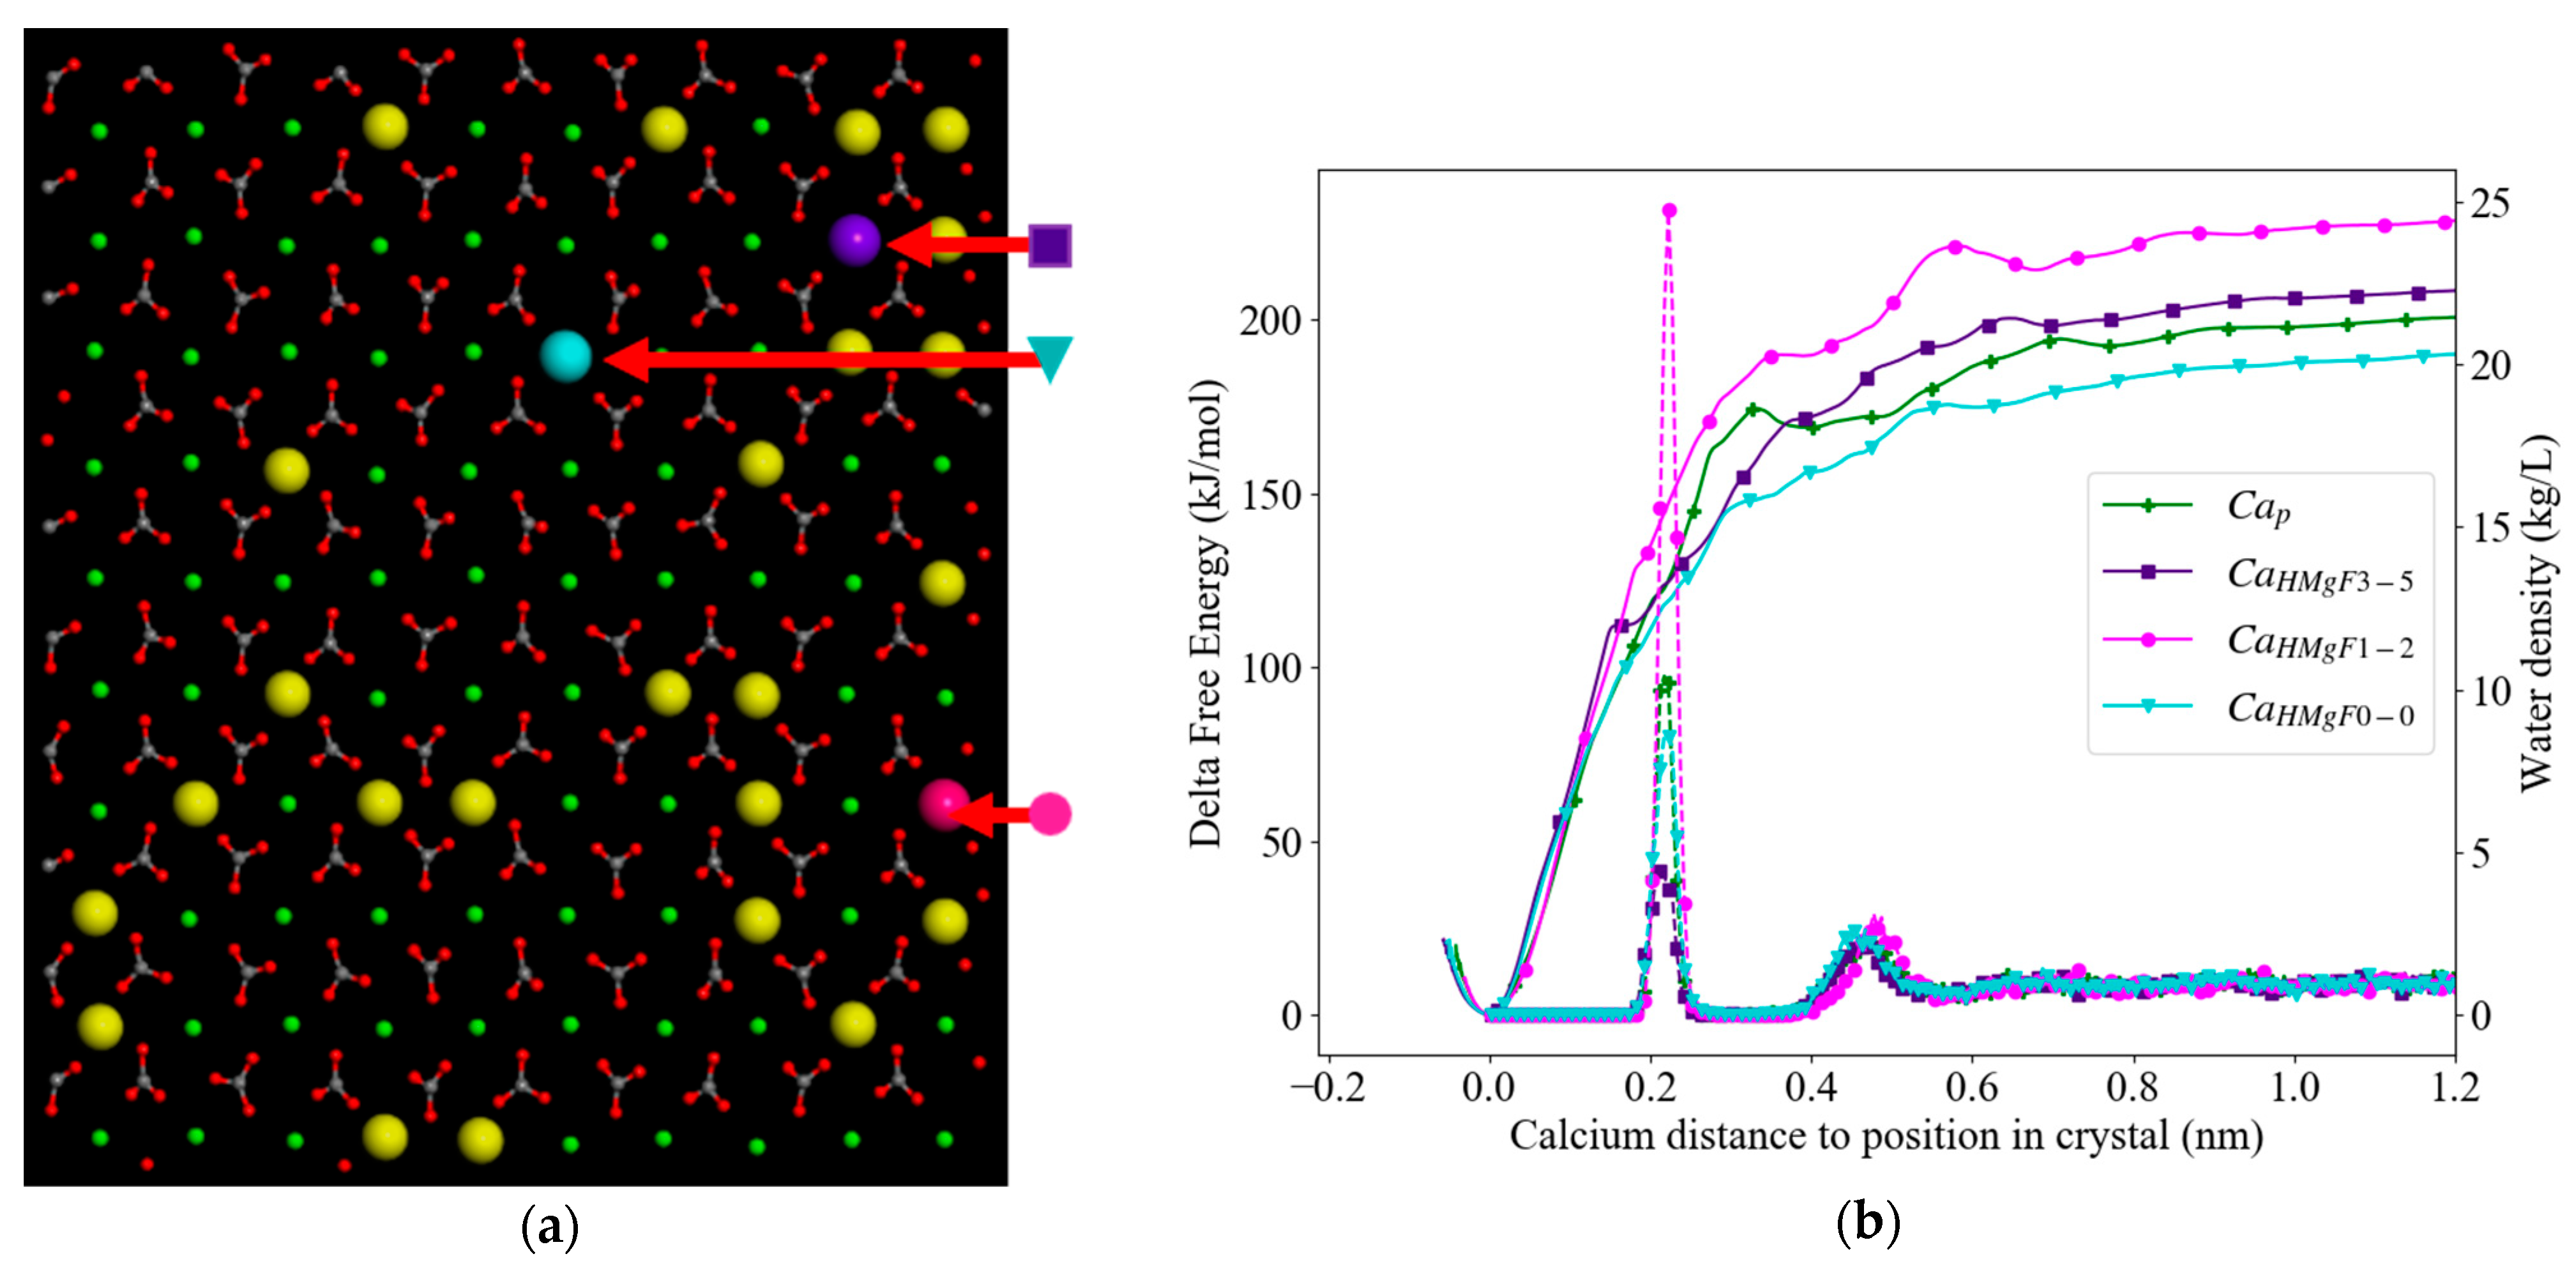
3.3.2. High Mg2+ Calcite

For the free energy profiles determined in the HMg system, three calcium sites were selected that could be differentiated by the number of Mg2+ in the vicinity. The first site (CaHMgF0-0; Figure 5a) showed average coordination distances to Oc (0.232 nm) close to the average coordination distance in pure calcite. The energy profile showed a shallower energy minimum at its relaxed position in the surface, resulting in a total ΔGextraction that was 13 kJ/mol lower compared to the extraction of Ca2+ from a pure system. The first and second peak in the water density profile correlated to moderation of the slope of the energy profile, but no other local minima were observed upon extraction. The second Ca2+ (CaHMgF1-2) had one Mg2+ next to it and another at a slightly larger distance (Figure 5a). Furthermore, two Mg2+ ions were present nearby in the second crystal layer. The average coordination distance to Oc (0.282 nm) was somewhat shorter than for pure calcite (Table S5). In the free energy profile of the second Ca2+ (CaHMgF1-2; Figure 5a), shallow local minima on both sides of the second peak of higher water density (at 0.45 nm) were observed. With a total ΔGextraction that was 26 kJ/mol higher than the pure calcite, this Ca showed the highest energy needed for extraction. Also, the water column on top showed the highest water density at the first peak in the density profile of all calcium sites. This high water density was comparable to CaLMgF1, which also had a Mg2+ at 0.39 nm (cf. Figure 4a and Figure 5a). Moreover, in both cases the second peak in the water density profile was slightly shifted away from the flat surface.
The last investigated site on HMgF (CaHMgF3-5; Figure 5) had the most Mg2+ ions in its vicinity and a total of five Mg2+ in the surface layer. It also had one Mg2+ in its vicinity in the second layer. It is worth noting that the distance of the closest Mg2+ and CaHMgF3-5 of 0.385 nm was similar to the distance between Ca2+ and Mg2+ in dolomite (0.387 nm). The average distance of the other two Mg2+ and one Mg2+ in the second layer was 0.486 nm. The average coordination distance to Oc (0.234 nm) is comparable with pure calcite. The Ca site was the only site that showed a clear shallow local minimum at <0.2 nm. The total ΔGextraction had an intermediate value of 5 kJ/mol, which was the closest to pure calcite. This Ca-site showed the lowest water density in the first water layer.

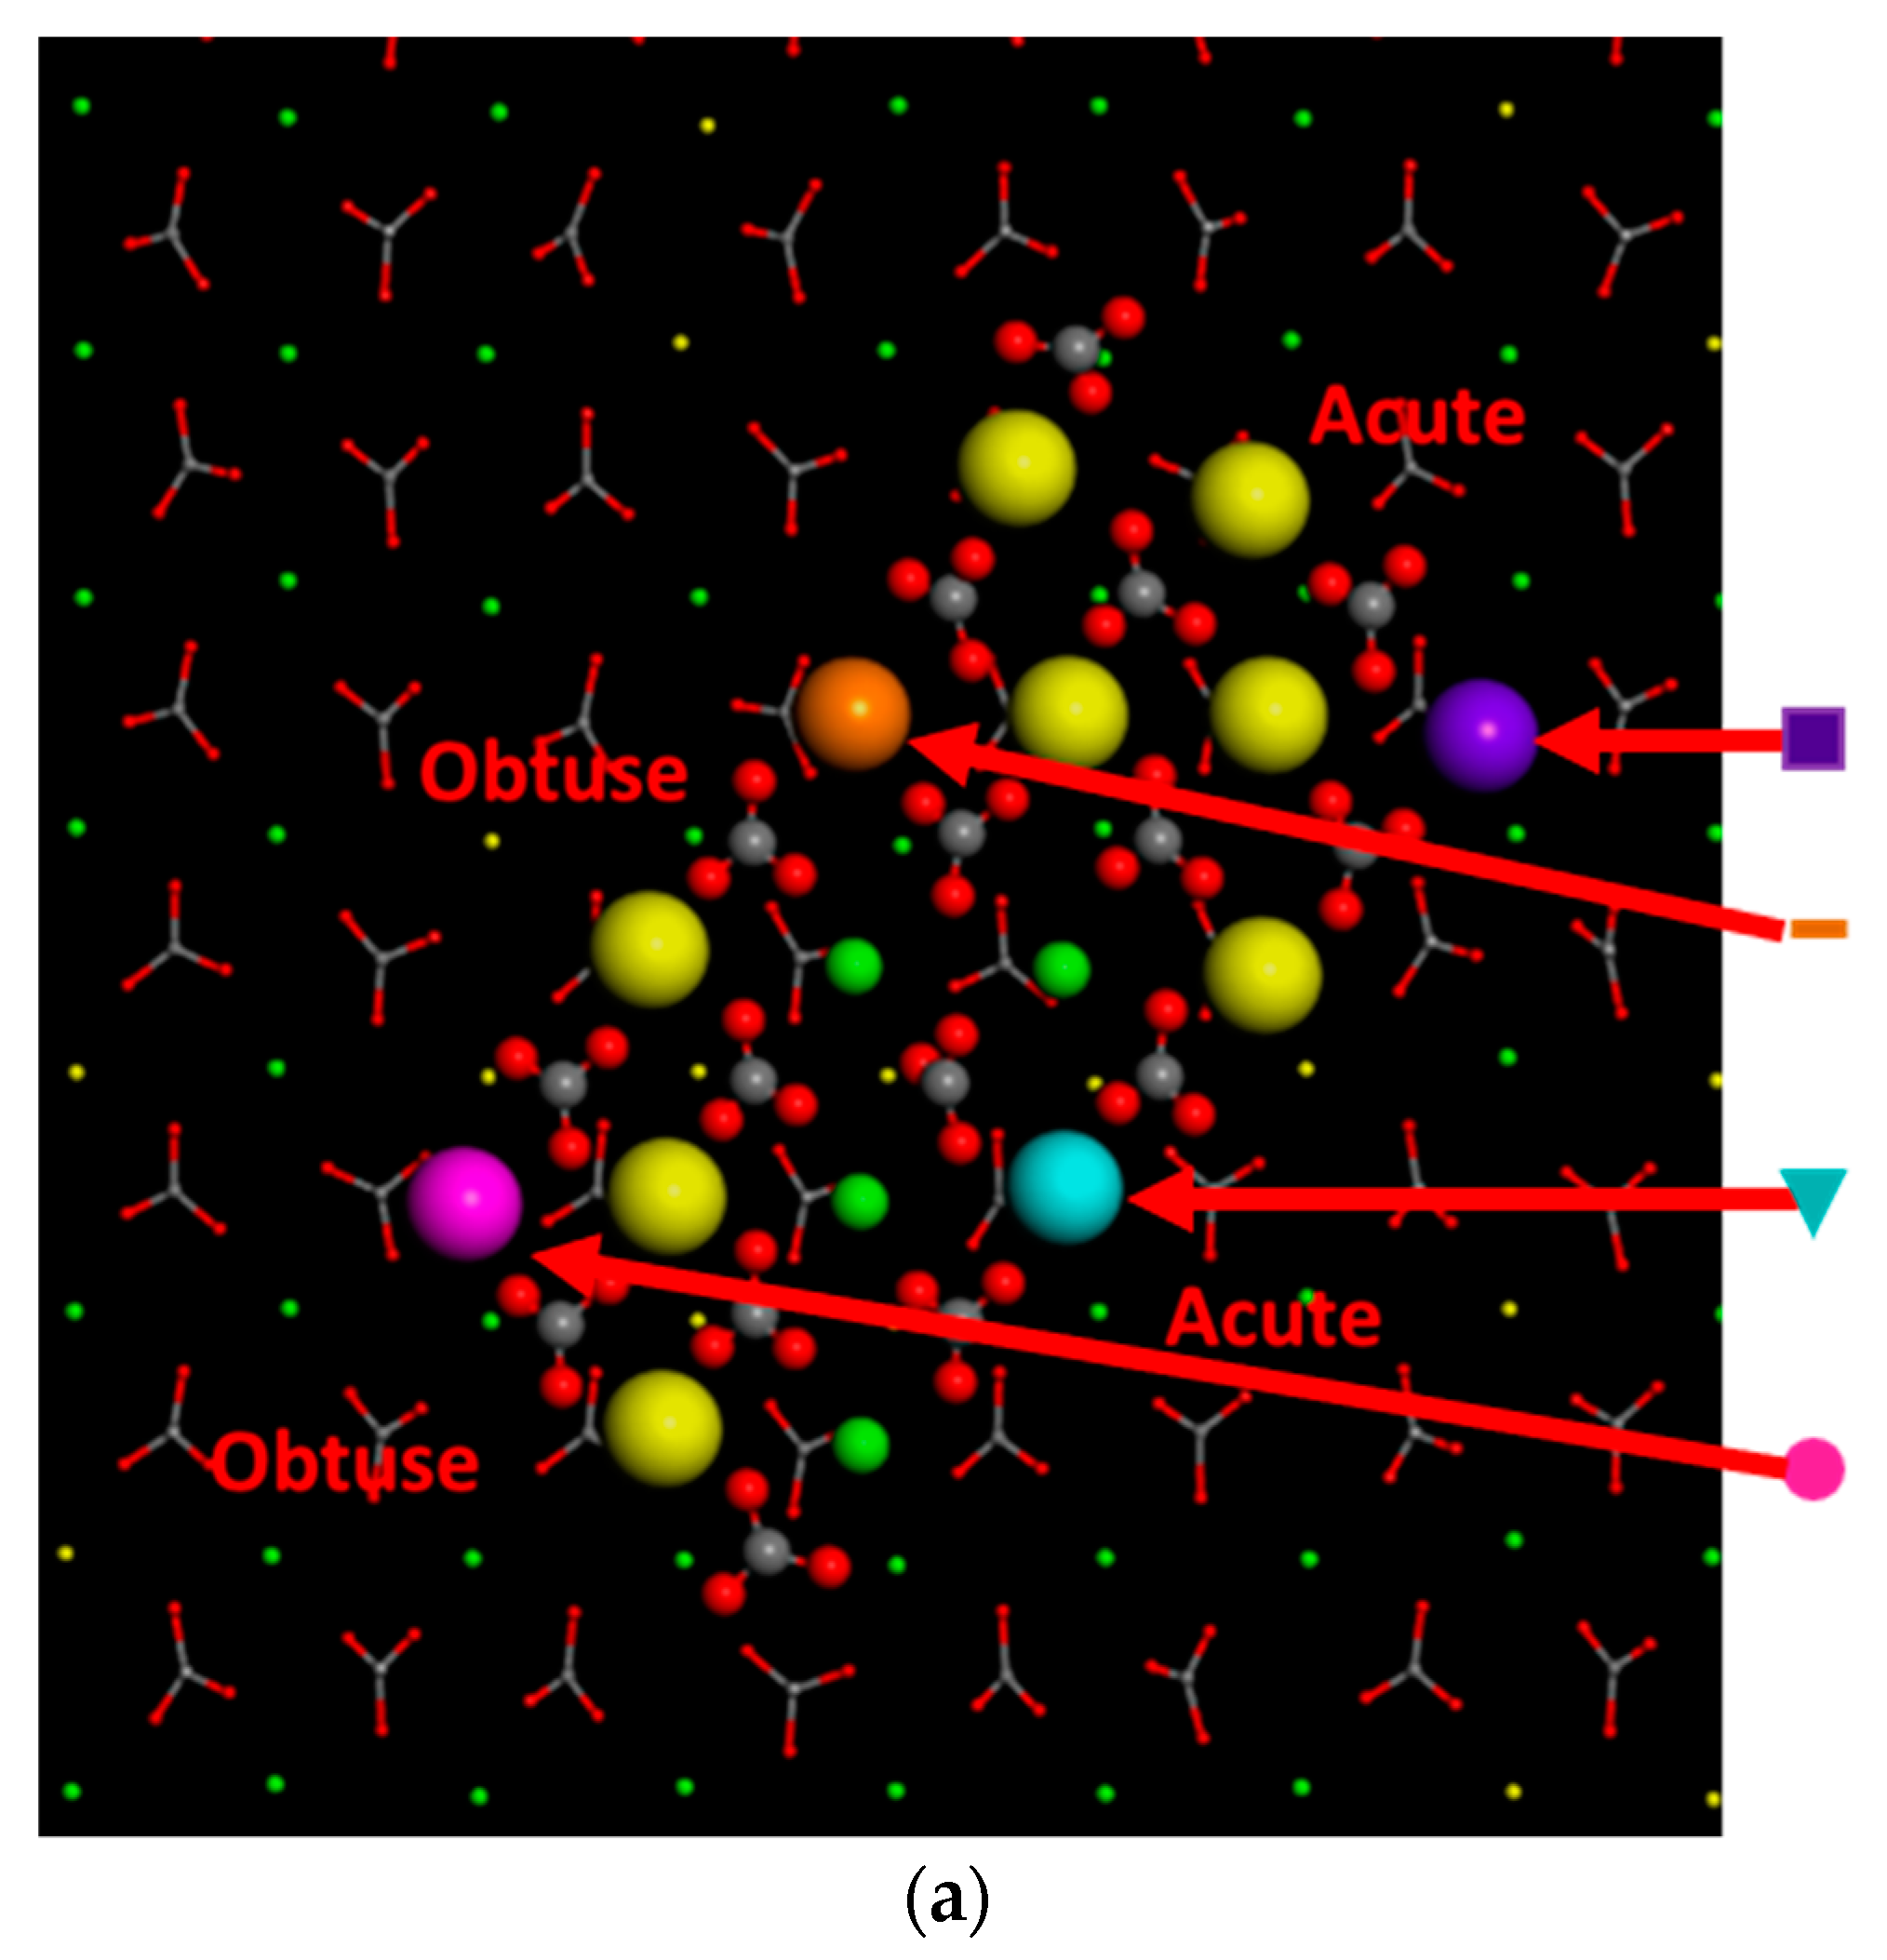
3.3.3. Calcite with an Island

In the Mg-doped island topography on the { 10 1 ¯ 4 } surface (HMgI, Figure 6a), we focused on four different sites of the 4×8 atoms island. Note that initially the Mg2+ impurities were randomly distributed, causing a 50% impurity level in the island. Subsequently, we moved a few Mg2+ closer to the corners to make them have equal amounts of impurities before starting the simulations. The Mg-rich island showed relaxation of the surface structure (Table S7), where the local symmetry of the island changed and the distances and positions were altered relative to the pure island. Consequently, the edges in HMgI did not have the same symmetry in the crystal as observed in the PureI edges. The RDFs between island-surface Ca2+ and Oc of high HMg (Figure 6) showed more distinguishable peaks compared to island-surface Ca2+ in pure calcite (in Figure 7).
In general, the energy profiles of PureI and HMgI (Figure 6) showed similar shapes with local minima and maxima at the same positions, yet the minima in the HMgI profiles were deeper, for example creating a more substantial minimum around the second peak of water density (~0.5 nm) on the obtuse edge. The total ΔGextraction (Table 3) for the obtuse edge in PureI is 16 kJ/mol higher than the same edge in HMgI. Furthermore, the extraction of Ca2+ is less favourable from the obtuse edge compared to the acute edge. For the acute edge, the PureI had a total ΔGextraction that was 16 kJ/mol lower than HMgI and was therefore the most easily extracted (dissolved). For the corner calcium sites in HMgI, the free energy profile (Figure 6b) showed several shallow minima and clear local minima on both sides of the water density peaks. Exceptionally, for the calcium site at the obtuse corner of HMgI, these minima were lower in free energy than the minimum for Ca2+ in the crystal structure. Although the difference in extraction energy (Table 3) between the position in the crystal and fully solvated was only 7 kJ/mol, the total ΔGextraction for this calcium was 24 kJ/mol, due to the low second minimum, yielding a free energy of extraction 15 kJ/mol lower than its pure calcite equivalent. The difference between total ΔGextraction of HMgI and PureI at the acute corner site is 6 kJ/mol and thereby the smallest difference observed on the island.
The HMgI edges showed a similar density for the obtuse and the acute edge, both lower than the PureI edges. The main differences in the water density profiles were observed in the first peak, i.e., the first layer of interfacial water. The water density on top of the obtuse corner in PureI had the highest water density of the island corners. The lowest density was observed on the acute corner of PureI, which also showed a small shift of the peak towards the surface. As in the trend for the corners, the obtuse calcium edge sites CaPOE showed the highest water density in the first peak.

3.4. Impact of Surface Carbonate on Energy Profiles

When determining the free energy profiles for calcium extraction from the island surfaces, we observed relaxation of carbonate ions in the vicinity of the extracted calcium sites. To study the impact on ΔGextraction, we froze all carbonate ions in the island and compared the free energy profiles (i.e., the carbonate groups were fixed in position and could not rotate or vibrate, Figure 8). The second energy value for the HMgI surface in Table 3 corresponds to the ΔGextraction for frozen CO32−.
Due to the frozen carbonate groups, the energy profiles changed significantly, the first minimum was deeper and the profiles are more similar in shape to the profiles obtained from the flat surface. In addition, the shapes and locations of the local minima showed little or no correlation to the unfrozen profiles. When the CO32− groups were frozen in their position, the ΔGextraction for the extraction from the corners were calculated at 90 and 97 kJ/mol for the obtuse and the acute corners respectively. These energies are 66 and 60 kJ/mol higher, respectively, than in the system where the carbonate ions were not frozen. To remove calcium from the edges, we calculated the total ΔGextraction to be 175 kJ/mol for the obtuse and 206 kJ/mol for the acute edges, respectively. As such, the free energy required to remove calcium from the acute edge was within the range of free energies obtained for the flat HMg surface.

4. Discussion

Before we focus on the impact of Mg, we compared our observations for the pure system with those previously published. Note that an extensive study of the force field used here, and the resulting { 10 1 ¯ 4 } surface interaction with water, was compared to X-ray data and our results compare well with these previously published values [14,43]. The surface energy we obtained for the atomically flat dry { 10 1 ¯ 4 } surface of a pure calcite compares well with previously published values (0.23–0.86 J/m2, Table S4) [65], including the value reported for the same forcefield (0.71 J/m2) [66]. The difference with this last value is possibly due to the extra relaxation by the MD simulation with water prior to the dry optimization of the slab in our methodology. Experimentally dry surfaces are never completely free of water, and hence lower surface energies were measured. The surface energies for wet surfaces are more comparable to the experimental values for the dry surfaces (0.23–0.34 J/m2); this discrepancy can be explained by the fact that experimental surfaces have defects (covered with water) that are not reproduced in the atomistic models [67].

4.1. Influence of Magnesium on Calcite Solubility and Dissolution

It is important to note that we do not see a systematic trend in a single parameter with changing Mg concentration in the solid, which suggests that the impact of increasing Mg content is a complex interplay between the different system characteristics. Consequently, upscaling to, for example, the meso-scale leads to numerous issues (see also [68,69]). This complexity is inherent in the microscopic scale, since there are many parameters that can play a role (simultaneously). The non-linear correlation of solubility with Mg concentration may suggest that the controlling parameters might change with increasing Mg.
The overall crystal and surface structures, as well as the interfacial water, for LMgF was very similar to pure calcite, suggesting that the local environment controls the stability of specific Ca-sites in the surface. For HMgF, the explanation becomes more complex, since there are more parameters in the interfacial water and the crystal structure that are distinct from pure calcite. In the sections below we discuss these parameters consecutively, showing trends and possible explanations for why some calcium sites are more prone to dissolve than others.

4.1.1. Interfacial Water Structure

The interfacial water is key in the growth and dissolution of any material (e.g., [70,71]). The structure and dynamics of the water in direct contact with the material can be described by the hydrogen-bond structure [72]. In this section, we focus on the flat surfaces to discuss the impact of Mg on the interfacial water, to avoid the added interplay of roughness. A clear layering of the water until 0.8 nm from the surface was observed for our pure calcite system, which has been seen before on calcite and other minerals in both theoretical [73,74] and experimental studies [75]. While the interfacial water structure in LMgF was indistinguishable from that in pure system, the water structure around the Mg2+ in the HMgF surface showed clear differences. As a result of the higher magnesium content, HMgF attracts water closer to the calcite surface, thereby disturbing the water layering (Figure 2). This behaviour agrees with that shown in previous computer simulations, where Mg2+ was adsorbed onto the surface [44,55,76]. With this disruption in the water layer, the hydrophilic and hydrophobic zones in the layering are both shifted 0.01 nm towards the surface.
The hydrogen-bond network for interfacial water is highly affected by the interaction with the crystal surface, with all vibrational modes shifting to higher energies (Figure S2). The higher intensities in our VDOS spectra indicate a stronger H-bond network directly over the surfaces compared to bulk liquid water for pure, LMg and HMg systems. For HMgF, the somewhat lower vibrational intensities around 110 and 400 cm−1 suggest that Mg2+ disrupts the H-bond network. This agrees with the lower number in H-bonds on top of Mg2+ (Table 1) and the altered dipole angle, indicating that the plane of water molecules is positioned more parallel to the surface (Section S3 in the Supplementary Materials and Table 1). Combined with the shorter Mg2+ to water oxygen distances (Figure 2, see c), this results in a lower tendency to form H-bonds with other water molecules from, for example, the second water layer. Instead, water molecules coordinated to surface Mg2+ are more likely to have proton-oxygen interactions with neighbouring carbonates. As a result, water molecules are librating towards neighbouring water molecules and Oc that are at the H-bond distance. Furthermore, the increase in librations (Figure S3, ~600 cm−1) for HMgF interfacial water suggests that there are more possibilities to form H-bonds, in agreement with the higher average water density (Figure 2) and shorter H-bond lifetimes. Due to the disruptions in the water layer, surface Ca2+ sites experience a weaker interaction with water molecules, resulting in higher water exchange frequencies and higher water diffusion coefficients to and from the surface calcium sites (Table S2).
The differences in intensities in the water z-density profiles do not correlate with the energy profiles or the ΔGextraction. The effect of water on the stability of the Ca2+ in the crystal is therefore minor. This observation is in agreement with experiments [48], although the disruption of the interfacial water structure in HMgF, resulting in higher water exchange frequencies and diffusion rates near surface calcium sites, are likely to contribute towards the release of Ca2+ and thereby enhance dissolution of the crystal.

4.1.2. Surface Energies and Structural Relaxation

Since higher Mg-bearing calcites are generally observed to be more soluble than pure calcite, the surface energy for HMgF was expected to be higher than for pure calcite [77]. Counter-intuitively, the lower surface energy for HMgF obtained indicates a more stable flat { 10 1 ¯ 4 } surface compared to pure calcite. This is most likely due to the strong relaxation observed in the crystal surface, in combination with the re-positioning of water molecules in the interface. Alternatively, in the atomically flat low-Mg calcite, no alteration of the global crystal structure and interfacial water was observed, and a small local deformation at the surface resulted in a 0.01 J/m2 increase of the surface energy relative to the pure system. Again, this was counter-intuitive, given that low-Mg calcites generally show lower solubility than pure calcite. Despite the differing methodologies, the higher surface energy for LMgF compared well to the trend seen in the literature, where a calcite slab with one Mg2+ had a slightly higher energy compared to a pure calcite { 10 1 ¯ 4 } surface [78].
In the case of a { 10 1 ¯ 4 } surface with a small island, which may be considered more comparable to realistic surface topographies, we obtained dry surface energies indicating that HMgI calcite is less stable (Table 2). Due to the random Mg distribution, the island contains higher concentrations of Mg2+ than the average HMgI slab, causing local alterations in the crystal structure (Table S7) that cannot be compensated fully, causing higher stress at the interface.
As can be seen from the surface energies of the wet surfaces (Table 2), water is stabilizing the interface as it interacts with the surface and in particular with surface Mg2+. This agrees with previous work where dolomite and magnesite have a lower wet surface energy than pure calcite and the water showed a greater impact on the surface energies for the Mg-bearing minerals [25]. Due to the stabilizing effect of water on the surface energy, there is no indication that the HMgF surface is more prone to dissolution than the pure and LMgF. We therefore explored the variability of the surface energy during the simulation relative to the optimised bulk configuration (cf. [79,80]). Note, that the average dynamic surface energies and standard deviations obtained (Table S3) are significantly higher than the surface energies in Table 2, due to the absence of energy minimization. Yet, the order of the values is the same as for the dry surface energies, implying again that the HMgI is the least stable system. The larger variance in surface energy for the surfaces with an island (Table S3), indicates a more mobile surface, with the largest variance for the HMgI indicating a very dynamic surface. As expected, the structure further into the slab and the interfacial water structure and dynamics were affected, which may imply that dissolving a surface island on a HMgI calcite is easier compared to a pure calcite and may be related to the deformed crystal template and the difficulty to find an island configuration that matches the crystal layer below.
The deformation of the crystal due to Mg2+ incorporation has beenn mentioned before in experiments, and is generally thought to be the reason for the increase in solubility of high-Mg calcite [81]. Furthermore, anhydrous experiments found that discrepancies in reactivity can be explained by stress in the crystal caused by the presence of Mg2+, independent of the water-material interaction [48]. Ab initio simulations supported both experiments and found a carbonate ion tilt by 6% due to the introduction of Mg2+ into the crystal [82]. We also observed some minor tilting of the carbonate ions in the surface, although we did not quantify this behaviour (Figure 3b), while the compression observed for HMgF calcite along the c-axis (Figure 3a) is related to local alterations of Ca2+–C distances (Figure 3b).
To summarise, the atomically flat surfaces show trends in overall surface energies that are opposite to those expected from known solubility trends, while the variability in surface energy with time does follow the solubility trend, suggesting that a more dynamic surface reflects a more soluble surface. Increasing structural deformation with increasing Mg content confirms previously reported structural destabilization of the crystal structure.

4.1.3. Local Variability in Surface Free Energies

The trend in the surface energies of the flat surfaces, showing HMgF being more stable due to the structural rearrangement, appears to contradict experimental observations. However, when also considering more realistic surface structures such as edges and kinks/corners, the surface energies, crystal deformation and interfacial water distortion suggest that once the surface contains imperfections, the system may become thermodynamically less stable, increasing the solubility product for HMgF as measured in experiments [83,84,85,86,87]. In order to investigate the impact of magnesium impurities, it is worth investigating the influence on the actual mechanism of dissolution, i.e., extraction of calcium ions from surface edge and kink sites as well as from atomically flat surfaces.
In general, calcite crystals will dissolve faster from terrace corners, edges and kink sites (e.g., [30,88,89]) than from a flat surface. The extraction of a cation from an edge or corner generates new kinks (strongly under-coordinated surface sites). The free energy profile for such calcium edge or kink site extraction was investigated in HMgI and pure calcite with an island (PureI). With the notable exception of the acute edge calcium site, the overall ΔGextraction was consistently lower for HMg island surface sites than for the same sites in the pure material (Table 3 and Figure 6b). Generally, it may therefore be concluded that rough HMg surfaces will dissolve more easily via calcium detachment than pure rough surfaces. The first minimum in the energy profiles corresponds to the equilibrium position in the crystal surface, the second minimum is at the same height as the first water layer near the surface (Figure 6b), which shows that the interfacial water molecules slightly stabilise extracted calcium ions. Note that there are subtle differences in interfacial water structure, density and local energy minima (Figure 6; and potentially carbonate molecule flexibility, see below) and that this interplay may contribute to defining the overall ΔGextraction for surface calcium ions. For extraction of PureI and HMgI surface corner and edge calcium sites, the local energy minima within <0.5 nm from the surface suggest that there is stabilisation of the extracted calcium, most likely as an inner sphere complex. For the obtuse corner on HMgI, this inner sphere complex is energetically more stable than its position in the crystal.
The dissolution of flat surfaces first needs new etch pit nucleation events, which is an important (rate limiting) dissolution mechanism at near equilibrium conditions [90,91]. The extraction of a single ion from a pure flat calcite face represents an unassisted etch pit nucleation event (i.e., without related sub-surface structural defect), which needs 204 kJ/mol according to our simulations (Table 3). The extracted Ca2+ from the flat surfaces shows a similar energy profile as published before, although the shallow energy minimum observed around 0.3 nm is more pronounced in our simulation and the total ΔGextraction at ~250 kJ/mol is higher [39]. A possible explanation can be the use of a different water force field, whereas our water force field also gave a slightly lower density in the coordination shell of Ca2+ [44,54]. In both our results and the literature, the free energies converge at >0.5 nm away from the surface. The extracted ion can still interact with the vacant site, even though there are layers of water in between. The lack of a local minimum closer than 0.5 nm to the surface suggests that there is no stabilisation of an inner sphere complex at the flat surface. The formation of outer sphere complexes (i.e., the energy minima at >0.5 nm from the surface) initiates the convergence of the free energy profiles. This observation is also seen in the impure flat surfaces, where the shallow minima/maxima are positioned between the first and second water layer. Structural imperfections, such as (local) deformation due to Mg impurities, can assist or inhibit nucleation of new etch pits. Accordingly, in LMgF it is expected that calcium extraction generally needs more energy than from pure calcite. Depending on the local environment of the extracted calcium, we observed higher ΔGextraction for LMgF than the pure mineral, albeit not for all calcium extractions (Table 3).
The more favourable ΔGextraction for one of the LMgF sites may be linked to the flexibility of the coordinated carbonate molecules, since we observed that the substitution of Ca by smaller Mg ions generates more space in the crystal structure and therefore more flexibility in the carbonate ions coordinated to that substitutional ion. This flexibility may enhance calcium extraction, and we observed a major increase in the ΔGextraction by 300% when interfacial CO32− ions were frozen (Table 3). Such flexibility of surface carbonate groups has been found previously in X-ray reflective and diffractive experiments, where the flexibility is mainly expressed in the standard deviation of the tilting angle of carbonate, which was reportedly 13 times larger for the surface layer compared to the bulk [92,93]. Although this variation could be due to the two main orientation directions of CO32− observed in AFM [45] and MD (e.g., Figure 1) or the surface roughness expected in every non-ideal, cleaved surface, there was no evidence found in the X-ray data for the existence of two distinguishable groups [92]. Furthermore, based on the ‘roughness factor’ introduced by Fenter et al., the impact of the surface roughness is negligible for X-ray reflectivity data interpretation [92]. It is very likely that the observed CO32− flexibility in X-Ray Diffraction (XRD) is due to imperfections and thereby indicates the presence of rotating carbonate sites on the calcite surface at geometrically more open surface sites (i.e., edge and kink sites). This is supported by the small flexibility observed in MD calculations of a perfectly flat calcite surface here and in previous investigations [14], indicating that the increased coordination of corner and edge sites with water molecules might not be the only reason for more favourable dissolution energetics and higher reactivities of such sites, but that more opportunity for carbonate molecule rotation and flexibility plays a (potential key) role as well. When Mg2+ is in the direct vicinity of Ca2+, the shared coordinated carbonate molecules are held in place more strongly by the stronger bond with Mg2+. Consequently, carbonate is less flexible and less likely to assist in the extraction of calcium. When distortion occurs in the local crystal environment, for example due to the longer Ca2+-distance (Table S6), the carbonate molecules are more flexible, resulting in a ΔGextraction that is slightly below the energy value of Ca2+ in pure calcite.
The lowest value for assisted etch pit nucleation (191 kJ/mol) was observed for the flat HMg surface, although not all calcium extractions led to lower ΔGextraction than in pure calcite (Table 3). These results indicate that it may be energetically more favourable to nucleate new etch pits on HMg calcite than pure calcite surfaces, although this strongly depends on the local magnesium distribution. Two out of three ΔGextraction derived from the HMgF agree with the calculated surface energy, indicating a more stable surface. In one of these sites, smaller distances between Ca and Oc are observed, which causes the Ca2+ to be better charge-compensated and increases ΔGextraction by 26 kJ/mol. In the other site, the local environment is structurally more similar to dolomite than high-Mg calcite and shows an increase in ΔGextraction by 5 kJ/mol, despite the larger Ca–Oc distances and higher water-exchange frequencies (Table S2). The calcium site with the most favourable ΔGextraction showed unaltered bond distances compared to pure calcite, so it appears that here there is no extra compensation from the crystal, unless the nearby presence of Mg ions alters the local charge distribution. Note that classical MD is not capable of revealing such differences at the electronic level and previous ab initio calculations have not reported alterations in charge distributions upon Mg incorporation, but is found to stiffen the calcite structure [82,94] Alternatively, it may be that this calcium site is less stable than Ca2+ in pure calcite, due to the characteristics of interfacial water: with a higher diffusion (Table S2) and less structured water (Figure 2 and Figure S3), Ca2+ is more easily extracted and solvated.
To conclude, calcium extraction is generally more favourable from edge, kink and flat surface sites in a high-magnesium surface than from pure calcite, depending on the subtle interplay between crystal surface and interfacial water structure and density that affects local energy minima. Moreover, the flexibility and opportunity for rotation of surface carbonate molecules may contribute to this complex interplay. This behaviour is particularly clear on atomically flat surfaces, where magnesium impurities limit this flexibility, in particular in low-Mg calcite, thereby potentially playing a key role in the non-linear impact of Mg on calcite solubility.

4.2. Implications for the Influence of Magnesium on Calcite Growth

The forced MD may also be considered to represent the molecular scale energetics of ion approach and attachment/adsorption, when regarding the reversed process of ion extraction. For example, in contrast to the enhanced dissolution of a high-magnesium island surface, it will be more difficult to grow such a feature on a HMgF surface compared to growth on pure calcite. In particular, the deformed crystal template makes it more complicated to match the structure and propagate a step edge. AFM experiments have revealed similar behaviour; the first monolayer of Mg2+ calcite grew normally on a pure calcite template crystal, but subsequent monolayers grew significantly more slowly [31]. In addition, AFM experiments have shown that Mg2+ is found to be a kink poisoner, by occupying a growth site, which drastically slows down growth [50,95,96,97]. In case of growth, our results strongly suggest Ca2+ is less stable on the high-magnesium surface (island) and less prone to approach and attach compared to Ca2+ on a pure calcite crystal. Moreover, we observed that the formation of adsorbed inner sphere complexes of calcium likely precedes incorporation of that calcium in acute corners and edge sites of PureI and HMgI, as well as the obtuse edges of the pure calcite island. In contrast, on the HMgI obtuse edge, the formation of such an inner sphere complex may be energetically more favourable than incorporation into the edge, potentially inhibiting the growth of the obtuse edge on high-Mg calcites.

5. Conclusions

We have performed molecular dynamics simulations of { 10 1 ¯ 4 } calcite surfaces with and without different Mg2+ concentrations and with and without an island on the crystal surface. With these simulations, the impact of Mg2+ was determined on the overall and local solid-water interface structure, energetics, as well as the free energy profiles for the onset of calcite dissolution via Ca2+ removal.
The overall { 10 1 ¯ 4 } surface energy varies according to HMgF < Pure < LMgF < PureI < HMgI. Strong relaxation of the crystal structure was observed in HMgF and HMgI. LMg calcite relaxed its structure to a lesser extent than HMg calcite, showing a crystal structure very similar to pure calcite.
The average free energies for calcium ion extraction from the pure and Mg-doped surfaces followed roughly the opposite trend as the overall surface energy differences. The average energy needed to remove calcium ions increased from HMgI ≤ PureI < Pure < LMgF = HMgF, although very large local differences (from −13 kJ/mol to + 26 kJ/mol) were observed. The large variations and the resulting appearance of lower ΔGextraction, compared to pure calcite, lowers the threshold for unassisted nucleation of new etch pits locally, in particular for HMgF.
The local variation in free energy (minima) depends on the amount and distance to the nearest Mg, in addition to local disruption of interfacial water and the flexibility for carbonate ions to rotate. Local configurations were observed to be less stable when Mg2+ was nearby in the surface, supporting experimental data in which calcite with higher percentages of Mg2+ has a higher solubility compared to pure calcite up until the dolomite ratio (i.e, Ca:Mg = 1). Some of the free energy profiles showed a local energy minimum where the highest interfacial water density was observed (reflecting the hydrophilic nature of calcium).
Based on the interfacial water structure and dynamics, the surface energies and the ΔGextraction, the low-Mg calcite surface is comparable to pure calcite, although locally Mg2+ induces stabilization of neighbouring Ca2+, which results in slightly unfavourable new etch pit nucleation energetics. We can conclude that low concentrations of Mg2+ tend to stabilise Ca2+ and increase etch pit nucleation energies, and thereby decrease the calcite solubility, whereas higher concentrations of Mg2+ lead to deformation of the surface crystal and interfacial water structure, which leads to local variabilities. The result is a thermodynamically less stable crystal and a higher solubility of high-Mg calcite compared to pure calcite, including more facile unassisted etch pit nucleation. Taken together, these results illustrate the molecular scale processes and demonstrate the first steps towards understanding of the non-linear impact of Mg2+ on the solubility of magnesium-bearing calcites.

Supplementary Materials

The following are available online at https://0-www-mdpi-com.brum.beds.ac.uk/article/10.3390/min11040407/s1, Figure S1: An example of the histograms obtained from all umbrellas along the CV, Figure S2: VDOS of interfacial water on top of a pure calcite (blue) and HMgF calcite (orange). For comparison and forcefield specific peak positions, in green the VDOS spectrum of pure bulk water, Figure S3: Zoom of spectrum range related to characteristics of the hydrogen bond network. Interfacial water on top of a pure calcite (blue) and HMgF calcite (orange). Pure bulk water (green), Figure S4: Variation in exchange frequency of water on top of pure calcite. The colours follow the exchange frequencies indicated in the legend, Figure S5: Variation in exchange frequency of water on top of HMgF calcite. The colours follow the exchange frequencies indicated in the legend. The green big balls represent Mg2+ as indicated with the red arrow, Figure S6: Radial distribution function for the cation with the oxygen of carbonate in pure, LMg and HMg calcite crystals, Figure S7: Top view of the 4×8 atoms island on top of Pure 1014 surface carbonate groups in grey (C) and red (O) and Ca2+ in small green or colour and symbol coded larger spheres to link them to the free energy profiles (Figure 6b) in orange (obtuse edge, ▬), turquoise (acute edge, ▼), pink (obtuse corner, ●) and purple (acute corner, ■), Table S1: Potential parameters, Table S2: Average exchange frequencies and diffusion coefficients of water coordinated to Ca2+ in a flat calcite surface, Table S3: Surface energies of after relaxation at 300K with water on top. The Us in equation (1) was calculated as the energy of the configuration without water, Table S4: A summary of computed relaxed surface energies of calcite, Table S5: Coordination distances in the bulk crystal structure, Table S6: Relevant distances between surface calcium and the neighbouring atoms and calcium coordination numbers at the different Ca2+ positions near Mg2+ in the low Mg2+ { 10 1 ¯ 4 } calcite surface, Table S7: Comparison of relevant distances and coordination in the surface of PureI versus HMgI. Between the selected calcium (Figure S7) and the neighbouring atoms.

Author Contributions

Conceptualization, J.A.K., S.E.R.H. and M.W.; methodology, J.A.K. and S.E.R.H.; validation, J.A.K., S.E.R.H. and M.W.; formal analysis, J.A.K. and S.E.R.H.; investigation, J.A.K., S.E.R.H. and M.W.; resources, M.W.; data curation, J.A.K.; writing—original draft preparation, J.A.K.; writing—review and editing, S.E.R.H. and M.W.; visualization, J.A.K.; formal analysis and review N.H.D.L. supervision, M.W.; project administration, M.W.; funding acquisition, M.W. All authors have read and agreed to the published version of the manuscript.

Funding

The research work of J.A.K., S.E.R.H. and M.W. is part of the Industrial Partnership Programme i32 Computational Sciences for Energy Research that is carried out under an agreement between Shell and the Netherlands Organisation for Scientific Research (NWO). This project has received funding from the European Research Council (ERC) under the European Union’s Horizon 2020 research and innovation programme (grant agreement No. [819588]).

Acknowledgments

This work was carried out on the Dutch national e-infrastructure with the support of SURF Cooperative.

Conflicts of Interest

The authors declare no conflict of interest. The funders had no role in the design of the study; in the collection, analyses, or interpretation of data; in the writing of the manuscript, or in the decision to publish the results.

References

  1. Ahr, W.M. Geology of Carbonate Reservoirs: The Identification, Description, and Characterization of Hydrocarbon Reservoirs in Carbonate Rocks; John Wiley & Sons, Inc.: Hoboken, NJ, USA, 2008; ISBN 9780470164914. [Google Scholar]
  2. Molins, S.; Trebotich, D.; Yang, L.; Ajo-Franklin, J.B.; Ligocki, T.J.; Shen, C.; Steefel, C.I. Pore-scale controls on calcite dissolution rates from flow-through laboratory and numerical experiments. Environ. Sci. Technol. 2014, 48, 7453–7460. [Google Scholar] [CrossRef] [PubMed]
  3. Agrawal, P.; Raoof, A.; Iliev, O.; Wolthers, M. Evolution of pore-shape and its impact on pore conductivity during CO2 injection in calcite: Single pore simulations and microfluidic experiments. Adv. Water Resour. 2020, 136, 103480. [Google Scholar] [CrossRef]
  4. Molins, S.; Soulaine, C.; Prasianakis, N.I.; Abbasi, A.; Poncet, P.; Ladd, A.J.C.; Starchenko, V.; Roman, S.; Trebotich, D.; Tchelepi, H.A.; et al. Simulation of mineral dissolution at the pore scale with evolving fluid-solid interfaces: Review of approaches and benchmark problem set. Comput. Geosci. 2020, 1–34. [Google Scholar] [CrossRef] [Green Version]
  5. Cao, B.; Stack, A.G.; Steefel, C.I.; DePaolo, D.J.; Lammers, L.N.; Hu, Y. Investigating calcite growth rates using a quartz crystal microbalance with dissipation (QCM-D). Geochim. Cosmochim. Acta 2018, 222, 269–283. [Google Scholar] [CrossRef] [Green Version]
  6. Hellevang, H.; Miri, R.; Haile, B.G. New insights into the mechanisms controlling the rate of crystal growth. Cryst. Growth Des. 2014, 14, 6451–6458. [Google Scholar] [CrossRef]
  7. Kurganskaya, I.; Luttge, A. Kinetic Monte Carlo Approach to Study Carbonate Dissolution. J. Phys. Chem. C 2016, 120, 6482–6492. [Google Scholar] [CrossRef]
  8. Wolthers, M.; Nehrke, G.; Gustafsson, J.P.; Van Cappellen, P. Calcite growth kinetics: Modeling the effect of solution stoichiometry. Geochim. Cosmochim. Acta 2012, 77, 121–134. [Google Scholar] [CrossRef] [Green Version]
  9. Sand, K.K.; Tobler, D.J.; Dobberschütz, S.; Larsen, K.K.; Makovicky, E.; Andersson, M.P.; Wolthers, M.; Stipp, S.L.S. Calcite Growth Kinetics: Dependence on Saturation Index, Ca2+:CO32− Activity Ratio, and Surface Atomic Structure. Cryst. Growth Des. 2016, 16, 3602–3612. [Google Scholar] [CrossRef]
  10. Larsen, K.; Bechgaard, K.; Stipp, S.L.S. Modelling spiral growth at dislocations and determination of critical step lengths from pyramid geometries on calcite {1014} surfaces. Geochim. Cosmochim. Acta 2010, 74, 558–567. [Google Scholar] [CrossRef]
  11. Bracco, J.N.; Grantham, M.C.; Stack, A.G. Calcite Growth Rates as a Function of Aqueous Calcium-to-Carbonate Ratio, Saturation Index, and Inhibitor Concentration: Insight into the Mechanism of Reaction and Poisoning by Strontium. Cryst. Growth Des. 2012, 12, 3540–3548. [Google Scholar] [CrossRef]
  12. Kirch, A.; Mutisya, S.M.; Sánchez, V.M.; De Almeida, J.M.; Miranda, C.R. Fresh Molecular Look at Calcite-Brine Nanoconfined Interfaces. J. Phys. Chem. C 2018, 122, 6117–6127. [Google Scholar] [CrossRef] [Green Version]
  13. Lardge, J.S.; Duffy, D.M.; Gillan, M.J.; Watkins, M. Ab initio simulations of the interaction between water and defects on the calcite (101 4) surface. J. Phys. Chem. C 2010, 114, 2664–2668. [Google Scholar] [CrossRef]
  14. Fenter, P.; Kerisit, S.; Raiteri, P.; Gale, J.D. Is the Calcite–Water Interface Understood? Direct Comparisons of Molecular Dynamics Simulations with Specular X-ray Reflectivity Data. J. Phys. Chem. C 2013, 117, 5028–5042. [Google Scholar] [CrossRef]
  15. Harstad, A.O.; Stipp, S.L.S. Calcite dissolution: Effects of trace cations naturally present in Iceland spar calcites. Geochim. Cosmochim. Acta 2007, 71, 56–70. [Google Scholar] [CrossRef]
  16. Müller, G.; Tietz, R. Recent dolomitization of quaternary biocalcarenites from fuerteventura (Canary Islands). Contrib. to Mineral. Petrol. 1966, 13, 89–96. [Google Scholar] [CrossRef]
  17. Long, X.; Ma, Y.; Qi, L. Biogenic and synthetic high magnesium calcite—A review. J. Struct. Biol. 2014, 185, 1–14. [Google Scholar] [CrossRef]
  18. Lenders, J.J.M.; Dey, A.; Bomans, P.H.H.; Spielmann, J.; Hendrix, M.M.R.M.; De With, G.; Meldrum, F.C.; Harder, S.; Sommerdijk, N.A.J.M. High-magnesian calcite mesocrystals: A coordination chemistry approach. J. Am. Chem. Soc. 2012, 134, 1367–1373. [Google Scholar] [CrossRef] [PubMed]
  19. Wang, D.; Hamm, L.M.; Giuffre, A.J.; Echigo, T.; Rimstidt, J.D.; De Yoreo, J.J.; Grotzinger, J.; Dove, P.M. Revisiting geochemical controls on patterns of carbonate deposition through the lens of multiple pathways to mineralization. Faraday Discuss. 2012, 159, 371–386. [Google Scholar] [CrossRef] [Green Version]
  20. Stanienda, K.J. Carbonate phases rich in magnesium in the Triassic limestones of the eastern part of the Germanic Basin. Carbonates Evaporites 2016, 31, 387–405. [Google Scholar] [CrossRef] [Green Version]
  21. De Leeuw, N.H.; Parker, S.C. Surface–water interactions in the dolomite problem. Phys. Chem. Chem. Phys. 2001, 3, 3217–3221. [Google Scholar] [CrossRef]
  22. De Leeuw, N.H. Molecular dynamics simulations of the growth inhibiting effect of Fe2+, Mg2+, Cd2+, and Sr2+ on calcite crystal growth. J. Phys. Chem. B 2002, 106, 5241–5249. [Google Scholar] [CrossRef]
  23. Paquette, J.; Reeder, R.J. Relationship between surface structure, growth mechanism, and trace element incorporation in calcite. Geochim. Cosmochim. Acta 1995, 59, 735–749. [Google Scholar] [CrossRef]
  24. Wang, Q. A Computational Study of Calcium Carbonate. Ph.D. Thesis, UCL (University College London), London, UK, 2011. [Google Scholar]
  25. De Leeuw, N.H. Surface structures, stabilities, and growth of magnesian calcites: A computational investigation from the perspective of dolomite formation. Am. Miner. 2002, 87, 679–689. [Google Scholar] [CrossRef]
  26. Brady, P.V.; Krumhansl, J.L.; Papenguth, H.W. Surface complexation clues to dolomite growth. Geochim. Cosmochim. Acta 1996, 60, 727–731. [Google Scholar] [CrossRef]
  27. Busenberg, E.; Plummer, N. The kinetics of dissolution of dolomite in CO2-H2O systems at 1.5 to 65 °C and 0 to 1 atm PCO2. Am. J. Sci. 1982, 282, 45–78. [Google Scholar] [CrossRef]
  28. Pokrovsky, O.S.; Schott, J. Kinetics and mechanism of dolomite dissolution in neutral to alkaline solutions revisited. Am. J. Sci. 2001, 301, 597–626. [Google Scholar] [CrossRef]
  29. Subhas, A.V.; Rollins, N.E.; Berelson, W.M.; Erez, J.; Ziveri, P.; Langer, G.; Adkins, J.F. The dissolution behavior of biogenic calcites in seawater and a possible role for magnesium and organic carbon. Mar. Chem. 2018, 205, 100–112. [Google Scholar] [CrossRef]
  30. Ruiz-Agudo, E.; Putnis, C.V. Direct observations of mineral fluid reactions using atomic force microscopy: The specific example of calcite. Miner. Mag. 2012, 76, 227–253. [Google Scholar] [CrossRef]
  31. Astilleros, J.M.; Fernández-Díaz, L.; Putnis, A. The role of magnesium in the growth of calcite: An AFM study. Chem. Geol. 2010, 271, 52–58. [Google Scholar] [CrossRef] [Green Version]
  32. Zhang, X.; Guo, J.; Wu, S.; Chen, F.; Yang, Y. Divalent heavy metals and uranyl cations incorporated in calcite change its dissolution process. Sci. Rep. 2020, 10, 16864. [Google Scholar] [CrossRef]
  33. Xu, M.; Higgins, S.R. Effects of magnesium ions on near-equilibrium calcite dissolution: Step kinetics and morphology. Geochim. Cosmochim. Acta 2011, 75, 719–733. [Google Scholar] [CrossRef]
  34. Di Tommaso, D.; Ruiz-Agudo, E.; De Leeuw, N.H.; Putnis, A.; Putnis, C.V. Modelling the effects of salt solutions on the hydration of calcium ions. Phys. Chem. Chem. Phys. 2014, 16, 7772–7785. [Google Scholar] [CrossRef] [Green Version]
  35. Wasylenki, L.E.; Dove, P.M.; Wilson, D.S.; De Yoreo, J.J. Nanoscale effects of strontium on calcite growth: An in situ AFM study in the absence of vital effects. Geochim. Cosmochim. Acta 2005, 69, 3017–3027. [Google Scholar] [CrossRef]
  36. Wolthers, M.; Di Tommaso, D.; Du, Z.; De Leeuw, N.H. Variations in calcite growth kinetics with surface topography: Molecular dynamics simulations and process-based growth kinetics modelling. CrystEngComm 2013, 15, 5506. [Google Scholar] [CrossRef] [Green Version]
  37. De La Pierre, M.; Raiteri, P.; Gale, J.D. Structure and Dynamics of Water at Step Edges on the Calcite {1014} Surface. Cryst. Growth Des. 2016, 16, 5907–5914. [Google Scholar] [CrossRef]
  38. De La Pierre, M.; Raiteri, P.; Stack, A.G.; Gale, J.D. Uncovering the Atomistic Mechanism for Calcite Step Growth. Angew. Chem. Int. Ed. 2017, 56, 8464–8467. [Google Scholar] [CrossRef] [Green Version]
  39. Spagnoli, D.; Kerisit, S.; Parker, S.C. Atomistic simulation of the free energies of dissolution of ions from flat and stepped calcite surfaces. J. Cryst. Growth 2006, 294, 103–110. [Google Scholar] [CrossRef]
  40. De Leeuw, N.H.; Parker, S.C.; Harding, J.H. Molecular dynamics simulation of crystal dissolution from calcite steps. Phys. Rev. B 1999, 60, 13792–13799. [Google Scholar] [CrossRef]
  41. Mutisya, S.M.; Kirch, A.; De Almeida, J.M.; Sánchez, V.M.; Miranda, C.R. Molecular Dynamics Simulations of Water Confined in Calcite Slit Pores: An NMR Spin Relaxation and Hydrogen Bond Analysis. J. Phys. Chem. C 2017, 121, 6674–6684. [Google Scholar] [CrossRef]
  42. Spagnoli, D.; Cooke, D.J.; Kerisit, S.; Parker, S.C. Molecular dynamics simulations of the interaction between the surfaces of polar solids and aqueous solutions. J. Mater. Chem. 2006, 16, 1997–2006. [Google Scholar] [CrossRef]
  43. Koleini, M.M.; Mehraban, M.F.; Ayatollahi, S. Effects of low salinity water on calcite/brine interface: A molecular dynamics simulation study. Colloids Surf. A Physicochem. Eng. Asp. 2018, 537, 61–68. [Google Scholar] [CrossRef]
  44. Kerisit, S.; Parker, S.C. Free energy of adsorption of water and metal ions on the { 10 1 ¯ 4 } calcite surface. J. Am. Chem. Soc. 2004, 126, 10152–10161. [Google Scholar] [CrossRef]
  45. Liang, Y.; Lea, A.S.; Baer, D.R.; Engelhard, M.H. Structure of the cleaved CaCo3 { 10 1 ¯ 4 } surface in an aqueous environment. Surf. Sci. 1996, 351, 172–182. [Google Scholar] [CrossRef]
  46. Kerisit, S.; Parker, S.C.; Harding, J.H. Atomistic simulation of the dissociative adsorption of water on calcite surfaces. J. Phys. Chem. B 2003, 107, 7676–7682. [Google Scholar] [CrossRef]
  47. Andersson, M.P.; Dobberschütz, S.; Sand, K.K.; Tobler, D.J.; De Yoreo, J.J.; Stipp, S.L.S. A Microkinetic Model of Calcite Step Growth. Angew. Chemie Int. Ed. 2016, 55, 11086–11090. [Google Scholar] [CrossRef]
  48. Xu, J.; Yan, C.; Zhang, F.; Konishi, H.; Xu, H.; Teng, H.H. Testing the cation-hydration effect on the crystallization of Ca-Mg-CO3 systems. Proc. Natl. Acad. Sci. USA 2013, 110, 17750–17755. [Google Scholar] [CrossRef] [Green Version]
  49. Davis, K.J.; Dove, P.M.; De Yoreo, J.J. The role of Mg2+ as an impurity in calcite growth. Science 2000, 290, 1134–1137. [Google Scholar] [CrossRef]
  50. Nielsen, L.C.; De Yoreo, J.J.; DePaolo, D.J. General model for calcite growth kinetics in the presence of impurity ions. Geochim. Cosmochim. Acta 2013, 115, 100–114. [Google Scholar] [CrossRef] [Green Version]
  51. Plimpton, S. Fast parallel algorithms for short-range molecular dynamics. J. Comput. Phys. 1995, 117, 1–19. [Google Scholar] [CrossRef] [Green Version]
  52. Nosé, S. A unified formulation of the constant temperature molecular dynamics methods. J. Chem. Phys. 1984, 81, 511–519. [Google Scholar] [CrossRef] [Green Version]
  53. Hoover, W.G. Canonical dynamics: Equilibrium phase-space distributions. Phys. Rev. A 1985, 31, 1695–1697. [Google Scholar] [CrossRef] [Green Version]
  54. Koskamp, J.A.; Ruiz-Hernandez, S.E.; Di Tommaso, D.; Elena, A.M.; De Leeuw, N.H.; Wolthers, M. Reconsidering Calcium Dehydration as the Rate-Determining Step in Calcium Mineral Growth. J. Phys. Chem. C 2019, 123, 26895–26903. [Google Scholar] [CrossRef] [PubMed] [Green Version]
  55. de Leeuw, N.H.; Parker, S.C. Molecular-dynamics simulation of MgO surfaces in liquid water using a shell-model potential for water. Phys. Rev. B Condens. Matter Mater. Phys. 1998, 58, 13901–13908. [Google Scholar] [CrossRef]
  56. Reischl, B.; Raiteri, P.; Gale, J.D.; Rohl, A.L. Atomistic Simulation of Atomic Force Microscopy Imaging of Hydration Layers on Calcite, Dolomite, and Magnesite Surfaces. J. Phys. Chem. C 2019, 123, 14985–14992. [Google Scholar] [CrossRef] [Green Version]
  57. Reischl, B.; Watkins, M.; Foster, A.S. Free energy approaches for modeling atomic force microscopy in liquids. J. Chem. Theory Comput. 2013, 9, 600–608. [Google Scholar] [CrossRef] [PubMed] [Green Version]
  58. Raiteri, P.; Demichelis, R.; Gale, J.D. Thermodynamically Consistent Force Field for Molecular Dynamics Simulations of Alkaline-Earth Carbonates and Their Aqueous Speciation. J. Phys. Chem. C 2015, 119, 24447–24458. [Google Scholar] [CrossRef] [Green Version]
  59. Wu, Y.; Tepper, H.L.; Voth, G.A. Flexible simple point-charge water model with improved liquid-state properties. J. Chem. Phys. 2006, 124, 024503. [Google Scholar] [CrossRef] [PubMed]
  60. Tribello, G.A.; Bonomi, M.; Branduardi, D.; Camilloni, C.; Bussi, G. PLUMED 2: New feathers for an old bird. Comput. Phys. Commun. 2014, 185, 604–613. [Google Scholar] [CrossRef] [Green Version]
  61. Grossfield, A. “WHAM: The weighted histogram analysis method” version 2.0.9. Available online: http://membrane.urmc.rochester.edu/wordpress/?page_id=126 (accessed on 10 April 2021).
  62. Smith, W. Mean Square Displacement. 1996. Available online: https://www.scd.stfc.ac.uk/Pages/DL_POLY.aspx (accessed on 10 April 2021).
  63. Allen, M.P.; Tildesley, D.J. Computer Simulation of Liquids; Oxford University Press Inc.: New York, NY, USA, 1987; ISBN 0198556454. [Google Scholar]
  64. Chandra, A. Effects of Ion Atmosphere on Hydrogen-Bond Dynamics in Aqueous Electrolyte Solutions. Phys. Rev. Lett. 2000, 85, 768–771. [Google Scholar] [CrossRef] [PubMed]
  65. Bruno, M.; Massaro, F.R.; Pastero, L.; Costa, E.; Rubbo, M.; Prencipe, M.; Aquilano, D. New estimates of the free energy of calcite/water interfaces for evaluating the equilibrium shape and nucleation mechanisms. Cryst. Growth Des. 2013, 13, 1170–1179. [Google Scholar] [CrossRef]
  66. Sekkal, W.; Zaoui, A. Nanoscale analysis of the morphology and surface stability of calcium carbonate polymorphs. Sci. Rep. 2013, 3, 1–10. [Google Scholar] [CrossRef] [PubMed] [Green Version]
  67. Røyne, A.; Bisschop, J.; Dysthe, D.K. Experimental investigation of surface energy and subcritical crack growth in calcite. J. Geophys. Res. 2011, 116, B04204. [Google Scholar] [CrossRef] [Green Version]
  68. Bracco, J.N.; Stack, A.G.; Steefel, C.I. Upscaling calcite growth rates from the mesoscale to the macroscale. Environ. Sci. Technol. 2013, 47, 7555–7562. [Google Scholar] [CrossRef] [PubMed]
  69. Kurganskaya, I.; Rohlfs, R.D. Atomistic to meso-scale modeling of mineral dissolution: Methods, challenges and prospects. Am. J. Sci. 2020, 320, 1–26. [Google Scholar] [CrossRef]
  70. Hancer, M.; Celik, M.S.; Miller, J.D. The significance of interfacial water structure in soluble salt flotation systems. J. Colloid Interface Sci. 2001, 235, 150–161. [Google Scholar] [CrossRef]
  71. Dewan, S.; Yeganeh, M.S.; Borguet, E. Experimental correlation between interfacial water structure and mineral reactivity. J. Phys. Chem. Lett. 2013, 4, 1977–1982. [Google Scholar] [CrossRef]
  72. Di Tommaso, D.; Prakash, M.; Lemaire, T.; Lewerenz, M.; de Leeuw, N.H.; Naili, S. Molecular Dynamics Simulations of Hydroxyapatite Nanopores in Contact with Electrolyte Solutions: The Effect of Nanoconfinement and Solvated Ions on the Surface Reactivity and the Structural, Dynamical, and Vibrational Properties of Water. Crystals 2017, 7, 57. [Google Scholar] [CrossRef] [Green Version]
  73. McCarthy, M.I.; Schenter, G.K.; Scamehorn, C.A.; Nicholas, J.B. Structure and Dynamics of the Water/MgO Interface. J. Phys. Chem. 1996, 100, 16989–16995. [Google Scholar] [CrossRef]
  74. Du, Z.; De Leeuw, N.H. Molecular dynamics simulations of hydration, dissolution and nucleation processes at the α-quartz (0001) surface in liquid water. J. Chem. Soc. Dalt. Trans. 2006, 2623–2634. [Google Scholar] [CrossRef]
  75. Cheng, L.; Fenter, P.; Nagy, K.L.; Schlegel, M.L.; Sturchio, N.C. Molecular-Scale Density Oscillations in Water Adjacent to a Mica Surface. Phys. Rev. Lett. 2001, 87, 156103. [Google Scholar] [CrossRef]
  76. Forbes, R.T.; York, P.; Fawcett, V.; Shields, L. Physicochemical Properties of Salts of p-Aminosalicylic Acid. I. Correlation of Crystal Structure and Hydrate Stability. Pharm. Res. 1992, 9, 1428–1435. [Google Scholar] [CrossRef]
  77. Gao, Z.Y.; Sun, W.; Hu, Y.H.; Liu, X.W. Anisotropic surface broken bond properties and wettability of calcite and fluorite crystals. Trans. Nonferrous Met. Soc. China Engl. Ed. 2012, 22, 1203–1208. [Google Scholar] [CrossRef]
  78. Bruno, M.; Bittarello, E.; Massaro, F.R.; Aquilano, D. The effect of impurities on the structure and energy of a crystal surface: Mg impurities in calcite as a case study. CrystEngComm 2018, 20, 4556–4564. [Google Scholar] [CrossRef]
  79. Lardge, J.S.; Duffy, D.M.; Gillan, M.J. Investigation of the interaction of water with the calcite (10.4) surface using ab initio simulation. J. Phys. Chem. C 2009, 113, 7207–7212. [Google Scholar] [CrossRef] [Green Version]
  80. Parker, S.C.; Kerisit, S.; Marmier, A.; Grigoleit, S.; Watson, G.W. Modelling Inorganic Solids and Their Interfaces: A Combined Approach of Atomistic and Electronic Structure Simulation Techniques. Faraday Discuss. 2003, 124, 155–170. [Google Scholar] [CrossRef]
  81. Ferreira, S.O. Advanced Topics on Crystal Growth; InTech: Rijeka, Croatia, 2013. [Google Scholar]
  82. Elstnerová, P.; Friák, M.; Fabritius, H.O.; Lymperakis, L.; Hickel, T.; Petrov, M.; Nikolov, S.; Raabe, D.; Ziegler, A.; Hild, S.; et al. Ab initio study of thermodynamic, structural, and elastic properties of Mg-substituted crystalline calcite. Acta Biomater. 2010, 6, 4506–4512. [Google Scholar] [CrossRef]
  83. Morse, J.W.; Mackenzie, F.T. Geochemistry of Sedimentary Carbonates; Elsevier Science Publisher: New York, NY, USA, 1990; Volume 48, ISBN 978-0-444-88781-8. [Google Scholar]
  84. Langmuir, D. Aqueous Environmental Geochemistry; Prentice Hall: Upper Saddle River, NJ, USA, 1997; ISBN 0023674121. [Google Scholar]
  85. Robie, R.; Hemingway, B. Thermodynamic Properties of Minerals and Related Substances at 298.15 K and 1 bar (105 Pascals) Pressure and at Higher Temperatures; Government Printing Office: Washington, DC, USA, 1995. [Google Scholar]
  86. Busenberg, E.; Niel Plummer, L. Thermodynamics of magnesian calcite solid-solutions at 25 °C and 1 atm total pressure. Geochim. Cosmochim. Acta 1989, 53, 1189–1208. [Google Scholar] [CrossRef]
  87. Bischoff, W.D.; Mackenzie, F.T.; Bishop, F.C. Stabilities of synthetic magnesian calcites in aqueous solution: Comparison with biogenic materials. Geochim. Cosmochim. Acta 1987, 51, 1413–1423. [Google Scholar] [CrossRef]
  88. Lasaga, A.C.; Lüttge, A. A model for crystal dissolution. Eur. J. Miner. 2003, 15, 603–615. [Google Scholar] [CrossRef]
  89. Bibi, I.; Arvidson, R.; Fischer, C.; Lüttge, A. Temporal Evolution of Calcite Surface Dissolution Kinetics. Minerals 2018, 8, 256. [Google Scholar] [CrossRef] [Green Version]
  90. Teng, H.H.; Dove, P.M.; De Yoreo, J.J. Kinetics of calcite growth: Surface processes and relationships to macroscopic rate laws. Geochim. Cosmochim. Acta 2000, 64, 2255–2266. [Google Scholar] [CrossRef]
  91. Wolthers, M. How minerals dissolve. Science 2015, 349, 1288. [Google Scholar] [CrossRef] [PubMed]
  92. Fenter, P.; Sturchio, N.C. Calcite (104)-water interface structure, revisited. Geochim. Cosmochim. Acta 2012, 97, 58–69. [Google Scholar] [CrossRef]
  93. Heberling, F.; Trainor, T.P.; Lützenkirchen, J.; Eng, P.; Denecke, M.A.; Bosbach, D. Structure and reactivity of the calcite–water interface. J. Colloid Interface Sci. 2011, 354, 843–857. [Google Scholar] [CrossRef]
  94. Zhu, L.F.; Friák, M.; Lymperakis, L.; Titrian, H.; Aydin, U.; Janus, A.M.; Fabritius, H.O.; Ziegler, A.; Nikolov, S.; Hemzalová, P.; et al. Ab initio study of single-crystalline and polycrystalline elastic properties of Mg-substituted calcite crystals. J. Mech. Behav. Biomed. Mater. 2013, 20, 296–304. [Google Scholar] [CrossRef]
  95. Ruiz-Agudo, E.; Putnis, C.V.; Jiménez-López, C.; Rodriguez-Navarro, C. An atomic force microscopy study of calcite dissolution in saline solutions: The role of magnesium ions. Geochim. Cosmochim. Acta 2009, 73, 3201–3217. [Google Scholar] [CrossRef]
  96. Arvidson, R.S.; Collier, M.; Davis, K.J.; Vinson, M.D.; Amonette, J.E.; Luttge, A. Magnesium inhibition of calcite dissolution kinetics. Geochim. Cosmochim. Acta 2006, 70, 583–594. [Google Scholar] [CrossRef]
  97. Arvidson, R.S.; Davis, K.J.; Collier, M.; Amonette, J.E.; Lüttge, A. Etch Pit Morphology and Magnesium Inhibition of Calcite Dissolution. In Proceedings of the 11th Symposium on Water-Rock Interactions WRI-11, Saratoga Springs, New York; Wanty, R.B., Seal, R.R., Eds.; Balkema: New York, NY, USA, 2004; pp. 721–725. [Google Scholar]
Figure 1. Snapshot of simulation cells after equilibration. (a) full simulation box with the calcite { 10 1 ¯ 4 } slab in the bottom, carbonate groups in grey (C) and red (O) and Ca2+ in green. The 6.5 nm water column with red (O) and white (H). (b) the calcite slab with a 16 cation-anion units island; water molecules were left out for visibility.
Minerals 11 00407 g001
Figure 2. Overall water z-density profile of pure (dashed green, overlaps with dotted red line), low Mg2+ flat surface (LMgF; dotted red) and high Mg2+ flat surface (HMgF; yellow) with respect to the flat crystal surface (= 0.0 nm). The lines with the marker (■) is the integral of the water density.
Minerals 11 00407 g002
Figure 3. (a) Radial distribution function for the cation with the carbon of carbonate in pure, low Mg2+ concentration (LMg) and high Mg2+ concentration (HMg) calcite crystals. (b) Side view snapshots of the calcite crystal showing the deformation along the c-axis in the HMg (left) compared to pure calcite (right—for average distances see Table S5 and Figure 3a); calcium ions are in green, magnesium ions in purple, carbonate oxygen and carbon in red and grey, respectively.
Minerals 11 00407 g003
Figure 4. (a) Top view of the LMgF { 10 1 ¯ 4 } surface with Mg2+ in yellow, carbonate groups in grey (C) and red (O) and Ca2+ in small green or colour-coded (cf. Table 3) larger spheres to link them to the free energy profiles in turquoise (), pink (), orange (no marker) and purple (). (b) Overlay of free energy profile (continuous line, left y-axis) of Ca2+ extracted from its equilibrium position in the crystal (0.0 nm) with the water z-density (dashed line, right y-axis) along the same axis. The colours are referring to the corresponding Ca2+ equilibrium position in the left image and Ca2+ in pure calcite in green (+)
Minerals 11 00407 g004
Figure 5. (a) Top view of HMgF { 10 1 ¯ 4 } surface with Mg2+ in yellow, carbonate groups in grey (C) and red (O) and Ca2+ in small green or colour-coded (cf. Table 3) larger spheres to link them to the free energy profiles in purple (), turquoise () and pink (). (b) Overlay of free energy profiles (continuous line, left y-axis) of calcium ions extracted from their equilibrium position in the crystal (0.0 nm) with the water z-density (dashed line, right y-axis) along the same axis. The colours are referring to the corresponding Ca2+ equilibrium position in the left image and Ca2+ in pure calcite in green (+).
Minerals 11 00407 g005
Figure 6. (a) Top view of the 4×8 atoms island on top of HMg { 10 1 ¯ 4 } surface with Mg2+ in yellow, carbonate groups in grey (C) and red (O) and Ca2+ in small green or colour and symbol coded larger spheres to link them to the free energy profiles in orange (obtuse edge, ), turquoise (acute edge, ), pink (obtuse corner, ) and purple (acute corner, ). (b) Overlay of free energy profile with the water density along the same axis. The dashed line represents the results for the equivalent calcium site in the pure system, i.e., the Ca2+ are in a similar position as in (a), but no Mg2+ is present in the surface.
Minerals 11 00407 g006aMinerals 11 00407 g006b
Figure 7. Radial distribution function (RDF) of the different calcium ions with Oc. (a) The acute and obtuse calcium corners and (b) the acute (with tripod marker) and obtuse calcium edges of the pure (dashed line) and HMg (continuous line) with the corresponding colours as presented in Figure 6.
Minerals 11 00407 g007
Figure 8. Free energy profiles of Ca2+ extraction from PureI (dashed lines), HMgI (continuous line) and HMgI in which the island-carbonate molecules are frozen (continuous blue line).
Minerals 11 00407 g008
Table 1. Interfacial water dipole angle and H-bond properties.
PropertyCa2+ in Pure
Calcite
Ca2+ in HMgF
Calcite
Mg2+ in HMgF
Calcite
CO32− in Pure CalciteCO32− in HMgF Calcite
Water dipole angle with surface (°)76.1375.89
Average number of hydrogen bonds between water molecules0.6330.6280.4850.9420.910
0 H-bond (%)49.949.957.740.842.3
1 H-bond (%)37.838.036.334.033.9
2 H-bond (%)11.511.35.816.915.9
3 H-bond (%)0.80.70.27.16.7
H-bond Lifetime3.13.32.53.53.9
Average number of H-bond between cation—Ow–Hw–Oc1.011.021.37
Water forming >1 H-bond with Oc (%)15.815.340.8
Distance HW–Oc1.8531.8551.860
Table 2. Overview of the surface energies of the simulated systems.
{ 10 1 ¯ 4 }   System AcronymSurface Energies (J/m2)
DryWet
Pure calcite Pure0.630.30
Low Mg2+ flat surfaceLMgF0.640.31
High Mg2+ flat surfaceHMgF0.620.20
Island pure calcite PureI0.660.35
Island high Mg2+HMgI0.680.29
Table 3. Selected calcium sites for forced molecular dynamics (MD) extraction, including the allocated colour code used in Figure 4, Figure 5 and Figure 6, label and free energy of full extraction. The second free energies reported for the HMgI system are for simulations in which the island CO32− molecules were frozen.
Calcium SiteColour CodeLabelΔGextraction(kJ/mol)
Ca2+ in pure calciteGreen ( Minerals 11 00407 i001)CaP204
Low Mg2+ flat surface (LMgF;Figure 4)
Ca2+with 1 Mg2+ in first cation shell *Turquoise ( Minerals 11 00407 i002)CaLMgF1218
Pink ( Minerals 11 00407 i003)CaLMgF2223
Orange ( Minerals 11 00407 i004)CaLMgF3222
Ca2+with 1 Mg2+ in second cation shellPurple ( Minerals 11 00407 i005)CaLMgF4197
High Mg2+ flat surface (HMgF;Figure 5)
Ca2+with 3 Mg2+ in first cation shell and 2 Mg2+ in second Purple ( Minerals 11 00407 i005)CaHMgF3-5209
Ca2+with 1 Mg2+ in first cation shell and 1 Mg2+ in secondPink ( Minerals 11 00407 i003)CaHMgF1-2230
Ca2+with 0 Mg2+ in first cation shell and 0 Mg2+ in secondTurquoise ( Minerals 11 00407 i002)CaHMgF0-0191
Island-surface, pure calcite (PureI, Figure S7)
Ca2+ in an Acute Corner Purple ( Minerals 11 00407 i005)CaPAC43
Ca2+ in an Obtuse Corner Pink ( Minerals 11 00407 i003)CaPOC39
Ca2+ in an Acute Edge Turquoise ( Minerals 11 00407 i002)CaPAE56
Ca2+ in an Obtuse Edge Orange ( Minerals 11 00407 i004)CaPOE76
Island-surface, high Mg2+ calcite (HMgI; Figure 6)
Ca2+ in an Acute Corner Purple ( Minerals 11 00407 i005)CaHMgIAC37; 97
Ca2+ in an Obtuse Corner Pink ( Minerals 11 00407 i003)CaHMgIOC24; 90
Ca2+ in an Acute Edge Turquoise ( Minerals 11 00407 i002)CaIHMgIAE72; 206
Ca2+ in an Obtuse Edge Orange ( Minerals 11 00407 i004)CaHMgIOE60; 175
The bold text indicates the different systems investigated * first cation shell is defined here as the first “cation” shell and therefore ignoring carbonate ion groups that are located more closely to the central metal ion.
Publisher’s Note: MDPI stays neutral with regard to jurisdictional claims in published maps and institutional affiliations.

