Article

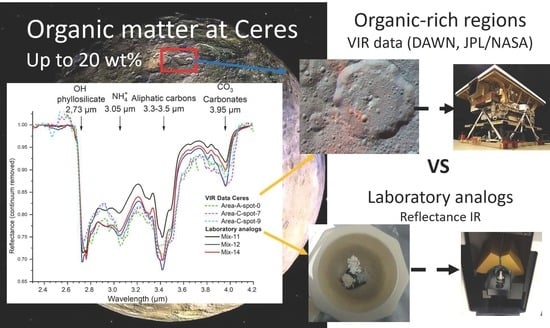
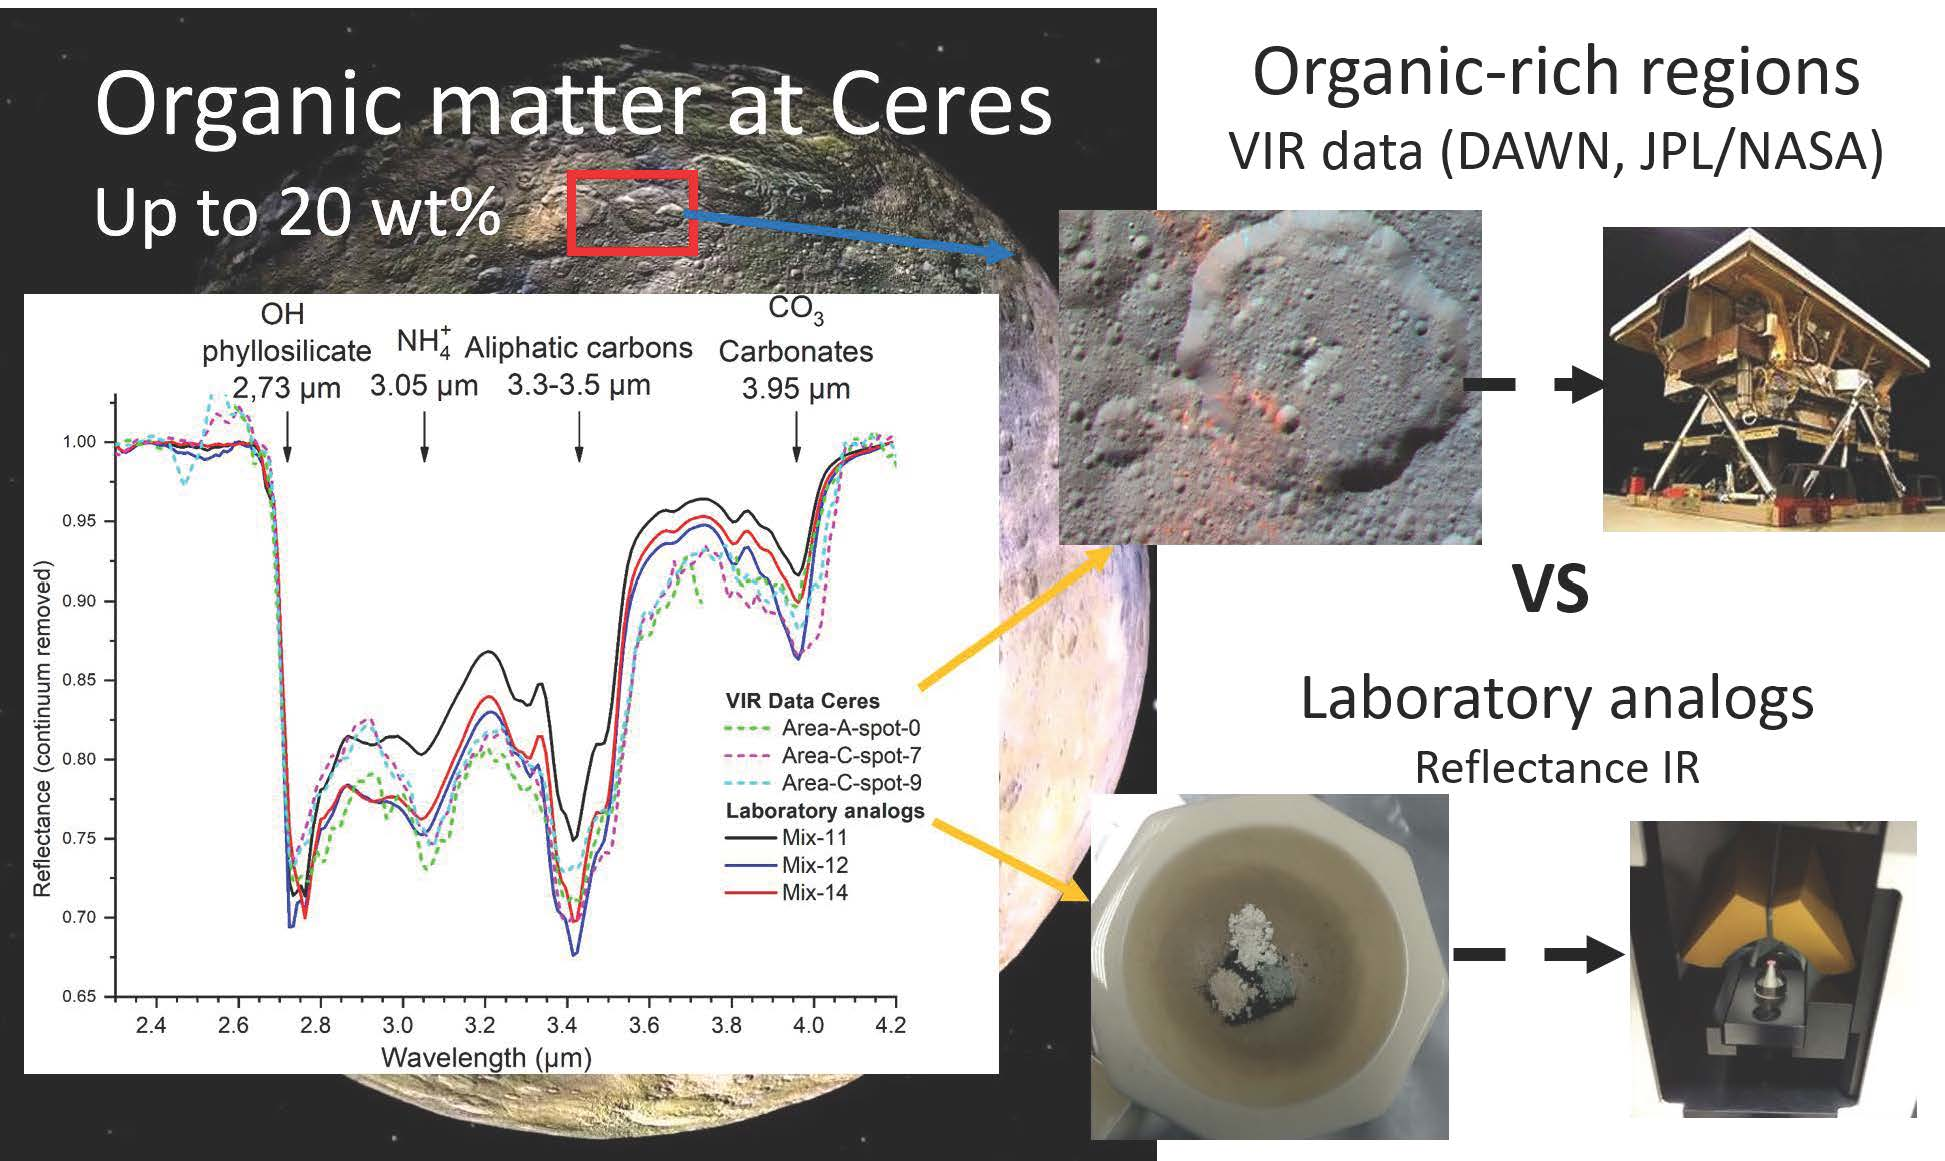
Laboratory Investigations Coupled to VIR/Dawn Observations to Quantify the Large Concentrations of Organic Matter on Ceres

by
Vassilissa Vinogradoff
1,2,*,
Giovanni Poggiali
3,
Andrea Raponi
2,
Mauro Ciarniello
2,
Simone De Angelis
2,
Marco Ferrari
2,
Julie C Castillo-Rogez
4,
John Brucato
3 and
Maria-Cristina De Sanctis
2
1
CNRS, Physique Des Interactions Ioniques et Moléculaires, UMR CNRS 7345 and Laboratoire d’Astrophysique de Marseille, UMR CNRS 7326, Aix-Marseille Université, 13013 Marseille, France
2
Istituto di Astrofisica e Planetologia Spaziali- IAPS-INAF, 00133 Roma, Italy
3
INAF—Astrophysical Observatory of Arcetri, 50125 Firenze, Italy
4
Jet Propulsion Laboratory, California Institute of Technology, Pasadena, CA 91125, USA
*
Author to whom correspondence should be addressed.
Submission received: 2 June 2021 / Revised: 25 June 2021 / Accepted: 29 June 2021 / Published: 3 July 2021

Abstract

:
Organic matter directly observed at the surface of an inner planetary body is quite infrequent due to the usual low abundance of such matter and the limitation of the infrared technique. Fortuitously, the Dawn mission has revealed, thanks to the Visible and InfraRed mapping spectrometer (VIR), large areas rich in organic matter at the surface of Ceres, near Ernutet crater. The origin of the organic matter and its abundance in association with minerals, as indicated by the low altitude VIR data, remains unclear, but multiple lines of evidence support an endogenous origin. Here, we report an experimental investigation to determine the abundance of the aliphatic carbon signature observed on Ceres. We produced relevant analogues containing ammoniated-phyllosilicates, carbonates, aliphatic carbons (coals), and magnetite or amorphous carbon as darkening agents, and measured their reflectance by infrared spectroscopy. Measurements of these organic-rich analogues were directly compared to the VIR spectra taken from different locations around Ernutet crater. We found that the absolute reflectance of our analogues is at least two orders of magnitude higher than Ceres, but the depths of absorption bands match nicely the ones of the organic-rich Ceres spectra. The choices of the different components are discussed in comparison with VIR data. Relative abundances of the components are extrapolated from the spectra and mixture composition, considering that the differences in reflectance level is mainly due to optical effects. Absorption bands of Ceres’ organic-rich spectra are best reproduced by around 20 wt.% of carbon (a third being aliphatic carbons), in association with around 20 wt.% of carbonates, 15 wt.% of ammoniated-phyllosilicate, 20 wt.% of Mg-phyllosilicates, and 25 wt.% of darkening agent. Results also highlight the pertinence to use laboratory analogues in addition to models for planetary surface characterization. Such large quantities of organic materials near Ernutet crater, in addition to the amorphous carbon suspected on a global scale, requires a concentration mechanism whose nature is still unknown but that could potentially be relevant to other large volatile-rich bodies.

Graphical Abstract

1. Introduction

Ceres is the only dwarf planet of the asteroid belt. Before the arrival of the DAWN mission, ground-based observations had already indicated spectral properties and composition close to CI chondrites, with most likely ammoniated Mg-bearing clays [1,2]. Thanks to the suite of instruments onboard the Dawn spacecraft, Ceres’ mineralogy and composition has been extensively characterized with high resolution. The visible and infrared mapping spectrometer (VIR) [3] obtained unprecedented reflectance spectra of the surface, which confirm the presence of serpentine, carbonates, and ammoniated-clays [4,5,6,7]. Additionally, observation of abundant salts in the Occator crater likely imply the existence of brines at depth [8,9]. Ceres’ composition and geological settings indicate the occurrence of an early ocean [10,11,12,13] and recent subsurface hydrothermal activity, which lead to the formation of concentration of salts and carbonates [5,8]. The latter were concentrated on the surface via brine effusion and other forms of cryovolcanism.
One of the most surprising results by Dawn, undetectable from ground-based observations, was the finding of organic matter (OM) absorption features around 3.4 µm near Ernutet crater (Figure 1). That signature is spread over more than 1000 km² around Ernutet crater, encompassing Hakumyi, Inamahari, and Omonga craters [14]. The 3.4 µm absorption corresponds to CH vibrations (CH2, CH3) from aliphatic carbon material, indicating the existence of aliphatic functions. The signature is quite similar to organic matter in carbonaceous chondrites, and especially to insoluble organic matter, which suggests similar composition and macromolecular structure [14,15]. The occurrence of organic material is also highly suspected at Cerealia Facula (Occator crater), where materials have been freshly exposed to the surface by ascending brines [8,16]. The presence of carbon materials in the salty brines of Occator is supported by the reddening of the spectral slope in the visible range, similar to the one observed near the Ernutet crater [16], and by the large and deep band in the 3.4 µm region [8].
In addition, results obtained from the Gamma Ray Neutron Detector (GRaND) that probed Ceres’ regolith to 0.5–1 m depth have shown the occurrence of amorphous carbon everywhere with average abundances between 8 and 14 wt.% [17]. This is larger than the bulk quantity of carbon in carbonaceous chondrites meteorites (CI up to 4–5 wt.% [18]). Compared to CI or CM chondrites, Ceres’ regolith is also richer in hydrogen (1.9 wt.% vs. 1.56 wt.% for CI), but poorer in an iron-bearing component (16 wt.% versus ~21 wt.% for CM), probably due to partial fractionation of iron during internal differentiation in Ceres [17]. Until now, no meteorite matching Ceres’ surface composition has been found on Earth [19], and Ceres has clearly accreted more water and organic matter than any carbonaceous chondrites (CC). Ceres’ origin is still unsolved, although some hypotheses agreed that Ceres formed in the outer Solar System and migrated inward [7,10,11]. Ceres could have been an ocean-world (global ocean) in the past [10,12]. However, one cannot rule out that the high carbon fraction in the regolith could be the result of a concentration mechanism yet to be determined.
The presence of amorphous carbon across the Ceres surface and hydrocarbon on specific locations with clear signatures of aliphatic groups, have raised questions about the origin, composition, and abundance of organic matter on Ceres [15,20,21,22]. Here, we report spectral measurements obtained on laboratory analogues rich in aliphatic carbons for comparison with the signatures obtained at Ceres. We attempt to spectrally reproduce the VIR spectra using natural matter with controlled compositions.
VIR and spectral modelling showed the presence of at least four components on the Ceres surface [7] (Figure 1). Each component corresponds to one major band in the spectrum, Mg-phyllosilicate at 2.73 µm, ammonium-bearing phyllosilicate at 3.05 µm, carbonate at 3.95 µm, and darkening materials as proposed by many authors to fit Ceres’ low albedo (visual I/F at standard observation geometry~0.03; [23]). However, there are local variations in the surface mineralogy and one is clearly visible in Ernutet crater, where a fifth component is needed to fit an additional band at 3.4 µm (Figure 1). This component is ascribed to an organic material containing aliphatic carbon [14]. To reproduce this band, we use terrestrial coals, which are known to be rich in organic material containing aliphatic and aromatic carbons, as well as a few percent of oxygen-(carboxyls) and/or nitrogen-(amines) functions. This diverse composition influences the global molecular structure of the organic material and its spectrum. In addition, a coal’s composition matches the potential nature of the organic matter around Ernutet [15]. Several mixtures containing the end-members found on Ceres’ surface were produced, intimately mixed, and measured by reflectance spectroscopy in the spectral range 1.25–25 µm. These analogues were then compared with VIR data to converge on a composition that reproduces Ceres’ organic-rich spectra. This approach allowed inferring the relative abundance of each component. Below, we report these results and discuss modeling results and implications for Ceres’ composition.

2. Methods and Analyses

2.1. VIR/Dawn Spectra and Region of Interest

We used VIR data taken in Dawn’s Low-Altitude Mapping Orbit (LAMO) orbital phases at a spatial resolution of less than 100 m/pix [15], corrected with the new calibrations [16]. Different regions of interest have been previously identified showing strong absorption features at 3.3–3.5 µm. Most of the areas selected are around the Ernutet crater and one is around the Hakumyi crater (Figure 2). We selected spectra showing different band intensity in the 3.4 µm as references for our analogues, namely spot area A-spot-0, area B-spot-4, area B-spot-5, area C-spot-7, area C-spot-8, and area C-spot-9 defined in De Sanctis et al. [15] and recalculated with the new calibration [16] and photometric reduction (see Supplementary Text and Figure S1). Full description of the precise location and characteristics of each area can be found in previous papers [14,15], and in the Supplementary Materials (Table S1). Each spectrum, in addition to having different absorption band depth for the aliphatic CH, also show variation in their mineralogical composition, especially in carbonate and phyllosilicate abundances.

2.2. Reflectance Spectroscopy

Analyses were performed with a Praying Mantis diffuse reflectance accessory (from Harrick scientific products inc. New York, NY, USA) interfaced with a FTIR Bruker Vertex 70v spectrometer (Bruker Corporation Massachusetts, MA, USA). The spectra were acquired in the 1.25–25 µm spectral range, with incidence angle = 45°, emission angle = 45°, phase angle 90°, and spectral resolution at 4 cm−1. Infragold support was used for reference. The background spectrum was acquired with 300 scans and the samples with 200 scans in order to obtain a good signal to noise ratio. The spectrometer optics were under vacuum and the Praying Mantis accessory was flushed with pure nitrogen during all the measurements. To compare laboratory data to Ceres IR spectra [15], the spectral resolution of the laboratory spectra was degraded to match the VIR measurements (ΔλIR = 9.8 nm/band).

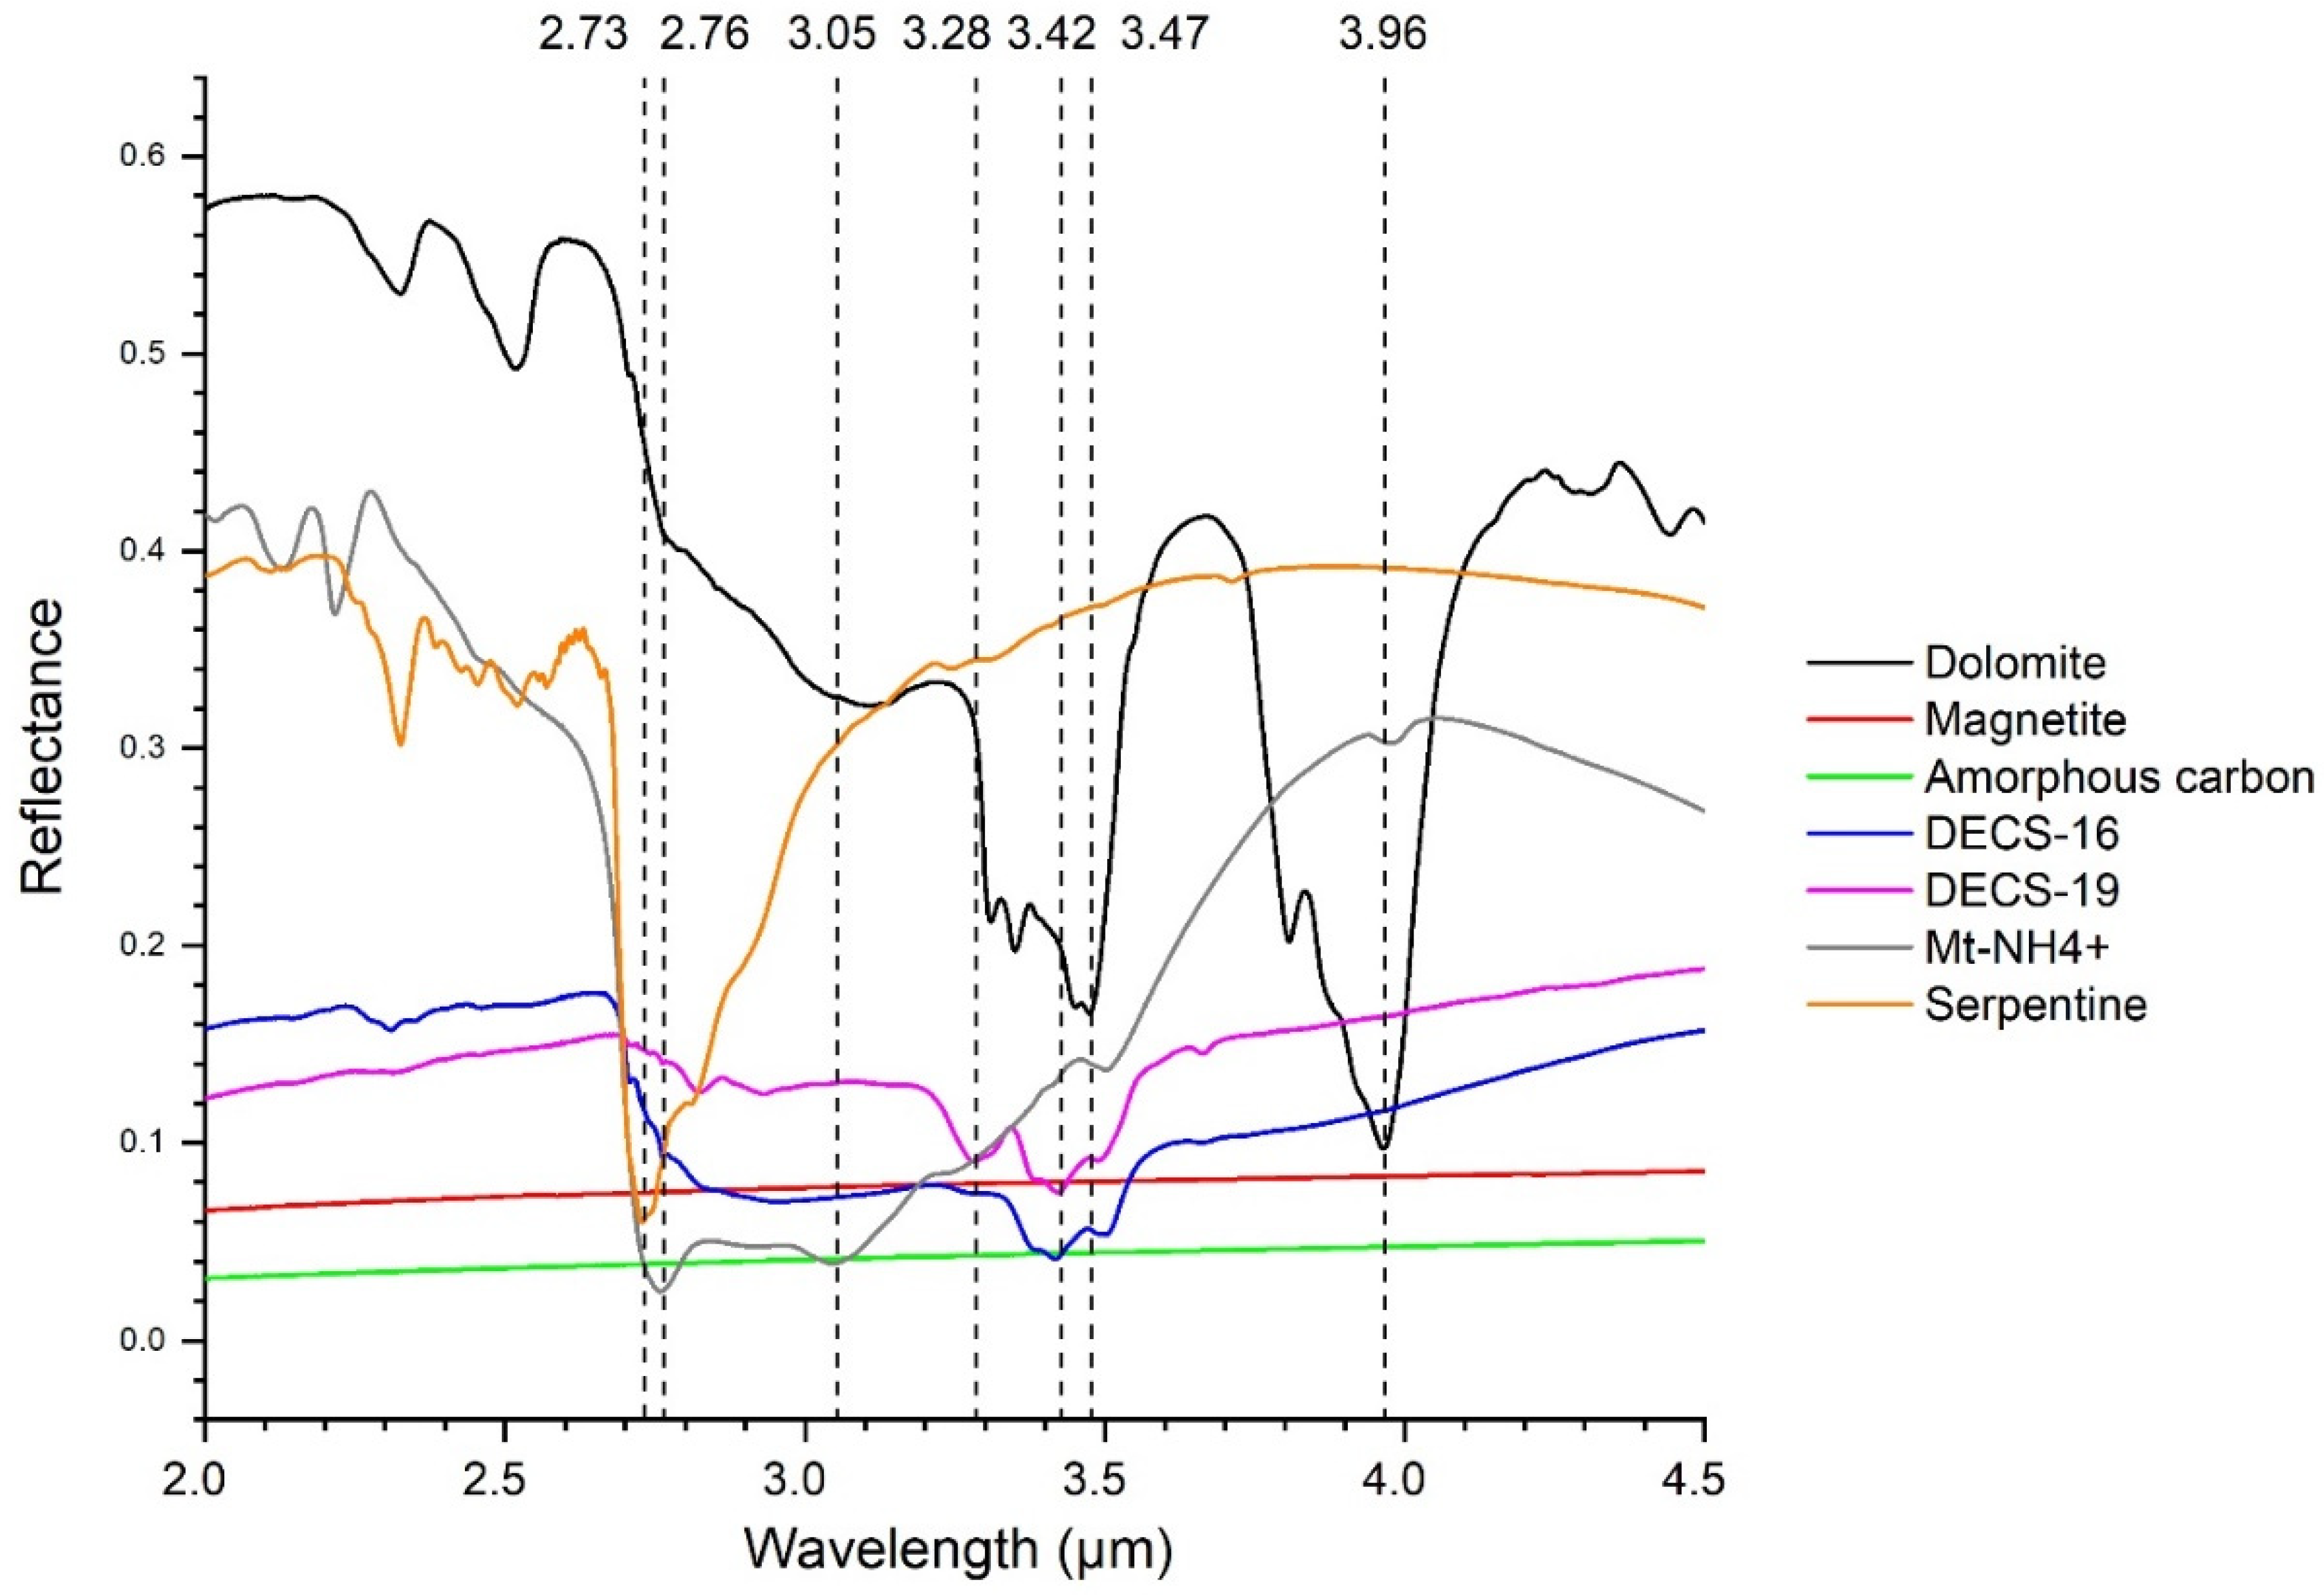
2.3. Endmembers for Ceres Analogues

We used 7 natural end-members as analog material of Ceres’ surface, in agreement with previous spectral characterizations [5,7]. Their parameters are listed in Table 1 and described hereafter.

2.3.1. Mg-Phyllosilicate

As Mg-phyllosilicate, we chose a serpentine with a main composition of antigorite from Poland, showing a major band center centered at 2.73 µm (Figure 3). The sample was sieved to <50 µm and presents a very low water content (no broad band around 3 µm). A few other minor bands (likely overtones) are also noticed near 2.3–2.5 µm.

2.3.2. Carbonate

Different types of carbonates seem to be present on Ceres’ surface. Natrite (Na2CO3) has been found to be the main carbonate in the Occator crater, while dolomite (CaMg(CO3)2) is close to Ceres’ average carbonate composition. For the organic-rich Ceres spectra, the assignment can be performed using the carbonate absorption band near 4 µm, which fits both the dolomite or calcite composition [6]. We chose a dolomite carbonate, named hydrated DS3 dolomite from Sassolungo location in Italy [25]. The sample has been sieved to <36 µm. It shows a strong absorption band centered at 3.96 µm corresponding to CO32−, and multiple bands (including overtones) at 2.3, 2.5, 3.3, 3.35, 3.45, and 3.47 µm. The reflectance level of the sample is the highest among the end-members (almost 0.6 at 2 µm).

2.3.3. Ammonium-Phyllosilicate

Ammoniated-phyllosilicates have been undoubtedly characterized on Ceres by VIR data as species contributing to the 3.05 µm band center absorption coupled to the 2.7 µm corresponding to phyllosilicate. Following previous investigations on Ceres’ composition and spectral characteristics of some ammoniated-phyllosilicates [24], we chose a lab sample of NH4-montmorillonite (SCa3-MT from the clay mineral society). Before NH4+ treatment (see [24]), the sample was sieved to <36 µm. The reflectance spectrum revealed OH hydroxyl band of phyllosilicate centered at 2.76 µm and a NH4+ absorption band centered at 3.05 µm (Figure 3). Overtones are observed near 2.1 and 2.2 µm.

2.3.4. Darkening Agent

Ceres has a very low visible and infrared albedo, possibly caused by the presence of darkening agents, in addition to other multi-physical spectral parameters [7]. Such darkening agents would have to be featureless and dark. We chose two darkening agents, amorphous carbon and magnetite (Fe3O4), sieved at <50 µm. These agents are featureless in the spectral range considered here, and their reflectance at 2 µm are ~0.06 for magnetite and ~0.03 for amorphous carbon from our measurements.

2.3.5. Aliphatic Carbons

Deciphering the exact nature of the molecules responsible for the aliphatic absorption bands detected around Ernutet is difficult [15]. Compared to meteorite organic matter and other extraterrestrial carbon, we can assume a molecular structure and diversity similar to the organic matter (OM) in carbonaceous chondrites (CC) [26,27,28]. Spectrally, in the 3.4 µm range, Ceres’ organic matter is similar to the insoluble organic matter in CC, a macromolecular structure compound. Earth analogues including kerogens, coals, bitumen, or soots are often optimal analogues for reproducing aliphatic and aromatic bands [29,30]. Here, we chose to use coals, as representative carbon compounds, with a structure and possible composition analogue to the one observed in Ceres. Coals are among the most abundant carbon matter on Earth and can be found as pure powder, which was wanted for our study. Note that coals are used as chemical compounds rich in carbon but this does not imply a similar origin for Ceres’ organics in any way. The choice of coals here was for their spectroscopic properties that match the Ceres spectrum and for its chemical structure (with heteroatoms) that could be similar to what is at the surface of Ceres.
DECS-16 and DECS-19 were purchased to the Penn State Coal Sample Bank (<250 µm) from the Pennsylvania State University. Elemental analysis provided by the Penn State Coal Sample bank gives a composition with 69.6 wt.% of carbon for DECS-16 (H/C 0.9) and 85.6 % for DECS-19 (H/C 0.6). Low-abundance minerals are also present (mainly silica and oxides), <15 wt.% for DECS-16 and <6 wt.% for DECS-19. All these minerals are featureless in the 2–4.5 µm range. The absorption features near 3.4 µm only correspond to aliphatic or aromatic carbons (Figure 2). In the 4–25 µm spectra range, absorption corresponding to aromatic and aliphatic groups are noted (Supplementary Materials Figure S2). In addition, we performed nuclear magnetic resonance spectrometry at solid angle to obtain relative quantification of the aliphatic over aromatic carbons (see the Supplementary Materials and Figure S3). Full characterization of the NMR spectra is outside the scope of this work, but, basically, areas between 0 and 80 ppm correspond to aliphatic carbon groups, such as CH2 (29 ppm) and CH3 (20 ppm), linked to aromatic or to aliphatic fractions, while the area between 90 to 170 ppm corresponds exclusively to aromatic carbon, either as CH (125 ppm) or quaternary carbon groups (136) involved in aromatic structures. We can observe that DECS-19 contains more than 80% (volume) of carbon involved in aromatic structures, with only 20% of aliphatic. This is correlated with the higher band depth of the 3.28 µm band in the IR spectra. In contrast, DECS-16, showing a very small shoulder at 3.28 µm, does contain at least 55% of its carbon in aromatic structure. The weak sensitivity of the IR spectra in deciphering the aromatic/aliphatic carbon abundances is mainly due to the very low absorption band strength of the aromatic CH (at 3.28 µm). Additionally, quaternary carbons (involved in aromatic rings) have no features in the IR range while they are detected by NMR and count in the aromatic carbon quantity.
The broad band between 2.7 µm and 3.2 µm in the DECS-16 sample is likely due to OH absorption from water. No carbonate peak is observed on the IR spectra, so the carbon quantity should be mainly organic carbon and will be used for relative quantification in this study.

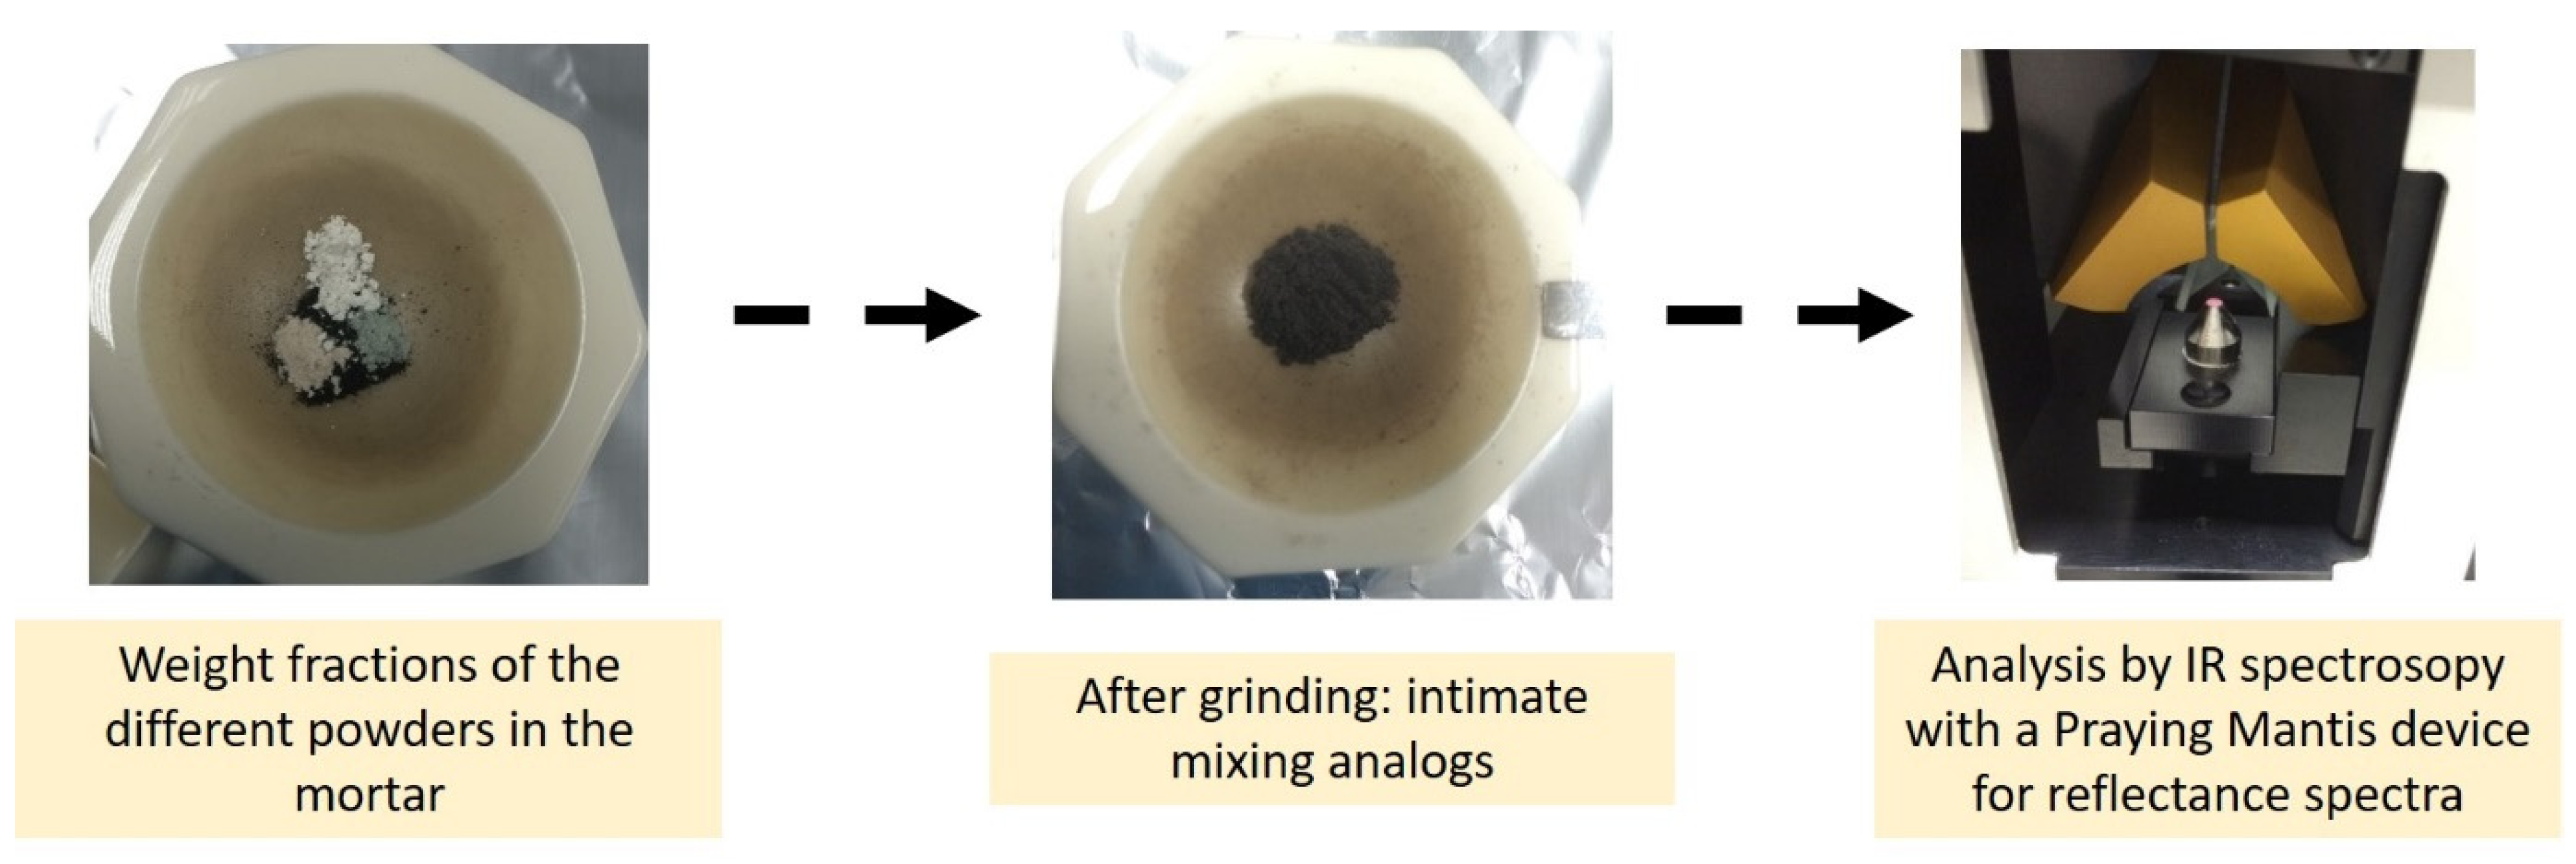
2.4. Mixture Preparation and Analysis

Samples were prepared by mixing together the powder in different weight fractions (Table 2). Then, the whole mixture was ground in an agate mortar by hand (10 min), which provided intimate mixing and decreased the grain size of the amorphous carbon powder (Figure 4). The larger components in size are indeed the DECS samples (Table 1), and so we estimated their grain size to be lower than 100 µm after grinding.

3. Results and Discussion on the Laboratory Mixtures

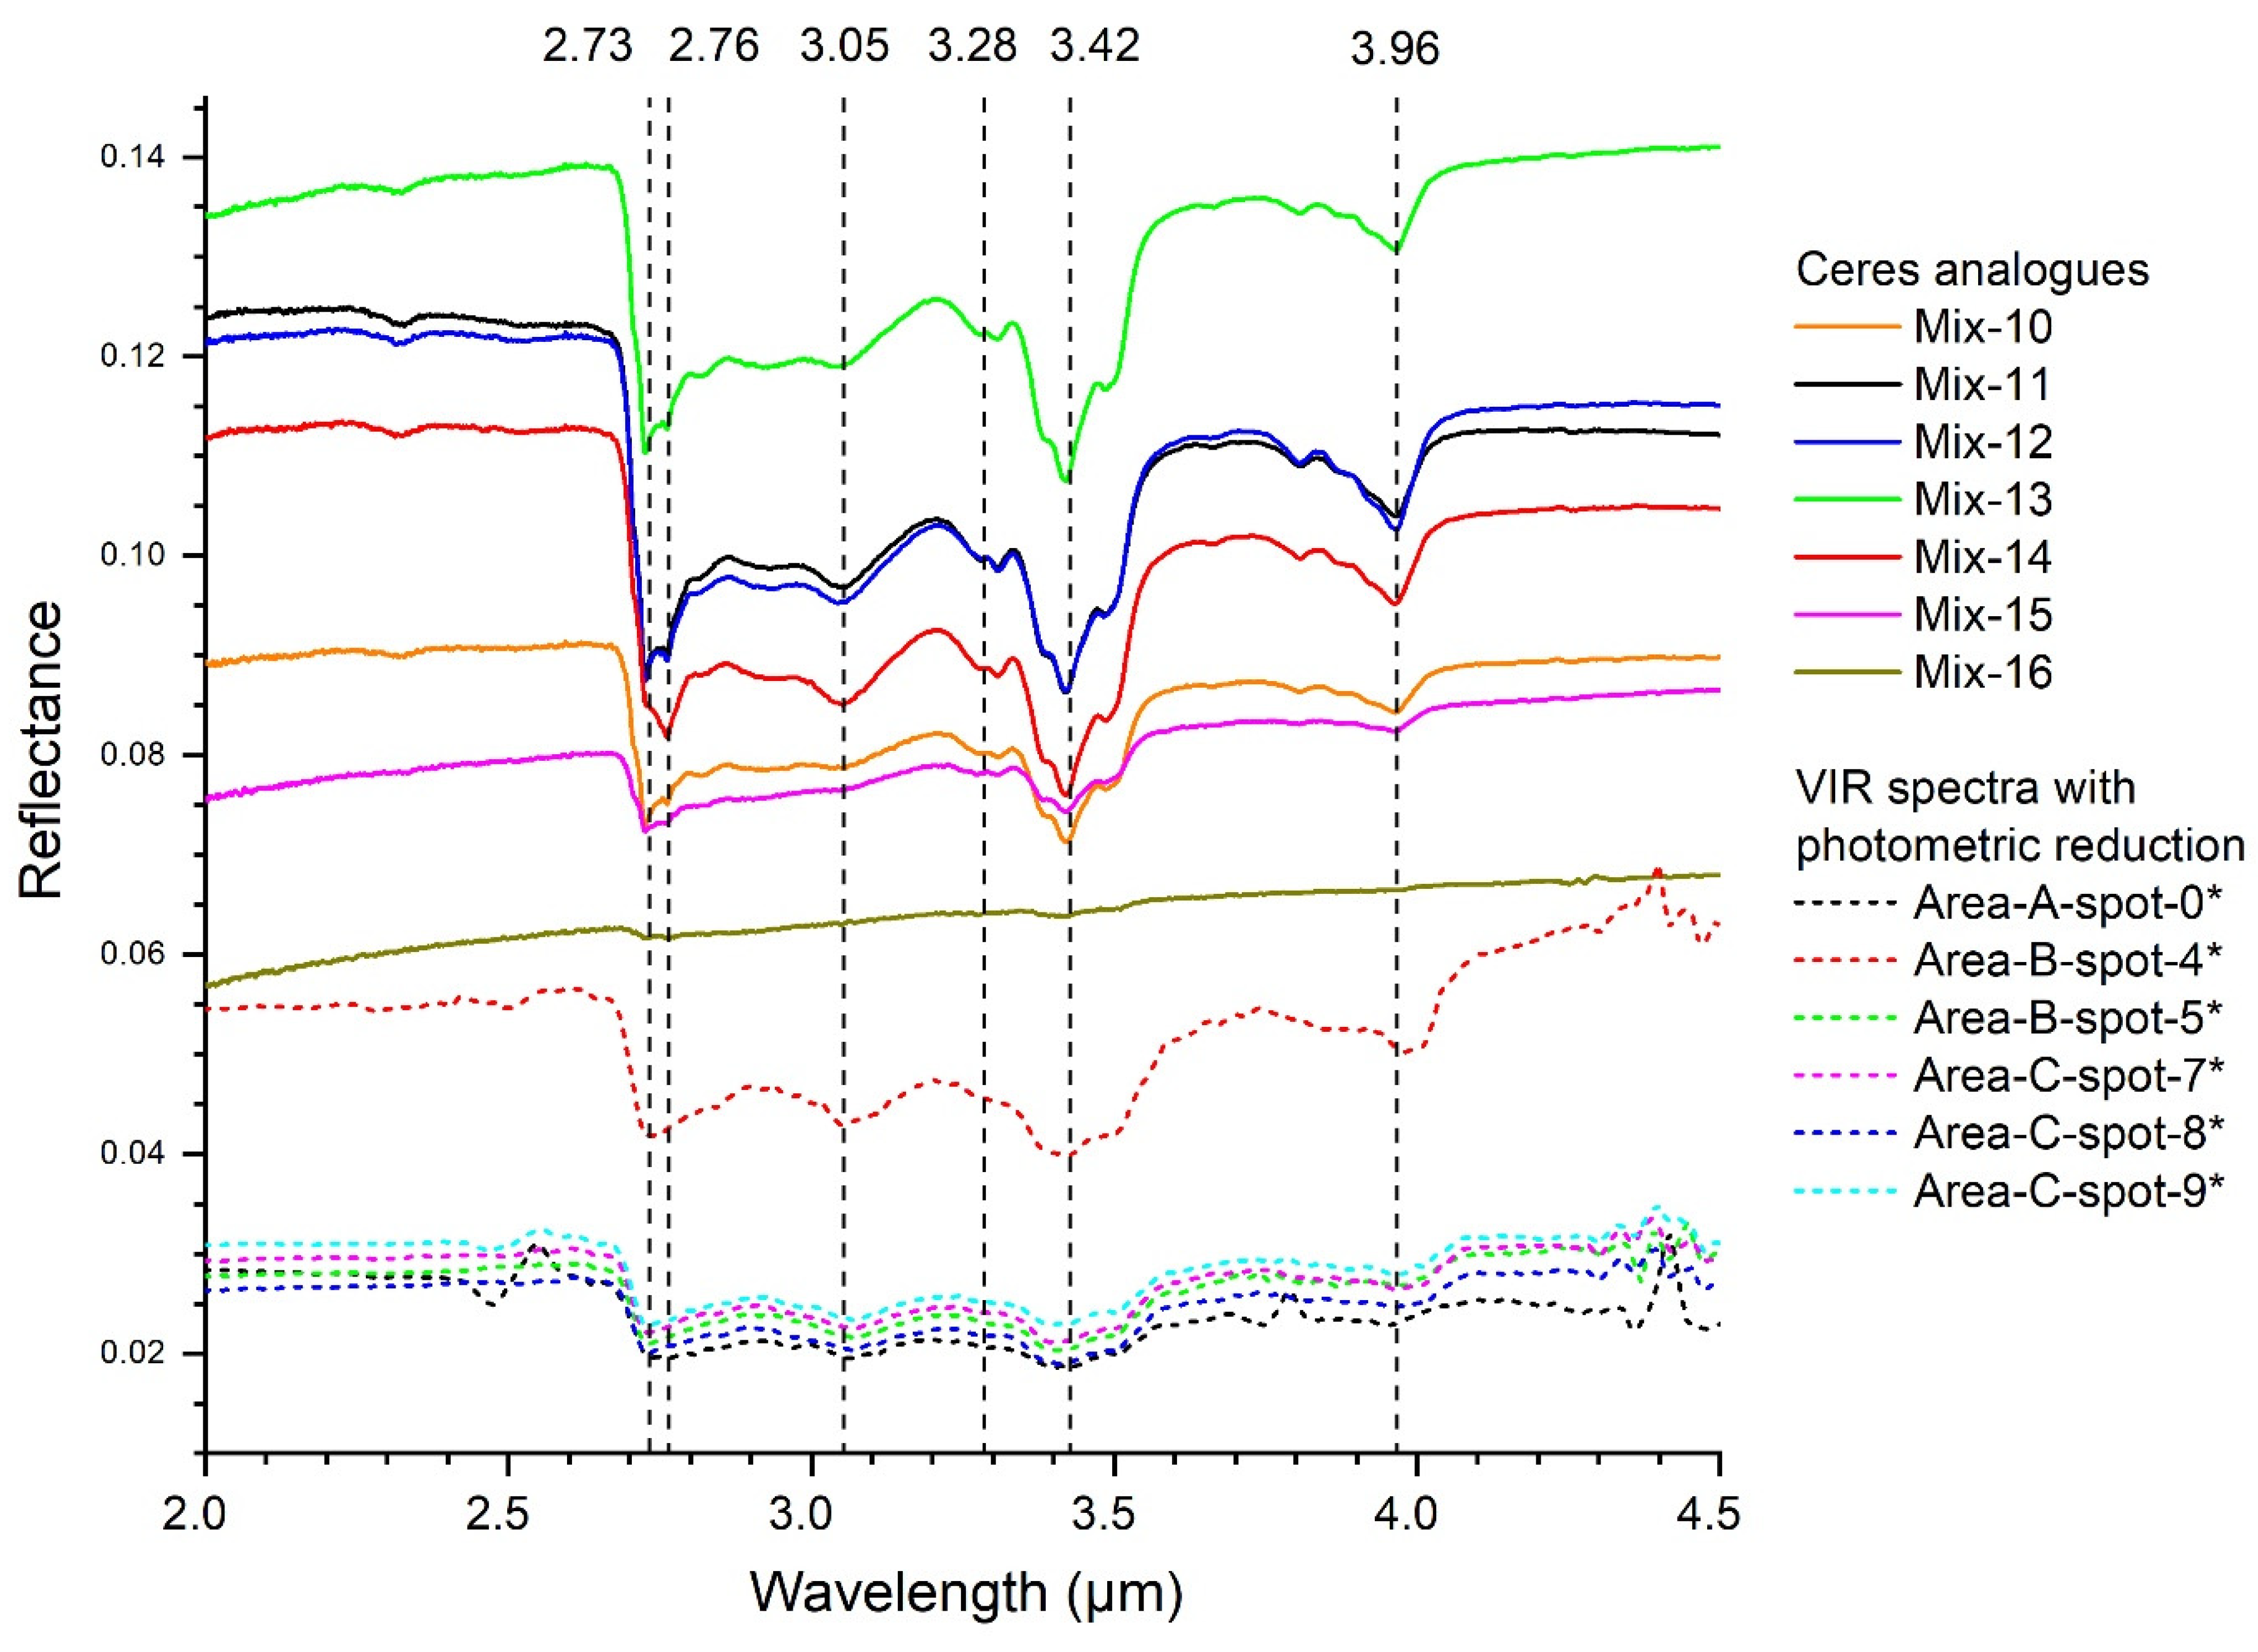
3.1. Reflectance of the Mixtures

Mixture compositions are reported in Table 2. Quantities are given in weight percent for the minerals and carbon compounds. We worked with the composition of the different mixtures to obtain a composition that fits the average surface spectra from VIR as much as possible. Adjustment of the five components were done based on the IR spectra measured after mixing and intimate grinding.
To perform a consistent comparison between laboratory mixture spectra and VIR observations, one must first correct the latter (VIR spectra) from photometric effects induced by different observation geometries with respect to the laboratory configuration (see Methods and Analyses section), and from unresolved shadows due to Ceres’ surface roughness. To accomplish this, we applied a photometric reduction of VIR observations to laboratory conditions (see the Supplementary Materials and Figure S1).
All the mixture reflectance levels presented here range between 0.06 and 0.14 (Figure 5), thus being 2 to 5 times higher than the observed reflectance level of Ceres’ organic rich areas after photometric reduction (mainly 0.03 I/F). Interestingly, our analogues match very closely the Ceres spectra when comparing the band depths and the overall shape discussed in the next sections.

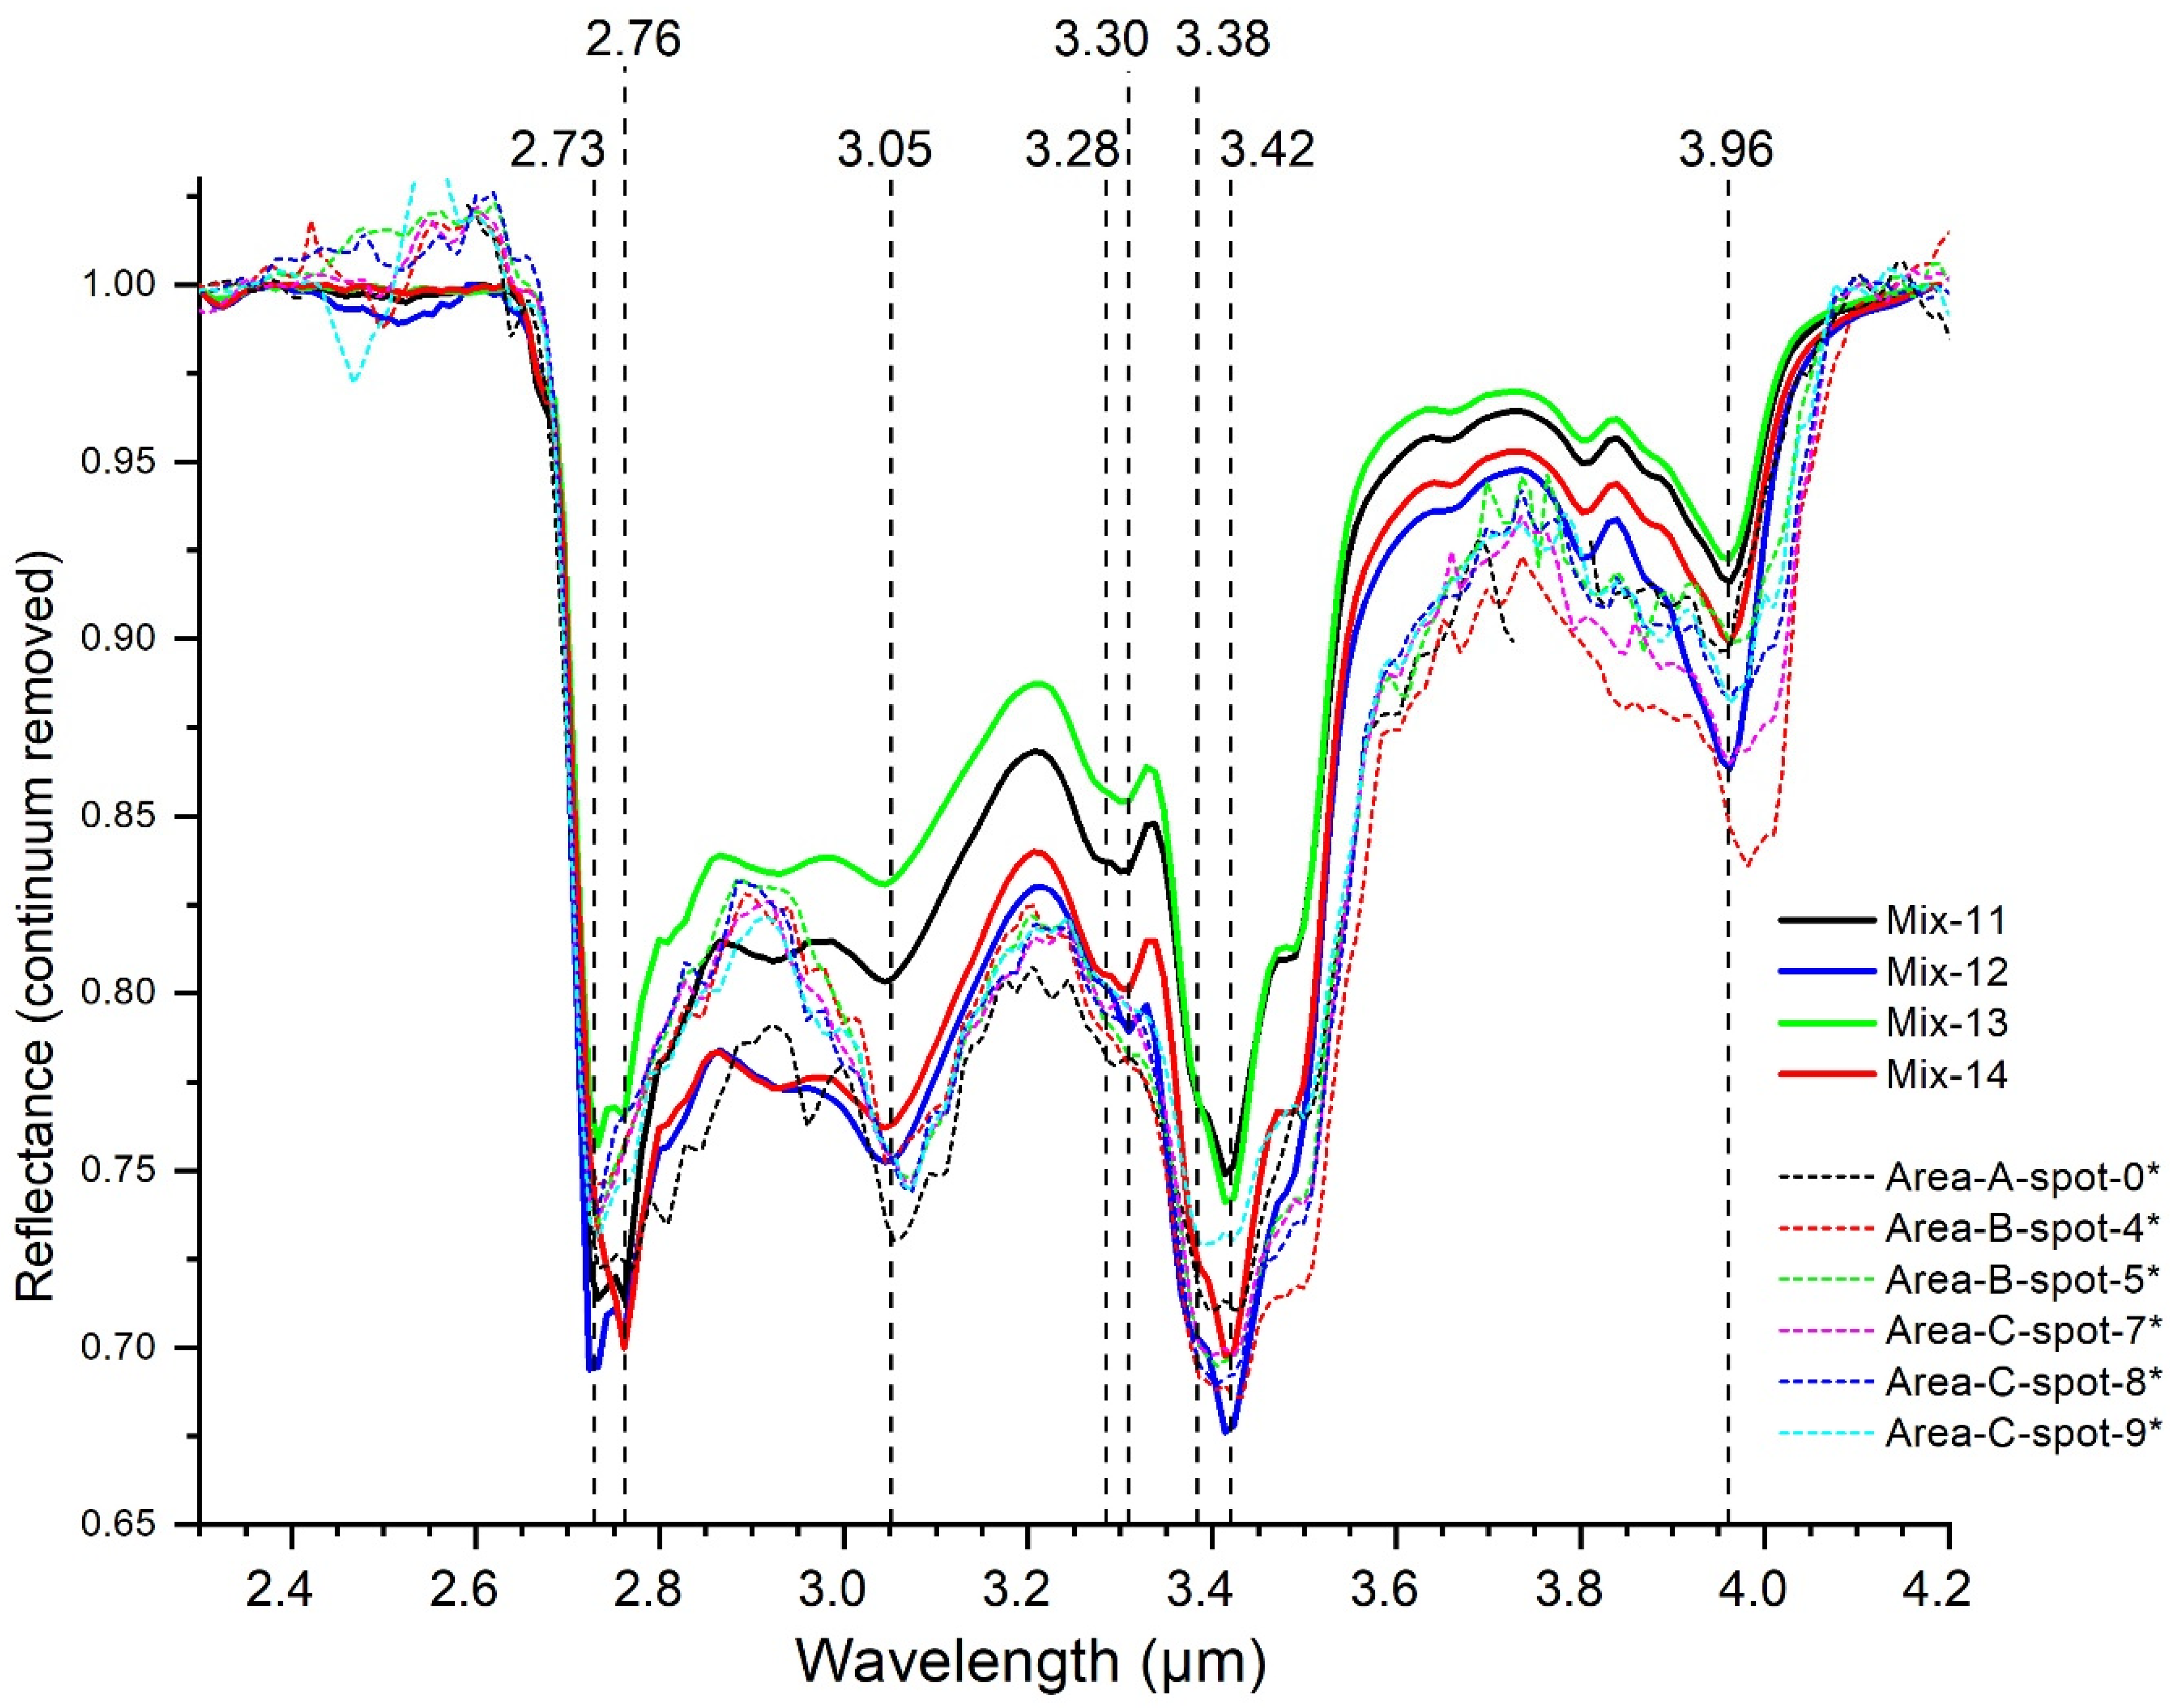
3.2. Composition and Quantification Compared to Ceres Spectra

For comparison with Ceres, our laboratory and the VIR spectra after photometric reduction were corrected from the continuum between 2.3 and 4.2 µm (Figure 6), dividing the spectra by an interpolated line between the extremes of the spectral range. This allows for a direct comparison of the absorption band depth and profile between laboratory and VIR spectra.
We can observe that mixtures 11, 12, 13, and 14 best reproduce the Ceres spectra and absorption band depths (Figure 6). Montmorillonite and serpentine present two distinct hydroxyl bands, one at 2.73 µm for the serpentine and the other at 2.76 for the montmorillonite, which drastically influence the resulting band at 2.7 µm (mix 14 vs. mix 12). Montmorillonite band at 2.76 µm closely matches the shoulder observed on VIR spectra spot-0 (Area-A) and spot-9 (Area-C). The Ceres phyllosilicate’s band is overall consistent with a majority of serpentine, given the fact that the Ceres’ band center is at 2.73 µm, but small concentrations of other phyllosilicates at higher wavelength can also contribute to the band profile. The nature of the phyllosilicates constituent of the regolith is not fully constrained yet and is likely constituted of more than two species. With our analogues, we observed that the 3 µm range is the most difficult to reproduce, either the band depth or the slope. This may certainly come from the nature of the minerals bearing the ammonium, and to the quantity of ammonium trapped within the phyllosilicates that is not constrained [24]. Additionally, possible water absorption was not controlled on our analogues; they have been manipulated under ambient temperature and air, while measurements were done under nitrogen flux. A small quantity of absorbed water can hence broaden the 3 µm band, as observed for ammonium-phyllosilicates [31], and indeed noted on our spectra. This band profile is barely observed on the Ceres spectra.
Beyond 3.1 µm to 4.2 µm, the spectral range of the VIR spectra are quite well reproduced by mixtures 14 and 12 and to a lesser extent by mixtures 11 and 13. To fit the carbon band near 3.4 µm, we noted that the presence of DECS-19, the richest in aromatic carbons (see Methods and Analyses section and Figure S2 in the Supplementary Materials), improved significantly the shape of the 3.4 µm band. In particular, the band at 3.28 µm, which corresponds to aromatic carbons, matches the shoulder observed in Ceres’ spectra. Coals are mixtures of aliphatic and aromatic carbons with some heteroatoms, highly ramified, which could be similar in molecular structure to the organic matter present in Ceres [10,15]. Absorption bands related to aromatic carbons are always faint in infrared spectroscopy, even if the sample could be composed of 84% aromatic carbons (such as DECS-19). Comparing our mixtures to Ceres’ spectra, we estimate that the 3.4 µm absorption observed by VIR can be reproduced with a third of aliphatic carbons mixed with aromatic carbons and few heteroatoms in a macromolecular structure (estimation from our mix with DECS-16 with DECS19, Table 2). Nonetheless, the band at 3.38 µm, observed on Ceres’ spectra, are not well reproduced by our analogues, having too much band at 3.42 µm corresponding to CH2 groups. Equal intensity between antisymmetric stretching modes of CH2 (3.42 µm) and CH3 (3.38 µm) may indicate a high abundance of CH3 groups in the aliphatic carbon fraction [15].
When comparing our laboratory mixture spectra to VIR spectra, several issues can be noted with the choice of dolomite as the main carbonate for this organic-rich region. Indeed, dolomite has a band at 3.30 µm, which is observed as an additional band on the analogues, while not present on VIR spectra (Figure 3 and Figure 6). Looking closely at the Ceres spectra from the different areas in the 4 µm region reveals a multicenter band with possible absorptions at 3.95, 3.96, 3.98, and 4.01 µm (see the Supplementary Materials Figure S4). Even if the dolomite carbonate with the band center at 3.96 µm fits nicely the VIR spectra and the slope between 3.4 µm and 3.8 µm, other carbonates, such as magnesite, calcite, siderite, or natrite, with a stronger 3.5 µm band (actually not well reproduced neither in our analogues), can also contribute to the Ceres composition in these organic-rich regions [6,15]. Interestingly, bands at 2.3 and 2.5 µm of the dolomite are barely observable in the mixture spectra, even with 26 wt.% of carbonates (Figure 5 and Figure 6), which could be a clue for its abundance. Overall, the quantity and nature of carbonate have a strong influence on the whole spectra and should be investigated further.
Relative abundances of the components composing the Ceres spectra can hence be extrapolated from our mixtures, especially from analogue mixtures 11, 12, 13, and 14. We infer that the Ceres spectra can be composed of an average of 16–22 wt.% serpentine (antigorite), 13–16 wt.% ammoniated-phyllosilicate (possibly montmorillonite), 19–26 wt.% of carbonates (not just dolomite), 20–28 wt.% of a darkening agent (such as magnetite), and 17–22 wt.% of carbon in the form of a macromolecule, with a third of aliphatic carbons with a lot of CH3 groups. This composition is applicable only for a mixture containing these six end-members; any additional component would require modifying the quantities and result in a different IR spectrum. Nonetheless, our analogues based on these end-members properly reproduce the Ceres organic-rich spectra, which suggests that they truly are the main components of the Ceres surface in agreement with observations.

3.3. Darkening Agent and Grains Sizes

In the mixtures, we tried two different darkening agents, magnetite and amorphous carbon. While they are both featureless, variation in the band slope has been observed (Figure 5). A positive band slope between 2–4.2 µm is observed for mixtures 13 and 15 that contain amorphous carbon (reflectance at 4.2 µm is higher than at 2 µm). Note that mixture 13 contains only 18 wt.% of amorphous carbon, indicating that the amorphous carbon has a stronger effect on the slope than magnetite. This positive slope is observed only when the magnetite is in excess in the mixture (90 wt.%; Mix. 16). With the same quantity in wt.% (Table 2), the spectra of the resulting mixtures 10 (magnetite) and 15 (amorphous carbon) present clearly this slope effect (Figure 5 and Figure 7). However, the volume used for the amorphous carbon and magnetite are different (they have different densities, Table 1). Assuming the two end-members have similar grain sizes, this implies a different total cross-section in the mixtures, which in turn play a role in the final IR spectrum by decreasing the absorption band depths (Figure 7).
Overall, VIR spectra have near horizontal to positive slope in the 2–4.2 µm range after photometric reduction to laboratory configuration (see the Supplementary Materials Figure S1 and Methods and Analyses section), which is in favor of the amorphous carbon as a darkening agent (Figure 5). Models of reflectance spectra of Ceres are usually composed of 50% of darkening agents and sometimes up to 90% in volume to fit Ceres’ reflectance level [15,32,33]. Here, with measurements of laboratory mixtures, we observed that an excess of darkening agent indeed decreases the reflectance level of the spectrum (mixture 16), but also decreases the absorption band depths of the other components (not only related to their quantities) and can change the overall slope. Hence, to limit the negative effects of the darkening agent on the spectra (band depth and slope), we suggest to add either less than 28 wt.% of the darkening agent having the same spectral properties as magnetite, or less than 18 wt.% of the darkening agent having the same properties as the amorphous carbon. It should be noted that we were not able to reproduce the absolute reflectance level of VIR spectra, and other parameters than composition such as optical biases may come into play, as discussed later.
Arising from these mixtures, the grain size of the particles can play a role. As noted, after grinding, DECS particles may be smaller than 100 µm and all other particles are smaller than 50 µm (Table 1, see Methods and Analyses section). It is known that the absorption band depths vary as a function of the grain size, both for minerals and carbon materials [34,35]. We studied this effect on the DECS-16 by measuring its reflectance spectra before and after grinding (Figure 8). As observed, the reflectance level increased by almost a factor of two after grinding, which is almost the factor needed to decrease the reflectance level of our analogues to fit VIR spectra (Figure 5). We hence propose that another experimental protocol should be developed for incorporation of larger grains or aggregates in intimate mixtures, to avoid a reflectance increase.

4. Implications for the Composition of Ceres

The observation of OM at the surface of Ceres, with such a clear and unquestionable signature, is one of the huge achievements of the Dawn mission. A few asteroids in the main belt (for example Themis 24 and Cybele 65) also present small features near 3.3–3.4 µm, but with no distinct aliphatic signatures [36,37,38]. Until now, only carbonaceous chondrites held a record of the organic matter in the inner Solar System (excluding comets). Ceres is an intriguing world whose geology and composition have witnessed a global hydrothermal alteration event, similar to hydrothermal alteration seen in carbonaceous chondrites [19,39,40].
Our mixing experiments highlight that Ceres spectra taken in organic-rich regions can be well-reproduced by using only four well-chosen end-members typical of the Ceres regolith composition as deduced from VIR data plus organic matter [6,7]. The results are in agreement with previous spectral models, yet with greater abundances of phyllosilicates and carbonates compared to the darkening agent [7,15,16,21,32,41]. Additionally, some spectral modelling included spectra from CC, as they represent complex mixtures similar to Ceres’ surface and help to decrease the reflectance level [21,32]. In fact, the main components of CCs that have absorption bands in the 2–4.5 µm spectral range are identical to those used in our experiments: phyllosilicates, carbonates, and some aliphatic carbons. The absence of ammoniated clays in CC is a major difference to Ceres’ surface. However, Ceres’ overall mineralogy is indeed similar to CC composition, especially CI, the closest analogues to Ceres [19,40].
One open issue is that we were not able to reproduce Ceres’ albedo with our mixtures while normalized laboratory and VIR spectra fit Ceres observation. On the one hand, the albedo could be due to opaque phases that are known to greatly contribute to the darkening of CC spectra. The nature of the main darkening agent is still unsolved. Sulfides and iron oxides [35,42] identified in meteorites and suspected in 67P/Churyumov–Gerasimenko, can compose Ceres and contribute to lowering Ceres’ albedo. Their presence on Ceres remains to be confirmed. A mixture of amorphous carbon, magnetite, and sulfides as darkening agents could be a realistic compromise, matching both the VIR observations and GRaND data [17]. The amount of the darkening agent should, however, remain rather low in order for the key absorption bands to stand out. On the other hand, the regolith micro structure can also strongly affect the albedo. Spectral modelling of Ceres’ surface highlights the necessity to have quite large grain size (300 µm), which could not be reproduced in our experiments. Grain size has indeed an important impact on reflectance, depending on the composition [34,35,43,44,45]. While silicates and carbon (such as the coals in this study) usually become brighter with smaller grains size, iron sulfide shows the opposite behavior [35]. Likewise, the opaque phases, such as the darkening agent, may be required to have sub-micrometric grains [35]. As another direction of interest, coating processes by space weathering at airless bodies can also represent a potentially strong darkening agent [46,47,48]. These differences and biases, either from spectral models as well as from experimental analogues, arise from the difficulty to reproduce such dark surfaces. The addition of all of these factors (grains sizes, nature of the darkening agent, surface geometry) and alteration by space weathering might reasonably explain Ceres’ low albedo. In addition, compounds at the surface of Ceres are likely in an intimate chemical association, which probably controls the absorption bands. All these are very difficult to reproduce in the same model or laboratory analogue.
The best experimental or model fit can nonetheless yield relative abundances of the mineralogical and organic compositions and broaden our knowledge of Ceres’ regolith composition. Based on the experiments reported in this study, a large quantity of aliphatic carbon can be present in the organic-rich areas identified on Ceres. Using the laboratory analogues, we found that up to 22 wt.% of OM in the form of both aliphatic and aromatic carbons can match the Ernutet spectra. Previous studies show that the estimated abundance of organic matter changes if we consider spectral modelling using IOM or kerogen as end-members of the mixture: <15 wt.% when using kerogen or >45 wt.% when using IOM compounds [14,15,16,33,41]. Differences reside in the spectral properties of the organic matter used, which depend on its macromolecular structure, its H/C ratio, and grain size, even if the different OM varieties are all composed of aliphatic and aromatic carbon functions. It should be noted that IOM is chemically isolated from a CC matrix by acid treatment and dissolution of minerals [27], which likely rearrange the insoluble carbons. Ceres’ OM observed at Ernutet should not be structurally or compositionally similar since it has not been isolated from the matrix. IOM spectra have very low albedo (not completely understood but possibly due to its structure and association with residual minerals), which biases the quantity needed to fit the Ceres spectra [33]. Alternatively, kerogen-like compounds, with more CH3 groups than IOM, also may be a more representative kind of organic matter for Ceres, resembling the coals used in this study, with a disordered structure having both insoluble and soluble materials [49]. Of course, neither kerogen nor coals are relevant analogues to OM in Ceres in terms of their biological origins and formation environment. Altogether, models and experiments are consistent and demonstrate quite a large quantity of OM near the Ernutet crater.
This large quantity of OM supports an endogenous origin of the aliphatic carbons on Ceres, and is in agreement with the mineralogical context surrounding this organic-rich area [15]. One possible scenario is that near-surface compounds are rich in aliphatic chains and aromatic carbons, which have been extruded by a recent impact, such as near the Ernutet crater as evidence by some geologic features [20,22] or with the salty brines in the Occator crater [16,41]. In other areas at the Ceres’ surface, space weathering would have aromatized aliphatic carbons over time [50,51] and can explain the global average quantity of carbon (8–14 wt.%—likely amorphous) observed by GRaND [17]. Interestingly, the VIR spectral slope is better reproduced with some amorphous carbon, as observed with our analogues (Figure 5), which can be an indirect indication of its presence. It should be noted that organic matter may be intimately linked to phyllosilicates at the surface, due to their formation evolution together in aqueous environments, which could have preserved some organic matter [52,53]. The organic-mineral association can delay the degradation of aliphatic compounds for some time [54,55], but further experiments in conditions specific to Ceres are required. Mechanisms leading to the concentration of organic matter in the shallow subsurface and regolith of Ceres remain to be investigated. For example, trapping of a large volume of organic matter in Ceres’ crust could result from the migration of OM in crustal macroporosity (e.g., fractures) that may be pervasive based on observations of, e.g., polygonal craters [56,57]. Elemental and isotopic mapping, phase relationships, and structural mapping performed in Earth’s laboratory could elucidate the formation and evolution of organic matter inside Ceres. In summary, the exact nature of organic matter and its emplacement history requires future in-situ investigations or sample return missions [12,58,59].

Supplementary Materials

The following are available online at https://0-www-mdpi-com.brum.beds.ac.uk/article/10.3390/min11070719/s1, Figure S1: VIR spectra before and after photometric reduction to correspond to lab reflectance measurement conditions (incidence angle 45°, emission = 45°, phase angle = 90°). Except for spot 4 Area B, the photometric reduction to the same geometric reflectance has reduced the reflectance variations between spectra, Figure S2: Infrared spectra in reflectance between 2 and 25 µm of the two coals, DECS-16 and DECS-19 used in this study. Stretching absorption bands relative to aromatic and aliphatic groups are noted at 6.22 and 6.88 um and bending bands (aromatic cycle deformation) are clearly observed near 12–13 µm, Figure S3: CPMAS solid state NMR spectrum of DECS-16 and DECS-19. Main peaks for identification are indicated (see text). Absolute Integration of the half width surface area between 200 to 85 ppm for aromatic carbons, and 85 to −10 for aliphatic carbons indicates 58 vs. 83% of aromatic carbons, and 42 vs. 17 % of aliphatic carbons for DECS-16 vs. DECS-19 respectively, Figure S4: Reflectance infrared spectra in the 3.7–4.2 µm range for mixtures 11-12-13-14 (dotted lines) compared with VIR Ceres spectra (solid lines- with photometric reduction*-see Methods and Analyses section in the main text). The absorption band near 4 µm corresponds to the carbonate absorption. The center of this absorption band is reported for each VIR Ceres spectrum. The observed variations on the spectra may indicate the presence of different types of carbonates in this region, which is not well reproduced by the mixture using only one carbonate (here dolomite, band center at 3.96 µm), Table S1: Detail of the selected VIR data. References [23,57] are cited in the supplementary materials.

Author Contributions

Conceptualization, V.V. and M.-C.D.S.; Formal analysis, V.V., G.P. and J.B.; Investigation, V.V., G.P., A.R., M.C. and J.C.C.-R.; Methodology, V.V., G.P., A.R., M.C., S.D.A., M.F. and J.B.; Resources, J.B. and M.-C.D.S.; Supervision, V.V.; Writing—original draft, V.V.; Writing—review & editing, G.P., A.R., M.C., S.D.A., M.F., J.C.C.-R., J.B. and M.-C.D.S. All authors have read and agreed to the published version of the manuscript.

Funding

VIR is funded by the Italian Space Agency (ASI INAF I/004/12/0) and was developed under the leadership of INAF-Istituto di Astrofisica e Planetologia Spaziali, Rome, Italy. This work was also supported by the Programme National de Planétologie (PNP) of CNRS/INSU France, co-funded by CNES, France (PI V. Vinogradoff).

Data Availability Statement

The data that support the findings of this study are available from the corresponding author upon reasonable request.

Acknowledgments

We thank Fabio Ziarelli at the Spectropole in Marseille for solid state NMR analysis.

Conflicts of Interest

The authors declare no conflict of interest.

References

  1. Rivkin, A.S.; Volquardsen, E.L.; Clark, B.E. The Surface Composition of Ceres: Discovery of Carbonates and Iron-Rich Clays. Icarus 2006, 185, 563–567. [Google Scholar] [CrossRef]
  2. Takir, D.; Emery, J.P. Outer Main Belt Asteroids: Identification and Distribution of Four 3-Μm Spectral Groups. Icarus 2012, 219, 641–654. [Google Scholar] [CrossRef]
  3. De Sanctis, M.C.; Coradini, A.; Ammannito, E.; Filacchione, G.; Capria, M.T.; Fonte, S.; Magni, G.; Barbis, A.; Bini, A.; Dami, M.; et al. The VIR Spectrometer. Space Sci. Rev. 2011, 163, 329–369. [Google Scholar] [CrossRef]
  4. Ammannito, E.; DeSanctis, M.C.; Ciarniello, M.; Frigeri, A.; Carrozzo, F.G.; Combe, J.-P.; Ehlmann, B.L.; Marchi, S.; McSween, H.Y.; Raponi, A.; et al. Distribution of Phyllosilicates on the Surface of Ceres. Science 2016, 353, aaf4279. [Google Scholar] [CrossRef]
  5. Carrozzo, F.G.; Sanctis, M.C.D.; Raponi, A.; Ammannito, E.; Castillo-Rogez, J.; Ehlmann, B.L.; Marchi, S.; Stein, N.; Ciarniello, M.; Tosi, F.; et al. Nature, Formation, and Distribution of Carbonates on Ceres. Sci. Adv. 2018, 4, e1701645. [Google Scholar] [CrossRef] [Green Version]
  6. De Sanctis, M.C.; Raponi, A.; Ammannito, E.; Ciarniello, M.; Toplis, M.J.; McSween, H.Y.; Castillo-Rogez, J.C.; Ehlmann, B.L.; Carrozzo, F.G.; Marchi, S.; et al. Bright Carbonate Deposits as Evidence of Aqueous Alteration on (1) Ceres. Nature 2016, 536, 54–57. [Google Scholar] [CrossRef]
  7. De Sanctis, M.C.; Ammannito, E.; Raponi, A.; Marchi, S.; McCord, T.B.; McSween, H.Y.; Capaccioni, F.; Capria, M.T.; Carrozzo, F.G.; Ciarniello, M.; et al. Ammoniated Phyllosilicates with a Likely Outer Solar System Origin on (1) Ceres. Nature 2015, 528, 241–244. [Google Scholar] [CrossRef] [PubMed] [Green Version]
  8. De Sanctis, M.C.; Ammannito, E.; Raponi, A.; Frigeri, A.; Ferrari, M.; Carrozzo, F.G.; Ciarniello, M.; Formisano, M.; Rousseau, B.; Tosi, F.; et al. Fresh Emplacement of Hydrated Sodium Chloride on Ceres from Ascending Salty Fluids. Nat. Astron. 2020, 4, 786–793. [Google Scholar] [CrossRef]
  9. Raponi, A.; De Sanctis, M.C.; Carrozzo, F.G.; Ciarniello, M.; Castillo-Rogez, J.C.; Ammannito, E.; Frigeri, A.; Longobardo, A.; Palomba, E.; Tosi, F.; et al. Mineralogy of Occator Crater on Ceres and Insight into Its Evolution from the Properties of Carbonates, Phyllosilicates, and Chlorides. Icarus 2019, 320, 83–96. [Google Scholar] [CrossRef]
  10. Castillo-Rogez, J.C.; Neveu, M.; McSween, H.Y.; Fu, R.R.; Toplis, M.J.; Prettyman, T. Insights into Ceres’s Evolution from Surface Composition. Meteorit. Planet. Sci. 2018, 53, 1820–1843. [Google Scholar] [CrossRef]
  11. Russell, C.T.; Raymond, C.A.; Ammannito, E.; Buczkowski, D.L.; De Sanctis, M.C.D.; Hiesinger, H.; Jaumann, R.; Konopliv, A.S.; McSween, H.Y.; Nathues, A.; et al. Dawn Arrives at Ceres: Exploration of a Small, Volatile-Rich World. Science 2016, 353, 1008–1010. [Google Scholar] [CrossRef] [PubMed] [Green Version]
  12. Castillo-Rogez, J.C.; Neveu, M.; Scully, J.E.C.; House, C.H.; Quick, L.C.; Bouquet, A.; Miller, K.; Bland, M.; De Sanctis, M.C.; Ermakov, A.; et al. Ceres: Astrobiological Target and Possible Ocean World. Astrobiology 2020, 20, 269–291. [Google Scholar] [CrossRef] [PubMed]
  13. De Sanctis, M.C.; Mitri, G.; Castillo-Rogez, J.; House, C.H.; Marchi, S.; Raymond, C.A.; Sekine, Y. Relict Ocean Worlds: Ceres. Space Sci. Rev. 2020, 216, 60. [Google Scholar] [CrossRef]
  14. De Sanctis, M.C.; Ammannito, E.; McSween, H.Y.; Raponi, A.; Marchi, S.; Capaccioni, F.; Capria, M.T.; Carrozzo, F.G.; Ciarniello, M.; Fonte, S.; et al. Localized Aliphatic Organic Material on the Surface of Ceres. Science 2017, 355, 719–722. [Google Scholar] [CrossRef]
  15. De Sanctis, M.C.; Vinogradoff, V.; Raponi, A.; Ammannito, E.; Ciarniello, M.; Carrozzo, F.G.; De Angelis, S.; Raymond, C.A.; Russell, C.T. Characteristics of Organic Matter on Ceres from VIR/Dawn High Spatial Resolution Spectra. Mon. Not. R. Astron. Soc. 2019, 482, 2407–2421. [Google Scholar] [CrossRef]
  16. Raponi, A.; De Sanctis, M.C.; Giacomo Carrozzo, F.; Ciarniello, M.; Rousseau, B.; Ferrari, M.; Ammannito, E.; De Angelis, S.; Vinogradoff, V.; Castillo-Rogez, J.C.; et al. Organic Material on Ceres: Insights from Visible and Infrared Space Observations. Life 2021, 11, 9. [Google Scholar] [CrossRef]
  17. Prettyman, T.H.; Yamashita, N.; Toplis, M.J.; McSween, H.Y.; Schörghofer, N.; Marchi, S.; Feldman, W.C.; Castillo-Rogez, J.; Forni, O.; Lawrence, D.J.; et al. Extensive Water Ice within Ceres’ Aqueously Altered Regolith: Evidence from Nuclear Spectroscopy. Science 2017, 355, 55–59. [Google Scholar] [CrossRef] [Green Version]
  18. Pearson, V.K.; Sephton, M.A.; Franchi, I.A.; Gibson, J.M.; Gilmour, I. Carbon and Nitrogen in Carbonaceous Chondrites: Elemental Abundances and Stable Isotopic Compositions. Meteorit. Planet. Sci. 2006, 41, 1899–1918. [Google Scholar] [CrossRef]
  19. McSween, H.Y.; Emery, J.P.; Rivkin, A.S.; Toplis, M.J.C.; Castillo-Rogez, J.; Prettyman, T.H.; De Sanctis, M.C.; Pieters, C.M.; Raymond, C.A.; Russell, C.T. Carbonaceous Chondrites as Analogs for the Composition and Alteration of Ceres. Meteorit. Planet. Sci. 2017, 1–12. [Google Scholar] [CrossRef]
  20. Pieters, C.M.; Nathues, A.; Thangiam, G.; Hoffmann, M.; Platz, T.; De Sanctis, M.C.; Ammannito, E.; Tosi, F.; Zambon, F.; Pasckert, J.H.; et al. Geologic Constraints on the Origin of Red Organic-Rich Material on Ceres. Meteorit. Planet. Sci. 2018, 53, 1983–1998. [Google Scholar] [CrossRef]
  21. Marchi, S.; Raponi, A.; Prettyman, T.H.; Sanctis, M.C.D.; Castillo-Rogez, J.; Raymond, C.A.; Ammannito, E.; Bowling, T.; Ciarniello, M.; Kaplan, H.; et al. An Aqueously Altered Carbon-Rich Ceres. Nat. Astron. 2019, 3, 140–145. [Google Scholar] [CrossRef]
  22. Bowling, T.J.; Johnson, B.C.; Marchi, S.; De Sanctis, M.C.; Castillo-Rogez, J.C.; Raymond, C.A. An Endogenic Origin of Cerean Organics. Earth Planet. Sci. Lett. 2020, 534, 116069. [Google Scholar] [CrossRef]
  23. Ciarniello, M.; Sanctis, M.C.D.; Ammannito, E.; Raponi, A.; Longobardo, A.; Palomba, E.; Carrozzo, F.G.; Tosi, F.; Li, J.-Y.; Schröder, S.E.; et al. Spectrophotometric Properties of Dwarf Planet Ceres from the VIR Spectrometer on Board the Dawn Mission. Astron. Astrophys. 2017, 598, A130. [Google Scholar] [CrossRef] [Green Version]
  24. Ferrari, M.; De Angelis, S.; De Sanctis, M.C.; Ammannito, E.; Stefani, S.; Piccioni, G. Reflectance Spectroscopy of Ammonium-Bearing Phyllosilicates. Icarus 2019, 321, 522–530. [Google Scholar] [CrossRef]
  25. Frondini, F.; Zucchini, A.; Comodi, P. Water-Rock Interactions and Trace Elements Distribution in Dolomite Aquifers: The Sassolungo and Sella Systems (Northern Italy). Geochem. J. 2014, 48, 231–246. [Google Scholar] [CrossRef] [Green Version]
  26. Schmitt-Kopplin, P.; Gabelica, Z.; Gougeon, R.D.; Fekete, A.; Kanawati, B.; Harir, M.; Gebefuegi, I.; Eckel, G.; Hertkorn, N. High Molecular Diversity of Extraterrestrial Organic Matter in Murchison Meteorite Revealed 40 Years after Its Fall. Proc. Natl. Acad. Sci. USA 2010, 107, 2763–2768. [Google Scholar] [CrossRef] [PubMed] [Green Version]
  27. Alexander, C.M.O.; Cody, G.D.; De Gregorio, B.T.; Nittler, L.R.; Stroud, R.M. The Nature, Origin and Modification of Insoluble Organic Matter in Chondrites, the Major Source of Earth’s C and N. Geochemistry 2017, 77, 227–256. [Google Scholar] [CrossRef]
  28. Danger, G.; Ruf, A.; Maillard, J.; Hertzog, J.; Vinogradoff, V.; Schmitt-Kopplin, P.; Afonso, C.; Carrasco, N.; Schmitz-Afonso, I.; d’Hendecourt, L.L.S.; et al. Unprecedented Molecular Diversity Revealed in Meteoritic Insoluble Organic Matter: The Paris Meteorite’s Case. Planet. Sci. J. 2020, 1, 55. [Google Scholar] [CrossRef]
  29. Moroz, L.V.; Arnold, G.; Korochantsev, A.V.; Wäsch, R. Natural Solid Bitumens as Possible Analogs for Cometary and Asteroid Organics. Icarus 1998, 134, 253–268. [Google Scholar] [CrossRef]
  30. Rotundi, A.; Rietmeijer, F.J.M. Carbon in Meteoroids: Wild 2 Dust Analyses, IDPs and Cometary Dust Analogues. In Advances in Meteoroid and Meteor Science; Trigo-Rodríguez, J.M., Rietmeijer, F.J.M., Llorca, J., Janches, D., Eds.; Springer: New York, NY, USA, 2008; pp. 473–483. ISBN 978-0-387-78419-9. [Google Scholar]
  31. Angelis, S.D.; Ferrari, M.; Sanctis, M.C.D.; Ammannito, E.; Raponi, A.; Ciarniello, M. High-Temperature VIS-IR Spectroscopy of NH4-Phyllosilicates. J. Geophys. Res. Planets 2021, 126, e2020JE006696. [Google Scholar] [CrossRef]
  32. Kurokawa, H.; Ehlmann, B.L.; Sanctis, M.C.D.; Lapôtre, M.G.A.; Usui, T.; Stein, N.T.; Prettyman, T.H.; Raponi, A.; Ciarniello, M. A Probabilistic Approach to Determination of Ceres’ Average Surface Composition from Dawn Visible-Infrared Mapping Spectrometer and Gamma Ray and Neutron Detector Data. J. Geophys. Res. Planets 2020, 125, e2020JE006606. [Google Scholar] [CrossRef]
  33. Kaplan, H.H.; Milliken, R.E.; Alexander, C.M.O. New Constraints on the Abundance and Composition of Organic Matter on Ceres. Geophys. Res. Lett. 2018, 45, 5274–5282. [Google Scholar] [CrossRef] [Green Version]
  34. Cloutis, E.A. Quantitative Characterization of Coal Properties Using Bidirectional Diffuse Reflectance Spectroscopy. Fuel 2003, 82, 2239–2254. [Google Scholar] [CrossRef]
  35. Rousseau, B.; Érard, S.; Beck, P.; Quirico, É.; Schmitt, B.; Brissaud, O.; Montes-Hernandez, G.; Capaccioni, F.; Filacchione, G.; Bockelée-Morvan, D.; et al. Laboratory Simulations of the Vis-NIR Spectra of Comet 67P Using Sub-Μm Sized Cosmochemical Analogues. Icarus 2018, 306, 306–318. [Google Scholar] [CrossRef] [Green Version]
  36. Campins, H.; Hargrove, K.; Pinilla-Alonso, N.; Howell, E.S.; Kelley, M.S.; Licandro, J.; Mothe-Diniz, T.; Fernandez, Y.; Ziffer, J. Water Ice and Organics on the Surface of the Asteroid 24 Themis. Nature 2010, 464, 1320–1321. [Google Scholar] [CrossRef] [PubMed]
  37. Rivkin, A.S.; Emery, J.P. Detection of Ice and Organics on an Asteroidal Surface. Nature 2010, 464, 1322–1323. [Google Scholar] [CrossRef] [PubMed]
  38. Licandro, J.; Campins, H.; Kelley, M.; Hargrove, K.; Pinilla-Alonso, N.; Cruikshank, D.; Rivkin, A.S.; Emery, J. (65) Cybele: Detection of Small Silicate Grains, Water-Ice, and Organics. Astron. Astrophys. 2011, 525, A34. [Google Scholar] [CrossRef] [Green Version]
  39. Brearley, A.J. The Action of Water. In Meteorites and the Early Solar System II; University of Arizona Press: Tucson, AZ, USA, 2006; pp. 584–624. [Google Scholar]
  40. King, A.J.; Schofield, P.F.; Howard, K.T.; Russell, S.S. Modal Mineralogy of CI and CI-like Chondrites by X-ray Diffraction. Geochim. Cosmochim. Acta 2015, 165, 148–160. [Google Scholar] [CrossRef] [Green Version]
  41. Raponi, A.; Carrozzo, F.G.; Zambon, F.; De Sanctis, M.C.; Ciarniello, M.; Frigeri, A.; Ammannito, E.; Tosi, F.; Combe, J.-P.; Longobardo, A.; et al. Mineralogical Mapping of Coniraya Quadrangle of the Dwarf Planet Ceres. Icarus 2017. [Google Scholar] [CrossRef]
  42. Quirico, E.; Moroz, L.V.; Schmitt, B.; Arnold, G.; Faure, M.; Beck, P.; Bonal, L.; Ciarniello, M.; Capaccioni, F.; Filacchione, G.; et al. Refractory and Semi-Volatile Organics at the Surface of Comet 67P/Churyumov-Gerasimenko: Insights from the VIRTIS/Rosetta Imaging Spectrometer. Icarus 2016, 272, 32–47. [Google Scholar] [CrossRef] [Green Version]
  43. Cloutis, E.A.; Gaffey, M.J.; Smith, D.G.W.; Lambert, R.S.J. Reflectance Spectra of Mafic Silicate-Opaque Assemblages with Applications to Meteorite Spectra. Icarus 1990, 84, 315–333. [Google Scholar] [CrossRef]
  44. Moroz, L.; Baratta, G.; Strazzulla, G.; Starukhina, L.; Dotto, E.; Barucci, M.A.; Arnold, G.; Distefano, E. Optical Alteration of Complex Organics Induced by Ion Irradiation:: 1. Laboratory Experiments Suggest Unusual Space Weathering Trend. Icarus 2004, 170, 214–228. [Google Scholar] [CrossRef]
  45. Skulteti, A.; Kereszturi, A.; Szabo, M.; Kereszty, Z.; Cipriani, F. Mid-Infrared Spectroscopic Investigation of Meteorites and Perspectives for Thermal Infrared Observations at the Binary Asteroid Didymos. Planet. Space Sci. 2020, 184, 104855. [Google Scholar] [CrossRef]
  46. Hapke, B. Space Weathering from Mercury to the Asteroid Belt. J. Geophys. Res. Planets 2001, 106, 10039–10073. [Google Scholar] [CrossRef]
  47. Shkuratov, Y.; Starukhina, L.; Hoffmann, H.; Arnold, G. A Model of Spectral Albedo of Particulate Surfaces: Implications for Optical Properties of the Moon. Icarus 1999, 137, 235–246. [Google Scholar] [CrossRef]
  48. Chapman, C.R. Space Weathering of Asteroid Surfaces. Annu. Rev. Earth Planet. Sci. 2004, 32, 539–567. [Google Scholar] [CrossRef] [Green Version]
  49. Bousige, C.; Ghimbeu, C.M.; Vix-Guterl, C.; Pomerantz, A.E.; Suleimenova, A.; Vaughan, G.; Garbarino, G.; Feygenson, M.; Wildgruber, C.; Ulm, F.-J.; et al. Realistic Molecular Model of Kerogen’s Nanostructure. Nat. Mater. 2016, 15, 576–582. [Google Scholar] [CrossRef] [PubMed]
  50. Lantz, C.; Brunetto, R.; Barucci, M.A.; Dartois, E.; Duprat, J.; Engrand, C.; Godard, M.; Ledu, D.; Quirico, E. Ion Irradiation of the Murchison Meteorite: Visible to Mid-Infrared Spectroscopic Results. Astron. Astrophys. 2015, 577, A41. [Google Scholar] [CrossRef] [Green Version]
  51. Godard, M.; Féraud, G.; Chabot, M.; Carpentier, Y.; Pino, T.; Brunetto, R.; Duprat, J.; Engrand, C.; Bréchignac, P.; d’Hendecourt, L.; et al. Ion Irradiation of Carbonaceous Interstellar Analogues—Effects of Cosmic Rays on the 3.4 Μm Interstellar Absorption Band. Astron. Astrophys. 2011, 529, A146. [Google Scholar] [CrossRef] [Green Version]
  52. Lagaly, G.; Ogawa, M.; Dékány, I. Chapter 10.3—Clay Mineral–Organic Interactions. In Developments in Clay Science; Bergaya, F., Lagaly, G., Eds.; Handbook of Clay Science; Elsevier: Amsterdam, The Netherlands, 2013; Volume 5, pp. 435–505. [Google Scholar]
  53. Vinogradoff, V.; Le Guillou, C.; Bernard, S.; Viennet, J.C.; Jaber, M.; Remusat, L. Influence of Phyllosilicates on the Hydrothermal Alteration of Organic Matter in Asteroids: Experimental Perspectives. Geochim. Cosmochim. Acta 2020, 269, 150–166. [Google Scholar] [CrossRef]
  54. Poch, O.; Jaber, M.; Stalport, F.; Nowak, S.; Georgelin, T.; Lambert, J.-F.; Szopa, C.; Coll, P. Effect of Nontronite Smectite Clay on the Chemical Evolution of Several Organic Molecules under Simulated Martian Surface Ultraviolet Radiation Conditions. Astrobiology 2015, 15, 221–237. [Google Scholar] [CrossRef] [PubMed] [Green Version]
  55. Dos Santos, R.; Patel, M.; Cuadros, J.; Martins, Z. Influence of Mineralogy on the Preservation of Amino Acids under Simulated Mars Conditions. Icarus 2016, 277, 342–353. [Google Scholar] [CrossRef]
  56. Zeilnhofer, M.F.; Barlow, N.G. The Characterization and Distribution of Polygonal Impact Craters on Ceres and Their Implications for the Cerean Crust. Icarus 2021, 114586. [Google Scholar] [CrossRef]
  57. Hargitai, H.; Kereszturi, Á. (Eds.) Encyclopedia of Planetary Landforms; Springer: New York, NY, USA, 2015; ISBN 978-1-4614-3133-6. [Google Scholar]
  58. Shi, X.; Castillo-Rogez, J.; Hsieh, H.; Hui, H.; Ip, W.-H.; Lei, H.; Li, J.-Y.; Tosi, F.; Zhou, L.; Agarwal, J.; et al. GAUSS—A Sample Return Mission to Ceres. arXiv 2020, arXiv:190807731. [Google Scholar]
  59. Castillo-Rogez, J.; Scully, J.; Neveu, M.; Wyrick, D.; Thangjam, G.; Rivkin, A.; Sori, M.; Vinogradoff, V.; Miller, K.; Ermakov, A.; et al. Science Motivations for the Future Exploration of Ceres. Bull. Am. Astron. Soc. 2021, 53, 303. [Google Scholar] [CrossRef]
Figure 1. Spectra of organic-rich areas (2 km²—blue line) compared with non-organic-rich areas (6 km²—100 km southeast of Ernutet crater—black line).
Minerals 11 00719 g001
Figure 2. Left: enhanced color images from the Ernutet (top) and Hakumyi (bottom) crater areas, from the framing camera (FC). Organic matter is revealed by the reddish colors in these images (adapted from De Sanctis et al. [15], original Figure in Ref. [15]). North is indicated by the blue arrows. Right: spectra of the different organic spots, used in this study for comparison, obtained during the LAMO phase (about 200–300 m² total) and newly recalibrated (see methods and analyses section). A background spectrum from the area is shown for reference.
Minerals 11 00719 g002
Figure 3. Reflectance spectra of the end-members used in this study between 2.0 and 4.5 µm. Vertical dashed lines point at major bands for each sample that also correspond to major bands observed in Ceres’ spectra; 2.73–2.76 µm: stretching OH from hydroxyl groups in phyllosilicate; 3.05 µm: stretching NH from ammonium ions NH4+; 3.28 µm: stretching CH from aromatic carbon groups; 3.42 µm: stretching CH from aliphatic carbon group; 3.96 stretching CO3 from carbonates.
Minerals 11 00719 g003
Figure 4. Schematic representation of the protocol. Left and center: preparation of the mixtures by grinding the different components (after weighing) into a mortar (35 mm diameter); right: analysis in reflectance by IR spectroscopy with a Praying Mantis device.
Minerals 11 00719 g004
Figure 5. IR reflectance spectra of the mixtures (solid lines) compared to VIR spectra (dashed lines) after photometric reduction (* see Methods and Analyses section). Vertical dashed lines point at major bands for each sample that also correspond to major bands observed in Ceres’ spectra; 2.73–2.76 µm: stretching OH from hydroxyl groups in phyllosilicate; 3.05µm: stretching NH from ammonium ions NH4+; 3.28 µm: stretching CH from aromatic carbon groups; 3.42 µm: stretching CH from aliphatic carbon group; 3.96 stretching CO3 from carbonates. Reflectance level of the mixtures ranges between 0.06 to 0.14 compared to the reflectance levels at various spots on Ceres (0.03 I/F). Photometric corrected spectrum of Area-B spot-4 appear brighter, likely due to higher abundance of carbonate [16].
Minerals 11 00719 g005
Figure 6. Reflectance spectra after continuum removal of laboratory mixtures 11-12-13-14 between 2.5–4.2 μm (solid lines) compared with carbon-rich VIR spectra (dashed lines) from Ceres in the Ernutet and Hakumyi areas (* with photometric reduction—see Methods and Analyses section). Vertical dashed lines are major bands discussed in the main text. These four mixtures present the best match with Ceres’ spectra and indicate that the surface composition in these regions can contain 20 wt.% of carbon, one third being aliphatic carbons.
Minerals 11 00719 g006
Figure 7. Reflectance spectra after continuum removal of laboratory mixtures 10-13-15-16 between 2.5–4.2 μm compared with carbon-rich VIR spectra from Ceres in the Ernutet and Hakumyi areas (* with photometric reduction, see Methods and Analyses section). Impact of the quantity and nature of the darkening agent can be observed on the spectra of these mixtures.
Minerals 11 00719 g007
Figure 8. Reflectance spectra of DECS-16 before and after grinding, revealing an increase in absolute reflectance with smaller grain size.
Minerals 11 00719 g008
Table 1. Characteristics of the end-members used for spectral fitting: grains size, density, and carbon content.
CompoundGrain Size (Before Grinding)Density (g/cm3)Carbon (wt.%)
Antigorite<50 µm2.9/
Dolomite<36µm2.85/
NH4-montmorillonite a<36 µm2.25 /
Amorphous carbon<50 µm2100
Magnetite<50 µm5.2/
DECS-19 b<250 µm1.5–285.6
DECS-16 b<250 µm1.5–269.6
a from [24]; b from the Penn State Coal Sample Bank.
Table 2. Composition of the mixtures prepared as Ceres’ organic-rich analogues. Quantities are in wt.%.
Mixtures N°Quantity (wt.%)
CoalsSerpentineMt + NH4+DolomiteMagnetiteAmorphous
Carbon
NameCarbon
(wt.%)
mix-10DECS-197.816.88.316.839.00.0
DECS-1611.4
mix-11DECS-198.519.014.219.028.40.0
DECS-1610.9
mix-12DECS-197.717.313.026.026.00.0
DECS-169.9
mix-13DECS-1910.422.311.222.30.018.6
DECS-1615.2
mix-14DECS-199.213.016.419.728.20.0
DECS-1613.4
mix-15DECS-197.816.88.316.80.039.0
DECS-1611.4
mix-16DECS-191.43.01.53.089.20.0
DECS-162
Publisher’s Note: MDPI stays neutral with regard to jurisdictional claims in published maps and institutional affiliations.

