
Implication of Mineralogy and Isotope Data on the Origin of the Permian Basic Volcanic Rocks of the Hronicum (Slovakia, Western Carpathians)

 , and
, and
Abstract
:1. Introduction
2. Geological Background
3. Analytical Methods
4. Petrography and Mineralogy
5. Geochemistry
6. Discussion and Interpretation
- The basic dykes intruded together with the later, second volcanic phase in the Permian, at the time of maximum extension. The age of the second eruption phase in the Malužina Formation is indicated on the basis of the microflora as Thuringien (Planderová [25] according to the regional Central European scale), later correlated with the standard ICS stratigraphic scale as the Wuchiapingian-Changhsingian (period after the Capitanian degree; ca. 265 Ma), when Pangea breakup began in general and roughly coincides with the Illawara Magnetic Horizon [31,80]. This period is also associated with the so-called “Mid-Permian Episode” by Deroin and Bonin [81], associated with transform strike-slip movement and the onset of maximum extension, leading to Pangea breakage.
- However, it is quite likely that the basic dykes do not have the same age. The extension in the Hronicum sedimentation space took place in several stages and intrusions of dykes could be associated with each stage of extension.
- Another possibility is that during the extrusion period of the second eruption phase, the elements were remobilized and completely overheated, which resulted in recrystallization of older apatites or rather crystallization of new ones either in basic dykes or in the volcanics of the first eruption phase. This could explain the large variance of ages in dating, but at the same time it would be consistent with the Upper Permian age (Lopingian) of the second eruption phase.
7. Conclusions
- The basalts of the Malužina Formation are strongly altered; clinopyroxene, plagioclase, and amphibole are locally preserved from the primary minerals. In basalts the predominant textures are intersertal, pilotaxitic, hyalopilitic. Amygdaloid and vesicular structures have been commonly identified.
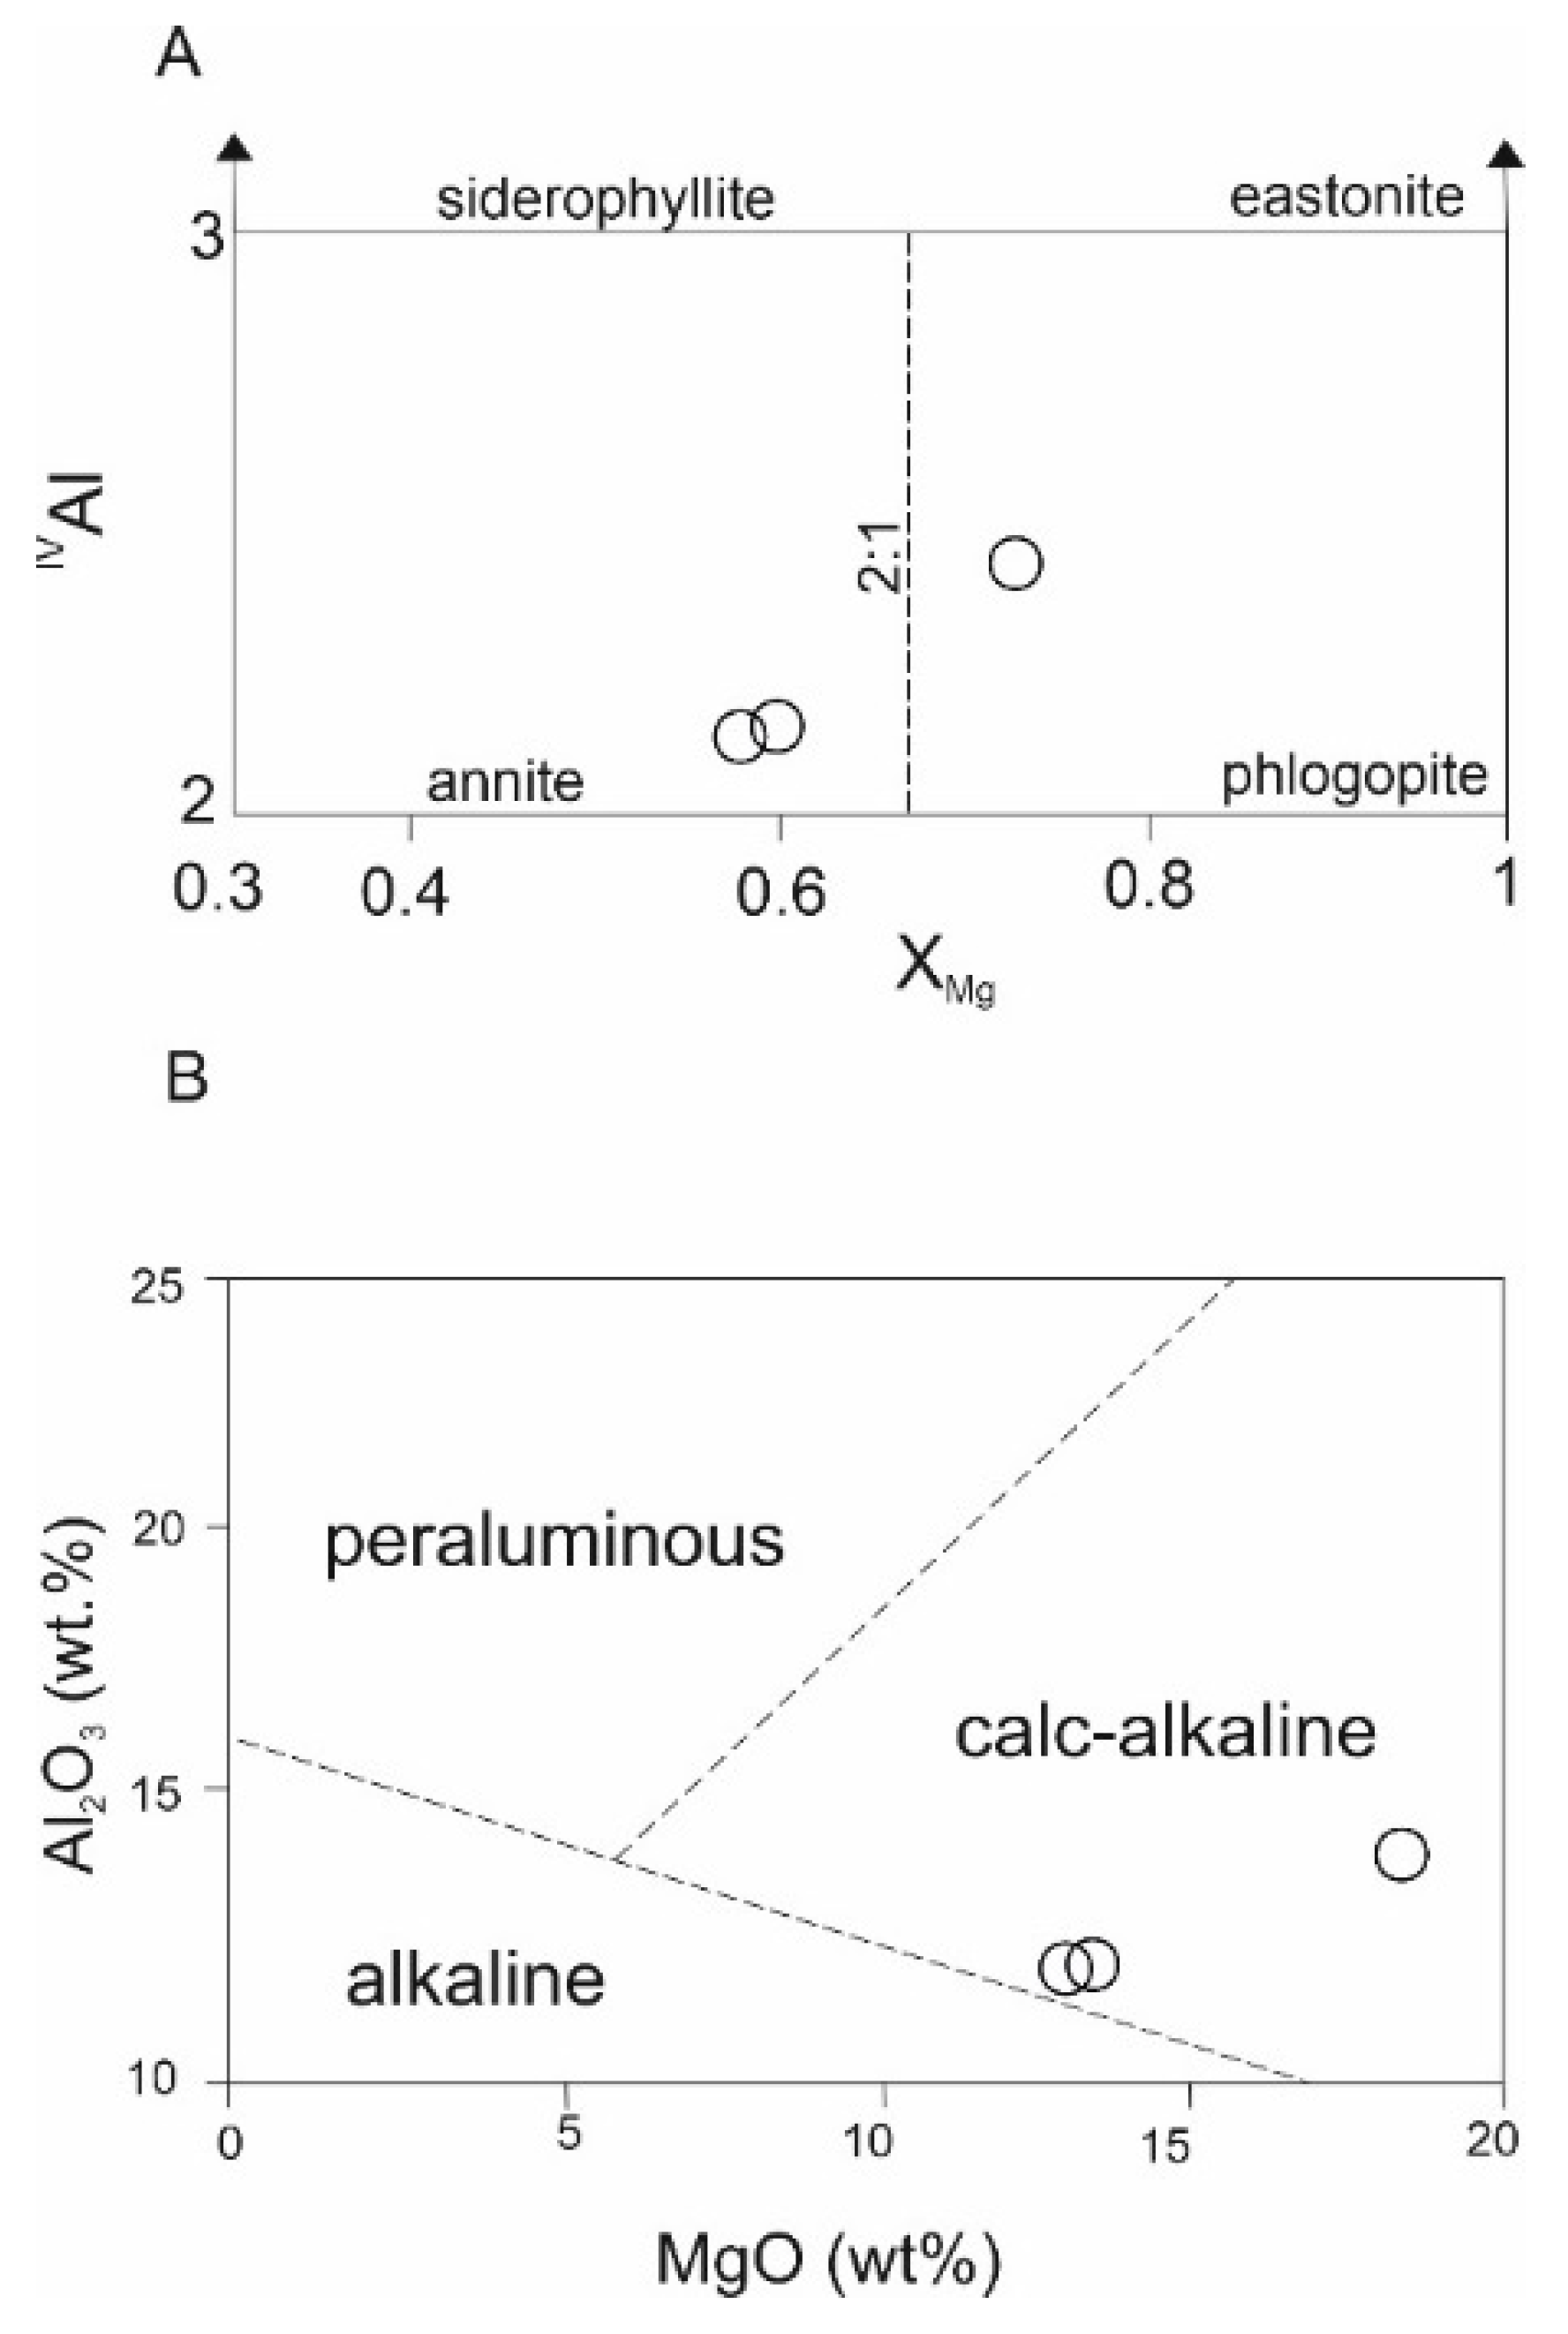
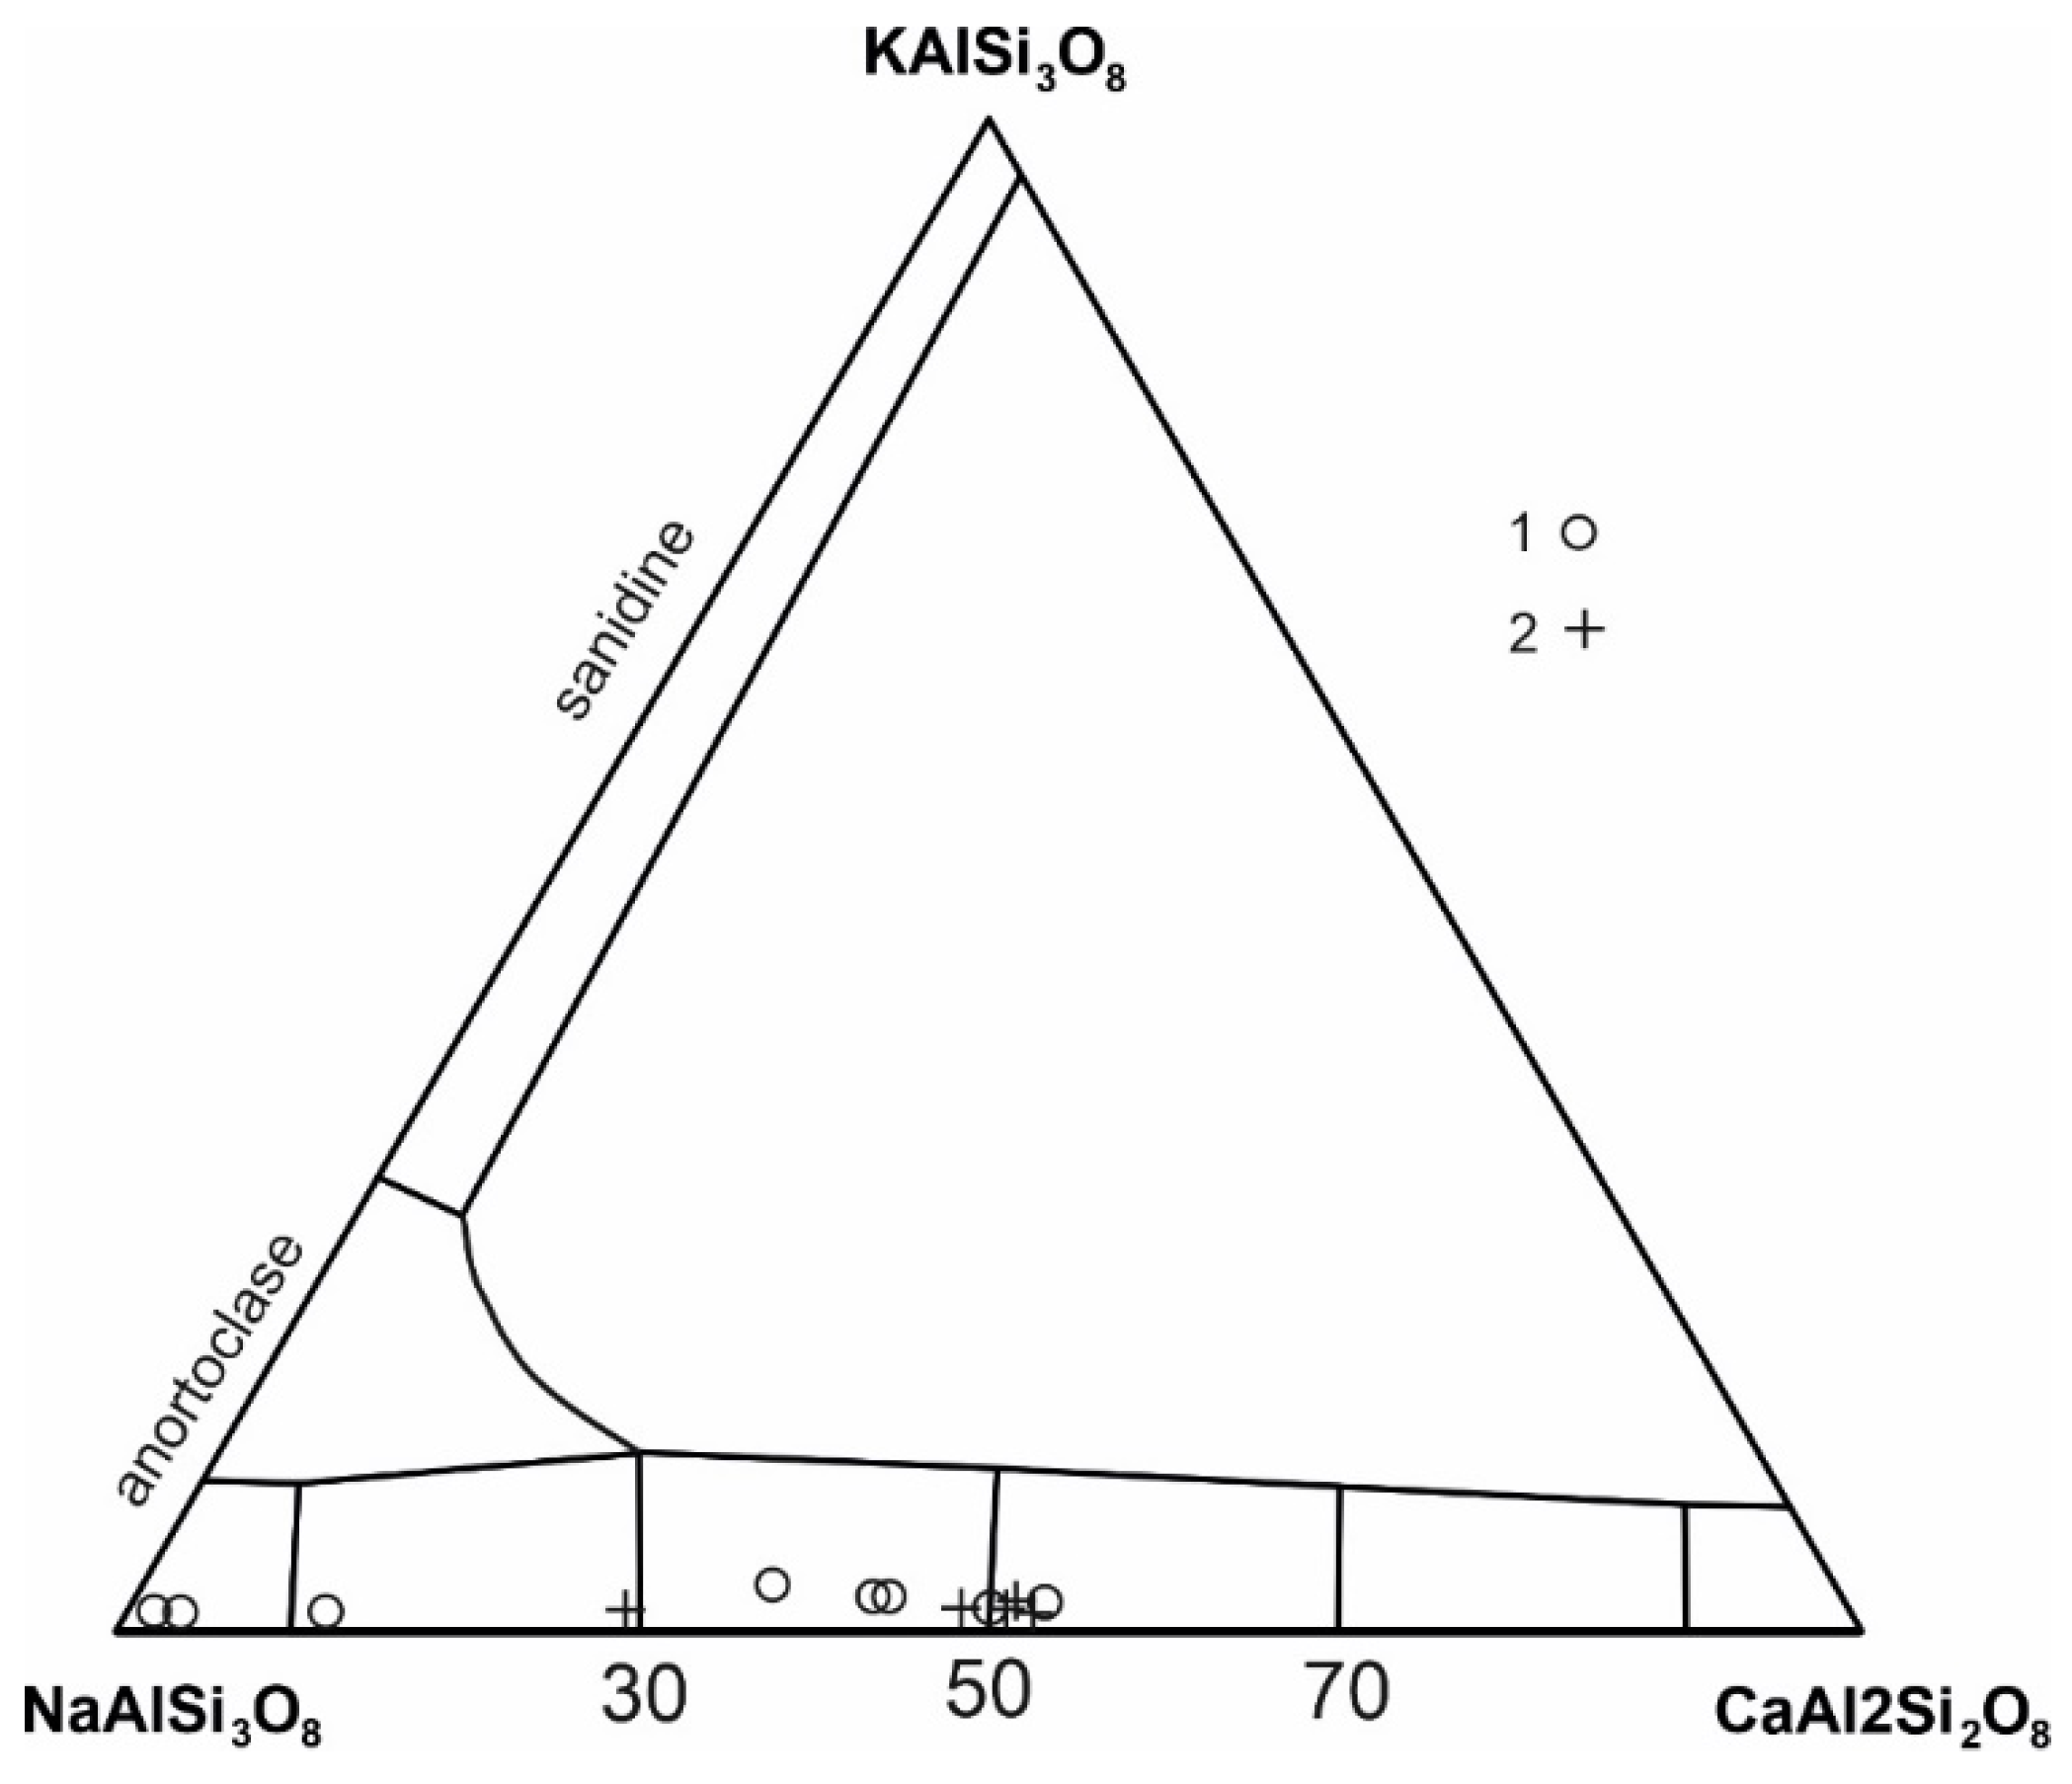
- Composition of main rock-forming minerals in different localities is similar. The clinopyroxenes are relatively homogenous in chemical composition, with only rarely observed darker zones in larger grains (Figure 2e) rich in Mg, and/or depleted of Fe. Based on the classification of pyroxenes these Cpx correspond to augite. There are two types of amphibole; the older amphibole coexisted with Cpx and has a composition corresponding to pargasite. The younger amphibole has a composition corresponding to actinolite/tremolite. Biotite is strongly altered and the biotites studied lie in the field of calc-alkaline rocks.
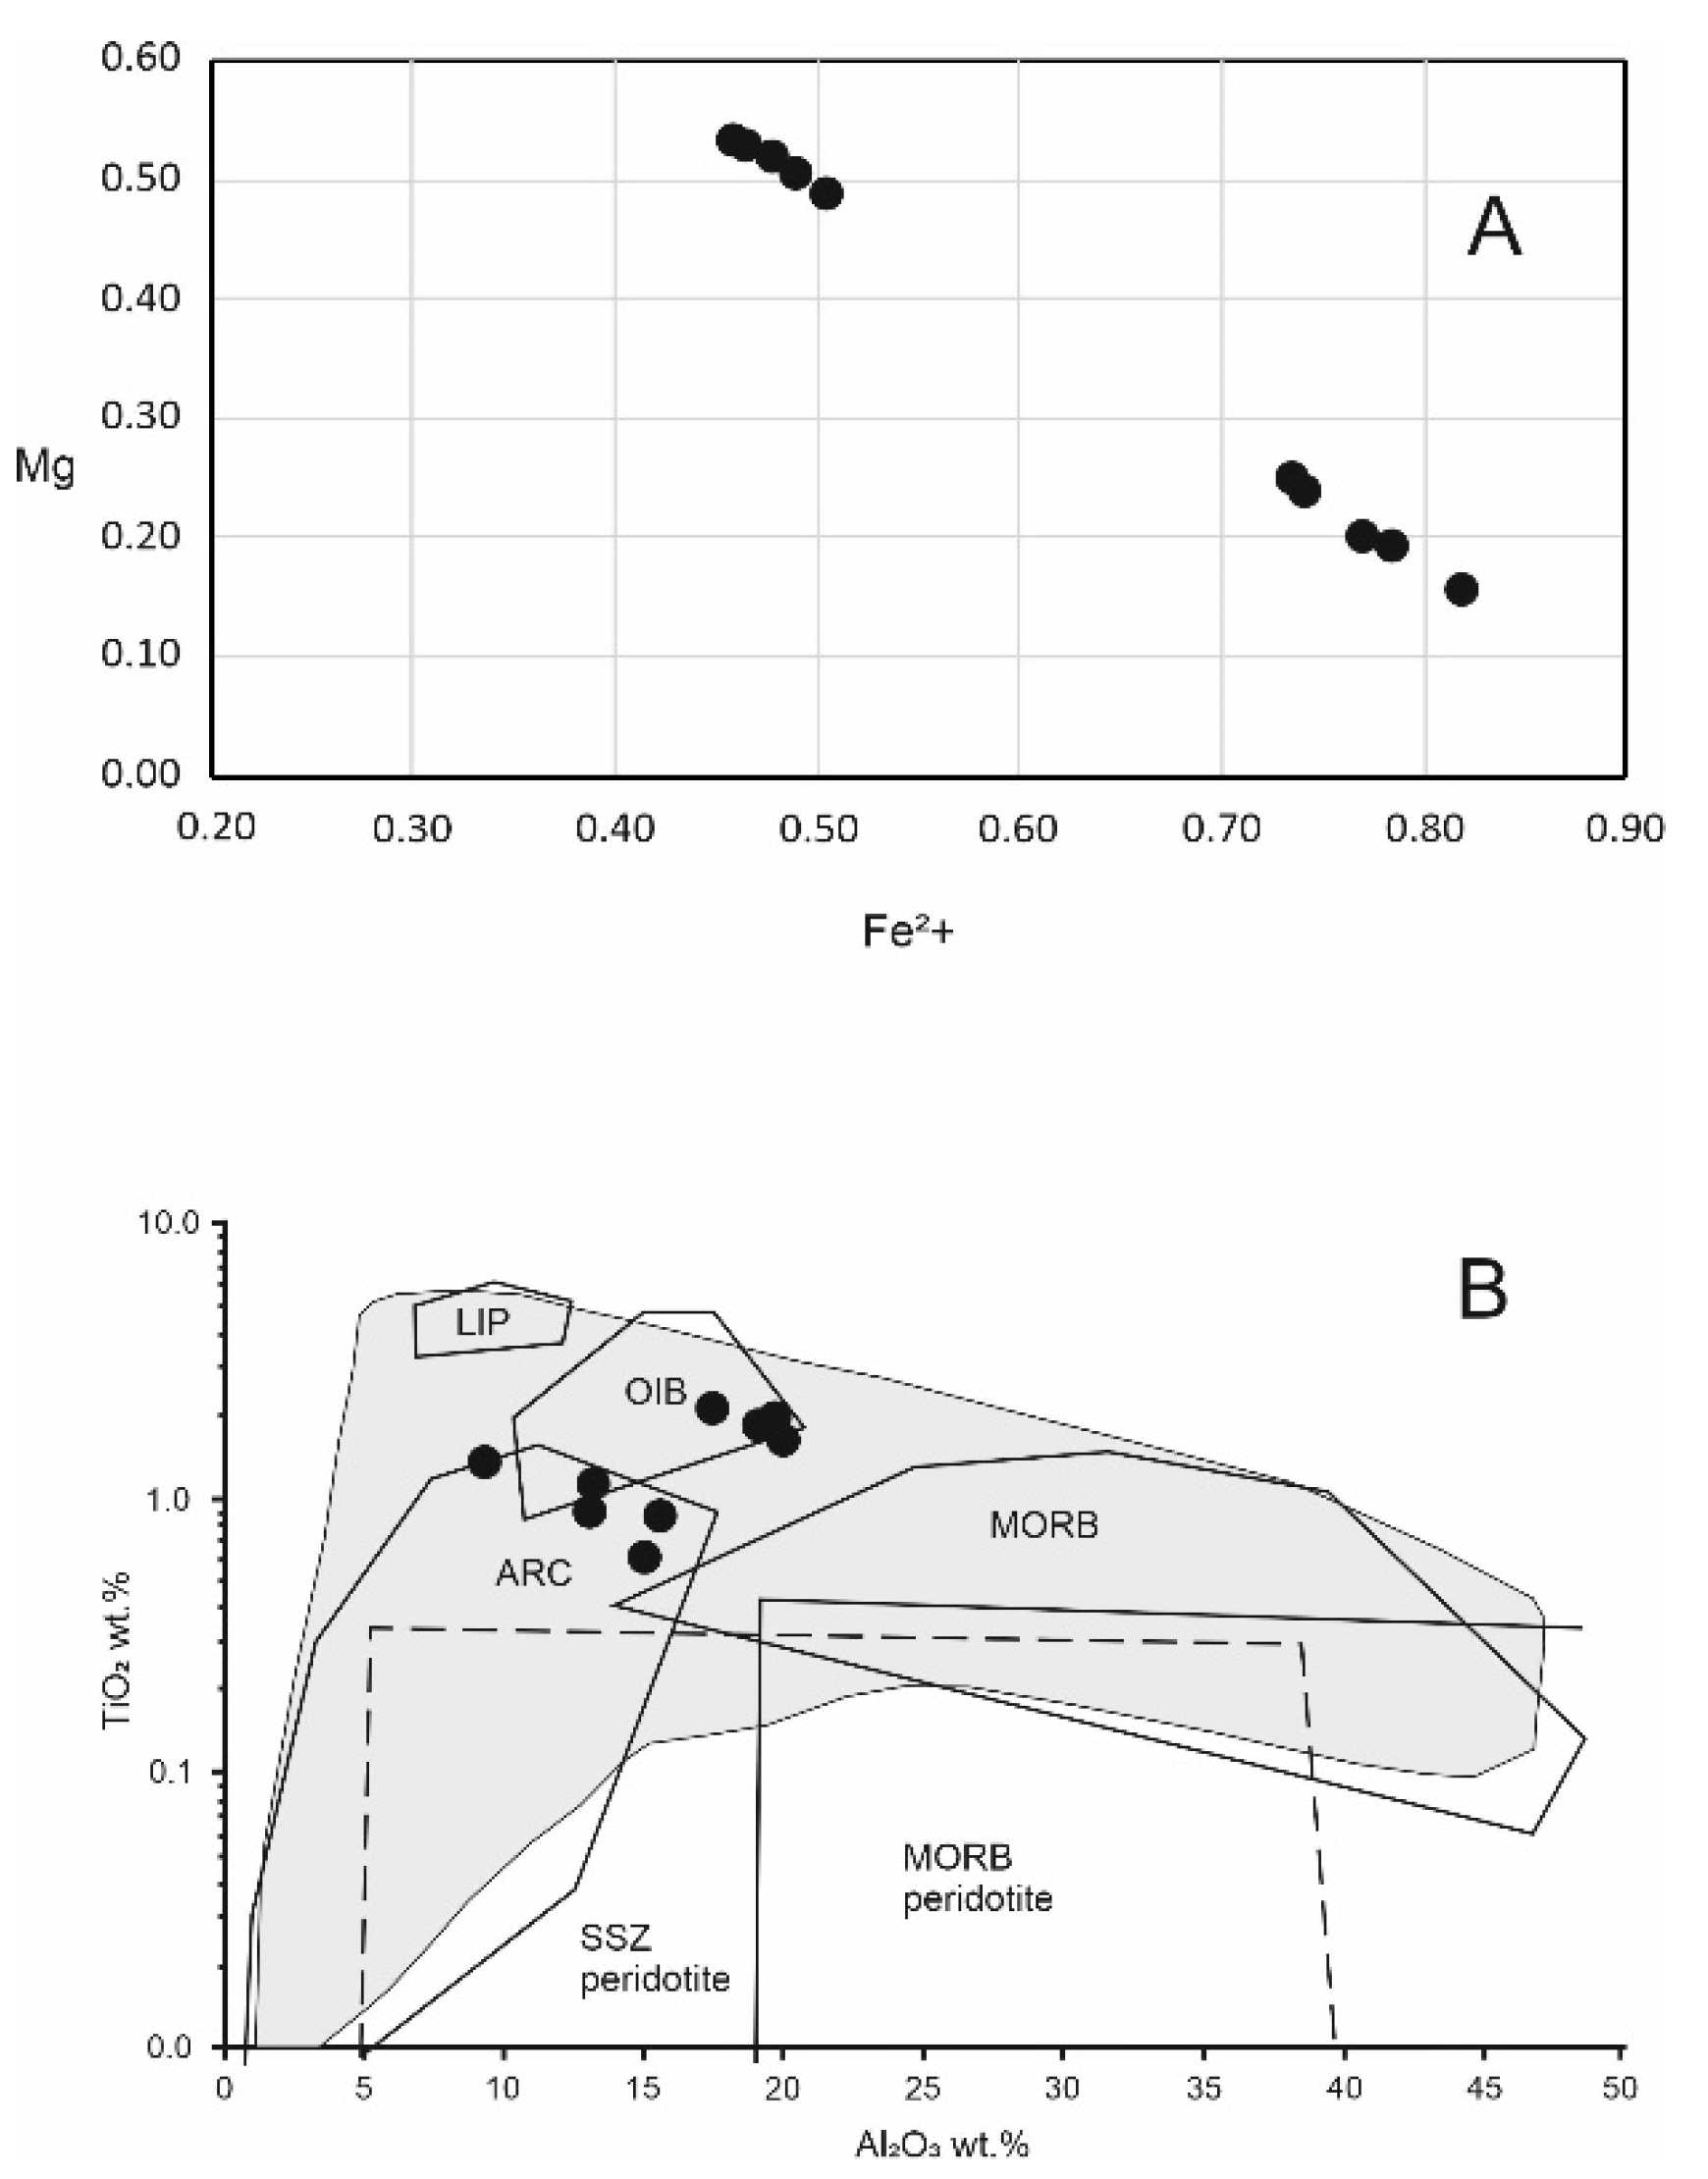
- Rare small grains of Cr-spinel have been observed in the gabbro-diorite dyke. Spinel grains probably formed part of the primary mineral association (clinopyroxenes, plagioclases, pargasite). The composition of spinels corresponds to spinels from volcanic rocks.
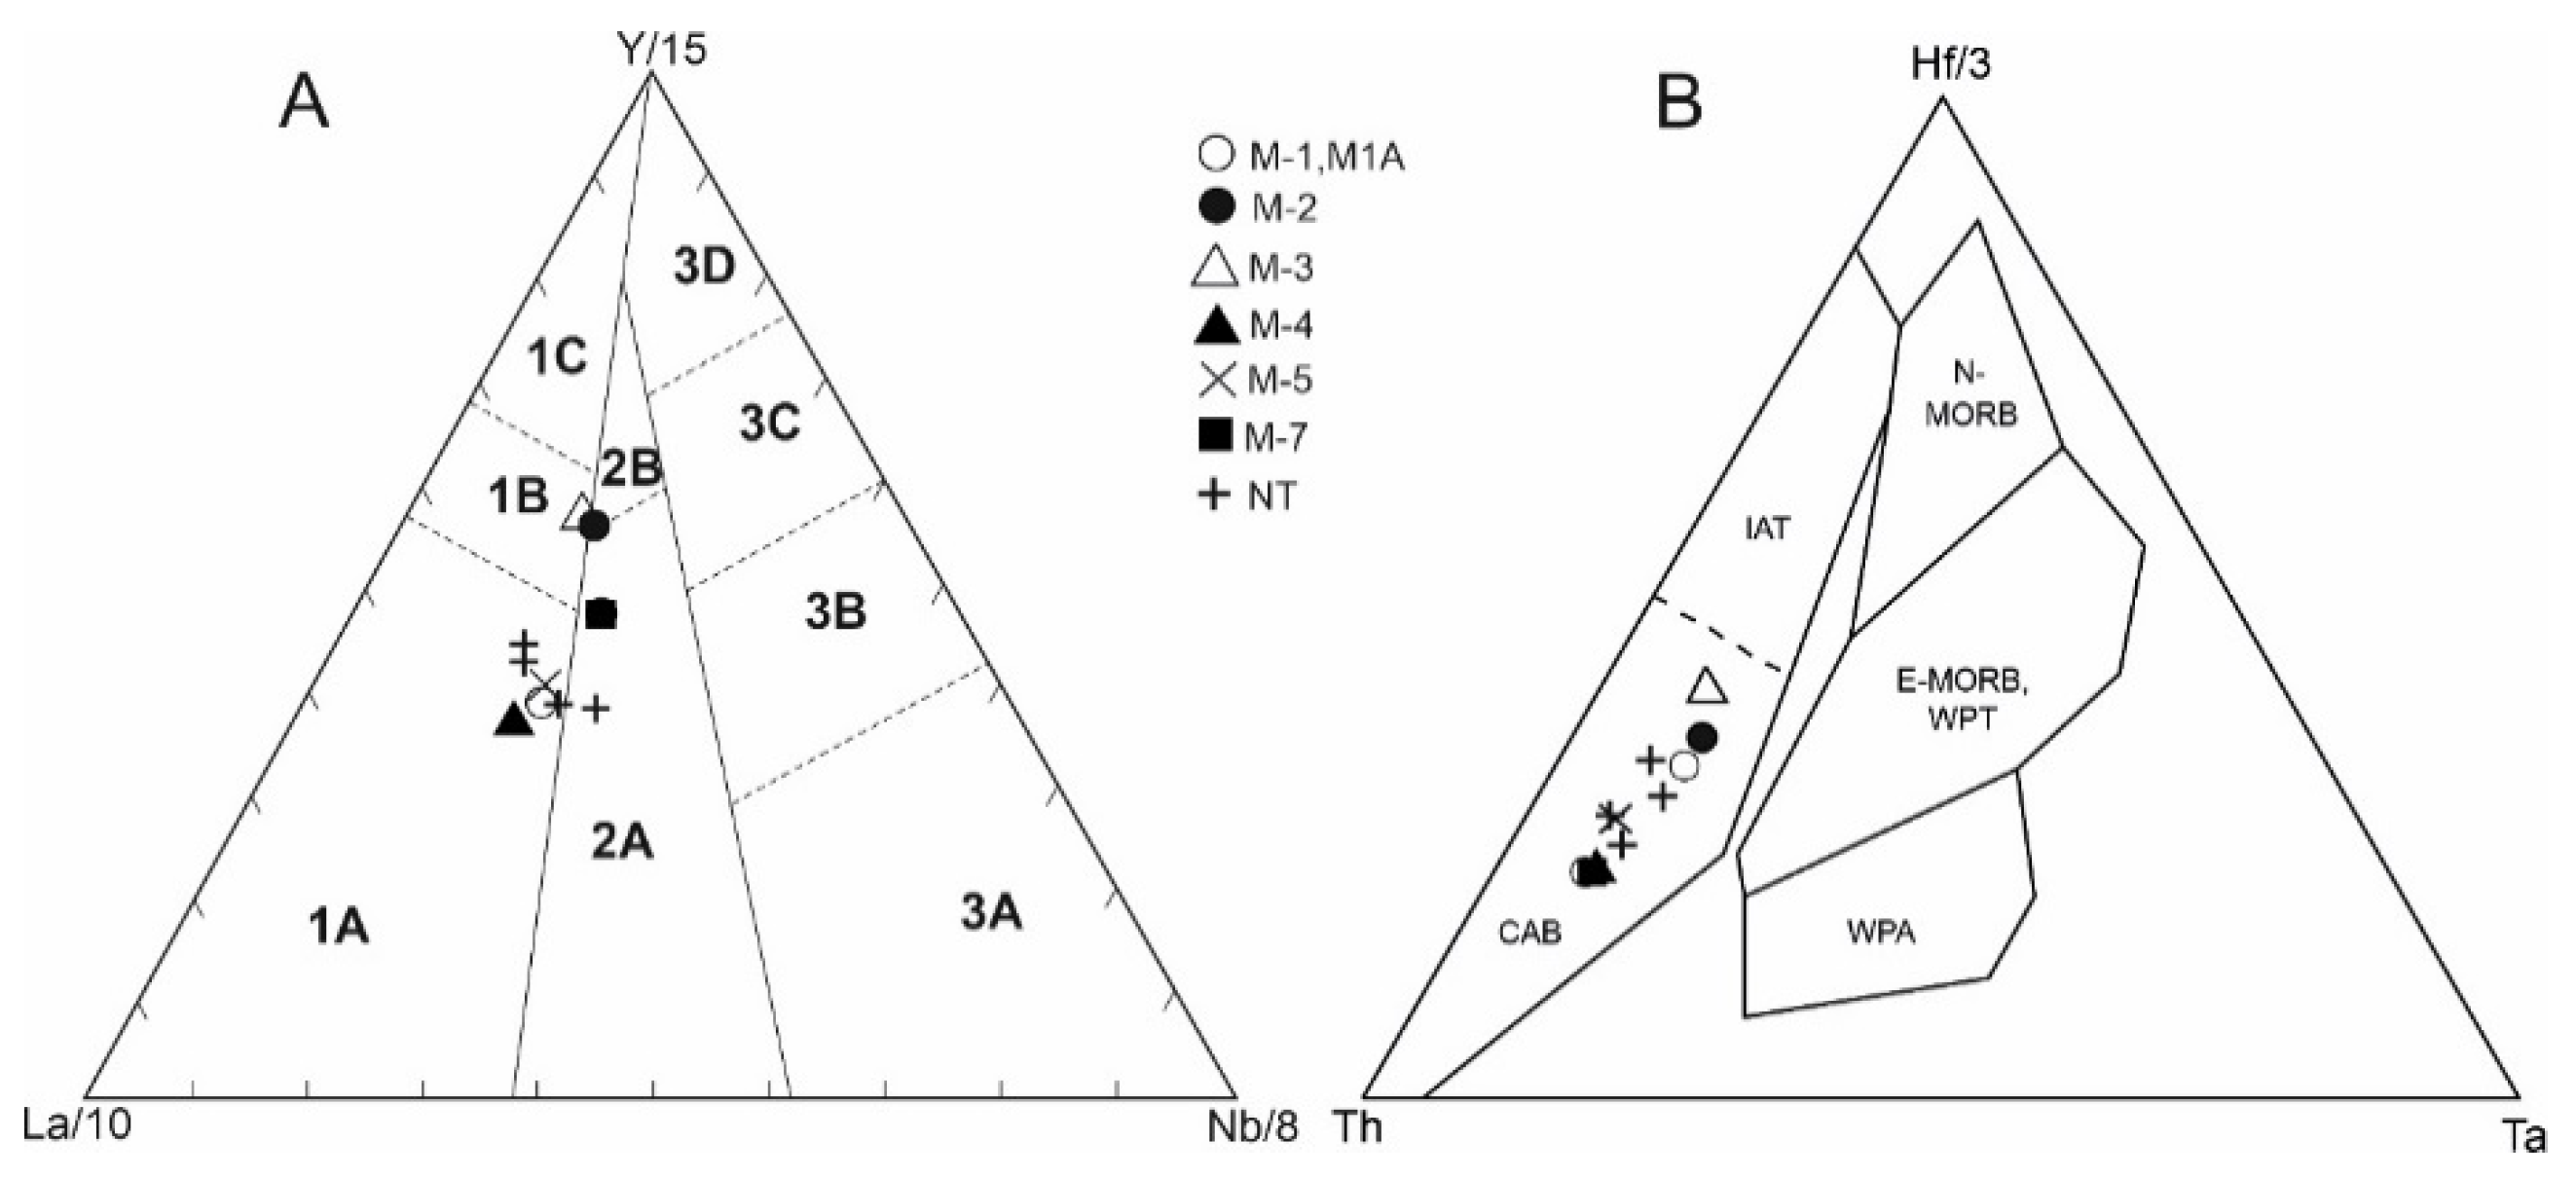
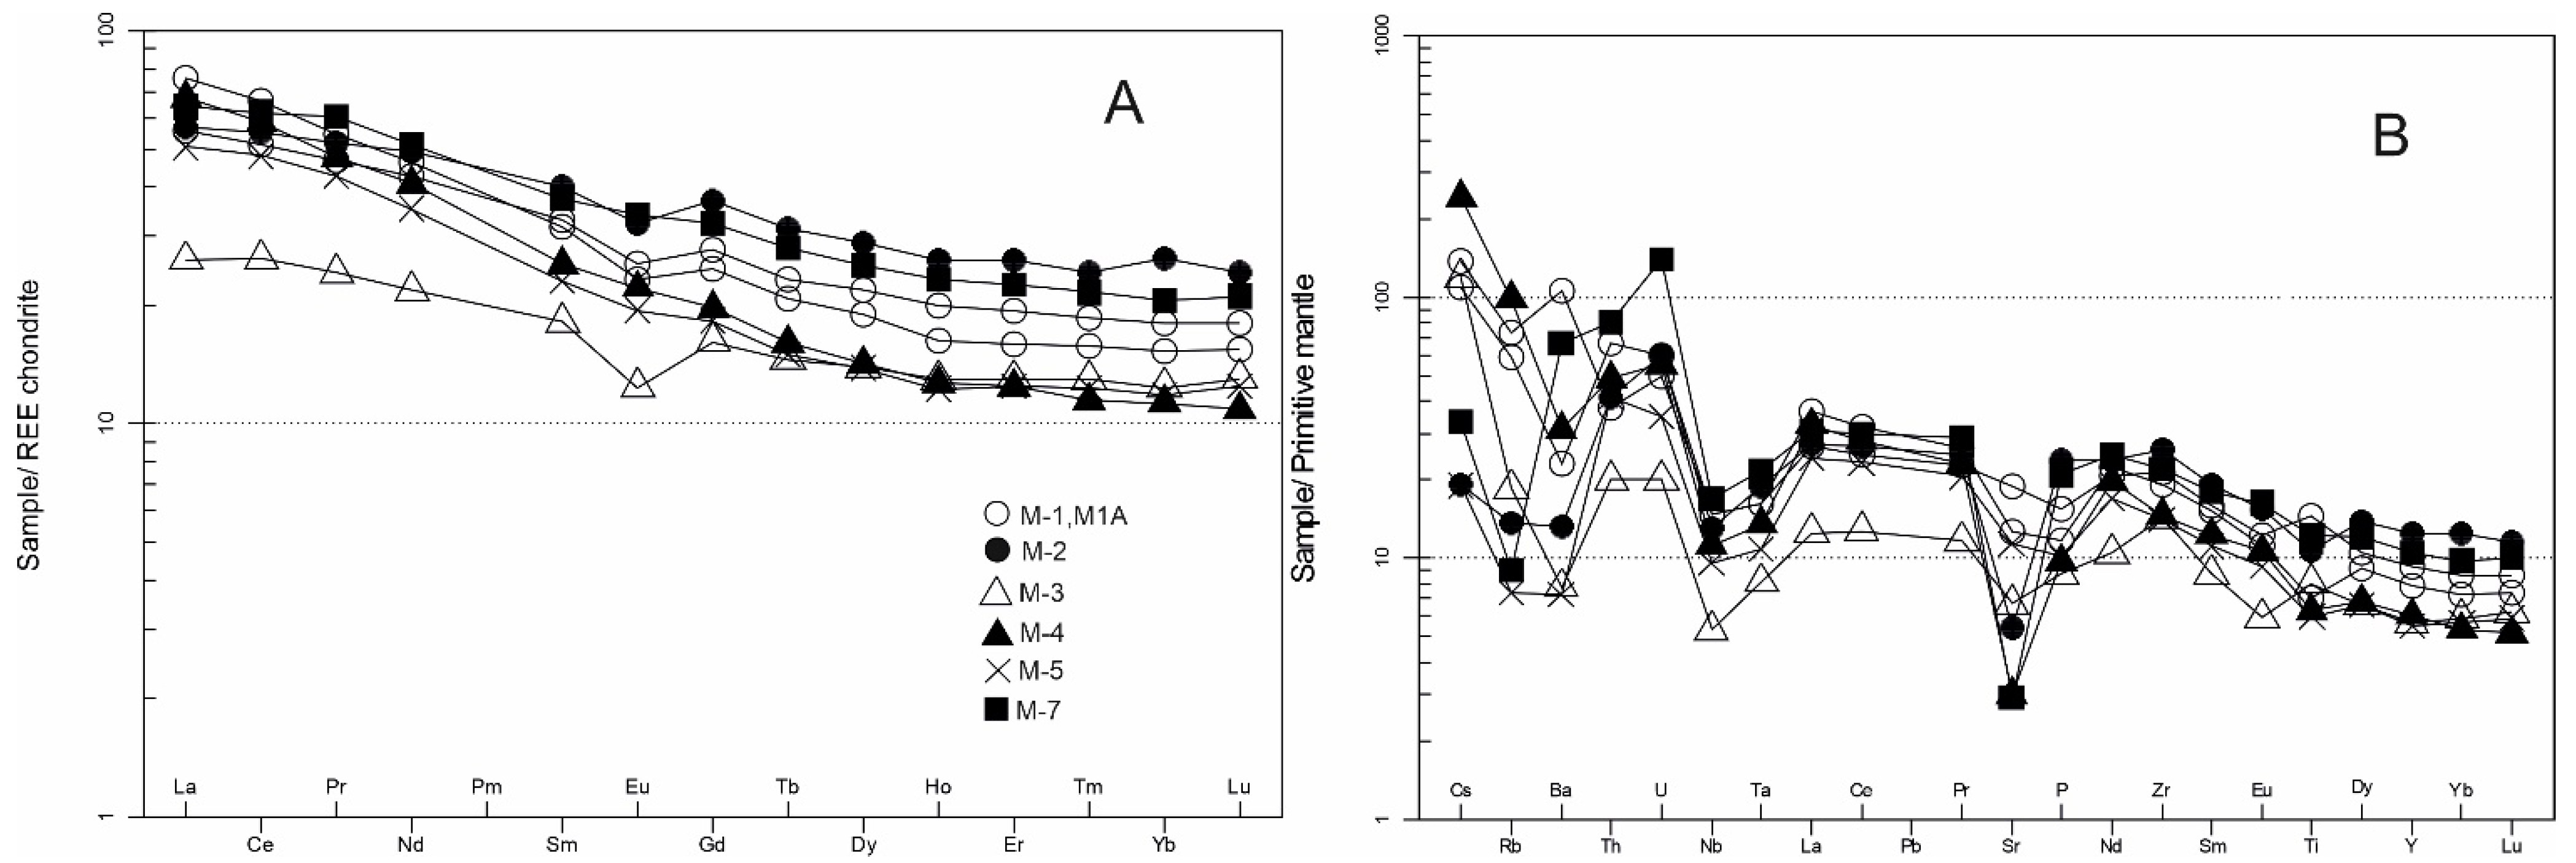
- From the geochemical point of view, the studied rocks can be classified as alkaline–calcium basalts with affinity for continental basalts. The basalts of the Malužina Formation show a significant depletion of Nb and Ta compared to La and Th when normalized to the primitive mantle. They are also depleted of P, which corresponds to the very low content of apatite in the studied volcanics. These features and the very low content of primary amphibole or apatite in the studied volcanics rather indicate a “dry” magmatic source.
- Based on the distribution trace elements and Sr-Nd-Pb isotope composition a magmatic source of EM II type can be assumed. The isotopic composition, depletion of Nb and Ta, and limited variability in the ratios of incompatible elements, indicate only weak crustal assimilation, which could be explained by a rapid ascent of magma to the surface.
- The two eruption phases correspond to two significant extension pulses during the development of the Hronicum original sedimentation basin in Permian. The presumed magmatic source of both eruption phases was identical. The differences indicated by the distribution of REE, incompatible elements, as well as Sr and Pb isotopes, were due to the relatively higher extents of mantle magma contamination by crust material in the volcanics of the first eruption phase.
Author Contributions
Funding
Institutional Review Board Statement
Informed Consent Statement
Data Availability Statement
Acknowledgments
Conflicts of Interest
References
- Ingersoll, R.V.; Busby, C.J. Tectonics of Sedimentary Basins. In Tectonics of Sedimentary Basins; Busby, C.J., Ingersoll, R.V., Eds.; Blackwell Science: Cambridge, UK, 1995; pp. 1–51. [Google Scholar]
- Ingersoll, R.V. Tectonic of sedimentary basins, with revised nomenclature. In Tectonics of Sedimentary Basins: Recent Advances; Busby, C., Ingersoll, R.V., Azor, A., Eds.; Blackwell Ltd.: Chichester, UK, 2012; pp. 3–43. [Google Scholar]
- Vozárová, A.; Vozár, J. Late Paleozoic in West Carpathians; Monogr, D., Ed.; Štátny Geologický ústav Dionýza Štúra: Bratislava, Slovakia, 1988; pp. 1–314, (In English with Slovak summary). [Google Scholar]
- Vozárová, A. Significance of clastic petrofacies for reconstruction of paleotectonic development of the Late Paleozoic in the Western Carpathians. In Sedimentological Problems of the West Carpathians; Sýkora, M., Jablonský, J., Samuel, O., Eds.; Štátny Geologický ústav Dionýza Štúra: Bratislava, Slovakia, 1990; pp. 69–78, (In Slovak with English summary). [Google Scholar]
- Vdacny, M.; Vozárová, A.; Vozár, J. Geochemistry of the Permian sandstones from the Malužiná Formation in the Malé Karpaty Mts (Hronic Unit, Western Carpathians, Slovakia): Implications for source-area weathering, provenance and tectonic setting. Geol. Carpathica 2013, 64, 23–38. [Google Scholar] [CrossRef] [Green Version]
- Vozárová, A.; Frank, W.; Kráľ, J.; Vozár, J. 40Ar/39Ar dating of detrital mica from the Upper Paleozoic sandstones in the Western Carpathians (Slovakia). Geol. Carpath. 2005, 56, 463–472. [Google Scholar]
- Vozárová, A.; Konečný, P.; Vdacny, M.; Vozár, J.; Šarinová, K. Provenance of Permian Malužiná Formation sandstones (Hronicum, Western Carpathians): Evidence from monazite geochronology. Geol. Carpathica 2014, 65, 329–341. [Google Scholar] [CrossRef] [Green Version]
- Vozárová, A.; Larionov, A.; Šarinová, K.; Vďačný, M.; Lepekhina, E.; Vozár, J.; Lvov, P. Detrital zircons from the Hronicum Carboniferous-Permian sandstones (Western Carpathians, Slovakia): Depositional age and provenance. Int. J. Earth Sci. 2018, 107, 1539–1555. [Google Scholar] [CrossRef]
- Vozár, J. Magmatic rocks of the tholeiite series in the Permian of the Choč nappe in the West Carpathians. Miner. Slovaca 1977, 9, 241–258, (In Slovak with English summary). [Google Scholar]
- Vozár, J. Rift-related volcanism in the Permian of the Western Carpathians. In Geological Evolution of the Western Carpathians; Grecula, P., Hovorka, D., Putiš, M., Eds.; Mineralia Slovaca: Bratislava, Slovaca, 1997; pp. 225–234. [Google Scholar]
- Dostal, J.; Vozár, J.; Keppie, J.D.; Hovorka, D. Permian volcanism in the Central Western Carpathians (Slovakia): Basin-and-Range type rifting in the southern Laurussian margin. Acta Diabetol. 2003, 92, 27–35. [Google Scholar] [CrossRef]
- Andrusov, D. Grundriss der Tektonik der Nördlichen Karpaten; Slovak Academy of Sciences: Bratislava, Slovakia, 1968; p. 188. [Google Scholar]
- Andrusov, D.; Bystrický, J.; Fusán, O. Outline of the structure of the West Carpathians. In Guide Book for Geological Excursion, Xth Congress of Carpathian–Balkan Association, Czechoslovakia; Dionýz Štúr Geological Institute: Bratislava, Slovakia, 1973; pp. 1–44. [Google Scholar]
- Biely, A.; Bezák, V.; Elečko, M.; Gross, P.; Kaličiak, M.; Konečný, V.; Lexa, J.; Mello, J.; Nemčok, J.; Potfaj, M.; et al. Explanation to Geological Map of Slovakia, 1:500,000; Dionýz Štúr Publishers: Bratislava, Slovakia, 1996; pp. 1–76. [Google Scholar]
- Biely, A.; Bezák, V.; Elečko, M.; Gross, P.; Kaličiak, M.; Konečný, V.; Lexa, J.; Mello, J.; Nemčok, J.; Potfaj, M.; et al. Geological map of Slovakia; Ministry of the Environment of Slovak Republic; Geological Survey of Slovak Republic: Bratislava, Slovak, 1996. [Google Scholar]
- Andrusov, D. Gedanken über das alpin-karpatische Falten-Decken-System. Geol. Sborník 1960, 6, 171–178, (In Slovak with German summary). [Google Scholar]
- Biely, A.; Fusán, O. Zum Problem der Wurzelzonen der subtatrischen Decken. Geol. Práce Správy 1967, 42, 51–64. [Google Scholar]
- Rakús, M.; Potfaj, M.; Vozárová, A. Basic paleogeographic and paleotectonic units of the Western Carpathians. In Geodynamic Development of the Western Carpathians; Rakús, M., Ed.; Štátny geologický ústav Dionýza Štúra: Bratislava, Slovakia, 1998; pp. 15–26. [Google Scholar]
- Biely, A.; Bezák, V. (Eds.) Explanation to Geological Map of the Nízke Tatry Mts, 1:50,000; Geological survey of Slovak Republic: Bratislava, Slovak, 1997; pp. 1–232, (In Slovak with English summary). [Google Scholar]
- Andrusov, D. Les nappes subtatriques des Carpathes occidentales. Carpatica 1936, 1, 3–50, (In Czech with French summary). [Google Scholar]
- Vozárová, A.; Vozár, J. Crystalline complex in the basal part of Choč nappe. Geol. Práce Správy 1979, 72, 195–197, (In Slovak with English summary). [Google Scholar]
- Vozárová, A.; Vozár, J. Lithostratigraphical subdivision of Late Paleozoic sequences of the Hronic unit. Miner. Slovaca 1981, 13, 385–403, (In Slovak with English summary). [Google Scholar]
- Menning, M.; Hendrich, A. (Eds.) Stratigraphic Table of Germany Compact 2012 (STDKe 2012); Deutsche Stratigraphische Komission: Potsdam, Germany, 2012. [Google Scholar]
- Sitár, V.; Vozár, J. Die ersten Makrofloren-Funde in dem Karbon der Choč-Einheit in der Niederen Tatra (Westkarpaten). Geol. Zborn. Geol. Carpath. 1973, 24, 441–448. [Google Scholar]
- Planderová, E. Biostratigraphical evaluation of the Carboniferous of the Choč nappe, based on palynology. Geol. Práce Správy 1979, 72, 31–59, (In Slovak with English summary). [Google Scholar]
- Vozár, J. Structure of Permian Choč volcanites at the northern slope of the Nízke Tatry Mts. Miner. Petrol. Geochem. Lož. 1974, 1, 1–49. (In Slovak) [Google Scholar]
- Planderová, E. Palynological research in the melaphyre series of the Choč unit in the NE part of Nízke Tatry between Spišský Štiavnik and Vikartovce. Geol. Práce Správy 1973, 60, 143–168, (In Slovak with English summary). [Google Scholar]
- Planderová, E.; Vozárová, A. Biostratigraphical correlation of Late Paleozoic formations in the West Carpathians. In Correlation of Prevariscan and Variscan Events of the Alpine-Mediterranean Mountain Belt; Sassi, F.P., Varga, I., Eds.; Newsletter 4, IGCP Pr. No. 5, Košice-Padova; State Geological Institute of Dionýz Štúr: Bratislava, Slovakia, 1982; pp. 67–71. [Google Scholar]
- Izart, A. The 343 IGCP Working Group. Stratigraphic correlations between the continental and marine Tethyan and Peri-Tethyan basins during the Late Carboniferous and the Early Permian. Geodiversitas 1998, 20, 521–596. [Google Scholar]
- Rojkovič, I. Uranium Mineralization in Slovakia; Univerzita Komenského: Bratislava, Slovakia, 1997; pp. 1–117. [Google Scholar]
- Menning, M. A Numerical Time Scale for the Permian and Triassic Periods: An Integrated Time Analysis. In The Permian of Northern Pangea; Scholle, P.A., Peryt, T.M., Ulmer-Sholle, D.S., Eds.; Springer: Berlin, Germany, 1995; Volume 1, pp. 77–97. [Google Scholar]
- Menning, M. A Permian Time Scale 2000 and correlation of marine and continental sequences using the Illawarra Reversal (265 Ma). In Permian Continental Deposits of Europe and other Areas. Regional Reports and Correlations; Cassinis, G., Ed.; Natura Bresciana: Brescia, Italy, 2001; pp. 355–362. [Google Scholar]
- Vrána, S.; Vozár, J. Mineral assemblage pumpellyite-prehnite-quartz facies from Nízke Tatry Mts. Geol. Práce Správy 1969, 49, 91–99. (In Slovak) [Google Scholar]
- Plašienka, D.; Janák, M.; Hacura, A.; Vrbatovič, P. First illite crystallinity data from Alpine metamorphosed rocks of the Veporicum, Central West Carpathians. Miner. Slovaca 1989, 21, 43–51, (In Slovak with English summary). [Google Scholar]
- Šucha, V.; Eberl, D.D. Burial metamorphism of Permian sediments in the Northern Gemeric and Hronic units, West Carpathians. Miner. Slovaca 1992, 24, 399–405. [Google Scholar]
- Frei, R.; Polat, A. Chromium isotope fractionation during oxidative weathering—Implications from the study of a Paleoproterozoic (ca. 1.9Ga) paleosol, Schreiber Beach, Ontario, Canada. Precambrian Res. 2013, 224, 434–453. [Google Scholar] [CrossRef]
- Wu, T.; Polat, A.; Frei, R.; Fryer, B.J.; Yang, K.-G.; Kusky, T. Geochemistry, Nd, Pb and Sr isotope systematics, and U–Pb zircon ages of the Neoarchean Bad Vermilion Lake greenstone belt and spatially associated granitic rocks, western Superior Province, Canada. Precambrian Res. 2016, 282, 21–51. [Google Scholar] [CrossRef] [Green Version]
- Todt, W.; Cliff, R.; Hanser, A.; Hofmann, A.W. Evaluation of a202Pb-205Pb Double Spike for High Precision Lead Isotope Analysis. Large Igneous Prov. 2013, 95, 429–437. [Google Scholar] [CrossRef]
- Thirlwall, M. Long-term reproducibility of multicollector Sr and Nd isotope ratio analysis. Chem. Geol. Isot. Geosci. Sect. 1991, 94, 85–104. [Google Scholar] [CrossRef]
- Thomson, S.N.; Gehrels, G.E.; Ruiz, J.; Buchwaldt, R. Routine low-damage apatite U-Pb dating using laser ablation-multicollector-ICPMS. Geochem. Geophys. Geosystems 2012, 13. [Google Scholar] [CrossRef]
- Cochrane, R.; Spikings, R.; Chew, D.; Wotzlaw, J.-F.; Chiaradia, M.; Tyrrell, S.; Schaltegger, U.; Van der Lelij, R. High temperature (>350 °C) thermochronology and mechanisms of Pb loss in apatite. Geochim. Cosmochim. Acta 2014, 127, 39–56. [Google Scholar] [CrossRef]
- Chew, D.M.; Donelick, R.A. Combined apatite fission track and U–Pb dating by LA-ICP MS and future trends in apatite provenance analysis. In Quantitative Mineralogy and Microanalysis of Sediments and Sedimentary Rocks; Sylvester, P., Ed.; International Mineralogical Association: Vancouver, Canada, 2012; Chapter 12; pp. 219–248. [Google Scholar]
- Schoene, B.; Bowring, S.A. U–Pb systematics of the McClure Mountain syenite: Thermochronological constraints on the age of the 40Ar/39Ar standard MMhb. Contrib. Miner. Pet. 2006, 151, 615–630. [Google Scholar] [CrossRef]
- McDowell, F.W.; McIntosh, W.C.; Farley, K. A precise 40Ar–39Ar reference age for the Durango apatite (U–Th)/He and fission-track dating standard. Chem. Geol. 2005, 214, 249–263. [Google Scholar] [CrossRef]
- Petrus, J.A.; Kamber, B. VizualAge: A Novel Approach to Laser Ablation ICP-MS U-Pb Geochronology Data Reduction. Geostand. Geoanalytical Res. 2012, 36, 247–270. [Google Scholar] [CrossRef]
- Paton, C.; Hellstrom, J.; Paul, B.; Woodhead, J.; Hergt, J. Iolite: Freeware for the visualisation and processing of mass spectrometric data. J. Anal. At. Spectrom. 2011, 26, 2508–2518. [Google Scholar] [CrossRef]
- Chew, D.; Petrus, J.; Kamber, B. U–Pb LA–ICPMS dating using accessory mineral standards with variable common Pb. Chem. Geol. 2014, 363, 185–199. [Google Scholar] [CrossRef]
- Locock, A. An Excel spreadsheet to classify chemical analyses of amphiboles following the IMA 2012 recommendations. Comput. Geosci. 2014, 62, 1–11. [Google Scholar] [CrossRef]
- Morimoto, N.; Fabries, J.; Ferguson, A.K.; Ginzburg, I.V.; Ross, M.; Seifert, F.A.; Zussman, J.; Aoki, K.; Gottardi, G. Nomenclature of Pyroxenes. Miner. Mag. 1988, 52, 535–550. [Google Scholar] [CrossRef]
- Hawthorne, C.F.; Oberti, R.; Harlow, G.E.; Maresch, V.W.; Martin, F.R.; Schumacher, C.J.; Welch, D.M. Nomenclature of the amphibole supergroup. Amer. Mineral. 2012, 97, 2031–2048. [Google Scholar] [CrossRef]
- Rieder, M.; Cavazzini, G.; D’Yakonov, Y.S.; Frank-Kamenetskii, V.A.; Gottardi, G.; Guggenheim, S.; Koval, P.V.; Müller, G.; Neiva, A.M.R.; Radoslovich, E.W.; et al. Nomenclature of micas. Canad. Mineral. 1998, 36, 905–912. [Google Scholar] [CrossRef]
- Abdel-Rahman, A.-F.M. Nature of Biotites from Alkaline, Calc-alkaline, and Peraluminous Magmas. J. Pet. 1994, 35, 525–541. [Google Scholar] [CrossRef]
- Spišiak, J.; Pitoňák, P. Pumpellyites from the granodiorites and gneisses of the Nízke Tatry Mts. Crystalline Complex. Acta Geol. Geogr. Univ. Comen. Geol. 1993, 49, 23–27. [Google Scholar]
- Lenaz, D.; Kamenetsky, V.S.; Crawford, A.J.; Princivalle, F. Melt inclusions in detrital spinel from the SE Alps (Italy-Slovenia): A new approach to provenance studies of sedimentary basins. Contrib. Miner. Pet. 2000, 139, 748–758. [Google Scholar] [CrossRef]
- Kamenetsky, V.; Crawford, A.J.; Meffre, S. Factors Controlling Chemistry of Magmatic Spinel: An Empirical Study of Associated Olivine, Cr-spinel and Melt Inclusions from Primitive Rocks. J. Pet. 2001, 42, 655–671. [Google Scholar] [CrossRef] [Green Version]
- Winchester, J.; Floyd, P. Geochemical discrimination of different magma series and their differentiation products using immobile elements. Chem. Geol. 1977, 20, 325–343. [Google Scholar] [CrossRef] [Green Version]
- Wood, D. The application of a ThHfTa diagram to problems of tectonomagmatic classification and to establishing the nature of crustal contamination of basaltic lavas of the British Tertiary Volcanic Province. Earth Planet. Sci. Lett. 1980, 50, 11–30. [Google Scholar] [CrossRef]
- Cabanis, B.; Lecolle, M. Le diagramme La/10-Y/15-Nb/8: Un outil pour la discrimination des séries volcaniques et la mise en évidence des procésses de mélange et/ou de contamination crustale. C. R. Acad. Sci. 1989, 2, 2023–2029. [Google Scholar]
- McDonough, W.; Sun, S.-S. The composition of the Earth. Chem. Geol. 1995, 120, 223–253. [Google Scholar] [CrossRef]
- Le Maitre, R.W.; Bateman, P.; Dudek, A.; Keller, J.; Lameyre, J.; Le Bas, M.J.; Sabine, P.A.; Schmid, R.; Sorensen, H.; Streckeisen, A.; et al. A Classification of Igneou Rocks and Glossary of Terms: Recommendations of the International Union of Geological Sciences Subcommision on the Systematics of Igneous Rocks; Blackwell Science Publishing: Cambridge, UK, 1989; p. 193. [Google Scholar]
- Vozár, J.; Spišiak, J.; Vozárová, A.; Bazarnik, J.; Krái, J. Geochemistry and Sr, Nd isotopic composition of the Hronic Upper Paleozoic basic rocks (Western Carpathians, Slovakia). Geol. Carpathica 2015, 66, 3–17. [Google Scholar] [CrossRef] [Green Version]
- McDonough, W.; Sun, S.-S.; Ringwood, A.; Jagoutz, E.; Hofmann, A. Potassium, rubidium, and cesium in the Earth and Moon and the evolution of the mantle of the Earth. Geochim. Et Cosmochim. Acta 1992, 56, 1001–1012. [Google Scholar] [CrossRef]
- Zindler, A.; Hart, S.R. Chemical geodynamics. Ann. Rev. Earth Planet. Sci. 1986, 14, 493–571. [Google Scholar] [CrossRef]
- Hart, S.R.; Hauri, E.H.; Oschmann, L.A.; Whitehead, J.A.; Hart, S.R.; Hauri, E.H.; Oschmann, L.A.; Whitehead, J.A. Mantle Plumes and Entrainment: Isotopic Evidence. Science 1992, 256, 517–520. [Google Scholar] [CrossRef] [PubMed]
- Willbold, M.; Stracke, A. Formation of enriched mantle components by recycling of upper and lower continental crust. Chem. Geol. 2010, 276, 188–197. [Google Scholar] [CrossRef]
- Kimura, J.; Gill, J.B.; Skora, S.; Van Keken, P.E.; Kawabata, H. Origin of geochemical mantle components: Role of subduction filter. Geochem. Geophys. Geosystems 2016, 17, 3289–3325. [Google Scholar] [CrossRef]
- Faure, G. Principles of Isotope Geology, 2nd ed.; John Wiley & Sons: New York, NY, USA, 1986; p. 589. [Google Scholar]
- Romer, R.L.; Hahne, K. Life of the Rheic Ocean: Scrolling through the shale record. Gondwana Res. 2010, 17, 236–253. [Google Scholar] [CrossRef]
- Zartman, R.; Doe, B. Plumbotectonics—The model. Tectonophysics 1981, 75, 135–162. [Google Scholar] [CrossRef]
- Sommer, C.A.; Barreto, C.J.S.; Lafon, J.M.; Lima, E.F.D.; Alexandre, F.M.; Chemale, F.; Koester, E. Pb isotope geochemistry and reappraisal of Sr-Nd isotopes of the Cerro Morado basic magmatism (Ischigualasto-Villa Union Triassic basin, NW Argentina): Implications for the mantle sources. Braz. J. Geol. 2018, 48, 115–126. [Google Scholar] [CrossRef]
- Zou, H. Quantitative Geochemistry; Imperial College Press: London, UK, 2007; p. 287. [Google Scholar]
- Hofmann, A.W. Chemical differentiation of the Earth: The relationship between mantle, continental crust, and oceanic crust. Earth Planet. Sci. Lett. 1988, 90, 297–314. [Google Scholar] [CrossRef] [Green Version]
- Ito, E.; White, W.M.; Göpel, C. The O, Sr, Nd and Pb isotope geochemistry of MORB. Chem. Geol. 1987, 62, 157–176. [Google Scholar] [CrossRef]
- Taylor, S.R.; McLennan, S. The geochemical evolution of the continental crust. Rev. Geophys. 1995, 33, 241–265. [Google Scholar] [CrossRef]
- Linnemann, U.; Romer, R.L. The Cadomian Orogeny in Saxo-Thuringia, Germany: Geochemical and Nd–Sr–Pb isotopic characterization of marginal basins with constraints to geotectonic setting and provenance. Tectonophysics 2002, 352, 33–64. [Google Scholar] [CrossRef]
- Abdelfadil, K.; Romer, R.; Seifert, T.; Lobst, R. Calc-alkaline lamprophyres from Lusatia (Germany)—Evidence for a repeatedly enriched mantle source. Chem. Geol. 2013, 353, 230–245. [Google Scholar] [CrossRef]
- Hawkesworth, C.J.; Mantovani, M.S.M.; Taylor, P.N.; Palacz, Z. Evidence from the Parana of south Brazil for a continental contribution to Dupal basalts. Nat. Cell Biol. 1986, 322, 356–359. [Google Scholar] [CrossRef]
- Marques, L.S.; Dupré, B.; Piccirillo, E. Mantle source compositions of the Paraná Magmatic Province (southern Brazil): Evidence from trace element and Sr–Nd–Pb isotope geochemistry. J. Geodyn. 1999, 28, 439–458. [Google Scholar] [CrossRef]
- Lassiter, J.C.; DePaolo, D.J. Plume/Lithosphere Interaction in the Generation of Continental and Oceanic Flood Basalts: Chemical and Isotopic Constraints. In Large Igneous Provinces; American Geophysical Union (AGU): Washington, DC, USA, 2013; Volume 100, pp. 335–355. [Google Scholar]
- Vozárová, A.; Túnyi, I. Evidence of the Illawarra Reversal in the Permian sequence of the Hronic Nappe (Western Carpathians, Slovakia). Geol. Carpath. 2003, 54, 229–236. [Google Scholar]
- Deroin, J.P.; Bonin, B. Late Variscan tectonomagmatic activity in Western Europe and surrounding areas: The mid-Permian Episode. Boll. Soc. Geol. It. 2003, 2, 169–184. [Google Scholar]


| Sample No. | Rock Type | Sample Locality | GPS Coordinates |
|---|---|---|---|
| M-1 | coarse-grained gabbro-diorite dyke | Malužinská dolina Valley, cliff on the right slope of the forest road 812 m a.s.l. | 48°57.182′ N 19°48.783′ E |
| M-1A | fine-grained gabbro-diorite dyke | Malužinská dolina Valley, cliff on the right slope of the forest road 812 m a.s.l. | 48°57.182′ N 19°48.783′ E |
| M-2 | andesite/basalt-2nd eruption phase | Hodruša Valley, SE from the Malužiná Village, cliff on the right slope of the forest road, 870m a.s.l. | 48°57.552′ N 19°50.051′ E |
| M-3 | andesite/basalt-2nd eruption phase | Malužinská dolina Valley, forest road cut, 1.4 km SE from Malužiná Village, 770 m a.s.l. | 48°57.544′ N 19°50.091′ E |
| M-4 | andesite/basalt-1st eruption phase | N from the Liptovská Teplička Village, abandoned quarry along the Šuňava-Liptovská Teplička road, 890 m a.s.l. | 48°59.038′ N 20°05.353′ E |
| M-5 | basaltic andesite-1st eruption phase | Benkovský potok Valley, small quarry at the left side of the forest road, 832 m a.s.l. | 49°00.468′ N 19°59.747′ E |
| M-7 | basaltic andesite-1st eruption phase | S from the Hranovnica Village, forest road at the left slope of the Vernár-Hranovnica state road, 694 m a.s.l. | 48°57.970′ N 20°17.566′ E |
| M-8 | coarse-grained gabbro-diorite dyke | West end of the Nižná Boca Village, 860 m a.s.l. | 48°56.915′ N 19°46.157′ E |
| M-9 | andesite/basalt-2nd eruption phase | Kvetnica quarry, 725 m a.s.l. | 49°00.521′ N 20°17.085′ E |
| Sample | M-1 | M-8 | M-1 | M-8 | M-9 | |||||||||||||
|---|---|---|---|---|---|---|---|---|---|---|---|---|---|---|---|---|---|---|
| Figures | 2a | 2b | 2c | 2e | 2f | |||||||||||||
| Anal. N. | 1 | 2 | 3 | 4 | 5 | 6 | 7 | 8 | 9 | 10 | 11 | 12 | 13 | 14 | 15 | 16 | 17 | 18 |
| SiO2 | 51.74 | 50.34 | 50.46 | 52.08 | 50.23 | 50.15 | 50.84 | 50.23 | 50.50 | 51.84 | 51.82 | 51.15 | 50.97 | 50.78 | 50.43 | 50.73 | 50.92 | 50.83 |
| TiO2 | 1.05 | 1.53 | 1.56 | 1.97 | 1.45 | 1.58 | 0.97 | 3.34 | 3.41 | 2.33 | 2.15 | 1.82 | 1.00 | 1.27 | 1.35 | 1.19 | 1.31 | 0.80 |
| Al2O3 | 1.65 | 2.60 | 2.63 | 0.71 | 2.69 | 2.90 | 2.13 | 1.09 | 0.80 | 0.68 | 0.78 | 0.79 | 2.29 | 2.13 | 2.39 | 2.13 | 2.34 | 2.40 |
| Cr2O3 | 0.03 | 0.00 | 0.08 | 0.50 | 0.00 | 0.16 | 0.05 | 0.83 | 0.93 | 0.37 | 0.09 | 0.00 | 0.23 | 0.08 | 0.14 | 0.04 | 0.17 | 0.52 |
| FeO+ | 10.87 | 10.21 | 9.91 | 5.90 | 9.68 | 9.31 | 11.23 | 6.03 | 6.04 | 4.57 | 6.61 | 8.95 | 10.65 | 10.43 | 9.63 | 10.57 | 10.03 | 9.28 |
| MnO | 0.24 | 0.30 | 0.17 | 0.13 | 0.30 | 0.23 | 0.24 | 0.11 | 0.20 | 0.09 | 0.10 | 0.26 | 0.22 | 0.23 | 0.18 | 0.16 | 0.09 | 0.23 |
| MgO | 13.37 | 14.24 | 14.10 | 17.60 | 13.98 | 13.78 | 13.55 | 16.28 | 16.62 | 17.06 | 16.83 | 15.89 | 16.60 | 15.41 | 15.64 | 14.74 | 15.83 | 17.04 |
| CaO | 19.75 | 19.53 | 19.06 | 20.80 | 19.28 | 19.77 | 19.40 | 21.35 | 21.13 | 21.24 | 21.30 | 20.28 | 17.35 | 19.11 | 19.18 | 19.51 | 18.86 | 17.35 |
| Na2O | 0.26 | 0.27 | 0.32 | 0.19 | 0.33 | 0.34 | 0.32 | 0.25 | 0.22 | 0.18 | 0.18 | 0.25 | 0.25 | 0.22 | 0.27 | 0.23 | 0.21 | 0.22 |
| K2O | 0.00 | 0.00 | 0.00 | 0.01 | 0.00 | 0.00 | 0.00 | 0.00 | 0.00 | 0.00 | 0.01 | 0.00 | 0.01 | 0.00 | 0.01 | 0.00 | 0.00 | 0.01 |
| Total | 98.96 | 99.02 | 98.28 | 99.88 | 97.93 | 98.22 | 98.73 | 99.51 | 99.84 | 98.36 | 99.88 | 99.38 | 99.57 | 99.63 | 99.22 | 99.29 | 99.75 | 98.69 |
| Formula based on 6 oxygens | ||||||||||||||||||
| Si | 1.964 | 1.899 | 1.917 | 1.916 | 1.914 | 1.906 | 1.931 | 1.870 | 1.874 | 1.936 | 1.914 | 1.911 | 1.896 | 1.897 | 1.886 | 1.906 | 1.895 | 1.899 |
| Ti | 0.030 | 0.043 | 0.045 | 0.054 | 0.042 | 0.045 | 0.028 | 0.094 | 0.095 | 0.065 | 0.060 | 0.051 | 0.028 | 0.036 | 0.038 | 0.034 | 0.037 | 0.023 |
| Al | 0.074 | 0.115 | 0.118 | 0.031 | 0.121 | 0.130 | 0.095 | 0.048 | 0.035 | 0.030 | 0.034 | 0.035 | 0.101 | 0.094 | 0.105 | 0.094 | 0.102 | 0.106 |
| Cr | 0.001 | 0.000 | 0.002 | 0.028 | 0.000 | 0.005 | 0.001 | 0.019 | 0.016 | 0.000 | 0.029 | 0.059 | 0.063 | 0.055 | 0.063 | 0.042 | 0.044 | 0.052 |
| Fe3+ | 0.000 | 0.019 | 0.000 | 0.015 | 0.000 | 0.000 | 0.010 | 0.024 | 0.027 | 0.011 | 0.003 | 0.000 | 0.007 | 0.002 | 0.004 | 0.001 | 0.005 | 0.015 |
| Fe2+ | 0.345 | 0.303 | 0.315 | 0.153 | 0.308 | 0.296 | 0.347 | 0.169 | 0.171 | 0.143 | 0.175 | 0.221 | 0.268 | 0.271 | 0.238 | 0.290 | 0.268 | 0.238 |
| Mn | 0.008 | 0.010 | 0.006 | 0.004 | 0.010 | 0.008 | 0.008 | 0.003 | 0.006 | 0.003 | 0.003 | 0.008 | 0.007 | 0.007 | 0.006 | 0.005 | 0.003 | 0.007 |
| Mg | 0.757 | 0.801 | 0.798 | 0.965 | 0.794 | 0.781 | 0.767 | 0.903 | 0.919 | 0.950 | 0.927 | 0.885 | 0.921 | 0.858 | 0.872 | 0.826 | 0.879 | 0.949 |
| Ca | 0.803 | 0.789 | 0.776 | 0.820 | 0.787 | 0.805 | 0.790 | 0.851 | 0.840 | 0.850 | 0.843 | 0.812 | 0.691 | 0.765 | 0.768 | 0.786 | 0.752 | 0.694 |
| Na | 0.019 | 0.020 | 0.023 | 0.014 | 0.024 | 0.025 | 0.024 | 0.018 | 0.016 | 0.013 | 0.013 | 0.018 | 0.018 | 0.016 | 0.019 | 0.017 | 0.015 | 0.016 |
| K | 0.000 | 0.000 | 0.000 | 0.000 | 0.000 | 0.000 | 0.000 | 0.000 | 0.000 | 0.000 | 0.000 | 0.000 | 0.000 | 0.000 | 0.000 | 0.000 | 0.000 | 0.000 |
| Wo% | 42.16 | 41.27 | 41.08 | 42.30 | 41.65 | 42.77 | 41.27 | 44.27 | 43.51 | 43.76 | 43.34 | 42.33 | 36.77 | 40.38 | 40.91 | 41.32 | 39.62 | 36.91 |
| En% | 39.72 | 41.88 | 42.26 | 49.80 | 42.03 | 41.50 | 40.09 | 46.97 | 47.61 | 48.89 | 47.66 | 46.15 | 48.96 | 45.32 | 46.42 | 43.42 | 46.27 | 50.44 |
| Fs% | 18.12 | 16.85 | 16.66 | 7.90 | 16.32 | 15.73 | 18.64 | 8.76 | 8.88 | 7.35 | 9.00 | 11.51 | 14.27 | 14.30 | 12.66 | 15.26 | 14.11 | 12.65 |
| Sample | M-1 | M-8 | ||||||||||
|---|---|---|---|---|---|---|---|---|---|---|---|---|
| Anal. N. | 1 | 2 | 3 | 4 | 5 | 6 | 7 | 8 | 9 | 10 | 11 | 12 |
| Figures | 2a | 2b | ||||||||||
| SiO2 | 46.77 | 47.14 | 46.23 | 44.03 | 45.73 | 54.07 | 52.98 | 53.19 | 52.62 | 52.75 | 52.05 | 51.92 |
| TiO2 | 0.20 | 0.40 | 0.52 | 2.79 | 0.42 | 0.13 | 0.07 | 0.01 | 0.00 | 0.00 | 0.01 | 0.04 |
| Al2O3 | 8.55 | 8.43 | 8.89 | 8.86 | 9.85 | 0.61 | 1.58 | 1.74 | 1.44 | 1.52 | 1.68 | 2.05 |
| Cr2O3 | 0.05 | 0.00 | 0.06 | 0.00 | 0.22 | 0.05 | 0.08 | 0.01 | 0.03 | 0.03 | 0.08 | 0.03 |
| FeO+ | 9.10 | 9.23 | 9.61 | 13.41 | 8.38 | 14.57 | 16.32 | 13.49 | 16.60 | 16.63 | 17.49 | 17.54 |
| MnO | 0.09 | 0.15 | 0.14 | 0.18 | 0.05 | 0.35 | 0.45 | 0.49 | 0.49 | 0.39 | 0.60 | 0.55 |
| MgO | 16.91 | 16.47 | 16.51 | 13.27 | 18.33 | 14.66 | 13.84 | 15.82 | 13.33 | 13.34 | 12.35 | 12.14 |
| CaO | 11.16 | 11.72 | 11.40 | 10.62 | 11.75 | 12.44 | 11.80 | 11.59 | 12.00 | 12.25 | 12.13 | 11.97 |
| Na2O | 2.06 | 1.95 | 2.13 | 2.28 | 2.94 | 0.11 | 0.22 | 0.36 | 0.16 | 0.15 | 0.23 | 0.32 |
| K2O | 0.42 | 0.34 | 0.45 | 0.53 | 0.17 | 0.04 | 0.04 | 0.02 | 0.04 | 0.04 | 0.06 | 0.05 |
| Total | 95.29 | 95.83 | 95.93 | 95.96 | 97.83 | 97.02 | 97.37 | 96.71 | 96.70 | 97.12 | 96.69 | 96.59 |
| Formula based on 24 (O, OH, F, Cl,) | ||||||||||||
| Si | 6.824 | 6.867 | 6.738 | 6.588 | 6.496 | 7.898 | 7.756 | 7.724 | 7.776 | 7.759 | 7.740 | 7.731 |
| AlIV | 1.176 | 1.133 | 1.262 | 1.412 | 1.504 | 0.102 | 0.244 | 0.276 | 0.224 | 0.241 | 0.260 | 0.269 |
| T | 8.000 | 8.000 | 8.000 | 8.000 | 8.000 | 8.000 | 8.000 | 8.000 | 8.000 | 8.000 | 8.000 | 8.000 |
| Ti | 0.022 | 0.043 | 0.057 | 0.314 | 0.045 | 0.014 | 0.007 | 0.001 | 0.000 | 0.000 | 0.001 | 0.005 |
| AlVI | 0.294 | 0.315 | 0.265 | 0.150 | 0.145 | 0.003 | 0.028 | 0.021 | 0.026 | 0.023 | 0.035 | 0.090 |
| Cr | 0.006 | 0.000 | 0.006 | 0.000 | 0.025 | 0.006 | 0.010 | 0.002 | 0.003 | 0.004 | 0.010 | 0.003 |
| Fe3+ | 0.445 | 0.300 | 0.425 | 0.217 | 0.631 | 0.056 | 0.184 | 0.247 | 0.188 | 0.206 | 0.202 | 0.156 |
| Mn2+ | 0.000 | 0.000 | 0.000 | 0.000 | 0.000 | 0.006 | 0.000 | 0.000 | 0.000 | 0.002 | 0.042 | 0.024 |
| Fe2+ | 0.556 | 0.764 | 0.661 | 1.360 | 0.272 | 1.723 | 1.752 | 1.305 | 1.847 | 1.839 | 1.973 | 2.027 |
| Mg | 3.677 | 3.578 | 3.586 | 2.959 | 3.882 | 3.192 | 3.020 | 3.424 | 2.936 | 2.926 | 2.737 | 2.694 |
| C | 5.000 | 5.000 | 5.000 | 5.000 | 5.000 | 5.000 | 5.001 | 5.000 | 5.000 | 5.000 | 5.000 | 4.999 |
| Mn2+ | 0.011 | 0.019 | 0.017 | 0.023 | 0.006 | 0.037 | 0.056 | 0.061 | 0.061 | 0.047 | 0.034 | 0.045 |
| Fe2+ | 0.109 | 0.061 | 0.086 | 0.101 | 0.093 | 0.000 | 0.063 | 0.086 | 0.017 | 0.000 | 0.000 | 0.000 |
| Ca | 1.745 | 1.829 | 1.781 | 1.702 | 1.788 | 1.947 | 1.851 | 1.803 | 1.900 | 1.931 | 1.933 | 1.909 |
| Na | 0.136 | 0.091 | 0.117 | 0.173 | 0.113 | 0.016 | 0.031 | 0.051 | 0.023 | 0.022 | 0.033 | 0.046 |
| B | 2.001 | 2.000 | 2.001 | 1.999 | 2.000 | 2.000 | 2.001 | 2.001 | 2.001 | 2.000 | 2.000 | 2.000 |
| Na | 0.446 | 0.459 | 0.485 | 0.488 | 0.696 | 0.016 | 0.031 | 0.051 | 0.023 | 0.022 | 0.034 | 0.046 |
| K | 0.077 | 0.063 | 0.084 | 0.101 | 0.031 | 0.008 | 0.008 | 0.004 | 0.007 | 0.008 | 0.012 | 0.009 |
| A | 0.523 | 0.522 | 0.569 | 0.589 | 0.727 | 0.024 | 0.039 | 0.055 | 0.030 | 0.030 | 0.046 | 0.055 |
| Sample | M1 | M-1 | M-8 | ||||||
|---|---|---|---|---|---|---|---|---|---|
| Mineral | Biotite | Pumpellyite | Prehnite | ||||||
| Anal. N. | 14 | 15 | 17 | 25 | 26 | 2 | 22 | 24 | 27 |
| SiO2 | 37.69 | 37.96 | 36.84 | 37.26 | 37.33 | 37.95 | 37.29 | 43.56 | 43.45 |
| TiO2 | 4.58 | 4.48 | 0.02 | 0.16 | 0.06 | 0.13 | 0.02 | 0.10 | 0.18 |
| Al2O3 | 12.18 | 12.15 | 25.90 | 25.37 | 25.12 | 29.85 | 26.89 | 24.52 | 24.51 |
| Cr2O3 | 0.00 | 0.00 | |||||||
| FeO+ | 16.55 | 17.19 | 3.07 | 3.33 | 3.08 | 0.71 | 2.47 | 0.27 | 0.15 |
| MnO | 0.04 | 0.00 | 0.14 | 0.08 | 0.00 | 0.04 | 0.15 | 0.00 | 0.00 |
| MgO | 13.40 | 13.11 | 1.71 | 2.29 | 2.28 | 0.09 | 1.98 | 0.00 | 0.03 |
| CaO | 0.00 | 0.03 | 22.10 | 22.30 | 22.36 | 23.45 | 23.31 | 27.36 | 27.27 |
| BaO | 0.17 | 1.43 | 0.01 | 0.00 | 0.00 | 0.00 | 0.00 | 0.00 | 0.00 |
| SrO | 0.00 | 0.00 | 0.02 | 0.01 | 0.00 | 0.00 | 0.00 | 0.00 | 0.00 |
| Na2O | 0.14 | 0.17 | 0.13 | 0.04 | 0.01 | 0.03 | 0.03 | 0.06 | 0.02 |
| K2O | 9.05 | 9.06 | 0.02 | 0.00 | 0.00 | 0.00 | 0.04 | 0.02 | 0.02 |
| Cl | 0.09 | 0.11 | |||||||
| F | 0.19 | 0.00 | |||||||
| Total | 94.07 | 95.67 | 89.94 | 90.83 | 90.23 | 92.26 | 92.18 | 95.88 | 95.63 |
| Formula based on 24 (O, OH, Cl, F) | Formula based on16 cations and 24, 5 oxygens | Formula based on 22 O * | |||||||
| Si | 5.773 | 5.776 | 6.076 | 6.093 | 6.135 | 6.007 | 5.997 | 5.977 | 5.975 |
| Al IV | 2.199 | 2.179 | 5.035 | 4.891 | 4.866 | 5.568 | 5.098 | 3.965 | 3.972 |
| Al VI | 0.000 | 0.000 | |||||||
| Ti | 0.528 | 0.512 | 0.003 | 0.019 | 0.007 | 0.016 | 0.003 | 0.011 * | 0.019 * |
| Cr | 0.000 | 0.000 | |||||||
| Fe | 2.121 | 2.188 | 0.423 | 0.455 | 0.423 | 0.095 | 0.332 | 0.031 | 0.017 |
| Mn | 0.005 | 0.000 | 0.019 | 0.010 | 0.000 | 0.005 | 0.020 | 0.000 | 0.000 |
| Mg | 3.060 | 2.974 | 0.420 | 0.559 | 0.557 | 0.021 | 0.475 | 0.000 | 0.005 |
| Ca | 0.000 | 0.004 | 3.906 | 3.908 | 3.937 | 3.976 | 4.018 | 4.022 | 4.019 |
| Na | 0.042 | 0.049 | 0.041 | 0.013 | 0.003 | 0.008 | 0.009 | 0.016 | 0.006 |
| K | 1.768 | 1.758 | 0.003 | 0.000 | 0.000 | 0.001 | 0.009 | 0.003 | 0.004 |
| Sr | 0.000 | 0.000 | |||||||
| Ba | 0.010 | 0.085 | |||||||
| OH * | 3.884 | 3.972 | |||||||
| F | 0.092 | 0.000 | |||||||
| Cl | 0.024 | 0.028 | |||||||
| TOTAL | 19.505 | 19.525 | |||||||
| Sample | M1A | M-9 | |||||||||||||
|---|---|---|---|---|---|---|---|---|---|---|---|---|---|---|---|
| Anal. N. | 1 | 2 | 3 | 4 | 5 | 6 | 7 | 8 | 9 | 10 | 11 | 12 | 13 | 14 | 15 |
| 22 | 23 | 24 | 20 | 21 | 16 | 18 | 19 | 1 | 3 | 4 | 5 | 6 | 7 | 12 | |
| Figures | 2a | 2c | 2d | ||||||||||||
| SiO2 | 68.92 | 56.18 | 55.06 | 68.67 | 57.82 | 56.34 | 54.01 | 64.48 | 55.14 | 55.27 | 55.78 | 55.27 | 56.26 | 61.22 | 57.38 |
| TiO2 | 0.00 | 0.20 | 0.13 | 0.03 | 0.19 | 0.07 | 0.19 | 0.06 | 0.24 | 0.11 | 0.17 | 0.19 | 0.17 | 0.07 | 0.24 |
| Al2O3 | 19.21 | 26.84 | 27.75 | 19.32 | 25.81 | 26.66 | 28.35 | 21.62 | 27.75 | 28.12 | 27.73 | 27.86 | 27.33 | 24.18 | 26.45 |
| FeO+ | 0.10 | 0.43 | 0.21 | 0.11 | 0.19 | 0.39 | 0.35 | 0.00 | 0.50 | 0.43 | 0.45 | 0.49 | 0.55 | 0.57 | 0.50 |
| CaO | 0.10 | 9.34 | 10.34 | 0.09 | 8.12 | 9.40 | 10.99 | 2.80 | 10.57 | 11.04 | 10.71 | 10.58 | 10.19 | 6.02 | 9.34 |
| BaO | 0.01 | 0.00 | 0.03 | 0.01 | 0.03 | 0.06 | 0.00 | 0.00 | 0.00 | 0.02 | 0.00 | 0.01 | 0.03 | 0.02 | 0.00 |
| Na2O | 11.41 | 5.79 | 5.39 | 11.64 | 6.53 | 5.84 | 5.03 | 10.08 | 5.31 | 5.12 | 5.51 | 5.37 | 5.68 | 7.63 | 6.07 |
| K2O | 0.09 | 0.18 | 0.21 | 0.05 | 0.37 | 0.29 | 0.23 | 0.09 | 0.25 | 0.21 | 0.24 | 0.25 | 0.23 | 0.62 | 0.30 |
| Total | 99.83 | 98.96 | 99.12 | 99.92 | 99.06 | 99.04 | 99.14 | 99.12 | 99.77 | 100.32 | 100.58 | 100.01 | 100.44 | 100.32 | 100.27 |
| Formula based on 5 cations and 8 oxygens | |||||||||||||||
| Si | 3.022 | 2.556 | 2.506 | 3.004 | 2.619 | 2.562 | 2.461 | 2.862 | 2.496 | 2.490 | 2.500 | 2.494 | 2.523 | 2.725 | 2.574 |
| Ti | 0.000 | 0.007 | 0.005 | 0.001 | 0.006 | 0.002 | 0.006 | 0.002 | 0.008 | 0.004 | 0.006 | 0.006 | 0.006 | 0.002 | 0.008 |
| Al | 0.993 | 1.439 | 1.489 | 0.996 | 1.378 | 1.429 | 1.522 | 1.131 | 1.480 | 1.493 | 1.465 | 1.482 | 1.445 | 1.268 | 1.398 |
| Cr | 0.000 | 0.000 | 0.000 | 0.000 | 0.000 | 0.000 | 0.000 | 0.000 | 0.000 | 0.000 | 0.000 | 0.000 | 0.000 | 0.000 | 0.000 |
| Fe3+ | 0.000 | 0.000 | 0.000 | 0.000 | 0.000 | 0.000 | 0.000 | 0.000 | 0.000 | 0.000 | 0.000 | 0.000 | 0.000 | 0.000 | 0.000 |
| Fe2+ | 0.004 | 0.016 | 0.008 | 0.004 | 0.007 | 0.015 | 0.013 | 0.000 | 0.019 | 0.016 | 0.017 | 0.019 | 0.021 | 0.021 | 0.019 |
| Ca | 0.004 | 0.455 | 0.504 | 0.004 | 0.394 | 0.458 | 0.537 | 0.133 | 0.512 | 0.533 | 0.514 | 0.511 | 0.490 | 0.287 | 0.449 |
| Ba | 0.000 | 0.000 | 0.000 | 0.000 | 0.001 | 0.001 | 0.000 | 0.000 | 0.000 | 0.000 | 0.000 | 0.000 | 0.000 | 0.000 | 0.000 |
| Na | 0.970 | 0.510 | 0.476 | 0.987 | 0.573 | 0.515 | 0.444 | 0.867 | 0.466 | 0.447 | 0.479 | 0.470 | 0.494 | 0.659 | 0.528 |
| K | 0.005 | 0.010 | 0.012 | 0.003 | 0.021 | 0.017 | 0.013 | 0.005 | 0.015 | 0.012 | 0.014 | 0.014 | 0.013 | 0.035 | 0.017 |
| An | 0.46 | 46.65 | 50.84 | 0.43 | 39.84 | 46.27 | 53.96 | 13.24 | 51.59 | 53.74 | 51.09 | 51.38 | 49.14 | 29.27 | 45.17 |
| Ab | 99.05 | 52.28 | 47.93 | 99.27 | 57.99 | 52.03 | 44.70 | 86.25 | 46.94 | 45.05 | 47.56 | 47.19 | 49.54 | 67.17 | 53.13 |
| Or | 0.49 | 1.07 | 1.22 | 0.29 | 2.17 | 1.69 | 1.34 | 0.51 | 1.47 | 1.21 | 1.35 | 1.43 | 1.32 | 3.57 | 1.70 |
| Anal. N. | 1 | 2 | 3 | 4 | 5 | 6 | 7 | 8 | 9 | 10 | 11 |
|---|---|---|---|---|---|---|---|---|---|---|---|
| SiO2 | 0.09 | 0.05 | 0.11 | 0.08 | 0.07 | 0.138 | 0.11 | 0.08 | 0.00 | 0.05 | 0.08 |
| TiO2 | 1.11 | 0.86 | 1.53 | 1.93 | 1.93 | 1.322 | 0.83 | 0.66 | 2.31 | 1.86 | 1.85 |
| Al2O3 | 12.76 | 13.19 | 9.29 | 20.71 | 20.39 | 16.265 | 16.55 | 15.33 | 17.47 | 20.28 | 20.42 |
| Cr2O3 | 27.59 | 27.81 | 30.24 | 32.86 | 33.70 | 36.020 | 29.00 | 29.35 | 34.45 | 33.68 | 32.66 |
| FeO | 26.98 | 26.47 | 27.43 | 17.91 | 18.25 | 13.062 | 25.98 | 25.70 | 18.46 | 17.44 | 17.08 |
| Fe2O3 | 25.97 | 25.26 | 26.17 | 14.14 | 13.42 | 21.435 | 20.60 | 21.84 | 15.26 | 14.06 | 14.11 |
| MnO | 0.41 | 0.46 | 0.45 | 0.34 | 0.34 | 0.380 | 0.39 | 0.40 | 0.30 | 0.32 | 0.37 |
| MgO | 3.69 | 3.87 | 2.95 | 10.67 | 10.44 | 8.556 | 4.63 | 4.71 | 9.89 | 10.93 | 10.91 |
| ZnO | 0.31 | 0.33 | 0.19 | 0.14 | 0.01 | 0.10 | 0.46 | 0.31 | 0.12 | 0.14 | 0.16 |
| V2O5 | 0.20 | 0.24 | 0.34 | 0.29 | 0.26 | 0.23 | 0.23 | 0.19 | 0.31 | 0.22 | 0.23 |
| NiO | 0.02 | 0.11 | 0.05 | 0.00 | 0.02 | 0.00 | 0.06 | 0.08 | 0.01 | 0.04 | 0.01 |
| total | 99.13 | 98.62 | 98.75 | 99.06 | 98.83 | 97.51 | 98.83 | 98.65 | 98.58 | 99.01 | 97.89 |
| Formula based on 4 oxygens | |||||||||||
| Si | 0.003 | 0.002 | 0.004 | 0.003 | 0.002 | 0.005 | 0.004 | 0.003 | 0.000 | 0.002 | 0.002 |
| Ti | 0.029 | 0.023 | 0.041 | 0.047 | 0.047 | 0.033 | 0.022 | 0.017 | 0.058 | 0.045 | 0.045 |
| Al | 0.526 | 0.545 | 0.393 | 0.795 | 0.779 | 0.642 | 0.674 | 0.622 | 0.681 | 0.772 | 0.785 |
| Cr | 0.763 | 0.771 | 0.859 | 0.847 | 0.864 | 0.953 | 0.793 | 0.799 | 0.901 | 0.860 | 0.842 |
| Fe3+ | 0.681 | 0.663 | 0.704 | 0.339 | 0.324 | 0.329 | 0.527 | 0.563 | 0.375 | 0.338 | 0.342 |
| Fe2+ | 0.786 | 0.772 | 0.820 | 0.478 | 0.489 | 0.600 | 0.739 | 0.736 | 0.504 | 0.466 | 0.460 |
| Mn | 0.012 | 0.014 | 0.014 | 0.009 | 0.009 | 0.011 | 0.011 | 0.012 | 0.008 | 0.009 | 0.010 |
| Mg | 0.193 | 0.202 | 0.158 | 0.518 | 0.504 | 0.427 | 0.239 | 0.242 | 0.488 | 0.526 | 0.530 |
| Sample | M-1 | M-1A | M-2 | M-3 | M-4 | M-5 | M-7 |
|---|---|---|---|---|---|---|---|
| SiO2 | 50.24 | 49.14 | 50.54 | 49.57 | 44.52 | 53.92 | 53.42 |
| TiO2 | 1.42 | 2.09 | 2.14 | 1.61 | 1.26 | 1.20 | 2.46 |
| Al2O3 | 15.87 | 16.80 | 15.98 | 17.88 | 17.26 | 15.24 | 16.72 |
| Fe2O3* | 7.12 | 10.88 | 10.21 | 9.95 | 6.37 | 9.65 | 11.36 |
| Cr2O3 | 0.02 | 0.01 | <0.002 | 0.01 | 0.02 | 0.01 | <0.002 |
| CaO | 8.33 | 7.58 | 5.88 | 1.12 | 8.31 | 4.55 | 0.69 |
| MnO | 0.12 | 0.17 | 0.13 | 0.09 | 0.10 | 0.09 | 0.04 |
| MgO | 5.46 | 5.61 | 1.68 | 9.07 | 6.07 | 3.40 | 5.77 |
| Na2O | 4.21 | 3.53 | 7.31 | 4.45 | 2.83 | 6.66 | 4.79 |
| K2O | 0.88 | 1.35 | 0.27 | 0.46 | 1.63 | 0.14 | 0.17 |
| P2O5 | 0.24 | 0.32 | 0.49 | 0.18 | 0.20 | 0.21 | 0.43 |
| LOl | 5.90 | 2.20 | 5.20 | 5.40 | 11.20 | 4.80 | 3.90 |
| Total | 99.81 | 99.68 | 99.83 | 99.79 | 99.77 | 99.87 | 99.75 |
| TOT/C | 0.74 | 0.03 | 1.11 | 0.09 | 1.77 | 0.69 | <0.02 |
| TOT/S | <0.02 | 0.02 | <0.02 | <0.02 | <0.02 | <0.02 | <0.02 |
| Sc | 30.00 | 25.00 | 20.00 | 26.00 | 23.00 | 18.00 | 25.00 |
| Ba | 152.00 | 697.00 | 87.00 | 51.00 | 206.00 | 48.00 | 439.00 |
| Be | 2.00 | 2.00 | 1.00 | <1 | <1 | <1 | 2.00 |
| Co | 28.20 | 36.8 | 21.10 | 35.00 | 34.40 | 24.50 | 26.80 |
| Cs | 2.30 | 2.90 | 0.40 | 2.50 | 5.10 | 0.40 | 0.70 |
| Ga | 16.90 | 19.20 | 19.20 | 17.40 | 15.60 | 14.50 | 20.00 |
| Hf | 5.20 | 5.40 | 6.80 | 3.90 | 3.90 | 4.30 | 6.30 |
| Nb | 9.78 | 9.70 | 8.60 | 3.50 | 7.40 | 6.30 | 11.10 |
| Rb | 35.10 | 43.70 | 8.20 | 11.30 | 59.10 | 4.40 | 5.40 |
| Sn | 1.00 | 2.00 | 2.00 | 1.00 | 1.00 | 2.00 | 2.00 |
| Sr | 253.10 | 375.50 | 108.00 | 133.60 | 59.80 | 224.80 | 57.90 |
| Ta | 0.60 | 0.60 | 0.70 | 0.30 | 0.50 | 0.40 | 0.80 |
| Th | 5.30 | 3.00 | 3.30 | 1.60 | 3.90 | 3.30 | 6.40 |
| U | 1.20 | 1.00 | 1.20 | 0.40 | 1.10 | 0.70 | 2.80 |
| V | 187.00 | 218.00 | 137.00 | 200.00 | 170.00 | 166.00 | 262.00 |
| W | 6.60 | 6.00 | 7.60 | 4.20 | 2.30 | 5.60 | 11.90 |
| Zr | 200.20 | 224.10 | 271.80 | 149.00 | 153.40 | 147.50 | 231.60 |
| Y | 33.60 | 39.60 | 53.20 | 24.40 | 26.00 | 23.60 | 45.30 |
| La | 23.80 | 17.30 | 17.70 | 8.10 | 21.00 | 15.70 | 19.90 |
| Ce | 53.50 | 41.60 | 44.70 | 21.30 | 47.30 | 38.90 | 50.20 |
| Pr | 6.69 | 5.73 | 6.36 | 2.95 | 5.82 | 5.22 | 7.04 |
| Nd | 27.90 | 25.70 | 29.70 | 13.10 | 24.60 | 21.20 | 30.90 |
| Sm | 6.20 | 6.46 | 7.80 | 3.54 | 4.99 | 4.51 | 7.30 |
| Eu | 1.72 | 1.88 | 2.37 | 0.91 | 1.63 | 1.43 | 2.05 |
| Gd | 6.45 | 7.19 | 9.56 | 4.19 | 5.01 | 4.74 | 8.40 |
| Tb | 0.99 | 1.11 | 1.49 | 0.69 | 0.76 | 0.71 | 1.33 |
| Dy | 6.11 | 7.07 | 9.35 | 4.48 | 4.57 | 4.46 | 8.16 |
| Ho | 1.17 | 1.43 | 1.88 | 0.93 | 0.91 | 0.99 | 1.67 |
| Er | 3.36 | 4.05 | 5.50 | 2.73 | 2.61 | 2.61 | 4.76 |
| Tm | 0.51 | 0.60 | 0.79 | 0.42 | 0.37 | 0.40 | 0.70 |
| Yb | 3.19 | 3.77 | 5.05 | 2.59 | 2.36 | 2.48 | 4.31 |
| Lu | 0.50 | 0.58 | 0.78 | 0.42 | 0.35 | 0.40 | 0.68 |
| Ni | 41.00 | 50.00 | <20 | 32.00 | 81.00 | 35.00 | <20 |
| Sample | M-1 | M-3 | M-4 | M-5 | M-7 |
|---|---|---|---|---|---|
| 206Pb/204Pb | 18.92209939 | 18.7368185 | 19.03282702 | 18.57438457 | 19.14024785 |
| ±2s+ | 0.011112606 | 0.01491399 | 0.012461895 | 0.010005923 | 0.019462799 |
| 207Pb/204Pb | 15.66053538 | 15.6515818 | 15.66947086 | 15.6394058 | 15.6842099 |
| ±2s+ | 0.010983742 | 0.014073549 | 0.011949346 | 0.010340995 | 0.017133993 |
| 208Pb/204Pb | 39.09866217 | 38.74599643 | 39.10893752 | 38.5879748 | 39.07321516 |
| ±2s+ | 0.032498962 | 0.038868704 | 0.034110976 | 0.030599558 | 0.045900435 |
| 207Pb/206Pb | 0.827633773 | 0.83534005 | 0.823288311 | 0.841989613 | 0.819437825 |
| ±2s+ | 0.000174809 | 0.000224997 | 0.000184886 | 0.000177841 | 0.000195686 |
| 208Pb/206Pb | 2.066304938 | 2.067915649 | 2.054823635 | 2.077492136 | 2.04142499 |
| ±2s+ | 0.000776447 | 0.000847523 | 0.000732947 | 0.000759999 | 0.000767098 |
| 87Sr/86Sr | 0.707907300 | 0.706442300 | 0.713264800 | 0.706534300 | 0.708874500 |
| +/−abs | 4.95535 × 10⁻⁶ | 6.35798 × 10⁻⁶ | 4.27959 × 10⁻⁶ | 4.23921 × 10⁻⁶ | 4.96212 × 10⁻⁶ |
| 143Nd/144Nd | 0.512546651 | 0.512868216 | 0.51259686 | 0.512701087 | 0.512593255 |
| +/−abs | 5.63801 × 10⁻⁶ | 6.15442 × 10⁻⁶ | 5.63857 × 10⁻⁶ | 5.63971 × 10⁻⁶ | 3.58815 × 10⁻⁶ |
| Age (Ma) | 265 | 265 | 265 | 265 | 265 |
| εNd | 0.33 | 5.62 | 1.7 | 3.54 | 0.95 |
Publisher’s Note: MDPI stays neutral with regard to jurisdictional claims in published maps and institutional affiliations. |
© 2021 by the authors. Licensee MDPI, Basel, Switzerland. This article is an open access article distributed under the terms and conditions of the Creative Commons Attribution (CC BY) license (https://creativecommons.org/licenses/by/4.0/).
Share and Cite
Spišiak, J.; Vozárová, A.; Vozár, J.; Ferenc, Š.; Šimonová, V.; Butek, J. Implication of Mineralogy and Isotope Data on the Origin of the Permian Basic Volcanic Rocks of the Hronicum (Slovakia, Western Carpathians). Minerals 2021, 11, 841. https://0-doi-org.brum.beds.ac.uk/10.3390/min11080841
Spišiak J, Vozárová A, Vozár J, Ferenc Š, Šimonová V, Butek J. Implication of Mineralogy and Isotope Data on the Origin of the Permian Basic Volcanic Rocks of the Hronicum (Slovakia, Western Carpathians). Minerals. 2021; 11(8):841. https://0-doi-org.brum.beds.ac.uk/10.3390/min11080841
Chicago/Turabian StyleSpišiak, Ján, Anna Vozárová, Jozef Vozár, Štefan Ferenc, Viera Šimonová, and Juraj Butek. 2021. "Implication of Mineralogy and Isotope Data on the Origin of the Permian Basic Volcanic Rocks of the Hronicum (Slovakia, Western Carpathians)" Minerals 11, no. 8: 841. https://0-doi-org.brum.beds.ac.uk/10.3390/min11080841