
Potential Uranium Migration within the Geochemical Gradient of the Opalinus Clay System at the Mont Terri


1
GFZ German Research Centre for Geosciences, Fluid Systems Modelling, Telegrafenberg, 14473 Potsdam, Germany
2
University of Potsdam, Institute of Geosciences, Karl-Liebknecht-Str. 24-25, 14476 Potsdam-Golm, Germany
*
Author to whom correspondence should be addressed.
Minerals 2021, 11(10), 1087; https://0-doi-org.brum.beds.ac.uk/10.3390/min11101087
Submission received: 3 September 2021
/
Revised: 29 September 2021
/
Accepted: 30 September 2021
/
Published: 3 October 2021
(This article belongs to the Special Issue Uranium in Sedimentary Basins: Migration and Concentration)
Abstract
:Transport properties of potential host rocks for nuclear waste disposal are typically determined in laboratory or in-situ experiments under geochemically controlled and constant conditions. Such a homogeneous assumption is no longer applicable on the host rock scale as can be seen from the pore water profiles of the potential host rock Opalinus Clay at Mont Terri (Switzerland). The embedding aquifers are the hydro-geological boundaries, that established gradients in the 210 m thick low permeable section through diffusive exchange over millions of years. Present-day pore water profiles were confirmed by a data-driven as well as by a conceptual scenario. Based on the modelled profiles, the influence of the geochemical gradient on uranium migration was quantified by comparing the distances after one million years with results of common homogeneous models. Considering the heterogeneous system, uranium migrated up to 24 m farther through the formation depending on the source term position within the gradient and on the partial pressure of carbon dioxide of the system. Migration lengths were almost equal for single- and multicomponent diffusion. Differences can predominantly be attributed to changes in the sorption capacity, whereby governs how strong uranium migration is affected by the geochemical gradient. Thus, the governing parameters for uranium migration in the Opalinus Clay can be ordered in descending priority: , geochemical gradients, mineralogical heterogeneity.
1. Introduction
The protection of future generations and their environment from effects of highly-radioactive waste requires the isolation of the e.g., spent fuel in deep geological repositories in a suitable host rock [1]. Clay formations are one of the preferred host rocks, because they have high retention capacities with respect to radionuclides due to the large reactive surface area of the inherent minerals and provide very low permeabilities, only allowing diffusive transport.
The retardation of radionuclide migration has been demonstrated for claystones, like the Swiss Opalinus Clay, in many laboratories as well as in-situ experiments, usually applying constant and homogeneous (geochemical) experimental conditions [2,3,4,5]. However, for many radionuclides it has been shown that sorption and migration are affected by geochemistry and can deviate by one or more orders of magnitude [6,7,8]. Hence, the transport parameters determined in experiments may no longer be applicable in the case of changing geochemical conditions.
On the host rock scale, a formation is not homogeneous. Therefore, numerical process coupling is required in order to give quantitative robust statements as the “homogeneous” results of the small-scale experiments are not easily transferable. Besides the hydro-physical and chemical properties governing transport of radionuclides, the overall thickness of the potential host rock plays a crucial role to ensure the enclosure of the radioactive material for times of up to one million years. In Germany and Switzerland, for instance, where the Opalinus Clay is present, a thickness of at least 100 m is a minimum criteria (§23 Article 5 StandAG, Ref. [9]). On the one hand, the heterogeneity is given by variations in the mineralogical composition due to the deposition process. Reason for differences in the pore water composition are water-rock-interactions. On the other hand, chemical heterogeneities developed as a result of diffusive exchange of waters with adjacent formations. Due to the large spatial and temporal scales to be considered, numerical simulations are indispensable for safety assessments of potential repositories to quantify radionuclide migration.
The Opalinus Clay is subdivided into three lithological units: the shaly, sandy, and carbonate-rich facies [10,11,12]. Furthermore, present-day pore water profiles are characterised on the host rock scale by a geochemical gradient across the entire thickness (Figures 1–3) as a result of the exchange with adjacent permeable formations [10,13]. The current hydro-geological boundaries are represented by aquifers at the footwall (Liassic limestone) and hanging wall (Dogger limestone, Figure 1). As discussed in the comprehensive study of Mazurek et al. [13], the shape and gradients of the profiles of chloride as conservative tracer (no mineral interaction) as well as of helium and the stable water isotopes can be explained by diffusion and the activation times of the surrounding aquifers. This leads to the following questions: Do geochemical gradients affect radionuclide migration? If so, how much?
In the present study, we assess the influence of measured geochemical gradients on potential radionuclide migration of uranium as one of the main components in spent fuel [15] in the hydro-geological system of the Opalinus Clay formation in the Mont Terri region. From previous numerical studies we know [8,16], that uranium speciation is controlled by the pore water composition and that it is mainly present in anionic and neutral complexes with calcium, magnesium and carbonate, e.g., , , . Moreover, sorption as well as diffusion processes of uranium in the geochemical system are governed by the partial pressure of carbon dioxide , concentration, pH, pe, the hydro-physical parameters and the clay mineral quantity. With fully coupled reactive transport models, we quantify uranium migration under consideration of the pore water geochemistry in the hydro-geological framework of the potential host rock Opalinus Clay.
In the first step, we modelled the chloride profile presented in Mazurek et al. [13] and extended their work with the profiles of other pore water components, e.g., calcium, sodium, magnesium or strontium, based on the comprehensive geochemical database given in Pearson et al. [10] and Wersin et al. [11] to calibrate our model. The basic idea is to match and initialise our simulations with the present-day profiles of the pore water components.
In the second step, we add uranium as prospective repository to the calibrated model and simulate the migration lengths for a time span of one million years. Important part of the study is the comparison of single-component (SC) with multi-component (MC) diffusion to determine the respective influence of geochemical gradients. In contrast to the SC simulations based on Fick’s laws, the MC approach accounts for the interaction of charged species with the diffuse double layers (DDL) of the clay mineral surfaces. The migration distances of uranium after a simulation time of one million years were compared with the results presented in Hennig et al. [16], that were obtained for a geochemically constant and thus homogeneous Opalinus Clay system with single-component simulations. In that way, we account for the first time for the influence of changing geochemical conditions on sorption as well as the diffusive transport, and we quantify the uncertainty of transport parameters of uranium on the host rock scale.
2. Methods
Reactive transport simulations were applied to quantify uranium migration considering diffusion and sorption processes as well as interaction with the inherent minerals depending on the geochemical gradient in the Opalinus Clay formation at the Mont Terri. Based on the geological evolution of the Mont Terri anticline (Section 2.1), the initial conditions (Section 2.2) were chosen and the geochemical system was defined (Section 2.3) to match as first step the present-day pore water profiles (Section 2.3) as calibration for our model concept. The one-dimensional simulations were conducted on the host rock scale (approx. 200 m) with PHREEQC Version 3.5.0 [17] to consider the geochemical conditions to quantify sorption (Section 2.4) and diffusion applying the SC method following Fick’s law (Section 2.5) as well as the implemented MC approach (Section 2.6). In the second step, we added a uranium source term to the system (Section 2.7) to assess the migration under a geochemical gradient for one million years.
The underlying thermodynamic data are based on the PSI/Nagra database version 12/07 [18] with the extensions and updates described in Hennig et al. [16] and Hennig and Kühn [8]. Details are given in the corresponding Supplementary Materials. All simulations were conducted for the reference temperature of 25 C. Previous studies showed that temperature variations, e.g., due to uplift of the formation, changes of the surface temperature or heat generated by the radioactive waste have only a minor effect on the modelled chloride profile [13,19]. Furthermore, uranium migration in the Opalinus Clay (up to temperatures of 60 C [20]) as well as the concentrations of the pore water components (<5% for a temperature of 45 C, Ref. [21]) are not significantly affected by elevated temperatures. The hydraulic rock properties correspond to the direction perpendicular to bedding for all transport simulations. Dirichlet boundaries are applied to the model outlets. All models have a spatial resolution of 2 m. Grid independence is ensured by simulations of finer resolution and numerical stability by the Neumann criteria.
2.1. Geological and Hydro-Geological Evolution of the Mont Terri Anticline
The Mont Terri anticline is located in northwestern Switzerland in the canton of Jura between the cities St. Ursanne and Courgenay, which are connected by a motorway tunnel constructed through the core of the anticline (Figure 1). The Mont Terri consists of Triassic and Jurassic limestones, marls and shales with the Opalinus Clay formation embedded (Figure 1). The formation accessed by an underground laboratory [10,22] has an overburden of around 300 m. The maximum overburden in the past is estimated with at least 1000 m [10,13,22]. Thus, the Opalinus Clay is an overconsolidated shale formation deposited about 180 Ma ago in the Lower Aalenian in a shallow marine environment of the Jurassic sea covering an area from the Jura mountains in Switzerland and France as well as the Swiss-German foreland basin and parts of Southern Germany [10,22].
In the studied area, the total thickness of the low permeable section is 210 m. It consists of 50 m of Liassic shales (Obtusus Clay, Posidonia Shale and Jurensis Marl) and the 160 m thick Opalinus Clay (Figure 1) with an alternating sequence of its facies shaly, sandy, and carbonate-rich [10,13]. The hydro-geological boundary at the footwall is the Liassic Gryphaea limestone. The hanging wall boundary is defined by the contact between Opalinus Clay and the limestones of the Lower Dogger (Figure 1) [10,19]. Hence, the Opalinus Clay is an aquiclude sandwiched between two aquifers [22]. According to Pearson et al. [10] and Mazurek et al. [13], fresh-water infiltration into both aquifers, and with that the activation of the current hydro-geological boundaries of the system, was only possible after uplift of the entire sequence due to the folding of the Jura mountains about 10 Ma ago and the subsequent erosion of the overlying stratigraphic layers. Therefore, onset of fresh-water infiltration first occurred in the upper aquifer of the Dogger between 10 Ma and 1.2 Ma before today (Figure 1) [13]. Only after erosion of the overlying Opalinus Clay and Liassic shales, the aquifer at the footwall was activated between 0.5 Ma and 0.2 Ma ago leading to a substantial time lag of fresh-water infiltration into both aquifers and thus to the associated asymmetric shape of the pore water components (Figure 2a and Figure 3). It is important to note that the observed profiles for chloride, helium, as well as the stable water isotopes could be reproduced and understood with diffusion as sole transport process [13]. More details on the hydro-geological evolution of the Opalinus Clay can be found in Pearson et al. [10], Mazurek et al. [13,19] and the Safety Report [9].
2.2. Initial Model Conditions
The total simulation time was six million years with the Dogger aquifer being active during the entire time and the Liassic aquifer only for the last 0.5 million years (Figure 2b). The initial conditions for the following simulations were based on the findings discussed in the comprehensive study of Mazurek et al. [13].
The observed chloride profile (Figure 2a) [10] suggests bleeding of chloride from the low permeable sequence into the bounding aquifers. This in turn means, the initial chloride concentration must have been equal or even higher compared to the maximum value of around 14 g/L observed today [10,13]. Based on their model calculations, Mazurek et al. [13] discussed, that the initial chloride concentration must have been between 14 g/L and 24 g/L with the best fit for an initial concentration of 18.4 g/L. This value was determined from a sampling of stagnant groundwater from the Liassic aquifer at the nearby Mont Russelin, where the Liassic has no surface contact and is protected within the core of the anticline shielded by the overlying formations like the Opalinus Clay [23]. Therefore, the water samples at Mont Russelin were interpreted to represent chemical signatures, that were not affected by exchange with aquifers [13,23].
For our simulations, we need the initial concentrations of the main pore water components (e.g., , , , , , , ) before the activation of the bounding aquifers. We elaborated two scenarios as given in Table 1 in order to model the pore water profiles observed at Mont Terri (Section 2.3), assuming that the waters determined at Mont Russelin are considered as unaffected. Hence, the pore water concentrations obtained from squeezing a sample from the Opalinus Clay in the core of the Mont Russelin anticline [23] with a chloride concentration of around 18.9 g/L were used for the first scenario (Scenario 1R, Table 1). The second scenario (Scenario 2J, Table 1) is based on sampled stagnant groundwater from the Liassic aquifer at Mont Russelin [23] according to Mazurek et al. [13]. However, only the values for chloride, sodium and strontium can be used due to a contamination with cement during sampling. We assume that the concentrations for calcium and magnesium in particular have been altered. For the other components, the sea water concentrations according to the time of deposition in the Jurassic were chosen, Ref. [24] as already discussed in Mazurek et al. [19]. The water compositions of the bounding aquifers stem from seepage samples taken in the Mont Terri tunnel close to the rock laboratory [10].
The concentrations of the main ions are given as well in Table 1 as averaged values of the corresponding measurement campaign. More details can be found in the Supplementary Material S1.
2.3. Geochemical System and Present-Day Pore Water Profiles
The geochemical system of the Opalinus Clay is governed by the calcite-carbonate system and hence by the [10,11,16]. This in turn controls speciation and migration of uranium and therefore the needs to be fixed. We took the atmospheric at the time of deposition close to the Triassic-Jurassic boundary (TJB) about 200 Ma ago. At the TJB, the carbon dioxide concentration in the atmosphere increased up to values between 2000 ppm and 2500 ppm and remained elevated for some time before it decreased again to the previous value of 1000 ppm [25]. The exact time frame is uncertain and therefore we selected two scenarios for the with 2000 ppm and 1000 ppm corresponding to bar (Scenario A) and bar (Scenario B), respectively. Depending on the applied , the initial pore water compositions were equilibrated with calcite and dolomite to control pH and with siderite and pyrite to govern the redox state within the system as these minerals are most consistent with measured values [10,11,26,27]. The initial values for the pH and pe were 8.2 according to today’s sea water [28] and −3.85, respectively. The latter is equivalent to an of −227 mV as published for Mont Terri [22]. The equilibrium of the mineral assemblage also controls the concentrations of the main cations calcium, magnesium, and iron. The ratio between the ions, for instance the Mg/Ca ratio, is thereby determined by the stability constants usually used for pure minerals resulting in this case to a Mg/Ca ratio of around 0.8. However, at Mont Terri higher Mg/Ca ratios were observed ranging between 0.9 and 1.3 [10] resulting from the exchange of calcium with magnesium ions on the surface of the calcite lattice [29]. The incorporation of magnesium led to an increased solubility of calcite compared to the pure mineral. Therefore, the stability constant of calcite has been adapted in the applied thermodynamic database according to the approach presented in Möller and De Lucia [29] based on the Mg/Ca ratio measured in the pore water of the Opalinus Clay at Mont Russelin [23]. The adapted log K is about 0.2 log units higher, as can be seen in the Supplementary Material S2 leading to a Mg/Ca ratio of 1.3. With the outlined constraints, we defined the geochemical system of the Opalinus Clay in our model concept as a function of the around the time of deposition.
Calcium, magnesium, and pH are the governing parameters for uranium speciation and hence sorption and diffusion [8,16]. Therefore, only these profiles are exemplary shown for the other pore water components (Figure 3). The applied geochemical data stems from various borehole analysis at the underground research laboratory taken from the comprehensive studies of Pearson et al. [10] and Wersin et al. [11]. The underlying data and all other profiles can be found in the Supplementary Materials S1 and S3, respectively.
2.4. Incorporated Sorption Processes
Sorption processes were integrated in the simulations via a bottom-up approach by the additive sorption on the individual minerals present in the formation [30,31] using mechanistic surface complexation models based on the two-layer model of Dzombak and Morel [32] as well as cation exchange. The applied and proven dataset [33] is given in the Supplementary Material of Hennig et al. [16] together with all required surface parameters and reactions. Not all present minerals contribute equally to the total uranium sorption [16]. Hence, we only consider sorption on the clay minerals kaolinite, illite, and illite/smectite mixed layers, that were handled as a 1:1 combination of the pure minerals illite and smectite. Smectite is a generic term for a group of clay minerals, for which we have chosen montmorillonite as the best investigated representative [33], and is not further described for the Opalinus Clay. Illite and montmorillonite are the exchange phases for the main cations as well as uranyl-ions [16,34]. The respective reactions are also given in the Supplementary Material of Hennig et al. [16]. Sorption is quantified via the distribution coefficient (m/kg) calculated in PHREEQC following Stockmann et al. [31] as ratio between the amount of a species absorbed on the solid phase and the amount present in the liquid phase.
Since geochemistry of the pore water is more decisive for uranium sorption and migration in the Opalinus Clay than the quantity of clay minerals, we decided to use a mean of 66 wt.% clay minerals for the entire low permeable sequence with 22 wt.% kaolinite, 23 wt.% illite, and 10 wt.% illite/smectite mixed layers [22,35]. Accordingly, we have also chosen averaged values for porosity 0.16 (-), wet water content 0.065% as well as for dry and wet bulk density 2307 kg/m and 2468 kg/m [10], respectively. These parameters are needed to calculate the amount of pore water per volume unit Opalinus Clay and hence the amount of clay minerals per kilogram pore water.
2.5. Modelling Single-Component Diffusion
In the SC simulations, diffusive transport is quantified based on Fick’s laws. Accordingly, one diffusion coefficient is used for all pore water components in the same way. To model the profiles, we use the effective diffusion coefficient of chloride with m/s [13,36], as it is a conservative tracer. Further, the chloride profile is used to calibrate our model (Section 3.1). For the subsequent uranium migration, the effective diffusion coefficient of uranium determined with a value of m/s in an experiment with Opalinus Clay of the sandy facies is used [20]. Transport modelling in PHREEQC is based on the assumption, that a model element solely contains water [17]. Consequently, the pore water diffusion coefficient must be applied instead, which can be derived from the effective porosity (-) and the accounting for the reduced cross-sectional area available for diffusion in porous media via (Equation (1)). Considering a ratio of anion- to water-accessible porosity of 0.54 due to the anion exclusion effect [13,36,37], this results in a m/s for chloride. In the uranium diffusion experiment, a neutral ternary uranyl complex was the dominant species resulting in a m/s used in the simulations.
2.6. Modelling Multi-Component Diffusion
The MC approach implemented in PHREEQC is based on the electrochemical potential. This enables the calculation of diffusive transport in porous media with uncharged regions and charged regions [17,38,39] as for instance present in claystones like the Opalinus Clay with the (free) pore water and the DDL, respectively. The approach has already been successfully applied to the Opalinus Clay to model a diffusion experiment with different charged species [39] as well as with uranium [8]. Detailed descriptions of the approach and underlying equations can be found in Appelo and Wersin [38], Appelo et al. [39], Hennig and Kühn [8] as well as in the PHREEQC manual [17].
With the MC option in PHREEQC, the diffusive flux is calculated separately for each species present in the system as the sum of diffusion in the pore water and the DDL. This is conceptually implemented by dividing a model element along its length in paired cells for each mineral defined, so that each pair consists of a charge-balanced solution (free pore water) and a charged surface with a DDL. The diffusive transport within a model element is calculated by explicit finite differences for each interface among the paired cells and then summed up to determine the exchange between two model elements. In the underlying thermodynamic database, each species is assigned its own self-diffusion coefficient in water (m/s) [8], that is needed to derive the corresponding analogous to Archie’s law:
where n is an empirical exponent [40], that needs to be determined for a specific medium, here Opalinus Clay (Section 3). The for the pore water components were taken from the phreeqc.dat provided with PHREEQC [17] and for the uranium species from the works of Kerisit and Liu [41] as well as Liu et al. [42] as described in Hennig and Kühn [8]. All details can be found in the corresponding Supplementary Material.
The net surface charge of the clay minerals is compensated within the area of the DDL by the enrichment of counter-ions and repulsion of co-ions, which accordingly reduces their pore space and hampers their diffusive transport compared to counter-ions. In the case of negatively charged surfaces of the clay minerals, this effect is known as anion exclusion [36,38,43]. Therefore, the amount of water and hence the thickness of the DDL as well as the composition govern anion exclusion. We use the fast and robust method of the Donnan approximation implemented in PHREEQC, that assumes a single potential for the DDL as entity, to calculate the composition within the DDL as average [17]. The thickness of the DDL is controlled by the ionic strength of the pore water [38,39,43]. With decreasing ionic strength according to the chloride concentration and the geochemical gradient towards the bounding aquifers, the thickness of the DDL increases. Therefore, we have decided to use the Debye-length option in PHREEQC [17] to determine the thickness of the DDL as a function of the ionic strength (Equation (2)). With this option, the thickness is calculated as product of a defined number of lengths times the Debye length [38,44]. Based on the ionic strengths I (mol/L) and given in Hennig and Kühn [8] for the three facies of the Opalinus Clay, we determined with a value of 1 according to:
where the number is a factor dependent on the dielectric constant and temperature and valid at a temperature of 25 °C [44].
2.7. Uranium Source Term
The uranium source term to mimic the failed high-level waste canisters is integrated by a mineral equilibrium with amorphous, hydrated uraninite . Thereby, the saturation index is chosen to achieve a concentration of around 1 mol/L [20,45]. The potential repository is placed in one case in the centre of the model at a depth of 100 m below contact between Dogger limestones and Opalinus Clay and in the other case at a depth of 150 m, i.e., the transition from Opalinus Clay to Liassic shales with the highest chloride concentrations (Figure 2 and Figure 4). We would like to emphasize that our results need to be considered as maximum diffusion lengths. We assume a very simplified nuclear waste repository concept and do not consider the effect of the engineered barriers on the source term, as for instance a delay and retention due to the metal canisters or the bentonite filling [9]. We focus on the migration behaviour of uranium in the far-field taking into account the geochemical gradient within the low permeable section.
Present-day uranium concentrations deviate between mol/L and mol/L in the pore waters of the low permeable section as well as in the surrounding aquifers [10]. The background concentrations were established in the model by an undersaturation with regard to together with the mineral equilibria with the carbonates and pyrite (Section 2.3).
3. Model Calibration and Validation
First, our model was calibrated against the chloride profile measured in the field (Figure 2a) with the outlined initial and boundary conditions (Section 2.2) using the SC approach (Section 2.5). Otherwise, it would be pointless to consider the other pore water components or MC diffusion. Subsequently, the exponent n required for the MC diffusion (Equation (1), Section 2.6) was determined based on the SC simulations. Both results are presented in Section 3.1. Secondly, the model was validated against a diffusion laboratory experiment with uranium and Opalinus Clay of the sandy facies [20], applying the SC as well as MC diffusion approach with the calibrated exponent n (Section 3.2).
3.1. Chloride Profile at Mont Terri
The chloride profile given in Pearson et al. [10] is used to calibrate our model and test the underlying concept with initial and boundary conditions (Section 2.2). The main assumption is, that the entire low permeable sequence (Liassic shales and Opalinus Clay) had a uniform initial chloride concentration of around 18.4 g/L [13], e.g., corresponding to around 0.5 mol/L (Table 1). Due to erosion, the surrounding aquifers were activated and thus flushed with fresh water leading to a diffusive exchange with the embedded clays (Figure 1, Section 2.1). Total simulation time was six million years with the footwall aquifer only being active for the last 0.5 million years (Figure 2b). The initial chloride concentrations of both scenarios are (very) similar with values of 18.9 g/L (1R) and 18.4 g/L (2J). We therefore present only the results of scenario 1R as the chloride profiles of both scenarios do not differ significantly. The deviation of our model in relation to the measured data is quantified by the relative Root Mean Square Error (rRMSE). Figure 4 shows, that the chloride profile can be well reproduced using the SC approach with a rRMSE of 4%.
Based on the SC results, the parameter n required for the MC diffusion to determine the effective diffusion coefficient for every species (Equation (1), Section 2.6) was varied until the best match between MC simulation results and measured data was achieved with n = 2 and an associated rRMSE of 5%. In literature, values of the medium-specific parameter n vary between 2 and 2.5 for the Opalinus Clay, especially for anionic species [13,19,36,46,47]. Thus, our calibrated parameter falls into the respective range. Compared to the SC simulations, diffusion of chloride towards the aquifers is slightly lower for the MC approach resulting in higher maximum values across the modelled profile. However, the profile still coincides very well with the measured data as shown in Figure 4. Therefore, we consider our model concept for the SC and MC approach with n = 2 as calibrated for further application and extension with the other pore water components.
3.2. Diffusion Experiment with Uranium
The diffusion experiment with uranium and Opalinus Clay of the sandy facies [20] is used to verify our model concept in terms of incorporated transport and sorption processes against laboratory data [20] to quantify migration of uranium. The spatial resolution, initial and boundary conditions of the model are equal to the one used in Hennig et al. [16]. Here, we consider sorption on the clay minerals kaolinite, illite and the illite/smectite mixed layers (Section 2.4) for the SC and MC diffusion approach (Section 2.6). The mineralogy used here is based on the results given in Hennig et al. [16] (23 wt.% kaolinite, 9 wt.% illite, 4 wt.% illite/smectite mixed layers) for a clay mineral content of 45 wt.% corresponding to the sandy facies [10]. Figure 5 shows the modelled diffusion experiment applying the SC as well as MC approach. The experimental data were well reproduced by the SC as well as by the MC diffusion simulations with rRMSEs of 30% and 35%, respectively. Due to the scattering of the data itself, we consider our conceptual model as calibrated and thus applicable to quantify uranium diffusion and sorption on the host rock scale [8,16].
4. Results
4.1. Simulation of Pore Water Profiles Using Single- and Multi-Component Diffusion
Present-day profiles of , , pH and were modelled applying SC and MC diffusion simulations for two scenarios differing in the composition of the initial pore water (Table 1). For scenario 1R, concentrations measured from samples of the Opalinus Clay at the Mont Russelin were used, where the Liassic aquifer has no contact with meteoric water and the pore water is therefore considered as unaffected. Scenario 2J was a combination of measured values from Liassic groundwater at Mont Russelin (, , ) and Jurassic sea water (, , , ). For both scenarios, the geochemical system was governed in the simulations by a mineral equilibrium with carbonates and pyrite for of bar (A) and bar (B) according to the atmospheric during the time of deposition (Section 2.3). The results for scenario 1R are given in Figure 6a–d and for Scenario 2J in Figure 6e–h.
The simulated pore water profiles of , , pH and coincide especially well with measured data using the initial pore water composition according to the Opalinus Clay at Mont Russelin (Scenario 1R, Figure 6a–d) and applying SC diffusion (solid line). Only the concentrations of were about 0.003 mol/L higher in relation to the observed values (Figure 6b). The application of MC diffusion (dashed line) increased modelled concentrations for (around 0.006 mol/L) as well as compared to the SC results (Figure 6a,b). Especially deviate even more with about 0.01 mol/L compared to the measured data using MC diffusion. The profiles of pH were almost equal for SC and MC diffusion (Figure 6c), whereas values were up to 0.3 log units lower in the MC simulations compared to SC (Figure 6d). The hydro-geological opening of the aquifers was reflected in the profiles of pH and by a wave-like signal close to the model boundaries. Best results for pH were obtained for an initial of bar (A) resulting in a of around bar within the low permeable section. The profiles of and were unaffected by the variation in (A and B). Results of the other pore water components are given in the Supplementary Material S4.
Using the combination of Jurassic sea water and Liassic groundwater as initial composition (Scenario 2J, Figure 6e–h), the resulting profiles match better with the observed data applying MC diffusion (dash-dotted line) in contrast to Scenario 1R. However, maximum concentrations of and (Figure 6e,f) were up to 0.003 mol/L lower compared to measured values. Using SC (dotted line), maximum concentrations in the modelled profiles were even lower with differences of up to 0.008 mol/L. The profiles of pH and were almost equal to those of Scenario 1R. Best results for pH were also obtained for an initial of bar (A). Applying MC diffusion, this led to a of around bar within the low permeable section. In contrast to Scenario 1R (Figure 6a,b), increasing the initial to bar (A) was associated with lower and higher concentrations (Figure 6e,f) compared to simulations with an initial of bar (B). Results of the other pore water components are given in the Supplementary Material S5.
From a purely visual ranking, best matches between modelled and measured data were observed for the simulations SC-1R-A and MC-2J-A. Therefore, they were selected for the subsequent investigations of uranium migration. Furthermore, best results were obtained for both scenarios using an initial of bar (A) according to the atmospheric around the TJB 200 Ma ago.
4.2. Simulation of Potential Uranium Migration within a Geochemical Gradient
Potential migration of uranium within a geochemical gradient was simulated for the hydro-geological system of the Opalinus Clay at the Mont Terri based on present-day pore water profiles within the 210 m thick low permeable section (Section 2.1). As described above (Section 4.1), best results for the modelled profiles were obtained with the simulations SC-1R-A and MC-2J-A (Figure 6). Two different locations for the potential repository were investigated. One in the centre of the low permeable section at a distance of around 100 m from the contact between Opalinus Clay and Dogger limestone (Figure 7a) and the other at a distance of around 150 m (Figure 7b) close to the transition between Opalinus Clay and Liassic shales with the highest chloride concentrations (Figure 4). Figure 7c displays the distribution coefficients (m/kg, Section 2.4) of uranium for the two scenarios. The boundary conditions were kept constant during the simulation with both aquifers at the model outlets active (Figure 2). The impact of the geochemical gradient on uranium migration was quantified by comparison with previous SC simulations of homogeneous models (red lines, Figure 7) as a function of [16]. For best comparison between both, simulation runs with most similar for the systems were chosen. This means, results of scenario 1R-A (average bar, Figure 6d) were projected onto simulations for a of bar and 2J-A (average bar, Figure 6h) with simulations for a of bar.
Uranium migrated farther through the formation in the heterogeneous simulations taking into account the geochemical gradient compared to the homogeneous model with similar (red dotted and solid lines, Figure 7a,b). Migration distances from the potential repository located 100 m below the contact Opalinus Clay and Dogger limestone (Figure 7a) towards the hanging wall aquifer (Dogger) ranged between 25 m (SC, scenario 2J-A, purple dotted line) and 50 m (SC and MC, scenario 1R-A, cyan lines). Distances towards the footwall aquifer (Liassic) were 20 m (SC and MC, scenario 2J-A, purple lines) and 40 m (SC and MC, scenario 1R-A, cyan lines). Compared to the migration lengths of the homogeneous models with maximum distances between 16 m (red dashed line, Figure 7) and 26 m (red solid line, Figure 7), the geochemical gradients enhanced uranium migration into the formation between +4 m (Scenario 2J-A, in relation to the red, dotted line with 16 m) and +24 m (Scenario 1R-A, reference to the red, solid line with 26 m). Consequently, differences between migration lengths of homogeneous and heterogeneous models were less pronounced for scenario 2J-A compared to 1R-A. Moreover, uranium migrated farther through the formation towards the Dogger limestones and, for scenario 1R-A, twice as far as for scenario 2J-A. No significant deviations in migration distances between SC and MC simulations were observed.
For the second location of the potential repository at 150 m below contact Opalinus Clay and Dogger (Figure 7b), distances towards the Dogger aquifer ranged between 15 m (SC and MC, scenario 2J-A, purple lines) and 30 m (SC and MC, scenario 1R-A, cyan lines). Towards the Liassic aquifer, distances were 20 m (SC and MC, scenario 2J-A, purple lines) and 35 m (SC, scenario 1R-A, solid cyan line). Compared to Figure 7a, migration distances from the peak of the geochemical gradient were thus decreased by up to −20 m. However, uranium migration was still enhanced by the gradients compared to homogeneous models. Uranium concentrations close to the model outlets were below the natural background concentration (red lines, Figure 7a,b).
Figure 7c shows the distribution coefficients (m/kg) for both scenarios. Values for scenarios 1R-A (cyan symbols) ranged from (m/kg) up to (m/kg). For scenario 2J-A (purple symbols), values differed between (m/kg) and (m/kg) with up to one order of magnitude larger compared to scenario 1R-A at the same depth. For both scenarios, a gradient in values towards the aquifers can be observed with the highest values at a depth around 160 m.
5. Discussion
Speciation of uranium in the Opalinus Clay and thus sorption and diffusion are governed by the calcite-carbonate system as we know from the study of Hennig et al. [16]. With their simulations, the authors showed, that the geochemistry of the system, predominantly , concentration and pH, is more decisive for uranium migration than the quantity of clay minerals. For instance, an increase in is associated with higher concentrations of carbonate, and in the pore water, decreasing sorption of uranium due to changes in the chemical speciation [16]. This in turn means that changes of the geochemical conditions directly influence the migration behaviour of uranium. As we consider the same geochemical system here, these findings are also valid for the presented results. Transport parameters determined for homogeneous conditions in the laboratory might no longer be applicable on the host rock scale [8]. Therefore, we extended the studies of Mazurek et al. [13] concerning the chloride profile at Mont Terri and included all other pore water components to quantify the influence of geochemical gradients on uranium migration for the host rock scale and a simulation time of one million years.
5.1. Diffusion and Mineral Interaction Control Pore Water Profiles
Profiles of , , pH and were modelled for two different initial pore water compositions (Scenario 1R and 2J) comparing SC and MC diffusion. Measured values within the hydro-geological system of the Mont Terri were reproduced with both scenarios. The initial pore waters were equilibrated with the carbonates and pyrite as a function of different with best results obtained for both scenarios for an initial of bar (A). This value corresponds to the atmospheric around the TJB, prior to the time of deposition. The best matches between measured data and modelled profiles were obtained with the SC simulations of scenario 1R-A and MC diffusion of 2J-A. For both scenarios, application of MC diffusion resulted in higher concentrations of and as well as lower values compared to the SC simulations, although the initial states of SC and MC diffusion were identical. An increase in was associated with higher and lower concentrations as well as pH compared to simulations with lower , whereas and profiles of scenario 1R were unaffected by the variation in .
Smaller pore water diffusion coefficients (m/s) of the individual species decrease exchange between aquifers and Opalinus Clay using MC diffusion. In the SC simulations, the reference of the is the one of with m/s (Section 2.5). For the MC approach, the applied of and were with values of m/s and m/s, respectively smaller. This in turn explains the higher concentrations within the low permeable section due to a reduced diffusive transport towards the aquifers. Of course, this does not only apply for the diffusive transport towards the aquifers and out of the Opalinus Clay, but also in the opposite direction, from the aquifers into the formation. For instance, the values of the surrounding aquifers were higher compared to the initial state of the low permeable section. Therefore, migrated from the aquifers into the formation leading to an increase of within the low permeable section, especially close to the model outlets. Due to the smaller of with m/s in the MC simulations, less diffused into the formation resulting in lower values of the MC simulations compared to SC for the same initial state. Due to the more recent exchange with the Liassic aquifer, the lowest values were observed at a depth of around 160 m corresponding to the contact between Opalinus Clay and Liassic shales with the highest chloride concentrations (Figure 2 and Figure 6d,h).
Pore water concentrations of and are governed by the Mg/Ca ratio set by the selected stability constants of the carbonates and not as much by the initial values. The applied scenarios differ considerably for some of the initial concentrations (Table 1). For instance, the concentration within scenario 2J is only about half of that of 1R. Nevertheless, the measured profile is reproduced with both scenarios in similar way. The deviations of the modelled profiles of scenario 2J correspond thereby with values of 0.008 mol/L for SC and 0.003 mol/L for MC to less than 50% in relation to the measured data and to the results of scenario 1R. The governing mineral equilibria are set by calcite and dolomite. The stability constant of calcite has been adapted in the underlying database to account for the incorporation of magnesium into the crystal structure [29]. To determine this, the ion ratio of the chemical signatures found in the Opalinus Clay pore waters at Mont Russelin (Section 2.3) were used resulting in initial Mg/Ca ratios of around 1.37 and 1.36 for scenarios 1R and 2J, respectively. This is the reason why variations of of the mineral equilibria only affect the and concentrations of scenario 2J with an original Mg/Ca ratio of 1.27 (Table 1). Since scenario 1R is based on the same pore water as used for the determination of the stability constant, the investigated results in almost equal concentrations of and to reach thermodynamic equilibrium. Only pH is significantly affected as more or less needs to be dissolved in the system to keep the Mg/Ca ratio for the applied in equilibrium with the carbonates. In further numerical experiments (not shown) using the original log K of the database for pure calcite, resulting and concentrations were always too low. The determined Mg/Ca ratios between 1 and 1.3 coincide with present-day ratios at Mont Terri [10]. Consequently, in addition to the plausible choice of initial concentrations, the selection of the underlying thermodynamic data is also decisive for the mineral equilibria.
We have therefore shown with our simulations, that present-day pore water profiles within the hydro-geological system at Mont Terri are understood on the one hand with a data-based concept (Scenario 1R). On the other hand, the same results are achieved starting with an estimate of the initial conditions derived from the geological evolution of the formation (Scenario 2J), especially considering process-based MC simulations as closer to reality of diffusion in claystones. Whether this approach is transferable to formations with a similar geochemical system and known geology but without location specific geochemical data will be examined in future works.
5.2. Geochemical System Governs Uranium Migration
Geochemical pore water gradients in heterogenous systems increase the migration length from a uranium source in the Opalinus Clay. We quantified the impact of the measured and simulated geochemical gradient on the migration lengths of uranium with +4 m (Scenario 2J-A) and +24 m (Scenario 1R-A, Figure 7a,b) for the hydro-geological system of the Opalinus Clay at Mont Terri in relation to homogeneous, meaning geochemically constant, SC models [16]. Simulations were performed using SC as well as MC models, whereby both SC models, homogeneous and heterogeneous, were used with a of m/s experimentally determined for uranium in the Opalinus Clay by Joseph et al. [20]. Thereby, the comparison between homogeneous and our heteregenous SC simulations showed the influence of the geochemical gradients on the sorption capacity. The deviations between heterogeneous MC and SC simulations additionally demonstrate the impact on diffusion. However, as there were no significant differences between MC and SC simulations on the host rock scale (±5 m, Figure 7a,b), the differences in migration lengths can be attributed to the geochemical gradient and associated changes in the sorption capacity. This means experimentally determined can be used in SC models for the host rock scale. However, this does not apply for the respective values.
Uranium migrates farther in the formation considering the geochemical gradients due to an associated decrease in sorption capacity from the peak of the concentration gradient towards the embedding aquifers. From a conceptual point of view, the in the homogeneous simulations is constant over the whole model length and thus the ratio between sorbed and transported uranium from one model element to the next is the same with every transport step. In contrast, the between two model elements differs in the heterogeneous simulations. From the highest values at a depth of around 160 m below contact Opalinus Clay and Dogger limestone it decreases by up to one order of magnitude towards the aquifers (Figure 7c). This means that with each transport step towards the aquifers, proportionally less uranium is sorbed and thus more is transported by diffusion compared to the homogeneous model with constant . One important parameter for the sorption of uranium on clay minerals is the pH [16], which also provides the geochemical explanation for the changes in within the gradients. The pH controls speciation of uranium as well as the charge of the functional groups on the clay mineral surfaces [48,49]. With rising pH above 7, sorption of uranium on clay minerals decreases due to changes in the sorption processes from cation exchange to surface complexation [33,34,48,50]. Further, the negative surface charge of the clay minerals also increases and thus negatively charged species are more repelled. As uranium is predominantly present in anionic and neutral complexes with and [8,16] in the investigated geochemical system, less uranium is sorbed with rising pH as the proportion of these complexes additionally increases [49]. Within the modelled pH profiles (Figure 6c,g), the lowest values were observed at a depth of around 160 m (pH = 7.4). From that point, values of pH increases towards the aquifers by up to 0.7 log units (pH = 8.1) before they decrease again. The profiles were opposed to the pH, accordingly (Figure 7c). Moreover, as pH is above 7, sorption of uranium increases with ionic strength due to changes in the electrochemical interaction [48,50]. The ionic strength governs the thickness of the DDL, that compensates the negative surface charge of the clay minerals by the attraction of cations. This means, with decreasing ionic strength, the thickness of the DDL increases and thus the repulsion of negatively charged species [38,44]. This also explains, why the migration lengths for the two investigated locations as well as towards the Dogger and Liassic aquifer differ (Figure 7a,b). Consequently, the location of a potential repository within a geochemical gradient is important as uranium migrates farther with decreasing gradients compared to the opposite direction.
The of the system is more decisive for the migration length of uranium than the geochemical gradient. The differences between homogeneous and heterogeneous simulations and with that the impact of the geochemical gradient on uranium migration lengths were at maximum +9 m and less pronounced for scenario MC-2J-A compared to +24 m for scenario SC-1R-A, although the pore water profiles, especially pH, were almost identical (Figure 6). Further, values of scenario 1R-A were roughly an order of magnitude lower compared to 2J-A (Figure 7c), so that uranium migrated twice as far (Figure 7a,b). This can be explained by the difference in of around 0.25 log units between both scenarios (Figure 6d,h). With increasing concentration of dissolved carbonate in the system, sorption of uranium decreases due to the formation of ternary complexes [50,51,52,53] as already discussed by Hennig et al. [16]. This in turn means, the lower the value of the considered system, the higher are the associated sorption capacities for uranium and the influence of the geochemical gradient on the migration lengths is consequently diminished as can be seen in our simulation results (Figure 7a). However, the influence of the gradient becomes more dominant with increasing . For instance, uranium migrated farther in the heterogeneous simulations for a of around bar compared to the homogeneous models with a of bar. Accordingly, the priority list for uranium migration in the Opalinus Clay provided by Hennig and Kühn [8] (> concentration > pH > pe > hydro-physical parameters > amount of clay minerals) can be confirmed and revised as follows: > hydro-geological system and inherent geochemical gradient > mineralogy (heterogeneity and clay mineral quantity). Moreover, experimentally determined values can not be applied to complex heterogeneous hydro-geological systems like the Opalinus Clay at Mont Terri.
6. Conclusions and Outlook
Heterogeneous models with resulting geochemical gradients significantly influence the migration of uranium in terms of increased migration lengths. The impact of a geochemical gradient on uranium diffusion and sorption was shown in one-dimensional simulations for the hydro-geological system of the Opalinus Clay at the Mont Terri anticline (Switzerland) with single-(SC) and multi-component (MC) diffusion approaches by comparing the migration lengths with homogeneous, e.g., geochemically constant, SC models. In contrast to SC models, where one diffusion coefficient is used for all species, with the MC approach, each species in the system is assigned its own diffusion coefficient and thus a more process-based description of diffusive transport is enabled. For this, an empirical medium-specific parameter needs to be calibrated, which we did successfully by means of present-day pore water data and a laboratory diffusion experiment with uranium and Opalinus Clay. Sorption processes were integrated via surface complexation and cation exchange using a bottom-up approach and quantified by means of the distribution coefficient (m/kg). By comparing the migration lengths of the SC models, homogeneous and heterogeneous, the influence of the geochemical gradient on uranium sorption can be determined and on diffusion by the heterogeneous SC and MC results. Numerical simulations are required to quantify diffusion of uranium for a heterogeneous system on the repository scale.
The hydro-geological system need to be conceptualised and calibrated first before the subsequent uranium migration within a geochemical gradient can be quantified for a simulation time of one million years. The Opalinus Clay and Liassic shales are part of a 210 m thick low permeable section embedded between Dogger (hanging wall) and Liassic aquifers (footwall). Both aquifers form the current hydro-geological boundaries of the system. Erosion of the anticline in certain areas led to flushing of the aquifers with fresh-water and subsequent diffusive exchange with the pore waters of the low permeable section. The Dogger aquifer was activated about six million years and the Liassic 0.5 million years ago resulting in an asymmetric pore water profile within the Opalinus Clay and geochemical pore water gradients.
Present-day pore water data from comprehensive borehole analyses at the underground laboratory Mont Terri were used to calibrate various models. Two scenarios for the composition of the pore water prior to activation of the aquifers were used. Scenario 1R is based on Opalinus Clay pore water from the nearby Mont Russelin, where the aquifers have and had no contact with meteoric water and the pore waters are therefore considered as unaffected representing unchanged chemical signatures since deposition. Scenario 2J is a combination of Liassic groundwater from Mont Russelin and Jurassic sea water according to the time of deposition of the Opalinus Clay 180 Ma ago. The pore waters were initially equilibrated depending on with the inherent carbonates (calcite, dolomite, and siderite) as well as pyrite governing pH, redox state and concentrations of main ions of the system. Due to the uncertainty regarding the atmospheric around the time of deposition, two values were used. The of case A was bar corresponding to the value around the Triassic-Jurassic-Boundary (TJB) 200 Ma ago and for case B a of bar was used according to post-TJB values. The application of MC diffusion resulted in higher concentrations of and and lower values compared to the SC simulations due to differences in the and thus a decreased diffusive exchange between aquifers and low permeable section. Accordingly, best visual match between observed and modelled profiles were obtained for the simulations SC-1R-A and MC-2J-A and were therefore selected for the subsequent uranium migration. Pore water profiles were reproduced solely by diffusive exchange between aquifers and Opalinus Clay for both scenarios and an initial of bar. Our results thus indicate that the in the Opalinus Clay correspond to old signatures of the TJB.
Migration lengths of homogeneous and heterogeneous models deviated, what can be attributed to changes in the sorption considering the gradients. No significant differences between heterogeneous MC and SC simulations (±5 m) were observed. Therefore, the geochemical gradient has only a minor influence on diffusion processes and major on sorption processes. This implies, that uranium migration in the Opalinus Clay can be adequately quantified with SC models using experimentally determined diffusion coefficients, but this does not apply to the respective values.
Depending on the location of a potential repository within the geochemical gradient, uranium migrated between +4 m and +24 m farther through the formation compared to homogeneous models due to a decreased sorption capacity associated with the gradients. Two different depths of a potential repository within the geochemical gradients were investigated. One in the centre of the low permeable section with maximum migration distances of 50 m and 40 m towards the Dogger and Liassic aquifer (Scenario 1R-A), and the other around the peak of the concentration gradient with migration lengths of 30 m and 35 m (Scenario 1R-A), respectively. Consequently, with increasing ionic strength, more uranium is sorbed on the clay minerals and thus migrates less far through the formation. The thickness of the diffuse double layers (DDL) compensating the negative surface charge of the clay minerals depends on ionic strength. The more ions are dissolved in the pore water, the thinner is the DDL and ions can sorb on the functional groups of the clay minerals. Besides the ionic strength, sorption is mainly governed by the pH profile as values increase towards the aquifers. A rise in pH is associated with a decrease in uranium sorption due to changes in the speciation and sorption process. The proportion of anionic and neutral, ternary uranyl complexes increases with pH and thus less uranium is available for sorption. Furthermore, the sorption processes change from cation exchange to surface complexation and the negative surface is amplified by an increase in pH leading to stronger repulsion of negatively charged species from the surfaces. Therefore, ionic strength and pH of the geochemical gradient govern uranium sorption and lead to a decrease in about one order of magnitude with the gradient towards the aquifers. Consequently, experimental determined values cannot be applied for the entire host rock in heterogeneous system, because the geochemistry of the system strongly impacts sorption processes.
The influence of the geochemical gradient on uranium sorption and thus its migration lengths increases with values of the system. The migration lengths of scenario 1R-A were twice as far as for scenario 2J-A with maximum distances of 25 m and 20 m towards the Dogger and Liassic aquifer, respectively. Moreover, the difference between migration lengths was less pronounced for scenario 2J-A with a maximum of +9 m in relation to 1R-A with +24 m. The reason for this is the approximately 0.2 log units difference in between scenario 1R-A with a value of bar and 2J-A with bar. The of the considered geochemical system is the most controlling factor for uranium sorption processes in the Opalinus Clay. With increasing , sorption of uranium decreases due to the formation of the ternary uranyl complexes. Therefore values of 2J-A with maximum values of (m/kg) were almost an order of magnitude larger compared to 1R-A with (m/kg). Accordingly, the influence of the geochemical gradient decreases for values bar as sorption increases. Therefore, the governing parameters for uranium migration can be ordered in descending priority: > hydro-geological system and inherent geochemical gradients > mineralogy (heterogeneity and clay quantity).
The sensitivity of uranium sorption processes requires a precise description and quantification of the geochemical system for future performance assessments. Otherwise, the uncertainty in maximum diffusion length can be several tens of metres. However, the uranium concentration close to the aquifers were below or equal the background concentration and thus the bounding aquifers were not reached and uranium is effectively retained within the host rock. Whether our findings can be transferred to other potential clay formations needs to be examined in detail in future works. Nevertheless, our findings provide orientation and a workflow for similar geochemical systems.
Supplementary Materials
The following are available online at https://0-www-mdpi-com.brum.beds.ac.uk/article/10.3390/min11101087/s1, Table S1: Summary of the concentrations of the pore water components used for model calibration, S2: Adapted log K of calcite, Figure S3: Concentration profiles of pore water components, Figure S4: Modelled concentration profiles of pore water components according to scenario 1R, Figure S5: Modelled concentration profiles of pore water components according to scenario 2J.
Author Contributions
Conceptualization, T.H. and M.K.; software, T.H.; investigation, T.H.; writing—original draft preparation, T.H.; writing—review and editing, T.H. and M.K.; supervision, M.K.; and funding acquisition, M.K. Both authors have read and agreed to the published version of the manuscript.
Funding
This research was funded by the German Federal Ministry of Education and Research (project number 02NUK053D), the Helmholtz Association (project number SO-093) and the GFZ German Research Centre for Geosciences Potsdam.
Institutional Review Board Statement
Not applicable.
Informed Consent Statement
Not applicable.
Data Availability Statement
Data is contained within the article and supplementary material.
Acknowledgments
The authors would like to thank M. Wetzel and M. Tranter for their helpful feedback improving the manuscript.
Conflicts of Interest
The authors declare that they have no known competing financial interests or personal relationships that could have appeared to influence the work reported in this paper.
Abbreviations
The following abbreviations are used in this manuscript:
| DDL | Diffuse double layer |
| Effective diffusion coefficient (m/s) | |
| Pore water diffusion coefficient (m/s) | |
| Self-diffusion coefficient in water (m/s) | |
| Porosity (-) | |
| Distribution coefficient (m/kg) | |
| MC | Multi-component |
| n | medium-specific, empirical exponent in Archie’s law (n) |
| Partial pressure of carbon dioxide (bar) | |
| SC | Single-component |
| TJB | Triassic-Jurassic-Boundary |
References
- IAEA. Scientific and Technical Basis for the Geological Disposal of Radioactive Wastes; Technical Report; International Atomic Energy Agency: Vienna, Austria, 2003. [Google Scholar]
- Van Loon, L.R.; Soler, J.M.; Jakob, A.; Bradbury, M.H. Effect of confining pressure on the diffusion of HTO, 36Cl− and 125I− in a layered argillaceous rock (Opalinus Clay): Diffusion perpendicular to the fabric. Appl. Geochem. 2003, 18, 1653–1662. [Google Scholar] [CrossRef]
- Van Loon, L.R.; Wersin, P.; Soler, J.M.; Eikenberg, J.; Gimmi, T.; Hernán, P.; Dewonck, S.; Savoye, S. In-situ diffusion of HTO, 22Na+, Cs+ and I− in Opalinus Clay at the Mont Terri underground rock laboratory. Radiochim. Acta 2004, 92, 757–763. [Google Scholar] [CrossRef] [Green Version]
- Wersin, P.; Soler, J.M.; Van Loon, L.; Eikenberg, J.; Baeyens, B.; Grolimund, D.; Gimmi, T.; Dewonck, S. Diffusion of HTO, Br−, I−, Cs+, 85Sr2+ and 60Co2+ in a clay formation: Results and modelling from an in situ experiment in Opalinus Clay. Appl. Geochem. 2008, 23, 678–691. [Google Scholar] [CrossRef]
- Leupin, O.X.; Van Loon, L.R.; Gimmi, T.; Wersin, P.; Soler, J.M. Exploring diffusion and sorption processes at the Mont Terri rock laboratory (Switzerland): Lessons learned from 20 years of field research. Swiss J. Geosci. 2017, 110, 391–403. [Google Scholar] [CrossRef] [Green Version]
- Noseck, U.; Brendler, V.; Flügge, J.; Stockmann, M.; Britz, S.; Lampe, M.; Schikora, J.; Schneider, A. Realistic Integration of Sorption Processes in Transport Codes for Long-Term Safety Assessments; Gesellschaft fuer Anlagen-und Reaktorsicherheit mbH (GRS): Berlin, Germany, 2012. [Google Scholar]
- Ma, B.; Charlet, L.; Fernandez-Martinez, A.; Kang, M.; Madé, B. A review of the retention mechanisms of redox-sensitive radionuclides in multi-barrier systems. Appl. Geochem. 2019, 100, 414–431. [Google Scholar] [CrossRef]
- Hennig, T.; Kühn, M. Surrogate model for multi-component diffusion of uranium through Opalinus Clay on the host rock scale. Appl. Sci. 2021, 11, 786. [Google Scholar] [CrossRef]
- Nagra. Project Opalinus Clay—Safety Report. Nagra Tech. Rep. 2002, NTB 02-05, 472.
- Pearson, F.J.; Arcos, D.; Bath, A.; Boisson, J.Y.; Fernández, A.M.; Gäbler, H.E.; Gaucher, E.C.; Gautschi, A.; Griffault, L.; Hernán, P.; et al. Mont Terri Project—Geochemistry of Water in the Opalinus Clay Formation at the Mont Terri Rock Laboratory; Technical Report 5; Federal Office for Water and Geology, FOWG: Bern, Switzerland, 2003. [Google Scholar]
- Wersin, P.; Gaucher, E.C.; Gimmi, T.; Leupin, O.X.; Mäder, U.K.; Pearson, F.J.; Thoenen, T.; Tournassat, C. Geochemistry of Pore Waters in Opalinus Clay at Mont Terri: Experimental Data and Modelling; Mont Terri Project, Technical Report; Mont Terri: Jura, Switzerland, 2009; Volume TR 2008-06. [Google Scholar]
- Lauper, B.; Jaeggi, D.; Deplazes, G.; Foubert, A. Multi-proxy facies analysis of the Opalinus Clay and depositional implications (Mont Terri rock laboratory, Switzerland). Swiss J. Geosci. 2018, 111, 383–398. [Google Scholar] [CrossRef] [Green Version]
- Mazurek, M.; Alt-Epping, P.; Bath, A.; Gimmi, T.; Niklaus Waber, H.; Buschaert, S.; Cannière, P.D.; Craen, M.D.; Gautschi, A.; Savoye, S.; et al. Natural tracer profiles across argillaceous formations. Appl. Geochem. 2011, 26, 1035–1064. [Google Scholar] [CrossRef]
- Freivogel, M.; Huggenberger, P. Modellierung bilanzierter Profile im Gebiet Mont Terri—La Croix (Kanton Jura). In Reports of the FOWG, Geology Series, No 4.: Mont Terri Project—Geology, Paleohydrology and Stress Field of the Mont Terri Region; FOWG: Bern, Switzerland, 2003; pp. 7–44. [Google Scholar]
- Metz, V.; Geckeis, H.; González-Robles, E.; Loida, A.; Bube, C.; Kienzler, B. Radionuclide behaviour in the near-field of a geological repository for spent nuclear fuel. Radiochim. Acta 2012, 100, 699–713. [Google Scholar] [CrossRef]
- Hennig, T.; Stockmann, M.; Kühn, M. Simulation of diffusive uranium transport and sorption processes in the Opalinus Clay. Appl. Geochem. 2020, 123. [Google Scholar] [CrossRef]
- Parkhurst, D.L.; Appelo, C.A.J. Description of input and examples for PHREEQC Version 3—A computer program for speciation, batch-reaction, one-dimensional transport, and inverse geochemical calculations. In U.S. Geological Survey Techniques and Methods; US Geological Survey: Reston, VA, USA, 2013; Volume 6, Chapter A43; p. 497. [Google Scholar]
- Thoenen, T.; Hummel, W.; Berner, U.; Curti, E. The PSI/NAGRA Chemical Thermodynamic Database 12/07; Technical Report; Paul Scherrer Institute (PSI): Villigen, Switzerland, 2014. [Google Scholar]
- Mazurek, M.; Alt-Epping, P.; Bath, A.; Gimmi, T.; Waber, H. Natural Tracer Profiles Across Argillaceous Formations: The CLAYTRAC Project; Technical Report; Nuclear Energy Agency: Paris, France, 2009. [Google Scholar]
- Joseph, C.; Van Loon, L.R.; Jakob, A.; Steudtner, R.; Schmeide, K.; Sachs, S.; Bernhard, G. Diffusion of U(VI) in Opalinus Clay: Influence of temperature and humic acid. Geochim. Cosmochim. Acta 2013, 109, 74–89. [Google Scholar] [CrossRef]
- Wersin, P.; Mazurek, M.; Mäder, U.K.; Gimmi, T.; Rufer, D.; Lerouge, C.; Traber, D. Constraining pore water chemistry in a 250 m thick argillaceous rock sequence. Chem. Geol. 2016, 434, 43–61. [Google Scholar] [CrossRef] [Green Version]
- Bossart, P.; Thury, M. Characteristics of the Opalinus Clay at Mont Terri. Reports of the Swiss Geological Survey; No. 3; Mont Terri: Wabern, Switzerland, 2008. [Google Scholar]
- Koroleva, M.; Mazurek, M. Natural Tracer Profile Mont Russelin (NT) Experiment: Natural Tracer Profiles in the Mont Russelin Anticline; Mont Terri Project Technic Note; Mont Terri: Jura, Switzerland, 2009; Volume 2006-24. [Google Scholar]
- Horita, J.; Zimmermann, H.; Holland, H.D. Chemical evolution of seawater during the Phanerozoic: Implications from the record of marine evaporites. Geochim. Cosmochim. Acta 2002, 66, 3733–3756. [Google Scholar] [CrossRef]
- Steinthorsdottir, M.; Jeram, A.J.; McElwain, J.C. Extremely elevated CO2 concentrations at the Triassic/Jurassic boundary. Palaeogeogr. Palaeoclimatol. Palaeoecol. 2011, 308, 418–432. [Google Scholar] [CrossRef]
- Pearson, F.J.; Tournassat, C.; Gaucher, E.C. Biogeochemical processes in a clay formation in situ experiment: Part E—Equilibrium controls on chemistry of pore water from the Opalinus Clay, Mont Terri underground research laboratory, Switzerland. Appl. Geochem. 2011, 26, 990–1008. [Google Scholar] [CrossRef] [Green Version]
- Wersin, P.; Leupin, O.X.; Mettler, S.; Gaucher, E.C.; Mäder, U.; De Cannière, P.; Vinsot, A.; Gäbler, H.E.; Kunimaro, T.; Kiho, K.; et al. Biogeochemical processes in a clay formation in situ experiment: Part A—Overview, experimental design and water data of an experiment in the Opalinus Clay at the Mont Terri underground research laboratory, Switzerland. Appl. Geochem. 2011, 26, 931–953. [Google Scholar] [CrossRef]
- Marion, G.M.; Millero, F.J.; Camões, M.F.; Spitzer, P.; Feistel, R.; Chen, C.T. pH of seawater. Mar. Chem. 2011, 126, 89–96. [Google Scholar] [CrossRef]
- Möller, P.; De Lucia, M. The impact of Mg2+ ions on equilibration of Mg-Ca carbonates in groundwater and brines. Geochemistry 2020, 80, 125611. [Google Scholar] [CrossRef]
- Marques Fernandes, M.; Vér, N.; Baeyens, B. Predicting the uptake of Cs, Co, Ni, Eu, Th and U on argillaceous rocks using sorption models for illite. Appl. Geochem. 2015, 59, 189–199. [Google Scholar] [CrossRef] [Green Version]
- Stockmann, M.; Schikora, J.; Becker, D.A.; Flügge, J.; Noseck, U.; Brendler, V. Smart Kd-values, their uncertainties and sensitivities—Applying a new approach for realistic distribution coefficients in geochemical modelling of complex systems. Chemosphere 2017, 187, 277–285. [Google Scholar] [CrossRef]
- Dzombak, D.A.; Morel, F.M.M. Surface Complexation Modelling: Hydrous Feric Oxide; John Wiley and Sons: New York, NY, USA, 1990; p. 393. [Google Scholar]
- Joseph, C.; Stockmann, M.; Schmeide, K.; Sachs, S.; Brendler, V.; Bernhard, G. Sorption of U(VI) onto Opalinus Clay: Effects of pH and humic acid. Appl. Geochem. 2013, 36, 104–117. [Google Scholar] [CrossRef]
- Hyun, S.P.; Cho, Y.H.; Hahn, P.S.; Kim, S.J. Sorption mechanism of U(VI) on a reference montmorillonite: Binding to the internal and external surfaces. J. Radioanal. Nucl. Chem. 2001, 250, 55–62. [Google Scholar] [CrossRef]
- Reisdorf, A.G.; Hostettler, B.; Jaeggi, D.; Deplazes, G.; Bläsi, H.; Morard, A.; Feist-Burkhardt, S.; Waltschew, A.; Dietze, V.; Menkfeld-Gfeller, U. Litho- and biostratigraphy of the 250 m-deep Mont Terri BDB-1 borehole through the Opalinus Clay and bounding formations, St-Ursanne, Switzerland. In Mont Terri Project, Technical Report; Mont Terri: Jura, Switzerland, 2016; Volume 2. [Google Scholar]
- Van Loon, L.R.; Soler, J.M.; Bradbury, M.H. Diffusion of HTO, 36Cl− and 125I− in Opalinus Clay samples from Mont Terri: Effect of confining pressure. J. Contam. Hydrol. 2003, 61, 73–83. [Google Scholar] [CrossRef]
- Wigger, C.; Van Loon, L.R. Effect of the pore water composition on the diffusive anion transport in argillaceous, low permeability sedimentary rocks. J. Contam. Hydrol. 2018, 213, 40–48. [Google Scholar] [CrossRef] [PubMed]
- Appelo, C.A.J.; Wersin, P. Multicomponent diffusion modelling in clay systems with application to the diffusion of tritium, iodide, and sodium in opalinus clay. Environ. Sci. Technol. 2007, 41, 5002–5007. [Google Scholar] [CrossRef] [PubMed]
- Appelo, C.A.J.; Van Loon, L.R.; Wersin, P. Multicomponent diffusion of a suite of tracers (HTO, Cl, Br, I, Na, Sr, Cs) in a single sample of Opalinus Clay. Geochim. Cosmochim. Acta 2010, 74, 1201–1219. [Google Scholar] [CrossRef]
- Van Loon, L.R.; Glaus, M.A.; Müller, W. Anion exclusion effects in compacted bentonites: Towards a better understanding of anion diffusion. Appl. Geochem. 2007, 22, 2536–2552. [Google Scholar] [CrossRef]
- Kerisit, S.; Liu, C. Molecular simulation of the diffusion of uranyl carbonate species in aqueous solution. Geochim. Cosmochim. Acta 2010, 74, 4937–4952. [Google Scholar] [CrossRef]
- Liu, C.; Shang, J.; Zachara, J.M. Multispecies diffusion models: A study of uranyl species diffusion. Water Resour. Res. 2011, 47, 1–16. [Google Scholar] [CrossRef] [Green Version]
- Wigger, C.; Kennell-Morrison, L.; Jensen, M.; Glaus, M.; Van Loon, L. A comparative anion diffusion study on different argillaceous, low permeability sedimentary rocks with various pore waters. Appl. Geochem. 2018, 92, 157–165. [Google Scholar] [CrossRef]
- Wersin, P.; Gimmi, T.; Mazurek, M.; Alt-Epping, P.; Pȩkala, M.; Traber, D. Multicomponent diffusion in a 280 m thick argillaceous rock sequence. Appl. Geochem. 2018, 95, 110–123. [Google Scholar] [CrossRef]
- Keesmann, S.; Noseck, U.; Buhmann, D.; Fein, E.; Schneider, A. Modellrechnungen zur Langzeitsicherheit von Endlagern in Salz- und Granitformationen; Technical Report GRS-206; Gesellschaft für Anlagen- und Reaktorsicherheit (GRS) mbH: Berlin, Germany, 2005. [Google Scholar]
- Van Loon, L.R.; Leupin, O.X.; Cloet, V. The diffusion of in Opalinus Clay: Measurements of effective diffusion coefficients and evaluation of their importance in view of microbial mediated reactions in the near field of radioactive waste repositories. Appl. Geochem. 2018, 95, 19–24. [Google Scholar] [CrossRef]
- Mazurek, M.; Gautschi, A.; Marschall, P.; Vigneron, G.; Lebon, P.; Delay, J. Transferability of geoscientific information from various sources (study sites, underground rock laboratories, natural analogues) to support safety cases for radioactive waste repositories in argillaceous formations. Phys. Chem. Earth 2008, 33, S95–S105. [Google Scholar] [CrossRef]
- Li, S.; Wang, X.; Huang, Z.; Du, L.; Tan, Z.; Fu, Y.; Wang, X. Sorption and desorption of uranium(VI) on GMZ bentonite: Effect of pH, ionic strength, foreign ions and humic substances. J. Radioanal. Nucl. Chem. 2016, 308, 877–886. [Google Scholar] [CrossRef]
- Saleh, A.S.; Yun, J.I. Equilibrium and kinetics of calcium–uranyl–carbonate adsorption on silica nanoparticles. J. Radioanal. Nucl. Chem. 2017, 314, 93–103. [Google Scholar] [CrossRef]
- Tournassat, C.; Tinnacher, R.M.; Grangeon, S.; Davis, J.A. Modelling uranium(VI) adsorption onto montmorillonite under varying carbonate concentrations: A surface complexation model accounting for the spillover effect on surface potential. Geochim. Cosmochim. Acta 2018, 220, 291–308. [Google Scholar] [CrossRef]
- Fox, P.M.; Davis, J.A.; Zachara, J.M. The effect of calcium on aqueous uranium(VI) speciation and adsorption to ferrihydrite and quartz. Geochim. Cosmochim. Acta 2006, 70, 1379–1387. [Google Scholar] [CrossRef] [Green Version]
- Bachmaf, S.; Planer-Friedrich, B.; Merkel, B.J. Effect of sulfate, carbonate, and phosphate on the uranium(VI) sorption behaviour onto bentonite. Radiochim. Acta 2008, 96, 359–366. [Google Scholar] [CrossRef]
- Philipp, T.; Shams Aldin Azzam, S.; Rossberg, A.; Huittinen, N.; Schmeide, K.; Stumpf, T. U (VI) sorption on Ca-bentonite at (hyper)alkaline conditions—Spectroscopic investigations of retention mechanisms. Sci. Total Environ. 2019, 676, 469–481. [Google Scholar] [CrossRef] [Green Version]
Figure 1.
Erosion history of the Mont Terri anticline and associated fresh-water infiltration into the embedding aquifers of the Opalinus Clay is indicated in the geological profile by the blue arrows. (Modified from Freivogel and Huggenberger [14]).
Figure 1.
Erosion history of the Mont Terri anticline and associated fresh-water infiltration into the embedding aquifers of the Opalinus Clay is indicated in the geological profile by the blue arrows. (Modified from Freivogel and Huggenberger [14]).

Figure 2.
Profile of measured chloride concentrations at Mont Terri (a) is used to define the conceptual model (b) with boundary and initial conditions. The shape of the profile in the low permeable section (Liasic shales and Opalinus Clay) is the result of the time lag in fresh-water infiltration into the bounding aquifers, e.g., the Dogger and Liassic limestones, modified from Pearson et al. [10]. The y-axis is the distance perpendicular to the contact between Opalinus Clay and Dogger limestones.

Figure 3.
Concentration profiles of calcium (a), magnesium (b), pH (c), and (d) as governing parameters of uranium speciation and migration. The data stems from borehole analysis at the underground laboratory Mont Terri. The y-axis is the distance perpendicular to the contact between Opalinus Clay and Dogger limestones.

Figure 4.
Model calibration for further application. The Chloride profile (dots) was reproduced (rRMSE ≤ 5%) for scenario 1R with an initial chloride concentration of around 18.9 g/L using the SC (solid line) as well as the MC diffusion approach (dashed line). Best match using MC diffusion was achieved for an exponent n = 2.

Figure 5.
The model is validated for uranium sorption and diffusion. SC (solid line) as well as MC (dashed line, n = 2) simulation results coincide with the laboratory data (dots) of the diffusion experiment with U(VI) and Opalinus Clay using a mineral composition of 23 wt.% kaolinite, 9 wt.% illite, 4 wt.% illite/smectite mixed layers.

Figure 6.
Pore water profiles of (a,e), (b,f), pH (c,g) and (d,h) were confirmed using the initial concentrations according to scenario 1R (a-d) and scenario 2J (e-h) applying SC (solid and dotted lines) as well as MC diffusion (dashed and dash-dotted lines). Initial pore waters were equilibrated with the carbonates, calcite, dolomite, and siderite, as well as pyrite for of bar (A) and bar (B). Total simulation time was six million years with the footwall aquifer only being active for the last 0.5 million years. The data stem from borehole analysis at the underground laboratory Mont Terri [10].

Figure 7.
Migration of uranium in the Opalinus Clay formation is increased by +4 m to +24 m for heterogeneous systems compared to homogeneous models (red line, Ref. [16]). The uranium source term representing a potential repository was located at a distance of 100 m (a) and 150 m (b) below the contact Opalinus Clay and Dogger limestone (y-axis). SC and MC simulations were performed for scenario SC-1R-A (solid and dashed line) and MC-2J-A (dotted and dash-dotted line) and the corresponding distribution coefficients (m/kg) of uranium between pore water and mineral phases (c) were given.


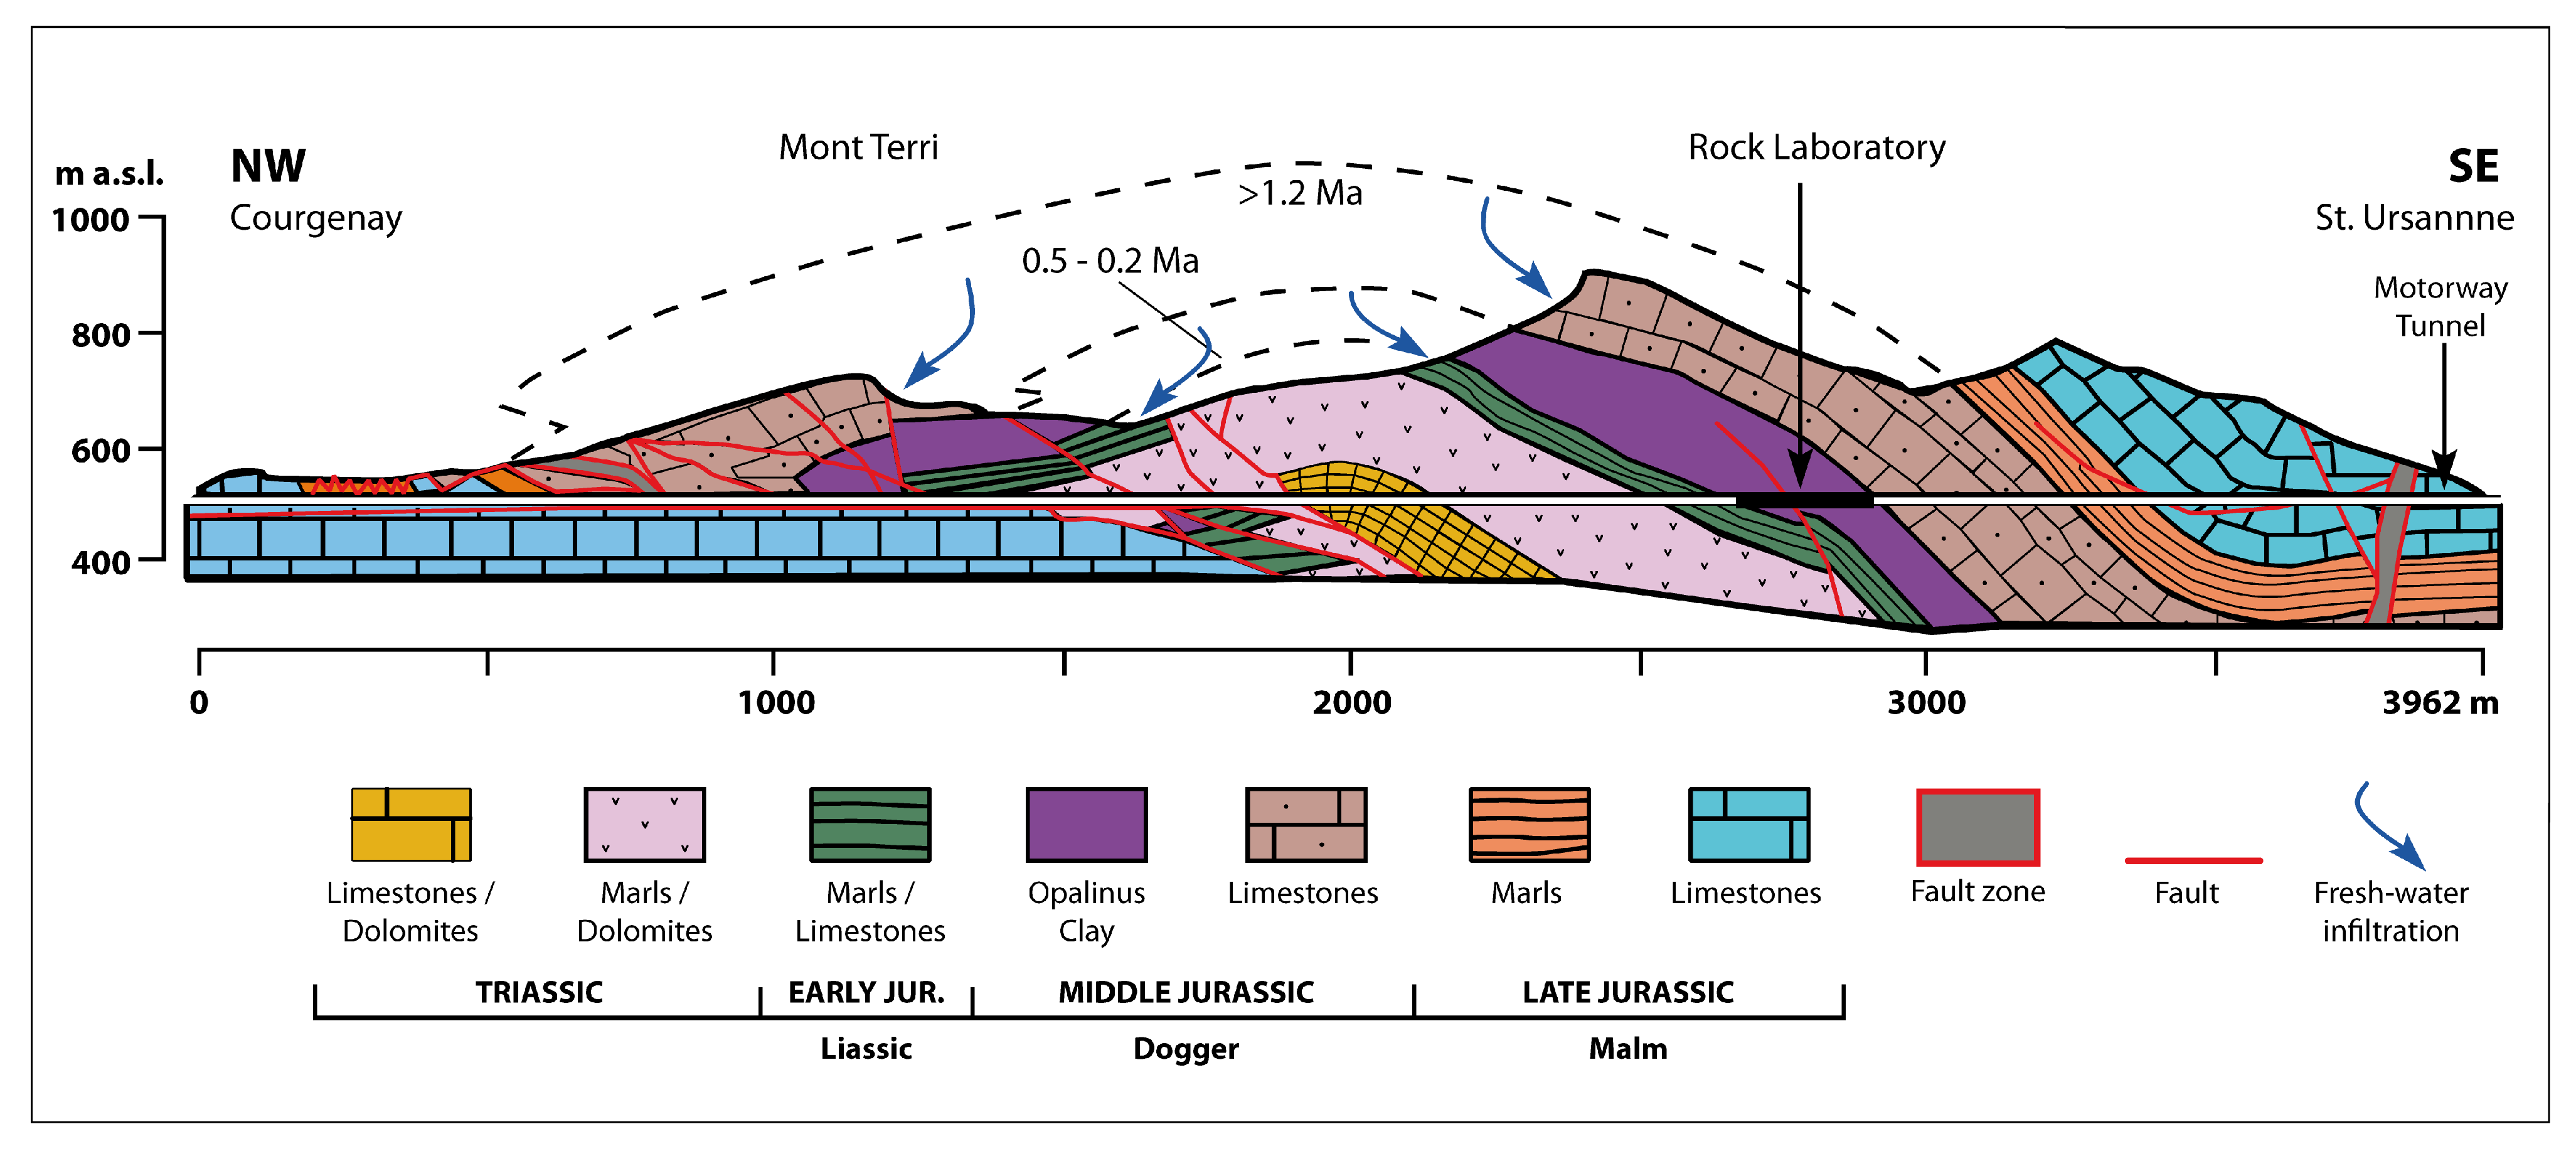
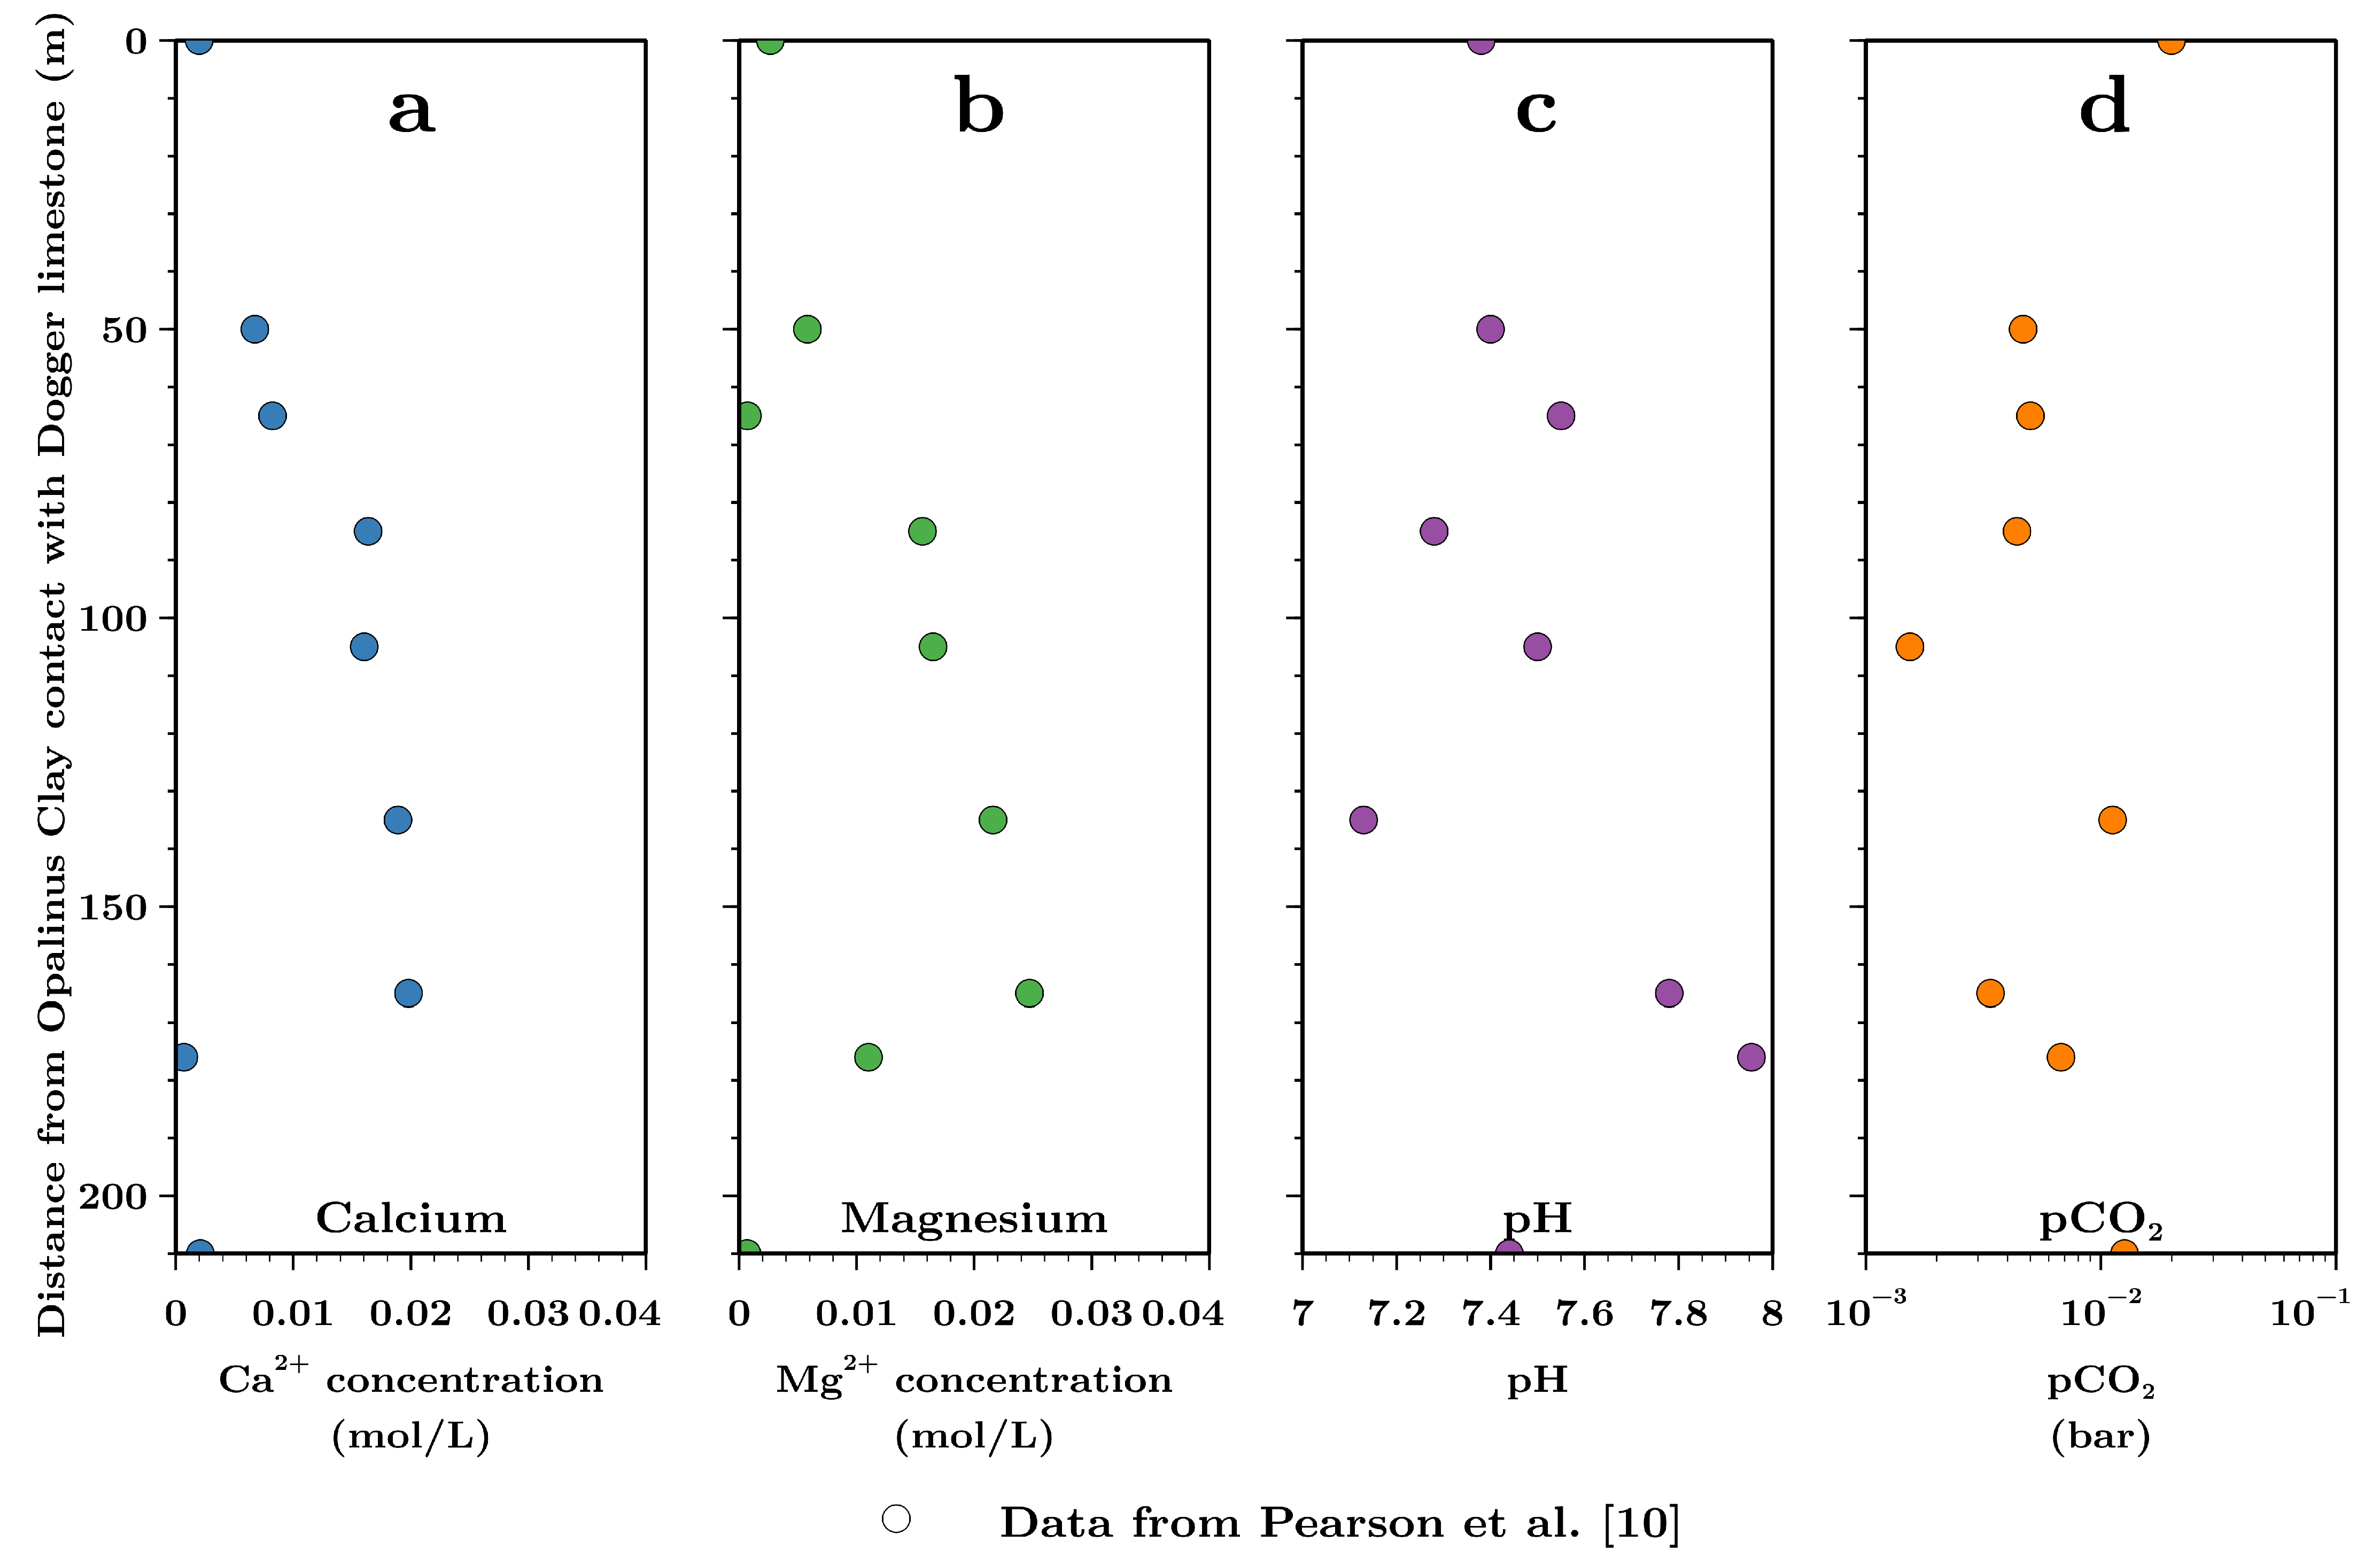
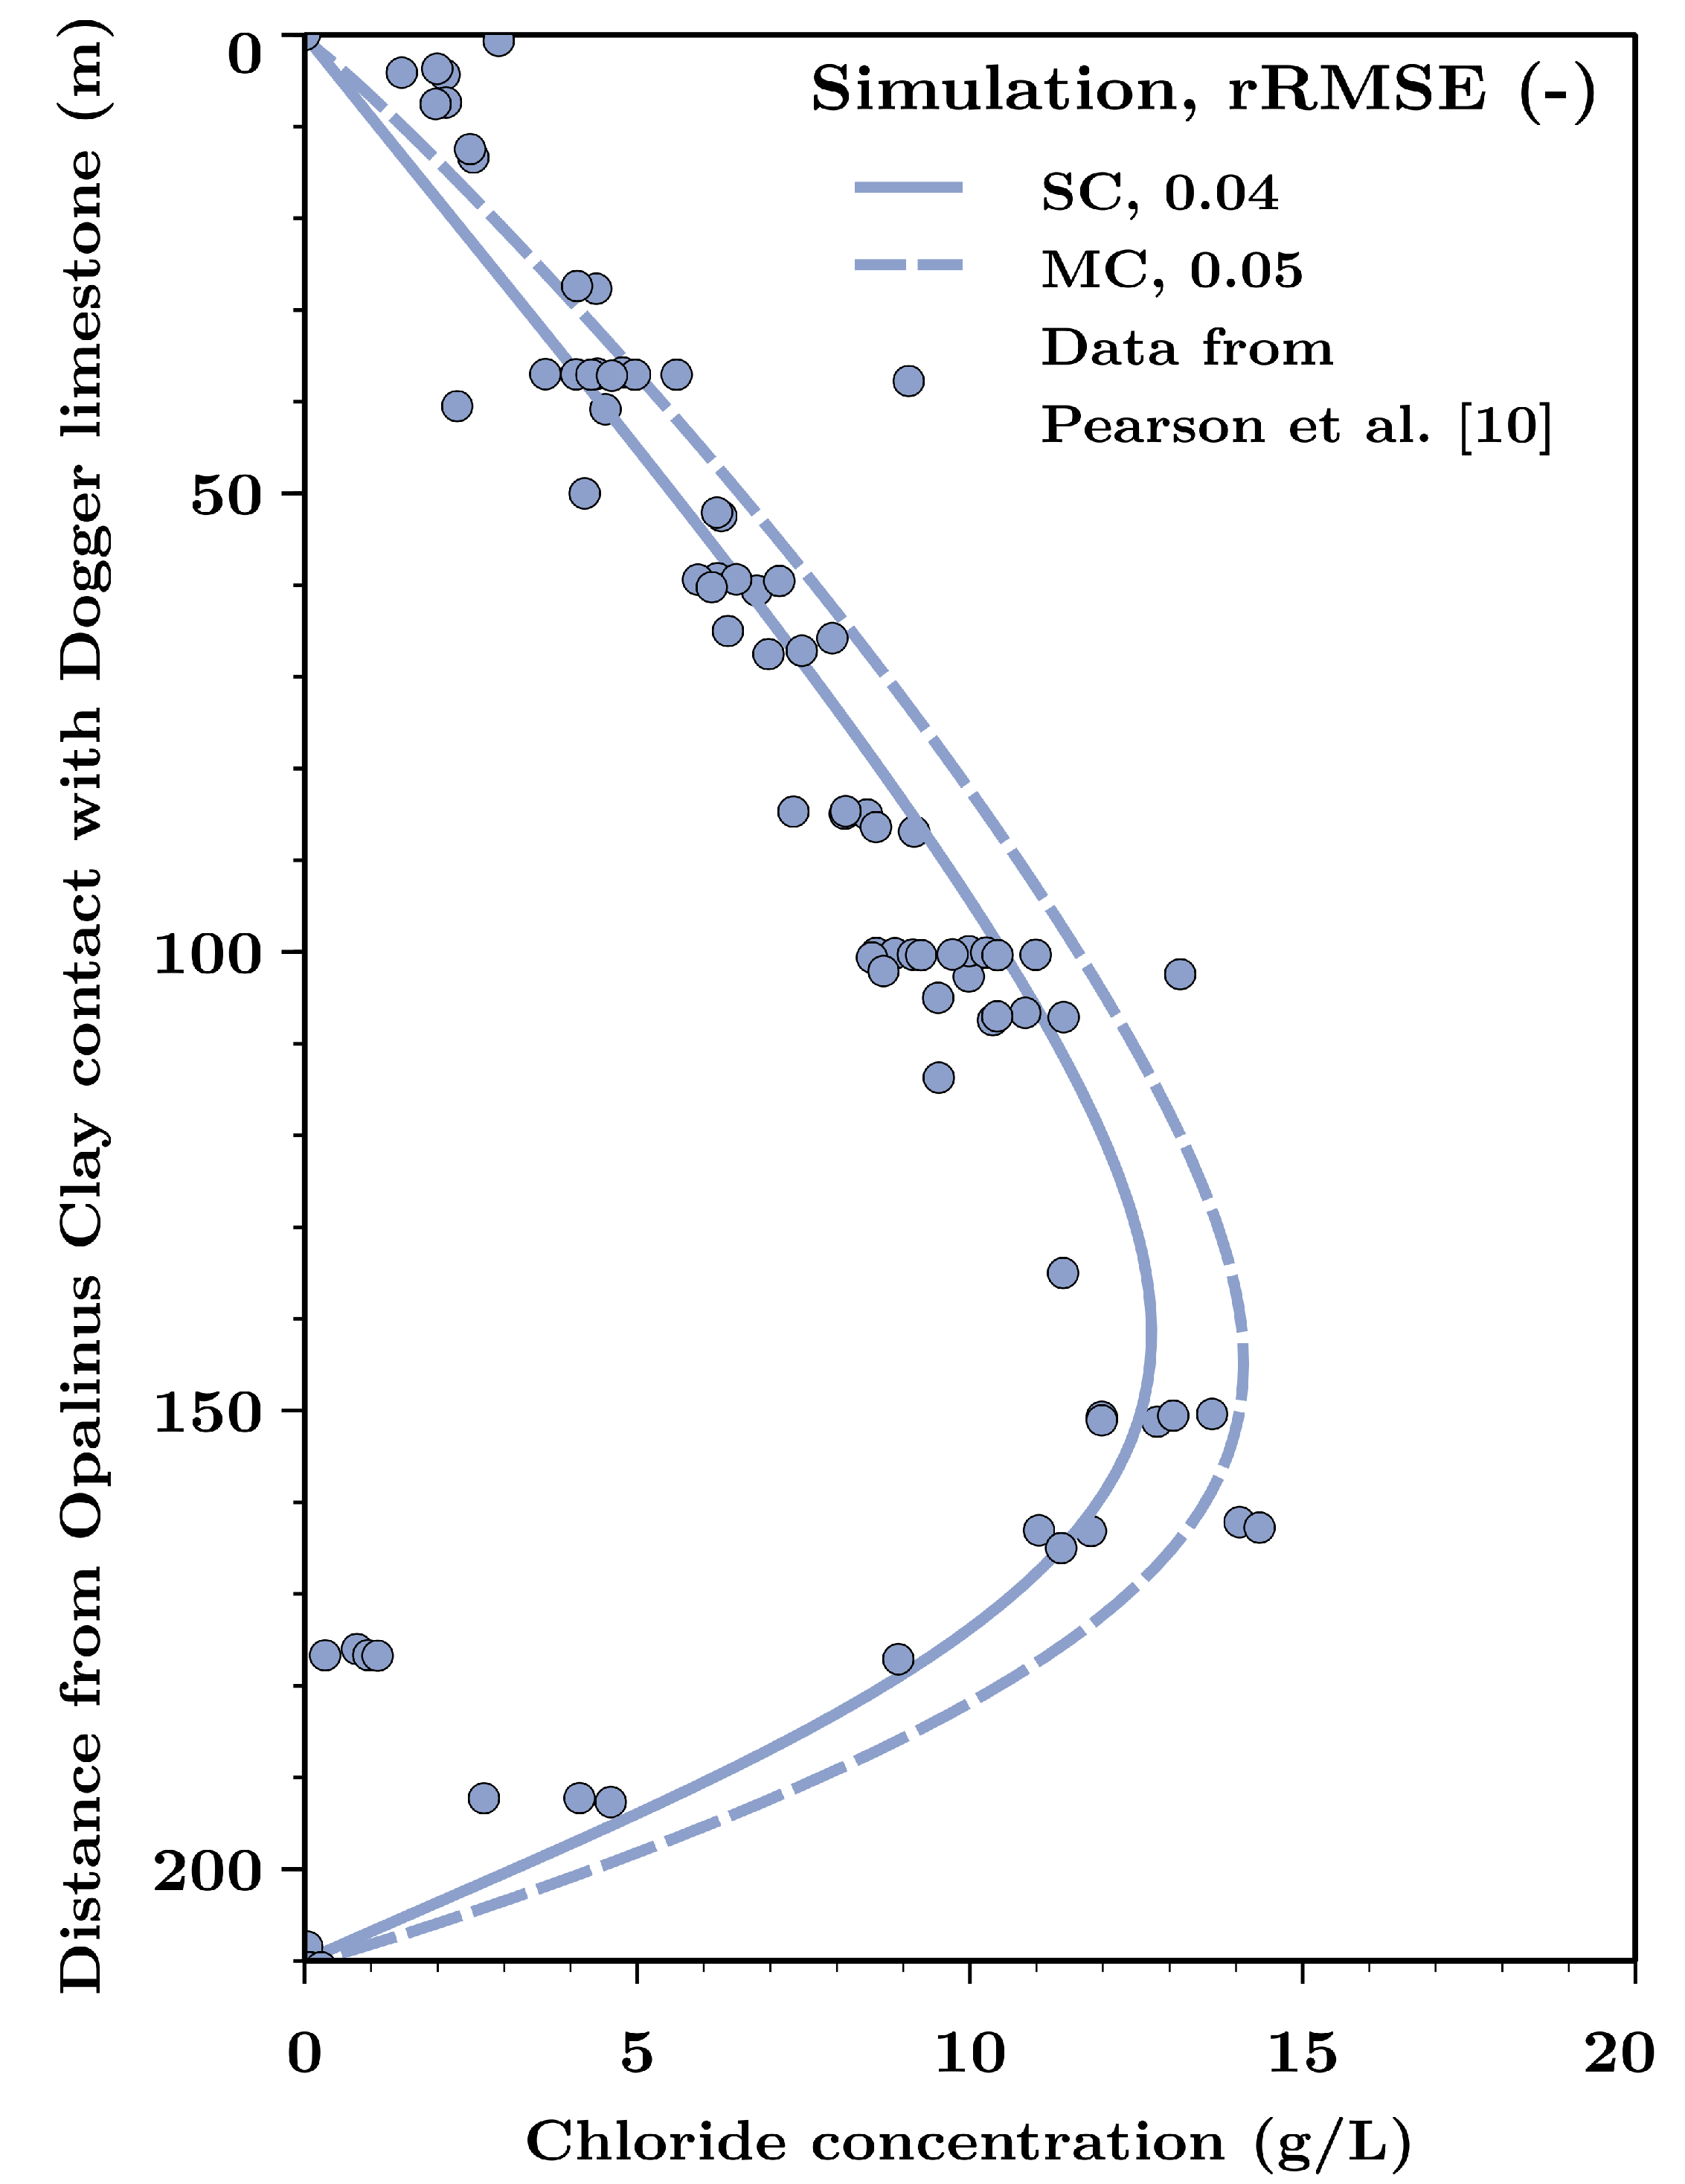
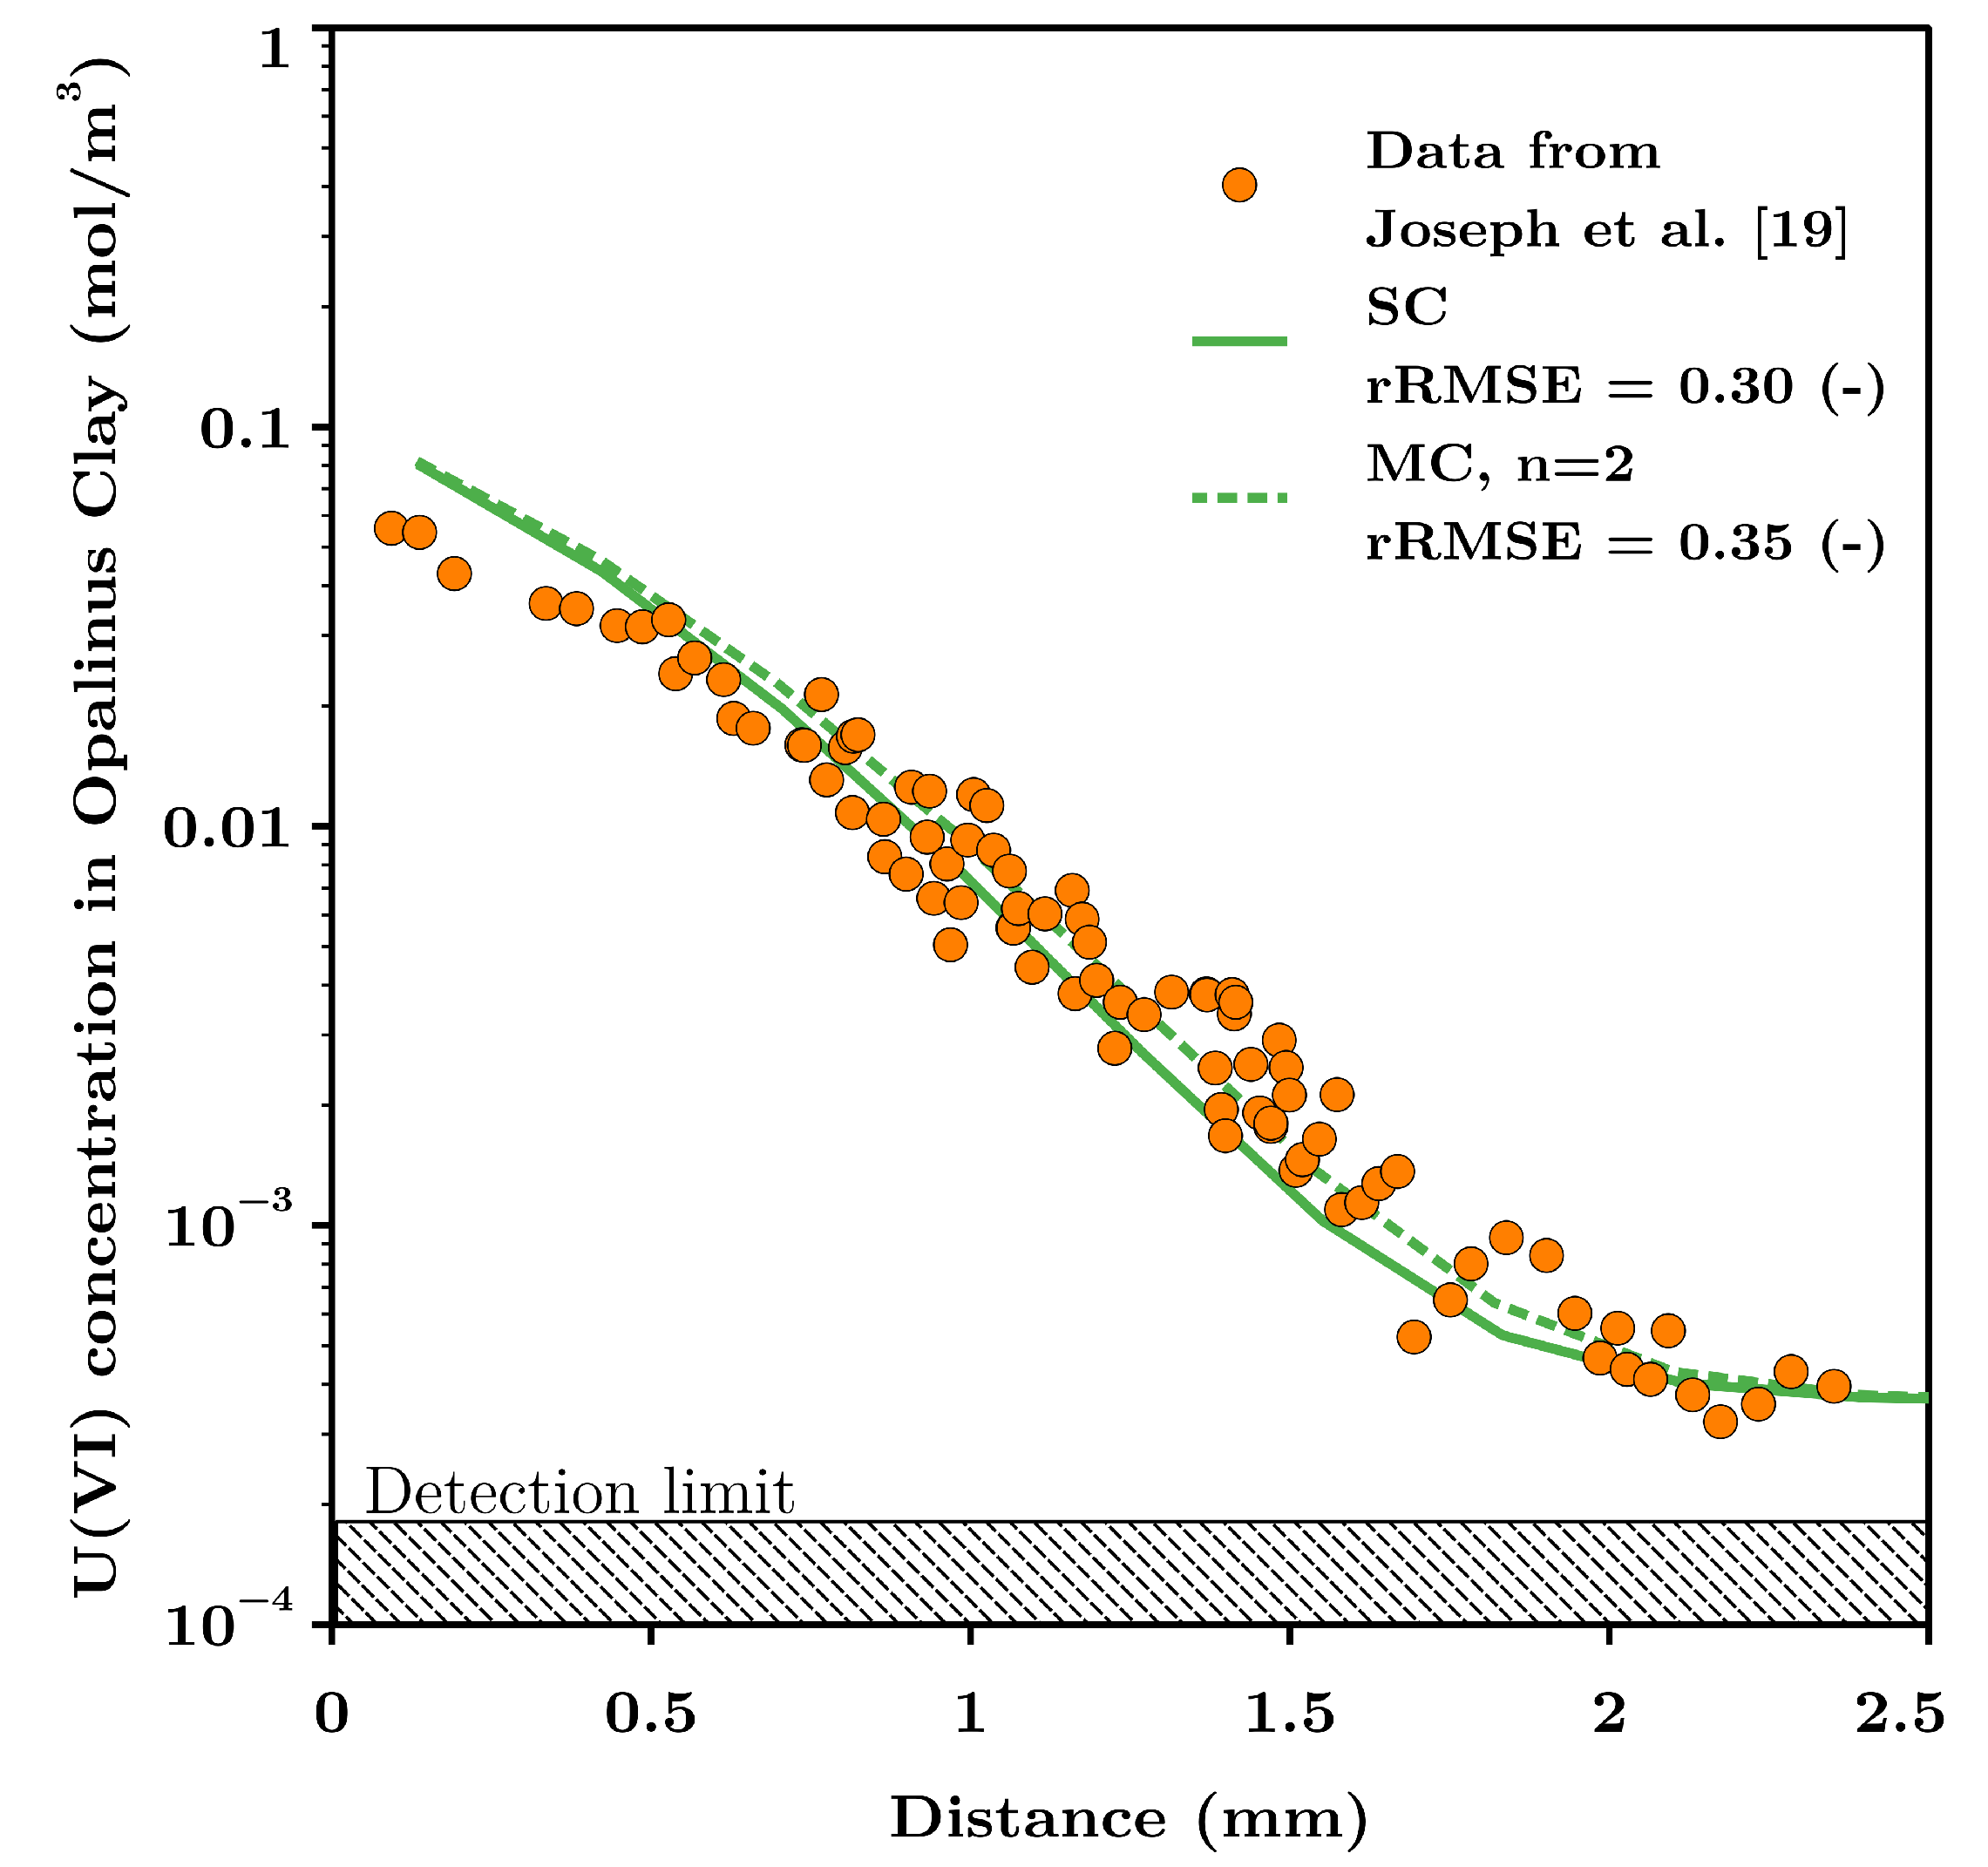
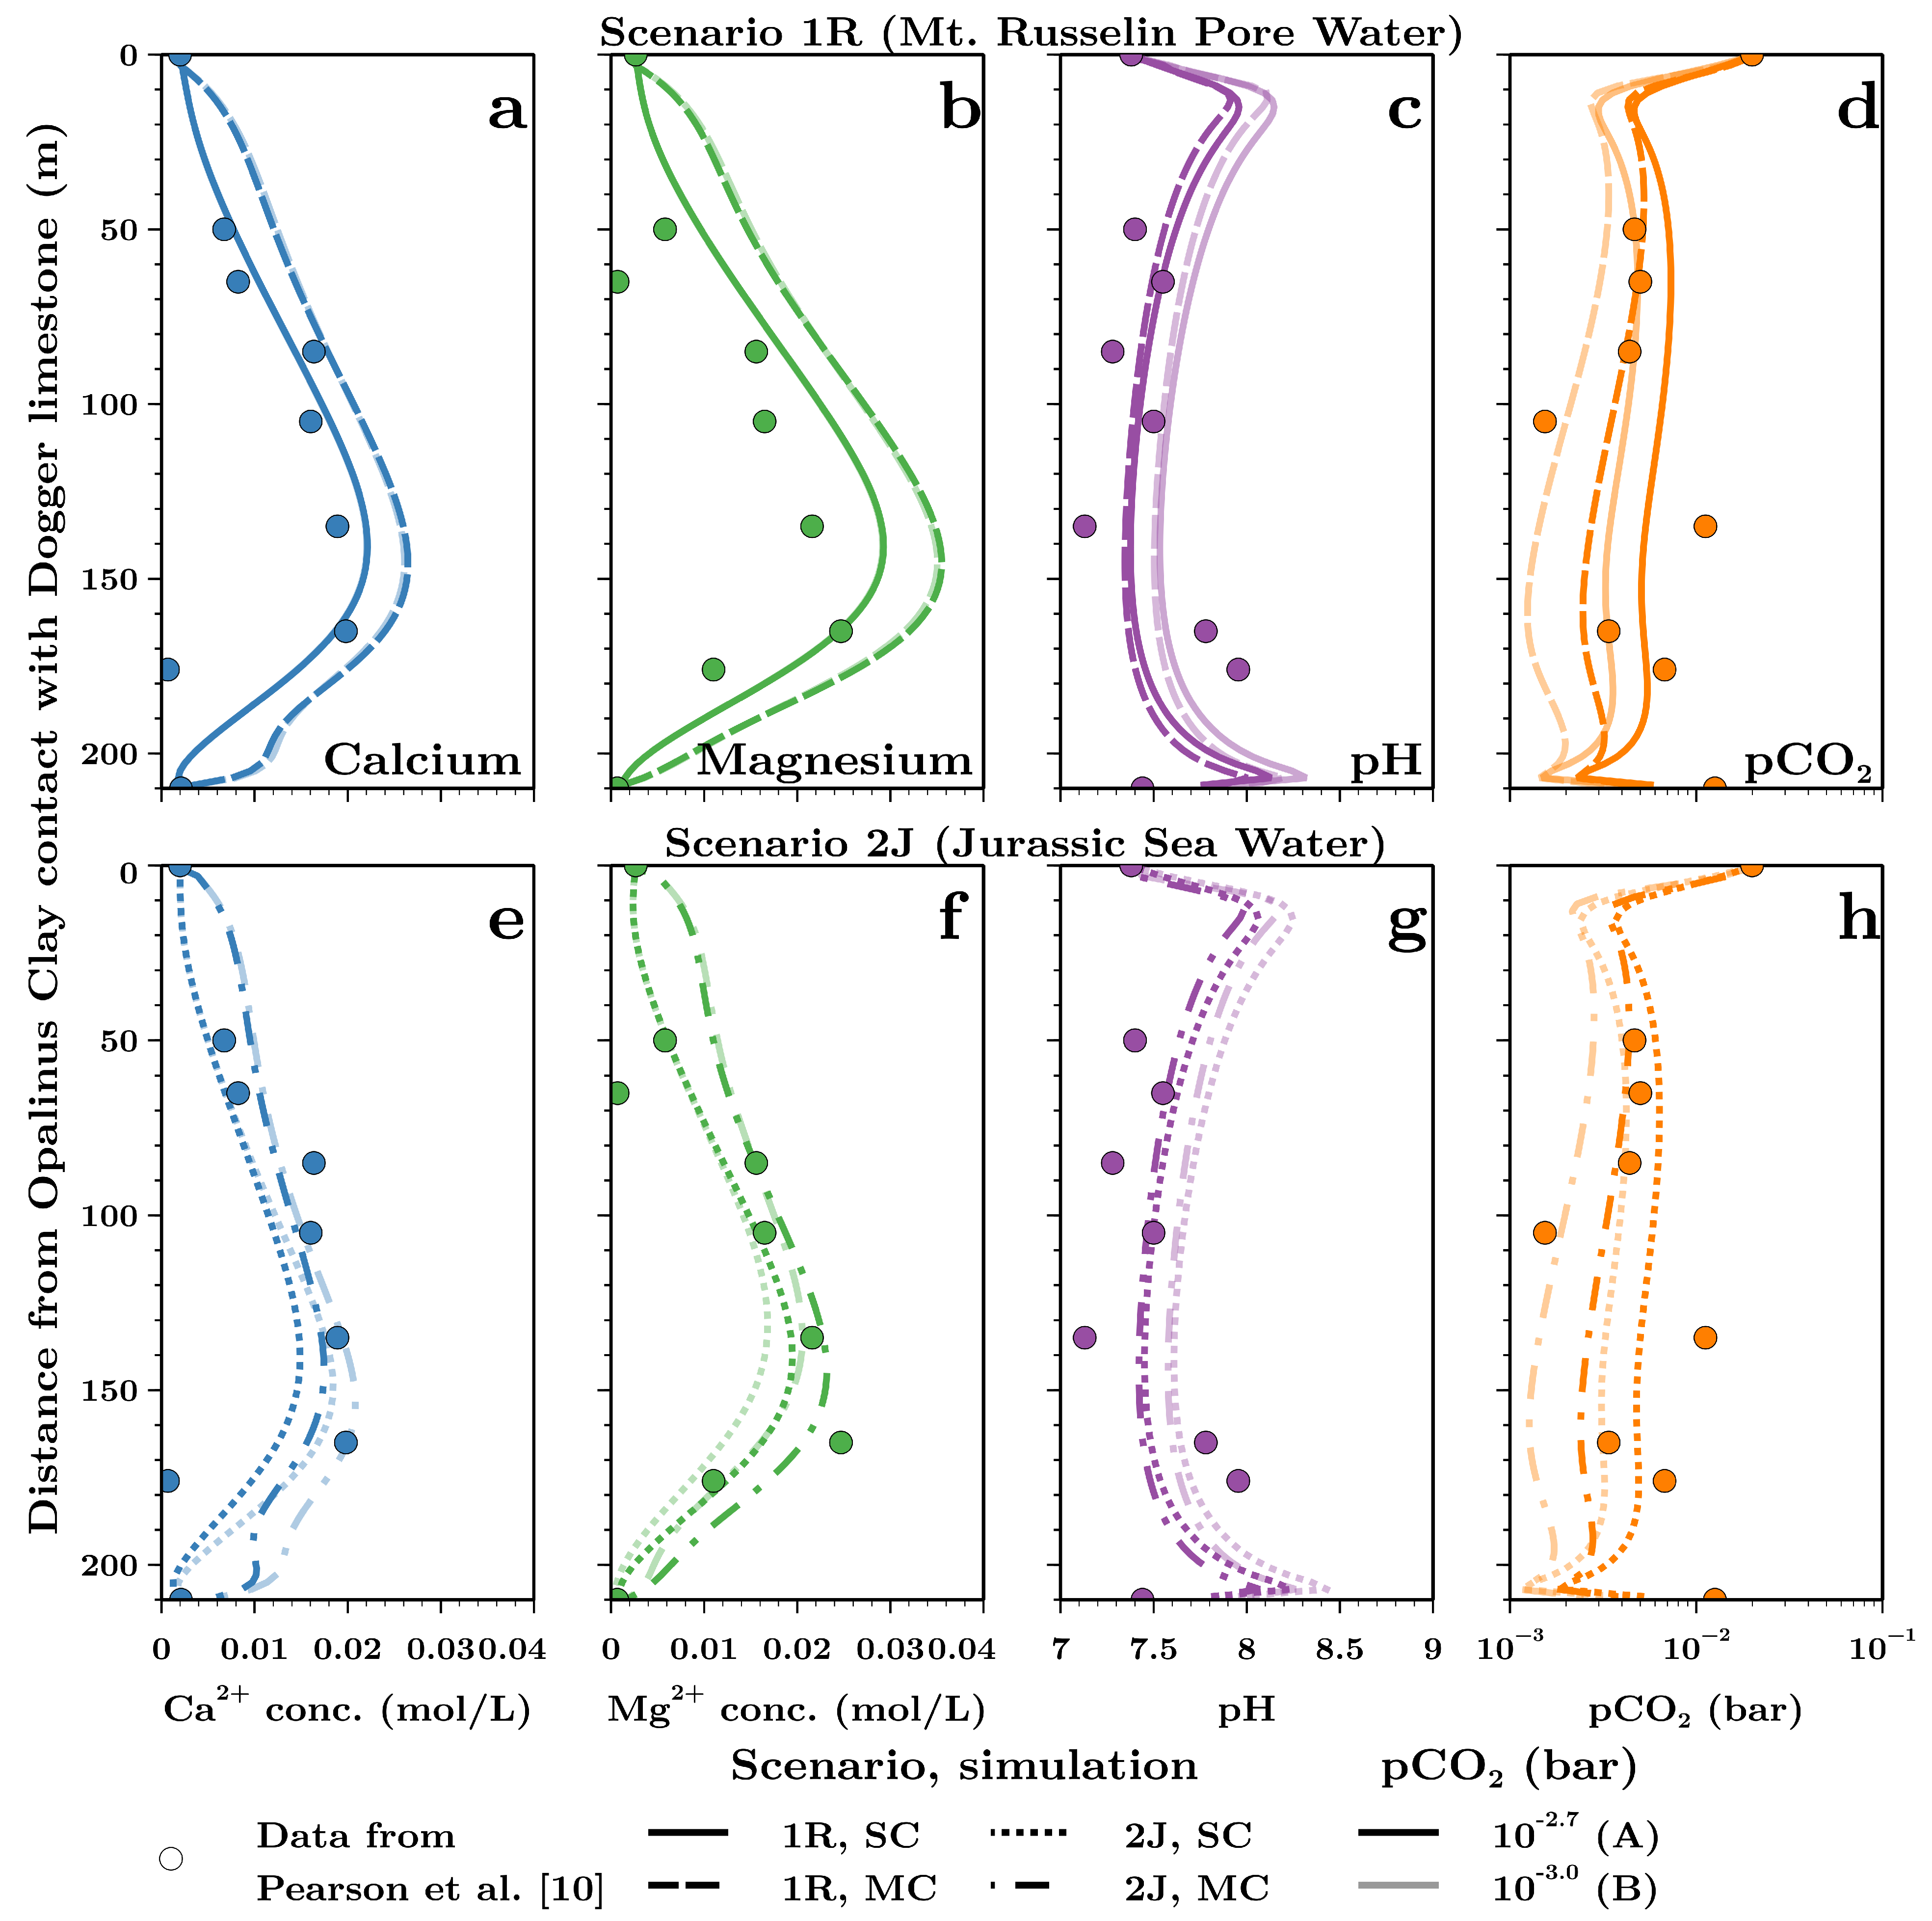
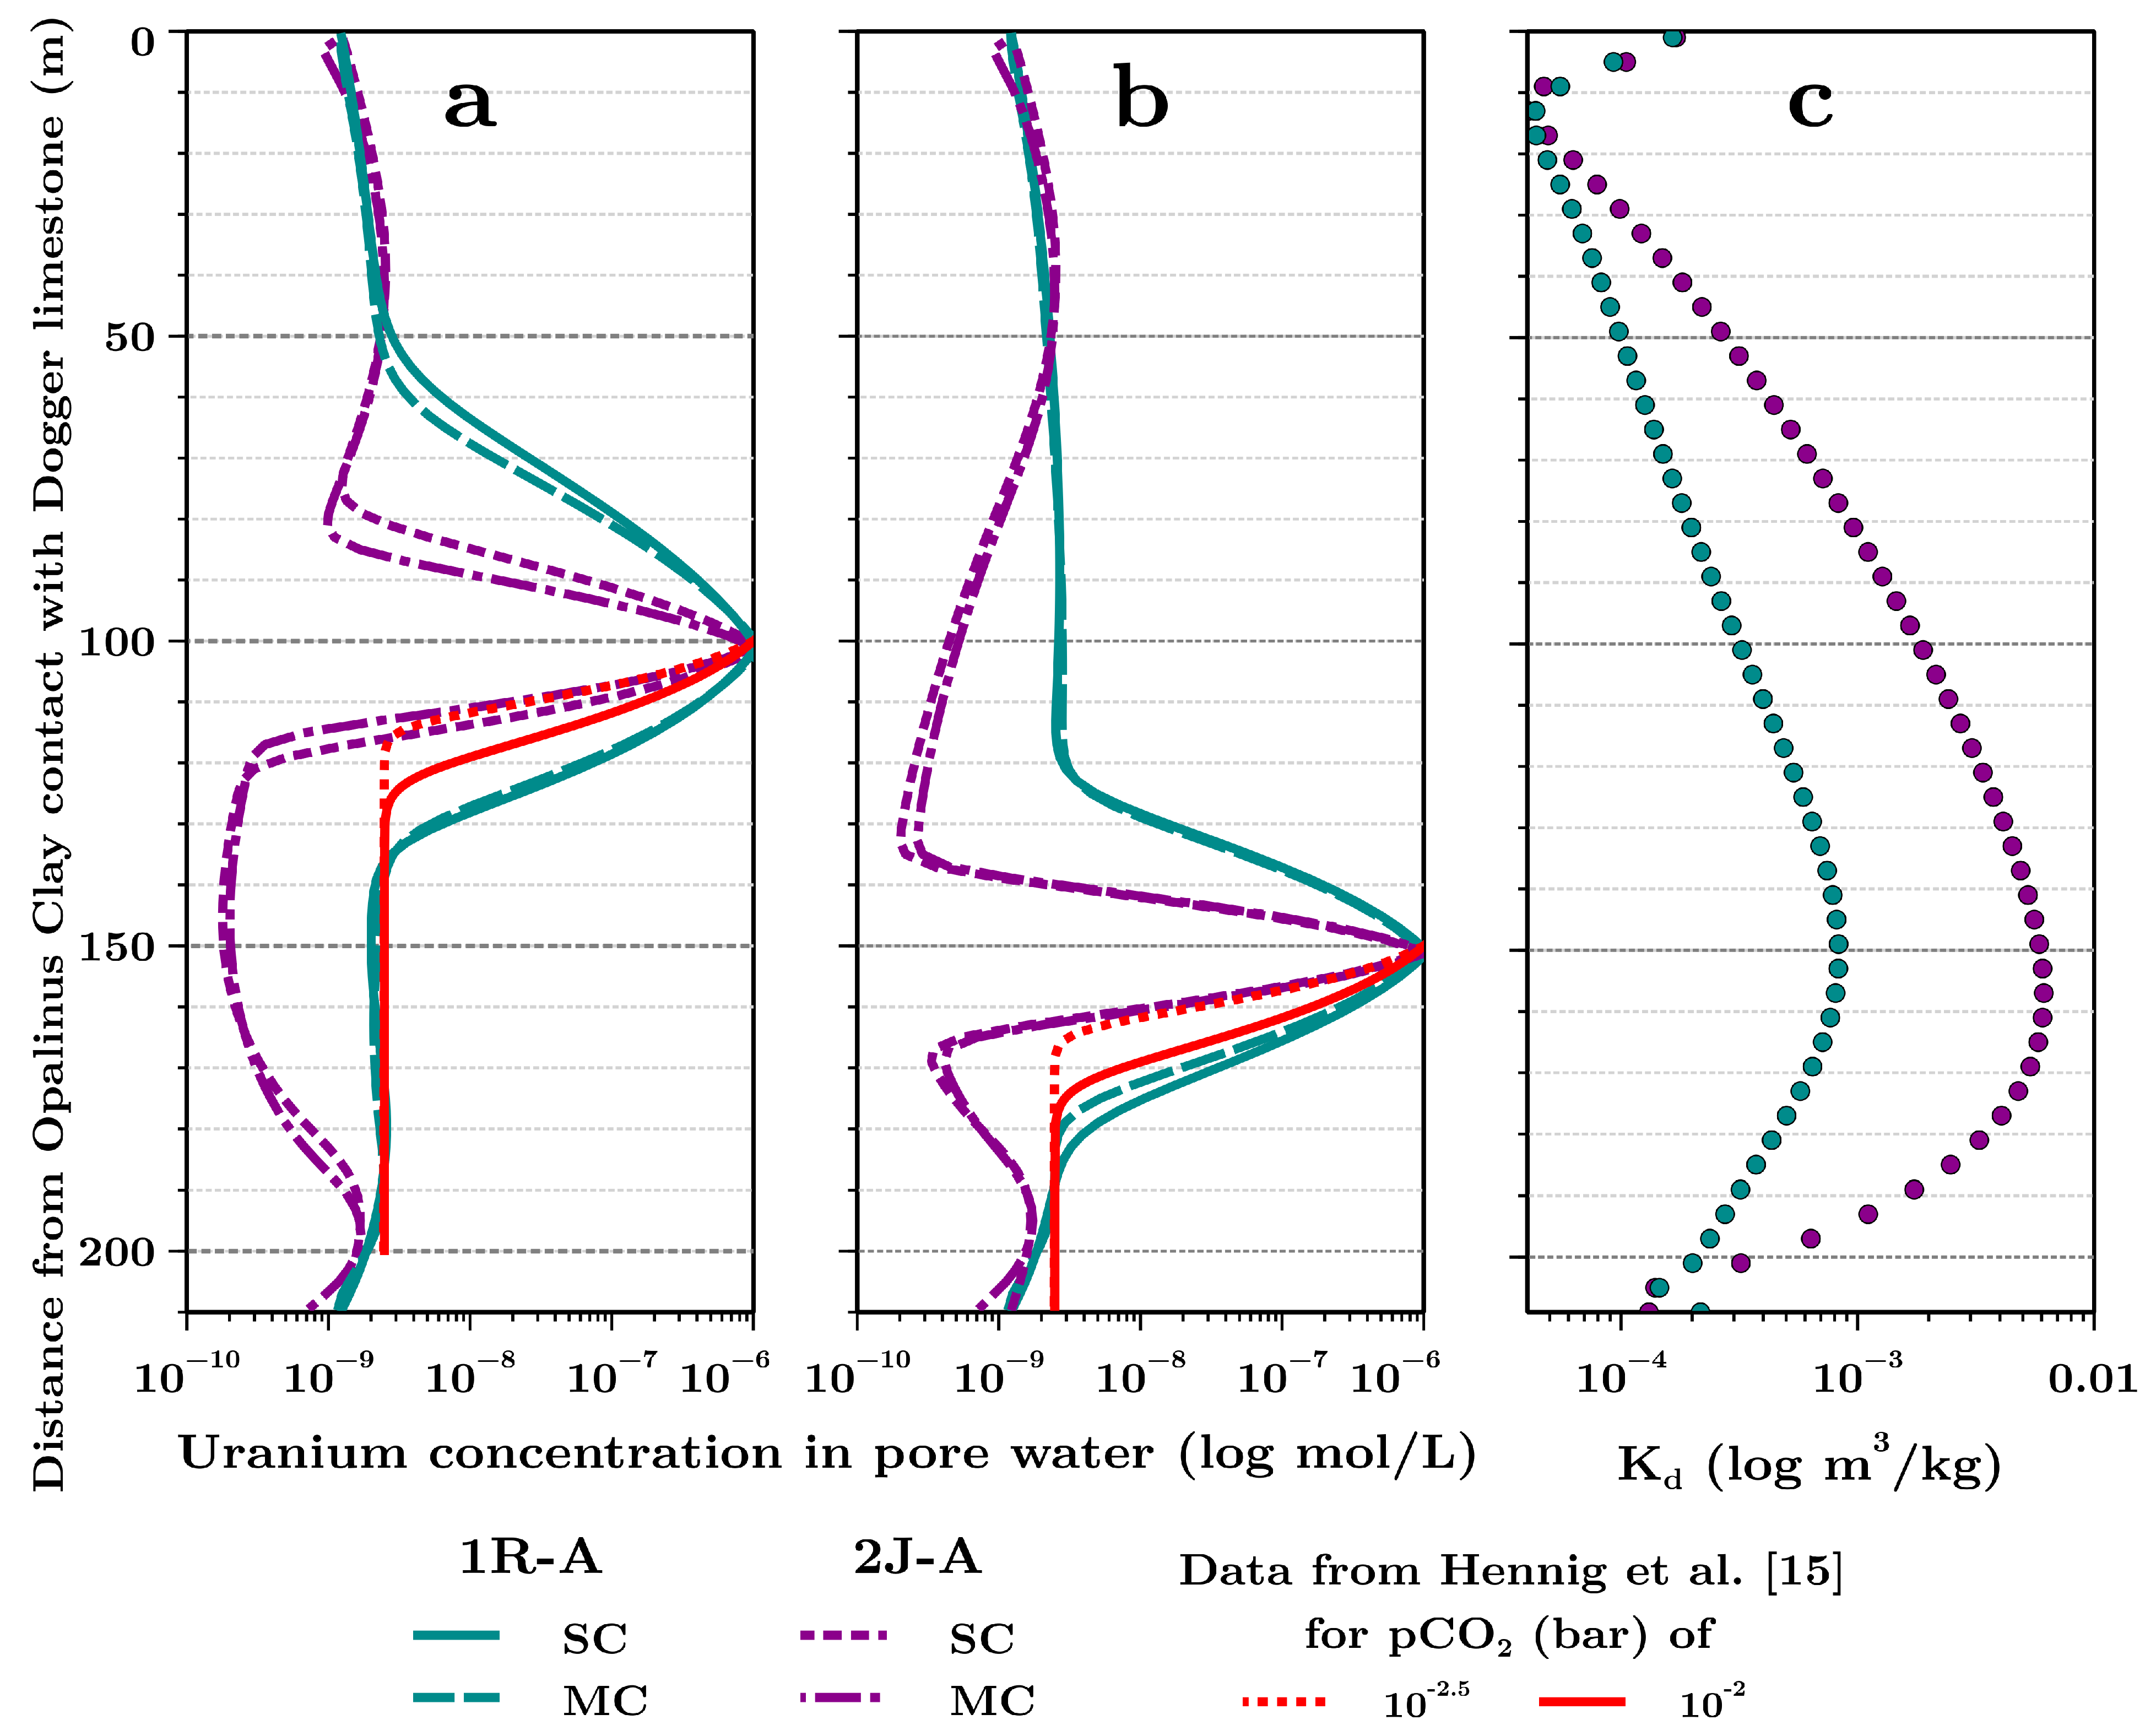
Table 1.
Concentrations of the main ions (mmol/L) for the two scenarios regarding the initial conditions prior to activation of the aquifers as well as for the present-day waters of bounding aquifers in the Dogger and Liassic. Scenario 1R is based on a sample from the Opalinus Clay taken at Mont Russelin [23]. Scenario 2J is a combination of Liassic groundwater at Mont Russelin [23] and Jurassic sea water (indicated by *) [24].
| Parameter | Scenario 1R | Scenario 2J | Dogger Limestone | Liassic Limestone |
|---|---|---|---|---|
| 402 | 413 | 0.8 | 1.3 | |
| 522 | 508 | 0.08 | 0.2 | |
| 46 | 26 * | 1.9 | 2.1 | |
| 41 | 33 * | 2.7 | 0.7 | |
| 31 | 14 * | 0.9 | 0.5 | |
| 1.2 | 10.2 * | 0.4 | 0.1 | |
| 0.8 | 0.6 | 0.2 | 0.03 |
Publisher’s Note: MDPI stays neutral with regard to jurisdictional claims in published maps and institutional affiliations. |
© 2021 by the authors. Licensee MDPI, Basel, Switzerland. This article is an open access article distributed under the terms and conditions of the Creative Commons Attribution (CC BY) license (https://creativecommons.org/licenses/by/4.0/).
Share and Cite
MDPI and ACS Style
Hennig, T.; Kühn, M. Potential Uranium Migration within the Geochemical Gradient of the Opalinus Clay System at the Mont Terri. Minerals 2021, 11, 1087. https://0-doi-org.brum.beds.ac.uk/10.3390/min11101087
AMA Style
Hennig T, Kühn M. Potential Uranium Migration within the Geochemical Gradient of the Opalinus Clay System at the Mont Terri. Minerals. 2021; 11(10):1087. https://0-doi-org.brum.beds.ac.uk/10.3390/min11101087
Chicago/Turabian StyleHennig, Theresa, and Michael Kühn. 2021. "Potential Uranium Migration within the Geochemical Gradient of the Opalinus Clay System at the Mont Terri" Minerals 11, no. 10: 1087. https://0-doi-org.brum.beds.ac.uk/10.3390/min11101087
Note that from the first issue of 2016, this journal uses article numbers instead of page numbers. See further details here.