Article

Dust Characterization and Its Potential Impact during the 2014–2015 Fogo Volcano Eruption (Cape Verde)

1
GeoBioTec Research Unit, Geosciences Department, University of Aveiro, Campus de Santiago, 3810-193 Aveiro, Portugal
2
LNEG National Laboratory of Energy and Geology, Rua da Amieira, Apartado 1089, 4466-901 S. Mamede de Infesta, Portugal
3
CESAM, Environment and Planning Department, University of Aveiro, Campus de Santiago, 3810-193 Aveiro, Portugal
*
Author to whom correspondence should be addressed.
Submission received: 30 October 2021 / Revised: 13 November 2021 / Accepted: 16 November 2021 / Published: 17 November 2021

Abstract

:
Fogo (Fogo Island) is the youngest and most active volcano of Cape Verde. The last eruption occurred in 2014–2015. Aiming to assess the dust sources that impacted the air quality during the present study period, fresh lava samples were collected, while Saharan dust intrusions and transport were modeled. Rooftop dust was also collected on the island dwellings and a mineralogical and chemical characterization was undertaken. Air quality monitors were used to obtain concentrations of atmospheric particulate matter (PM) and gaseous pollutants. The mineralogical constitution was assessed by XRD and Electron Microprobe. The pseudototal chemical concentration was performed by XRF, ICP-MS and SEM; the latter includes particles morphology. During the study, WRF-CHIMERE results showed the intrusion of desert dust which affected the air quality. Lava was classified as tephritic to basanitic, with high potassium content. The Pollution Load Index for rooftop dust was >1 in all samples, suggesting an enrichment. Higher values were found in dust size fraction <63 µm, with contamination factor pointing to high enrichment of As, Ni and Pb, and very high enrichment of Cd. The non-carcinogenic hazard estimated for children suggested that health problems may arise. The carcinogenic risk was above the target risk, mostly due to As > Pb > Co. Ingestion was the main exposure route. PM10 concentrations exceeded the 24-h mean of 50 µg/m3 recommended by WHO. Nevertheless, TVOCs displayed levels lower than guidelines. The highest levels of CO2 were recorded in more populated villages and farthest from the volcano.

1. Introduction

Extreme events, such as volcanic eruptions and transport of desert dust masses, represent an important hazard to the ecosystems worldwide. Deserts are considered the main source of mineral dust to the atmosphere and influencing the air quality, with the Sahara Desert contributing to nearly half of it [1]. Studies by [2] showed that Saharan dust impacted the soils in the Canary Islands, an archipelago belonging to Macaronesia, along with Cape Verde. Sahara Desert particles transported by wind, mostly composed of silt (4 to 63 μm) and clay (<4 μm) sizes, can be deposited to distant locations, such as Cape Verde or even the American continent [3]. These particles may be associated with salts, pathogens and anthropogenic pollutants. Within the framework of CV-DUST (Atmospheric aerosol in Cape Verde region: seasonal evaluation of composition, sources and transport) research project [4], in Praia city (Santiago Island, Cape Verde), it was observed that, in 2011, the daily concentrations exceeded the air quality guidelines proposed by the World Health Organization [5] for particulate matter <2.5 µm (PM2.5) and <10 µm (PM10) in 20 and 30% of the days, respectively. Most of the exceedances took place during dust outbreaks.
Volcanos are a source of essential elements and pollutants, influencing air, water and agriculture [6,7,8]. Eruptions usually occur for short periods, nevertheless, expelled particles can persist locally for long periods of time [9]. Depending on particle sizes, they can be deposited closer to the vent (coarser fraction) or transported and dispersed by wind over long distances [10]. The particles’ density and eruption magnitude and style also influence the deposition distance. To evaluate the health impact of volcanic ash (particles <2 mm), it is important to characterize the particle sizes, particularly to quantify the inhalable fractions (<10 µm), their elemental concentration, the mineralogical composition, especially silica content and particle morphology [10]. Ash particles are usually very hard and angular, what makes them more abrasive than the typical ones transported from the desert [11]. In addition, volcanic ash can present vesicles resulting from the quick solidification of magma expelled containing gases. The volcanic materials vary with type of magma and can be enriched in different potentially toxic elements (PTEs), such as Si, As, Co, Cr, Fe, Mn, Sb, U and Zn [12]. The authors of [13] showed that the Fe2+ present in fresh ash surface generates more free radicals than weathered particles, and that it is very reactive in the lungs. Elements As and Cd are classified as carcinogenic to humans [14] and their association with inhalable particles represent a potential hazard to the health [15]. The long-term exposure to significant amounts of dust enriched in crystalline Si, such as quartz, cristobalite or tridymite polymorphs, can lead to lung silicosis [9]. Nevertheless, studies on natural events, such as volcanic eruptions and desert dust transport, can be overestimated since there are other natural and anthropogenic contributions that can be misperceived. Fogo being a small island in the Atlantic Ocean, sea salt also influences the air quality [16]. Anthropogenic activities, such as traffic related emissions, can impact air quality, by the release of elements such as Pb and Cr, and by forming soot particles, derived from combustion, that are well defined structures composed of aggregates of solid spherical particles with diameters of 30–50 nm [17,18].
The outdoor air quality of Fogo island is mostly influenced by the seasonal transport of suspended dust from the Sahara Desert [19], sea salt, anthropogenic activities and by its active volcano dust and gaseous emissions. The last eruption occurred between November 2014 and February 2015. The major events can exert an important impact on the population health, mostly by acute dust inhalation, leading to irritation of the nose, throat discomfort, asthma exacerbation and dermal and eye abrasion [11,20]. Prolonged exposure to dust can lead to the development of illnesses such as chronic obstructive pulmonary disease (COPD) [21]. Epidemiological studies have revealed potential relationships between dust exposure and mortality increase and hospital visits or admissions due to respiratory and cardiovascular diseases [22].
The aims of the present research were to: (a) identify major dust sources that impact air quality during the study period; (b) characterize dust collected in rooftops and filters; (c) evaluate particulate matter (PM), carbon dioxide (CO2), carbon monoxide (CO) and total volatile organic compounds (TVOC) concentrations; and (d) identify the hazard of dust collected to the environment and human health. These findings will allow to better understand the air quality of Fogo Island and plan mitigation measures to reduce the dust impact hazard.

2. Materials and Methods

Study area: Fogo Island (Cape Verde; Figure 1b) is located in the Atlantic Ocean, 800 km from the northwestern African coast. The Cape Verdean archipelago origin is linked to hotspot magmatism, with melts predominantly alkaline silica-undersaturated of basanitic to tephritic composition, also occurring in phonolites and carbonatites [23].
Fogo is an active stratovolcano with a maximum altitude at Pico do Fogo (~2829 m above sea level (asl)). According to [24], Fogo Island is covered by young volcanic rocks of Quaternary age. A collapsed caldera is located in the center of the island [25], with ~8 km in diameter. This collapse gave rise to a scar, locally called Bordeira, with a vertical wall with maximum ~1000 m high and a flat area of ~35 km2 (~1700 m asl), locally called Chã das Caldeiras, where two villages were destroyed during the 2014–2015 eruption (Bangaeira and Portela villages, previously evacuated) (Figure 1c). The eruptive style of the strombolian type began with an explosive phase, forming an eruptive column with ~6 km high. Three eruptive craters with strombolian emissions were formed [26].
Sampling and air quality monitoring: After the volcanic eruption started, travelling and sampling planning was very short in time. Apparatus’s to be taken were selected according to the possibility of being easily and quickly transported to the study area. Between 10 and 21 December 2014, data acquisition was performed in 10 human settlements, including locations to where inhabitants directly affected by the eruption were relocated (Figure S1): Mosteiros, Achada Furna, Cova Figueira, Monte Grande, Ponta Verde, S. Filipe, Corvo, Covatina, Campanas de Baixo and Cisterno (Figure 1c). Additionally, Monte Beco, a former eruptive vent near the 2014–2015 eruption, was also included in the study. Samples and data collected were: (a) 10 samples of outdoor dust, collected from the rooftops of private houses using new plastic brooms and shovels (Figure S2); in Monte Beco samples were not collected, since there are no dwellings; in the laboratory, samples were dried (<40 °C), homogenized, sieved (<2 mm) and partially pulverized to <170 µm in a agate mill for chemical analysis; (b) 11 samples of the thoracic fraction of particulate matter (PM10), collected by low volume sampling (2 L/min) using a Deluxe pump (model 224-PCMTX8) from SKC Inc. (Dorset, UK) connected to a size-selective head, also from SKC Inc., equipped with 37 mm quartz filters. The pump was powered by a battery and included a run time programmable unit, a constant pressure controller and a low flow adaptor; (c) continuous measurements of temperature (T), relative humidity (RH), carbon dioxide (CO2), carbon monoxide (CO) and total volatile organic compounds (TVOCs) in 11 locations with a 5-min resolution were performed with an IQ-610 Air Quality Probe (Gray Wolf® monitor); and (d) a DustTrak DRX 8533 aerosol real time monitor from TSI (also with 5-min resolution) was used in the same 11 locations for simultaneous monitoring of PM1, PM2.5, PM4, PM10 and total suspended particulate matter (TSP). Additionally, two fresh lava samples were collected in the two directions of the lava flows, direction N and S of the vent (Figure 1c). Each media sample was georeferenced and preserved until laboratorial processing.
During the sampling campaigns, informal questionnaires were performed to the local population, asking about habits and health outcomes before and during the eruption. As expected, respiratory problems, nose and throat irritation with severe coughing and breath difficulty, eye irritation and skin allergies were reported. In addition, nervousness and extreme anxiety episodes were communicated, as a consequence of the eruption.
Granulometric analysis: Rooftop dust, <2 mm fraction, was subject to wet sieving to quantify and analyze separately different size fractions: <63, 63–125, 125–250, 250–500, 500–1000 and 1000–2000 µm. Particles associated salts derived from the eruption magmatic acidic gases, were dissolved by the sieving process, not being considered for this study. The granulometric distribution of the dust fraction <63 µm was determined at the University of Aveiro, Portugal, using an SediGraph III Plus X-ray grain size analyzer (Micromeritics® Instrument Corp., Norcross, GA, USA). This technique is based on the sedimentation theory (Stokes’ law) and the absorption of X-radiation (Beer-Lambert law).
Chemical analysis: Different granulometric fractions of rooftop dust and lava samples were submitted to multielement analysis at the ACME Analytical Laboratories (ISO 9002 Accredited Lab; Vancouver, Canada). A sample of 0.5 g was leached in hot (95 °C) aqua regia (HCl-HNO3-H2O), and pseudo-total concentrations were determined by Inductively Coupled Plasma Mass Spectrometry (ICP-MS) for Al, As, Ca, Cd, Co, Cr, Cu, Fe, K, Mg, Mn, Na, Ni, P, Pb, Si, Ti, Zn (detection limits of Cd < 0.1 mg kg−1; Co, Pb < 0.15 mg kg−1; As, Cr, Cu, Ni < 1 mg kg−1; Zn < 1.5 mg kg−1; Mn < 2 mg kg−1; Fe, Mg < 5 mg kg−1; P < 10 mg kg−1; Al, Ca, K, Na, Si, Ti <20 mg kg−1).
XRD analysis: Rooftop dust fractions and lava mineralogy was determined by powder XRD (LNEG, Portugal) using a Phillips/Panalytical powder diffractometer, model X’Pert-Pro MPD, equipped with an automatic slit. A Cu-X-ray tube was operated at 50 kV and 30 mA. Data were collected from 2 to 70° 2θ with a step size of 1° and a counting interval of 0.02 s.
Electron microprobeanalysis: The mineralogical characteristics of lava samples were determined using backscattered electron imaging (BSE) in an electron microprobe JEOL 8500-F (National Laboratory of Energy and Geology-LNEG, S. Mamede de Infesta, Portugal). The operating conditions obtained for the backscattered electron imaging were 15 kV excitation voltage and 30 nA beam current.
Particle morphology and semi-quantitative chemical analysis: PM10 (collected on quartz filters) and rooftop dust were analyzed at University of Aveiro (UA, Portugal) with a Hitachi S-4100 scanning electron microscope (SEM) coupled to a Bruker Quantax 400 energy dispersive spectrometer (EDS) to assess the morphological, granulometric and semi-quantitative chemical properties of the particles. The identification of inorganic insoluble particles was performed using a mix of protocols for each particle [27].
Precision and accuracy of analyses and procedures: These parameters were monitored using accredited ACME Analytical Laboratories, LNEG and UA internal standards, certified reference material and quality control blanks. Results were within the 95% confidence limits. The relative standard deviation was between 5% and 10%.
Modeling external mineral dust emissions and transport: The CHIMERE chemistry-transport model [28], forced by 3-D meteorological fields simulated by the WRF model [29], was used in this study to model the external dust mineral contribution. This model was previously used over this geographical region, where it showed its ability to correctly reproduce the atmospheric dust load and surface concentrations from the daily to the seasonal timescales [30]. The model applied considered the processes that drive the main phases of the dust cycle: saltation and sandblasting for emissions calculations, horizontal advection and vertical transport, including advection and mixing. Two nested domains were considered (CVd1 and CVd2; Figure 1a) covering the main dust source areas in North Africa, with horizontal resolutions of 0.5° and 0.175°, respectively. The GOCART global model climatology [31] was used to set the boundary conditions for the larger domain simulation. Eight vertical layers were used extending from the surface up to 500 hPa. The simulations were performed in time slices of 24 consecutive hours, each new period being initialized by the previous one, so that concentrations are continuous in time. Spin-up runs, relative to the 10 days prior to the period of interest, were used to initialize the model.
Enrichment index (Ei): Ei was calculated by averaging the ratios of elemental concentrations to the lava elemental mean concentration and divided by the number of elements set to assess enrichments in dust samples. An Ei > 1.0 indicates that, on average, the elemental concentration is above the standard level, and that anthropogenic input may have contributed to elemental enrichment [32].
Pollution Factor (CF) and Contamination Degree (CD) [33]: CF was calculated for each element (As, Cd, Co, Cr, Cu, Mn, Ni, Pb, Zn) by dividing the mean individual concentration (Ci) by its corresponding baseline value (Cb, estimated from lava samples) to assess external sources. The overall CD for each sample was calculated for each of the nine elements considered:
C D = i = 1 9 C F i / 9
CF and CD classifications are: 0 ≤ CF < 1 Low, 1 ≤ CF < 3 Moderate, 3 ≤ CF < 6 High and 6 ≤ CF Very high Contamination Factor; and 0 ≤ CD < 1.5 None to very low, 1.5 ≤ CD < 2 Low, 2 ≤ CD < 4 Moderate, 4 ≤ CD < 8 High, 8 ≤ CD < 16 Very high, 16 ≤ CD < 32 Extremely high and 32 ≤ CD Ultra high Contamination Degree.
Pollution Load Index (PLI): PLI provides a simple comparative means to assess the level of enrichment. It was determined as the nth root of the product of the nEF: ELI = (CF1 × CF2 × CF3 × · · · × CFn)1/n. PLI > 1 suggests environmental deterioration by elemental pollution [34].
Geoaccumulation Index (Igeo): It is defined as Igeo = Log2(Cn)/1.5(Bn), where Cn and Bn are the concentrations of each element (n) in dust and lava, respectively. The value of 1.5 is the matrix correction factor due to lithospheric effects [35]. Igeo classes are: Igeo ≤ 0 practically unpolluted, 0 < Igeo < 1 unpolluted to moderately polluted, 1 < Igeo < 2 moderately polluted, 2 < Igeo < 3 moderately to heavily polluted, 3 < Igeo < 4 heavily polluted, 4 < Igeo < 5 heavily to extremely polluted and 5 > Igeo extremely polluted.
Potential Ecological Risk Index (PERI): PERI is defined as the sum of risk factors, defining a potential ecological risk of an element in each sample:
P E R I i = i = 1 7 E F i = i = 1 7 C F i · T F
PERIi is the Potential Ecological Risk Index for each sample (i), EFi the monomial potential ecological risk factor, CFi the contamination factor and TF the heavy metal toxic-response factor for each element [33]. It was initially proposed for sediments but has been extensively applied to dust (e.g., [36]). Reference values of igneous rock types, soil, freshwater, land plants and land animals were as proposed by [37]. The PERI classification is as follows: PERI < 150 Low, 150 ≤ PERI < 300 Moderate, 300 ≤ PERI < 600 Considerable and 600 ≤ PERI Very High Ecological Risk.
Non-carcinogenic and carcinogenic risk assessment: Human health risks were calculated taking into consideration that residents, both children and adults, are directly exposed to dust through three main pathways (a) ingestion, (b) inhalation and (c) dermal absorption. PM10 (particulate matter < 10 µm) are more relevant in inhalation processes, nevertheless, coarser sizes are decomposed in the gastrointestinal track. The carcinogenic and non-carcinogenic side effects for each element were computed individually, considering reference toxicity levels for each variable, as extensively described in [38]. For each selected potentially toxic element (PTE; As, Cd, Cr, Co, Cu, Pb, Mn and Zn) and pathway, the non-cancer toxic hazard was estimated by computing the Hazard Quotient (HQ) for systemic toxicity (i.e., non-carcinogenic risk). If HQ > 1, non-carcinogenic effects might occur as the exposure concentration exceeds the reference dose (RfD). The cumulative non-carcinogenic hazard index (HI) corresponds to the sum of HQ for each pathway and/or variable. Similarly, HI > 1 indicates that non-carcinogenic effects might occur. Carcinogenic risk, or the probability of an individual to develop any type of cancer over a lifetime as a result of exposure to a potential carcinogen, was estimated by the sum of total cancer risk for the three exposure routes. A risk > 1.00E−06 is classified as the carcinogenic target risk, while values >1.00E−04 are considered unacceptable [38].

3. Results and Discussion

3.1. Outdoor Dust—Main Potential Contributions

To estimate Fogo Island main potential sources of outdoor air contamination, and since there were not enough samples to perform an advanced multivariate statistical analysis, the geochemical and mineralogical characterization of the two 2014–2015 lava samples were considered, and the external mineral dust emissions and their transport were modeled.
The XRF chemical analysis of the lava samples revealed 44.28 and 46.68 wt% SiO2 content, a basaltic type with high melt temperature (1000‒1200 °C). Results are similar to those of other studies in the same region (e.g., 43.03–47.99% SiO2)) [39] and also to the present study rooftop dust (<2 mm) composition (43.01 to 44.99 wt% SiO2). According to the total alkali-silica (TAS) diagram [40], this volcanic rock is tephritic to basanitic, with high potassium content. When compared to the 1995 Fogo volcano eruption lavas [41], the current samples displayed relatively higher mean SiO2 (present study vs. 41.59 wt%), Al2O3 (17.36 vs. 14.63 wt%), K2O (3.65 vs. 2.35 wt%), Na2O (4.68 vs. 3.79 wt%) and P2O5 (0.93 vs. 0.79 wt%), similar MnO (0.21 vs. 0.20 wt%) and lower F2O3 (10.85 vs. 13.79 wt%), MgO (4.32 vs. 7.09 wt%) and TiO2 (3.05 vs. 3.79 wt%) concentrations, showing no significant differences (t-student test, p > 0.05).
The backscattered electron imaging of lava samples identified several minerals, e.g., matrixes of titanian augite [(Ca,Na)(Mg,Ti,Fe,Al,)(Si,Al)2O6] spotted with white ilmenite [Fe2+TiO3] crystals, vitric materials, basaltic hornblendes [NaCa2Fe3+4Ti(Si6Al2O23)(OH)2], pyrrhotites [Fe7S8], apatites [Ca5(PO4)3F], pyroxenes (possibly aegirine [NaFeSi2O6]), basaltic hornblendes [NaCa2Fe3+4Ti(Si6Al2O23)(OH)2] and hematites [Fe2O3] (Figure S3, Table S1), reflected in the chemical composition. These results are in line with other studies of the same eruption event (e.g., [39]).
The modeled mean PM10 surface concentrations within the inner domain (CVd2), between mid-November 2014 and 31 January 2015, is presented in Figure 2 and Figure S4. It is possible to identify two PM10 surface concentration hotspot, one in Mauritania, where the highest dust concentrations (>400 µg/m3) were simulated. According to the model results, Cape Verde PM10 mean concentrations due to desert dust intrusions were within the range 50–150 µg/m3.
Desert dust storms impacted the PM levels over the Cape Verdean archipelago, starting in December 2014, revealing a remarkable increase of the PM surface level concentrations. One of the main dust storm events occurred during this study period, between 12 and 20 December. The emission of dust in the Mauritania hotspots was intensified between 9 and 11 December. In these days, dust was transported westwards with maximum surface PM10 concentrations (>350 µg/m3 daily mean values) being reached around 12 December in Fogo Island (Figure S5). The model suggests that the source regions that mostly affect the surface Cape Verdean air quality are located over Mauritania (Sahara Desert). Aerosol optical thickness (AOD) values (Figure S5), registered during the same periods in the AERONET site of Sal Island in Cape Verde, highlight the extent of long-range transport of dust from the African continent. The same tendency that is shown both by the modeled PM10 and the AOD observations, can be seen in the partial data for this period acquired in S. Filipe by an aerosol monitor, by the National Institute of Meteorology and Geophysics (Praiacity, Cape Verde), on the same period (Figures S6 and S7). Despite a few days without information (local electrical power problems), readings reveal a similar tendency to modeled PM10 and AERONET results, suggesting an impact in Fogo Island air quality.
Figure 2. Modeled mean PM10 surface concentrations within the inner domain (CVd2) between 15 November 2014 and 31 January.
Minerals 11 01275 g002

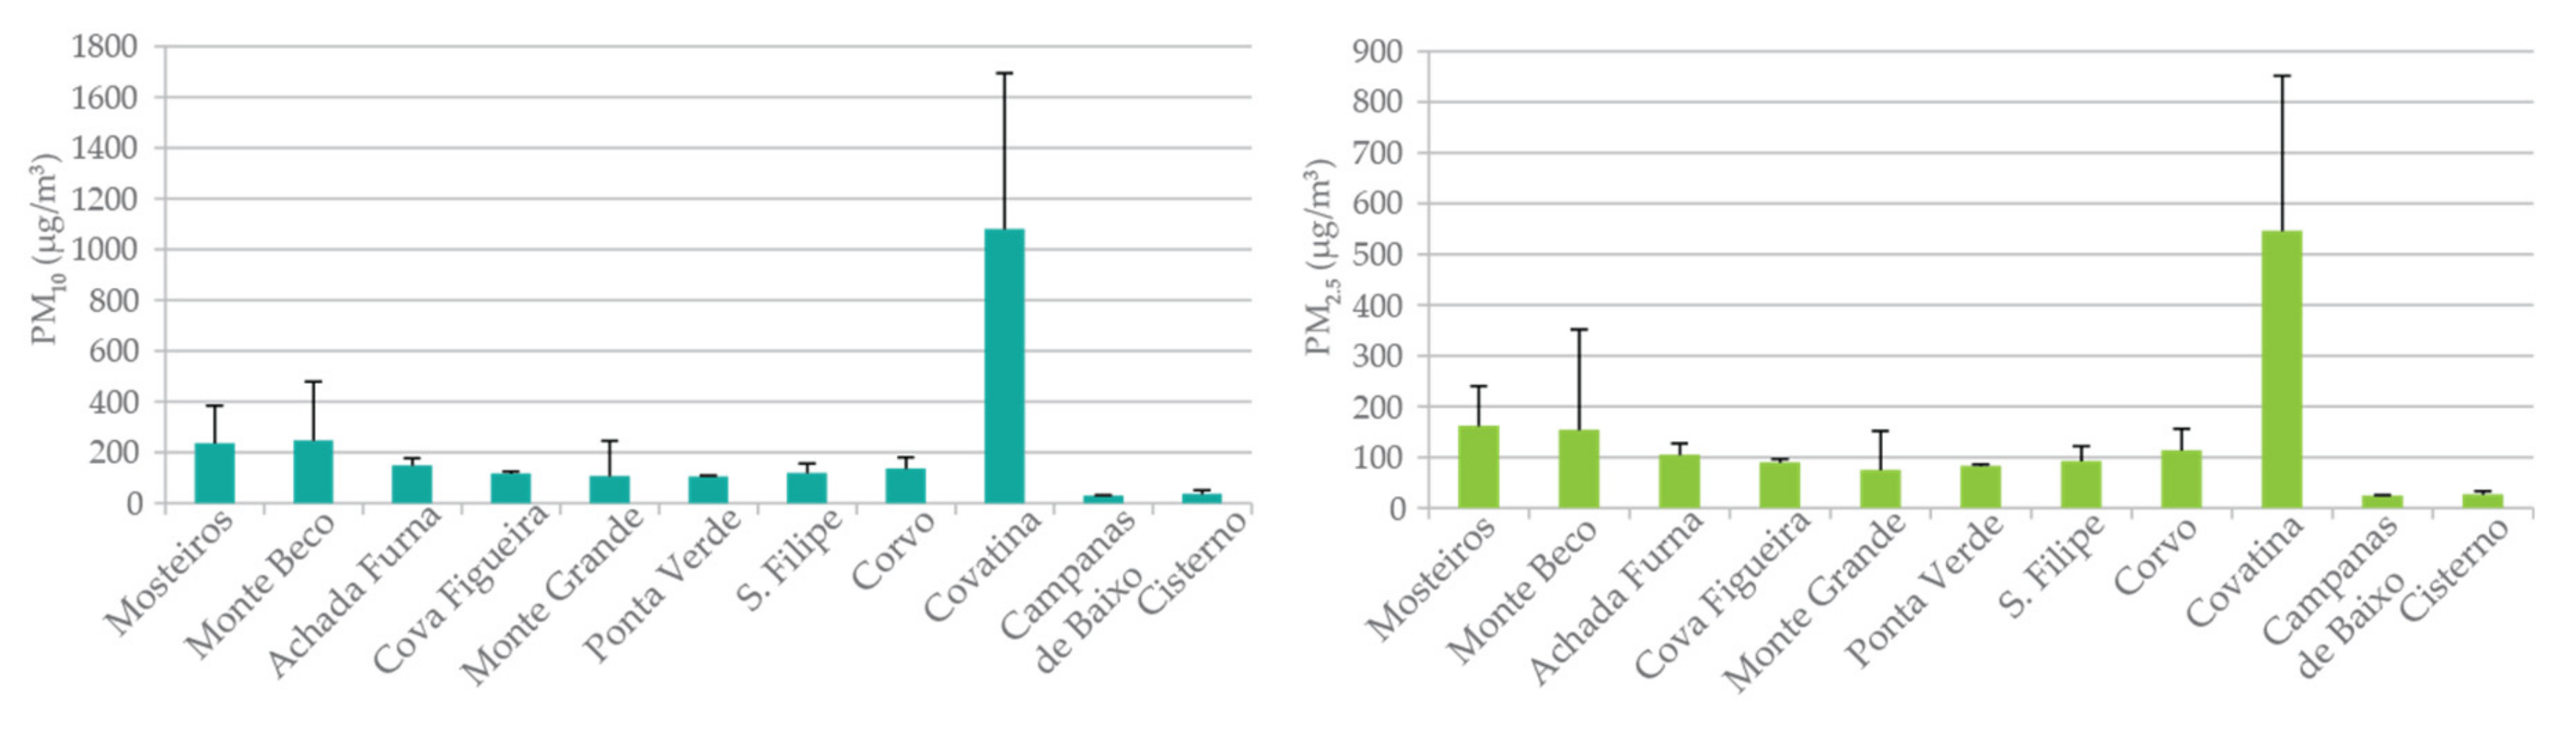
3.2. Rooftop and Ambient PM10 Dust Characterization

The XRD analysis (Table S1), indicates that quartz was ubiquitous in all rooftop dust samples, with higher representation in coarser fractions, revealing the influence of the volcanic ash and desert transported dust. Augite and diopside were also dominant minerals in all fractions, being characteristic of Fogo volcano emissions. Secondary minerals, such as calcite, may result from volcanic weathered particles or from desert dust, present especially in the <63 µm fraction, characteristic of Sahara particles.
The chemical analysis of the rooftop dust (<2 mm fraction) and fresh lava samples revealed similar mean elemental concentration profiles (Figure 3), showing that the eruption outputs directly influenced the outdoor air quality. Minimum and maximum pseudototal concentrations of rooftop dust samples, fractions 125–250, 63–125 and <63 µm, are presented in Figure 4. A 1-way ANOVA analysis showed significant differences between the As, Cd and Cu concentrations in the three fractions (p < 0.05), with the highest minimum elemental concentrations found in fraction <63 µm, ranked Si 106,000 > Al 78,000 > Na 24,000 > K 21,000 > P 4024 > Zn 141 > Cu 78 > Cr 72 > Ni 39 > Co 35 > Pb 19 > As 4.9 > Cd 2.2 mg/kg. A cluster analysis of this fraction samples revealed two groups, a set with K, Na, Al and P variables, related to the local geogenic influence, and a second cluster divided into variables with a mixed origin of local geogenic, external and anthropogenic contributions, with Cr, Ni, Co, Mg, Fe and Mn, and another sub-cluster with As, Cd, Pb, Cu, Zn, Ca, Si and Ti, also of mixed origin and with important influence of long-range transported dust. [42] proposed Ti as a marker for Saharan dust due to rutile [TiO2] and anatase from weathered soils in northern African source areas and with no specific area trend. The results of the finest fraction cluster analysis are confirmed by the Spearman correlation, with statistically significant coefficients (p < 0.01) between pairs K/Na (r = 0.941), Co/Cr (r = 0.826), Co/Ni (r = 0.826), Cr/Ni (r = 0.978) and As/Cd (r = 0.787) and Cu/Zn (r = 0.768). The authors of [43,44] found that potentially toxic elements (PTEs) are more abundant in their stable form in the finest fractions, which is in line with the outcomes of the present study. Single dust samples collected in locations in the NE region were possibly more impacted by external dust intrusions, as they presented higher contents of Fe, Al, Si and Ca than those observed lava samples and in samples from other locations, in the thinner fractions. These elements are representative of quartz and other oxides (e.g., FeO2), carbonates (e.g., CaCO3) and aluminosilicates (e.g., feldspar, clay minerals), characteristic of the Sahara Desert [45]. The same authors, and references therein, also proposed that the morphology of the Saharan dust is almost elliptical, with different rounded shapes. The SEM-EDS of Fogo samples found diverse individual rounded dust particles and agglomerates (Figure S8), with (Ca + Mg)/Fe ratio > 2, suggesting an origin of the particles’ origin is in northwestern Africa [46], in agreement with the external dust inputs modeled in this study. In addition, particles with a morphology typical of volcanic ash, e.g., angular, glassy, conchoidal fractures, vesicular marks, were identified in the rooftop dust (Figure S9) (e.g., [47]). No asbestiform particles were found, thus decreasing the health impacts of these volcanic dust [48]. In locations more impacted by the emissions, especially in Covatina, several fluorite (CaF2) particles were identified in the rooftop dust sample closest to the eruption. The association between F geochemistry and health is well documented (e.g., [49,50]). Fluoride metabolism varies with solubility, structure, reactivity and release of F ions. In humans, the main F absorption path is the gastrointestinal tract, by inhalation and ingestion (drinking and diet), with 80–90% of consumed F absorbed within 30 min [51]. Nevertheless, the F content varies with individual uptake and excretion, with 45–60% of the ingested F excreted in urine, while the remaining is recirculated into the plasma or deposited into the bones [52]. The volcanic expelled products contribute to inhalation and ingestion of dust and gases, but also through consumption of food and water enriched in potentially toxic elements. Additional studies are being performed to understand the potential impact of F in agricultural products from Fogo Island.
The SEM-EDS analysis of the PM10 samples collected on quartz filters (Figure S9) also revealed the presence of sea salt [NaCl], suggesting the Atlantic Ocean as another particle source, in addition to the volcanic emissions that produce soluble salt deposited on the surface of the ash [53]. In S. Filipe, the capital of the island, the location with more traffic related emissions, soot particles were also identified.
The cluster analysis of the fraction 63–125 µm revealed three main groups of variables, with a set of K, Na, Al, P and Si linked to the local geogenic context, a group with Cr, Ni, Co, Mg, Fe, Mn and Ti linked to a mix of sources and a third set with As, Cd, Pb, Ca, Cu and Zn, possibly associated with external and anthropogenic sources. These findings are confirmed by the significant Spearman correlations (p < 0.01) between K/Na (r = 0.939), Co/Cr (0.976), Co/Ni (r = 0.976), Cr/Ni (r = 0.988), Ca/Zn (r = 0.857) and Cu/Zn (0.838) and (p < 0.05) for the pairs Mg/Ti (0.762), Ca/Cu (r = 0.0826), Ca/Pb (r = 0.786) and Pb/Zn (0.810). [54] suggested that the fine fraction <150 µm is the one that most adhere to human skin, especially in children with hand-to-mouth behaviors. According to these authors, particles < 150 µm are more likely to be ingested and dissolved, accessing the gastric system, and posing a potential risk to humans, depending on each PTE bioaccessible fraction.
The 250–125 µm fraction revealed that the higher minimum values in elements Fe 125,000 > Si 107,000 > Ti 19,000 mg/kg, are possibly linked to the abundant presence of minerals such as augite [(Ca,Na)(Mg,Fe,Al,Ti)2(Si,Al)2O6], which are related to the local geogenic context and eruption outputs (S4). A cluster analysis showed two main groups, in the samples of this particle size range, with K, Na, P, Al, Cu, Si and Cd forming a group with variables more influenced by the local geogenic environment, and the remaining variables associated with both a combination of natural and external contributions. These results are also reflected in the significant and positive Spearman correlations (p < 0.01) between Al/K (r = 0.958), Al/Na (r = 0.976), Al/P (r = 0.976), K/Na (r = 0.994), K/P (r = 0.992), K/Si (r = 0.861), Na/P (r = 0.982), Na/Si (0.838) and P/Si (r = 0.838), and between Co/Cr (r = 0.964), Co/Fe (r = 0.904), Co/Mg (r = 0.940), Co/Ni (0.970), Co/Zn (r = 0.855), Cr/Fe (r= 0.857), Cr/Mg (0.952), Cr/Ni (0.994), Fe/Mg (r = 0.881), Fe/Ni (r = 0.886) and Mg/Ni (r = 0.970), suggesting a common source between the pairs of variables. These findings indicate that coarser fractions are more linked to the volcanic eruption and local geogenic environment, while the finer fractions are related to the two main events that took place during this study period, the eruption and desert dust intrusion. Other studies have also established a link between As, Cd, Cr, Co, Fe, Mn, Ni and Zn concentrations and anthropogenic activities, including the concrete nature of the rooftops and traffic related materials, presenting similar concentrations when compared to this study [55,56,57].
Figure 3. (a) Mean elemental concentration of the 2014–2015 lava and rooftop dust samples (<2mm; in mg/kg); and (b) rooftop dust PM10 granulometric relative distribution (in %).
Minerals 11 01275 g003
Figure 4. Minimum and maximum elemental concentration of the 2014–2015 lava and rooftop dust samples, fractions 125–250, 63–125, 63 and <63 µm (in mg/kg).
Minerals 11 01275 g004
The <63, 63–125, 125–250, 250–500, 500–1000 and 1000–2000 µm granulometric distribution of the rooftop dust samples suggested a predominance of particles with diameter <250 µm (~56%), followed by the size fraction 125–250 µm (~30%). In two locations, other fractions prevailed: (a) Corvo, with a dominant 250–500 µm fraction (~55%); and (b) Cisterno, with a prevailing 63–125 µm fraction (~55%). Among all samples, Mosteiros was the village with higher <63 µm content (11%). This sampling site is located in the NW part the island (Figure 1), directly impacted by external dust masses that can be transported over long trajectories, namely from the African continent. [58] suggested that particles < 20 μm are mainly transported by long-term suspension, and that this can occur for long periods and distances.
The quantification of different granulometric inhalable fractions <10 µm (PM10; Figure 3b) was performed by Sedigraph. PM10 represented 33 to 93% of the 63 µm fraction. The highest percentage of the 10–5 µm fraction (~35%) was found in Monte Beco, while in Mosteiros, Corvo and Cisterno the finest fraction <0.1 µm was the most representative, accounting for 36.1, 46,1 and 48.5%, respectively. The granulometric results suggest an external source, since particles <10 µm represent a significant mass fraction of dust transported over long distances, originating in the Sahara Desert [59].
A DustTrak DRX 8533 aerosol real time monitor from TSI (5-min resolution) was used for simultaneous monitoring of PM1, PM2.5, PM10 and total suspended particulate matter (TSP). Regardless of the sampling location, concentrations of the thoracic fraction of particulate matter (PM10) largely exceeded the 24-h daily mean stipulated by the European Air Quality Directive 2008/50/EC and recommended by the World Health Organization of 50 µg/m3 (Figure 5). Fine particles, known as the alveolar size fraction (PM2.5), also far exceeded the daily guideline of 25 µg/m3 recommended by the WHO. Highest concentrations were registered in Covatina, located in Chã das Caldeiras, close to the Bordeira ~1 km high wall, which acts as a barrier and retain dust particles. These were the lowest concentrations, but still above 100 µg/m3 and 75 µg/m3 for PM10 and PM2.5, respectively, were measured outside the eruption area, on the north-east to the south-west flanks of the volcano (Ponta Verde, Monte Grande and Cova Figueira). In the two monitoring sites closest to the eruption (Monte Beco and Covatina), PM10 accounted for 65 to 69% of TSP. This means that almost 70% of the inhaled particles can pass beyond the larynx and ciliated airways. The percentage of thoracic particles increased to 92 to 96% at other locations. Small villages and towns within the caldera were strongly impacted by coarse ashes, which tend to settle out first. Finer particles remain in the plume and stay airborne while being transported over long distance. Thus, the TSP/PM10 ratio tends to be higher in locations farther from the eruptive source. The alveolar size fraction encompassed between 51 and 79% of the thoracic particulate mass. The lowest PM2.5/PM10 mean ratio was registered in Covatina, near the Bordeira wall, whereas the highest value was monitored in Ponta Verde, a settlement in the northwestern part of the island outside the crater rim. PM2.5 comprised higher proportions of ultrafine particles (PM1), around 97‒98%, in the vicinities of the volcano, while all locations outside the Bordeira scarp presented PM1/PM2.5 ratios in the 0.92‒0.94 range.
In São Filipe, the island capital, a Cape Verdean aerosol monitoring station (15 min. resolution) was installed between 28 November 2014 and 15 February 2015, the eruption time-lapse. Although some problems with equipment and energy (days 30 November for PM10, 28 November to 6 December for PM2.5 and 15 to 19 December for both PM2.5 and PM10), some data was collected. The mean PM10 24-h concentration guideline [5] was largely exceeded (Figure S6). Values ranging from 268 to 453 µg/m3 were registered. The maximum daily mean concentration was reached on 13 December (383 µg/m3). An extreme concentration range of 479–511 µg/m3 was recorded between 7:30 pm 6 January and 1:30 am 7 January 2015. [5] also proposed guidelines for PM2.5: (a) Interim target-1 (IT-1) of 35 µg/m3; (b) IT-2 of 25 µg/m3; (c) IT-3 of 15 µg/m3 and (d) AQG of 25 µg/m3 (24-h mean). The daily mean IT-1, IT-2 and IT-3 levels are expected to translate roughly into a 5%, 2.5% and 1.2% increase in daily mortality over the AQGs, respectively. A PM2.5 daily maximum of 107 µg/m3 was measured in January 7th (Figure S7). The maximum PM2.5 concentration peaked at 123 µg/m3 on 7 January 2015 between 2:30 and 5:50 am. The high PM10 and PM2.5 levels are consistent with the volcanic eruption time-lapse and the Sahara desert dust intrusions.
Concentrations of PM10 and PM2.5 above the guidelines may represent a risk to the human health [60,61] and are consistent with the volcanic eruption time-lapse and the Sahara desert dust intrusions. PM10-bound constituents and morphology can cause breathing problems and irritation to the respiratory system [5]. In turn, PM2.5 can reach alveoli and induce asthma and even heart attacks, being especially disturbing in children and people with pre-existing health conditions [62,63]. To humans, fresh volcanic ashes might represent a higher hazard than mineral dust, due to morphology and chemical coatings.

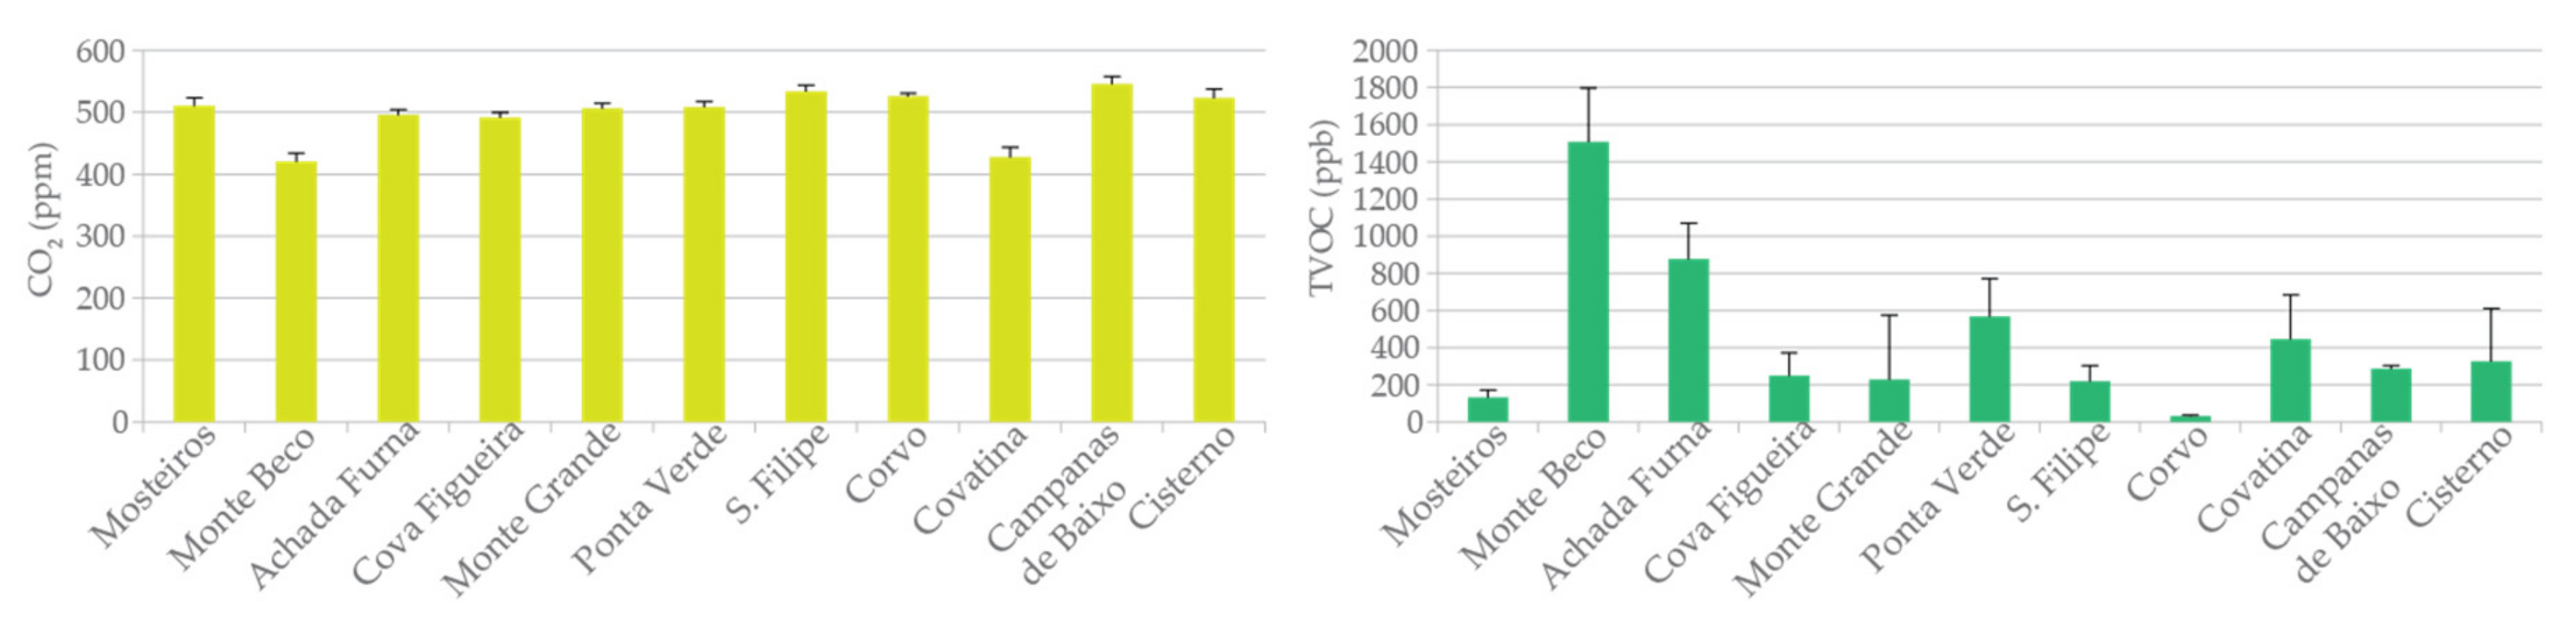
3.3. CO2, CO and TVOCs

TVOCs include non-methane hydrocarbons (NMHC) and oxygenated NMHC. Considerable discomfort and headaches are likely if levels fall in the range of 1.2‒10 ppm [64]. Only Monte Beco reached levels close to the lower limit of the worrying range (Figure 6). There are no enforceable limits for TVOC concentrations, i.e., there is no legal threshold. Much higher VOC concentrations, varying between 2.89 and 35.3 ppm, have been reported by [65] for 13 sites in Delhi, India. However, much lower levels, in the ranges 7‒173 ppb and 10‒285 ppb in the summer and fall, respectively, have been registered in Los Angeles, California [66]. VOC concentrations may be highly variable, depending on the emission sources, dispersion conditions and atmospheric stability. A follow-up air quality monitoring campaign by passive sampling techniques was carried out in the Fogo Island between November 2016 and January 2017 [67]. In this later campaign, the highest concentrations of various individual VOCs were registered in Monte Grande, probably due to additional anthropogenic activities resulting from population resettlement at this village after the eruption.
It has been shown that VOCs from fumaroles mainly consist of C2–C5 alkanes and relatively high concentrations of aromatics (benzene and toluene) and C2–C3 alkenes (mainly propene and isobutene) [68]. The main mechanism for the production of alkanes is likely related to pyrolysis of organic matter bearing sediments that interact with the ascending magmatic fluids. Alkanes are then converted to alkene and aromatic compounds via catalytic reactions (dehydrogenation and dehydroaromatisation, respectively). However, a biogenic origin for the light hydrocarbons cannot be ruled out [68]. It is expected that sulfur and halogen-bearing gaseous compounds, not measured as TVOCs, are dominant in the volcanic plume. Moreover, it should be taken into account that the volcanic plume is ejected at high altitude. Emissions from lava and the fraction of the volcanic plume that reaches the ground suffer dilution by strong winds and changes of their direction. Thus, VOCs may originate, at great extent, from other local sources, other than the volcano. These include natural sources, such as vegetation, and anthropogenic sources, which include emissions from biomass burning, solvent usage and road transport.
The average CO2 concentrations (Figure 6) ranged from 445 ppm at Monte Beco (1908 m asl) to 570 ppm at Campanas de Baixo (453 m asl). The highest levels were not registered near the volcano, but rather in more populated villages. CO2 concentrations around 415 ppm have recently been recorded at the remote observatory near the summit of Mauna Loa, at an altitude of 3400 m asl, which is well situated to measure air masses that are representative of very large areas. CO2 mixing ratios have been found to be higher in many urban centers worldwide compared to adjacent rural locations, phenomenon known as an “urban CO2 dome” [69]. These higher mixing ratios are due in part to local traffic emissions. For example, [70] measured CO2 concentrations in air samples collected from various locations in Paris, its suburbs and the surrounding open countryside. These data sets revealed that near-surface atmospheric CO2 concentrations throughout the country outside Paris averaged 415 ppm, while values in the city sometimes reached as high as 950 ppm.
The CO levels were always close to the detection limit (0.5 ppm). Due to ejection at high altitude and atmospheric dilution, concentrations of gaseous pollutants seem less affected by the eruption than particles. Ash and gases can be transported either aggregated or separated in the atmosphere. Vertical separation occurs due to the eruption style or by different sedimentation velocity of ash and gases, and horizontal separation due to wind shear [71].

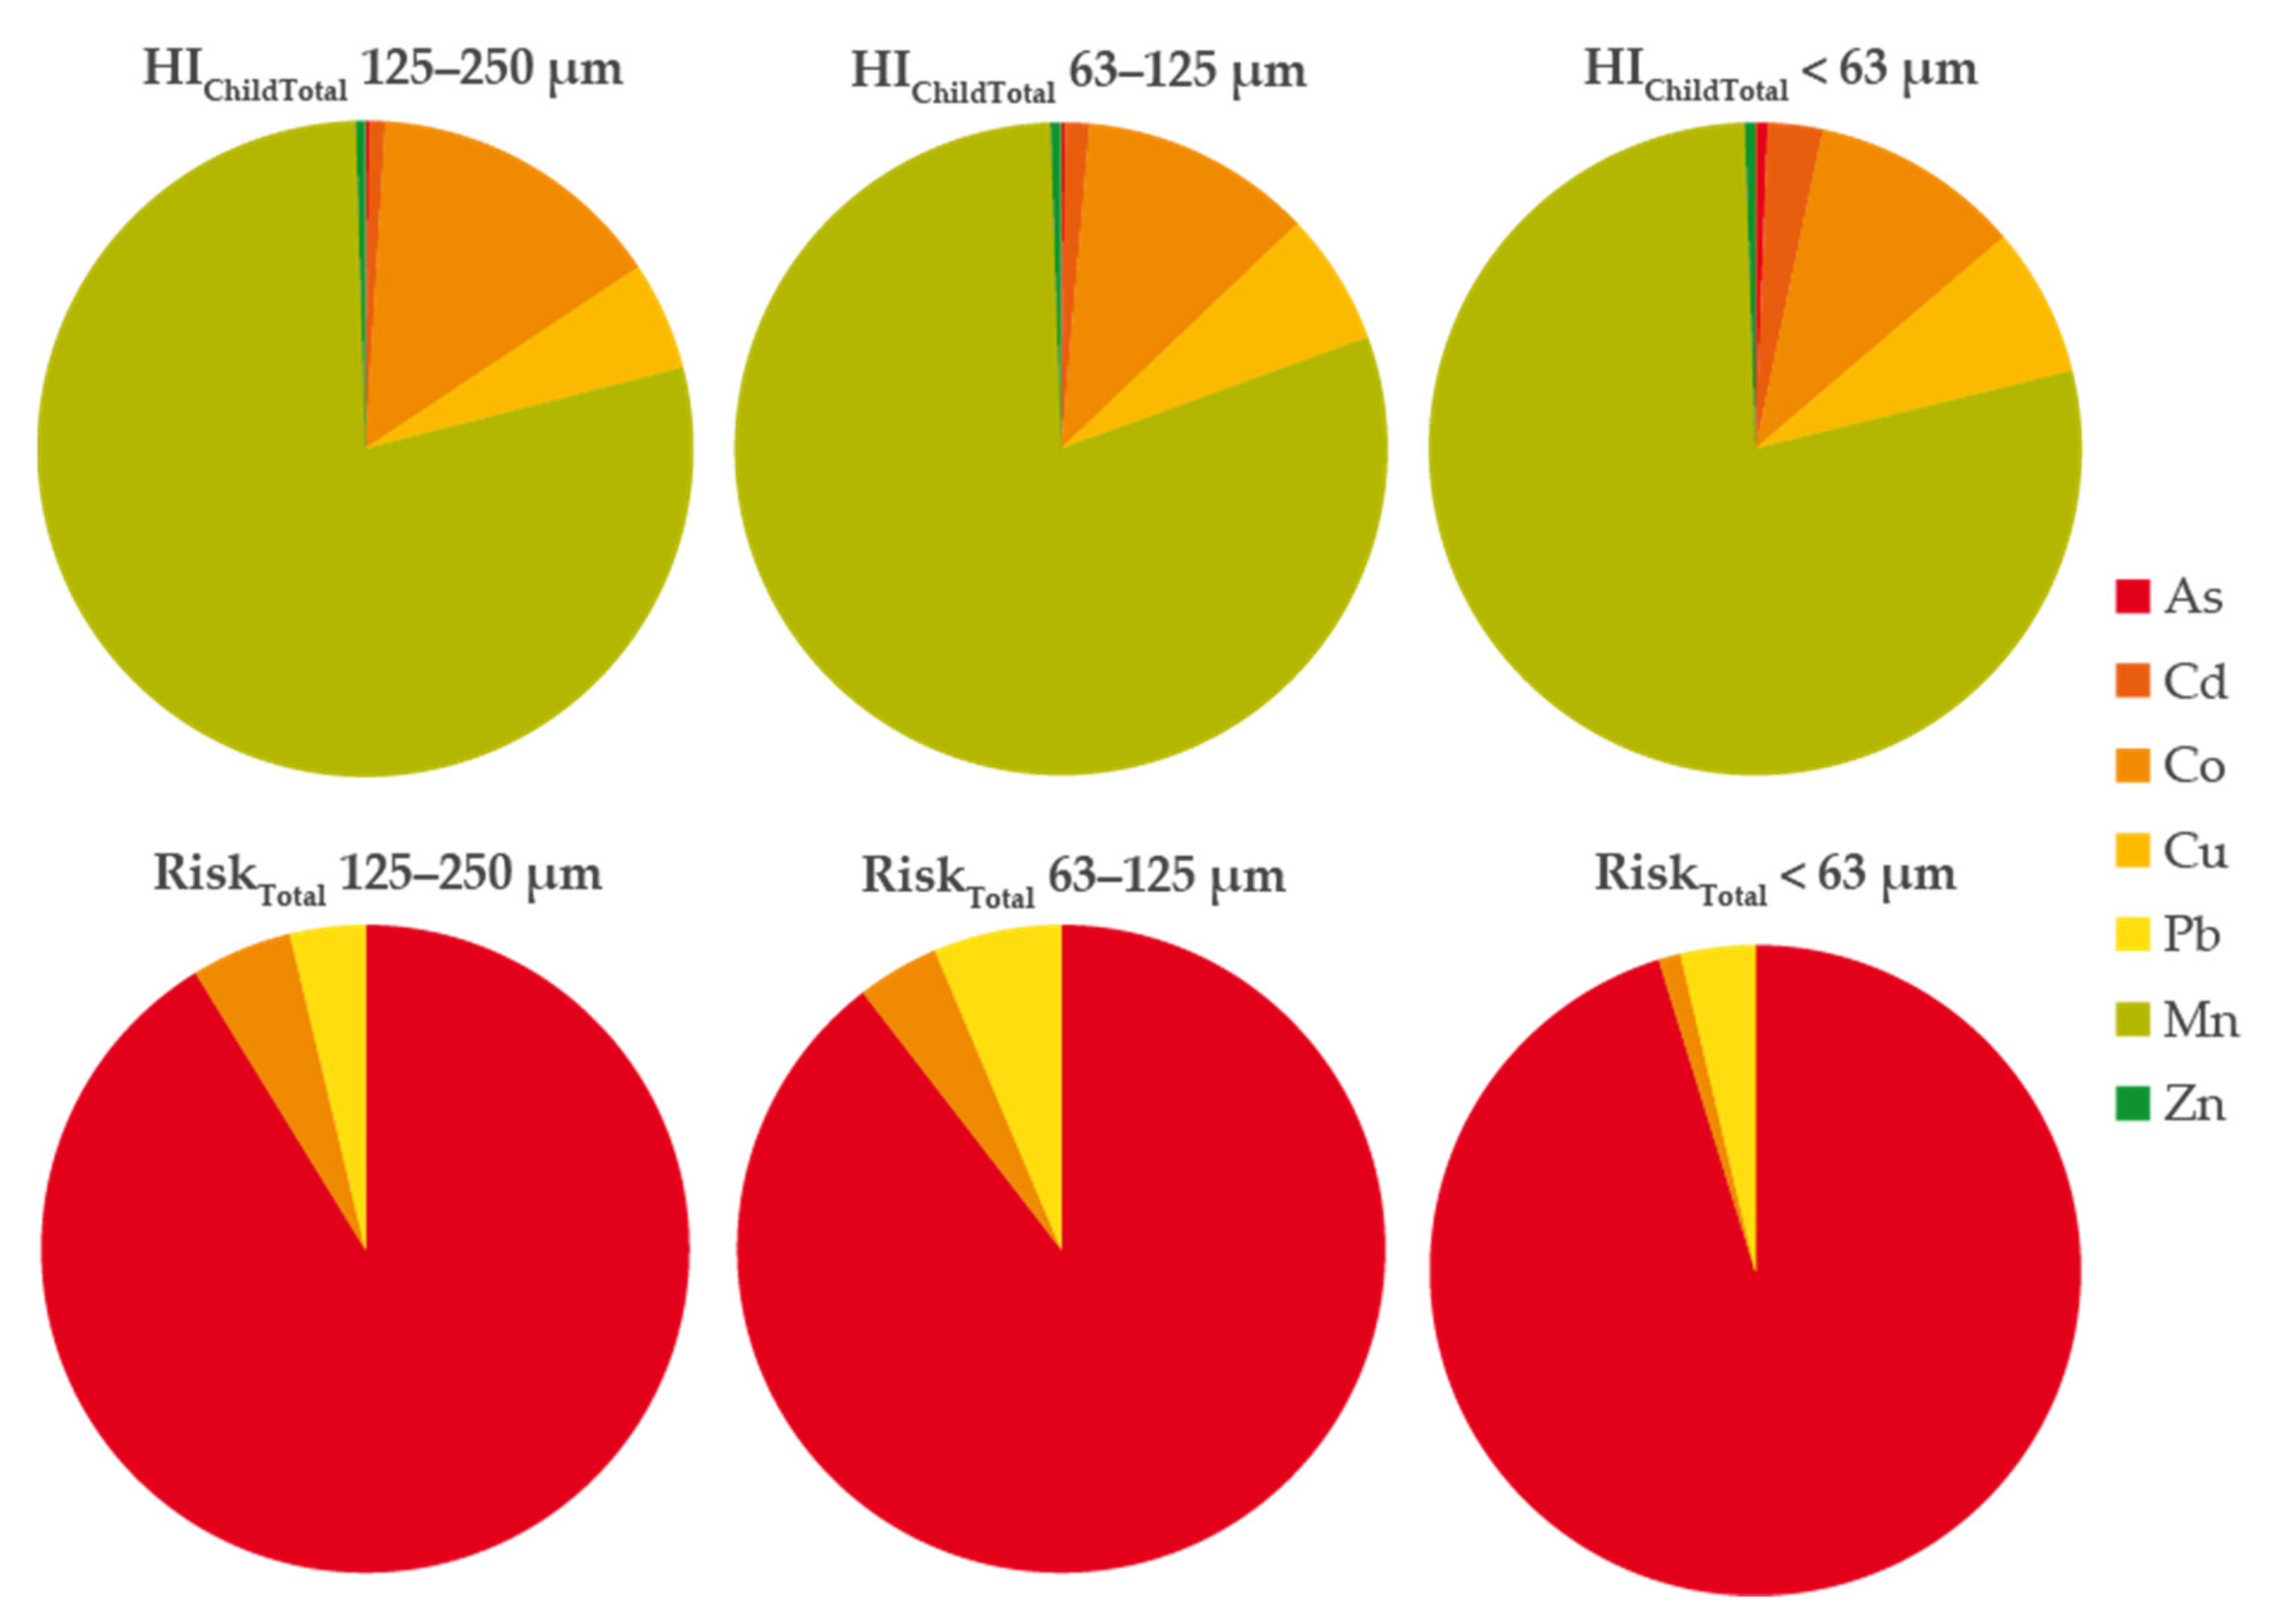
3.4. Environmental Impact and Human Health Risk Assessment

For the calculation of different environmental indexes, mean concentrations of lava samples were used as background values, to understand the external sources of dust enrichment. Two sets of variables were studied: (a) major elements, Al, Ca, Fe, K, Mg, Si and Ti; and (b) trace elements potentially linked to anthropogenic sources, As, Cd, Co, Cr, Cu, Mn, Ni, Pb and Zn. Three size fractions were selected (<63, 63–125 and 125–250 µm). This selection was especially done for the health risk assessment, since particles with diameter <250 µm are more likely to adhere to hands and may be ingested by hand-to-mouth behaviors [72].
The group of major elements, linked to the Fogo volcano geochemical composition, suggest a small contribution from external sources. The Enrichment Index (Ei; Table S2) was slightly over 1, with a maximum of 1.5 for the dust fraction sized 125–250 µm of Ponta Verde. These results are confirmed by the Contamination Degree (CD), Pollution Load Index (PLI) and Potential Ecological Risk Index (PERI), which enabled to classify all locations with a low-grade enrichment, although Ponta Verde presented higher results. The Geoccumulation Index (Igeo) and Contamination Factor (CF) also showed a low external contribution in all samples and fractions, with slightly higher Mg concentrations that in lava samples.
The Enrichment index for a set of elements with a potential link to anthropogenic sources (Table S3) suggest the contribution of an external source of these elements to the dust samples, irrespective of the size fractions. The minimum values were found to be higher in the size fraction <63 µm, especially in samples from the NE sector of the island. Nevertheless, the maximum Ei values (4.9 in 125–250 µm and 4.2 in 63–125 µm fractions) were observed in coarser fractions from Ponta Verde, a village not directly impacted by volcanic emissions. The Pollution Load Index presented values above 1 in all samples, except for the 125–250 µm size fraction of dust from Cisterno, suggesting an external contribution for the selected elements. Higher PLI values were found in the size fraction <63 µm, especially in Ponta Verde and Campanas de Baixo villages. The same results were obtained with the Potential Ecological Risk Index. All the samples sized <63 µm were classified of extreme risk. The 125–250 µm size fraction of dust from Monte Grande presented the lowest PERI value (144), while the highest PERIs were obtained in Ponta Verde, Mosteiros and Campanas de Baixo (551, 491 and 334, respectively). For the size fraction 63–125 µm, the highest PERI values were found in Mosteiros (502) and Ponta Verde (492), whose samples were categorized of severe risk, whereas other samples were classified with moderate risk.
The Geoaccumulation index (S12) indicated a small external contribution for all size fractions and elements. The highest Igeo values (2.4 Cr and 2.5 Cu in dust sized 125–250 µm, and 2.0 Cr and 2.4 Cu in the 63–125 µm size fraction) were obtained in dust from Ponta Verde, classified as moderately to heavily contaminated. In the same location, As presented a maximum Igeo value of 1.5, in the size fraction <63 µm, classified as moderately contaminated. The Contamination Factor (CF) displayed a high contamination of As, Ni and Pb, and very high contamination of Cd in the size fraction <63 µm of dust from Ponta Verde and Cisterno villages. Nevertheless, the Contamination Degree presented its maximum in the 125–250 µm size fraction of dust from Ponta Verde (CD = 4.6, high contamination). Other size fractions of this location were classified with moderate contamination. Coarser dust fractions from Cova Figueira, Campanas de Baixo and Achada Furna were classified as having a moderate CD.
Being children more sensitive and prone to hand-to-mouth behavioral manners, the non-carcinogenic Hazard Quotient through Ingestion (HQChildIng; Table 1) and the Hazard Index (HIChildTotal) were estimated for this age group. Both HQChildIng and HIChildTotal results were above the threshold of 1 (mean HQ = HI = 1.4 in all samples and in the three size fractions studied), suggesting that non-carcinogenic health outcomes might occur, since exposure to elements is higher than the reference dose. The highest HQ (1.6) and HI (1.7) were found in the fraction 63–125 µm of dust collected in S. Filipe, the island Capital, for which Co, Cu and Mn concentrations were the main contributors, representing 24.4, 3.3 and 71.3%, respectively, of the Hazard. In all samples and fractions, Mn accounted for 71.3 to 83.9% of the total HI. Previous studies suggested that Mn hazard depends on its oxidation state, with both Mn3+ and Mn2+ forms related to neurotoxicological hazards ([73] and references therein).
The carcinogenic risk (Table 1), for both children and adults, of all size fractions was above the target value of 1.00E−6. However, regardless of the samples, the risk was always <1.00E−4. Arsenic was the element that most contributed to the risk, accounting for 86.2 to 95.8% of the total (Figure 7), followed by Pb (1.7 to 9.7%) and Co (1.1 to 10.6%). Ingestion was found to be the main exposure route for all dust size fractions, representing 78.5 to 87.3% of the total risk posed by the three exposure routes. The finest size fraction (<63 µm) was the one with the highest risk, mostly due to As, whose concentrations accounted for 91.4 to 95.5% of the total. The lowest total risk value was found in Monte Grande, located in the interior of the island, for the 125–250 µm size fraction, while the highest was observed in the <63 µm fraction of Ponta Verde. Nevertheless, it is known that the pseudototal concentration of PTEs can overestimate the hazard and/or risk to humans and a bioaccessibility study is needed.

4. Conclusions

Fogo island inhabitants, particularly those living in Chã das Caldeiras, are exposed to air deterioration, especially during local volcanic eruption outputs and Sahara dust intrusion events. Two main sources of atmospheric contamination were assessed: (i) the long-range transport of mineral dust, showing a contribution from the Mauritania region (Sahara Desert), and (ii) the volcanic eruption. The granulometric distribution of outdoor dust samples was dominated by particles with diameter <250 µm, followed by the size fractions >125 and <250 µm. The PM10 inhalable fraction represented the highest percentage of the dust samples sized <63 µm, which can potentiate breathing problems and irritation to the respiratory tract. PM10 and PM2.5 concentrations largely exceeded the World Health Organization guidelines, in line with the volcanic eruption time-lapse and the Sahara Desert dust outbreaks. The highest levels of CO2 were recorded in more populated villages.
Cumulative environmental indices calculated based on the content of Al, Ca, Fe, K, Mg, Si and Ti, allowed the categorization of dust as polluted in all locations with a moderate enrichment in the size fraction <63 µm. Individual indices suggested a high contamination of As, Ni and Pb, and very high contamination of Cd. The Non-carcinogenic Hazard Quotient and the Hazard Index from the exposure of children to elements through ingestion were above 1, suggesting that non-carcinogenic health outcomes might occur, since concentrations were higher than the reference doses. The carcinogenic risk associated with all dust size fractions was above the target risk of 1.00E-06. Arsenic was the element that most contributed to the global risk, followed by Pb and Co. Ingestion was found to be the main exposure route of dust-bound metals in all size-segregated fractions. The size fraction <63 µm was the one representing a higher risk, mostly due to the concentration of As.
The results highlight the need for continuous monitoring of air quality in this area. It is known that the total concentration of potentially toxic elements can overestimate the risk for humans. To understand the bioaccessible fraction (BAF%) in lungs, gastric and gastrointestinal phases of the outdoor dust, the Artificial Lysosomal Fluid (ALF) and Unified Bioaccessibility Method (UBM) assays are being done. The island population is strongly dependent on agriculture, livestock and groundwater. The volcanic expelled products not only contributed to human health by inhalation and ingestion of dust, but also through consumption of food and water enriched in potentially toxic elements. In addition, the edible plants most consumed in the island are being analyzed and BAF% being estimated.

Supplementary Materials

The following are available online at https://0-www-mdpi-com.brum.beds.ac.uk/article/10.3390/min11111275/s1, Figure S1: Fogo island sampling sites at (a) location with displaced population; and (b) human settlements., Figure S2: Rooftop dust collection, with new plastic broom and shovel, Figure S3. Backscattered electron imaging of Fogo 2014–2015 eruption lava samples, Figure S4 Daily evolution of the modeled mean PM10 surface concentrations within the inner domain (CVd2) during a dust storm impacting air quality in Cape Verde (8–13 December 2014), Figure S5 (a) Modeled daily mean PM10 concentrations in Fogo Island, Cape Verde, between 15 November 2014 and 31 January 2015 (simulation by CHIMERE: 14.95N 24.35W); and (b) Aerosol optical thickness (Level 2.0; daily averages) observed in the AERONET site installed in Sal Island, Cape Verde, between 15 November 2014 and 31 January 2015, Figure S6. Daily mean PM10 concentrations in São Filipe, between 28 November 2014 and 15 February 2015 (courtesy of INMG—National Institute of Meteorology and Geophysics, Cape Verde). The red dashed line represents the daily mean 50 µg/m3 guideline proposed by WHO (2006). Days without readings are in grey dots, Figure S7. Daily mean PM2.5 concentrations in São Filipe for the eruption time-lapse, between 7 December 2014 and 15 February 2015 (courtesy of INMG—National Institute of Meteorology and Geophysics, Cape Verde). Dashed lines represent the daily mean 25 (AQGPM2.5), 15 (IT-3), 25 (IT-2) and 35 (IT-1) µg/m3 guidelines proposed by WHO (2006). Days without readings are in grey dots, Figure S8. SEM images of dust collected on the rooftops of private houses: (a) cubic particles of augite [(Ca,Na)(Mg,Fe,Al,Ti)(Si,Al)2O6] surrounded by small fluorite [CaF2] particles; (b) detail of fluorite aggregate; (c) hematite [Fe2O3] with marks that suggest brittle fracture processes, covered with Ti oxides cristals; (d) particle aggregate with quartz and haüyne [(Na,Ca)4-8Al6Si6(O,S)24(SO4,Cl)1-2]; (e) Fe oxide with vesicular marks; (f) sharp Fe and Ti rich particle with marks resulting from brittle fracture conditions characteristic of the eruption; (g) raft-like calcite aggregate; (h) rounded Fe and Ca enriched particles, Figure S9. SEM images of PM10 collected on quartz filters: (a) PM10 enriched in Fe, S and Ti; (b) Ca and S rich particles agglomerate (Bassanites?) with inhalable size; (c) salt [NaCl] on top of a Si, Fe, Ti enriched particle (Sahara?); (d) soot aggregate, Table S1. Main mineral occurrence (DRX analysis) in the two lava samples and different dust size fractions [µm], Table S2. Enrichment index (Ei), Geoaccumulation Index (Igeo), Enrichment Factor (EF), Contamination Factor (CF), Contamination Degree (CD), Pollution Load Index (PLI) and Potential Ecological Risk Index (PERI) for Al, Ca, Fe, K, Mg, Si, and Ti in outdoor dust samples sized <63, 63–125 and 125–250 µm, Table S3: Enrichment index (Ei), Geoaccumulation Index (Igeo), Contamination Factor (CF), Contamination Degree (CD), Pollution Load Index (PLI) and Potential Ecological Risk Index (PERI) for As, Cd, Co, Cr, Cu, Mn, Ni, Pb, and Zn in outdoor dust samples, fractions <63, 63–125 and 125–250 µm.

Author Contributions

C.C.: sampling, conceptualization, funding, methodology, formal analysis, supervision, writing—original draft. P.F.Á.: methodology, formal analysis, writing—review and editing. C.A.: methodology, formal analysis, writing—original draft. C.G.: methodology, formal analysis, writing—original draft. C.S.: formal analysis, writing—review and editing. E.F.d.S.: writing—review and editing. F.R.: writing—review and editing. All authors have read and agreed to the published version of the manuscript.

Funding

The sampling campaign was supported by the Portuguese Foundation for Science and Technology (FCT), with an emergency financial support provided to C4G (Collaboratory for Geosciences) for the 2014–2015 Fogo volcano eruption monitoring mission. Carla Candeias is grateful to FCT by grant SFRH/BPD/99636/2014. All authors are thankful for the support to GeoBioTec (UID/GEO/04035/2019 + UIDB/04035/2020) and CESAM (UIDB/50017/2020 + UIDP/50017/2020) to FCT/MCTES through national funds, and co-funding by FEDER, within the PT2020 Partnership Agreement and Compete 2020.

Acknowledgments

Authors are thankful to the National Institute of Meteorology and Geophysics (Cape Verde), for the monitoring data, and to Fogo population that helped in this study.

Conflicts of Interest

The authors declare no known competing financial interests or personal relationships that could have appeared to influence the work reported in this paper.

References

  1. Kotsyfakis, M.; Zarogiannis, S.G.; Patelarou, E. The health impact of Saharan dust exposure. Int. J. Occup. Med. Environ. Health 2019, 32, 749–760. [Google Scholar] [CrossRef] [PubMed]
  2. Menéndez, I.; Diaz-Hernandez, J.L.; Mangas, J.; Alonso, I.; Sanchez-Soto, P.J. Airborne dust accumulation and soil development in the North-East sector of Gran Canaria (Canary Islands, Spain). J. Arid Environ. 2007, 71, 57–81. [Google Scholar] [CrossRef] [Green Version]
  3. Middleton, N.J. Desert dust hazards: A global review. Aeolian Res. 2017, 24, 53–63. [Google Scholar] [CrossRef]
  4. Pio, C.A.; Cardoso, J.G.; Cerqueira, M.A.; Calvo, A.; Nunes, T.V.; Alves, C.A.; Custódio, D.; Almeida, S.M.; Almeida-Silva, M. Seasonal variability of aerosol concentration and size distribution in Cape Verde using a continuous aerosol optical spectrometer. Front. Environ. Sci. 2014, 2, 15. [Google Scholar] [CrossRef] [Green Version]
  5. WHO, World Health Organization. Air Quality Guidelines for Particulate Matter, Ozone, Nitrogen Dioxide and Sulfur Dioxide-Global Update 2005, Summary of Risk Assessment; World Health Organization: Geneva, Switzerland, 2006. [Google Scholar]
  6. Carlsen, H.K.; Ilyinskaya, E.; Baxter, P.J.; Schmidt, A.; Thorsteinsson, T.; Pfeffer, M.A.; Barsotti, S.; Dominici, F.; Finnbjornsdottir, R.G.; Jóhannsson, T.; et al. Increased respiratory morbidity associated with exposure to a mature volcanic plume from a large Icelandic fissure eruption. Nat. Commun. 2021, 12, 2161. [Google Scholar] [CrossRef]
  7. Tiwari, A.; Singh, S.; Soni, V.K.; Kumar, R.R. Environmental Impact of Recent Volcanic Eruption from Mt. Mayon Over 1 South-East Asia. J. Geogr. Nat. Disast. 2021, 10, 4. [Google Scholar]
  8. Wilson, T.; Cole, J.; Cronin, S.; Stewart, C.; Johnston, D. Impacts on agriculture following the 1991 eruption of Vulcan Hudson, Patagonia: Lessons for recovery. Nat. Hazards 2011, 57, 185–212. [Google Scholar] [CrossRef]
  9. Horwell, C.; Baxter, P.J. The respiratory health hazards of volcanic ash: A review for volcanic risk mitigation. Bull. Volcanol. 2006, 69, 1–24. [Google Scholar] [CrossRef]
  10. Gudmundsson, G. Respiratory health effects of volcanic ash with special reference to Iceland. A review. Clin. Resp. J. 2010, 231, 9. [Google Scholar] [CrossRef]
  11. Knippertz, P.; Stuut, J.-B. Mineral Dust, a Key Player in the Earth System, 1st ed.; Springer: Dordrecht, The Netherlands, 2014. [Google Scholar] [CrossRef]
  12. Daga, R.; Guevara, S.; Poire, D.; Arribére, M. Characterization of tephras dispersed by the recent eruptions of volcanoes Calbuco (1961), Chaitén (2008) and Cordón Caulle Complex (1960 and 2011), in Northern Patagonia. J. S. Am. Earth Sci. 2014, 49, 1–14. [Google Scholar] [CrossRef]
  13. Horwell, C.; Fenoglio, I.; Ragnarsdottir, K.V.; Sparks, R.S.; Fubini, B. Surface reactivity of volcanic ash from the eruption of Soufrière Hills volcano, Montserrat, West Indies with implications for health hazards. Environ. Res. 2003, 93, 202–215. [Google Scholar] [CrossRef]
  14. IARC, International Agency for Research on Cancer. Monographs. Available online: https://monographs.iarc.who.int/ (accessed on 15 July 2021).
  15. Smeester, L.; Fry, R.C. Long-Term Health Effects and Underlying Biological Mechanisms of Developmental Exposure to Arsenic. Curr. Environ. Health Rep. 2018, 5, 134–144. [Google Scholar] [CrossRef]
  16. Fomba, K.; Müller, K.; van Pinxteren, D.; Poulain, L.; van Pinxteren, M.; Herrmann, H. Long-term chemical characterization of tropical and marine aerosols at the Cape Verde Atmospheric Observatory (CVAO) from 2007 to 2011. Atmos. Chem. Phys. 2014, 14, 8883–8904. [Google Scholar] [CrossRef] [Green Version]
  17. Nriagu, J. Toxic metal pollution in Africa. J. Sci. Total Environ. 1992, 121, 1–37. [Google Scholar] [CrossRef]
  18. Grobeéty, B.; Giereé, R.; Dietze, V.; Stille, P. Airborne Particles in the Urban Environment. Elements 2010, 6, 229–234. [Google Scholar] [CrossRef] [Green Version]
  19. Gama, C.; Tchepel, O.; Baldasano, J.M.; Basart, S.; Ferreira, J.; Pio, C.; Cardoso, J.; Borrego, C. Seasonal patterns of Saharan dust over Cape Verde–A combined approach using observations and modelling. Tellus B Chem. Phys. Meteorol. 2015, 67, 24410. [Google Scholar] [CrossRef] [Green Version]
  20. Weinstein, P.; Cook, A. Volcanic emissions and health. In Medical Geology: Effects of Geological Environments on Human Health-Developments in Earth and Environmental Sciences Series; Komatina, M.M., Ed.; Elsevier: Amsterdam, The Netherlands, 2005; pp. 203–226. [Google Scholar]
  21. Gayle, A.; Quint, J.; Fuertes, E. Understanding the relationships between environmental factors and exacerbations of COPD. Expert Rev. Respir. Med. 2021, 15, 39–50. [Google Scholar] [CrossRef]
  22. Karanasiou, A.; Moreno, N.; Moreno, T.; Viana, M.; Leeuw, F.; Querol, X. Health effects from Sahara dust episodes in Europe: Literature review and research gaps. Environ. Int. 2012, 47, 107–114. [Google Scholar] [CrossRef]
  23. Dumont, S.; Silveira, G.; Custódio, S.; Lopes, F.; Mouël, J.; Gouhier, M.; Guéhenneux, Y. Response of Fogo volcano (Cape Verde) to lunisolar gravitational forces during the 2014–2015 eruption. Phys. Earth Planet Int. 2021, 312, 106659. [Google Scholar] [CrossRef]
  24. Larrue, S.; Paris, R.; Etienne, S. The use of vascular plant densities to estimate the age of undated lava flows in semi-arid areas of Fogo Island (Cape Verde, Atlantic Ocean). J. Arid Environ. 2020, 173, 104042. [Google Scholar] [CrossRef]
  25. Barrett, R.; Lebas, E.; Ramalho, R.; Klaucke, I.; Kutterolf, S.; Klügel, A.; Lindhorst, K.; Gross, F.; Krastel, S. Revisiting the tsunamigenic volcanic flank collapse of Fogo Island in the Cape Verdes, offshore West Africa. Geol. Soc. Lond. 2020, 500, 13–26. [Google Scholar] [CrossRef] [Green Version]
  26. Silva, S.; Alfama, V.; Cardoso, N. The Volcanic Eruption of 2014/15 on Fogo Island Cape Vert and the main effects. Repocs 2016, 13, 49–61. (In Portuguese) [Google Scholar] [CrossRef] [Green Version]
  27. Wu, G.; Zhang, X.; Zhang, C.; Xu, T. Mineralogical and morphological properties of individual dust particles in ice cores from the Tibetan Plateau. J. Glaciol. 2016, 62, 46–53. [Google Scholar] [CrossRef] [Green Version]
  28. Menut, L.; Bessagnet, B.; Khvorostyanov, D.; Beekmann, M.; Blond, N.; Colette, A.; Coll, I.; Curci, G.; Foret, G.; Hodzic, A.; et al. CHIMERE: A model for regional atmospheric composition modelling. Geosc. Model. Dev. 2013, 6, 981–1028. [Google Scholar] [CrossRef] [Green Version]
  29. Skamarock, W.C.; Klemp, J.B.; Dudhia, J.; Gill, D.O.; Barker, D.M.; Duda, M.G.; Huang, X.-Y.; Wang, W.; Powers, J.G. A Description of the Advanced Research WRF Version 3. NCAR Tech. Note NCAR/TN-475+STR 2008, 113. [Google Scholar] [CrossRef]
  30. Schmechtig, C.; Marticorena, B.; Chatenet, B.; Bergametti, G.; Rajot, J.L.; Coman, A. Simulation of the mineral dust content over Western Africa from the event to the annual scale with the CHIMERE-DUST model. Atmos. Chem. Phys. 2011, 11, 7185–7207. [Google Scholar] [CrossRef] [Green Version]
  31. Ginoux, P.; Chin, M.; Tegen, I.; Prospero, J.; Holben, B.; Dubovik, O.; Lin, S.-J. Sources and distributions of dust aerosols simulated with the GOCART model. J. Geophys. Res. 2001, 106, 20255–20274. [Google Scholar] [CrossRef]
  32. Nishida, H.; Miyai, M.; Tada, F.; Suzuki, S. Computation of the index of pollution caused by heavy metals in river sediment. Environ. Pollut. 1982, 4, 241–248. [Google Scholar] [CrossRef]
  33. Hakanson, L. Ecological risk index for aquatic pollution control, a sedimentological approach. Water Res. 1980, 14, 975–1001. [Google Scholar] [CrossRef]
  34. Tomlinson, D.L.; Wilson, J.G.; Harris, C.R.; Jeffrey, D.W. Problems in the assessment of heavy-metal levels in estuaries and the formation of a pollution index. Helgol. Meeresunters. 1980, 33, 566–575. [Google Scholar] [CrossRef] [Green Version]
  35. Muller, G. Schwermetalle in den sediment des Rheins, Veranderungem Seit. Umschau 1979, 79, 778–783. [Google Scholar]
  36. Yesilkanat, C.; Kobya, Y. Spatial characteristics of ecological and health risks of toxic heavy metal pollution from road dust in the Black Sea coast of Turkey. Geoderma Reg. 2021, 25, e00388. [Google Scholar] [CrossRef]
  37. Bowen, H.J.M. Trace Elements in Biochemistry; Academic Press: London, UK, 1966. [Google Scholar]
  38. RAIS, The Risk Assessment Information System. Available online: https://rais.ornl.gov/ (accessed on 5 June 2021).
  39. Mata, J.; Martins, S.; Mattielli, N.; Madeira, J.; Faria, B.; Ramalho, R.S.; Silva, P.; Moreira, M.; Caldeira, R.; Moreira, M.; et al. The 2014–2015 eruption and the short-term geochemical evolution of the Fogo volcano (Cape Verde): Evidence for small-scale mantle heterogeneity. Lithos 2017, 288–289, 91–107. [Google Scholar] [CrossRef]
  40. Le Bas, M.J.; Le Maitre, R.W.; Woolley, A.R. The Construction of the Total Alkali-Silica Chemical Classification of Volcanic Rocks. J. Petrol. 1986, 27, 745–750. [Google Scholar] [CrossRef]
  41. Escrig, S.; Doucelance, R.; Moreira, M.; Allegre, C. Os isotope systematics in Fogo Island: Evidence for lower continental crust fragments under the Cape Verde Southern Islands. Chem. Geol. 2005, 219, 93–113. [Google Scholar] [CrossRef]
  42. Nicolás, J.; Chiari, M.; Crespo, J.; Garcia Orellana, I.; Lucarelli, F.; Nava, S.; Pastor, C.; Yubero, E. Quantification of Saharan and local dust impact in an arid Mediterranean area by the positive matrix factorization (PMF) technique. Atm. Environ. 2008, 42, 8872–8882. [Google Scholar] [CrossRef]
  43. Cai, Y.; Li, F.; Zhang, J.; Zhu, X.; Li, Y.; Fu, J.; Chen XLiu, C. Toxic metals in size-fractionated road dust from typical industrial district: Seasonal distribution, bioaccessibility and stochastic-fuzzy health risk management. Environ. Technol. Innov. 2021, 23, 101643. [Google Scholar] [CrossRef]
  44. Liu, G.; Wang, J.; Liu, X.; Liu, X.; Li, X.; Ren, Y.; Wang, J.; Dong, L. Partitioning and geochemical fractions of heavy metals from geogenic and anthropogenic sources in various soil particle size fractions. Geoderma 2018, 312, 104–113. [Google Scholar] [CrossRef]
  45. Jeong, G.; Park, M.; Kandler, K.; Nousiainen, T.; Kemppinen, O. Mineralogical properties and internal structures of individual fine particles of Saharan dust. Atmos. Chem. Phys. 2016, 16, 12397–12410. [Google Scholar] [CrossRef] [Green Version]
  46. Scheuvens, D.; Schütz, L.; Kandler, K.; Ebert, M.; Weinbruch, S. Bulk composition of northern African dust and its source sediments-A compilation. Earth Sci. Rev. 2013, 116, 170–194. [Google Scholar] [CrossRef]
  47. Butwin, M.K.; Pfeffer, M.A.; von Löwis, S.; Støren, E.W.N.; Bali, E.; Thorsteinsson, T. Properties of dust source material and volcanic ash in Iceland. Sedimentology 2020, 67, 3067–3087. [Google Scholar] [CrossRef]
  48. Reich, M.; Zúñiga Al Amigo, A.; Vargas, G.; Morata, D.; Palacios, C.; Parada, M.; Garreaud, R. Formation of cristobalite nanofibers during explosive volcanic eruptions. Geology 2009, 37, 435–438. [Google Scholar] [CrossRef]
  49. Lavalle-Carrasco, J.; Molina-Frechero, N.; Nevárez-Rascón, M.; Sánchez-Pérez, L.; Hamdan-Partida, A.; González-González, R.; Cassi, D.; Isiordia-Espinoza, M.; Bologna-Molina, R. Recent biomarkers for monitoring the systemic fluoride levels in exposed populations: A systematic review. Int. J. Environ. Res. Public Health 2021, 18, 317. [Google Scholar] [CrossRef]
  50. Falcone, E.; Federico, C.; Bellomo, S.; Brusca, L.; D’Alessandro, W.; Longo, M.; Calabrese, S. Impact of acidic volcanic emissions on ash leaching and, on the bioavailability, and mobility of trace metals in soils of Mt. Etna. Ital. J. Geosci. 2021, 140, 57–78. [Google Scholar] [CrossRef]
  51. Kabir, H.; Gupta, A.; Tripathy, S. Fluoride and human health: Systematic appraisal of sources, exposures, metabolism, and toxicity. Crit. Rev. Environ. Sci. Technol. 2020, 50, 1116–1193. [Google Scholar] [CrossRef]
  52. Johnston, N.; Strobel, S. Principles of fluoride toxicity and the cellular response: A review. Arch. Toxicol. 2020, 94, 1051–1069. [Google Scholar] [CrossRef]
  53. Mueller, S.; Ayris, P.; Wadsworth, F.; Kueppers, U.; Casas, A.; Delmelle, P.; Taddeucci, J.; Jacob, M.; Dingwell, D. Ash aggregation enhanced by deposition and redistribution of salt on the surface of volcanic ash in eruption plumes. Sci. Rep. 2017, 7, 45762. [Google Scholar] [CrossRef]
  54. Ruby, M.V.; Lowney, Y.W. Selective soil particle adherence to hands: Implications for understanding oral exposure to soil contaminants. Environ. Sci. Technol. 2012, 46, 12759–12771. [Google Scholar] [CrossRef] [PubMed]
  55. Lu, X.; Wang, L.; Li, L.; Lei, K.; Huang, L.; Kang, D. Multivariate statistical analysis of heavy metals in street dust of Baoji, NW China. J. Hazard. Mater. 2010, 173, 744–749. [Google Scholar] [CrossRef]
  56. Gunawardana, C.; Goonetilleke, A.; Egodawatta, P.; Dawes, L.; Kokot, S. Source characterisation of road dust based on chemical and mineralogical composition. Chemosphere 2012, 87, 163–170. [Google Scholar] [CrossRef] [Green Version]
  57. Fiala, M.; Hwang, H.M. Influence of highway pavement on metals in road dust: A case study in Houston, Texas. Water Air Soil Pollut. 2021, 232, 185. [Google Scholar] [CrossRef]
  58. Breuning-Madsen, H.; Awadzi, T.W. Harmattan dust deposition and particle size in Ghana. Catena 2005, 63, 23–38. [Google Scholar] [CrossRef]
  59. Ryder, C.; Highwood, E.; Walser, A.; Seibert, P.; Philipp, A.; Weinzier, B. Coarse and giant particles are ubiquitous in Saharan dust export regions and are radiatively significant over the Sahara. Atmos. Chem. Phys. 2019, 19, 15353–15376. [Google Scholar] [CrossRef] [Green Version]
  60. HEI, Health Effects Institute. State of Global Air 2020. Available online: https://www.stateofglobalair.org/ (accessed on 20 July 2021).
  61. Sprigg, W.A.; Nickovic, S.; Galgiani, J.N.; Pejanovic, G.; Petkovic, S.; Vujadinovic, M.; Vukovic, A.; Dacic, M.; DiBiase, S.; Prasad, A.; et al. Regional dust storm modeling for health services: The case of valley fever. Aeolian Res. 2014, 14, 53–73. [Google Scholar] [CrossRef] [Green Version]
  62. Zhang, T.; Gao, B.; Zhou, Z.; Chang, Y. The movement and deposition of PM2.5 in the upper respiratory tract for the patients with heart failure: An elementary CFD study. Biomed. Eng. Online 2016, 15, 138. [Google Scholar] [CrossRef] [Green Version]
  63. Xing, Y.-F.; Xu, Y.-H.; Shi, M.-H.; Lian, Y.-X. The impact of PM2.5 on the human respiratory system. J. Thorac. Dis. 2016, 8, E69–E74. [Google Scholar] [CrossRef]
  64. Grimsrud, D.T. Project Summary Report to the Legislative Commission on Minnesota Resources (LCMR) Part III: Literature Review of IAQ Impacts on School Children. Continuous Indoor Quality (IAQ) Monitoring in Minnesota Schools. Proj. Results 2004, 2, 2004. [Google Scholar]
  65. Varshney, C.K.; Padhy, P.H. Total volatile organic compounds in the urban environment of Delhi. J. Air Waste Manag. Assoc. 1998, 48, 448–453. [Google Scholar] [CrossRef] [Green Version]
  66. Fujita, E.; Campbell, D.; Zielinska, B.; Arnott, W.; Chow, J. Concentrations of Air Toxics in Motor Vehicle–Dominated Environments. Res. Rep. Health Eff. Inst. 2011, 156, 3–77. [Google Scholar]
  67. Alves, C.A.; Candeias, C.; Nunes, T.V.; Tomé, M.J.C.; Vicente, E.D.; Avila, P.F.; Rocha, F. Passive monitoring of particulate matter and gaseous pollutants in Fogo Island, Cape Verde. Atmos. Res. 2018, 214, 250–262. [Google Scholar] [CrossRef]
  68. Tassi, F.; Capecchiacci, F.; Cabassi, J.; Calabrese, S.; Vaselli, O.; Rouwet, D.; Pecoraino, G.; Chiodini, G. Geogenic and atmospheric sources for volatile organic compounds in fumarole emissions from Mt. Etna and Volcano Island (Sicily, Italy). J. Geophys. Res. 2012, 117, D17305. [Google Scholar] [CrossRef] [Green Version]
  69. Briber, B.; Hutyra, L.; Dunn, A.; Raciti, S.; Munger, J. Variations in atmospheric CO2 mixing ratios across a Boston, MA urban to rural gradient. Land 2013, 2, 304–327. [Google Scholar] [CrossRef] [Green Version]
  70. Widory, D.; Javoy, M. The carbon isotope composition of atmospheric CO2 in Paris. Earth Planet Sci. Lett. 2003, 215, 289–298. [Google Scholar] [CrossRef]
  71. Andersson, S.M.; Martinsson, B.G.; Friberg, J.; Brenninkmeijer, C.; Rauthe-Schöch, A.; Hermann, M.; van Velthoven, P.; Zahn, A. Composition and evolution of volcanic aerosol from eruptions of Kasatochi, Sarychev and Eyjafjallajökull in 2008–2010 based on CARIBIC observations. Atmos. Chem. Phys. 2013, 13, 1781–1796. [Google Scholar] [CrossRef] [Green Version]
  72. Zheng, J.; Noller, B.; Huynh, T.; Ng, J.; Taga, R.; Diacomanolis, V.; Harris, H. How the population in Mount Isa is living with lead exposure from mining activities. Extract. Ind. Soc. 2021, 8, 123–134. [Google Scholar] [CrossRef]
  73. Takeda, A. Manganese action in brain function. Brain Res. Rev. 2003, 41, 79–87. [Google Scholar] [CrossRef]
Figure 1. (a) Cape Verde, westwards of African coast, with the CHIMERE simulation domains (CVd1-green and CVd2-red lines; CHIMERE description in section below); (b) Cape Verde archipelago; and (c) Fogo Island, 2014 eruption lava and samples sites (adapt. [23]).
Minerals 11 01275 g001
Figure 5. PM10 and PM2.5 concentrations in distinct locations of Fogo Island.
Minerals 11 01275 g005
Figure 6. Concentrations of CO2 and TVOCs in distinct locations of Fogo Island.
Minerals 11 01275 g006
Figure 7. Mean rooftop dust PTE contributions, in the three exposure routes, to the cumulative non-carcinogenic Hazard Index for children (HIChildTotal) and Total Risk posed for both children and adults, in fractions <63, 63–125 and 125–250 µm.
Minerals 11 01275 g007
Table 1. Non-carcinogenic hazard and carcinogenic risk posed by rooftop dust samples, in fractions <63, 63–125 and 125–250 µm.
Dust FractionsHQChildIng HIChildTotalRiskAsIngRiskAsTotalRiskTotalIngRiskTotal
<63 µmmean1.41.46.34E−067.24E−066.63E−067.61E−06
min1.31.36.34E−067.24E−066.58E−067.56E−06
max1.51.56.34E−067.24E−066.67E−067.65E−06
63–125 µmmean1.41.42.11E−062.41E−062.29E−062.68E−06
min1.31.31.62E−061.85E−061.72E−062.02E−06
max1.61.75.57E−066.35E−066.04E−066.92E−06
125–250 µmmean1.41.41.97E−062.25E−062.05E−062.45E−06
min1.21.31.62E−061.85E−061.65E−062.00E−06
max1.51.54.40E−065.02E−064.58E−065.34E−06
HQChilIng—Non-carcinogenic Hazard Quotient for children by ingestion; HIChildTotal—Cumulative non-carcinogenic Hazard Index of all elements and routes for children; RiskAsIng—Carcinogenic risk posed by As ingestion for both children and adults; RiskTotalIng—Risk by Ingestion for total elements for both children and adults; RiskTotal—Total Risk posed by all elements and exposure routes for both children and adults.
Publisher’s Note: MDPI stays neutral with regard to jurisdictional claims in published maps and institutional affiliations.

