
NMR Spectral Characteristics of Ultrahigh Pressure High Temperature Impact Glasses of the Giant Kara Crater (Pay-Khoy, Russia)


Abstract
:1. Introduction
2. Materials and Methods
3. Results
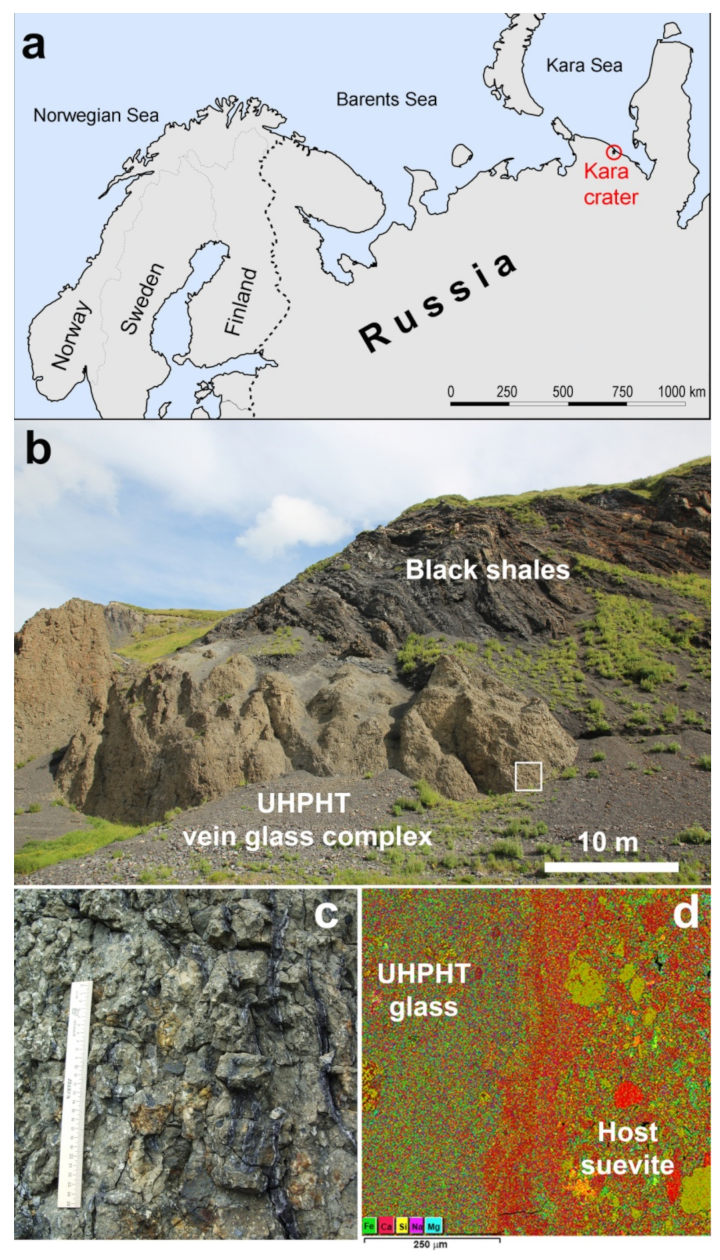
3.1. Samples Characterization
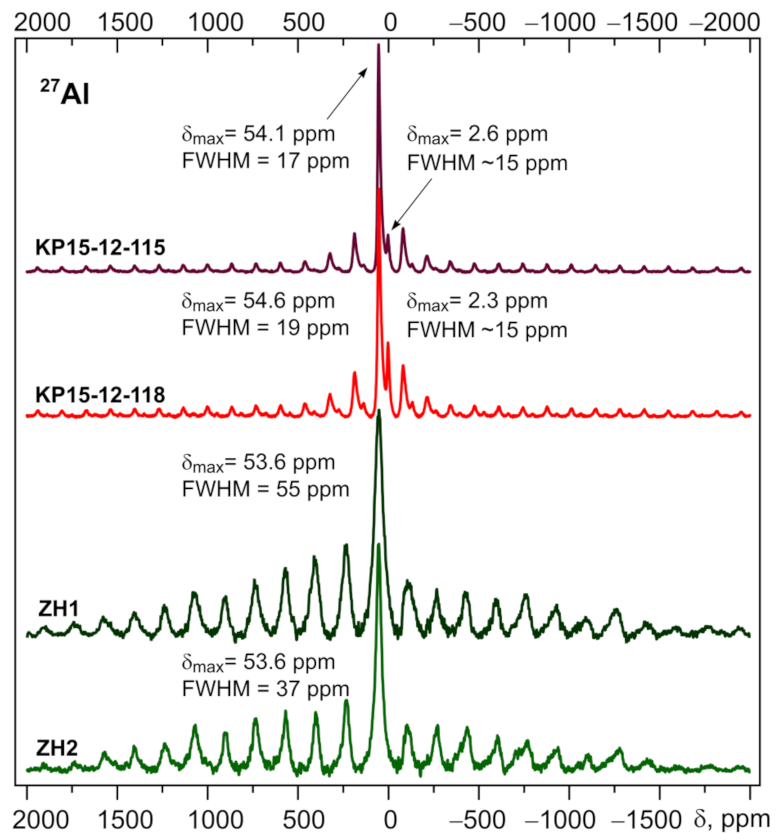
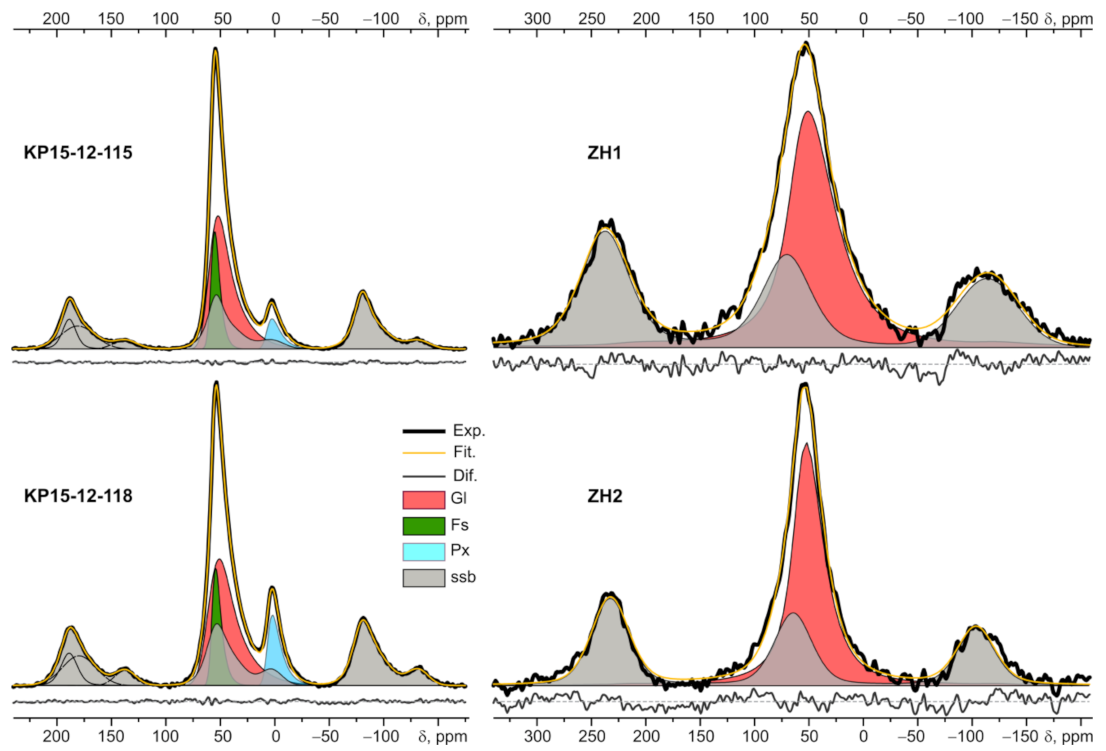
3.2. 27Al MAS NMR
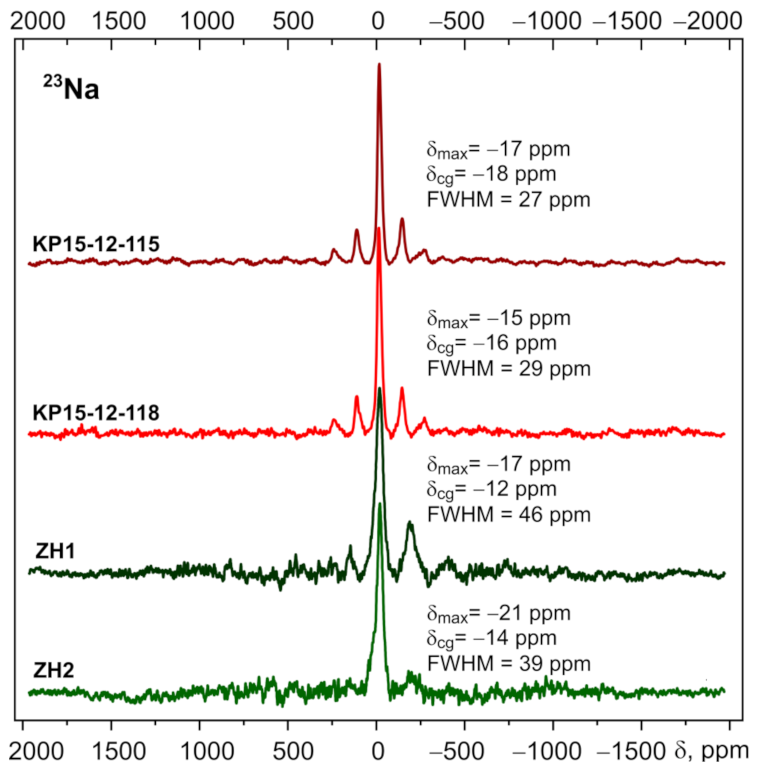
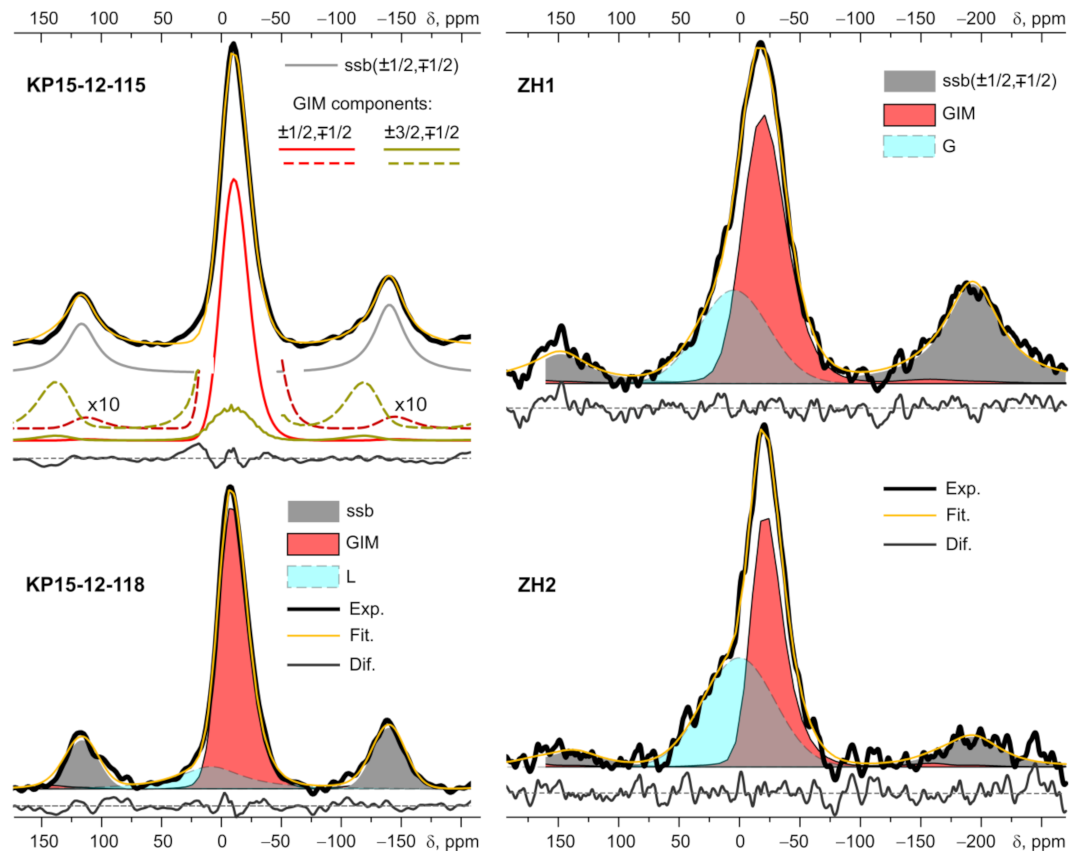
3.3. 23Na MAS NMR
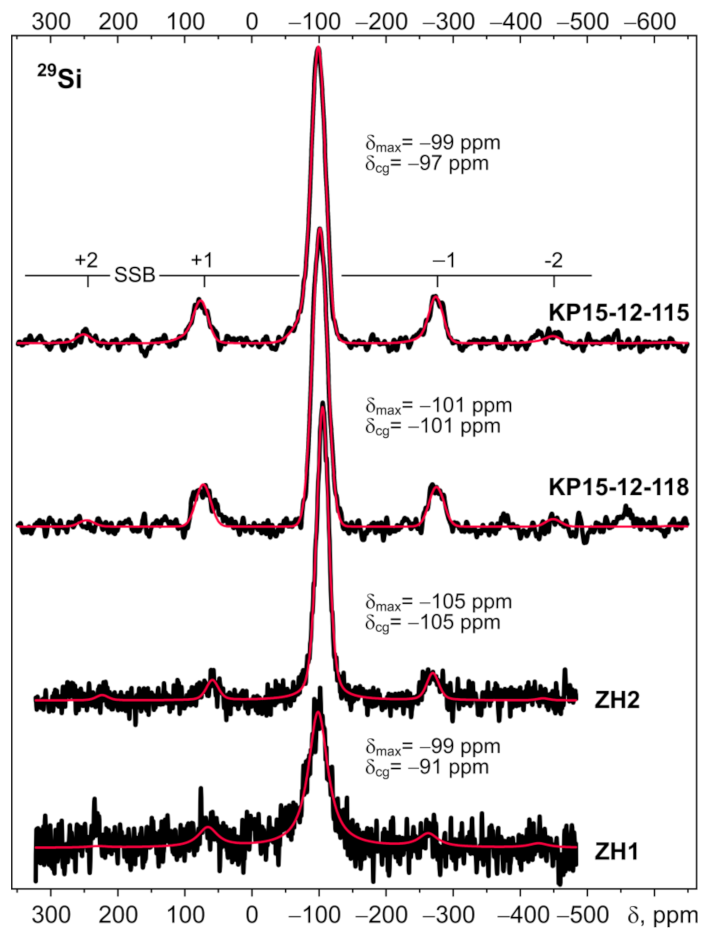
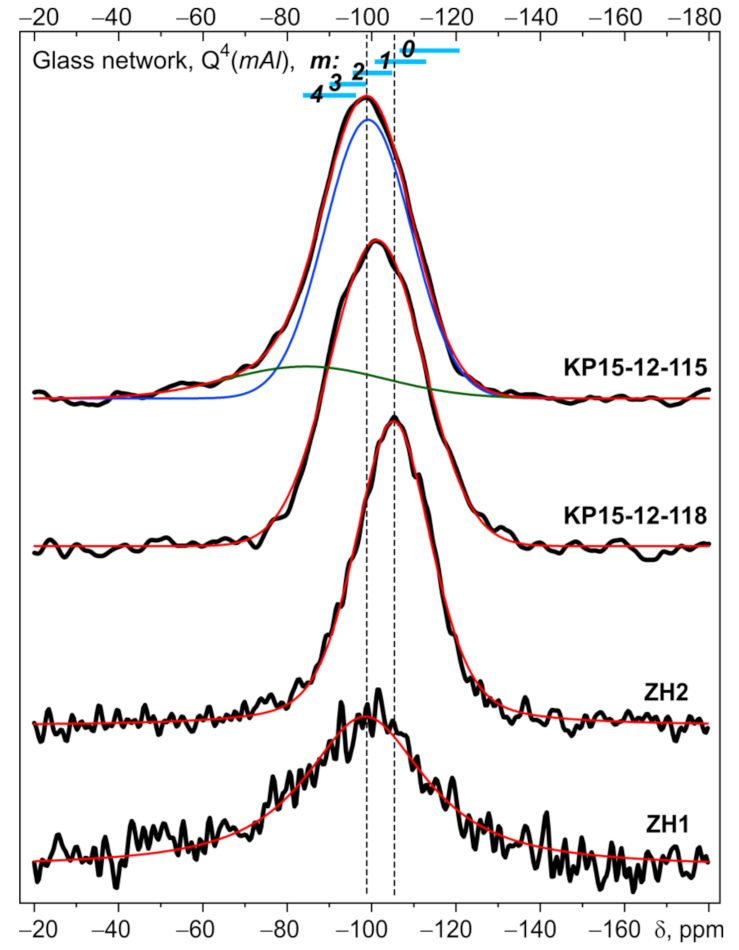
3.4. 29Si MAS NMR
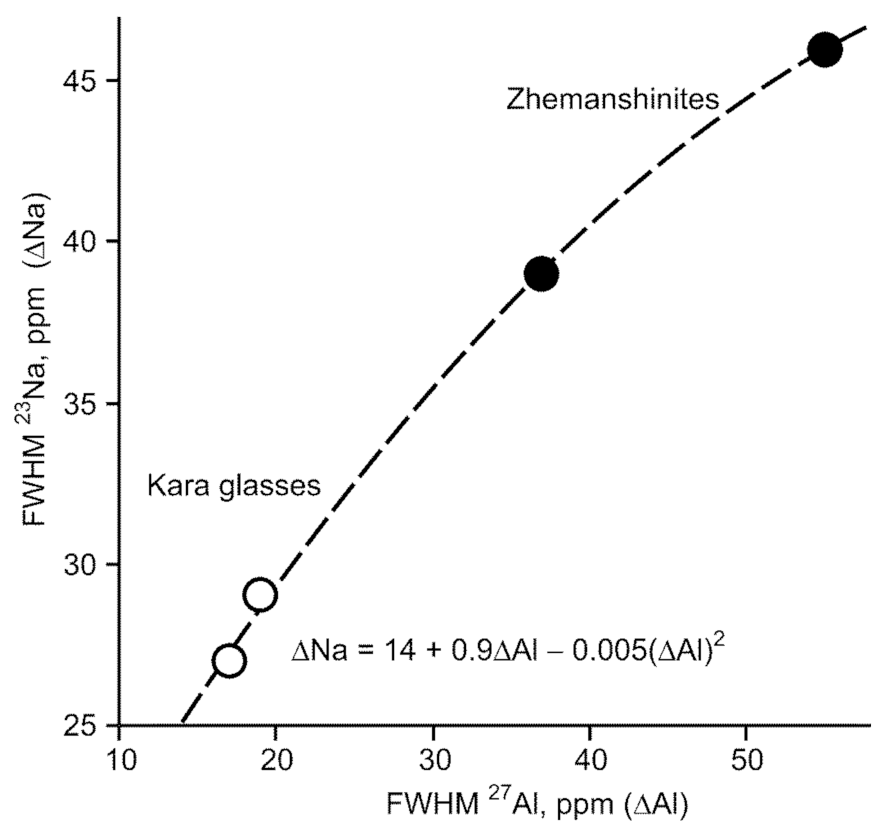
4. Discussion
5. Conclusions
Author Contributions
Funding
Acknowledgments
Conflicts of Interest
References
- Tsiok, O.B.; Brazhkin, V.V.; Lyapin, A.G.; Khvostantsev, L.G. Logarithmic Kinetics of the Amorphous-Amorphous Transformations in SiO2 and GeO2 Glasses under High Pressure. Phys. Rev. Lett. 1998, 80, 999–1002. [Google Scholar] [CrossRef]
- Brazhkin, V.V.; Katayama, Y.; Trachenko, K.; Tsiok, O.B.; Lyapin, A.G.; Artacho, E.; Dove, M.; Ferlat, G.; Inamura, Y.; Saitoh, H. Nature of Structural Transformations in the B2O3 Glass under High Pressure. Phys. Rev. Lett. 2008, 101, 35702. [Google Scholar] [CrossRef] [PubMed] [Green Version]
- Benmore, C.J.; Soignard, E.; Amin, S.A.; Guthrie, M.; Shastri, S.D.; Lee, P.L.; Yarger, J.L. Structural and topological changes in silica glass at pressure. Phys. Rev. 2010, 81, 54105. [Google Scholar] [CrossRef]
- Pronin, A.A.; Kondrin, M.V.; Lyapin, A.G.; Brazhkin, V.V.; Volkov, A.A.; Lunkenheimer, P.; Loid, A. Glassy dynamics under superhigh pressure. Phys. Rev. 2010, 81, 41503. [Google Scholar] [CrossRef] [PubMed] [Green Version]
- Sato, T.; Funamori, N. High-pressure structural transformation of SiO2 glass up to 100 GPa. Phys. Rev. 2010, 82, 184102. [Google Scholar] [CrossRef]
- Brazhkin, V.V.; Fomin, Y.u.D.; Lyapin, A.G.; Ryzhov, V.N.; Trachenko, K. Two Liquid States of Matter: A Dynamical Line on a Phase Diagram. Phys. Rev. 2012, 85, 31203. [Google Scholar] [CrossRef] [Green Version]
- Deschamps, T.; Margueritat, J.; Martinet, C.; Mermet, A.; Champagnon, B. Elastic Moduli of Permanently Densified Silica Glasses. Sci. Rep. 2014, 4, 7193. [Google Scholar] [CrossRef] [Green Version]
- Kono, Y.; Kenney-Bensona, C.; Ikutaa, D.; Shibazaki Yu Wang, Y.; Shena, G. Ultrahigh-pressure polyamorphism in GeO2 glass with coordination number >6. PNAS 2016, 113, 3436–3441. [Google Scholar] [CrossRef] [Green Version]
- Bolmatov, D.; Brazhkin Trachenko, V.V. Thermodynamic behavior of supercritical matter. Nat. Commun. 2013, 4, 2331. [Google Scholar] [CrossRef]
- Borisova, P.A.; Blanter, M.S.; Brazhkin, V.V.; Somenkov, V.A.; Filonenko, V.P. Phase transformations in amorphous fullerite C60 under high pressure and high temperature. J. Phys. Chem. Solids. 2015, 83, 104–108. [Google Scholar] [CrossRef]
- Shultz, M.M.; Mazurin, O.V. Contemporary Concept of Glass Structure and Their Properties; Nauka: Leningrad, Russia, 1998. (In Russian) [Google Scholar]
- Guerette, M.; Ackerson, M.R.; Thomas, J.; Yuan, F.; Watson, E.B.; Walker, D.; Huang, L. Structure and Properties of Silica Glass Densified in Cold Compression and Hot Compression. Sci. Rep. 2015, 5, 15343. [Google Scholar] [CrossRef] [PubMed] [Green Version]
- Shumilova, T.G.; Zubov, A.A.; Isaenko, S.I.; Karateev, I.A.; Vasiliev, A.I. Mysterious long-living ultrahigh pressure or secondary impact crisis. Sci. Rep. 2020, 10, 2591. [Google Scholar] [CrossRef]
- Shumilova, T.G.; Lutoev, V.P.; Isaenko, S.I.; Kovalchuk, N.S.; Makeev, B.A.; Lysiuk AYu Zubov, A.A.; Ernstson, K. Spectroscopic features of ultrahigh-pressure impact glasses of the Kara astrobleme. Sci. Rep. 2018, 8, 6923. [Google Scholar] [CrossRef] [Green Version]
- Lutoev, V.P.; Potapov, S.S.; Lysuyk AYu Golovataya, O.S. Features of natural and synthetic silica glasses by FTIR, EPS and Mössbouer spectroscopy. In Mineralogy of Technogenesis-2018; Potapov, S.S., Anfilogov, V.N., Popov, V.A., Eds.; Institute of Mineralogy UB RAS: Miass, Russia, 2018; pp. 26–51. (In Russian) [Google Scholar]
- Golubev, Y.A.; Shumilova, T.G.; Isaenko, S.I.; Radaev, V.A.; Utkin, A.A.; Makeev, B.A.; Ernstson, K. Microscopic studies of ultra-high pressure glasses from impactites of the Kara astrobleme. J. Non-Cryst. Solids 2020, 534, 119951. [Google Scholar] [CrossRef]
- Koroleva, O.N.; Anfilogov, V.N.; Shatskiy, A.; Litasov, K.D. Structure of Na2O–SiO2 melt as a function of composition: In situ Raman spectroscopic study. J. Non-Cryst. Solids 2013, 375, 62–68. [Google Scholar] [CrossRef]
- Angeli, F.; Gaillard, M.; Jollivet, P.; Charpentier, T. Influence of glass composition and alteration solution on leached silicate glass structure: A solid-state NMR investigation. Geochim. Cosmochim. Acta 2006, 70, 2577–2590. [Google Scholar] [CrossRef]
- Florenskiy, P.V. The Zhamanshin meteorite crater (Northern Aral Sea region) and its tektites and impactites. Int. Geol. Rev. 1997, 19, 526–538. [Google Scholar] [CrossRef]
- Kartashov, P.M.; Gornostaeva, T.A.; Mokhov, A.V.; Bogatikov, O.A. The Natural High Pressure Phase of Cubic CdSe in Impact Glass from Zhamanshin Crater. Dokl. Earth Sci. 2016, 467, 412–414. [Google Scholar] [CrossRef]
- Gornostaeva, T.A.; Mokhov, A.V.; Kartashov, P.M.; Bogatikov, O.A. Condensate glasses from the Zhamanshin Crater. I. Irghizites. Petrology 2016, 24, 1–20. [Google Scholar] [CrossRef]
- Massiot, D.; Fayon, F.; Capron, M.; King, I.; Le Calvé, S.; Alonso, B.; Durand, J.-O.; Bujoli, B.; Gan, Z.; Hoatson, G. Modelling one- and two-dimensional Solid State NMR spectra. Magn. Reson. Chem. 2002, 40, 70–76. [Google Scholar] [CrossRef]
- Makeyev, A.B.; Lutoev, V.P.; Vtorov, I.P.; Braynchaninova, N.I.; Makavetskas, A.R. Composition and spectroscopy of olivine xenocrysts from the Hawaiian tholeiitic basalts. Uchenye Zap. Kazan. Univ. Seriya Estestv. Nauk. 2020, 162, 253–273. [Google Scholar] [CrossRef]
- Phillips, B.L.; Kirkpatrick, R.J.; Hovis, G.L. 27A1, 29Si, and 23Na MAS NMR Study of an Al, Si Ordered Alkali Feldspar Solid Solution Series. Phys. Chem. Miner. 1988, 16, 262–275. [Google Scholar] [CrossRef]
- Kohn, S.C.; Dupree, R.; Mortuza, M.G. The interaction between water and aluminosilicate magmas. Chem. Geol. 1992, 96, 399–409. [Google Scholar] [CrossRef]
- Brus, J.; Abbrent, S.; Kobera, L.; Urbanova, M.; Cuba, P. Advances in 27Al MAS NMR Studies of Geopolymers. Annu. Rep. NMR Spectrosc. 2016, 88, 79–147. [Google Scholar] [CrossRef]
- Kelsey, K.E.; Stebbins, J.F.; Singer, D.N.; Brown, G.E.; Mosenfelder, J.L.; Asimow, P.D. Cation field strength effects on high pressure aluminosilicate glass structure: Multinuclear NMR and La XAFS results. Geochim. Cosmochim. Acta 2009, 73, 3914–3933. [Google Scholar] [CrossRef]
- Kelsey, K.E.; Stebbins, J.F.; Mosenfelder, J.L.; Asimow, P.D. Simultaneous aluminum, silicon, and sodium coordination changes in 6 GPa sodium aluminosilicate glasses. Am. Mineral. 2009, 94, 1205–1215. [Google Scholar] [CrossRef] [Green Version]
- Bista, S.; Stebbins, J.F.; Hankins, W.B.; Sisson, T.W. Aluminosilicate melts and glasses at 1 to 3 GPa: Temperature and pressure effects on recovered structural and density changes. Am. Mineral. 2015, 100, 2298–2307. [Google Scholar] [CrossRef]
- Schmidt, B.C.; Riemer, T.; Kohn, S.C.; Behrens, H.; Dupree, R. Different water solubility mechanisms in hydrous glasses along the Qz-Ab Join: Evidence from NMR Spectroscopy. Geochim. Cosmochim. Acta 2000, 64, 513–526. [Google Scholar] [CrossRef]
- Haouas, M.; Taulella, F.; Martineau, C. Recent advances in application of 27Al NMR spectroscopy materials science. Prog. Nucl. Magn. Reson. Spectrosc. 2016, 94–95, 11–36. [Google Scholar] [CrossRef]
- Youngman, R. NMR Spectroscopy in Glass Science: A Review of the Elements. Materials 2018, 11, 476. [Google Scholar] [CrossRef] [Green Version]
- Schroeder, P.A.; Pruett, R.J. Fe ordering in kaolinite: Insights 29Si and 27Al MAS NMR spectroscopy. Am. Mineral. 1996, 81, 26–38. [Google Scholar] [CrossRef]
- D’Espinose de Lacaillerie, J.-B.; Fretigny, C.; Massiot, D. MAS NMR spectra of quadrupolar nuclei in disordered solids: The Czjzek model. J. Magn. Reson. 2008, 192, 244–251. [Google Scholar] [CrossRef]
- Neuville, D.R.; Cormier, L.; Massiot, D. Al environment in tectosilicate and peraluminous glasses: A 27Al MQ-MAS NMR, Raman, and XANES investigation. Geochim. Cosmochim. Acta 2004, 68, 5071–5079. [Google Scholar] [CrossRef]
- Pronin, A.A.; Kondrin, M.V.; Lyapin, A.G.; Brazhkin, V.V.; Volkov, A.A.; Lunkenheimer, P.; Samoson, A. Satellite transition high-resolution NMR of quadrupolar nuclei in powders. Chem. Phys. Lett. 1985, 119, 29–32. [Google Scholar] [CrossRef]
- Lippma, E.; Samoson, A.; Magi, M. High-Resolution 27Al NMR of Aluminosilicates. J. Am. Chem. Soc. 1986, 108, 1730–1735. [Google Scholar] [CrossRef]
- Diallo, B.; Allix, M.; Veron, E.; Sarou-Kanian, V.; Bardez-Giboire, I.; Montouillout, V.; Pellerin, N. Deconvolution method of 29Si MAS MNR spectra applied to homogeneous and phase separated lanthanum aluminosilicate glasses. J. Non-Cryst. Solids 2019, 503–504, 352–365. [Google Scholar] [CrossRef]
- Flemming, R.L.; Terskikh, V.; Ye, E. Aluminum environments in synthetic Ca-Tschermak clinopyroxene (CaAlAlSiO6) from Rietveld refinement, 27Al NMR, and first-principles calculations. Am. Mineral. 2015, 100, 2219–2230. [Google Scholar] [CrossRef]
- Kohn, S.C.; Roome, B.M.; Smith, M.E.; Howes, A.P. Testing a potential mantle geohygrometer; the effect of dissolved water on the intracrystalline partitioning of Al in orthopyroxene. Earth Planet. Sci. Lett. 2005, 238, 342–350. [Google Scholar] [CrossRef]
- Begaudeau, K.; Morizet, Y.; Florian, P.; Paris, M.; Mercier, J.-C. Solid-state NMR analysis of Fe-bearing minerals: Implications and applications for Earth sciences. Eur. J. Mineral. 2012, 24, 535–550. [Google Scholar] [CrossRef]
- Palke, A.C.; Stebbins, J.F.; Frost, D.J.; McCammon, C.A. Incorporation of Fe and Al in MgSiO3 perovskite: An investigation by 27Al and 29Si NMR spectroscopy. Am. Mineral. 2012, 97, 1955–1964. [Google Scholar] [CrossRef]
- Pedone, A.; Gambuzzi, E.; Malavasi, G.; Menziani, M.C. First-principle simulation of the 27Al and 17O solid-state NMR spectra of the CaAl2Si3O19 glass. Theor. Chem. Acc. 2012, 131, 1147. [Google Scholar] [CrossRef]
- Massiot, D.; Bessada, C.; Coutures, J.P.; Taulelle, F.A. Quantitative Study of 27Al MAS NMR in Crystalline YAG. J. Magn. Reson. 1990, 90, 231–242. [Google Scholar] [CrossRef]
- Lee, S.K.; Stebbins, J.F. The distribution of sodium ions in aluminosilicate glasses: A high-field Na-23 MAS and 3Q MAS NMR study. Geochim. Cosmochim. Acta 2003, 67, 1699–1709. [Google Scholar] [CrossRef]
- Gambuzzi, E.; Charpentier, T.; Menziani, M.C.; Pedone, A. Computational interpretation of 23Na MQMAS NMR spectra: A comprehensive investigation of the Na environment in silicate glasses. Chem. Phys. Lett. 2014, 612, 56–61. [Google Scholar] [CrossRef]
- Maekawa, H.; Nakao, T.; Shimokawa, S. Coordination of sodium ions in NaAlO2–SiO2 melts at high temperature. Phys. Chem. Miner. 1997, 24, 53–65. [Google Scholar] [CrossRef]
- Fiske, P.S.; Nellis, W.J.; Xu Zhi Stebbins, J.F. Shocked quartz: A 29Si magic-angle-spinning nuclear magnetic resonance study. Am. Mineral. 1998, 83, 1285–1292. [Google Scholar] [CrossRef] [Green Version]
- Kirkpatrick, R.J.; Smith, K.A.; Schramm, S.; Turner, G.; Yang, W.-H. Solid-state nuclear magnetic resonance spectroscopy of minerals. Ann. Rev. Earth Planet. Sci. 1985, 13, 29–47. [Google Scholar] [CrossRef]
- Kirkpatrick, R.J.; Carpenter, M.A.; Yang, W.-H.; Montez, B. 29Si magic-angle NMR spectroscopy of low-temperature ordered plagioclase feldspar. Nature 1987, 325, 236–238. [Google Scholar] [CrossRef]
- Mysen, B.; Richet, P. Silicate Glasses and Melts, 2nd ed.; Elsevier Science: Amsterdam, The Netherlands, 2019; p. 118. [Google Scholar] [CrossRef]


| Component | KP15-12-115 | KP15-12-118 | ZH1 | ZH2 |
|---|---|---|---|---|
| SiO2 | 56.15 | 57.22 | 74.29 | 71.25 |
| TiO2 | 0.83 | 0.95 | 0.81 | 0.53 |
| Al2O3 | 14.47 | 15.94 | 9.89 | 10.30 |
| FeO | 5.50 | 6.48 | 5.66 | 3.58 |
| MnO | n.d. | n.d. | 0.01 | n.d. |
| NiO | n.d. | n.d. | 0.06 | n.d. |
| CaO | 2.99 | 3.26 | 2.39 | 1.96 |
| MgO | 4.39 | 5.45 | 2.91 | 0.87 |
| K2O | 1.93 | 1.86 | 2.16 | 2.85 |
| Na2O | 2.77 | 2.16 | 1.02 | 1.66 |
| Sum | 89.02 | 93.32 | 99.2 | 93.00 |
| Al/(Si + Al) 1 | 0.23 | 0.25 | 0.14 | 0.15 |
| Na/(Na + K) 1 | 0.69 | 0.64 | 0.47 | 0.47 |
| Fe/(Fe + Si + Al) 1 | 0.06 | 0.07 | 0.05 | 0.03 |
| Samples | Components | δiso, ppm | ΔCS, ppm | CQ, MHz | A, % |
|---|---|---|---|---|---|
| KP15-12-115 | Px, VIAl | 8.2 ± 0.4 | 8 ± 1 | 3.8 ± 0.2 | 9 ± 1 |
| Fs, IVAl | 58.8 ± 0.1 | 7 ± 1 | 2.7 ± 0.1 | 23 ± 4 | |
| Gl, IVAl | 62 ± 1 | 14 ± 1 | 5.4 ± 0.1 | 68 ± 4 | |
| KP15-12-118 | Px, VIAl | 7.6 ± 0.3 | 7.4 ± 0.7 | 3.7 ± 0.1 | 17 ± 1 |
| Fs, IVAl | 58.1 ± 0.2 | 6 ± 1 | 2.9 ± 0.2 | 19 ± 2 | |
| Gl, IVAl | 63 ± 1 | 18 ± 1 | 5.7 ± 0.2 | 64 ± 2 | |
| ZH1 | Gl, IVAl | 65 ± 4 | 33 ± 1 | 5.5 ± 0.1 | 100 |
| ZH2 | Gl, IVAl | 61.1 ± 0.3 | 23 ± 1 | 4.1 ± 0.1 | 100 |
| Sample | Component | δiso, ppm | ΔCS, ppm | CQ, MHz | A, % |
|---|---|---|---|---|---|
| KP15-12-115 | GIM | –9.0 ± 0.3 | 22 ± 1 | 1.9 ± 0.1 | 100 |
| KP15-12-118 | GIM | –6.2 ± 0.5 | 20 ± 2 | 2.1 ± 0.2 | 82 ± 3 |
| L | 3 ± 8 | 65 ± 20 | – | 18 ± 4 | |
| ZH1 | GIM | –6 ± 1 | 32 ± 1 | 2.5 ± 0.3 | 66 ± 5 |
| G | 5 ± 4 | 67 ± 7 | – | 34 ± 5 | |
| ZH2 | GIM | –10 ± 1 | 20 ± 1 | 2.4 ± 0.3 | 54 ± 5 |
| G | 0 ± 2 | 70 ± 10 | – | 46 ± 5 |
| Sample | δiso, ppm | ΔCS, ppm | G/L | A, % |
|---|---|---|---|---|
| KP15-12-115 | –99.1 ± 0.1 | 24.2 ± 0.3 | 1 | 80 |
| –84 ± 2 | 44 ± 2 | 1 | 20 | |
| KP15-12-118 | –101.2 ± 0.1 | 26.1 ± 0.2 | 1 | 100 |
| ZH1 | –99.3 ± 0.6 | 35 ± 3 | 0.1 | 100 |
| ZH2 | –105.0 ± 0.1 | 24.4 ± 0.4 | 0.6 | 100 |
Publisher’s Note: MDPI stays neutral with regard to jurisdictional claims in published maps and institutional affiliations. |
© 2021 by the authors. Licensee MDPI, Basel, Switzerland. This article is an open access article distributed under the terms and conditions of the Creative Commons Attribution (CC BY) license (https://creativecommons.org/licenses/by/4.0/).
Share and Cite
Lyutoev, V.; Shumilova, T.; Mazur, A.; Tolstoy, P. NMR Spectral Characteristics of Ultrahigh Pressure High Temperature Impact Glasses of the Giant Kara Crater (Pay-Khoy, Russia). Minerals 2021, 11, 1418. https://0-doi-org.brum.beds.ac.uk/10.3390/min11121418
Lyutoev V, Shumilova T, Mazur A, Tolstoy P. NMR Spectral Characteristics of Ultrahigh Pressure High Temperature Impact Glasses of the Giant Kara Crater (Pay-Khoy, Russia). Minerals. 2021; 11(12):1418. https://0-doi-org.brum.beds.ac.uk/10.3390/min11121418
Chicago/Turabian StyleLyutoev, Vladimir, Tatyana Shumilova, Anton Mazur, and Peter Tolstoy. 2021. "NMR Spectral Characteristics of Ultrahigh Pressure High Temperature Impact Glasses of the Giant Kara Crater (Pay-Khoy, Russia)" Minerals 11, no. 12: 1418. https://0-doi-org.brum.beds.ac.uk/10.3390/min11121418