Article

The Effect of Freeze-Thaw Cycling and the Initial Mass of Water on the Unfrozen Water Content of Calcium Bentonites Modified by Copper Ions

Department of Geotechnical and Water Engineering, Kielce University of Technology, 25-314 Kielce, Poland
*
Author to whom correspondence should be addressed.
Submission received: 4 October 2021 / Revised: 1 January 2022 / Accepted: 2 January 2022 / Published: 5 January 2022
(This article belongs to the Special Issue Application of Clays and Clay Minerals to Prevent Contamination)

Abstract

:
This research was conducted with the use of the DSC method; it involved the examination of the unfrozen water content in two model (source) calcium bentonites (≥75% smectite), after one to three freeze-thaw cycles in the natural state, as well as after the ion exchange for a potentially toxic element (Cu2+). The freeze-thaw cycles do not affect the unfrozen water content at a given negative temperature in a statistically significant manner. However, a statistically significant influence of temperature, the initial mass of the water, and the clay type on the change of the unfrozen water content was found. Moreover, the empirical models of predicting the unfrozen water in the bentonite after the exchange for Cu2+ ion were created, for which the parameter was the mass of the water and the mass of the dry soil, at the temperature of −2 °C.

1. Introduction

In the case of the clay-water system, part of the water remains in a liquid state below 0 °C. The fraction of the above-mentioned water is called the unfrozen water, while its amount below the freezing point gradually decreases as the temperature drops. Below a certain negative temperature (in the case of bentonites T ≈ −40 °C), the unfrozen water content no longer depends on the temperature and becomes a constant function. This part of the unfrozen water is called the non-freezing water [1]. The presence of some clay minerals, due to their large specific surface area available for water, is of fundamental importance in the occurrence of phase phenomena below 0 °C. The amount of the unfrozen water contained in frozen coarse-grained soils is negligible and that in the frozen bentonites is the largest [1]. The unfrozen water constitutes one of the most important factors, apart from the type of clay mineral that builds the soil skeleton, impacting the manner of the frosty transformations of the fine-grained soil structure as a result of the water migration to its surface [2]. Although the mechanism of the ice lens formation is known [3], learning about the factors impacting its progress creates difficulties in the studied cohesive soils. The frosty modifications of the structure results in changes in the fine-grained soil properties [4,5,6]. An additional factor impacting the transformation of the clay structure, and thus a change in their properties, is the influence of chemical substances [7], including ions [8,9]. Therefore, identification of the changes in the unfrozen water in the contaminated clays becomes a complex problem, which is relatively rarely discussed in global literature and has not been well understood. The authors put an emphasis on the issue that this knowledge is especially important in the case of bentonites, which are used as geological barriers in dangerous waste landfills and may be impacted by the potentially toxic metal ions [10]. Thus, knowledge of this water fraction may contribute to the undertaking of appropriate actions aimed at preventing the clay contamination, predicting its effects and possibly selecting a method for their neutralisation by modelling coupled with the thermal-hydraulic-mechanical chemical processes in the frozen clays [11]. E.g., artificial freezing constitutes one of the methods for the immobilisation of the soil pollution [12,13]. While treating cohesive soils contaminated with the metal ions as a construction substrate, learning about their behaviour under freeze-thaw conditions is very significant in the scope of broadly understood environmental engineering or construction, in order to prevent construction disasters [14,15].
The results of the research conducted so far demonstrated that the unfrozen water content depends on the temperature [16,17], soil type [17,18], specific surface area of the fine-grained soil [1], and granulometric composition [6,19,20]. The impact of these parameters on the curve shape of the unfrozen water as a function of the temperature seems to be well confirmed in the literature. The authors of many studies emphasised that these were probably not the only factors impacting the unfrozen water content, and that research in this scope should be continued. Other listed predisposed factors include the moisture content and the mass of the water contained in the fine-grained soil [16,21,22,23], as well as the freeze-thaw cycles (F-T) [11,16,24]. In general, the multiple freeze-thaw process should affect the redistribution of the water content after the freezing cycles, due to the induction of the increasingly higher ice pressure. Despite the research of many authors, the obtained results were not comparable with each other, and they related more to the observed relations than to the confirmed dependencies. While conducting research on the source clays in the conditions of the freeze-thaw cycles, Kozłowski and Nartowska [24] did not demonstrate a statistically significant relation between the water content in the clay and the number of freeze-thaw cycles in the clays characterised by a high degree of plasticity. However, the authors observed that the clays with the lowest and highest initial water contents had higher levels of unfrozen water content. The relation between the unfrozen water content and the soil moisture was described by Wei et al. [16] in the permafrost areas on the Qinghai-Tibet Plateau. According to the researchers, a soil moisture that decreased after the freeze-thaw cycle led to the formation of underground ice near the permafrost. Ren et al. [17] noted that in the permafrost areas, the temperature and the changes in the moisture content constituted an essential factor that modified the elastic modulus of the fine-grained soils. In the samples subjected to the wetting, the elastic moduli were low, while the impact of the F-T cycles was negligible. Ren and Vanapalli [11] confirmed the lack of a significant impact of the F-T cycles on the unfrozen water content in the fine-grained soils characterised by a low and medium plasticity, as well as the plastic consistency. Based on the cited literature, it can be assumed that the impact of the F-T cycles may be associated with the initial water content, and in the cohesive soils with contents higher than the hygroscopic moisture content, it was usually insignificant. Certain correlations of the moisture and initial water content with the unfrozen water content in a system subjected to freezing-thawing, regardless of the cycles, have been found in cohesive soils characterised by a low water content. Teng et al. [21] believe that the unfrozen water content curves as a function of temperature, determined with the use of the NMR method, differ significantly for different initial water contents in the silica sand, silt, and red clay. Lower initial water contents led to the fact that the unfrozen water content increased more slowly during the soil defrosting. Timofeev et al. [22] found a linear correlation in the clay soils with a moisture content of up to 10% between the total soil moisture and the unfrozen water content, which faded away as the temperature decreased, due to the generation of the increasing quantity of ice in the sample. The authors believe that this was caused by the changes in the porosity during the formation of the ice lenses, thus it directly impacted the change in the soil moisture.
The impact of the freeze-thaw cycles on the unfrozen water content as a function of the temperature is still not a well understood process. This is confirmed by other researchers [11]. The research is conducted with the use of various experimental conditions for different types of soil, and the unfrozen water content is determined by various research techniques. The unfrozen water content determined using the NMR method may differ from the unfrozen water content determined using the DSC method, particularly in the case of the clays contaminated with metal ions [19]. It seems that no study has been published that would determine the impact of the freeze-thaw cycles on the unfrozen water content in the bentonites, contaminated with the ions of potentially toxic metals, including copper ions. The supplementation of this knowledge is significant, e.g., for the optimisation of the contaminated clay purification processes. Currently it is only known that the purification efficiency of the sandy soils contaminated with copper ions increases along with a decrease in the freezing rate [12]. Moreover, this issue is relevant in the context of engineering projects, in connection with the results of the experimental studies published by Foose and Thomson [14], which indicated that the hydraulic conductivity of soil-bentonite mixtures may increase by several orders of magnitude, as a result of cyclic freezing-thawing in the presence of divalent cations. Furthermore, there are no unambiguously confirmed dependencies of the impact of the initial moisture content on the unfrozen water content in the literature. The authors did not find any study in which the dependencies would be evaluated in clays contaminated with copper ions.
This article presents research concerning the impact of the freeze-thaw cycles and the initial mass of water contained in the clay on the change of the unfrozen water content in the bentonites contaminated with copper ions, at temperatures to −26 °C. The research was conducted on the source smectite clays (≥75% smectite), which were subjected to the ion exchange. The DSC technique was used in order to evaluate the changes of liquid fraction in the groundwater system. With the use of statistical analysis, the correlations were observed and the empirical dependencies between the initial mass of water, the mass of the dry soil, and the fraction of unfrozen water at specific negative temperatures were presented.

2. Materials and Methods

2.1. Materials

Two source calcium bentonites from Texas (Stx-1b) and Slovakia (BSvk), as well as their copper forms ‘Cu’, were used to study the changes of the unfrozen water content as a result of cyclic freezing-thawing. Twenty samples of clay paste with various moisture contents were prepared, and each of them was subjected to three freeze-thaw cycles. The detailed characteristics are demonstrated in Table 1.

2.2. Methods

2.2.1. Chemical Preparatory Procedures of the Samples

The copper forms of the bentonites were obtained by the implementation of a three-time saturation of the fractions <0.063 µm with 1M copper (II) chloride solution at intervals of 48 h. After this time, the solution was subjected to a decantation process, while the remaining clay was placed in chlorine-permeable membranes. The rinsing of the samples from the excess chlorine was implemented in a container with a forced circulation of distilled water. During the 40-day process, the water was replaced many times, until the fading away of the reaction to the chloride ion (with AgNO3). Subsequently, the clay pastes were moved to glass cylinders and air dried in order to remove excess water. A detailed methodology can be found in the study of Nartowska et al. [19].
The content of the elements in the dry matter of the clay matrix was determined by the ICP-OES technique (inductively coupled plasma optical emission spectroscopy) with the use of the Perkin Elmer Optima 800 device. Before the determination, the clay samples with a mass of 2 g were dried for 24 h at 110 °C, and subsequently subjected to mineralisation using the wet method with aqua regia, in accordance with PN-ISO 11466. The content of the elements in the clay is demonstrated in Table 2.
Semi-quantitative chemical analysis of the elements for the ‘Cu’ samples were conducted based on the area scan using an energy dispersive X-ray spectrometer (EDS). The experiments were conducted with a Quanta 250 FEG scanning electron microscope (FEI Company, Hillsboro, OR, USA) at 20 kV voltage applied. The surfaces of the air-dried samples were covered with a 40 nm layer of gold to prevent electrisation and photographed at magnifications ×2000. The SEM-EDXS results can be used as a guideline for major element composition determinations (Figure 1). Figure 1 showed that the samples were contented of Si, O, Al, Cu, Fe, Mg, and Ca. The determination suggested a mainly Cu-type smectite.

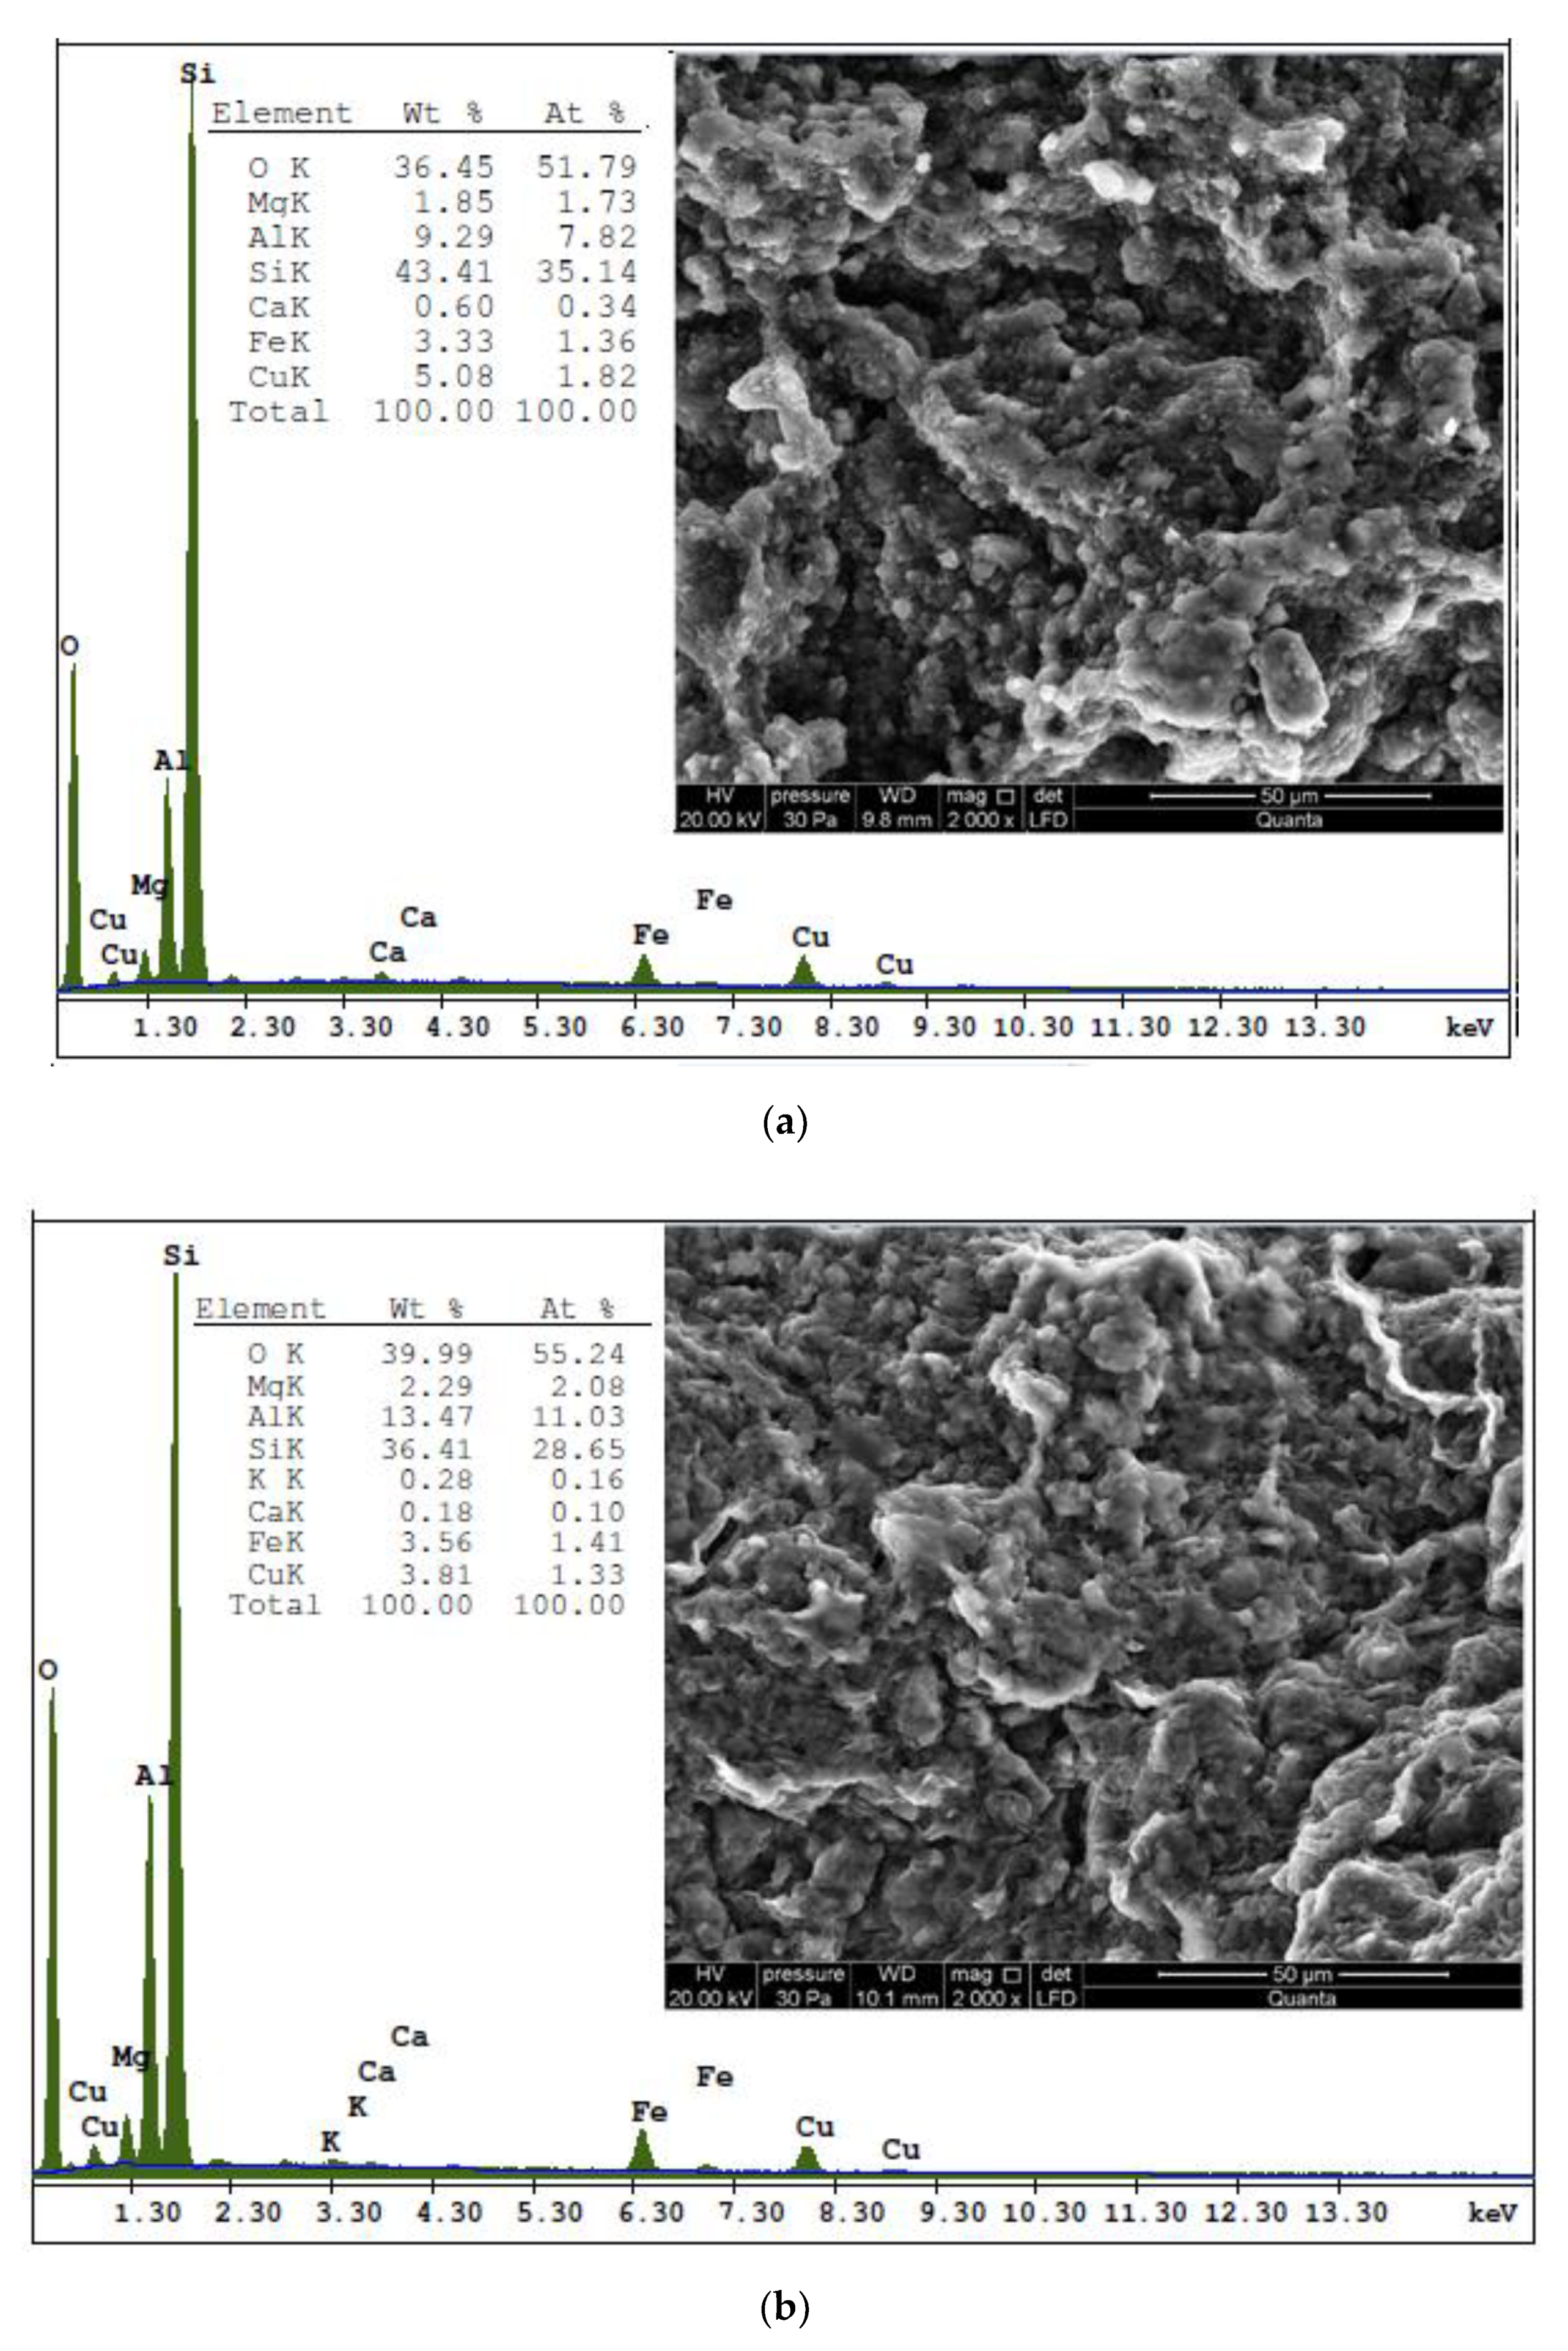
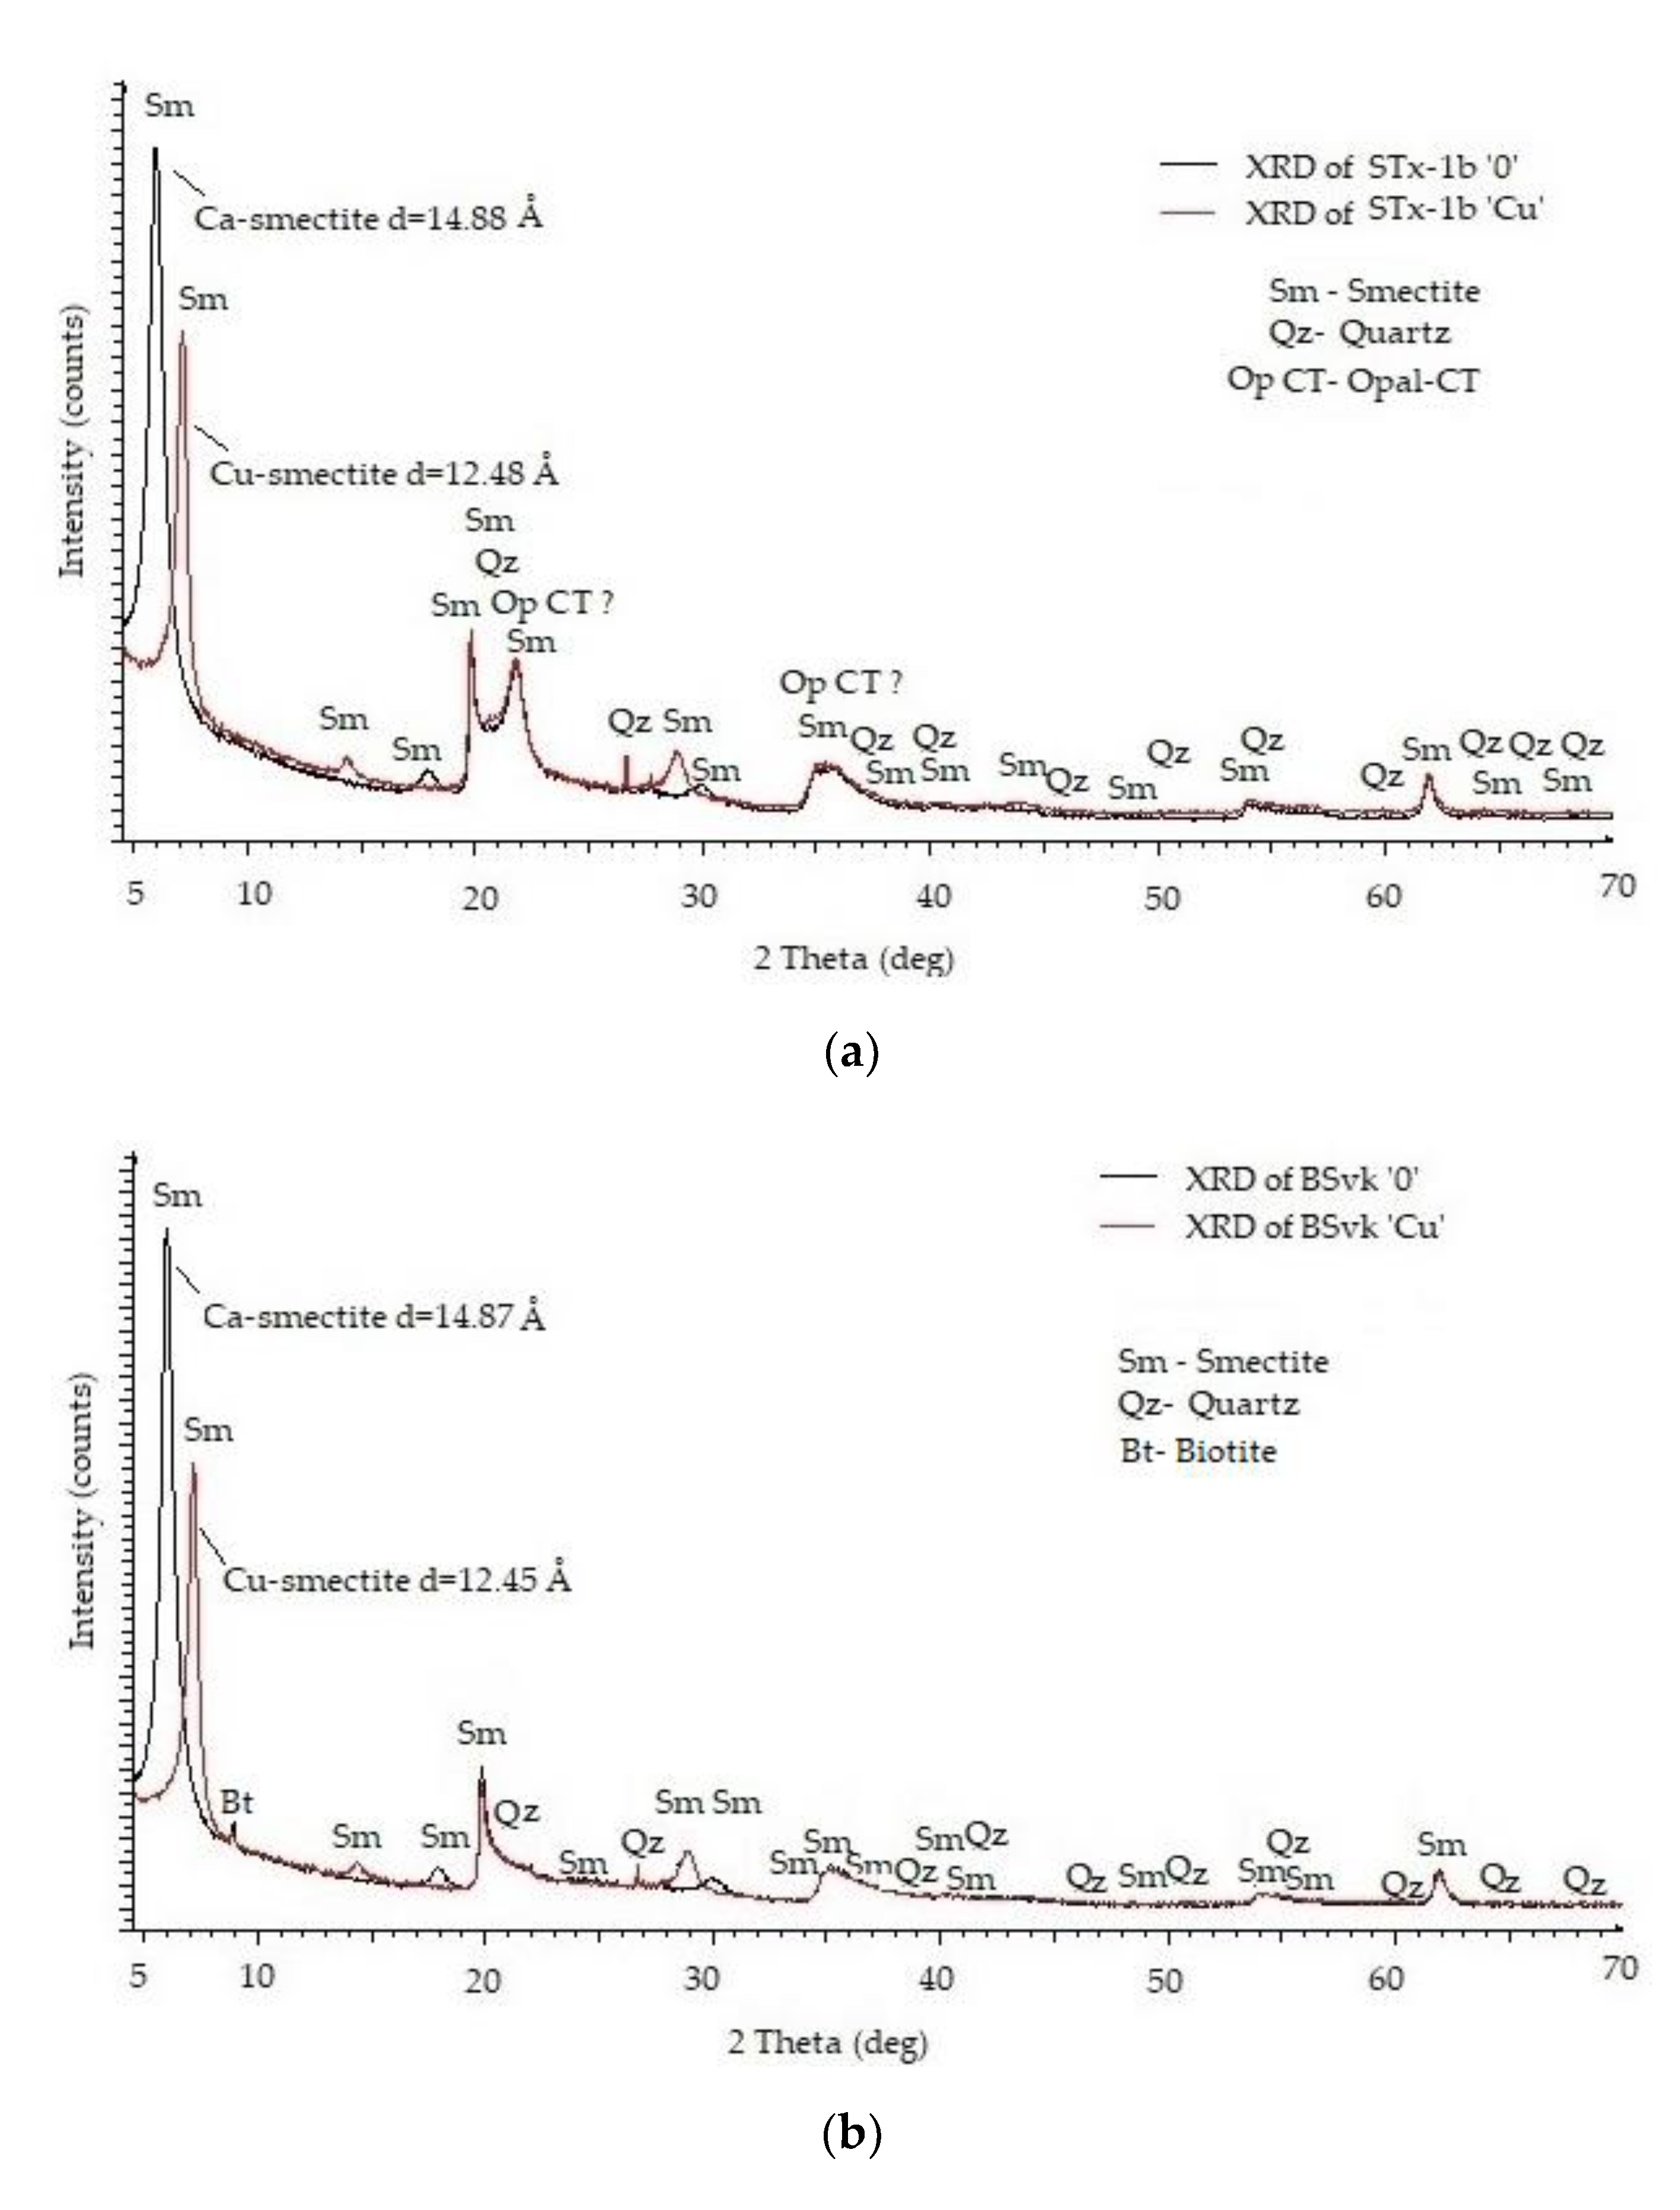
2.2.2. Determination of the Mineral Composition and Physicochemical Properties

Table 2 contains a summary of the clay properties, e.g., the mineral composition, the granulometric composition, and the specific surface area. Each of these parameters may have a significant impact on the changes of the unfrozen water content at a given negative temperature, as well as may constitute a predictor for the estimation of this water fraction for engineering purposes [1,19,24].
The mineral composition was determined using the XRD method. The phases were identified using a semi-quantitative method in the Diffrac.Eva V6 software (Bruker, Berlin, Germany) and the powder diffraction file (PDF+4) database. The research involved the use of Bruker D8 advance powder diffractometer (Bruker, Berlin, Germany) in Debye-Sherrer geometry, Cu–Kα1 radiation (λ = 1.5406 Å) from a Johansson-type monochromator (Bruker, Berlin, Germany) and a LynxEye position-sensitive detector (Bruker, Berlin, Germany). The measurements were carried out at 2θ from 4.51° to 70°. The applied voltage was 3.540 kV with a 530 mA current. The XRD patterns of the untreated samples and the Cu-saturated fractions are presented in Figure 2. The reflections of the powder can be ascribed to the presence of a smectite mineral phase, opal-CT, biotite, and quartz depending on the type of bentonite.
The granulometric composition was determined by the laser diffraction method with the use of a HELOS/BF SUCELL device manufactured by Sympatec GmbH (Clausthal-Zellerfeld, Germany), in order to examine the particle size in the clay suspension. Prior to commencement of the determinations, the air-dry samples with a mass of approximately 3 g were dissolved in 50 mL of distilled water, then 2 mL of the dispersant (NaP2O3·6H2O + Na2CO3) were added and mixed for 5 min.
The specific surface area was determined by the method using the water vapour sorption (WTC) in compliance with Equation (1) according to Stępkowska [27]. The sorption moisture w50 was determined at the relative water vapour pressure p/p0 = 0.50 in the desiccator over a saturated solution of magnesium nitrate (V); (sorption lasts 10 days).
S = 6 w 50 5.85
where w50 is the sorption moisture at a vapour pressure p:p0 = 0.5 determined by drying at 220 °C; S (m2/g).

2.2.3. The DSC Method and Calculating the Unfrozen Water Content

The calorimetric technique with the use of the calibrated DSC Q200 device manufactured by TA was chosen for the examination of the changes in the unfrozen water content at a given negative temperature. Previous research of the authors [19] demonstrated that in the case of the 1HNMR technique, it was very likely that the water molecules participating in the process of the cation hydration were no longer partially “visible” for the magnetic resonance, thus preventing the correct evaluation of the changes in the unfrozen water content. The first indications of the possible existence of this phenomenon (the so-called chemical shift), in the concentrated solvents, originated from Sare et al. [28]. Subsequently, it was confirmed in the clays [29]. According to the researchers, the intensity of this phenomenon grows along with the increase in the clay moisture. The authors believed that in such a case, the soil was dominated by the water-water interactions, which were responsible for the creation of the loosely bound water on the clay surface. In the scope of the calorimetric method, the water hydrating cations will be classified as non-freezing water [19].
Samples of the clay paste weighing 5–13 mg were placed in an aluminium calorimetric vessel with a diameter of 6 mm. In order to facilitate the heat transfer, the samples were given a uniform form of a flat layer covering the bottom of the vessel. The above-mentioned sample preparation allowed for the free volume changes, due to the multiple F-T. After airtight closing, the vessel with the sample was weighed with an accuracy of 10−6 g and stored in special containers. Directly prior to the examination, the vessel with the sample was weighed again in order to check the airtightness of the closure. Subsequently, the vessel with the sample was placed in the appropriate well of the calorimeter. The calorimeter chamber was closed, and the previously prepared research program was commenced. It consisted of three freeze-thaw cycles for each sample. The number of cycles was chosen in order to minimise the time-consuming calculations, while at the same time capturing the most significant changes. The latest literature reports [11,17] indicated that three F-T cycles were sufficient to evaluate whether there was an influence of the F-T process on the changes in the unfrozen water content. Freezing was implemented at a rate of −2.5 °C/min to a temperature of −90 °C. After 5 min of temperature stabilisation at a level of −90 °C, the heating was conducted at a rate of 5 °C/min to the temperature of 20 °C/min. After 30 min of stabilisation, this cycle was repeated two times. The scanning speed in the cooling mode was adapted to the performance of the RSC90 compressor cooling system for the temperature −90 °C. The heating rate was chosen optimally in order to shorten the duration of a single experiment, while maintaining the appropriate sensitivity and resolution of the equipment. The F-T rates, which were adopted by way of compromise, allowed to maintain a linear change of the block temperature over the entire range of the examined temperatures. The adoption of the freezing temperature at the level of −90 °C allowed to capture the phase changes at the temperatures close to −40 °C. If, for example, heating was commenced at −50 °C, then the time for establishing a stable baseline could be too short. Moreover, the authors wanted to maintain the same experimental conditions as in the previous studies on model clays [24], in order to validate the results of the studies on clays contaminated with copper ions. After the experiments, the samples were removed from the calorimeter and weighed again with an accuracy of 0.01 mg, in order to check the airtightness of the closure. Subsequently, the calorimetric vessel was pierced and dried at 110 °C for 24 h, in order to determine the moisture content. A summary of the moisture contents and weights of the samples is presented in Table 1.
The analysis of the phase composition was conducted based on the data obtained in the heating mode, due to the phenomenon of supercooling, which in small samples assumes big values [30]. Interpretation correctness of the results from the freezing curves is confirmed by Teng et al. [21]. Single heating thermograms were obtained with the use of Universal Analysis 2000 software. Subsequently, the calculations of the unfrozen water were carried out in accordance with the proven methodology, as demonstrated in the study by Kozłowski and Nartowska [24]. In order to extract the actual endothermic effects associated with melting, the stochastic deconvolution was used, in accordance with the Kozłowski’s assumptions [31,32]. The unfrozen water content, depending on the temperature wu(T), was calculated from the Equation (2):
w u T i = w j = i n 100 · q T j · 1 L T j · m s
where wu(Ti) is the unfrozen water content at temperature Ti as a percentage of the dry mass, w is the water content expressed as a percentage of the dry mass, q(Ti)·1 = ∆hj, ∆hj—change in the entalphy within 1 K, ms is the mass of the dry soil in the sample (g), and L(Tj) is the latent heat of fusion of the ice at temperature Tj calculated according to the empirical equation given by Horiguchi (1985) Equation (3):
L T = 7.3 · T + 334
where L(T) is the latent heat of fusion of the ice at temperature T (J/g) and T is temperature (°C).

3. Results and Analysis

Figure 3 demonstrates the changes of the unfrozen water content in the individual melting cycles 1–3 for the selected samples of the Stx-1b and BSvk bentonites, before and after the ion exchange with the Cu2+ ions (marked as ‘Cu’).
The mean unfrozen water contents, obtained from the examination of the five samples at specific negative temperatures for a given F-T cycle and a given clay, while considering the standard deviation, are presented below (Table 3).
Based on Figure 3 and Table 3, it can be observed that the unfrozen water content in the clays contaminated with copper ions was lower than in the clays before the exchange. The same tendency was observed by the authors during the examination of the bentonite contaminated with copper ions using the 1H NMR method [19]. This may be the effect of a decrease in the specific surface area that occurred in the clays as a result of the introduction of copper ions into their structure (Table 2). The specific surface area constituted one of the significant parameters impacting the unfrozen water content [1]. At first glance, the F-T cycles did not seem to influence the change of the unfrozen water content in the clays contaminated with Cu ions (Table 3).
The obtained results were subjected to statistical analysis with the use of the Statistica 13 software. The unfrozen water content was analysed at selected temperatures: −2 °C, −4 °C, −6 °C, −8 °C, −10 °C, −12 °C, −14 °C, −20 °C, and −26 °C in three thawing cycles. In total, 270 determinations of the unfrozen water content were obtained for the ‘Cu’ bentonites and the same number for the natural ones. It was assumed that the temperature amounting to −26 °C refers to the state, in which only the non-freezing water was present in all ‘Cu’ bentonite samples, immediately prior to the commencement of the melting process in the heating mode. This resulted from the observation of the thawing peaks. The remaining temperatures were selected in order to ensure that the difference in the unfrozen water content between the individual temperatures was as small as possible (on average approximately 2–3%). This enabled a very accurate analysis of the course of the curve representing the changes in the unfrozen water content, as a function of the temperature in the statistical software.

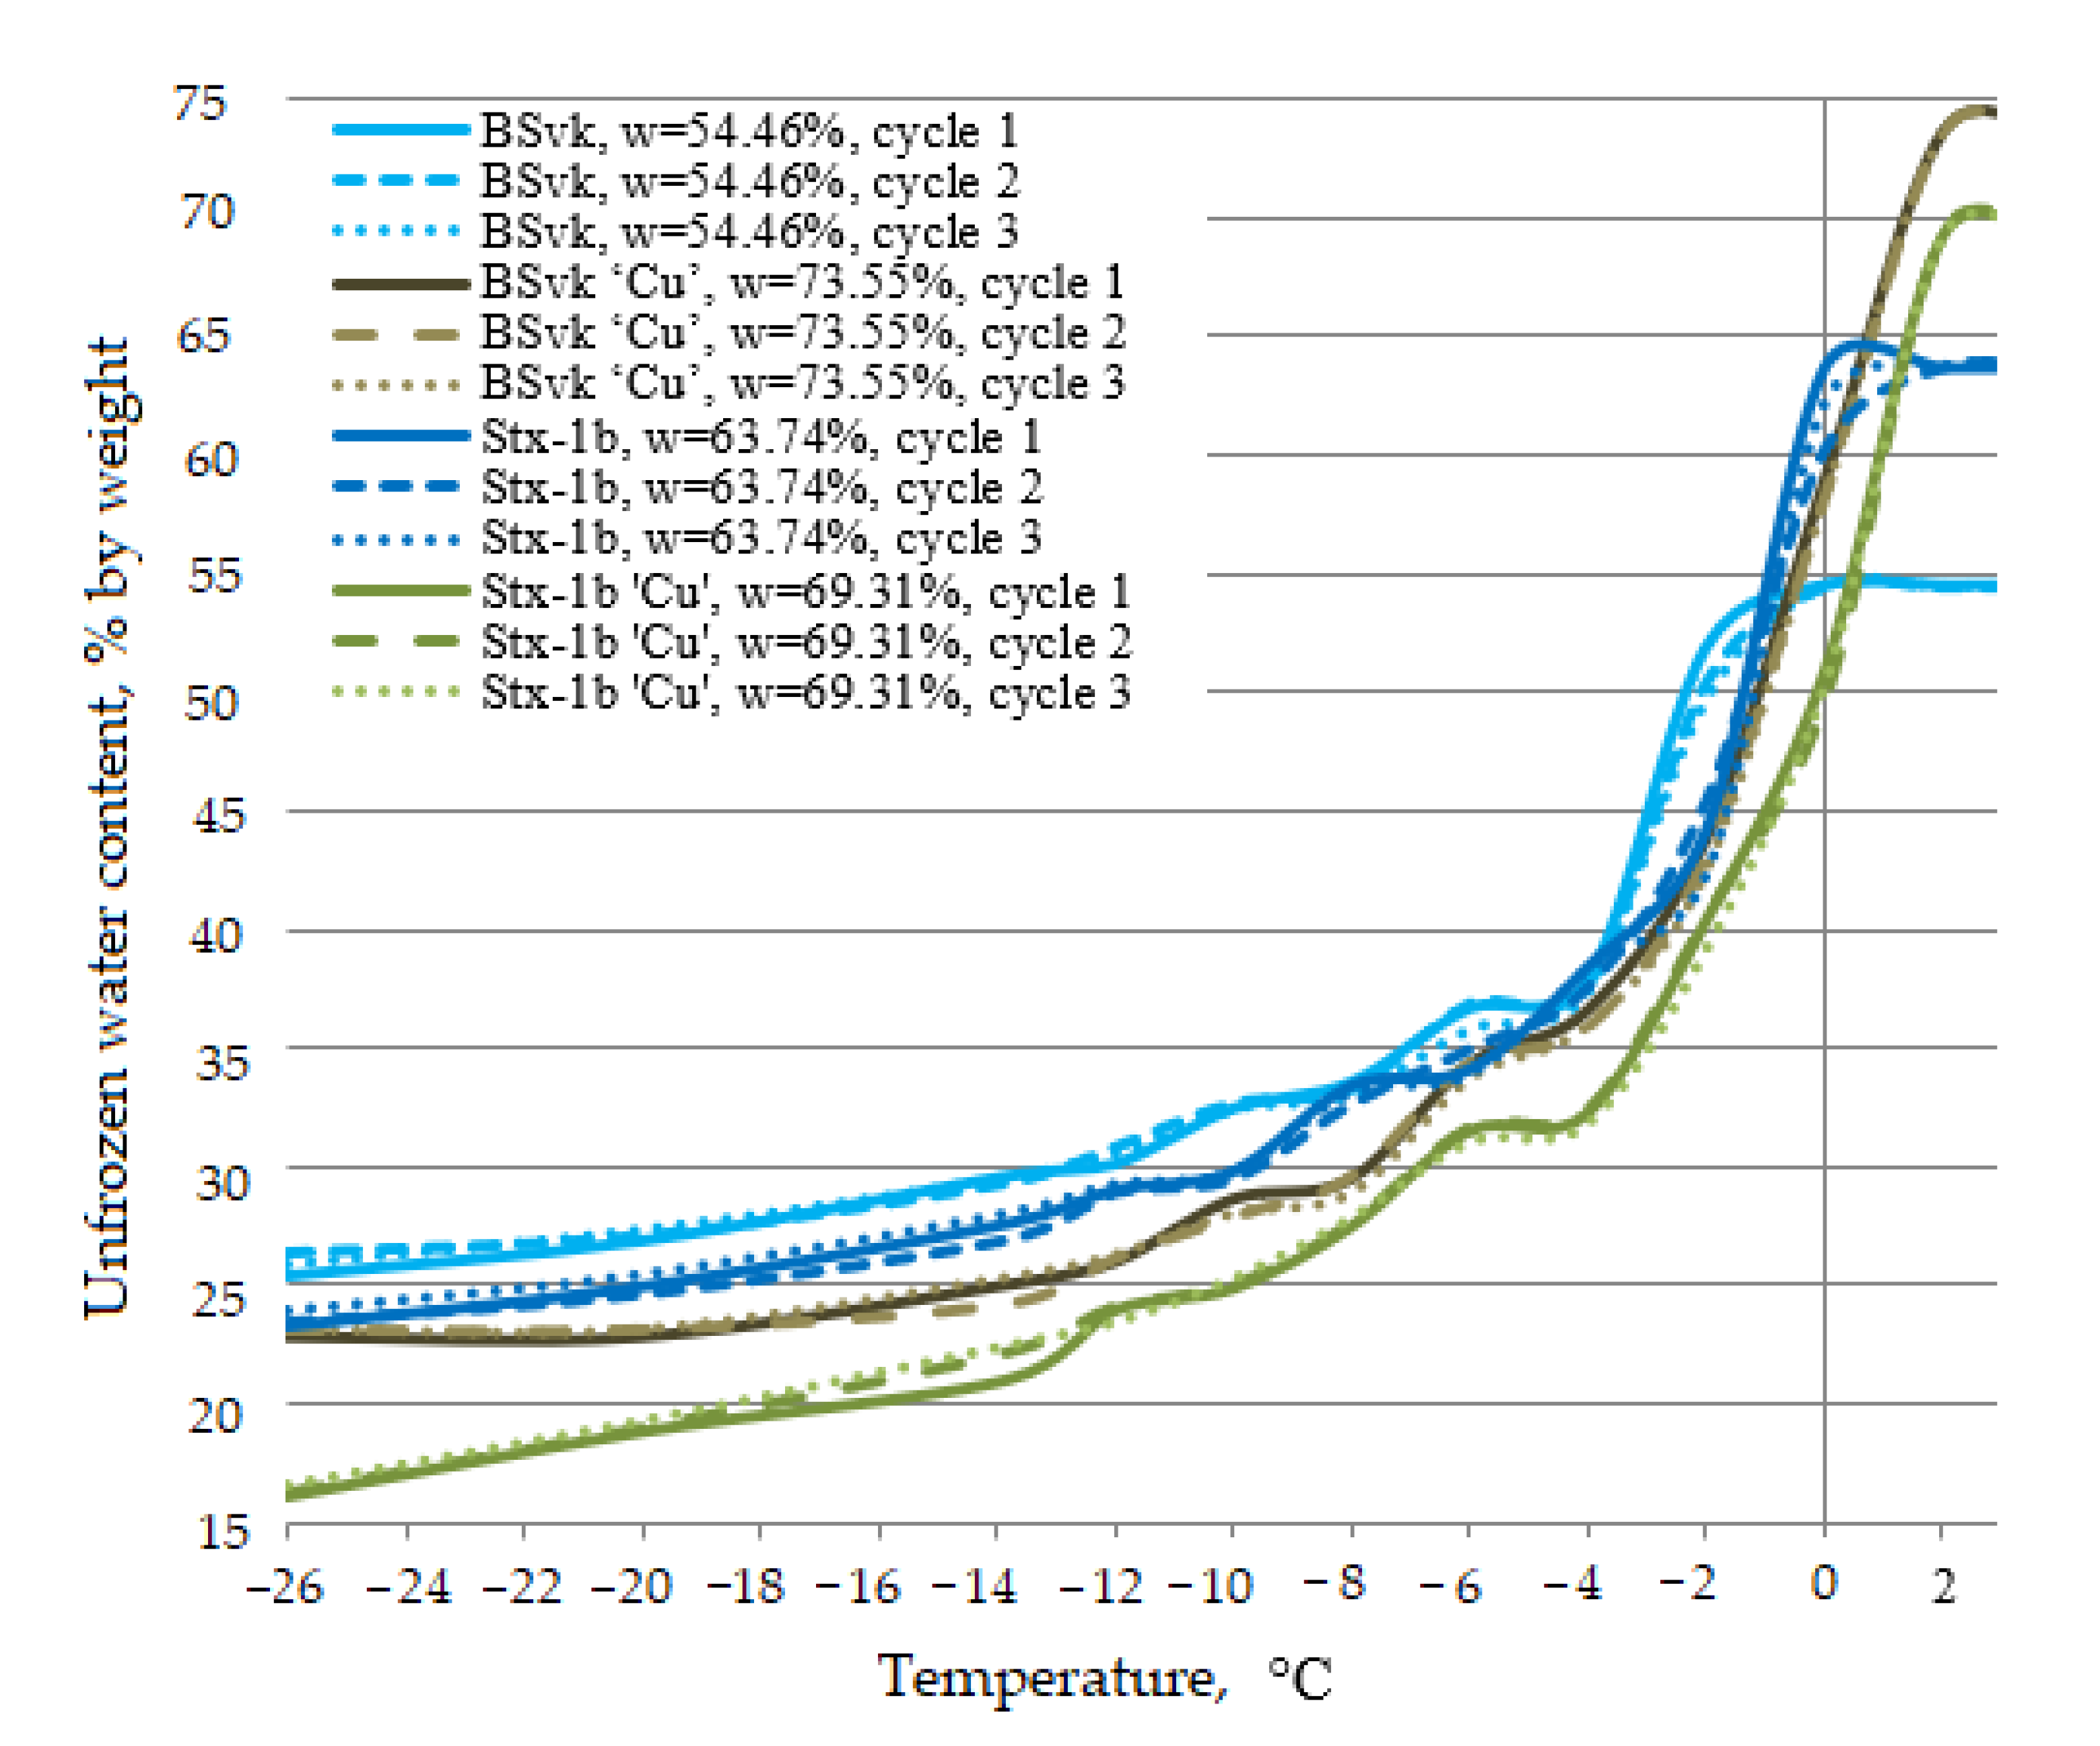
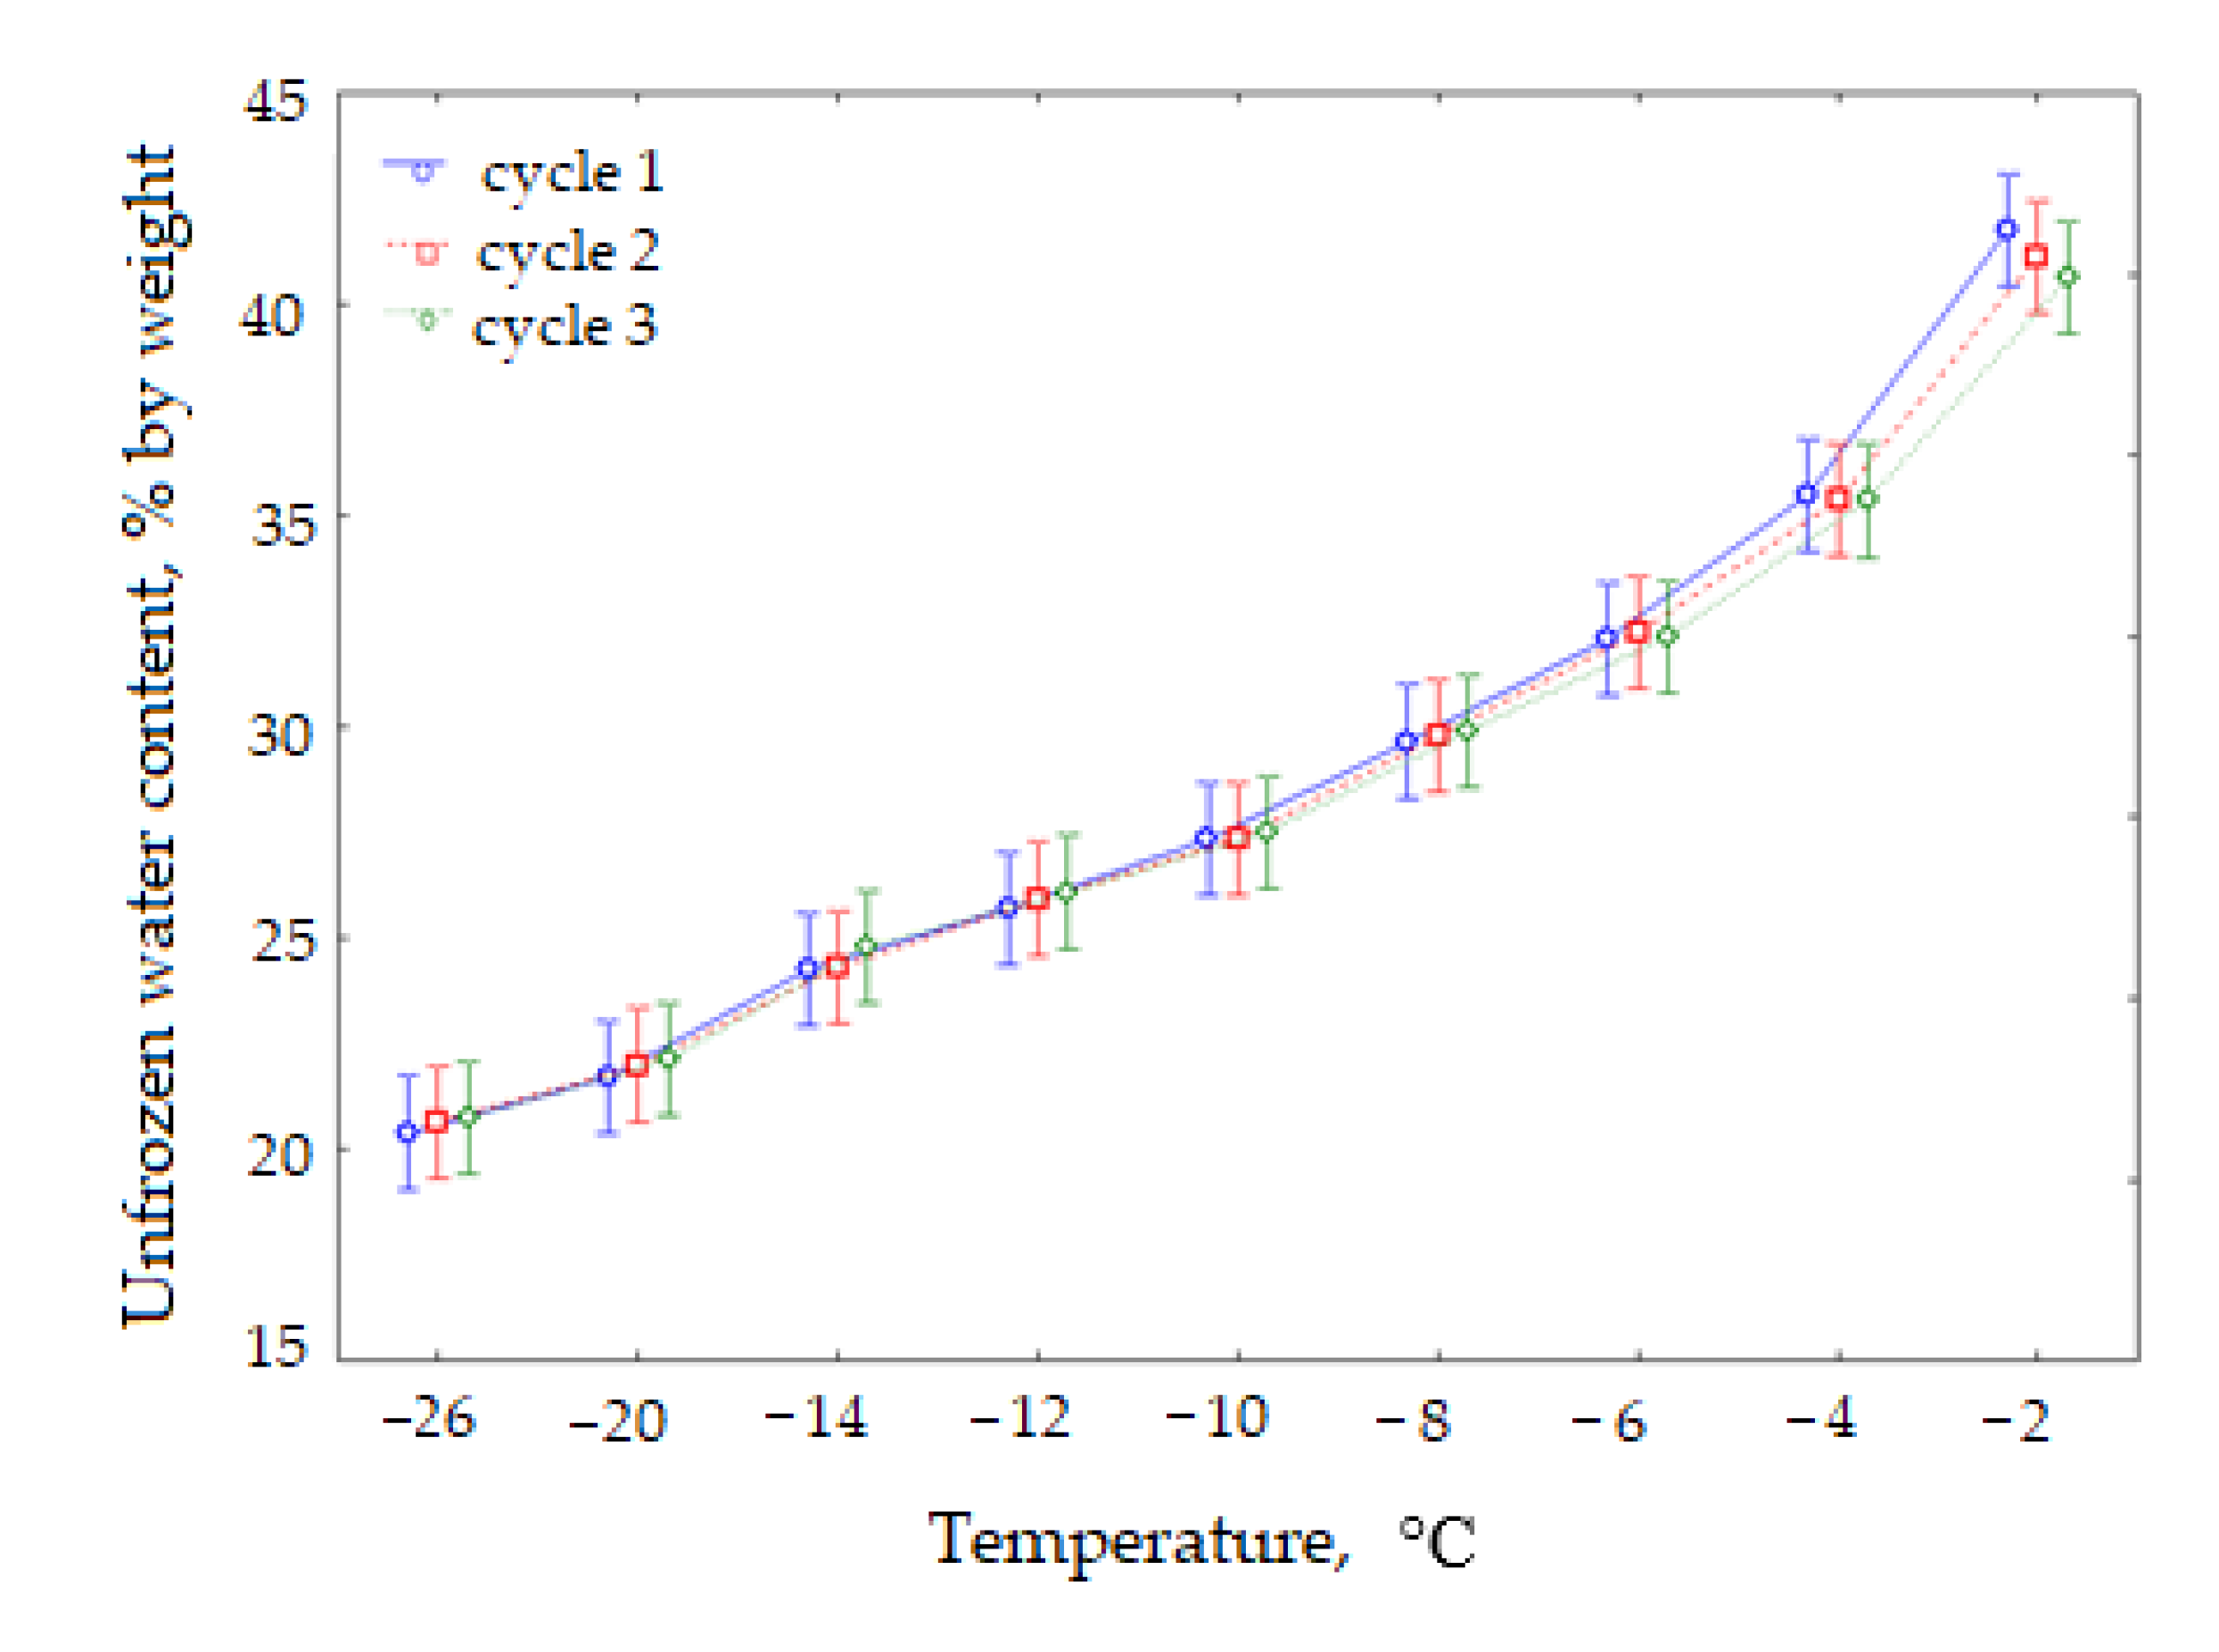
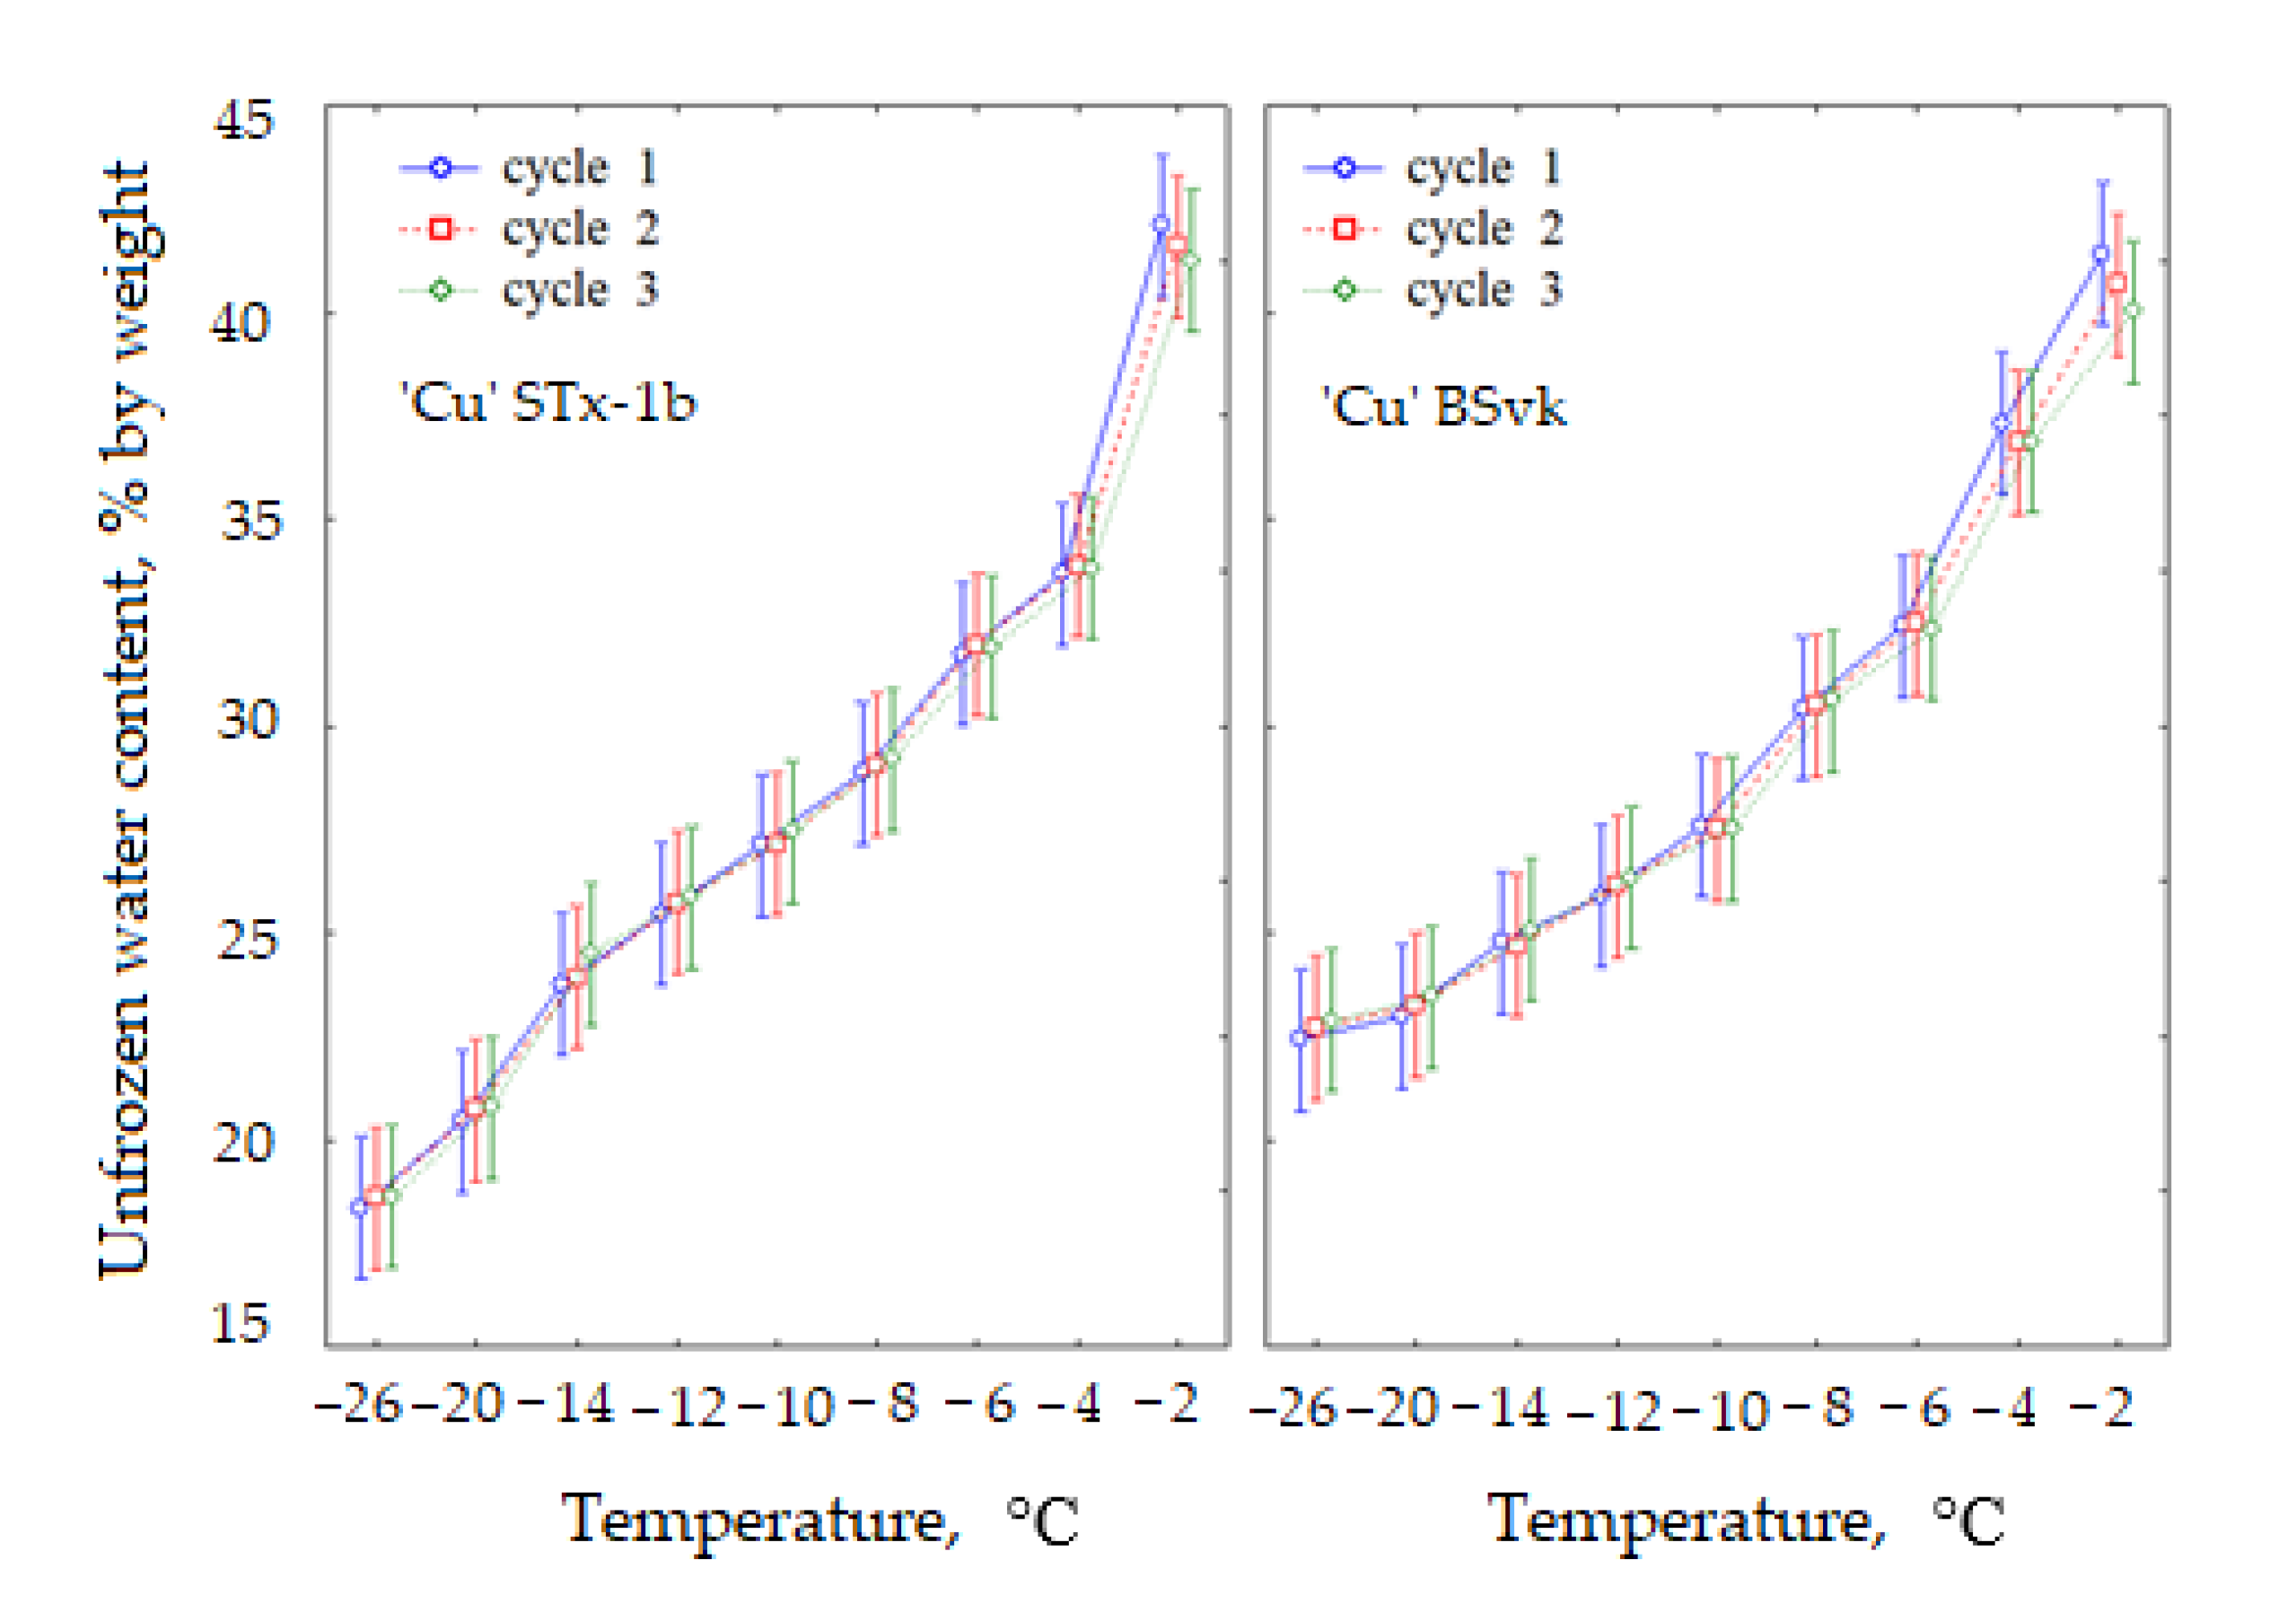
3.1. The Effect of the Freeze-Thaw Cycles

Figure 4 demonstrates the mean unfrozen water contents in the bentonites contaminated with copper ions at a given negative temperature, depending on the freeze-thaw cycle, regardless of the clay type. The analysis of Figure 4 confirms our assumptions regarding the insufficiently significant impact of the F-T cycles on the unfrozen water content. In order to increase the reliability of the results, the ANOVA (Analysis of Variance) was conducted, which demonstrated that in the case of the clays contaminated with copper ions, the F-T cycles did not affect the unfrozen water content in a statistically significant manner (Table 4). Although there were no studies on this type of clay in the literature, the impact of the F-T process was examined. The results of the authors [24] on the model clays confirmed the lack of the F-T impact on the unfrozen water content. While examining the clays with a low and medium plasticity, Ren et al. [17] and Ren and Vanapalli [11] obtained similar conclusions.
A significant impact on the unfrozen water content was exhibited by the temperature and clay type (Table 4) and (Figure 5). These results were consistent with those previously obtained by the authors for the model clays [24], and they were confirmed by other researchers [16,17,18].
Despite the lack of significance of the impact of the F-T cycles on the unfrozen water content, some dependencies were observed in each type of clay (Figure 5). At lower temperatures (−12 °C to −26 °C), the unfrozen water content slightly increased along with the increase of cycles 1–3. At these temperatures, a large part of the water is water adsorbed on the flat surface of the clay minerals. Perhaps, the subsequent F-T cycles had an impact on this slight increase due to the induction of the increasingly higher ice pressure in the sample. In the case of temperatures close to 0 °C (at −2 °C), the tendency was reversed, and the unfrozen water content decreased along with the increase of cycles 1–3. Perhaps, this resulted from the redistribution of the pores during the F-T cycles, which dominated at this temperature over the specific surface area [23].

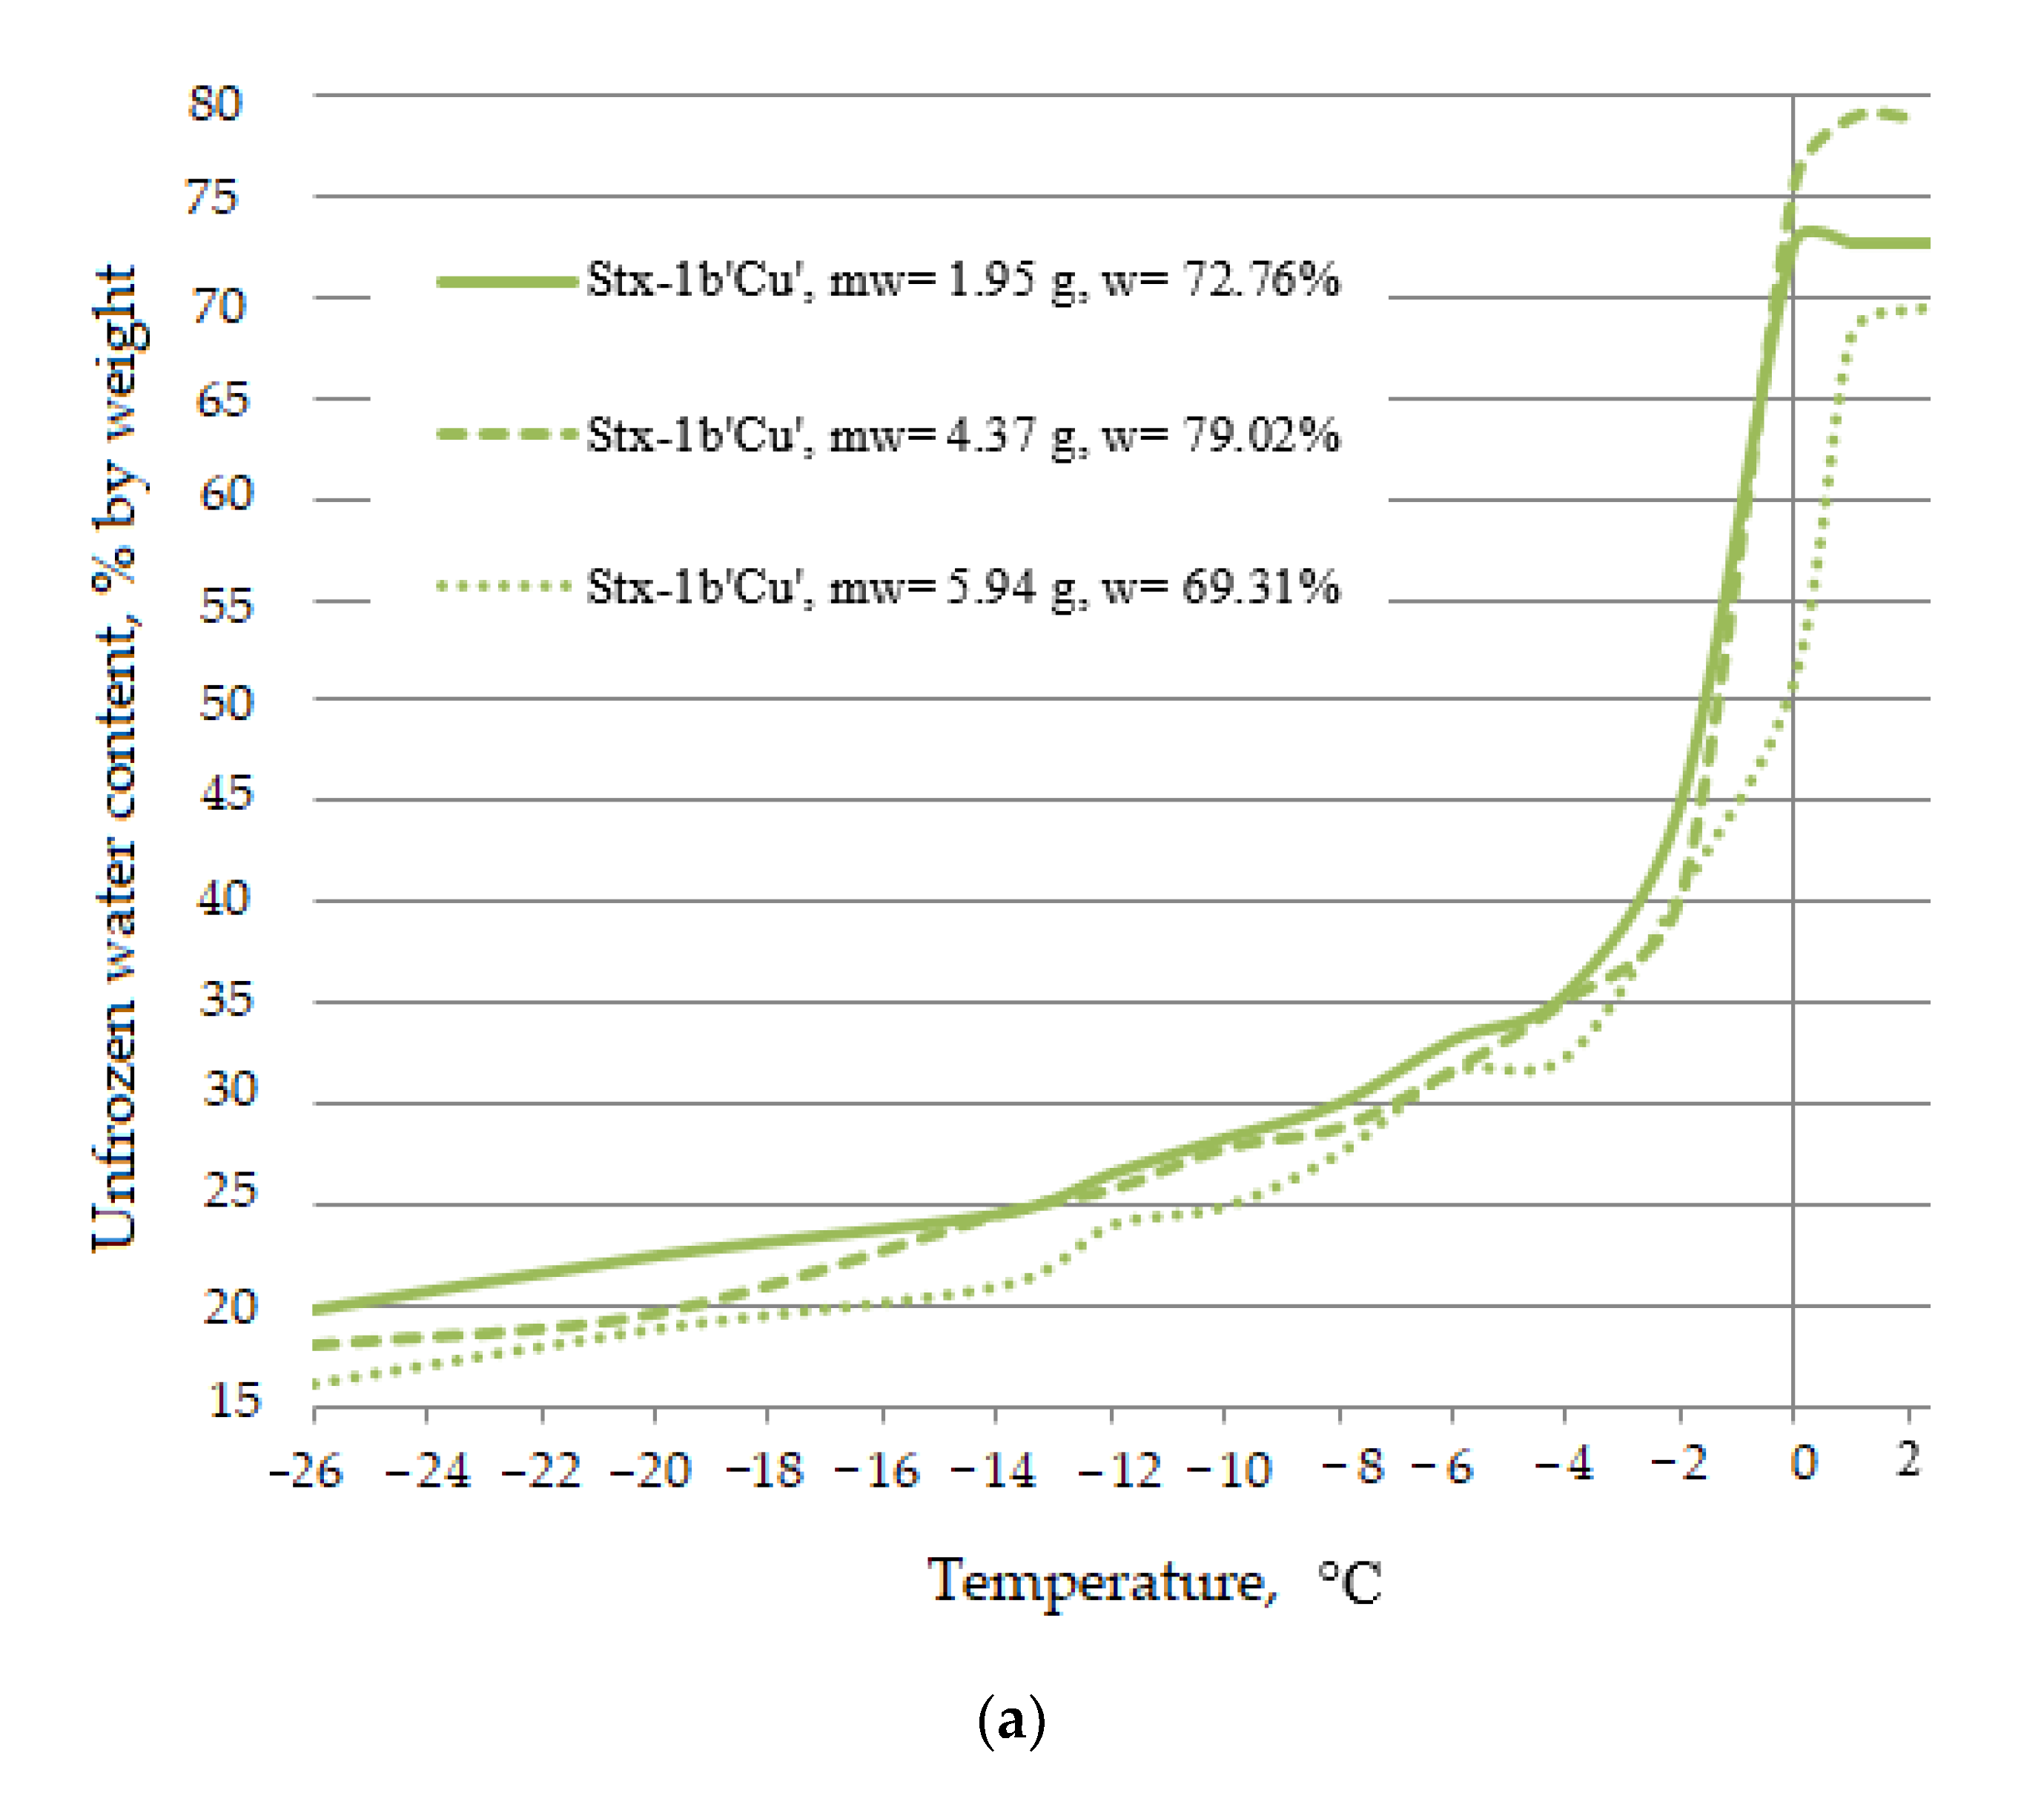
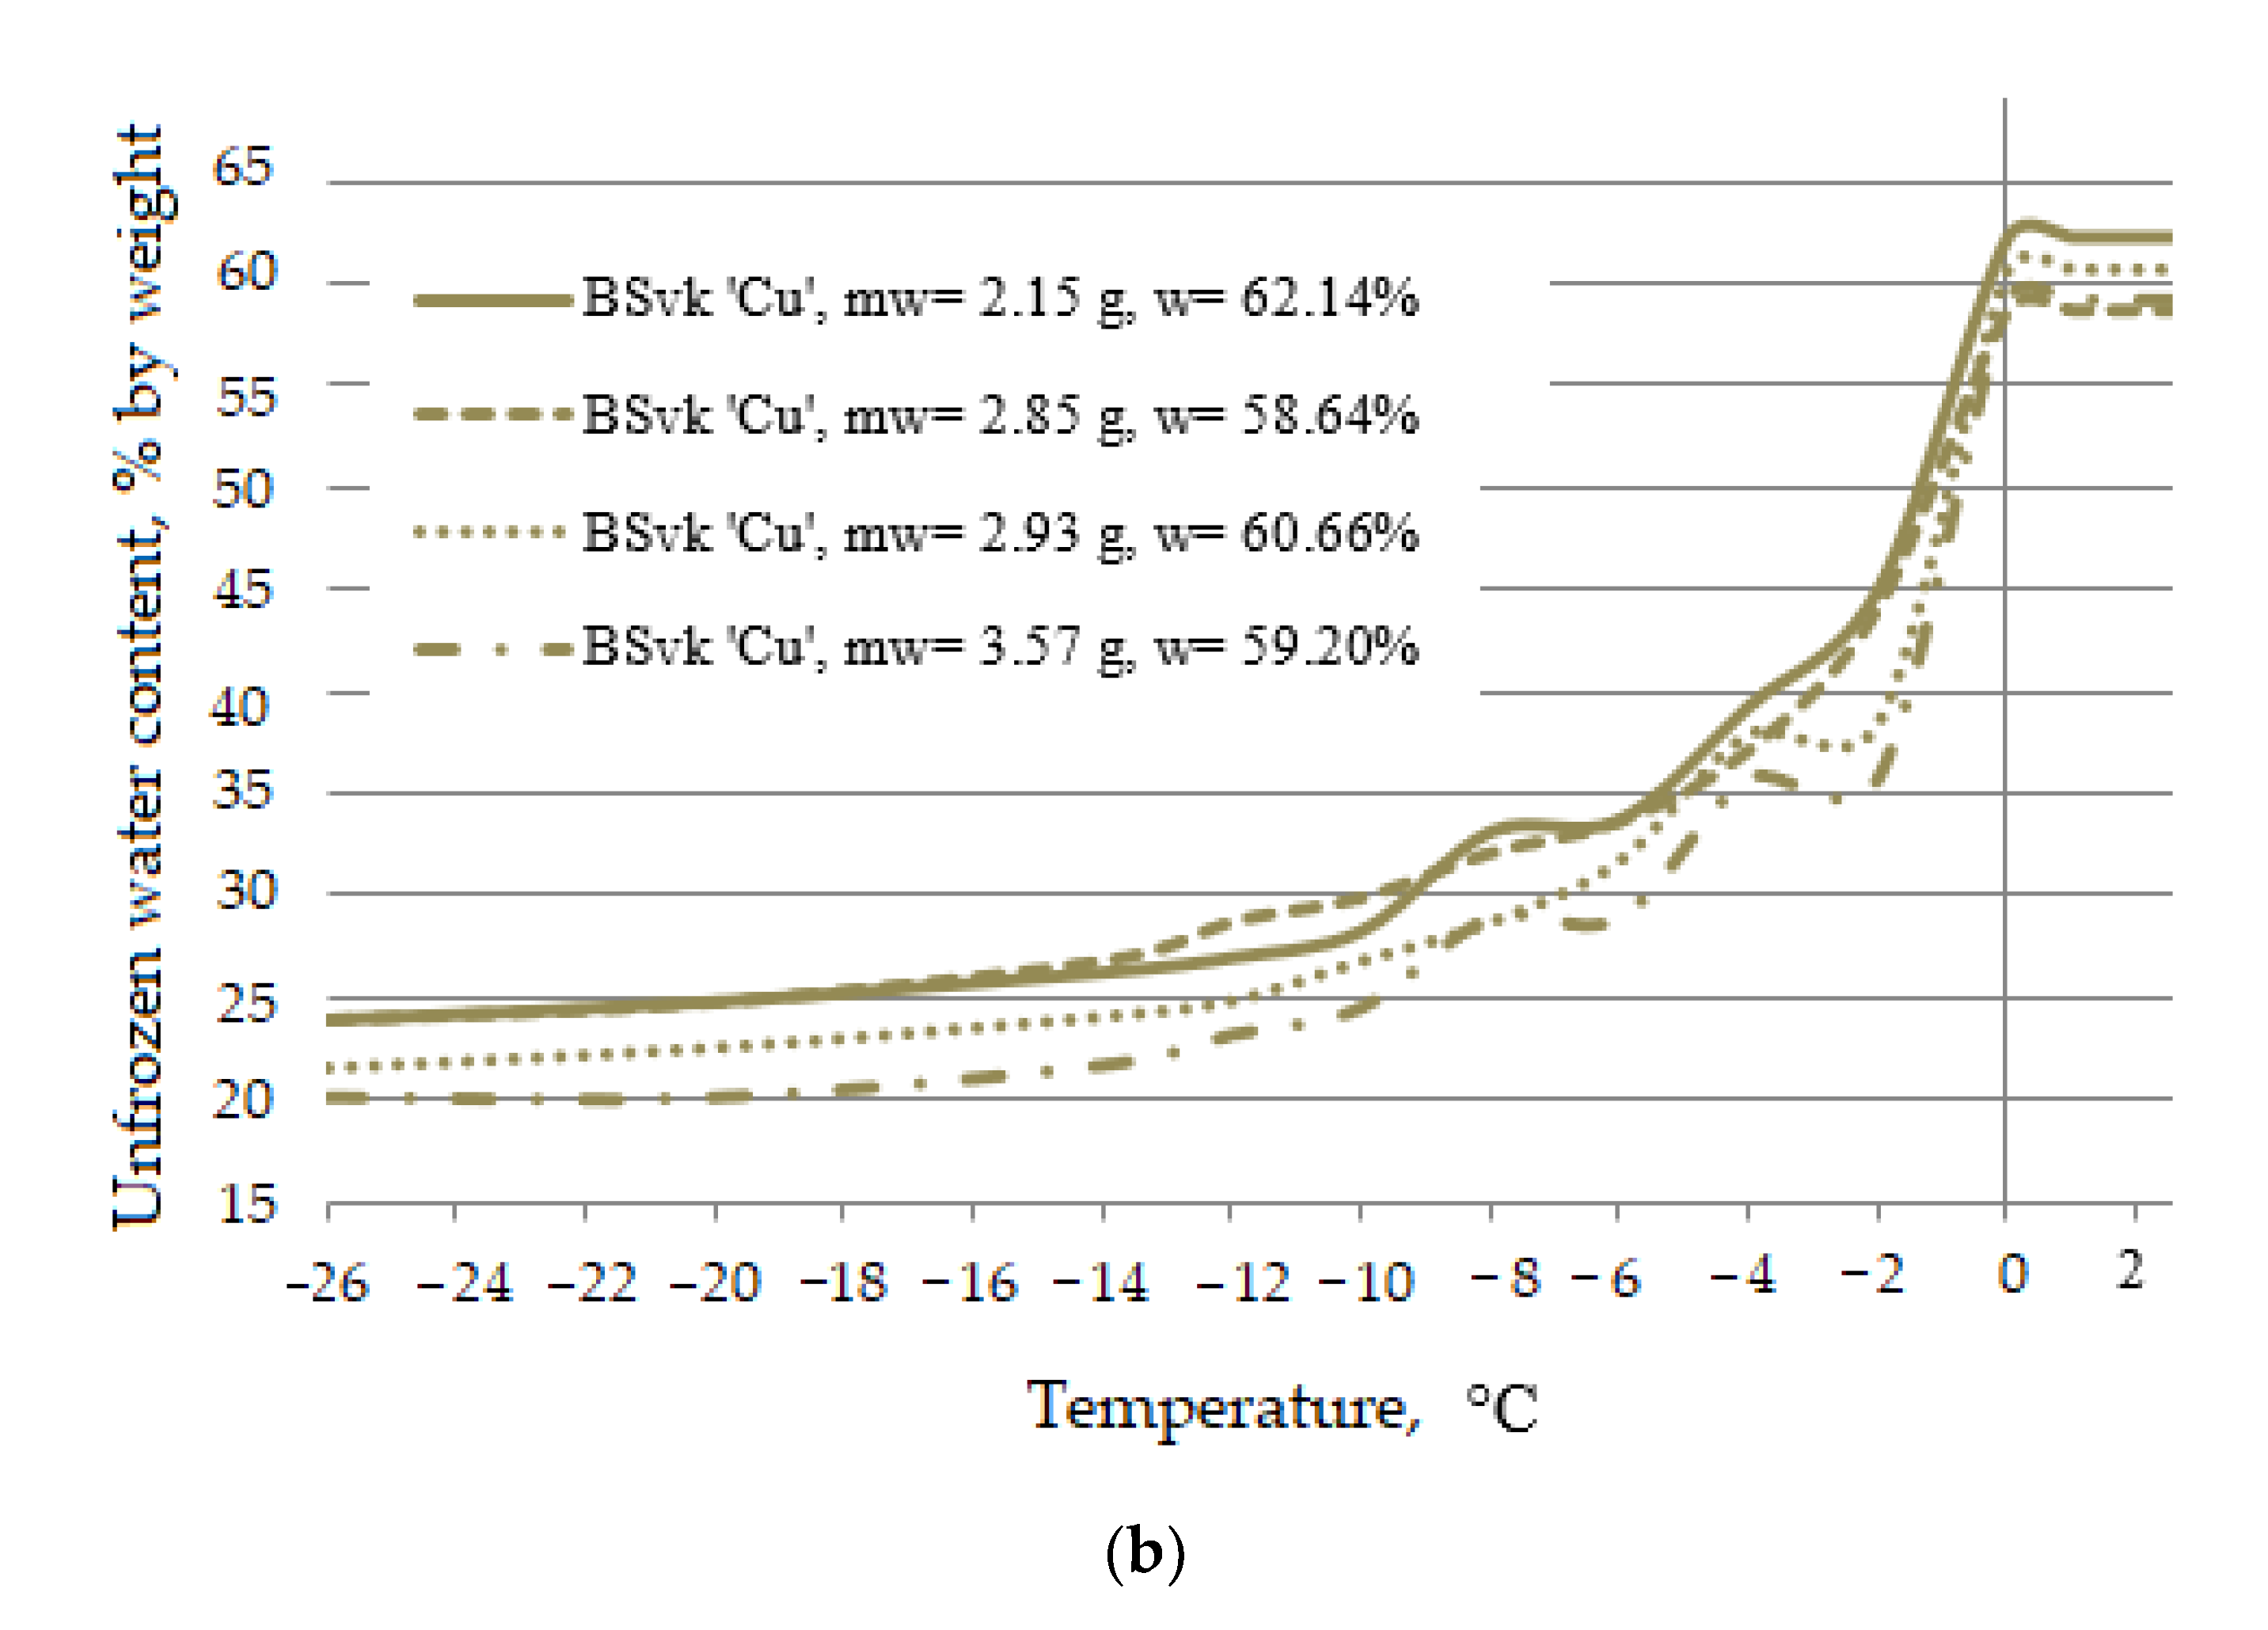
3.2. The Effect of the Initial Mass of Water

The authors observed that in each type of copper bentonite characterised by a similar moisture content, the unfrozen water content at a given negative temperature depended on the initial mass of the water in the clay sample (Figure 6). In order to confirm these observations in a statistically significant manner, a multidimensional regression analysis was conducted (Table 5), which demonstrated that in each type of ‘Cu’ clay at individual negative temperatures, the dependence of the unfrozen water content on the mass of water contained in the clay (p = 0.001) and on the moisture content (p = 0.05) was statistically significant. The authors [24] did not observe any significant correlation between these parameters in the model clays. Nevertheless, literature reports indicated that the dependencies between the moisture content, the volumetric water content in a cohesive soil sample and the unfrozen water content were possible in the cohesive soils with a hygroscopic moisture content [22], and in the cohesive soils with a low plasticity (PI = 9–14%) [18]. The clays studied by us did not meet these criteria. In the publication of Timofeev et al. [22], the authors indicated the transformations of the structure due to the interaction of water with the mineral skeleton, as one of the main reasons for possible dependencies between the unfrozen water content and moisture content. Thus, it seemed that the interactions in the clays contaminated with copper ions would be different to those in the non-contaminated clays [19,33]. Moreover, they would be different for each type of natural clay [18]. There are no studies in the literature on the bentonites contaminated with copper ions, which prevents the comparison of results.
Results of the regression analysis (Table 5) demonstrated that the unfrozen water content in each type of clay, and at a given negative temperature, increased in a statistically significant manner (p = 0.05) along with the increase in clay moisture. The above-mentioned dependency was hard to capture in the case of observing single graphs (Figure 4). Apparently, the dependencies were too small or occurred only at selected temperatures. E.g., Zhang et al. [18] observed a decrease in the volumetric unfrozen water content along with a decrease in the initial volumetric water content at relatively low temperatures in the cohesive soils characterised by low plasticity. Thus, their research suggested that the relation should not be sought only with the moisture content, understood as the gravitational ratio of the mass of water to the mass of the skeleton, with the initial mass of the water contained in the cohesive soil. Our research demonstrated a significant relation (p = 0.001) between the unfrozen water content and the initial mass of water expressed in grams in the bentonites contaminated with copper ions. It was surprising that the unfrozen water content was higher the smaller the mass of water contained in these clays. These changes were especially visible in each examined clay in the samples with a similar moisture content (Figure 6). The most probable reason for the observed variability was the distribution of the water in the micro, macro, and mesopores during the freezing of the sample. In the case of the clays with a greater mass of water, some of the pores swelled, and formed macro and mesopores, in which large ice crystals were formed. In the case of the clays with a lower initial mass of water, the water was trapped in the smaller pores [23]. As a result, it thawed at higher temperature and the unfrozen water content in these clays was higher.
Since a lower initial mass of water resulted in a higher unfrozen water content, it can be expected that in the clays contaminated with copper ions, higher metal concentrations would occur along with a higher unfrozen water content. It was known that solvents migrated with water during freezing [34,35]. This research confirmed this thesis. Higher mean unfrozen water contents were observed in the bentonite with a higher copper concentration, and these changes were statistically significant (p = 0.05). The team of Bing et al. [34] observed similarly higher levels of unfrozen water content in the cohesive soils characterised by higher salt concentrations. Nevertheless, we would like to emphasise that this dependence should be confirmed over a wide range of metal concentrations, which indicates the purposefulness of the continuance of the research on the impact of a Cu ion concentration in contaminated clays on the unfrozen water content. Proving this correlation would confirm the usefulness of the calorimetric techniques in the scope of the study of the bentonites contaminated with copper ions, as opposed to the 1H NMR methods, in which the part of the water involved in the cation hydration process may be subject to the chemical shift phenomenon and may not be visible for magnetic resonance spectroscopes [28]. The above-mentioned observations were made by the authors in previous studies [19].

4. Discussion

In the case of the bentonites contaminated with copper ions, it was possible to estimate in a statistically significant manner (p = 0.00; R = 0.96) the unfrozen water content at a given negative temperature, via the linear equation (Equation (4)) using the mass of the water contained in the clay, determined by the gravimetric method and the temperature. Table 6 contains a summary of the model estimation parameters.
w u T i = a 1 + a 2 · m w + a 3 · ln θ
where w u T i is the unfrozen water content at temperature Ti as a percentage of the dry mass, m w is the mass of the water in the sample (g), and θ is the temperature depression (K).
In the case of Equation (1), the greatest estimation errors (SEEs) of the unfrozen water content occurred at the lowest (−26 °C, −20 °C) and the highest (−2 °C, −4 °C) temperatures. Nevertheless, even at these temperatures, the differences between the unfrozen water content determined in a laboratory and the unfrozen water content estimated by Equation (1) did not exceed 3–4%, and on average these differences amounted to 1–2%. In the authors’ opinion, this model may be useful for quick estimations of the unfrozen water in the clays contaminated with Cu ions for engineering purposes, since the determination of the mass of the water in the clay needs somewhere from several to 24 h and does not require any specialised devices. A more precise adaption of the model was possible for selected negative temperatures. According to the literature, the specific surface area [1,24] and the granulometric composition [20,36] may have had an impact on the unfrozen water content. In turn, in the case of the clays saturated with copper ions, the specific surface area seemed to describe the physical correlations that occurred at the micro-structural level (an increase in porosity and decrease in permeability) in the best possible manner [9,33]. Similarly significant was that in Equation (4) for the temperature of −26 °C, the SEEs were statistically insignificant, while the previous studies by the authors [24] demonstrated that the strongest correlations with the specific surface area occurred at the lowest temperatures. Therefore, in order to provide a better adaptation of the 2-parameter model (Equation (4)), the authors proposed the 3-parameter equation with the mass of water, specific surface area, and temperature (Equation (5)).
w u T i = a 1 + a 2 · m w + a 3 · S + a 4 · ln θ
where a1 = 38.52467, a2 = −0.62903, a3 = 0.02411, a4 = −8.25766; degrees of freedom = 266; R = 0.963, m w is the mass of water in the sample (g), S is the specific surface area (m2/g), and θ is the temperature depression (K).
Equation (5) generated significantly smaller estimation errors compared to Equation (4), for the unfrozen water content determined at the lowest examined temperatures of −26 °C (SEEs(Equation (1)) = 2.316 (NS); SEEs(Equation (2)) = 1.585), −20 °C (SEEs(Equation (1)) = 1.781; SEEs(Equation (2)) = 1.416) and the temperature of −4 °C (SEEs(Equation (1)) = 1.900; SEEs(Equation (2)) = 1.361). Apparently, in the case of these temperatures, the impact of the specific surface area on the unfrozen water content was as significant as the mass of the water. In an earlier publication, the authors confirmed the strong impact of the specific surface area on the unfrozen water content at temperatures of −5 °C and −40 °C [24] in the model clays.
It is difficult to evaluate the change in the unfrozen water content at temperatures close to 0 °C, since the thawing process at these temperatures is the most dynamic. Analysis of the correlation coefficients of the unfrozen water with clay properties at the highest analysed temperature (−2 °C) indicated that the only statistically significant correlation coefficient with the unfrozen water was the mass of the soil skeleton. Since there was some physical dependence behind each correlation, the authors proposed Equation (6). It allowed statistically significant estimations of the unfrozen water content at the temperature of −2 °C in the clays contaminated with copper ions to be achieved. The standard error of estimation of the unfrozen water at the temperature of −2 °C, using Equation (6), amounted to 2.56 and it was lower compared to other models, by at least 0.2.
w u T i = a 1 + a 2 · m s + a 3 · ln θ
where a1 = 49.22748, a2 = −0.47515, and a3 = −8.25766; degrees of freedom = 270; R = 0.957, ms is the mass of the dry soil (g), and θ is the temperature depression (K).
Equation (6) suggested that at the temperature of −2 °C, the unfrozen water content was the greater of, the lower the mass of the dry soil. It was possible that the lower mass of the skeleton in the bentonites was associated with a volumetrically smaller number of pores, in which the water was trapped. Therefore, in the case of less porous cohesive soils, the water thawed faster and more unfrozen water remained at the temperature of −2 °C. A higher unfrozen water content at this temperature may be associated with a higher density of the electric charge surface on the external surface of the bentonite with a lower skeleton mass [37]. Moreover, the weakly bound water was responsible for the change in the unfrozen water content at this temperature, the amount of which depended on the parameters directly associated with the soil skeleton, i.e., the granulometric composition (clay fraction content) [24] and the chemical composition [38].
The unfrozen water content predicted by the models 4–6 was very close to the values obtained with the use of the laboratory method. The smallest differences at any given temperature amount to ±0.1%. The greatest differences depended on the temperature, in which the unfrozen water was determined, however usually they did not exceed 4% (Table 7).

5. Conclusions

  • The effect of the cyclic freezing on the unfrozen water content in bentonites (≥75% smectite) contaminated with copper ions, frozen in a closed system, was determined to be statistically insignificant.
  • The most important factors impacting the unfrozen water content in the examined bentonites included: the temperature, the initial mass of the water contained in the clay, and the clay type.
  • In the case of the clays with a similar moisture content at a given negative temperature, the unfrozen water content was higher and the lower the initial mass of the water in the clay sample. Research should be continued in order to optimise the drainage processes on the clays contaminated with copper ions.
  • It was observed that in the case of the clays with higher contents of copper ions, there was a higher unfrozen water content at a given negative temperature. Research should be continued on a wider range of metal concentrations, in order to establish this correlation and use it as a basis for the creation of a tool for evaluating the migration of copper ions in the contaminated clays.
  • The unfrozen water content determined via the DSC method in the bentonites contaminated with copper ions can be expressed as a simple linear function with R~0.96, depending on the initial mass of the water contained in the clay determined with the use of the gravimetric method.
  • Only significant correlations for the unfrozen water and the mass of the dry soil were obtained at the temperature of −2 °C. As a result, an empirical model was proposed that was determined to be better suited to the experimental data than the model with the mass of the water.

Author Contributions

Conceptualization: E.N.; methodology: E.N. and T.K.; software: E.N.; validation: E.N. and T.K.; formal analysis: E.N.; investigation: E.N.; resources: E.N. and T.K.; writing—original draft preparation: E.N.; writing—review and editing: E.N. and T.K.; visualization: E.N.; supervision: T.K.; project administration: E.N. and T.K.; funding acquisition: E.N. and T.K. All authors have read and agreed to the published version of the manuscript.

Funding

This research and the APC was funded by Faculty of Environmental, Geomatic, and Energy Engineering of Kielce University of Technology, No.05.0.09.02/2.01.01.00.0000MNSPUBB. IKGO. 21.002.

Data Availability Statement

The data presented in this manuscript can be found in the cited articles and in the author’s database.

Conflicts of Interest

The authors declare no conflict of interest. The funders had no role in the design of the study; in the collection, analyses, or interpretation of data; in the writing of the manuscript, or in the decision to publish the results.

References

  1. Anderson, D.M.; Tice, A.R. The unfrozen interfacial phase in frozen soil water systems. In Physical Aspects of Soil Water and Salts in Ecosystems. Ecological Studies (Analysis and Synthesis); Hadas, A., Swartzendruber, D., Rijtema, P.E., Fuchs, M., Yaron, B., Eds.; Springer: Berlin/Heidelberg, Germany, 1973; Volume 4. [Google Scholar] [CrossRef]
  2. Andersland, O.; Ladanyi, B. Frozen Ground Engineering, 2nd ed.; John Wiley & Sons: Chichester, UK, 2004; pp. 1–75. [Google Scholar]
  3. Taber, S. Frost heaving. J. Geol. 1929, 37, 428–461. [Google Scholar] [CrossRef]
  4. Li, T.; Kong, L.; Guo, A. The deformation and microstructure characteristics of expansive soil under freeze–thaw cycles with loads. Cold Reg. Sci. Technol. 2021, 192, 103393. [Google Scholar] [CrossRef]
  5. Melnikov, A.; Kut, A.; Zhang, Z.; Rochev, V. Carbonate Soil Cryogenesis in South Yakutia (Russia). Minerals 2021, 11, 800. [Google Scholar] [CrossRef]
  6. Zhai, J.; Zhang, Z.; Melnikov, A.; Zhang, M.; Yang, L.; Jin, D. Experimental Study on the Effect of Freeze—Thaw Cycles on the Mineral Particle Fragmentation and Aggregation with Different Soil Types. Minerals 2021, 11, 913. [Google Scholar] [CrossRef]
  7. Krupskaya, V.V.; Zakusin, S.V.; Tyupina, E.A.; Dorzhieva, O.V.; Zhukhlistov, A.P.; Belousov, P.E.; Timofeeva, M.N. Experimental study of montmorillonite structure and transformation of its properties under treatment with inorganic acid solutions. Minerals 2017, 7, 49. [Google Scholar] [CrossRef]
  8. Nartowska, E.; Kozłowski, T.; Kolankowska, M. The changes in the microstructure of ion-exchanged clays. E3 Web Conf. 2017, 17, 00063. [Google Scholar] [CrossRef] [Green Version]
  9. Nartowska, E.; Kozłowski, T.; Gawdzik, J. Assessment of the influence of copper and zinc on the microstructural parameters and hydraulic conductivity of bentonites on the basis of SEM tests. Heliyon 2019, 5, 7. [Google Scholar] [CrossRef] [Green Version]
  10. Podlech, C.; Matschiavelli, N.; Peltz, M.; Kluge, S.; Arnold, T.; Cherkouk, A.; Meleshyn, A.; Grathoff, G.; Warr, L.N. Bentonite Alteration in Batch Reactor Experiments with and without Organic Supplements: Implications for the Disposal of Radioactive Waste. Minerals 2021, 11, 932. [Google Scholar] [CrossRef]
  11. Ren, J.; Vanapalli, S.K. Effect of freeze–thaw cycling on the soil-freezing characteristic curve of five Canadian soils. Vadose Zone J. 2020, 19, e20039. [Google Scholar] [CrossRef]
  12. Liu, S.; Wang, J.; Zhou, G.; Chen, T.; Zhou, Y.; Wang, T.; Mu, Y.; Liang, H. Effects of different freezing rates on purification efficiency of sandy soil contaminated by heavy metal copper. Cold Reg. Sci. Technol. 2019, 163, 1–7. [Google Scholar] [CrossRef]
  13. Du, L.; Dyck, M.; Shotyk, W.; He, H.; Ly, J.; Cuss, C.W.; Bie, J. Lead immobilization processes in soils subjected to freeze-thaw cycles. Ecotoxicol. Environ. Saf. 2020, 192, 110288. [Google Scholar] [CrossRef]
  14. Foose, G.; Thomson, R.A., Jr. Effect of freeze-thaw cycling on the hydraulic conductivity of soil-bentonite mixtures. In Proceedings of the 11th International Conference on Cold Regions Engineering, Anchorage, AK, USA, 20–22 May 2002. [Google Scholar] [CrossRef]
  15. Sun, B.; Ren, F.; Ding, W.; Zhang, G.; Huang, J.; Li, J.; Zhang, L. Effects of freeze-thaw on soil properties and water erosion. Soil Water Res. 2021, 16, 205–216. [Google Scholar] [CrossRef]
  16. Wei, C.; You, S.; Jichun, W.; Yaling, C.; Erxing, P.; Leonid, G. Soil hydrological process and migration mode influenced by the freeze-thaw process in the activity layer of permafrost regions in Qinghai-Tibet Plateau. Cold Reg. Sci. Technol. 2021, 184, 103236. [Google Scholar] [CrossRef]
  17. Ren, J.; Vanapalli, S.K.; Han, Z.; Omenogor, K.O.; Bai, Y. The resilient moduli of five Canadian soils under wetting and freeze-thaw conditions and their estimation by using an artificial neural network. Cold Reg. Sci. Technol. 2019, 168. [Google Scholar] [CrossRef]
  18. Zhang, M.; Lu, J.; Zhang, X.; Pei, W. Analysis of volumetric unfrozen water contents in freezing soils. Exp. Heat Transf. 2018, 32, 426–438. [Google Scholar] [CrossRef]
  19. Nartowska, E.; Kozłowski, T.; Kolankowska, M. Exchangeable cations (Cu2+, Zn2+) effects on unfrozen water content in clay-water system using 1H NMR method. Cold Reg. Sci. Technol. 2021, 192, 103403. [Google Scholar] [CrossRef]
  20. Kozłowski, T.; Rusin, A.; Nartowska, E. The specific heat of dry homoionic forms of bentonites SWy-2 and Stx-1b: An effect of the fraction of particles less than 2 μm. Appl. Clay Sci. 2014, 101, 82–89. [Google Scholar] [CrossRef]
  21. Teng, J.; Kou, J.; Yan, X.; Zhang, S.; Sheng, D. Parameterization of soil freezing characteristic curve for unsaturated soils. Cold Reg. Sci. Technol. 2020, 170, 102928. [Google Scholar] [CrossRef]
  22. Timofeev, A.M.; Kravtsova, O.N.; Protodyakonova, N.A. Temperature dependence of unfrozen water quantity in clay soil with different moisture content. IOP Conf. Ser. Mater. Sci. Eng. 2020, 753, 052002. [Google Scholar] [CrossRef]
  23. Kozłowski, T. Temperature dependence of the solidification enthalpy as experimentally determined between 245 and 203 K for montmorillonite-water systems. Thermochim. Acta 2016, 634, 12–25. [Google Scholar] [CrossRef]
  24. Kozłowski, T.; Nartowska, E. Unfrozen water content in representative bentonites of different origin subjected to cyclic freezing and thawing. Vadose Zone J. 2013, 12, 1–11. [Google Scholar] [CrossRef] [Green Version]
  25. Chipera, S.J.; Bish, D.L. Baseline studies of the clay minerals society source clays: Powder X-ray diffraction analyses. Clay Clay Miner. 2001, 49, 398–409. [Google Scholar] [CrossRef]
  26. Górniak, K. Bentonite from the Central Slovakia Volcanic Field—A Prospective Raw Material for Polish Industry. Mineralogia 2017, 48, 23–38. [Google Scholar] [CrossRef]
  27. Stępkowska, E.T. Simple method of crystal phase water. Specific surface and clay mineral content estimation in natural clays. Stud. Geotech. 1973, 2, 21–36. [Google Scholar]
  28. Sare, E.J.; Moynihan, C.T.; Angell, C.A. Proton magnetic resonance chemical shifts and the hydrogen bond in concentrated aqueous electrolyte solutions. J. Phys. Chem. 1973, 77, 1869–1876. [Google Scholar] [CrossRef]
  29. Wang, H.; Shibue, T.; Komine, H. Hydration and dehydration of water of bentonite: A solid-state 1H magic-angle spinning NMR study. Chem. Phys. 2020, 536, 110796. [Google Scholar] [CrossRef]
  30. Kozłowski, T. Some factors affecting supercooling and the equilibrium freezing point in soil–water systems. Cold Reg. Sci. Technol. 2009, 59, 25–33. [Google Scholar] [CrossRef]
  31. Kozłowski, T. A comprehensive method of determining the soil unfrozen water curves: 1. Application of the term of convolution. Cold Reg. Sci. Technol. 2003, 36, 71–79. [Google Scholar] [CrossRef]
  32. Kozłowski, T. Low temperature exothermic effects on cooling of homoionic clays. Cold Reg. Sci. Technol. 2011, 68, 139–149. [Google Scholar] [CrossRef]
  33. Nartowska, E. The effects of potentially toxic metals (copper and zinc) on selected physical and physico-chemical properties of bentonites. Heliyon 2019, 5, 10. [Google Scholar] [CrossRef] [PubMed] [Green Version]
  34. Bing, H.; He, P.; Zhang, Y. Cyclic freeze–thaw as a mechanism for water and salt migration in soil. Environ. Earth Sci. 2015, 74, 675–681. [Google Scholar] [CrossRef] [Green Version]
  35. Kruse, A.M.; Darrow, M.M. Adsorbed cation effects on unfrozen water in fine-grained frozen soil measured using pulsed nuclear magnetic resonance. Cold Reg. Sci. Technol. 2017, 142, 42–54. [Google Scholar] [CrossRef]
  36. Qiu, E.; Wan, X.; Qu, M.; Zheng, L.; Zhong, C.; Gong, F.; Liu, L. Estimating Unfrozen Water Content in Frozen Soils Based on Soil Particle Distribution. J. Cold Reg. Eng. 2020, 34, 2. [Google Scholar] [CrossRef]
  37. Shang, J.Q.; Lo, K.Y.; Quigley, R.M. Quantitative determination of potential distribution in Stern–Gouy double-layer model. Can. Geotech. J. 1994, 31, 5. [Google Scholar] [CrossRef]
  38. Martin, R.T. Water vapor sorption on kaolinite: Entropy of adsorption. Clays Clay Miner. 1960, 8, 102–114. [Google Scholar] [CrossRef]
Figure 1. Morphology and SEM-EDX data of the bentonite samples after ‘Cu’ treatments: (a) Stx-1b from Texas, (b) BSvk from Slovakia.
Minerals 12 00066 g001
Figure 2. Powder XRD patterns of the bentonite samples before ‘0’ and after ‘Cu’ treatments (a) Stx-1b from Texas, (b) BSvk from Slovakia.
Minerals 12 00066 g002
Figure 3. The unfrozen water content vs. temperature obtained in the thawing 1–3 cycles for the BSvk (Jelšový potok, Slovakia) and Stx-1b (Texas) bentonites before and after replacement with the ‘Cu’ ions for samples with different total water contents.
Minerals 12 00066 g003
Figure 4. Graph of the mean unfrozen water contents at a given negative temperature, depending on the F-T cycle, regardless of the type of copper bentonite ‘Cu’ (Stx-1b; BSvk).
Minerals 12 00066 g004
Figure 5. Mean unfrozen water contents at a given negative temperature for the individual F-T cycles, depending on the type of copper bentonite.
Minerals 12 00066 g005
Figure 6. The curve of the unfrozen water content as a function of the temperature, depending on the type of copper bentonite ‘Cu’ (a) Stx-1b; (b) BSvk and the initial mass of water in the samples of the clays characterised by a similar moisture content; cycle 1.
Minerals 12 00066 g006aMinerals 12 00066 g006b
Table 1. Descriptive characteristics and the water contents of the samples.
SymbolDescriptionCharacteristics of the Samples
Water Content
w (%)
Mass of Water
mw (g)
Mass of Dry Soil
ms (g)
Stx-1bNatural calcium bentonite from Texas, USA (the Clay Minerals Society Source Clay)76.993.584.65
63.742.904.55
64.864.066.26
81.725.97.22
85.214.615.41
Stx-1b ‘Cu’Homoionic form of bentonite from Texas saturated with copper ions72.761.952.68
85.834.184.87
88.022.943.34
69.315.948.57
79.024.375.53
BSvkNatural calcium bentonite from Stará Kremnička—Jelšový Potok, Slovakia125.04.053.24
90.945.225.74
54.461.773.25
48.701.873.84
70.063.444.91
BSvk ‘Cu’Homoionic form of the bentonite from Slovakia saturated with copper ions62.142.153.46
58.642.854.86
60.662.934.83
59.203.576.03
73.555.597.6
Table 2. Properties of the clays investigated in this study.
PropertyStx-1bBSvk
‘0’‘Cu’‘0’‘Cu’
Content of elements in the dry clay matrix(mg/kg dry of clay) aCa11,802 ± 1291491 ± 14.111,945 ± 1401598 ± 28
K661 ± 10.7198.5 ± 5959 ± 9.3522 ± 18.4
Mg5609 ± 682702 ± 485348 ± 60.52819 ± 10.7
Na1970 ± 39363 ± 6.81151 ± 9412.57 ± 4.8
Fe2493 ± 363764 ± 483582 ± 464443 ± 32
Cd0.25 ± 0.0020.5 ± 0.10.27 ± 0.0020.63 ± 0.003
Cr13.95 ± 0.3417.5 ± 0.310.09 ± 0.1122.88 ± 0.17
Ni7.57 ± 0.1416.2 ± 0.087.22 ± 0.2122.02 ± 0.09
Pb2.59 ± 0.046.07 ± 0.117.02 ± 0.0117.93 ± 0.18
Zn73.68 ± 0.2792.96 ± 2.964.54 ± 0.6995.61 ± 0.72
Co0.27 ± 0.030.1 ± 0.0051.26 ± 0.010.11 ± 0.06
Cu8.97 ± 0.135427 ± 436.28 ± 0.067677 ± 70
Mineral composition bEstimated quantity≈ 75% smectite (20% opal CT; 5% quartz)≈ 92% smectite (5% quartz; 3% biotite)
According to the literaturefor ‘0’ clays≈67% smectite ((30% opal CT, 3% )quartz + feldspar + kaolinite + talc(?)) c≈85% smectite (5% opal C/CT, 5% feldspar, 3% biotite, 2% quartz) d
Clay/Silt fraction (%) e12/8814/8411/8913/87
Specific surface area S (m2/g) f568414671460
Note: a ICP-OES method; b XRD method; c According to [25] for “as shipped” clays; d According to [26],e Laser diffraction method; f Water Sorption Test (WST) by Stępkowska [27]; Mean ± standard deviation is provided in each case.
Table 3. The mean unfrozen water content at a given negative temperature in the 1–3 melting cycle, depending on the clay type.
ClayCycleMean Unfrozen Water Content (% by Weight) by Temperature (°C)
−2sd−4sd−6sd−8sd−10sd
Stx-1b143.193.9538.561.5134.541.3132.811.3129.980.46
242.813.5037.971.2934.651.1732.481.0129.970.90
342.112.9538.181.2734.330.8732.350.9830.000.59
Stx-1b ‘Cu’142.091.8533.681.5731.731.6528.871.1327.131.71
241.601.5033.861.6331.971.1129.061.1727.151.63
341.241.6533.821.9731.911.3629.191.2027.461.88
BSvk146.885.0739.021.0535.442.0333.021.2630.471.85
245.714.8538.711.3334.932.2833.101.1830.42.20
346.034.8738.330.8935.221.9732.951.7230.412.21
BSvk ‘Cu’141.44.0737.311.3832.422.2130.432.0327.592.08
240.673.5936.861.4532.482.0930.501.8827.511.87
340.023.4736.881.3832.351.9430.622.1427.521.89
ClayCycleMean Unfrozen Water Content (% by Weight) by Temperature (°C)
−12sd−14sd−20sd−26sd−35sd
Stx-1b128.820.9927.430.5124.900.8923.441.0622.211.24
228.590.8827.170.6724.730.9323.410.9422.461.37
328.560.8827.440.4124.790.7923.350.7922.521.11
Stx-1b ‘Cu’125.461.7823.762.1820.461.7418.361.7618.361.76
225.721.4223.931.8820.731.5118.601.8818.601.88
325.861.8724.482.1720.791.6318.642.0518.642.05
BSvk128.781.9428.131.5625.581.5824.841.2324.541.30
229.082.0027.841.7925.761.3925.141.2924.751.12
329.041.8627.981.9125.851.5924.981.2424.741.29
BSvk ‘Cu’125.912.1424.782.0522.981.9622.431.6622.431.66
226.142.0824.691.9023.251.9722.711.6822.711.68
326.332.0725.071.9023.472.1922.881.6322.881.63
Note: sd—standard deviation; N = 5 for each clay; cycle and temperature.
Table 4. Univariate tests of the significance of the temperature and its interaction with the clay, copper concentration, and cycle for the unfrozen water content.
The Unfrozen Water ContentSum of SquaresDegrees of FreedomMean SquareF-Test Valuep-ValueStatistical Significance
Intercept223,262.21223,262.258,366.210.0000***
Temperature (T)10,565.981320.7345.270.0000***
Type of clay (S)131.81131.834.450.0000***
Cycle (C)0.420.20.060.9441NS
T × S157.6819.75.150.000007***
T × C10.7160.70.170.999878NS
S × C0.620.30.080.927128NS
T × S × C1.0160.10.021.000000NS
Error826.22163.8
Note: Significant at the *** 0.001 probability level; NS: not significant at the 0.05 probability level; Type of clay (Stx-1b. BSvk); Cycle (1; 2; 3 freeze-thaw cycles); Temperature (−26 °C, −20 °C, −14 °C, −12 °C, −10 °C, −8 °C, −6 °C, −4 °C, and −2 °C).
Table 5. Multiple regression analysis between the type of clay, the mass of water of the clay, the water content as a percentage of the dry mass, and the unfrozen water of the clay at selected temperatures in the temperature range (−26 °C to −2 °C).
The Unstandardized Beta (β)Std. Error βThe Standardized Beta (β)Std. Error βt Test Valuep-ValueSignificance
N = 270Dependent Variable: Unfrozen Water at the Temperatures
−26 °C, −20 °C, −14 °C, −12 °C, −10 °C, −8 °C, −6 °C, −4 °C, and −2 °C
R = 0.89R2 = 0.79adj. R2 = 0.78Std. Error of Estimate: 3.06
Intercept −186.02662.53284−2.974850.003202**
Mass of water−0.1337080.029177−0.6830.14896−4.582710.000007***
The water content0.1063660.0461530.0680.029452.304630.021960*
Type of clay0.1656780.0455892.1810.600063.634190.000335**
Temperature0.8698390.0283600.7840.0255630.671150.000000***
Note: Significant at the *** 0.001, ** 0.01, * 0.05 probability level.
Table 6. Parameter estimates and overall characteristics of the model given by Equation (4).
ParameterEstimateSEtpStatistical SignificanceConfidence Limits
LowerUpper
a149.3400.475103.8250.000***48.40550.276
a2−0.7050.088−7.9640.000***−0.880−0.531
a3−8.2580.151−54.6970.000***−8.554−7.960
Note: *** Significant at the 0.001 probability level; NS: not significant at the 0.05 probability level; For Equation (1): R = 0.960; df = 270 and standard errors of the estimate (SEEs) at −26, −20, −14, −12, −10, −8, −6, −4, and −2 °C are 2.316 (NS); 1.781, 1.625, 1.574, 1.570, 1.279, 1.639, 1.900, and 2.698 (NS), respectively.
Table 7. Maximum difference between the unfrozen water content determined by the DSC method at a given negative temperature and the unfrozen water content predicted by the empirical models 4–6, expressed in % by weight.
Temperature (°C)−2−4−6−8−10−12−14−20−26
Equation (4)5.72.83.62.42.13.13.33.14.7
Equation (5)6.32.33.62.23.83.73.82.64.0
Equation (6)5.23.23.62.62.23.13.33.54.5
Note: Equation (4) wu = 49.34046 + (−0.70547 × mw) + (−8.25766 × ln|T|); Equation (5) wu = 38.52467 + (−0.62903 × mw) + 0.02411 × S + (−8.25766 × ln|T|); Equation (6) wu = 49.22748 + (−0.47515) × ms + 8.25766 × ln|T|; N = 30.
Publisher’s Note: MDPI stays neutral with regard to jurisdictional claims in published maps and institutional affiliations.

