Article

Effects of Regional Differences in Shale Floor Interval on the Petrophysical Properties and Shale Gas Prospects of the Overmature Niutitang Shale, Middle-Upper Yangtz Block

1
State Key Laboratory of Organic Geochemistry, Guangzhou Institute of Geochemistry, Chinese Academy of Sciences, Guangzhou 510640, China
2
University of Chinese Academy of Sciences, Yuquan Road, Beijing 100049, China
*
Author to whom correspondence should be addressed.
Submission received: 5 March 2022 / Revised: 11 April 2022 / Accepted: 23 April 2022 / Published: 26 April 2022
(This article belongs to the Special Issue Shale and Tight Reservoir Characterization and Resource Assessment)

Abstract

:
The lower Cambrian Niutitang/Qiongzhusi shale gas in the Middle-Upper Yangtz Block had been regarded as a very promising unconventional natural gas resource due to its high total organic carbon, great thickness, and large areal distribution. However, no commercial shale gas fields have yet been reported. From the northwest to the southeast there are considerable differences in the sedimentary environments, lithology, and erosive nature of the underlying interval (the floor interval) of the Niutitang shale. However, systematic research on whether and how these regional differences influence shale petrophysical properties and shale gas preservation in the Niutitang shale is lacking. A comparison of Niutitang shale reservoirs as influenced by different sedimentary and tectonic backgrounds is necessary. Samples were selected from both the overmature Niutitang shales and the floor interval. These samples cover the late Ediacaran and early Cambrian, with sedimentary environments varying from carbonate platform and carbonate platform marginal zone facies to continental shelf/slope. Previously published data on the lower Cambrian samples from Kaiyang (carbonate platform), Youyang (carbonate platform marginal zone) and Cen’gong (continental shelf/slope) sections were integrated and compared. The results indicate that the petrophysical properties of the floor interval can affect not only the preservation conditions (sealing capacity) of the shale gas, but also the petrophysical properties (pore volume, porosity, specific surface area and permeability) and methane content of the Niutitang shale. From the carbonate platform face to the continental shelf/slope the sealing capacity of the floor interval gradually improves because the latter gradually passes from high permeability dolostone (the Dengying Formation) to low permeability dense chert (the Liuchapo Formation). In addition, in contrast with several unconformities that occur in the carbonate platform face in the northern Guizhou depression, no unconformity contact occurs between the Niutitang shale and the floor interval on the continental shelf/slope developed in eastern Chongqing Province and northwestern Hunan Province. Such regional differences in floor interval could lead to significant differences in hydrocarbon expulsion behaviour and the development of organic pores within the Niutitang shale. Therefore, shale gas prospects in the Niutitang shales deposited on the continental shelf/slope should be significantly better than those of shales deposited on the carbonate platform face.

1. Introduction

The lower Cambrian Qiongzhusi Formation (Niutitang Fm equivalent in northern Guizhou Area) and the upper Ordovician Wufeng Formation-lower Silurian Longmaxi Formation are the main marine shale-bearing gas formations in South China. They both feature high total organic carbon (TOC) values, great thickness, and large areal distribution [1,2,3]. In the 2010s, several large shale gas fields, such as the Fuling and Changning shale gas fields were developed in the Wufeng-Longmaxi shale in the Sichuan Basin and its periphery. However, no commercial shale gas field has been built in the Qiongzhusi shale. The Qiongzhusi shale is considered to be the source rock of many giant conventional gas fields [4,5]. For example, the Anyue super-large gas field with reserves of trillions of cubic meters was discovered in the dolomite reservoirs of the upper Sinian Dengying Formation (e.g., 138.15 × 10⁴ m3/d [4878.73 × 104 ft3/d] in Gaoshi 1 well) and carbonate reservoirs of the lower Cambrian Longwangmiao Formation (e.g., 190.68 × 10⁴ m3/d [6733.81 × 104 ft3/d] in Moxi 8 well) around paleo-uplift in the Central Sichuan Basin in 2013 [4,5,6]. The lower Cambrian Qiongzhusi Formation is considered to be the main source rock of the Anyue gas field [4], suggesting that the Qiongzhusi shale has always had great potential for hydrocarbon generation. However, although industrial gas flows have been obtained from the Qiongzhusi shale in the Sichuan Basin and its adjacent areas [7], very few shale gas wells currently yield commercial quality shale gas [3]. For example, the Jinye Well #1-HF (Hydraulic Fracturing) in the southern Sichuan Basin, which is the most productive of all Qiongzhusi shale wells, produced 8.6 × 10⁴ m3 (303.7 × 104 ft3) of gas per day [3,8]. In addition, the hydrocarbon gas content of the Niutitang shale in the northern Guizhou area (in the south of the Sichuan Basin) was very low (i.e., methane content was mainly ranged from 4–8% [9]), despite the current depth of the Niutitang shale exceeding 3800 m [10]. Therefore, the Qiongzhusi shale featured low shale gas content in the relatively stable tectonic area and low hydrocarbon gas content in the complicated tectonic area, implying that the shale gas prospects in the Qiongzhusi shale are not as good as those in the Wufeng-Longmaxi shale.
Numerous researchers have explored the factors causing the poor commercial quality of gas from the Qiongzhusi shale. The Qiongzhusi shale in the Upper Yangtz Block is commonly inferred to be characterized by undeveloped organic pores, and it has a porosity of approximately 1/3 to 1/2 that of the Wufeng-Longmaxi shales [3]. These characteristics have been linked to a large number of geological factors, such as high maturity, strong compression, and inferior preservation [3,10,11,12,13]. Notably, most of the reported Qiongzhusi shales are deposited on the carbonate platform in the Upper Yangtz Block (Figure 1).
The sedimentary environments and lithology of the Ediacaran–Cambrian (E–Є) changed significantly from the northwest to southeast of the Yangtze Block, South China [15]. For example, following the disappearance of the silica-rich Liuchapo Formation near the E–Є boundary toward the carbonate platform, the lithology of the floor interval of the Niutitang shale varies from continuous sedimentary massive chert, interbedded muddy dolostone and chert to non-continuous sedimentary dolostone [15]. As a result, the sealing capacity of the floor interval of the Niutitang shale reservoir may change with lithology variation. Sealing rocks such as shales and evaporites with low permeability can prevent petroleum and gas in a reservoir from escaping [16,17]. Owing to the undulation of paleotopography and lateral migration of fluids, the sealing capacity of the reservoir floor is also very important for oil and gas preservation [11,18]. However, systematic research on whether or how these regional differences of underlying floor intervals such as sedimentary environments, lithology, and erosive nature influence the shale gas prospect of the Niutitang shale is lacking. Therefore, the objective of this paper is to (1) characterize the geological conditions and petrophysical properties of the Niutitang shales and the floor interval deposited in various sedimentary environments such as carbonate platform, carbonate platform marginal zone, and continental shelf/slope; (2) reveal whether and how these regional differences of floor interval influence the petrophysical properties and preservation conditions of the Niutitang shale.

2. Materials and Methods

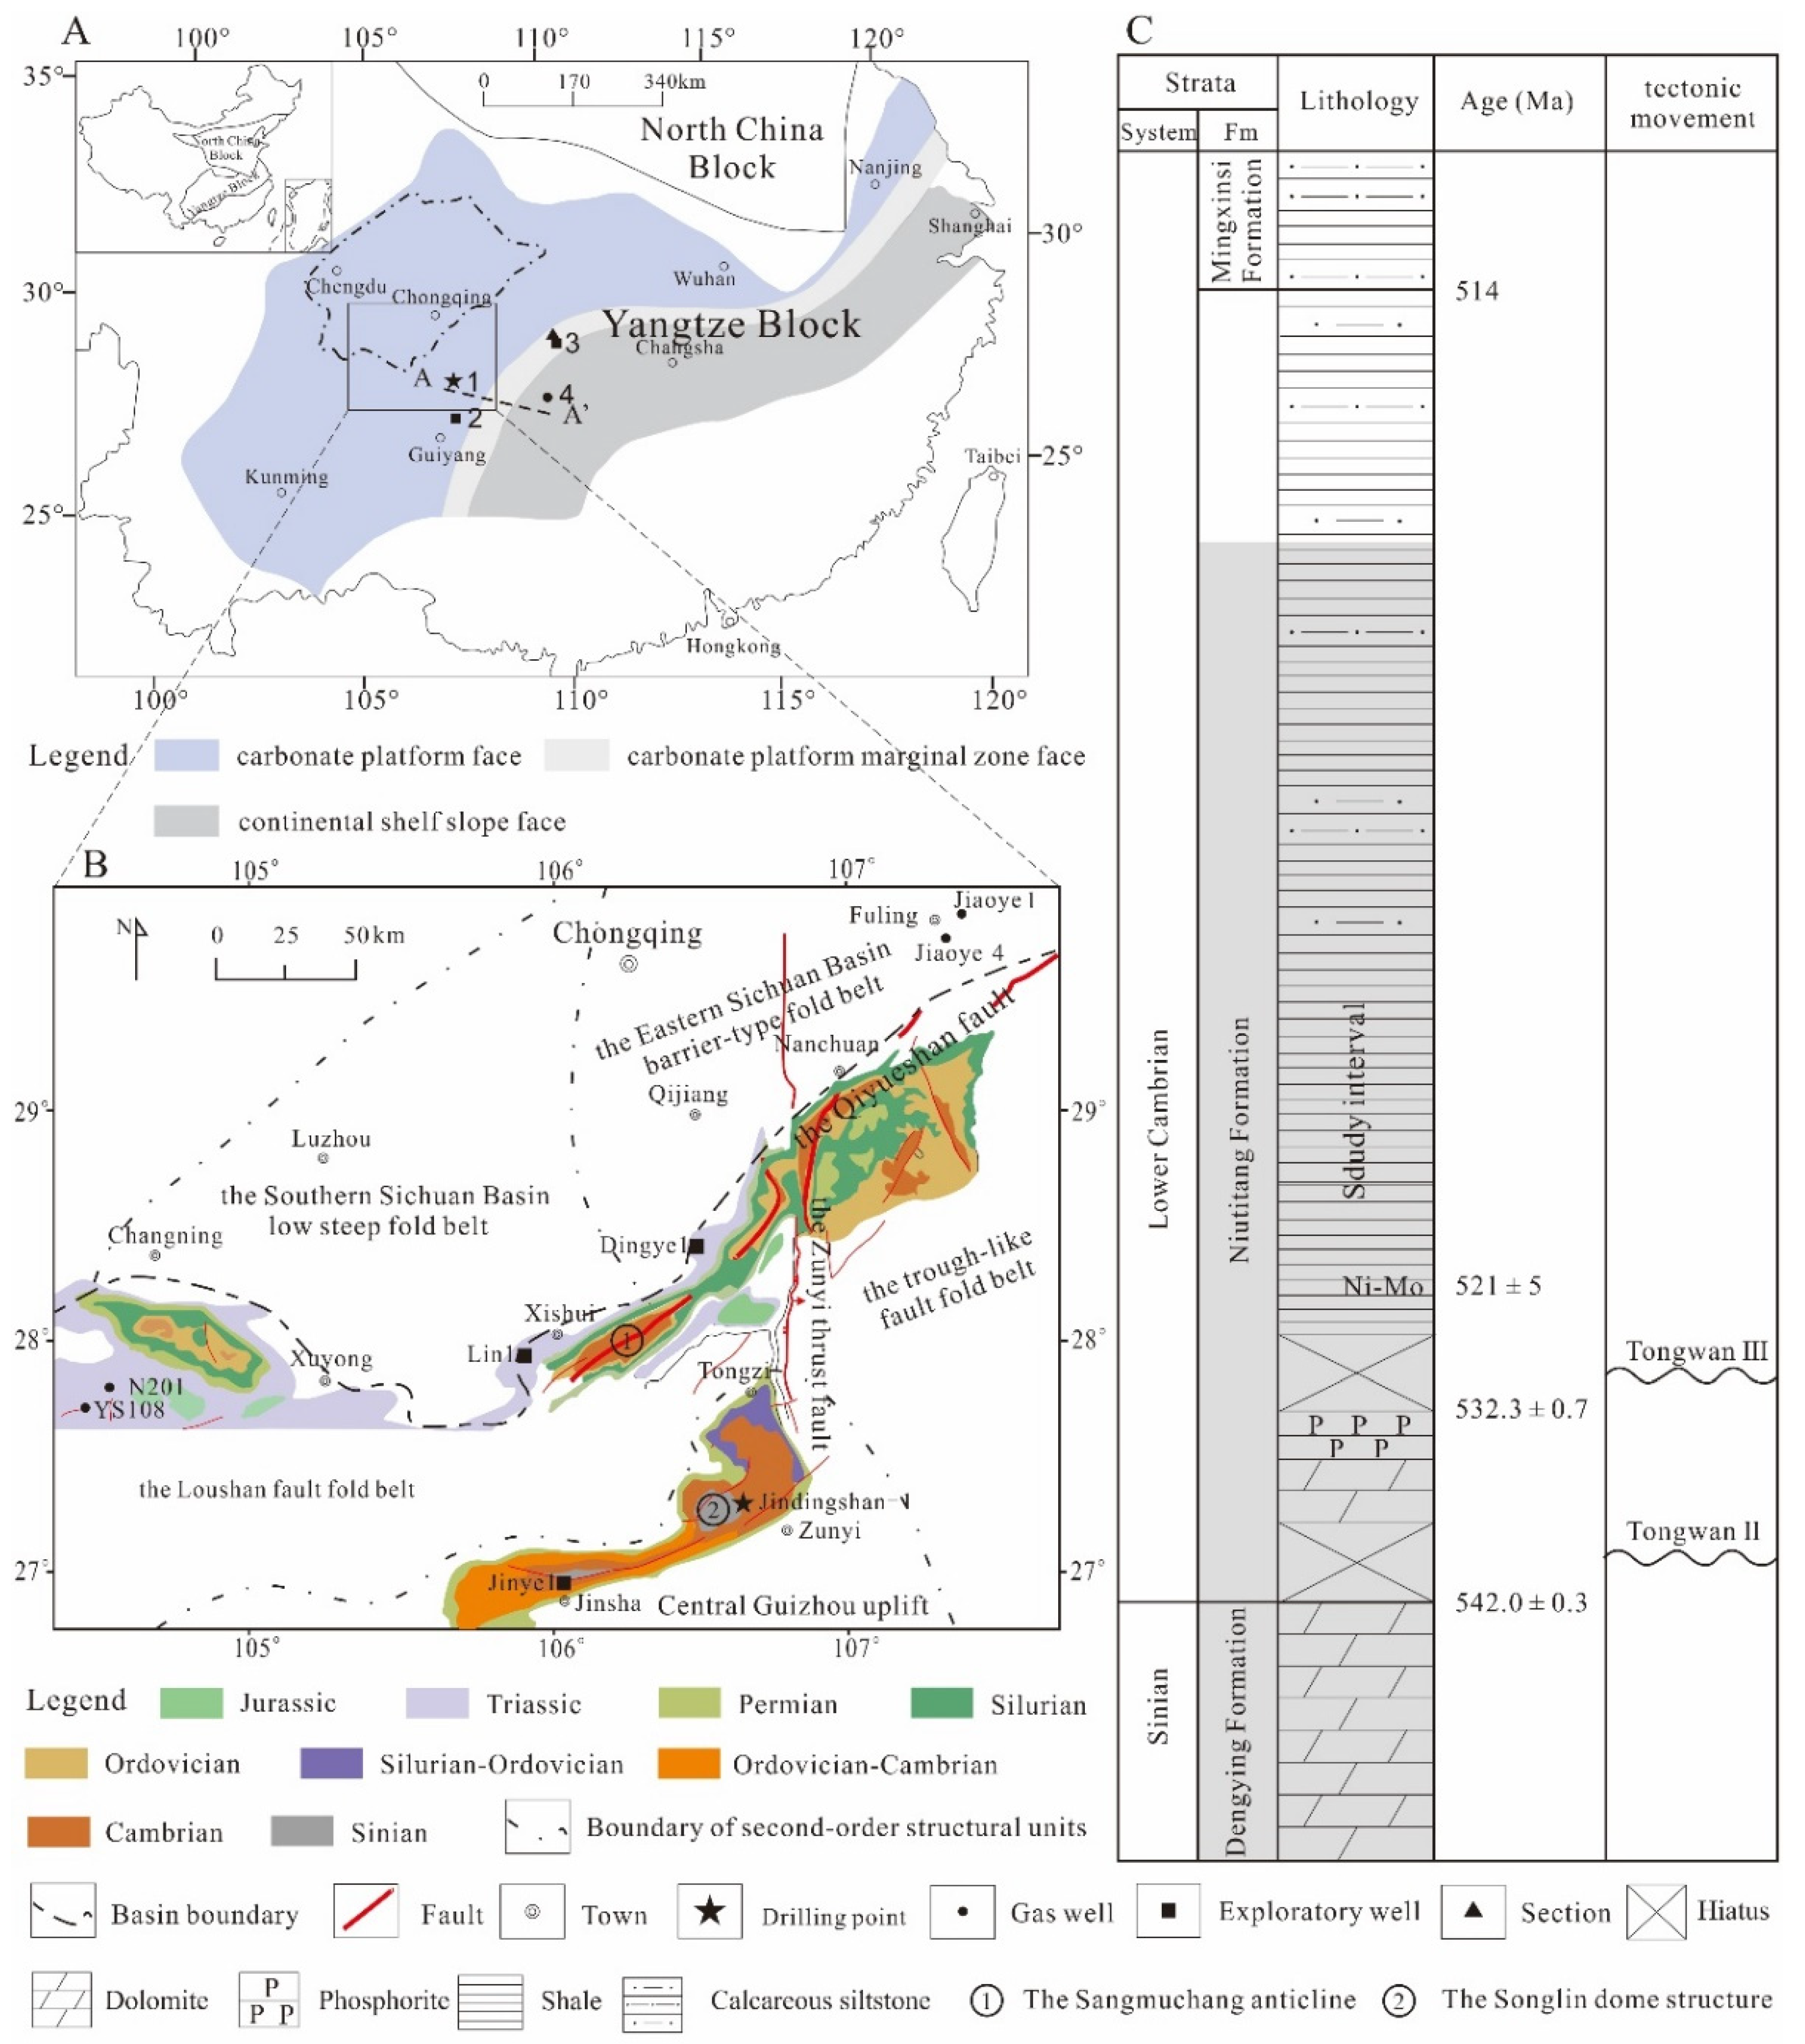
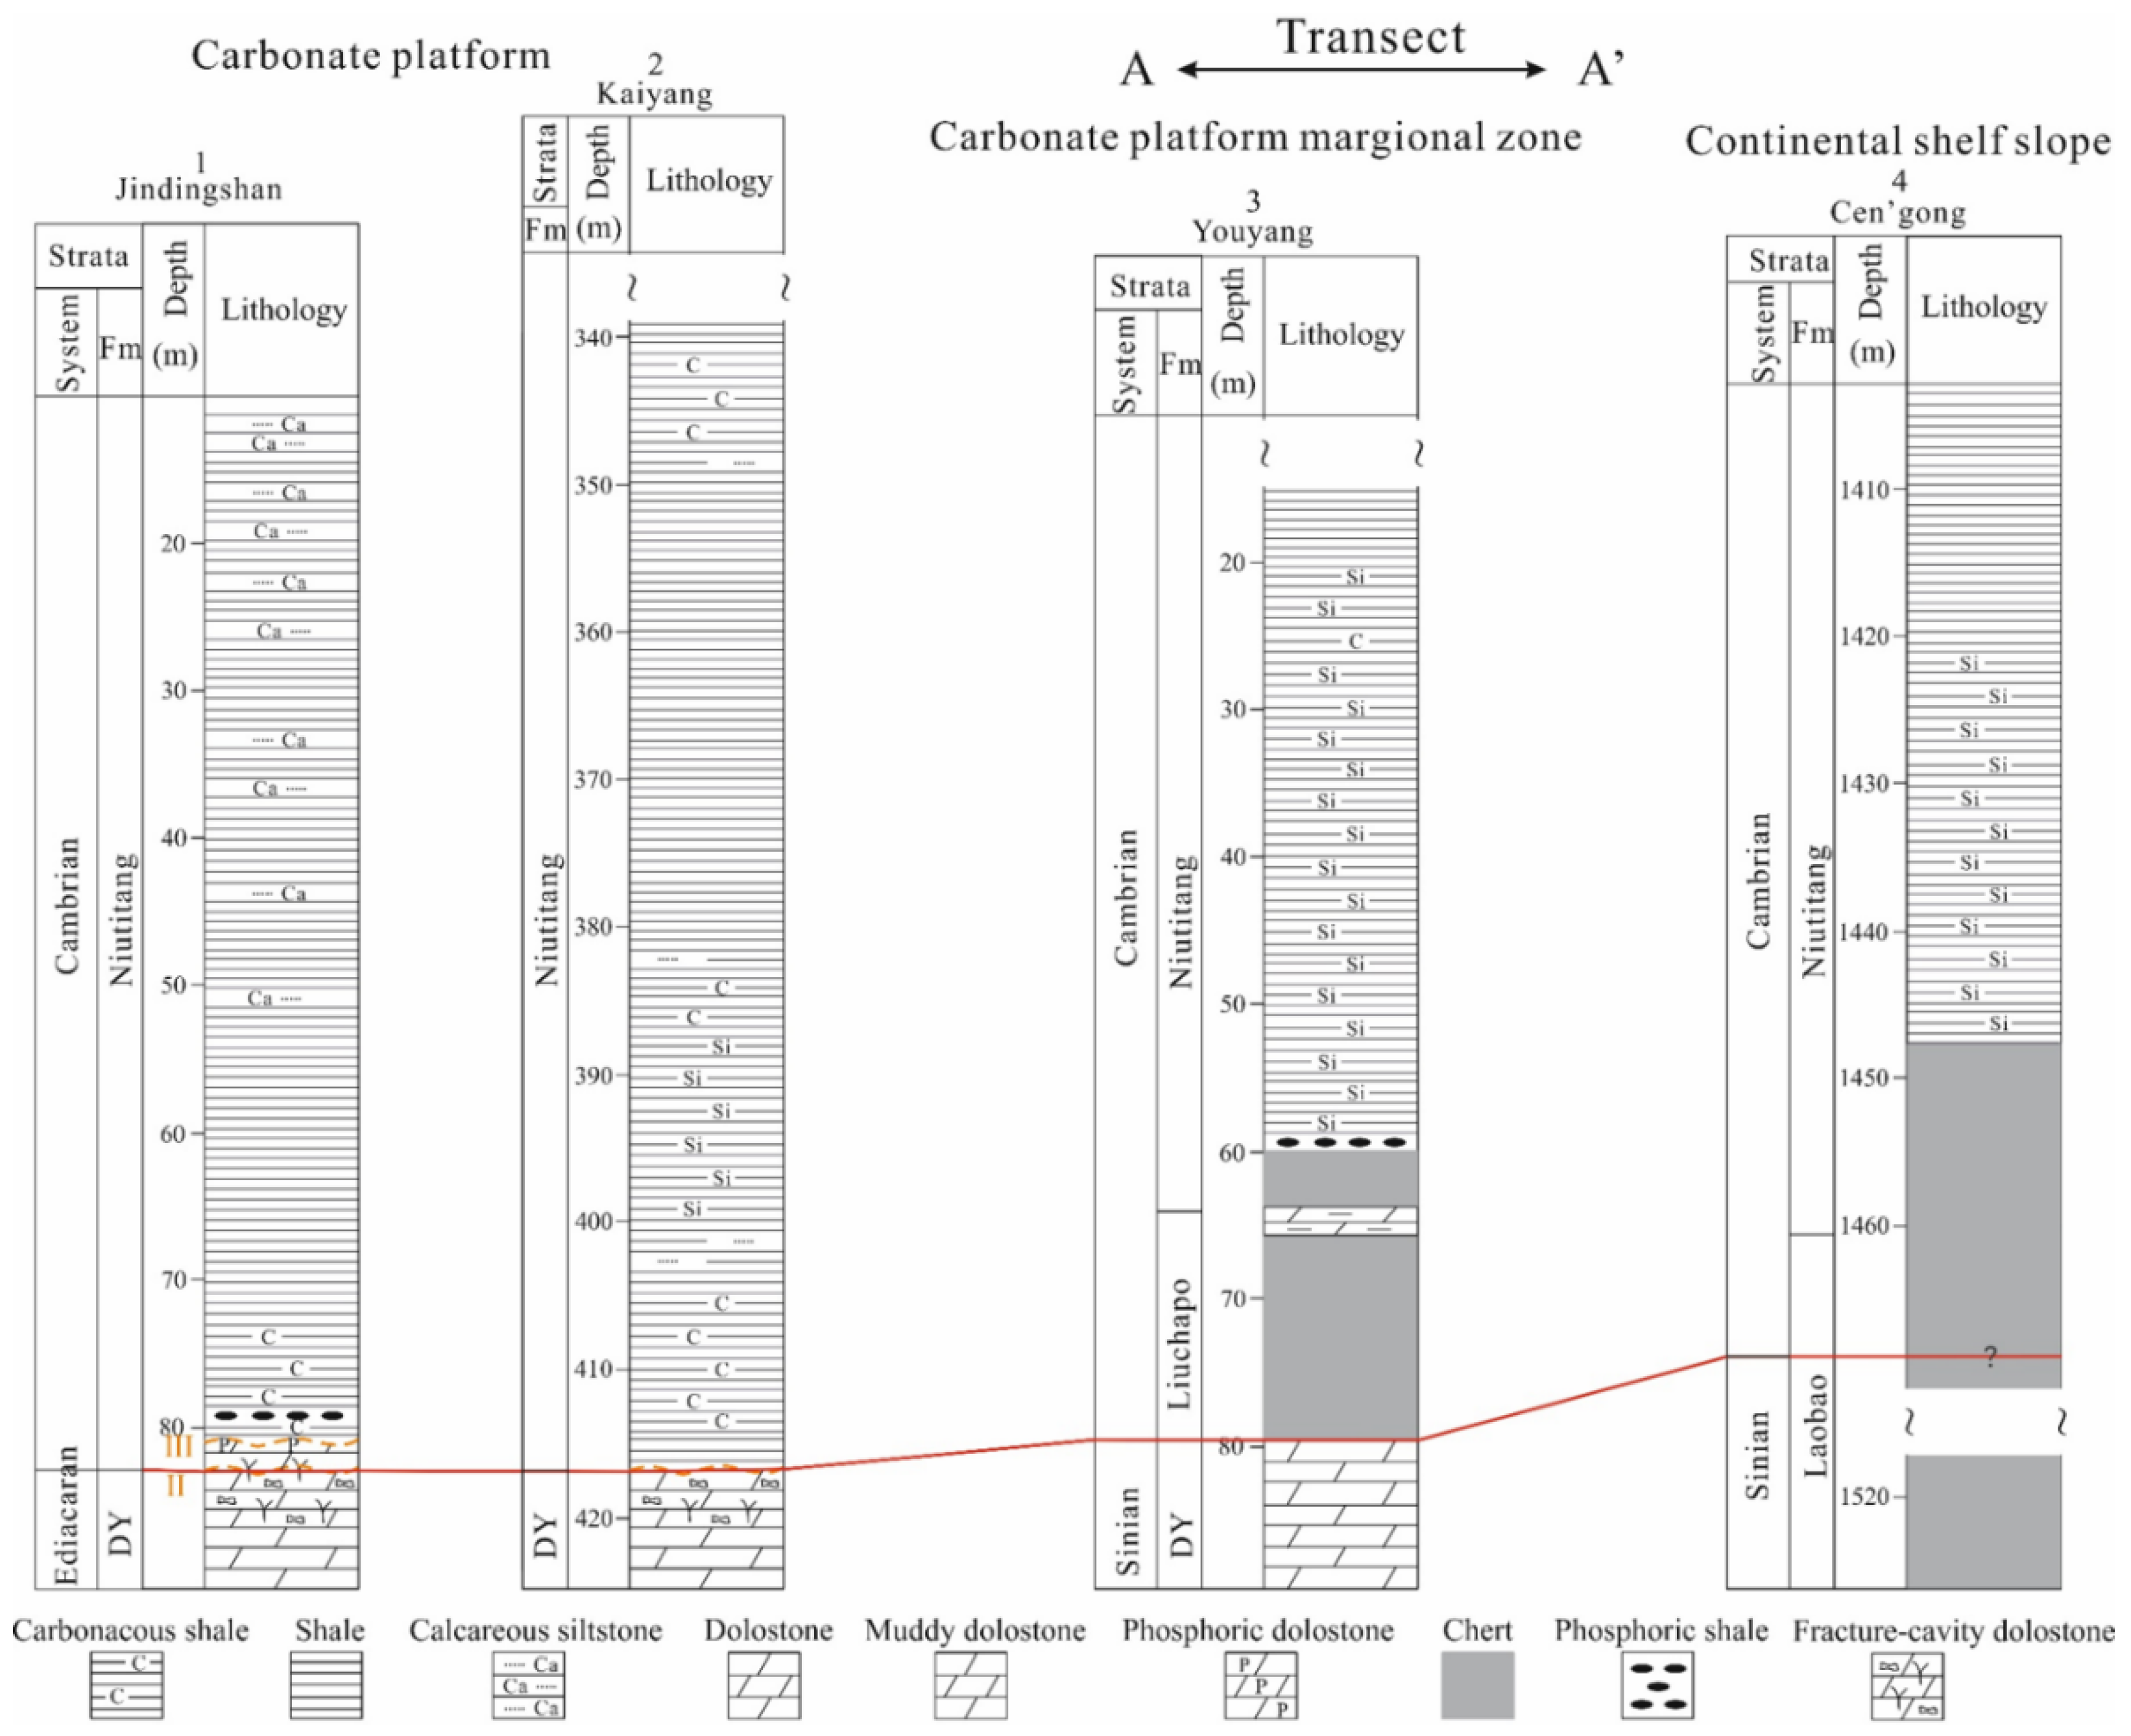
2.1. Paleogeography of Study Sections

During the E–Є transition, the Yangtze Block evolved from a rift basin to a passive continental margin basin [19]. From west to east, the lithology passed from dolostone deposited in shallow carbonate platform to black chert shale deposited on the continental shelf/slope of the deep basin [20,21] (Figure 1A). In the Upper Yangtz Block, the floor interval of the Niutitang shale is the dolostone of the Dengying Formation deposited in the settings of the carbonate platform. However, in southeastern Chongqing (e.g., Youyang, Chongqing Municipality) [22] and northern Hunan (Dayong, Hunan Province) [15], the E–C successions include the Dengying Formation (dolostone) deposited in the deep-water settings of the carbonate marginal zone, the overlying Liuchapo Formation (chert) and the Niutitang Formation (black shale). The Liuchapo chert successions occur as stratum wedges embedded in the carbonate successions, which thicken rapidly to form the complete chert successions over a short distance towards the southeast, namely, northwestern Hunan [15]. The thick Liuchapo chert in northwestern Hunan is considered to be deposited in the settings of the continental shelf/slope of the deep basin.
The differences in the floor interval of the Niutitang shale are related to the sedimentary environment and the contemporaneous tectonic movements. The second episode of the Tongwan movement (Tongwan II), which occurs at the end of the fourth member of the Dengying Formation (D4), resulted in weathering, erosion, and karstification of the upper D4 dolomites, leading to the formation of abundant karst pores and cavities [6,23]. In addition, the third episode of the Tongwan movement (Tongwan III), which mainly occurs at the end of the Lower Cambrian Maidiping Formation, resulted in gentle-angle unconformity contact between the Qiongzhusi and Maidiping formations in the Sichuan Basin [23,24]. In the early Cambrian, the widespread Niutitang shale recorded transgression globally [25,26]. The precise SHRIMP U-Pb zircon PЄ/Є (Precambrian and Cambrian) boundary age is 542 ± 0.3 million years (Myr) [27]. The SHRIMP U-Pb zircon age of the volcanic ash bed between the phosphorite and the siliceous shale of the Niutitang Formation near the Zhongnancun section of Songlin Town is 532.3 ± 0.3 Myr [28]. Re-Os isochronous age of the Ni-Mo polymetallic layer at the bottom of the Niutitang shale in the Dazhuliushui section of Songlin Town is 521 ± 5 Ma [29]. The restricted geological age at the top of the Niutitang Formation is 514 Ma ([30] updated) (Figure 1C). Ni-Mo polymetallic layer rested unconformably on the Dengying Formation in areas where erosive nature was particularly severe, as indicated by the GK1 well of the Moxi-Gaoshiti gas field in the Sichuan Basin [21]. This indicated that little or no sedimentation occurs in the carbonate platform within the first 20 Myr of the Early Cambrian [21]. Consequently, weathering karst reservoirs extensively occurs on the top of D4 in the carbonate platform.
The E–Є successions of the four study sections in this manuscript can be correlated within a framework ranging from carbonate platform to continental shelf/slope based on lithology (Figure 2). Along the carbonate platform-carbonate platform marginal zone-continental shelf/slope and basin facies transect (A–A’), the two unconformities at the bottom of the Niutitang Formation gradually passed to conformity contact until continuous deposition occurred, and the thickness of chert in the shale floor interval gradually increased.
In the Jindingshan section, the E–Є successions include the Dengying and Niutitang formations. The Niutitang Formation was deposited on the carbonate platform, unconformably overlying the Dengying Formation (Figure 3). Based on the unconformity surface and lithology, the Niutitang Formation is subdivided into three members: (1) a lower member consisting of dolostone and phosphorite layers, which lies between two unconformity surfaces; (2) a middle member consisting of siliceous shale, phosphorite nodules layer, Ni-Mo polymetallic layer, and black shale with high TOC content; (3) an upper member consisting of muddy siltstone and grey shale with low TOC content.
In the Kaiyang section, the E–Є successions also include the Niutitang Formation and the Dengying Formation. The Niutitang Formation unconformably overlies the Dengying Formation [31]. The Niutitang Formation was deposited on the carbonate platform, representing a shallow water setting similar to the Jindingshan section (Figure 1). Based on the unconformity surface and TOC content, the Niutitang Formation can be subdivided into two members: (1) a lower member consisting of siliceous shale and black shale with high TOC content, (2) an upper member consisting of grey silty shale with low TOC content.
In the Youyang section (including both Danquancun and Yuke-1), the E–Є successions are composed of the Dengying, Liuchapo, and Niutitang formations [22]. Both the Liuchapo Formation and the Niutitang Formation are considered to be deposited in the carbonate platform marginal zone. The Liuchapo Formation overlies the Dengying Formation. Based on the lithology, the Liuchapo Formation is subdivided into two members: (1) a lower member composed of chert, (2) an upper member composed of interbedded muddy dolostone, and shale. The overlying Niutitang Formation can be subdivided into two members: (1) a lower member consisting of chert, and (2) an upper member consisting of phosphorite nodules layer, a Ni-Mo polymetallic layer, and black shale with high TOC content.
In the Cen’gong section, the E–Є successions of the continental shelf/slope are composed of the Laobao (Liuchapo, equivalent) and Niutitang formations [13,33]. In the deep-water slope to basin settings, the Ediacaran–Cambrian boundary is placed at a level within the Liuchapo Formation [15]. The Liuchapo Formation is mainly composed of chert. The Niutitang Formation is subdivided into two members: (1) a lower member consisting of siliceous shale/chert, and (2) an upper member consisting of black shale.

2.2. Sampling Location and Sample Collection

In the Jindingshan section, a shallow well was drilled in Jindingshan Town of Zunyi City, Guizhou Province; and named JDS-1. JDS-1 well is located at the eastern flank of the Songlin dome structure (Figure 1B). During the E–Є transition, the JDS-1 well was paleogeographically located in shallow-water settings of the carbonate platform (Figure 1A). The Niutitang Formation unconformably overlies the Dengying Formation (Figure 3). The Niutitang stratum dip was 6°. Except for the overlying soil, the Niutitang shale core is 72.5 m (237.9 ft) thick. No gas show was recorded during drilling. A total of 109 core samples (Niutitang: 107 and Dengying: 2) were collected from JDS-1 well, at 0.5-m or 1.0-m (1.6-ft or 3.3-ft) intervals from the bottom up.
In addition, a total of 22 samples (Niutitang: 17, Liuchapo: 3, and Dengying: 2) were collected from a fresh quarry in the Danquancun village of Longtan Town, Youyang County of the Chongqing Municipality (Figure 1). They were commonly collected at 2.0-m (6.6-ft) intervals from the bottom up. These samples represent the Danquancun sections. In the Danquancun section, the Niutitang stratum dip was 4°. The thickness of the fresh black shale interval was approximately 40.0 m (131.2 ft). Because the actual exposure of the Niutitang Formation in the shale quarry and the Dengying Formation outcrop nearby was discontinuous, the Danquancun section was composite. Fortunately, approximately 2.5 km to the southeast of the Danquancun section, there is a previously reported shallow well Yuke-1 (28°38′58″ N, 108°52′89″ E). The histogram of the Danquancun section was reconstructed according to the stratigraphic conditions of Yuke-1 (YK-1).
Based on the shale samples collected from both Jindingshan and Danquancun sections, along with the parameters from the literature concerning Kaiyang and Cen’gong sections, the lithology, thickness, porosity, and permeability of shale floor interval, petrophysical properties, and shale gas composition of the Niutitang shale in northern Guizhou area were comprehensively investigated and compared.

2.3. Methodology

All samples were divided into two parts and pulverized to powders (60–120 and <200 mesh sizes) and then dried in an oven for 10 h at 80 °C (176 °F). A total of 106 and 20 shale samples were analyzed for TOC from JDS-1 and the Danquancun section, respectively. The TOC values were measured using a Leco CS-320 Carbon and Sulfur Analyzer. Before TOC measurement, the powdered shale samples (60–100 mg, <200 mesh size) were treated with 5% hydrochloric acid (HCl) at 80 °C (176 °F) to remove the carbonates and then washed at least six times with deionized water to remove residual HCl.
The maturities of highly mature to overmature samples commonly exhibit large variations owing to the considerable inhomogeneity. However, a good relationship was observed between the vibration information of atoms and molecules in the aromatic carbon ring structure of solid organic matter and the thermal evolution degree of samples [34,35]. Raman reflectance (RmcRo%), which is equivalent to vitrinite reflectance, was established by Liu et al. [34] to characterize the maturities of samples from the mature to the overmature stage at the molecular level. RmcRo% values of organic matter were measured to present the maturities of shale samples. A detailed summary of the method used to analyze RmcRo% was presented by Liu et al. [34].
An X-ray diffractometer (OLYMPUS Innova-X BTX-II, Waltham, MA, USA) was used for mineral composition analyses. The diffractometer was equipped with a Co X-ray tube operated at 31 kV and 0.4 mA. The exposure time was 70 min, and the exposure rate was 3 times/min. Stepwise scanning measurements were performed within the range of 3–55° (2θ), using a 0.02° (2θ) scanning step. The relative mineral percentages were estimated semi-quantitatively using the area under the curve for the major peaks of each mineral. To elucidate the influence of excess silicon on shale petrophysical properties, the major element concentrations were also investigated. The concentrations of major elements in 17 core samples and 10 fresh shale samples were determined via X-ray fluorescence (Rigaku 100e), and the analytical precision of the results was ±3%. A detailed summary of the methods used to analyze major oxides was presented by Li et al. [36].
The porosity of the shale samples was measured on a Micrometritics Autopore 9510 Porosimeter (Micrometritics Instruments, Norcross, GA, USA) using the mercury injection capillary pressure (MICP) techniques that were widely used in previous studies [37,38]. A total of 6 shale samples from JDS-1 were analyzed. Furthermore, 3–5 g of core samples were crushed to 1–20 mesh sizes and then dried in the oven for at least 24 h at 110 °C (230 °F) under vacuum conditions. Pore sizes ranging from 3 nm–120 μm were identified. The porosities were calculated from the Hg intrusion data [38]. In addition, the porosity and permeability of the chert and dolomite samples underlying the Niutitang shale were also measured.
The permeability of the Niutitang shale and the chert/dolomite samples underlying the Niutitang shale were measured on CoreLab’s PDP-200 (CoreLab, Houston, TX, USA) using the pressure-pulse decay (PPD) method from Dicker and Smits [39]. The apparatus is composed of a cell containing a cylindrical rock sample, two chambers, and three pressure transducers. The schematic of PDP-200 and experimental procedures were described by Yang et al. [40].
The pores ranging from 0.33–100 nm were measured using non-local-density functional theory (NLDFT) analysis based on the CO2 and N2 composited adsorption. The pores were classified into three categories according to their pore size: micropores (<2 nm), mesopores (2–50 nm), and macropores (>50 nm) [41]. The specific surface area and pore volume were also calculated based on the NLDFT method [42]. Low-pressure N2 and CO2 gas adsorption analyses were performed on an accelerated surface area and porosimetry system (ASAP-2460, Micromeritics Instruments, Norcross, GA, USA). The detailed analysis procedures are reported by Zheng et al. [43].
After treatment via argon ion-beam milling (IM4000, Hitachi High-Tech, Nake, Japan), the field emission scanning electron microscopy (FE-SEM) images of the nanopores on the shale chips were obtained. Secondary electron (SE) images for documenting topographic variation and backscattered electron (BSE) images to delineate the compositional variation were acquired on Hitachi SU8010 (Hitachi High-Tech, Nake, Japan). Additional observations were made using energy disperse spectroscopy (EDS), which is required for mineral identification and characterization [37,44].

3. Results

3.1. Geochemical Characteristics of the Niutitang Formation

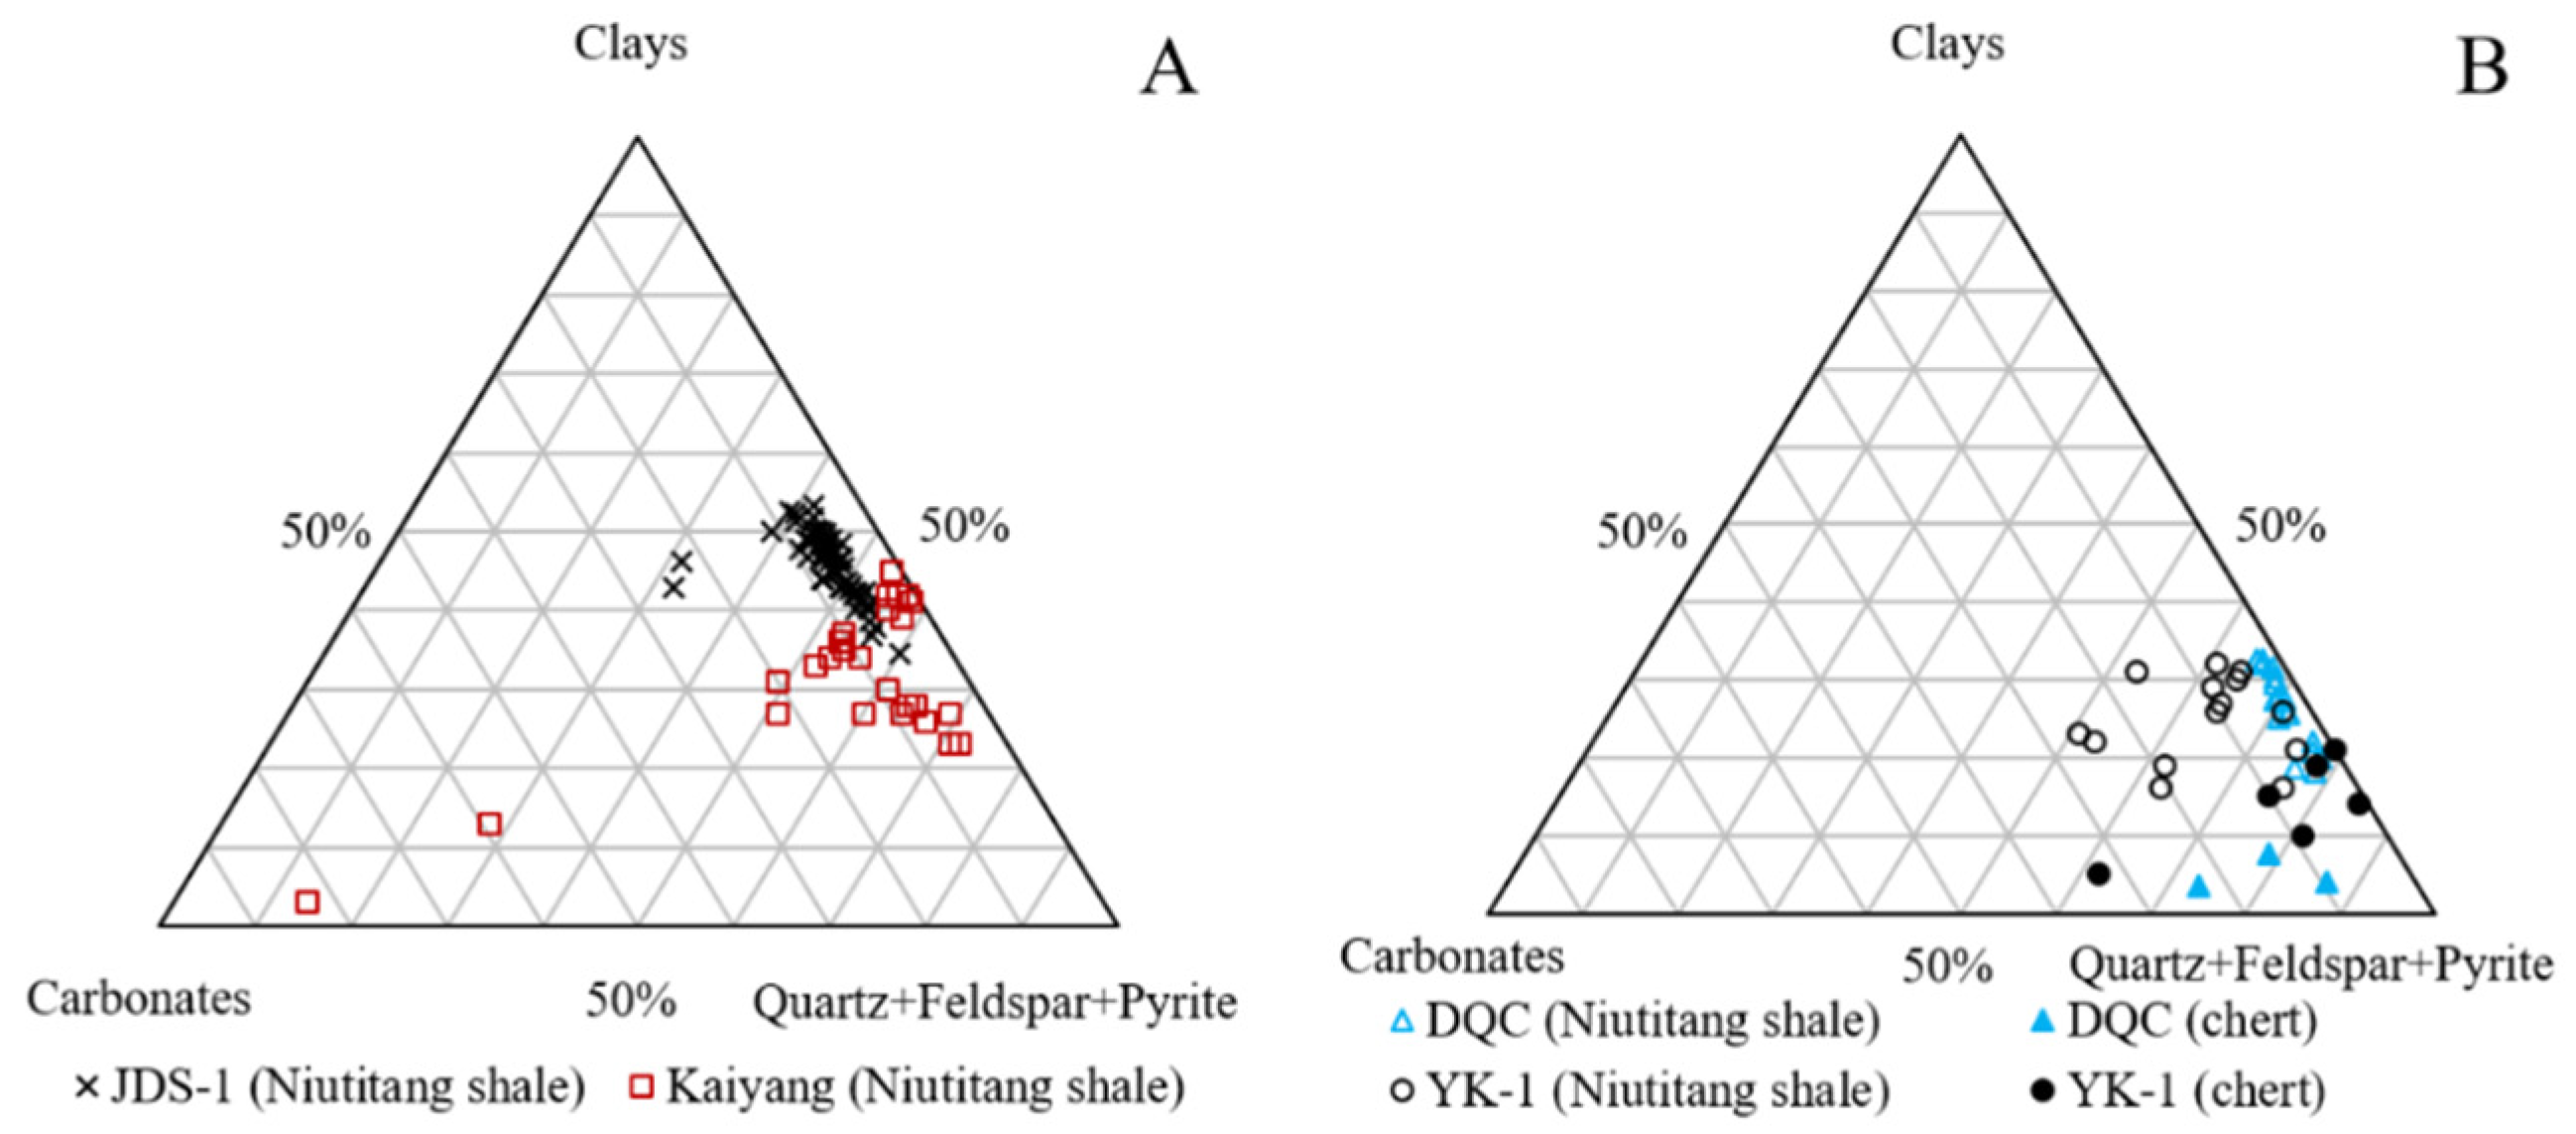
3.1.1. Geochemical Characteristics of the Niutitang Shale in the Jingdingshan Section (JDS-1 Well)

The TOC values of the Niutitang shale in the JDS-1 well range from 0.03–5.42 wt.% (Table 1). The TOC values of the Niutitang shale increase downward in the stratigraphy (Figure 3). The organic-rich shale interval (TOC >2.0 wt.%) is approximately 20 m (~66 ft) thick, with an average TOC value of 3.2 wt.%. The organic matter (OM) in the Niutitang shale is mainly composed of amorphous OM (95%). The RmcRo% values range from 3.63–3.75% (Table 1), suggesting that the Niutitang shale is overmature.
In the JDS-1 well, the brittle minerals (quartz, feldspar, calcite, dolomite, and pyrite) of the Niutitang shale samples range from 46.8–65.5%, with an average of 54.1% (Table 2). In addition, quartz is dominant among the brittle minerals (11.4–42.0%, average 25.1%), followed by feldspar (12.8–22.9%, average 19.0%). The carbonate contents range from 3.4–24.9%, with an average of 6.4%. Calcite is dominant in the carbonates, and its concentration decreased from 61 m (~200 ft) to the bottom (80 m, ~262 ft) of the shale interval (Figure 3). The clay contents range from 34.5–53.2%, with an average of 43.9%.
In the compositions of the major oxides (Table 3), SiO2 is the most abundant of all oxides, followed by Al2O3. In the JDS-1 well, SiO2 content in the organic-rich Niutitang shale interval ranges from 55.05–65.20%, with an average of 58.12%. Al2O3 content in the same interval ranges from 10.76–16.89% (average 14.30%) and decreases gradually.

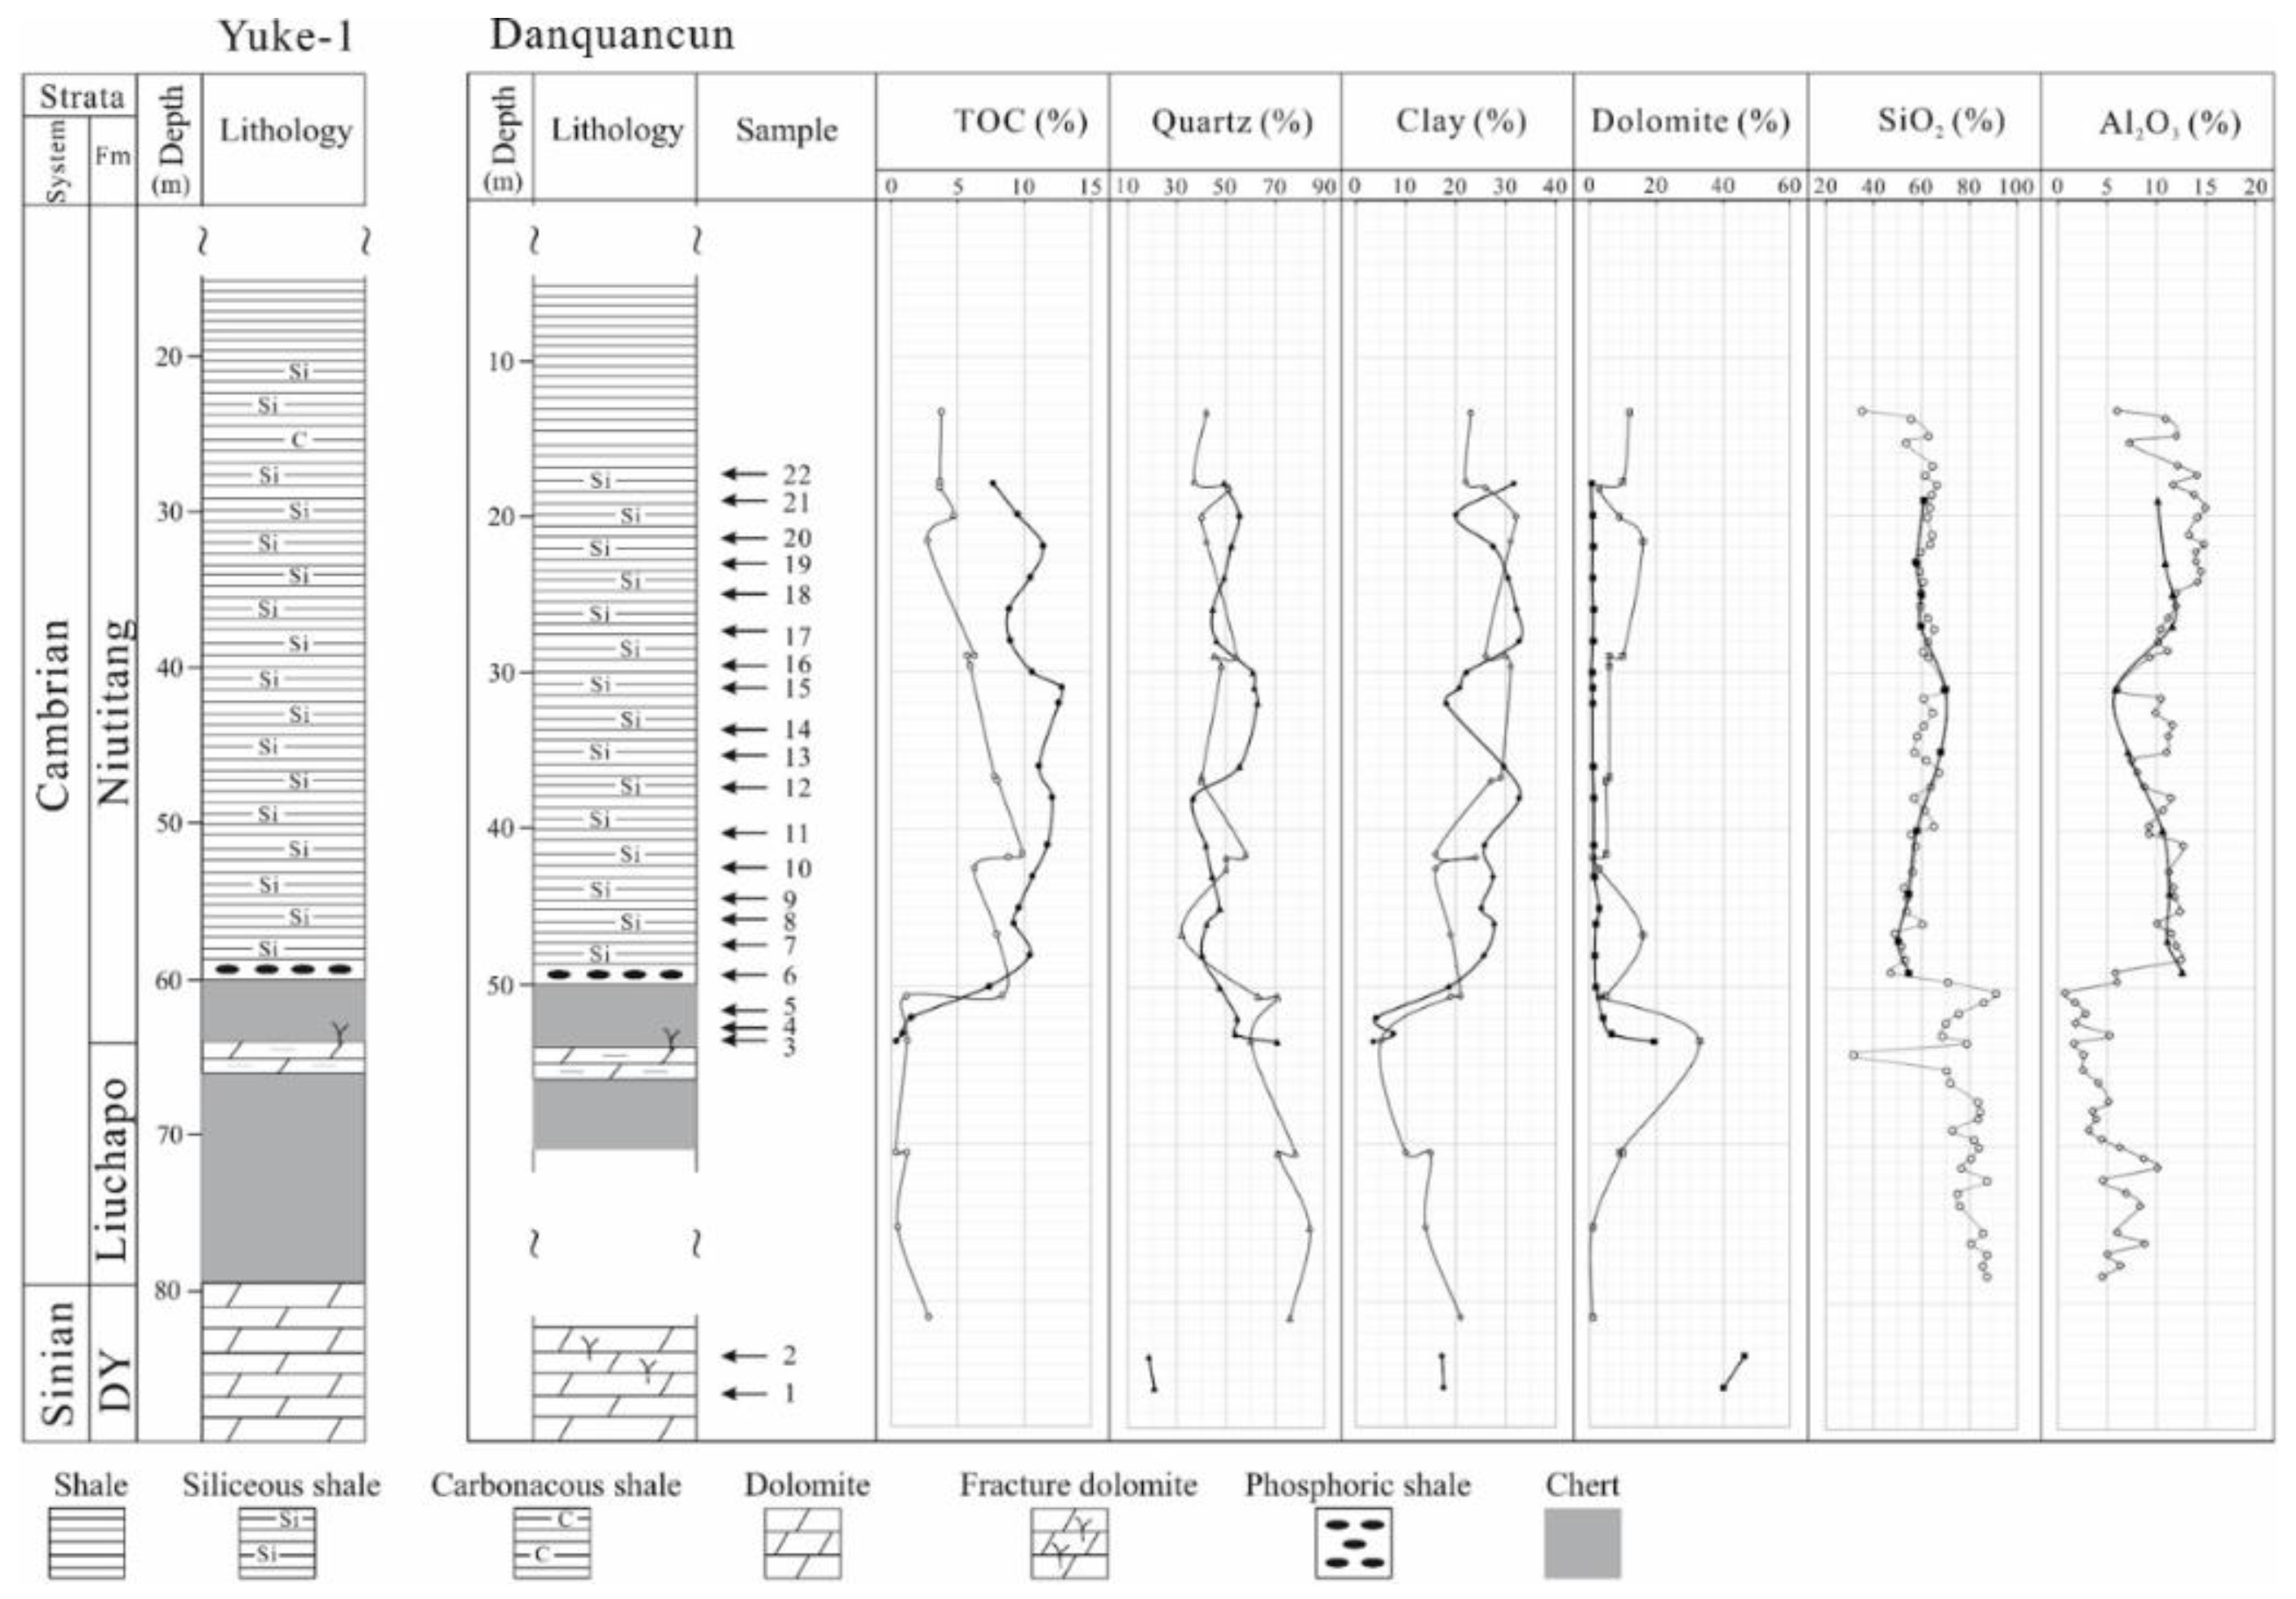
3.1.2. Geochemical Characteristics of the Niutitang Shale and Chert in the Danquancun Section

In the Danquancun section, the TOC values of the Niutitang shale and chert range from 7.33–12.77 wt.% and 0.36–1.51 wt.%, respectively. The δ13C values of the bulk OM in the Niutitang shale samples range from −31.8‰ to −31.2‰ (Table 1). The RmcRo% values vary within the range of 3.54–3.81% (Table 1), suggesting that the Niutitang shale is overmature.
For all 17 Niutitang shale samples in the Danquancun section (Table 2), the brittle minerals are dominated by quartz (36.7–62.8%, average 48.6%). The feldspar contents range from 9.0–26.1%, with an average of 15.8%. The carbonate contents range from 1.3–5.4%, with an average of 2.6%. The average pyrite content is 6.7%. The clay contents range from 18.1–32.7%, with an average of 26.3%. Two ternary diagrams were used to show mineral compositions of the Niutitang shale in both the Jindingshan and Danquancun sections, respectively (Figure 4). Remarkably, the mineral compositions from the Niutitang shale in these sections were different. The brittle mineral contents of the Niutitang shale in the Danquancun section exceeded those in the JDS-1 well. In addition, in the YK-1 well [22,32] and the Danquancun section, the brittle mineral contents of the chert exceeded those of the Niutitang shale.
In the Danquancun section, the compositions of the major oxides are consistent with the mineral compositions (Table 2 and Table 3). SiO2 and Al2O3 contents of the Niutitang shale range from 50.20–69.85% (average 59.35%) and 5.89–12.64% (average 10.30%), respectively. Figure 5 shows the mineral compositions and major element data of the Niutitang shale and chert, the Liuchapo Formation chert from the YK-1 well [22], and the Danquancun section. The major elements of the Niutitang shale in these sections exhibit remarkable vertical consistency, which indicates that the sedimentary facies and lithology of the Danquancun section and YK-1 well are similar from bottom to top. In addition, the chert samples from both the Liuchapo and Niutitang formations featured high SiO2 content and abnormally low Al2O3 content, indicating that the clay contents of chert samples are very low.

3.2. Petrophysical Properties of the Niutitang Shale and Its Floor

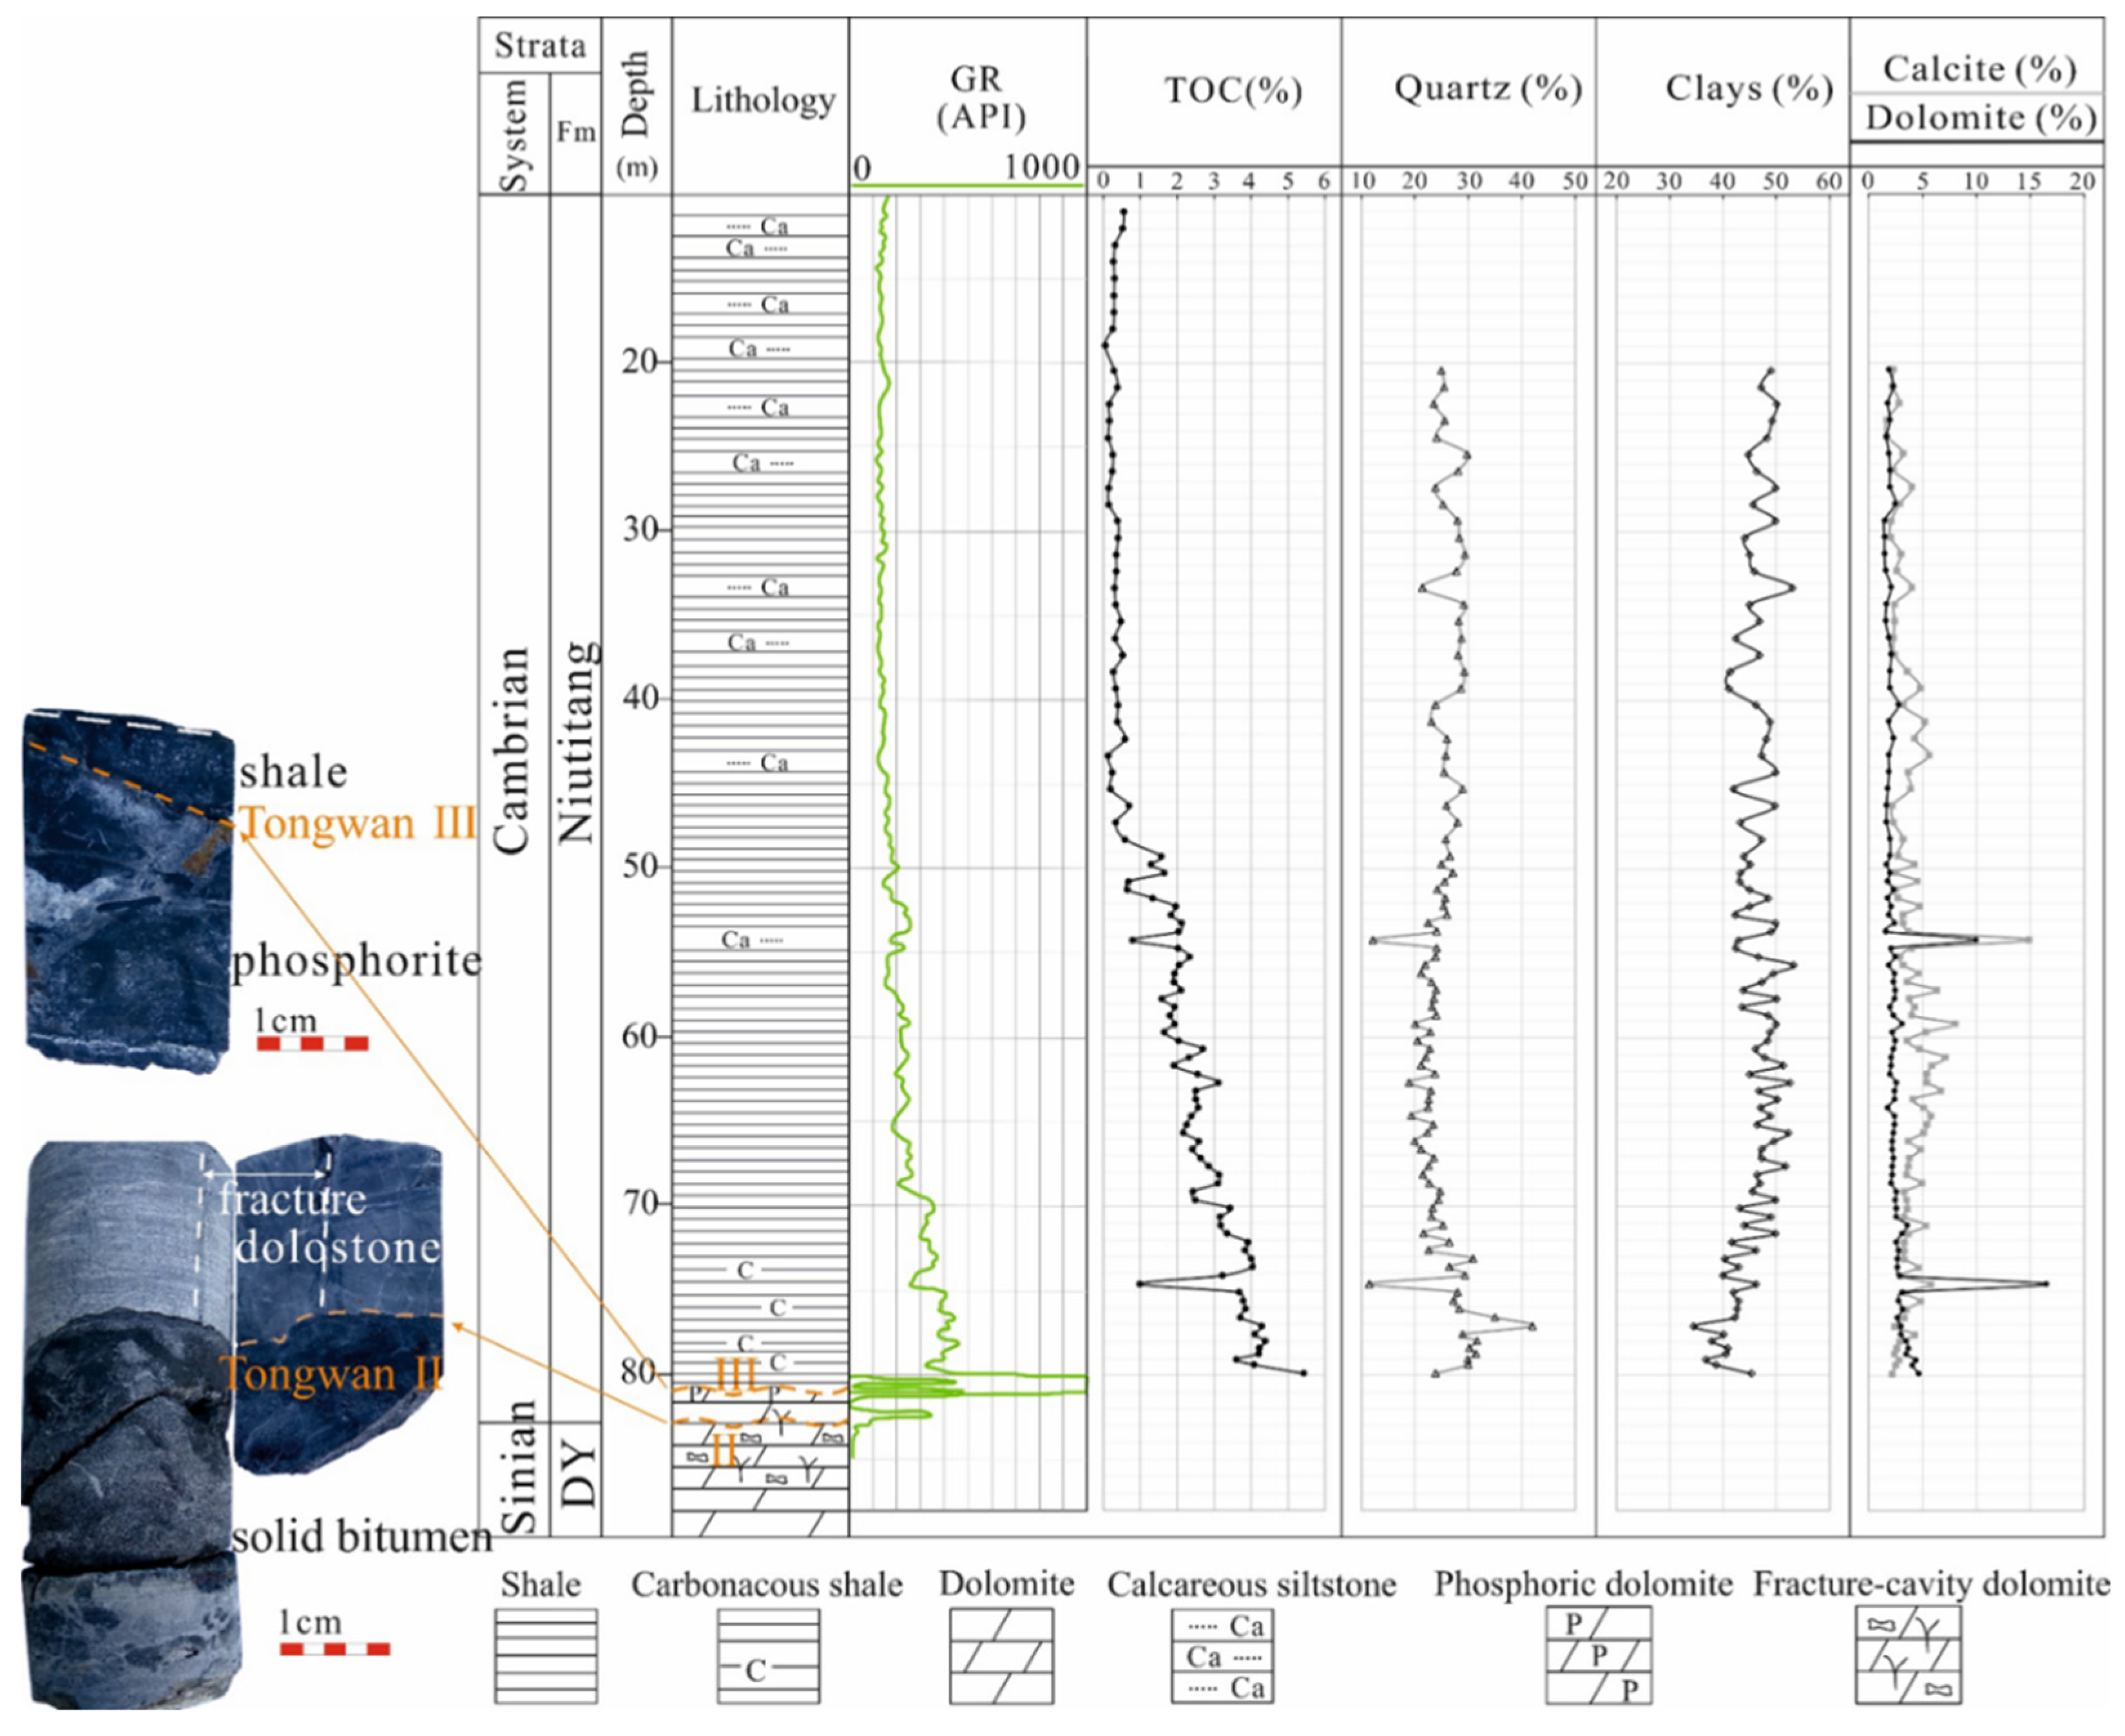
3.2.1. Petrophysical Properties of the Niutitang Shale and Its Floor in the Jindingshan Section

The MICP porosities of the Niutitang shale in the JDS well range from 0.62–2.18%. The mercury injection measurement indicates that all the Niutitang shale samples display a unimodal pattern of pore-size distribution (PSD) because the pore sizes are dominantly distributed within the range of 10–100 μm. The pores ranging from 50 nm to 10 μm in size were not developed and only a few mesopores were formed. As shown in Figure 6, mesoporosity (<50 nm, MICP porosity) is low and macroporosity (50 nm to 120 μm) is dominant, especially for the shale samples at the bottom of the Niutitang shale. This indicates that the closer to unconformity, the higher the porosity.
Table 2 shows the mineral compositions and petrophysical properties of the Niutitang shale in the JDS well, and the He porosity and permeability of the shale floor interval. The He porosity values of dolostone in both the Niutitang and Dengying formations range from 3.0–3.5% (average 3.3%). Except for the dolostone sample with visible fractures, the permeabilities of dolostones in the Niutitang and Dengying formations range from 1.19 × 10⁻³ to 1.48 × 10⁻³ mD. However, the permeabilities of the Niutitang shale range from 0.31 × 10⁻⁵ to 2.01 × 10⁻⁵ mD. Vertically, the permeability values of the dolostones developed in both the Niutitang and Dengying formations in the JDS-1 well are significantly higher than those of the Niutitang shale. The differences in the average permeabilities of the dolostones and shales are approximately two orders of magnitude (Figure 6). Therefore, the dolostone floor could be an effective transportation layer for hydrocarbon expulsion from the Niutitang shale in the Jindingshan section. In addition, the permeability of the fractured dolostone sample is the highest (0.0126 mD), which is beyond the scope of the chart (indicated by the arrows).
The isotherm shapes of the Niutitang shale samples in the JDS-1 well were almost the same, with a narrow hysteresis and similar absorbed gas quantities at high relative pressure (P/P0 = 0.995; the ratio of adsorption gas pressure [P] to saturation pressure [P0]) (Figure 7A–D). This suggests that the Niutitang shale contains mainly slit-like pores, and the Niutitang shale samples have fewer mesopores regardless of TOC, relative to the Wufeng-Longmaxi shale in the Upper Yangtze block [43]. However, the hysteresis loops of the Niutitang shale in the Danquancun section are relatively large and their turning points are evident, similar to the H2 type loops (Figure 7E–H). It indicates that the Niutitang shale samples in the Danquancun section contain relatively more ink-bottle-shaped pores.
The pore volume and specific surface area of the shale samples calculated from the adsorption isotherms using the NLDFT method are shown in Table 4. In JDS-1, the total pore volume (Vtotal) and total specific surface area (Stotal) values of the organic-rich Niutitang shale interval ranged from 16.5–24.6 × 10⁻³ cm3/g (average 19.2 × 10⁻³ cm3/g) and 16.0–23.7 m2/g (average 18.6 m2/g), respectively. Vertically, the specific surface area and pore volume of the Niutitang shale samples increases as TOC increases at depths ranging from 10–55 m. However, this trend is not obvious for a shale interval above the unconformity (approximately 25 m thick) (Figure 6), at depths ranging from approximately 55–80 m. The specific surface area and pore volume of the Niutitang shale samples do not increase with TOC values at this depth range.
The curve of parameter dV/d (log [D]) (partial volume V of each pore diameter D) is effectively used to display the distribution of the mesopore and macropore volume of shale samples [43,45]. Figure 8 shows the PSDs of the Niutitang shale and chert samples in the Jindingshan and Danquancun sections determined via the Barrett-Joyner-Halenda (BJH) method, assuming Harkins-Jura’s thickness equation model, which was calculated based on the N2 adsorption branch of the isotherms. In JDS-1 well, little change is observed in the mesopores of the Niutitang shale samples regardless of the variations in TOCs (Figure 8A). The Niutitang shale samples with relatively high TOC are characterized by slightly higher pore volume, especially the pore size ranging from 2–10 nm (Figure 8A).
After processing via Ar ion-beam milling, the nature of the pore system of the shale samples was studied using FE-SEM. Figure 9 shows the details of the Niutitang shale in JDS-1 well (e.g., JDS-75b: TOC = 3.68 wt.%, clay = 41.9%, quartz = 28.0%). There are very few organic pores in certain blocky OM grains, and these pores exhibit poor connectivity (Figure 9A,B). Most blocky OM grains are usually in direct contact with detrital mineral particles and lack visible organic pores (Figure 9C,D). However, the OM patches, occurring in framboidal pyrite or between framboidal pyrite particles, are rich in various types of mesopores and macropores (Figure 9E,F). In addition, the corrosion pores in carbonate minerals are large (micrometre scale) and exhibit remarkable local connectivity (Figure 9G,H).

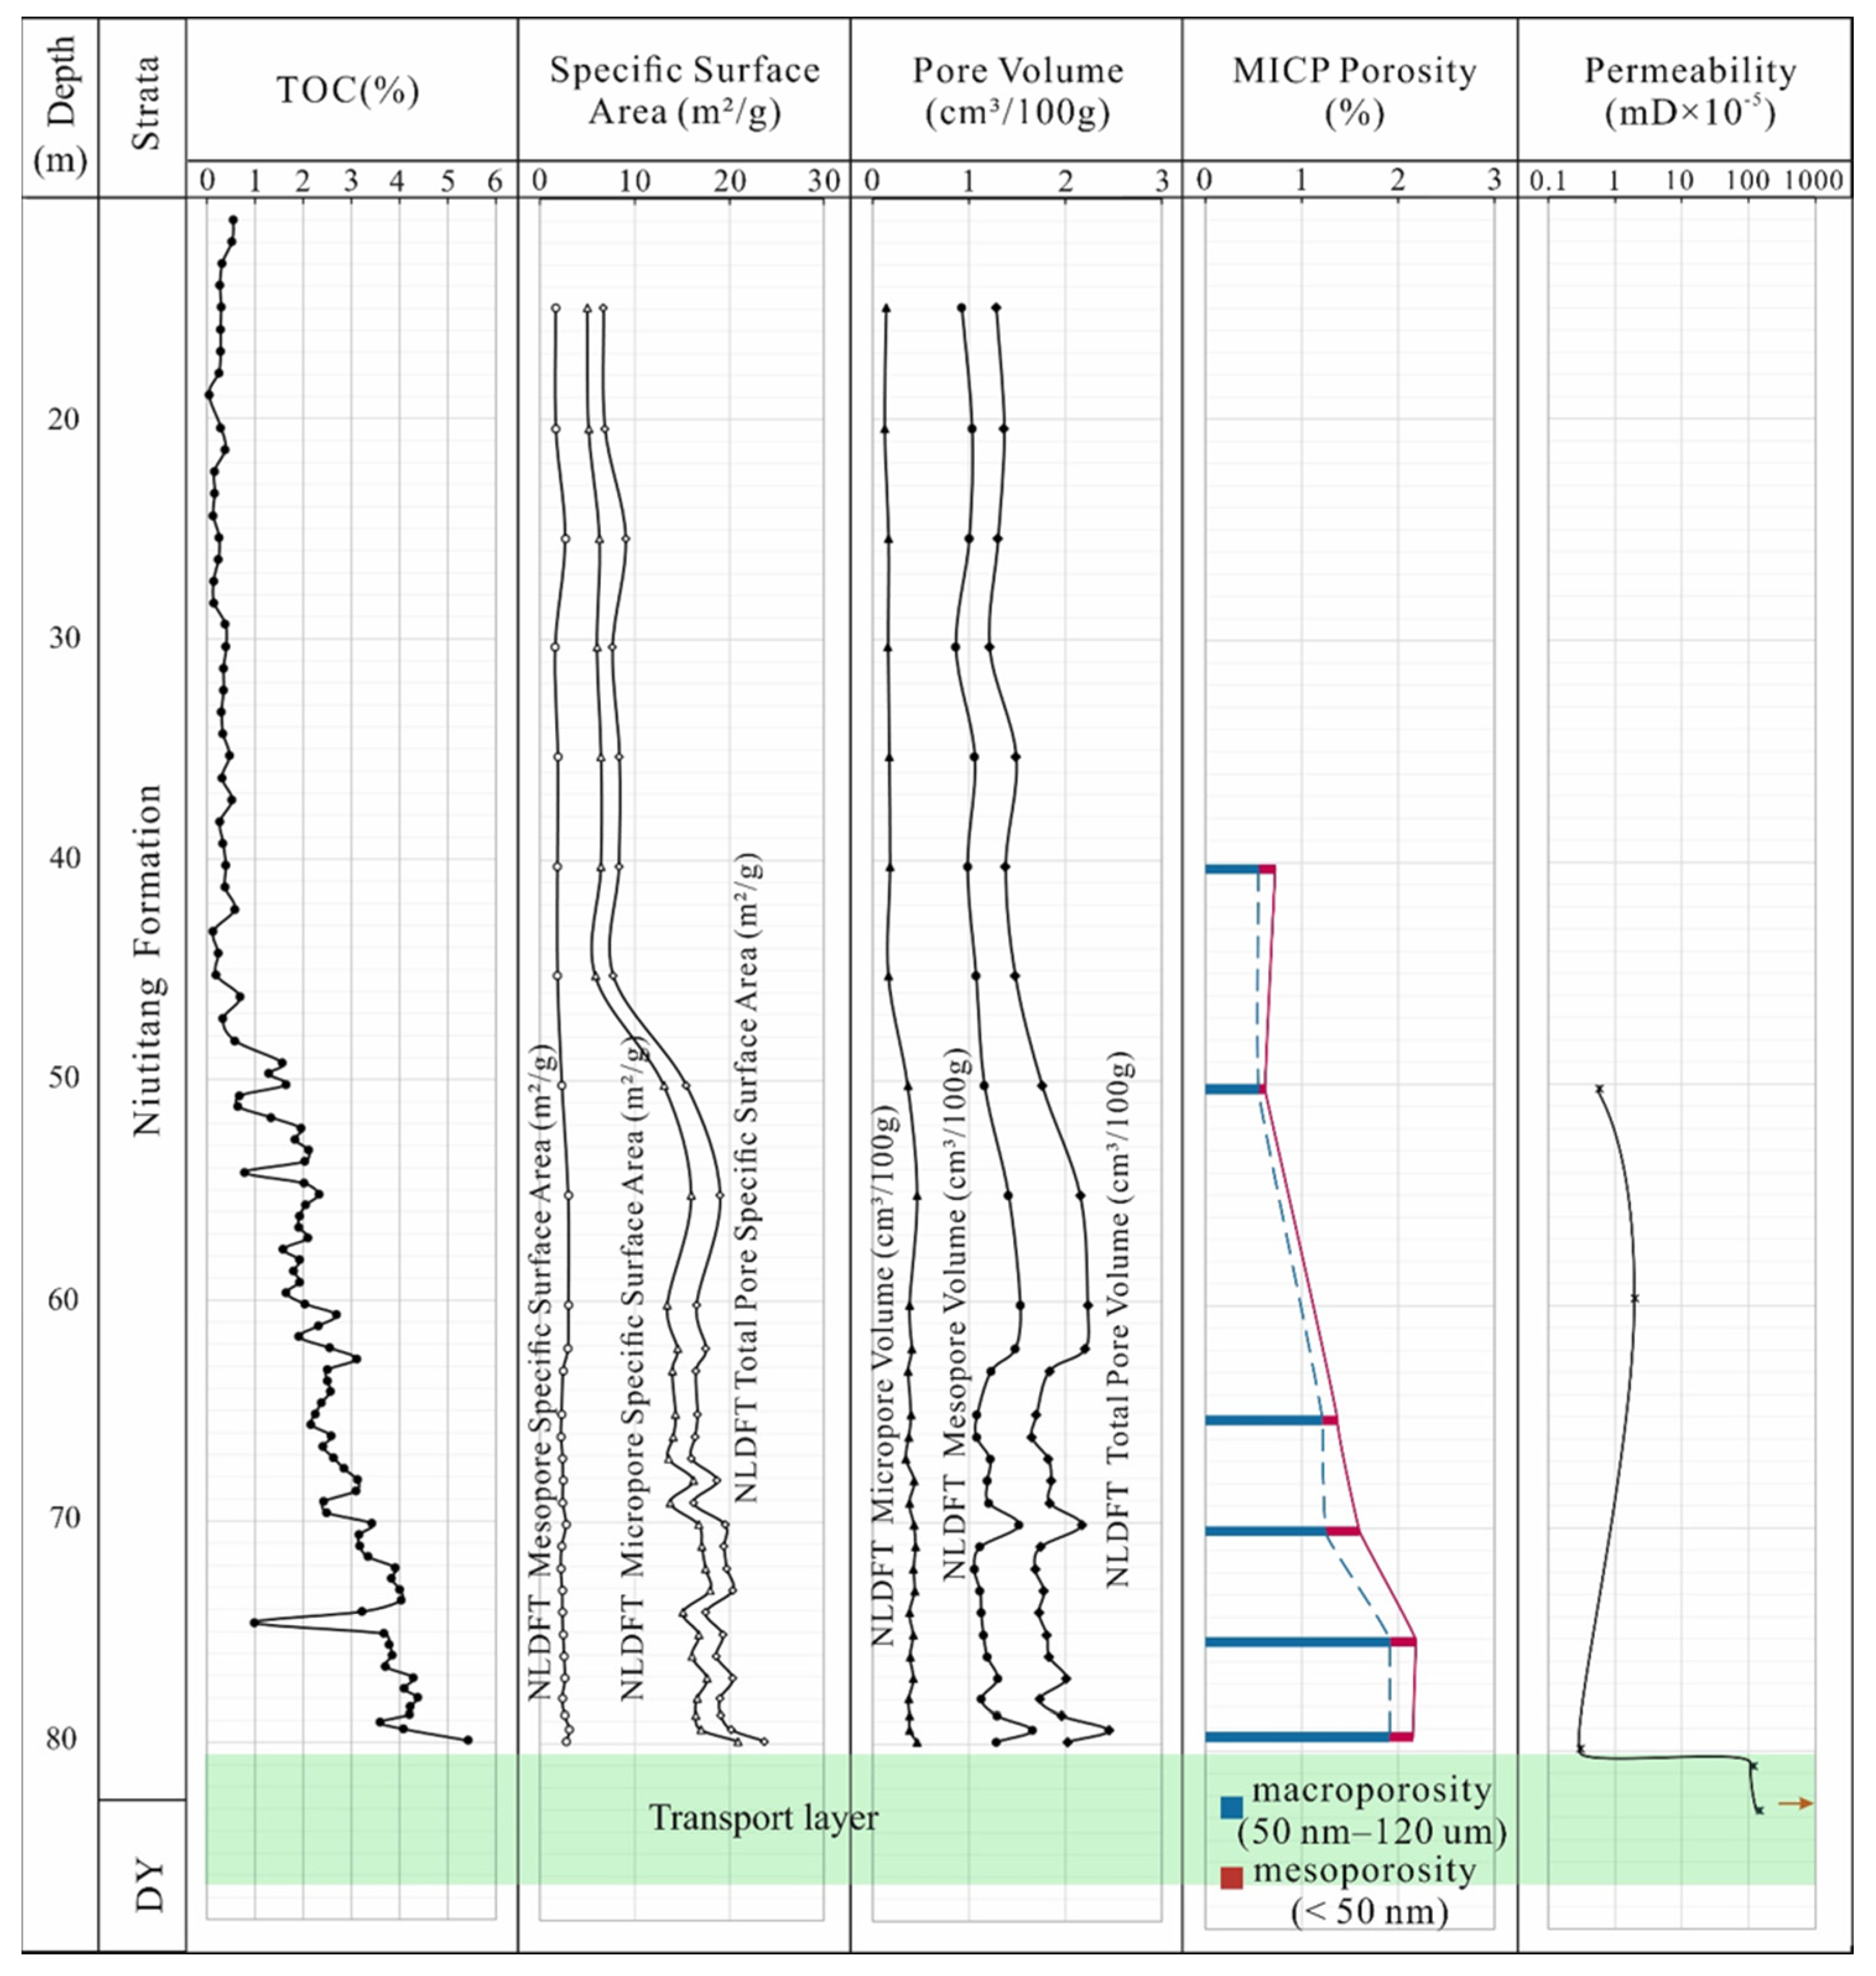
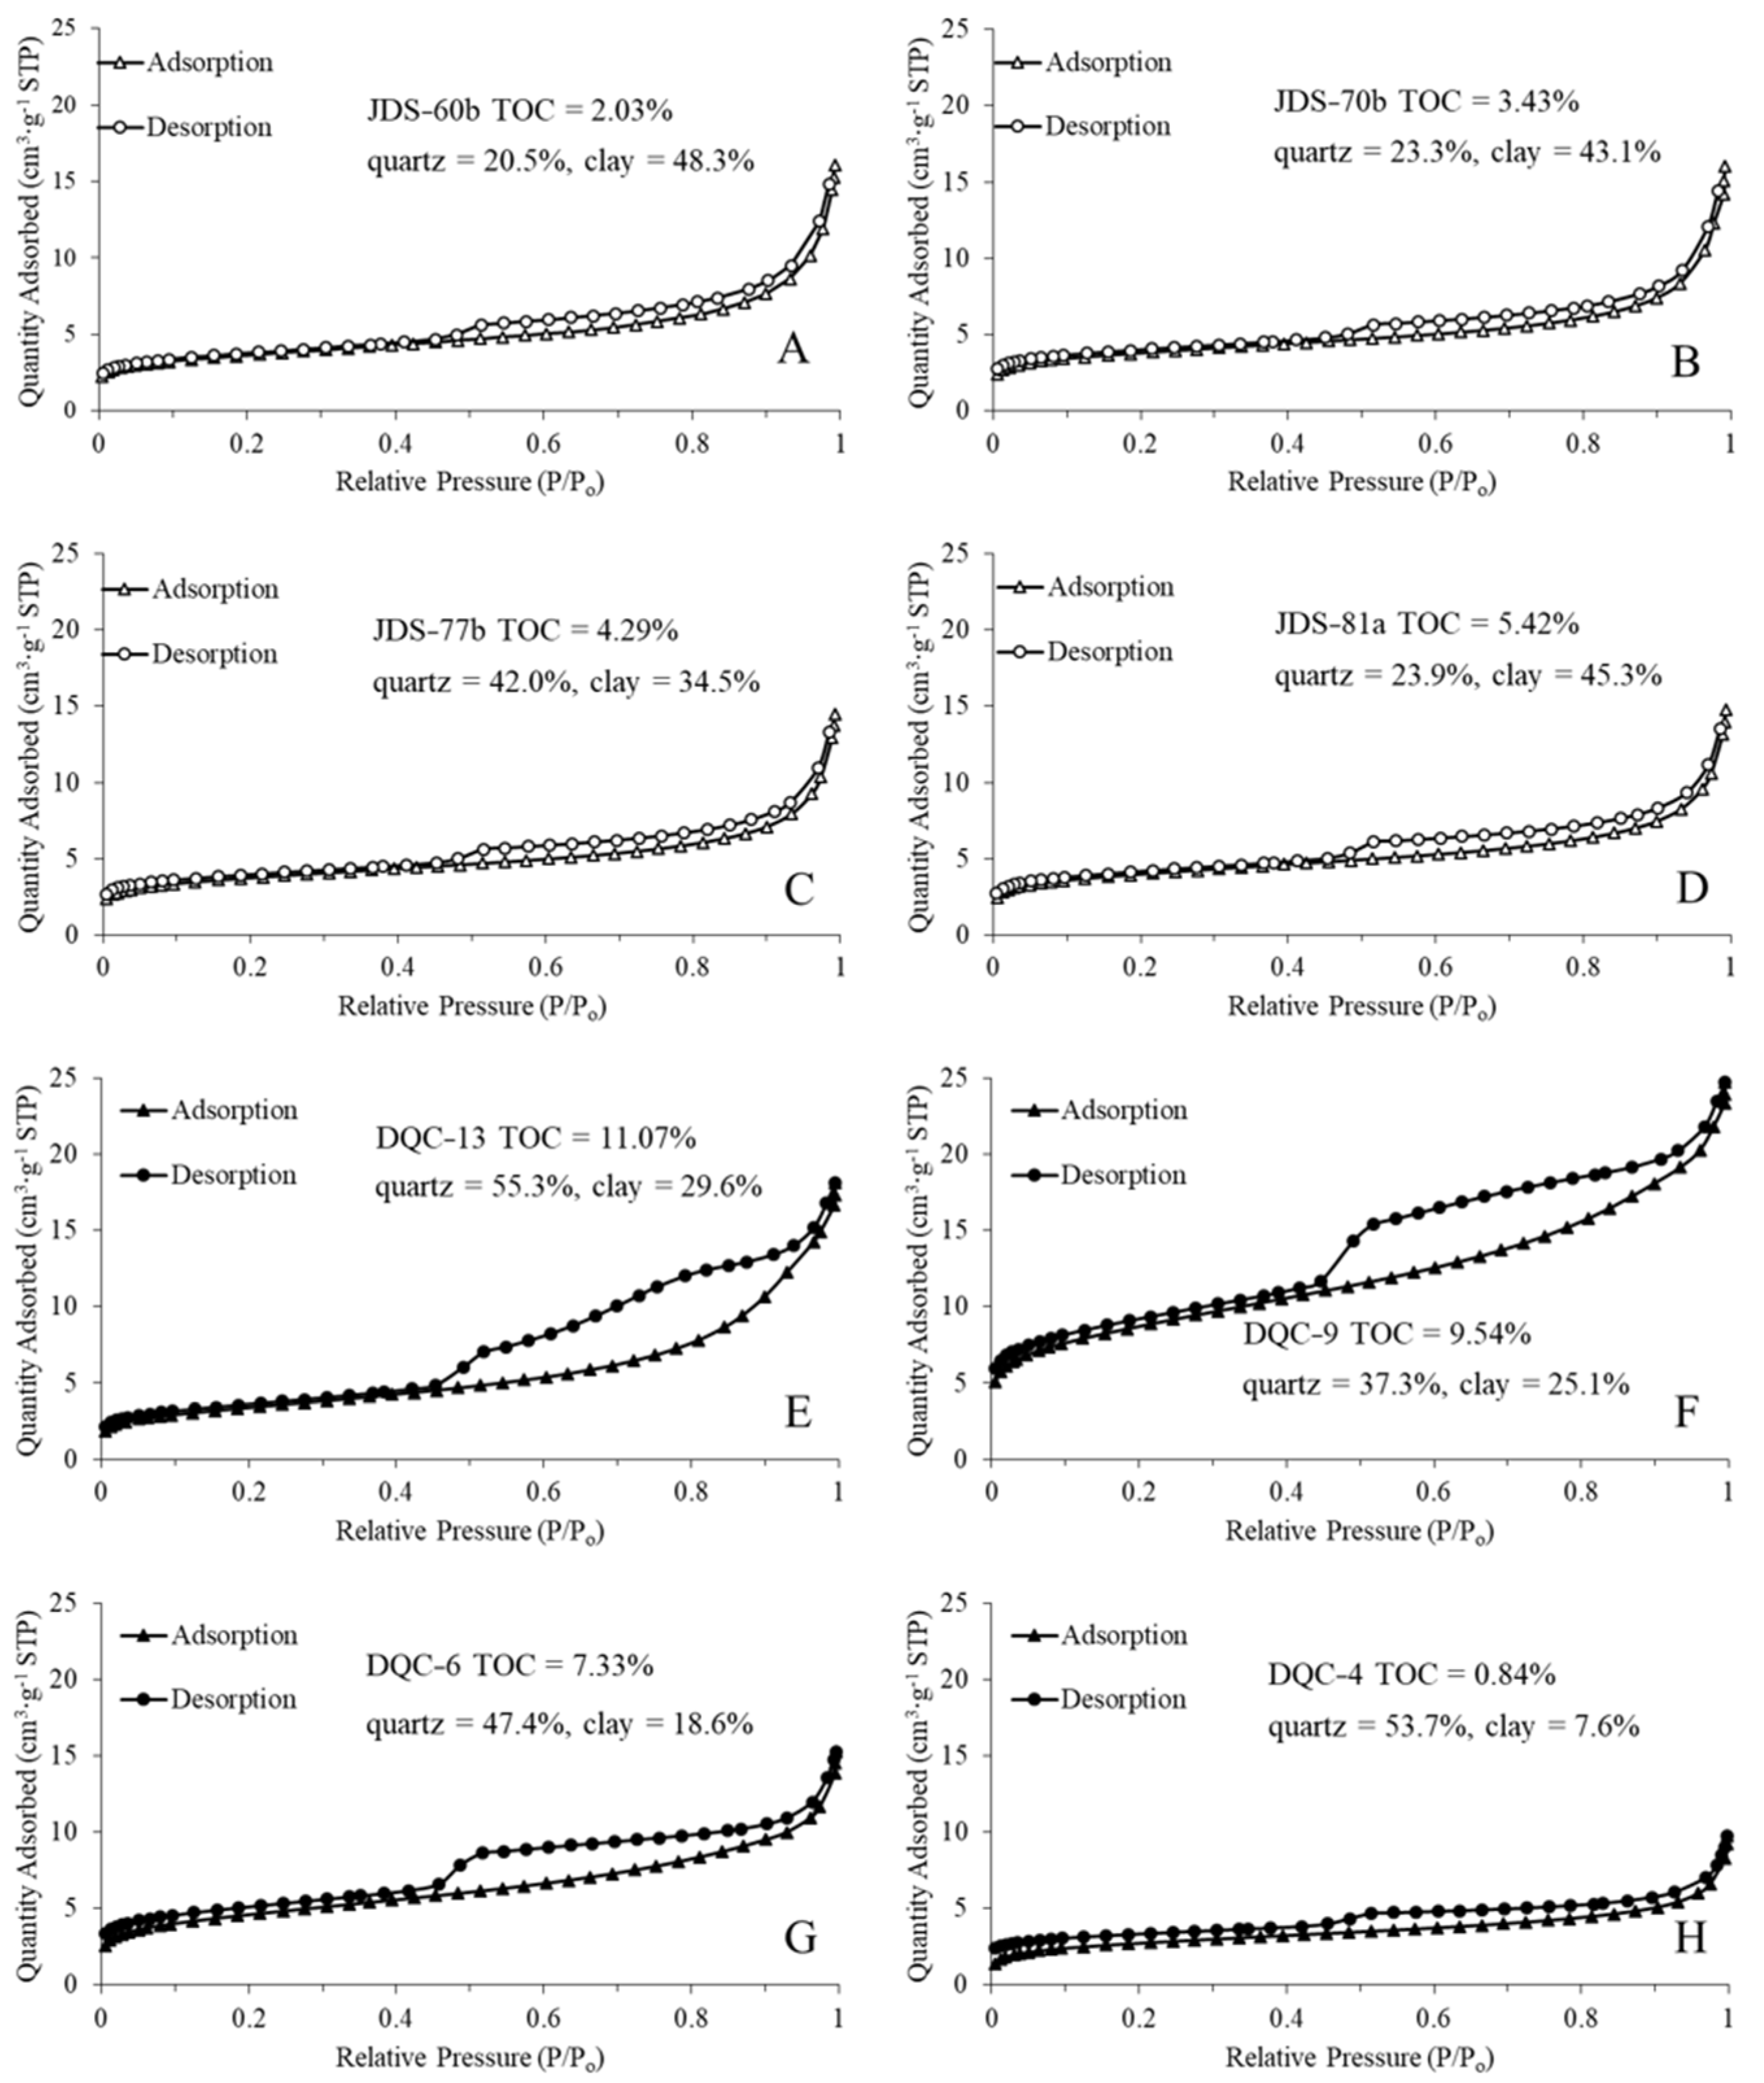
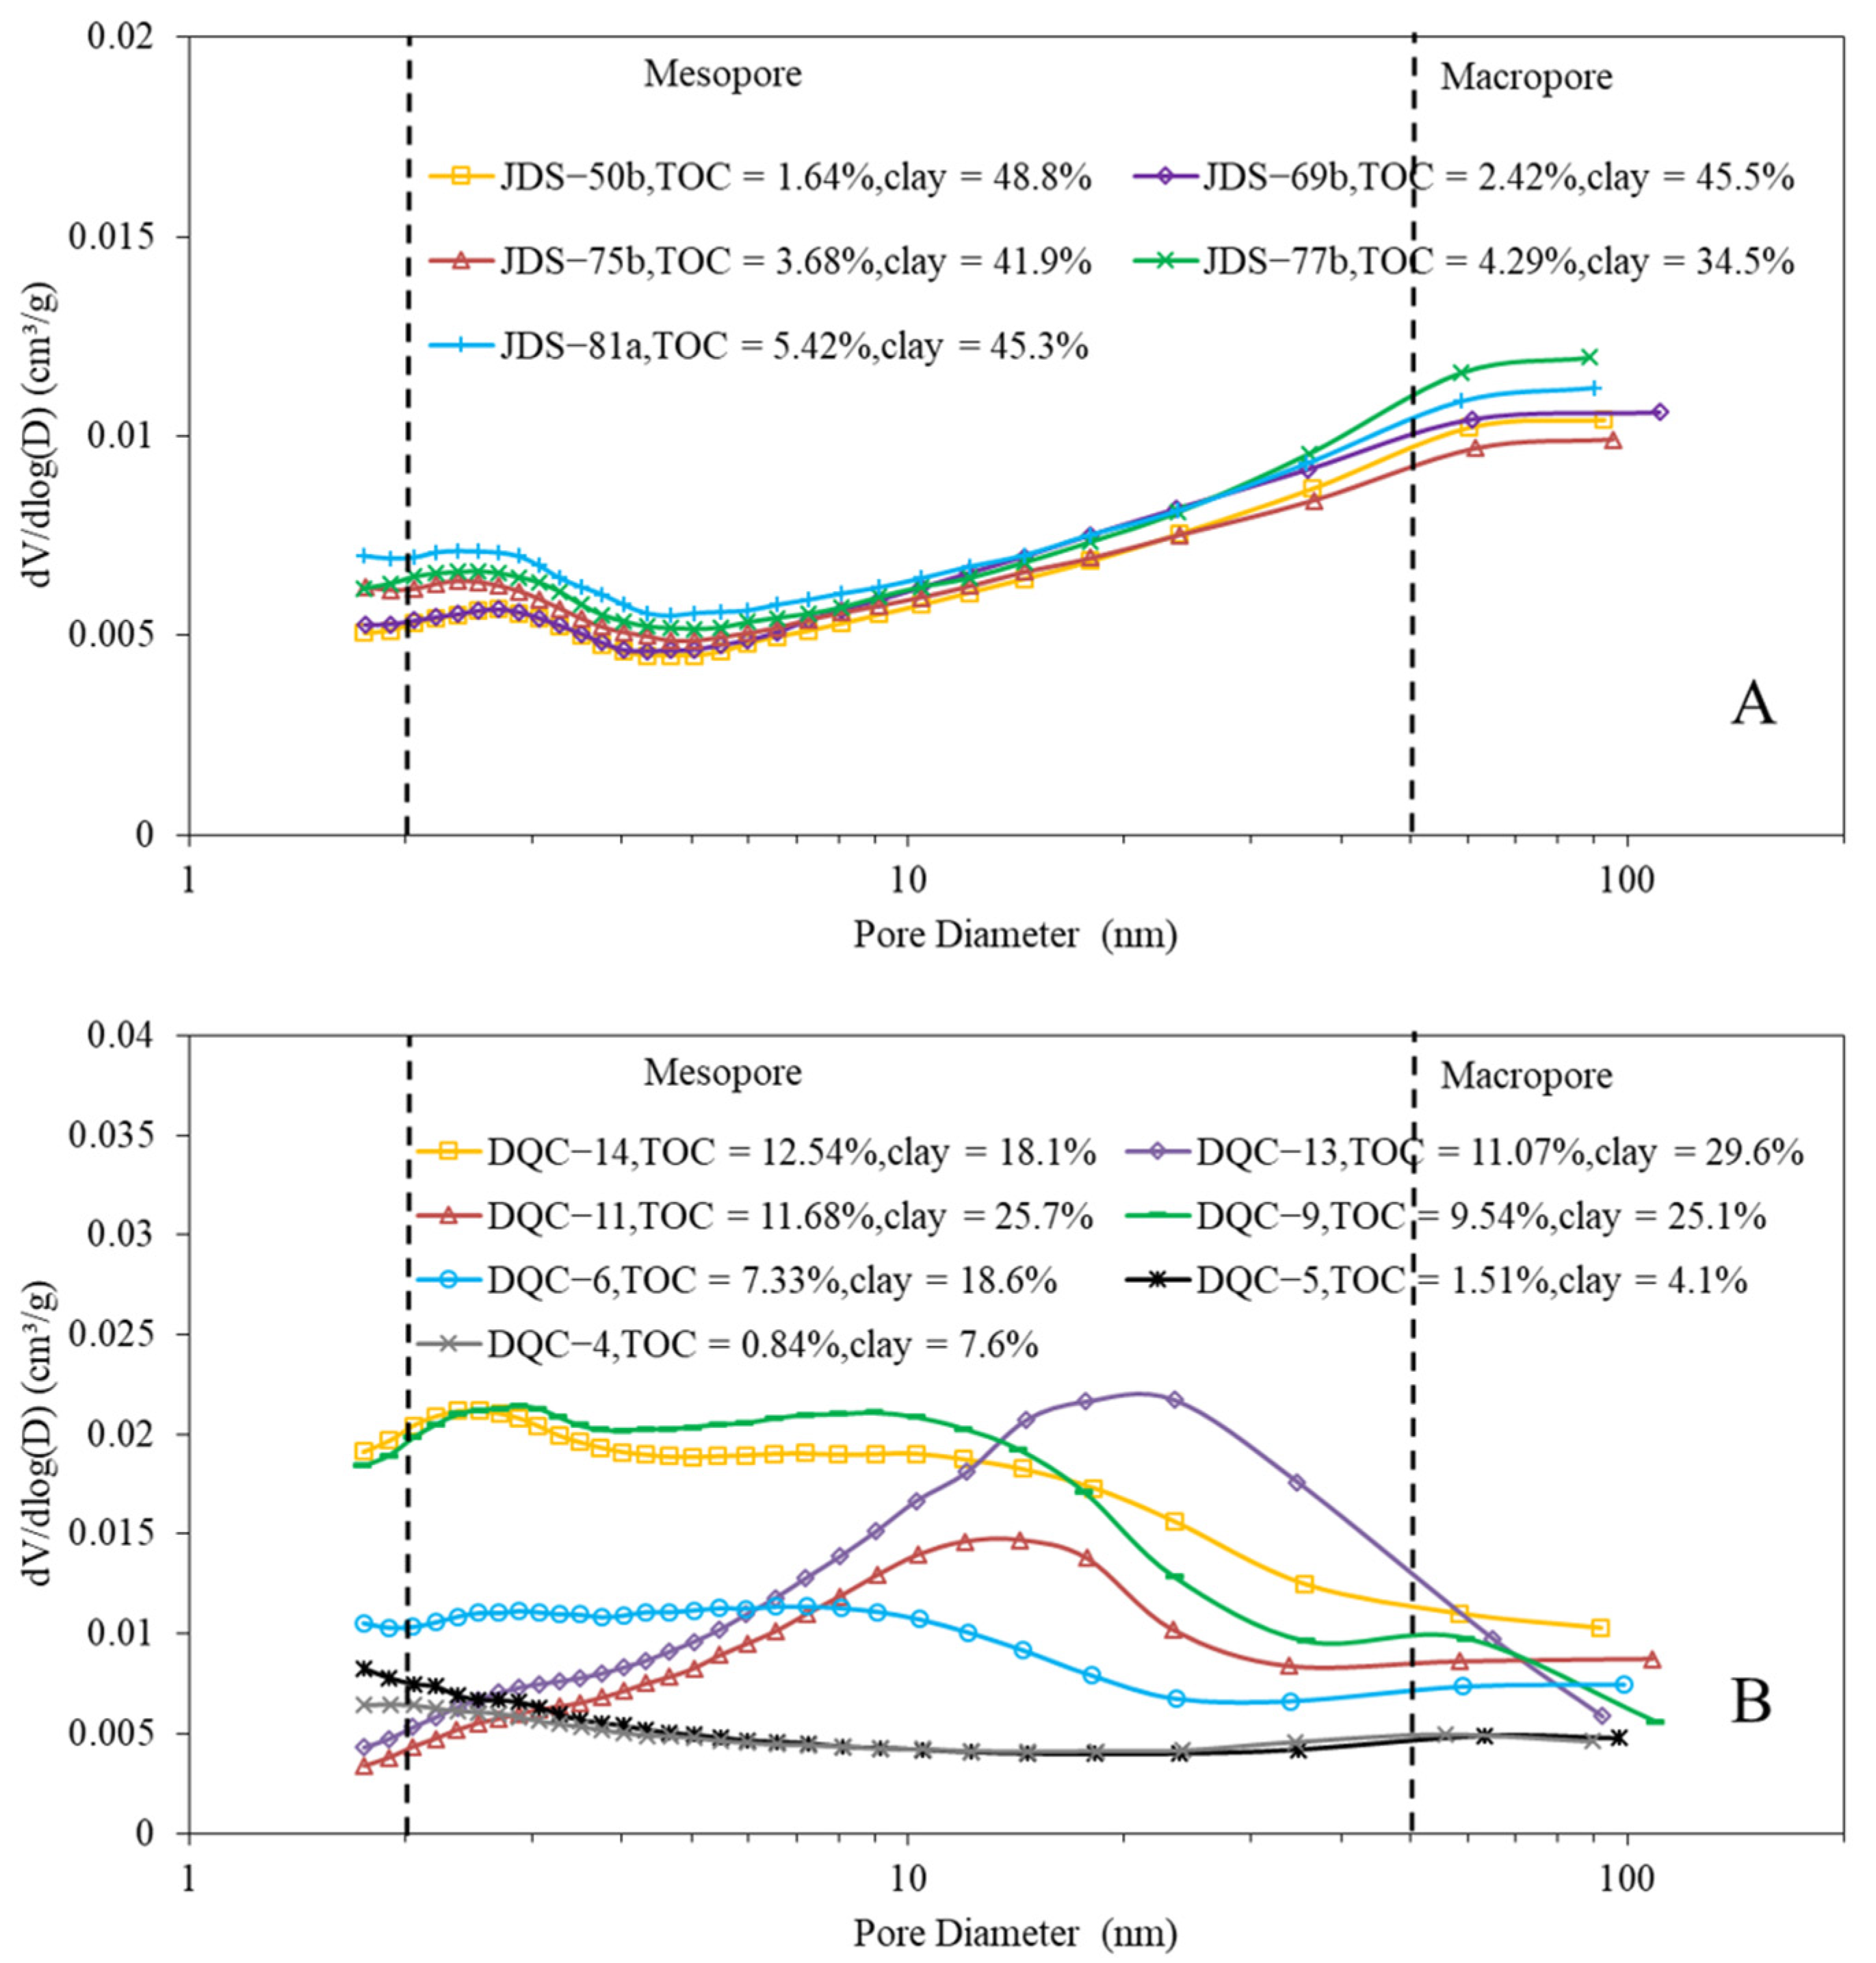
3.2.2. Petrophysical Properties of the Niutitang Shale and Its Floor in the Danquancun Section

In the Danquancun section, He porosities of shales, cherts in the Niutitang Formation, and dolostones in the Dengying Formation range from 2.99–5.36%, 2.52–3.17%, and 2.39–3.81%, respectively (Table 2). Except for the chert samples with visible fractures, the permeabilities of shales, cherts in the Niutitang Formation, and dolostones in the Dengying Formation range from 6.86 × 10⁻⁵–7.27% × 10−5 mD, 0.80 × 10⁻⁵–0.99% × 10−5 mD, and 1.50 × 10⁻⁵–1.73% × 10−5 mD, respectively. Accordingly, He porosities of the underlying cherts and dolostones are slightly lower than those of the Niutitang shale, but the permeabilities of the chert and dolostone in the floor interval are significantly lower than those of the Niutitang shale (Figure 10). Therefore, the dense floor interval, especially the chert, may act as an effective barrier layer hindering hydrocarbon expulsion from the Niutitang shale. In addition, the permeability of the fractured chert sample is the highest (0.0183 mD), which is beyond the scope of the chart (indicated by the arrows). It may suggest that fractures in floor strata may have a significant effect on the preservation conditions of shale gas.
The Vtotal and Stotal values of the organic-rich Niutitang shale interval (TOC ≥ 2.0%) range from 19.1–35.8 × 10⁻³ cm3/g (average 26.7 × 10⁻³ cm3/g) and 18.4–39.8 m2/g (average 28.3 m2/g), respectively (Table 4). Therefore, both Vtotal and Stotal values of the Niutitang shale in the Danquancun section are significantly higher than those of the Jindingshan section. However, in both YK-1 [32] and the Danquancun section (Table 4 and Figure 10), the Vtotal and Stotal values of the chert samples are significantly lower than those of the shale samples. In addition, in the Danquancun section, the PSDs of the Niutitang shale samples are more diverse than those of the chert samples (Figure 8B). As shown in Figure 8, the PSDs of the Niutitang shale in the Danquancun section are more diverse than those of the Niutitang shale in the Jindingshan section.
Figure 11 shows the details of the Niutitang shale under FE-SEM (e.g., DQC-9: TOC = 9.54 wt.%, quartz = 47.3%, clays = 25.1%, excess SiO2 = 19.45%). The pore space among detrital mineral grains was filled with aggregates of authigenic microcrystalline quartz and blocky OM grains (Figure 11A). The pyrobitumens filled in aggregates of authigenic microcrystalline quartz show various pore types of mesopores and macropores, but these organic pores continue to exhibit poor connectivity (Figure 11B–D). Certain blocky OM grains lack visible organic pores (Figure 11D).

4. Discussion

4.1. Hydrocarbon Expulsion from the Niutitang Shale in the Central Guizhou Uplift

The Central Guizhou Uplift controlled the hydrocarbon accumulation of the Sinian-Lower Paleozoic strata in northern Guizhou and adjacent areas [18]. The coarse-grained dolomite cement in the dissolution pores of the Dengying Formation in the Songlin section was associated with pyrobitumen [46]. The 87Sr/86Sr ratio value of the coarse-grained dolomite cement was similar to that of the Niutitang shale, indicating that the overlying Niutitang and Dengying formations were connected [46]. The extensive occurrence of pyrobitumen in the dissolution pores of the Dengying Formation also suggests that the sealing capacity of the Dengying Formation as the floor interval of the Niutitang shale system is poor. In fact, the Dengying porous dolostone was commonly considered to be a good reservoir rock. Based on the homogenization temperature of fluid inclusions, Yang et al. [18] reported that the Dengying Formation in the northern Guizhou area experienced three hydrocarbon accumulation stages, including middle-late Caledonian (470–428 Ma), Indosinian (252–228 Ma), and early Yanshanian (177–145 Ma).
Before the Yanshan movement, the northern Guizhou area had a similar sedimentary environment, covering very thick Paleozoic-Mesozoic strata [18]. Since the late Cretaceous (~97 Ma), the northern Guizhou area has been uplifted and denuded [18,47]. The height of the uplift and the thickness of erosive nature in the southeast of the Qiyueshan thrust fault were relatively larger than those in the northwest of the Qiyueshan thrust fault. For example, the burial depth of the top boundary of the Dengying Formation of Dingshan 1 well is 3490 m and that of Lin 1 well is 2580 m [18], whereas that of Jinye 1 well is 221.4 m [48] and that of JDS-1 well is 83.0 m. The Songlin dome structure is located on the northeastern margin of the Central Guizhou Uplift. The Songlin dome structure was an inheritable paleo-uplift. The Tongwan movement strengthened the uplift form of the Songlin dome structure [49]. In the Songlin dome structure, a part of the Dengying Formation is outcropped. Therefore, hydrocarbon generation and expulsion processes may be similar for the Niutitang shale between JDS-1 and Jinye 1 wells.
The cement periods, homogenization temperature of fluid inclusions, and maturity (equivalent vitrinite reflectance) of OM can be used to reconstruct the hydrocarbon accumulation and evolution history [18]. The maturities of the Niutitang shales (about RmcRo% = 3.75%) in the JDS-1 well were almost the same as those in Jinsha (average equivalent vitrinite reflectance: Roa = 3.77%, [18]). According to a previous study on fluid activity and hydrocarbon accumulation stages of the Dengying Formation in the Central Guizhou Uplift [18], the burial history of the JDS-1 well can be reconstructed. This suggests remarkable matching among the components and processes of the petroleum system. Therefore, hydrocarbon expulsion from the Niutitang shales in the JDS-1 well was likely to be highly efficient. First, long-term exposure and erosion of the Dengying Formation dolostone on the carbonate platform led to the widespread development of karst reservoirs in the Dengying dolostone [23]. There are two unconformities at the bottom of the Niutitang Formation in JDS-1 well. They corresponded to two phases of the Tongwan movements (Tongwan II and III (542–521 Ma)) (Figure 3). Unconformities could be an excellent transport layer for oil and gas migration [10]. The permeability of the shale floor interval, namely, the Dengying Formation dolostone, is two orders of magnitude higher than that of the Niutitang shale, and the fractured dolostone sample under the unconformities has even higher permeability (Figure 6 and Table 2). In brief, in the Songlin dome structure, the lithology sealing capacity of the floor interval of the Niutitang shale is limited by the unconformities and karstification in the underlying dolostone. As a result, oil generation-expulsion of the Niutitang shale could occur early and easily. The oil expulsion peak from type I source rock was reported to initiate at a relatively low maturity level of ~0.75% Ro [50,51]. Last but not the least, the Songlin dome trap was initially formed during Tongwan III [49] and the Central Guizhou Uplift trap was formed before the Late Ordovician [18,52]. Large-scale hydrocarbon generation and migration from the lower Cambrian Niutitang (Є1n) shale have been confirmed by geochemical analyses of bitumen and gas samples from a wide range of the Upper Sinian Dengying Formation (Z2dn), the lower Cambrian Mingxinsi Formation (Є1m), and the lower Cambrian Longwangmiao Formation (Є1l) reservoirs in northern Guizhou area and the Central Sichuan Basin area [3,5,18,46]. Therefore, the Niutitang shale deposited on the carbonate platform generally should have high hydrocarbon expulsion efficiency due to the unconformities (Tongwan II and III), poor lithology sealing capacity, well-developed karst reservoirs of the early traps (traps in the Songlin dome and the Central Guizhou Uplift) in the underlying Dengying Formation.
On the contrary, the Niutitang shale deposited on the carbonate platform marginal zone or continental shelf/slope should have low hydrocarbon expulsion efficiencies because the permeabilities of the underlying chert layers were significantly lower than those of the Dengying Formation dolostone (Figure 6). Therefore, the underlying dense chert successions primarily acted as an effective barrier layer hindering hydrocarbon expulsion from the Niutitang shale.

4.2. Variations in Petrophysical Property of the Niutitang Shales under Different Sedimentary Environments

In the Jindingshan section, pore volume and specific surface area values of the Niutitang shale samples at varying proximities from the unconformity between the Dengying Formation and the Niutitang Formation differ significantly. Although the Niutitang shale near the unconformity has relatively high TOC and high permeability, its pore volume and MICP porosities are likely to be lower than those of the upper shale with lower TOC (Figure 7). This may be attributable to the high hydrocarbon expulsion efficiency of the Niutitang shale near the unconformity. High hydrocarbon expulsion efficiency can usually lead to relatively low fluid pressure which could be conducive to the compaction of the residual organic pores (Figure 8).
Our data also provided certain clues for a more extensive evaluation of petrophysical property changes along with the carbonate platform-to-basin transect (A–A’). For example, in the Kaiyang section, due to the great thickness of the Niutitang shale, the vertical variations in petrophysical properties are more significant (Figure 12). Generally, the petrophysical properties of the Niutitang shale near the floor interval deteriorated in that the pore volume and specific surface area values were mostly below 10 cm3/mg and 5 m2/g, respectively [31]. Although the particle size of the shale samples standing for the Kaiyang section was different from the particle size of the shale samples from the JDS-1 well in our study, and the pore volume and specific surface area values were obtained only through nitrogen adsorption, the overall variation trend of the petrophysical properties of the Kaiyang and Jingdingshan sections is similar.
Significant differences are observed in the pore volume and specific surface area values of Niutitang shale and chert between the Yuke and Danquancun sections. In addition, the petrophysical properties (pore volume, specific surface area and permeability) of the Niutitang shale are more optimized than those of the chert (Figure 10). Furthermore, the chert and dolostone in the Liuchapo Formation, which are beneath the Niutitang shale (Table 2), are very dense and of low permeability. Their permeabilities (DQC-4 and DQC-5) are significantly lower than that of the Niutitang shale (DQC-9 and DQC-14). The floor rocks with low permeability are thought to be effective petroleum-resisting layers. Therefore, the Niutitang shale above the chert was likely to retain a large amount of oil at the mature stage, which may be the reason the organic nanopores of the Niutitang shale in the Danquancun section are more developed than those in the JDS-1 well.
In the Cen’gong section, although the petrophysical properties of the Niutitang shale and chert were not reported in their entirety, the shale gas content can partially reflect the petrophysical properties and preservation conditions of the Niutitang shale. The Niutitang shales in both Cenye-1 (CY-1) well and Tianxin-1 (TX-1) well were deposited on the continental shelf/slope. Owing to the poor preservation conditions of the CY-1 well (near structural fractures), its maximum shale gas content is lower than that of the TX-1 well [13]. Wang et al. [13] studied the continental shelf/slope of the Cen’gong section (TX-1 well), which represents a deep-water setting, compared to the carbonate platform of the Jindingshan section. Significant differences between the shale gas content of the Niutitang shale and chert were observed. Shale gas content of the Niutitang shale above the chert gradually increases as TOC values increase in both wells in the Cen’gong section (Figure 13), indicating that the pore volume/porosity of the Niutitang shale above the chert is mostly attributed to organic pores.
Along the carbonate platform-to-basin transect (A–A’) (Figure 2), the Niutitang shale near the unconformity usually features high porosity and permeability that are likely to be inferior to those of the upper shale, while the petrophysical properties of the Niutitang shale above the chert with low permeability are likely to be relatively more optimized.

4.3. Shale Gas Records in Northern Guizhou Area

Certain exploration wells for shale gas in the Niutitang Formation of the northern Guizhou area showed that the middle and lower parts of the Niutitang shale evidently featured shale gas and high desorption gas content, especially on the continental shelf/slope-basin [9]. The data of exploration wells (such as the buried depth of the Niutitang Formation and the average value of gas components) collected in the northern Guizhou area were reorganized (Figure 14). Along the carbonate platform-to-basin transect, the content of methane in the Niutitang shale increases gradually. For shallow-water facies inside the carbonate platform, such as the Suiye1 well, the composition of shale gas is as follows; nitrogen: 94.5–95.3%, methane: 3.9–5.0%, and carbon dioxide: 0.4–0.8%. The shale gas composition in Zhengye1 well is as follows; nitrogen: 57.3–65.4%, methane: 5.3–8.1%, hydrogen: 24.7–37.0%, and carbon dioxide: 0.4–1.8%. For the carbonate platform marginal zone, such as the Meiye1 well, the shale gas composition is as follows; nitrogen: 93.9–95.4%, methane: 4.4–4.8%, and carbon dioxide: 0.2–1.2% [9]. In Yucan9 well, the shale gas composition includes nitrogen: 73.8–94.9%, methane: 0.1–4.9%, and carbon dioxide: 1.2–21.3% [10]. However, in Maye1 well, methane is dominant (average 57.8%), followed by nitrogen (average 37.5%), and the content of other components is less than 5% [53]. On the continental shelf/slope, in the Cenye1 well, the methane content is more than 98% [33]. Because TX-1 well is farther from the fault than from CY-1 well, and its preservation conditions and shale gas content are more optimized than those of the CY-1 well [13]. The gas composition of the Niutitang shale in the TX-1 well is speculated to be similar to that of the CY-1 well.
Along the carbonate platform-to-basin transect (Figure 14), the methane content of the Niutitang shale increases gradually. This is probably related to the increasing sealing capacity of the shale floor interval. In the areas with more optimized sealing capacity, the overmature Niutitang shale deposited on the thick and dense floor interval has relatively high pore volume and the specific area, making it more likely to enrich shale gas.

4.4. Implications for the Evolution of Petrophysical Property and Shale Gas Prospect of the Overmature Niutitang Shale

An unconventional, continuous petroleum system consists of an accumulation of hydrocarbons that are mostly found in low-matrix-permeability rocks [54]. Previous studies mentioned that the oil and gas expulsion efficiency of the source rock is closely related to the OM type, maturity, and lithology [55,56,57]. At the over mature stage, mobile hydrocarbons in shale are predominantly composed of methane. Methane is commonly formed by the thermal cracking of OM trapped in shale, such as kerogen, bitumen, crude oil, light hydrocarbons, and wet gases [58]. The mobility of these hydrocarbons generated by kerogen in the oil generation window follows the order: methane > wet gases > light hydrocarbons > crude oil > bitumen, and the methane conversion rates in the gas generation window follow the order: wet gases > light hydrocarbons > crude oil > bitumen > kerogen [57]. The retention of more hydrocarbons in shale means more methane can be produced at the high maturity stage [57,59], and the shale could possibly contain a relatively high gas content.
Although the effect of retained oil richness on the commercial quality of the self-contained hydrocarbon resource system has been adequately demonstrated [54], little attention has been paid to the effect of the floor sealing capacity on hydrocarbon expulsion and retention in the shale reservoir. The Barnett Shale is a prodigious shale gas system owing to specific geological characteristics: (1) the Barnett shale gas system is sealed by limestone above and in some areas below the shale, (2) the hydrocarbon expulsion efficiency of the Barnett shale (approximately 60%) is lower than that of the conventional source rock, and (3) abundant crude oil was retained in the Barnett shale before the secondary cracking of OM [54]. Through a pyrolysis experiment, Liu et al. [60] showed that abundant bitumen can be left in the organic-rich shales if oil expulsion efficiency in the oil generative window is relatively low, and subsequently, hydrocarbon gas generation of the shale at high thermal maturity may be enhanced.
Although the lower Cambrian Niutitang shale is widely distributed in the Middle-Upper Yangtze Block (Figure 1A), most of it rests unconformably on the Precambrian Dengying dolostone reservoir and has undergone multiple tectonic movements. A high hydrocarbon expulsion efficiency resulting from poor floor sealing capacity, and good matching among the components and processes of petroleum systems, was favourable for oil and gas expulsion from the Niutitang Formation but not conducive to methane formation at the overmature stage [57,59]. In the area that had experienced complicated tectonic movements, the methane content of the Niutitang shale on the carbonate platform is generally low. In addition, organic pores within the Niutitang shale near the floor strata, which showed high permeability, are not developed. It is different from those in the upper shale or those above floor strata with low permeability in which organic pores are more developed. Furthermore, there are relatively few residual organic pores in the Niutitang shale in the Jindingshan section (Figure 8, deposited on carbonate platform), but relatively more residual organic pores can be observed in the Niutitang shale in the Danquancun section (Figure 10, deposited on carbonate platform marginal zone).
Compared with North American shales, marine shales in South China are generally characterized by old sedimentary age, relatively high maturity (mostly Ro > 2.0%), and have undergone multiple phases of uplift and/or subsidence processes and more intense tectonic activities [1,18,61]. Therefore, the shale gas prospect of overmature shale in South China is also closely related to the preservation conditions [3,43,62]. Inferior preservation leads to an interconnection between fractures, opened faults, or highly permeable layers (i.e., dolomite and chert containing fracture), which result in the leakage of shale gas [13]. In the complicated tectonism area, the methane content of the Niutitang shale is generally low. Although the lithology, thickness of the Niutitang shale, and floor interval between CY-1 and TX-1 wells are similar, in the CY-1 well, which is closer to the faults, the preservation conditions deteriorate. As a result, the gas content of the CY-1 well (less than 1.3 m3/t) is significantly lower than that of the TX-1 well (less than 2.8 m3/t) (Figure 13). In the relatively stable tectonic area, the preservation conditions of shale gas can also be characterized by the pressure coefficient. The area with a pressure coefficient exceeding 1.0 is usually the sweet spot area for shale gas exploration [7,63]. The Qiongzhusi shale deposited on the carbonate platform is dominated by the normal pressure coefficient. For example, the pressure coefficient of the Qiongzhusi shale in Weiyuan is mostly approximately 1.0, and the maximum value is 1.2. In addition, the pressure coefficient of the Niutitang shale around the Sichuan Basin is almost lower than 1.0 [3]. Therefore, the low-pressure coefficient of the Niutitang shale reservoir may be attributable to the high permeability and weak sealing capacity of the shale floor interval.
Basically, in the carbonate platform, the Dengying porous dolostone, which acts as the floor interval of the Niutitang shale, was exposed and eroded for a long time and two periods of unconformity were developed before the deposition of the Niutitang shale. As a result, the lithology sealing capacity of the Dengying porous dolostone beneath the Niutitang shale is poor (He porosity is approximately 3–3.5%, and the permeability of dolostone is two orders of magnitude higher than that of Niutitang shale) in the Songlin dome structure. The Niutitang shale in the JDS-1 well exhibited high hydrocarbon expulsion efficiency and the preservation of shale gas was difficult. In addition, residual OM nanopores in the shale interval near the floor are especially undeveloped due to the leakage of hydrocarbon fluid.
In the carbonate platform marginal zone, the lithology sealing capacity of the floor interval is relatively good because the shale floor strata include the Dengying dolostone and the dense chert successions which occurs before the deposition of the Niutitang shale. Therefore, in the Danquancun section, a more optimized lithology sealing capacity of the floor interval should allow for better development of the OM nanopores of the Niutitang shale than that of the matter nanopores in the JDS-1 well, resulting in increased porosity. However, the tectonic deformation in Southeast Chongqing is strong, faults are well developed, shale gas preservation conditions are poor, and methane content is low. However, on the continental shelf/slope, thicker chert successions act as the floor interval of the Niutitang shale. The lithology sealing capacity of the chert successions improved because it was dense, continuously deposited, and devoid of unconformity. In the Cen’gong block, shale gas in the Niutitang shale has high methane content. Even in the complicated tectonism areas, the Niutitang shale was effectively sealed by the chert successions and may feature more optimized preservation conditions.

5. Conclusions

Based on the above discussion, the following conclusion can be made.
From the carbonate platform face to the continental shelf/slope, the floor interval gradually passes from high permeability dolostone (the Dengying Formation) to low permeability dense chert (the Liuchapo Formation), the sealing capacity of the floor interval gradually improves. In contrast with several unconformities that occurred in the carbonate platform face in the northern Guizhou depression, no unconformity contact occurs between the Niutitang shale and the floor interval on the continental shelf/slope developed in eastern Chongqing Province and northwestern Hunan Province. Regionally, the lithology, thickness, permeability of the shale floor strata, contact relationship between the shale and the floor strata, and fractures developed in floor strata may affect the hydrocarbon expulsion efficiency, development of organic pores, and variations in shale gas composition of the Niutitang shale. Shale gas prospects in the Niutitang shales deposited on continental shelf/slope should be significantly better than those of shales deposited in the carbonate platform face.

Author Contributions

Conceptualization, Y.L. and Y.Z.; methodology, Y.L. and Y.Z.; software, Y.X.; validation, Y.L. and Y.W.; formal analysis, Y.Z.; investigation, Y.L. and Y.Z.; resources, Y.W. and P.P.; data curation, Y.Z.; writing—original draft preparation, Y.Z.; writing—review and editing, Y.L.; visualization, Y.Z.; supervision, Y.L.; project administration, Y.W.; funding acquisition, Y.L. and P.P. All authors have read and agreed to the published version of the manuscript.

Funding

This work was supported by the National Natural Science Foundation of China (Grants No. 41872156 and 42173056), the Special Fund for Strategic Priority Research Program of the Chinese Academy of Sciences (Grant No. XDA14010103), the State Key Laboratory of Organic Geochemistry (Grant No. SKLOGA2016-A08).

Acknowledgments

Xinan Yang and Yueyi Huang are acknowledged for their help in fieldwork and sample collection.

Conflicts of Interest

The authors declare no conflict of interest.

References

  1. Hao, F.; Zou, H.; Lu, Y. Mechanisms of Shale Gas Storage: Implications for Shale Gas Exploration in China. AAPG Bull. 2013, 97, 1325–1346. [Google Scholar] [CrossRef]
  2. Wang, P.; Jiang, Z.; Chen, L.; Yin, L.; Li, Z.; Zhang, C.; Tang, X.; Wang, G. Pore Structure Characterization for the Longmaxi and Niutitang Shales in the Upper Yangtze Platform, South China: Evidence from Focused Ion Beam–He Ion Microscopy, Nano-Computerized Tomography and Gas Adsorption Analysis. Mar. Pet. Geol. 2016, 77, 1323–1337. [Google Scholar] [CrossRef]
  3. Zhao, W.; Li, J.; Yang, T.; Wang, S.; Huang, J. Geological Difference and Its Significance of Marine Shale Gases in South China. Pet. Explor. Dev. 2016, 43, 547–559. [Google Scholar] [CrossRef]
  4. Zou, C.; Du, J.; Xu, C.; Wang, Z.; Zhang, B.; Wei, G.; Wang, T.; Yao, G.; Deng, S.; Liu, J.; et al. Formation, Distribution, Resource Potential, and Discovery of Sinian-Cambrian Giant Gas Field, Sichuan Basin, SW China. Pet. Explor. Dev. 2014, 41, 306–325. [Google Scholar] [CrossRef]
  5. Wei, G.Q.; Wang, Z.H.; Li, J.; Yang, W.; Xie, Z.Y. Characteristics of source rocks, resource potential and exploration direction of Silian and Cambrian in Sichuan Basin. Nat. Gas Geosci. 2017, 28, 1–13. (In Chinese) [Google Scholar]
  6. Wei, G.; Shen, P.; Yang, W.; Zhang, J.; Jiao, G.; Xie, W.; Xie, Z. Formation Conditions and Exploration Prospects of Sinian Large Gas Fields, Sichuan Basin. Pet. Explor. Dev. 2013, 40, 139–149. [Google Scholar] [CrossRef]
  7. Zou, C.; Dong, D.; Wang, Y.; Li, X.; Huang, J.; Wang, S.; Guan, Q.; Zhang, C.; Wang, H.; Liu, H.; et al. Shale Gas in China: Characteristics, Challenges and Prospects (II). Pet. Explor. Dev. 2016, 43, 182–196. [Google Scholar] [CrossRef]
  8. Jiao, K.; Ye, Y.; Liu, S.; Ran, B.; Deng, B.; Li, Z.; Li, J.; Yong, Z.; Sun, W. Characterization and Evolution of Nanoporosity in Superdeeply Buried Shales: A Case Study of the Longmaxi and Qiongzhusi Shales from MS Well #1, North Sichuan Basin, China. Energy Fuels 2018, 32, 191–203. [Google Scholar] [CrossRef]
  9. Yi, T.S.; Zhao, X. Characteristics and distribution patterns of the Lower Cambrian Niutitang Shale reservoirs in Guizhou, China. Nat. Gas Ind. 2014, 34, 8–14. (In Chinese) [Google Scholar]
  10. Jiao, W.W.; Wang, S.X.; Cheng, L.J.; Luo, Q.Y.; Fang, G.J. The reason of high nitrogen content and low hydrocarbon content of shale gas from the Lower Cambrian Niutitang Formation in southeast Chongqing. Nat. Gas Geosci. 2017, 28, 1882–1890. (In Chinese) [Google Scholar]
  11. Zhang, K.; Song, Y.; Jia, C.; Jiang, Z.; Jiang, S.; Huang, Y.; Wen, M.; Liu, X.; Liu, W.; Chen, Z.; et al. Vertical Sealing Mechanism of Shale and Its Roof and Floor and Effect on Shale Gas Accumulation, a Case Study of Marine Shale in Sichuan Basin, the Upper Yangtze Area. J. Pet. Sci. Eng. 2019, 175, 743–754. [Google Scholar] [CrossRef]
  12. Chen, Q.; Zhang, J.; Tang, X.; Li, W.; Li, Z. Relationship between Pore Type and Pore Size of Marine Shale: An Example from the Sinian-Cambrian Formation, Upper Yangtze Region, South China. Int. J. Coal Geol. 2016, 158, 13–28. [Google Scholar] [CrossRef]
  13. Wang, R.; Ding, W.; Zhang, Y.; Wang, Z.; Wang, X.; He, J.; Zeng, W.; Dai, P. Analysis of Developmental Characteristics and Dominant Factors of Fractures in Lower Cambrian Marine Shale Reservoirs: A Case Study of Niutitang Formation in Cen’gong Block, Southern China. J. Pet. Sci. Eng. 2016, 138, 31–49. [Google Scholar] [CrossRef]
  14. Wang, S.; Zou, C.; Dong, D.; Wang, Y.; Li, X.; Huang, J.; Guan, Q. Multiple controls on the paleoenvironment of the Early Cambrian marine black shales in the Sichuan Basin, SW China: Geochemical and organic carbon isotopic evidence. Mar. Pet. Geol. 2015, 66, 660–672. [Google Scholar] [CrossRef]
  15. Chen, D.; Wang, J.; Qing, H.; Yan, D.; Li, R. Hydrothermal Venting Activities in the Early Cambrian, South China: Petrological, Geochronological and Stable Isotopic Constraints. Chem. Geol. 2009, 258, 168–181. [Google Scholar] [CrossRef]
  16. Jin, Z.; Yuan, Y.; Sun, D.; Liu, Q.; Li, S. Models for Dynamic Evaluation of Mudstone/Shale Cap Rocks and Their Applications in the Lower Paleozoic Sequences, Sichuan Basin, SW China. Mar. Pet. Geol. 2014, 49, 121–128. [Google Scholar] [CrossRef]
  17. Liu, Y.; Zhang, J.; Zhang, P.; Liu, Z.; Zhao, P.; Huang, H.; Tang, X.; Mo, X. Origin and Enrichment Factors of Natural Gas from the Lower Silurian Songkan Formation in Northern Guizhou Province, South China. Int. J. Coal Geol. 2018, 187, 20–29. [Google Scholar] [CrossRef]
  18. Yang, P.; Xie, Y.; Wang, Z.; Li, Q.; Liu, J.; Zhang, D.; Yang, Z.; Yin, F. Fluid Activity and Hydrocarbon Accumulation Period of Sinian Dengying Formation in Northern Guizhou, South China. Pet. Explor. Dev. 2014, 41, 346–357. [Google Scholar] [CrossRef]
  19. Wang, J.; Li, Z.X. History of Neoproterozoic Rift Basins in South China: Implications for Rodinia Break-Up. Precambrian Res. 2003, 122, 141–158. [Google Scholar] [CrossRef]
  20. Jin, C.; Li, C.; Algeo, T.J.; Planavsky, N.J.; Cui, H.; Yang, X.; Zhao, Y.; Zhang, X.; Xie, S. A Highly Redox-Heterogeneous Ocean in South China during the Early Cambrian (∼529-514 Ma): Implications for Biota-Environment Co-Evolution. Earth Planet. Sci. Lett. 2016, 441, 38–51. [Google Scholar] [CrossRef] [Green Version]
  21. Gao, P.; Liu, G.; Jia, C.; Young, A.; Wang, Z.; Wang, T.; Zhang, P.; Wang, D. Redox Variations and Organic Matter Accumulation on the Yangtze Carbonate Platform during Late Ediacaran-Early Cambrian: Constraints from Petrology and Geochemistry. Palaeogeogr. Palaeoclimatol. Palaeoecol. 2016, 450, 91–110. [Google Scholar] [CrossRef]
  22. Li, Y.; Fan, T.; Zhang, J.; Zhang, J.; Wei, X.; Hu, X.; Zeng, W.; Fu, W. Geochemical Changes in the Early Cambrian Interval of the Yangtze Platform, South China: Implications for Hydrothermal Influences and Paleocean Redox Conditions. J. Asian Earth Sci. 2014, 109, 100–123. [Google Scholar] [CrossRef]
  23. Feng, W.M.; Xie, Y.; Li, R.; Luo, J.N.; Lin, J.S.; Liu, J.Q.; Zhao, Z. Restoration of karst palaeotopography on the Tongwan Movement Period in the southeastern Sichuan and northwestern Guizhou. Geol. Rev. 2017, 63, 1270–1280. [Google Scholar] [CrossRef]
  24. Wang, Z.; Jiang, H.; Wang, T.; Lu, W.; Gu, Z.; Xu, A.; Yang, Y.; Xu, Z. Paleo-Geomorphology Formed during Tongwan Tectonization in Sichuan Basin and Its Significance for Hydrocarbon Accumulation. Pet. Explor. Dev. 2014, 41, 305–312. [Google Scholar] [CrossRef]
  25. Miller, K.G.; Kominz, A.; Browning, J.V.; Wright, J.D.; Mountain, G.S. The Phanerozoic Record of Sea Level Change. Science 2005, 310, 1293–1299. [Google Scholar] [CrossRef] [PubMed] [Green Version]
  26. Zhu, M.; Zhang, J.; Steiner, M.; Yang, A.; Li, G.; Erdtmann, B. Sinian-Cambrian Stratigraphic Framework for Shallow- to Deep-Water Environments of the Yangtze Platform: An Integrated Approach*. Prog. Nat. Sci. 2003, 13, 951–960. [Google Scholar] [CrossRef]
  27. Amthor, J.E.; Grotzinger, J.P.; Schröder, S.; Bowring, S.A.; Ramezani, J.; Martin, M.W.; Matter, A. Extinction of Cloudina and Namacalathus at the Precambrian-Cambrian Boundary in Oman. Geology 2003, 31, 431–434. [Google Scholar] [CrossRef]
  28. Jiang, S.Y.; Pi, D.H.; Heubeck, C.; Frimmel, H.; Liu, Y.P.; Deng, H.L.; Ling, H.F.; Yang, J.H. Early Cambrian Ocean Anoxia in South China. Nature 2009, 459, 2008–2009. [Google Scholar] [CrossRef]
  29. Xu, L.G.; Bernd, L.; Mao, J.W.; Qu, W.J.; Du, A.D. Re-Os age of polymetallic Ni-Mo-PGE-Au mineralization in early Cambrian black shales of South China-A reassessment. Econ. Geol. 2011, 106, 511–522. [Google Scholar] [CrossRef]
  30. Cohen, K.; Finney, S.; Gibbard, P.; Fan, J.; Cohen, K.M.; Finney, S.C.; Gibbard, P.L.; Fan, J.X. The ICS International Chronostratigraphic Chart. Episodes 2013, 36, 199–204. [Google Scholar] [CrossRef]
  31. Wu, C.; Tuo, J.; Zhang, L.; Zhang, M.; Li, J.; Liu, Y.; Qian, Y. Pore Characteristics Differences between Clay-Rich and Clay-Poor Shales of the Lower Cambrian Niutitang Formation in the Northern Guizhou Area, and Insights into Shale Gas Storage Mechanisms. Int. J. Coal Geol. 2017, 178, 13–25. [Google Scholar] [CrossRef]
  32. Sun, M.; Yu, B.; Hu, Q.; Chen, S.; Xia, W.; Ye, R. Nanoscale Pore Characteristics of the Lower Cambrian Niutitang Formation Shale: A Case Study from Well Yuke #1 in the Southeast of Chongqing, China. Int. J. Coal Geol. 2016, 154–155, 16–29. [Google Scholar] [CrossRef]
  33. Yang, K.; Chen, J.W.; Chu, J.; Chen, L.; Wang, X.Y.; Zhu, Y.K. Discussion on influential factors of test gas in Cenye–1 well. Pet. Geol. Eng. 2015, 29, 104–109. (In Chinese) [Google Scholar]
  34. Liu, D.H.; Xiao, X.M.; Tian, H.; Min, Y.S.; Zhou, Q.; Cheng, P.; Shen, J.G. Sample Maturation Calculated Using Raman Spectroscopic Parameters for Solid Organics: Methodology and Geological Applications. Chin. Sci. Bull. 2013, 58, 1285–1298. [Google Scholar] [CrossRef] [Green Version]
  35. Kelemen, S.R.; Fang, H.L. Maturity Trends in Raman Spectra from Kerogen and Coal. Energy Fuels 2001, 15, 653–658. [Google Scholar] [CrossRef]
  36. Li, Y.; Zhang, T.; Ellis, G.S.; Shao, D. Depositional Environment and Organic Matter Accumulation of Upper Ordovician–Lower Silurian Marine Shale in the Upper Yangtze Platform, South China. Palaeogeogr. Palaeoclimatol. Palaeoecol. 2017, 466, 252–264. [Google Scholar] [CrossRef]
  37. Chalmers, G.R.; Bustin, R.M.; Power, I.M. Characterization of Gas Shale Pore Systems by Porosimetry, Pycnometry, Surfacearea, Andfield Emission Scanning Electron Microscopy/Transmission Electron Microscopy Image Analyses: Examples from the Barnett, Woodford, Haynesville, Marcellus, and Doig Units. AAPG Bull. 2012, 96, 1099–1119. [Google Scholar] [CrossRef]
  38. Ross, D.J.K.; Marc Bustin, R. The Importance of Shale Composition and Pore Structure upon Gas Storage Potential of Shale Gas Reservoirs. Mar. Pet. Geol. 2009, 26, 916–927. [Google Scholar] [CrossRef]
  39. Dicker, A.I.; Smits, R.M. Practical Approach for Determining Permeability from Laboratory Pressure-Pulse Decay Measurements. In Proceedings of the International Meeting on Petroleum Engineering, Tianjin, China, 1–4 November 1988; pp. 285–292. [Google Scholar]
  40. Yang, Z.; Sang, Q.; Dong, M.; Zhang, S.; Li, Y.; Gong, H. A Modified Pressure-Pulse Decay Method for Determining Permeabilities of Tight Reservoir Cores. J. Nat. Gas Sci. Eng. 2015, 27, 236–246. [Google Scholar] [CrossRef]
  41. International Union of Pure and Applied Chemistry. Recommendations for the characterization of porous solids (technical report). Pure Appl. Chem. 1994, 66, 1739–1758. [Google Scholar] [CrossRef]
  42. Wei, M.; Zhang, L.; Xiong, Y.; Li, J.; Peng, P. Nanopore Structure Characterization for Organic-Rich Shale Using the Non-Local-Density Functional Theory by a Combination of N2 and CO2 Adsorption. Microporous Mesoporous Mater. 2016, 227, 88–94. [Google Scholar] [CrossRef]
  43. Zheng, Y.; Liao, Y.; Wang, Y.; Xiong, Y.; Peng, P. Organic Geochemical Characteristics, Mineralogy, Petrophysical Properties, and Shale Gas Prospects of the Wufeng–Longmaxi Shales in Sanquan Town of the Nanchuan District, Chongqing. AAPG Bull. 2018, 102, 2239–2265. [Google Scholar] [CrossRef]
  44. Zhao, J.; Jin, Z.; Jin, Z.; Wen, X.; Geng, Y. Origin of Authigenic Quartz in Organic-Rich Shales of the Wufeng and Longmaxi Formations in the Sichuan Basin, South China: Implications for Pore Evolution. J. Nat. Gas Sci. Eng. 2017, 38, 21–38. [Google Scholar] [CrossRef]
  45. Kuila, U.; Prasad, M. Specific Surface Area and Pore-Size Distribution in Clays and Shales. Geophys. Prospect. 2013, 61, 341–362. [Google Scholar] [CrossRef]
  46. Shi, Z.J.; Wang, Y.; Tian, Y.M.; Wang, C.C. Cementation and Diagenetic Fluid of Algal Dolomites in the Sinian Dengying Formation in Southeastern Sichuan Basin. Sci. China Earth Sci. 2013, 56, 192–202. [Google Scholar] [CrossRef]
  47. Jin, Z.J.; Yuan, Y.S.; Liu, Q.Y.; Wo, Y.J. Controls of Late Jurassic-Early Cretaceous Tectonic Event on Source Rocks and Seals in Marine Sequences, South China. Sci. China Earth Sci. 2013, 56, 228–239. [Google Scholar] [CrossRef]
  48. Liu, S.G.; Ran, B.; Guo, T.L.; Wang, S.Q.; Hu, Q.H.; Luo, C.; Yang, D.; Sun, W.; Hu, Y.H.; Deng, B. From Oil-Prone Source Rock to Gas-Producing Shale Reservoir Lower Palaeozoic Organic-Matter-Rich Black Shale in the Sichuan Basin and Its Periphery; Science Press: Beijing, China, 2013; pp. 55–56. (In Chinese) [Google Scholar]
  49. Yang, G.L. Forming mechanism and evolution of Songlin dome in northern Guizhou Province. Geol. Resour. 2013, 22, 164–168. [Google Scholar]
  50. Han, Y.; Horsfield, B.; Wirth, R.; Mahlstedt, N.; Bernard, S. Oil Retention and Porosity Evolution in Organic-Rich Shales. AAPG Bull. 2017, 101, 807–827. [Google Scholar] [CrossRef] [Green Version]
  51. Radke, M. Application of Aromatic Compounds as Maturity Indicators in Source Rocks and Crude Oils. Mar. Pet. Geol. 1988, 5, 224–236. [Google Scholar] [CrossRef]
  52. Rong, J.Y.; Chen, X.; Wang, Y.; Zhan, R.B.; Liu, J.B.; Huang, B.; Tang, P.; Wu, R.C.; Wang, G.X. Northward expansion of Central Guizhou Oldland through the Ordovician and Silurian transition: Evidence and implications. Sci. China Earth Sci. 2011, 41, 1407–1415. (In Chinese) [Google Scholar]
  53. Lu, S.F.; Chen, H.G. Shale Characteristics and Shale Gas Exploration Prospect in Cambrian Niutitang Formation in Well MY-1, Southern Guizhou. China Pet. Explor. 2017, 22, 81–87. [Google Scholar]
  54. Jarvie, D.M.; Hill, R.J.; Ruble, T.E.; Pollastro, R.M. Unconventional Shale-Gas Systems: The Mississippian Barnett Shale of North-Central Texas as One Model for Thermogenic Shale-Gas Assessment. AAPG Bull. 2007, 91, 475–499. [Google Scholar] [CrossRef]
  55. Liao, L.; Wang, Y.; Chen, C.; Shi, S.; Deng, R. Kinetic Study of Marine and Lacustrine Shale Grains Using Rock-Eval Pyrolysis: Implications to Hydrocarbon Generation, Retention and Expulsion. Mar. Pet. Geol. 2018, 89, 164–173. [Google Scholar] [CrossRef]
  56. Kelemen, S.R.; Walters, C.C.; Ertas, D.; Kwiatek, L.M.; Curry, D.J. Petroleum Expulsion Part 2. Organic Matter Type and Maturity Effects on Kerogen Swelling by Solvents and Thermodynamic Parameters for Kerogen from Regular Solution Theory. Energy Fuels 2006, 20, 301–308. [Google Scholar] [CrossRef]
  57. Jia, W.; Wang, Q.; Liu, J.; Peng, P.; Li, B.; Lu, J. The Effect of Oil Expulsion or Retention on Further Thermal Degradation of Kerogen at the High Maturity Stage: A Pyrolysis Study of Type II Kerogen from Pingliang Shale, China. Org. Geochem. 2014, 71, 17–29. [Google Scholar] [CrossRef]
  58. Hill, R.J.; Zhang, E.; Katz, B.J.; Tang, Y. Modeling of Gas Generation from the Barnett Shale, Fort Worth Basin, Texas. Am. Assoc. Pet. Geol. Bull. 2007, 91, 501–521. [Google Scholar] [CrossRef]
  59. Zheng, Y.; Jiang, C.; Liao, Y. Relationship between Hydrocarbon Gas Generation and Kerogen Structural Evolution Revealed by Closed System Pyrolysis and Quantitative Py-GC Analysis of a Type II Kerogen. Energy Fuels 2021, 35, 251–263. [Google Scholar] [CrossRef]
  60. Liu, Y.; Xiong, Y.; Li, Y.; Peng, P. Effects of Oil Expulsion and Pressure on Nanopore Development in Highly Mature Shale: Evidence from a Pyrolysis Study of the Eocene Maoming Oil Shale, South China. Mar. Pet. Geol. 2017, 86, 526–536. [Google Scholar] [CrossRef]
  61. Guo, T.; Zeng, P. The Structural and Preservation Conditions for Shale Gas Enrichment and High Productivity in the Wufeng-Longmaxi Formation, Southeastern Sichuan Basin. Energy Explor. Exploit. 2015, 33, 259–276. [Google Scholar] [CrossRef] [Green Version]
  62. Tonglou, G.; Hanrong, Z. Formation and Enrichment Mode of Jiaoshiba Shale Gas Field, Sichuan Basin. Pet. Explor. Dev. 2014, 41, 31–40. [Google Scholar] [CrossRef]
  63. Jarvie, D.M. Shale Resource Systems for Oil and Gas: Part 1—Shale-Gas Resource Systems. AAPG Mem. 2012, 97, 69–87. [Google Scholar] [CrossRef]
Figure 1. (A) Simplified paleogeographic map of the Yangtze Block around the Sinian-Cambrian boundary interval (modification of the map presented by [14]). The location of JDS-1 well is marked by stars. The lower Cambrian Niutitang Formation black shales were deposited in the carbonate platform. (B) Regional, geological, and tectonic profiles of the study area, showing JDS-1 well and exposed strata. (C) Stratigraphic column and studied intervals. Sections: 1—Jindingshan; 2—Kaiyang; 3—Youyang; and 4—Cen’gong. Fm = Formation.
Minerals 12 00539 g001
Figure 2. Stratigraphic framework for the lower Cambrian strata of the northern Guizhou Area. Notably, lithology changes in the vertical direction of the Jindingshan, Kaiyang, Youyang and Cen’gong sections. The red line represents the boundary between Cambrian and Precambrian. The orange line represents the unconformities. II: The second episode of Tongwan movement; III: The third episode of Tongwan movement. Sources of lithological data: 1—Jindingshan; 2—Kaiyang [31]; 3—Youyang [22,32]; and 4—Cen’gong [13,33]. DY = Dengying, Fm = Formation.
Minerals 12 00539 g002
Figure 3. Depth profiles of gamma-ray (GR), total organic carbon content (TOC), quartz, clay, and carbonate contents for the Niutitang shale in Jindingshan-1 (JDS-1) well, showing lithology, unconformities, and weathering karst dolostone. Carbonaceous shale here refers to shale with TOC content ≥ 3.0 wt.%. The orange lines represent the unconformity. II: The second episode of Tongwan movement; III: The third episode of Tongwan movement. DY = Dengying, Fm = Formation.
Minerals 12 00539 g003
Figure 4. Ternary diagram of the mineralogical compositions of the Niutitang shale and chert from (A) Kaiyang well [31] and Jindingshan-1 (JDS-1) well deposited on the carbonate platform; (B) Yuke-1 (YK-1) well [32] and the Danquancun (DQC) section deposited on the carbonate platform marginal zone. The minerals of Kaiyang and JDS-1 wells are similar, and the minerals of the DQC section and YK-1 well are similar.
Minerals 12 00539 g004
Figure 5. Lithological profile, sample location, total organic carbon content (TOC), quartz, clay, carbonate contents and major elements of Yuke-1 (YK-1) well (hollow circles, [32]; cross stars, [22] and the Danquancun section (solid circles). The lithology of the Danquancun section and YK-1 well is similar from bottom to top. DY = Dengying, Fm = Formation.
Minerals 12 00539 g005
Figure 6. Depth profiles of the total organic carbon (TOC) content, nonlocal density functional theory (NLDFT) specific surface area, NLDFT pore volume, mercury injection capillary pressure (MICP) porosity and permeability of the Niutitang shale in the JDS-1 well. The blue dashed line and red solid line denote the overall trends of macroporosity (50 nm to 120 μm) and mesoporosity (<50 nm) measured using high-pressure Hg porosimetry. The floor interval with high permeability (as the transport layer) is shown in green. DY = Dengying.
Minerals 12 00539 g006
Figure 7. Nitrogen gas adsorption and desorption isotherms of the Niutitang shale. (AD) H3 type of loop indicates the narrow slit-shaped pores of the Niutitang shale samples from the JDS-1 well. (EG) H2 type loop indicates the ink-bottle-shaped pores of the Niutitang shale samples from the Danquancun section. (H) H3 type loop indicates the narrow slit-shaped pores of the Niutitang chert sample from the Danquancun section.
Minerals 12 00539 g007
Figure 8. Pore volume distribution is determined via the Barrett-Joyner-Halenda method, assuming Harkins-Jura’s thickness equation model. (A) Niutitang shale samples from JDS-1 well. (B) Niutitang shale and chert samples (grey and black) from the Danquancun section. There are relatively few residual organic pores in the Niutitang shale underlying floor interval with high permeability in the Jindingshan section, but relatively more residual organic pores can be observed in the Niutitang shale underlying floor interval with low permeability in the Danquancun section. Nanopores are not developed in chert.
Minerals 12 00539 g008
Figure 9. Field emission scanning electron microscopy (FE-SEM) images of the Niutitang shale sample JDS-75b (75.1 m, 246.4 ft, TOC = 3.68 wt.%, quartz = 28.0%, clay = 41.9%, excess SiO2 = 15.01%). (A,B) Blocky OM grains with a few organic pores that exhibit poor connectivity. (C,D) OM grains without visible organic pores. (E,F) Various types of mesopores and macropores developed in OM patches occurring in framboidal pyrite or between framboidal pyrite particles. (G,H) Corrosion pores in carbonate minerals.
Minerals 12 00539 g009
Figure 10. Depth profiles of the total organic carbon (TOC) content, specific surface area, pore volume, He porosity, and permeability of the Niutitang shale in the Yuke-1 well (data from [32]) and TOC, nonlocal density functional theory (NLDFT) specific surface area, NLDFT pore volume, He porosity, and permeability for the Niutitang shale and its floor interval at the Danquancun section. The floor interval with low permeability is thought to be an effective petroleum-resisting layer. The pore volume and specific surface area of the shale interval closing to low permeability floor interval are relatively bigger than the above shale interval with similar TOC. The permeability of the fractured chert sample is beyond the scope of the chart (the arrows). Fm = Formation.
Minerals 12 00539 g010
Figure 11. Field emission scanning electron microscopy (FE-SEM) images of the Niutitang shale sample DQC-9 (TOC = 9.54 wt.%, quartz = 47.3%, clay = 25.1%, excess SiO2 = 19.45%). (A) Interparticle pores between clastic grains are mainly filled up by organic matter (OM) and authigenic quartz, and clay minerals are scattered sporadically. (B,C) Certain OM patches have a large number of resolvable mesopores with poor connectivity. (D) Certain OM patches lack distinguishable organic pores, whereas some organic matter that fills up the aggregates of authigenic microcrystalline quartz contains various types of mesopores and macropores.
Minerals 12 00539 g011
Figure 12. Depth profiles of the total organic carbon (TOC) content, specific surface area, pore volume, and He porosity for the Niutitang shale at the Kaiyang section (data from [31]). The floor interval with high permeability (as the transport layer) is shown in green. The shale interval (grey zone) closing to unconformity and transport layer has a relatively lower pore volume and porosity than the above shale interval (pink zone) with similar TOC. DY = Dengying, Fm = Formation.
Minerals 12 00539 g012
Figure 13. Depth profiles of the total organic carbon (TOC) content and shale gas content for the Niutitang shale at the Cen’gong section (data obtained from [13]). The floor interval with low permeability dense chert is conducive to the preservation of shale gas. Gas content increases with the TOC. Fm = Formation.
Minerals 12 00539 g013
Figure 14. Exploration well distribution and shale gas composition of the Niutitang shale in the northern Guizhou area (data obtained from [9,10,13,33,53]). Sections: 1—Jindingshan; 2—Kaiyang; 3—Youyang; and 4—Cen’gong. Along the carbonate platform-to-basin transect, the permeability of floor interval decrease, and the methane content of the Niutitang shale increases gradually.
Minerals 12 00539 g014
Table 1. Lithology and petrogeochemical characteristics of the Niutitang shale in the Jindingshan-1 (JDS-1) well and Danquancun (DQC) section.
SectionSampleLithologyTOC (wt.%)δ13C (‰)RmcRoRock-Eval S2
(mg HC/g Rock)
Jindingshan-1 JDS-55bblack shale2.32/3.66–3.740
JDS-77bblack siliceous shale4.29/3.63–3.650.01
JDS-81ablack carbonaceous shale5.42/3.71–3.750.01
DanquancunDQC-17black siliceous shale8.89−31.2/0.01
DQC-16black siliceous shale10.54−31.8/0.01
DQC-15black siliceous shale12.77−31.7//
DQC-14black siliceous shale12.54−31.4//
DQC-13black siliceous shale11.07−31.53.54–3.740.04
DQC-12black carbonaceous shale12.05///
DQC-11black siliceous shale11.68−31.4//
DQC-10black siliceous shale10.59−31.4//
DQC-9black siliceous shale9.54−31.53.76–3.810.02
DQC-8black siliceous shale9.19−31.4//
DQC-7black siliceous shale10.37−31.6//
DQC-6black siliceous shale7.33−31.6//
Table 2. Mineralogy compositions, He porosities and permeabilities of the Niutitang shale samples in the Jindingshan-1 (JDS-1) well and Danquancun (DQC) section.
SectionSampleDepthTOCQuartzFeldsparCalciteDolomitePyriteChloriteIlliteHe PorosityPermeabilitySignature of Sample
m%%%%%%%%%10−5 mD
Jindingshan-1Niutitang Formation
JDS-50b50.221.6427.122.92.522.210.3333.120.58
JDS-60a59.671.6422.918.75.32.22.117.631.24.972.01
JDS-80a79.073.5929.919.22.84.46.9729.85.190.31
JDS-83a80.680.7511.27.44.25.519.2 15.13.39119.07apatite (37.4%)
Dengying Formation
JDS-84a82.67 7.64.2 668.4 13.83.041264.76Dolomite containing fracture
JDS-84b83.12 12.48.22.355.22.1 19.83.5147.67
DanquancunNiutitang Formation
DQC-143212.5462.89.42.41.16.22.415.75.367.27
DQC-9459.5447.316.1137.53.721.42.996.86
Liuchapo Formation
DQC-5521.5154.618.85.24.113.2 4.12.520.99
DQC-4530.8453.713.37.26.611.6 7.62.780.8
DQC-353.50.3670.82.53.719.4 3.63.171832.13chert containing fracture
Dengying Formation
DQC-2 18.711.53.346.42.8 17.33.811.5
DQC-1 20.912.56.340.22.5 17.62.391.73
Table 3. Major oxides of the Niutitang shale in the Jindingshan-1 (JDS-1) well and Danquancun (DQC) section.
SectionSampleDepth (m)TOCAl2O3CaOFe2O3K2OMgOMnONa2OP2O5SiO2SO3TiO2Excess SiO2Ti/Al
%%%%%%%%%%%%
Jindingshan-1JDS-109.950.4917.122.276.783.372.91.230.140.0958.532.890.735.290.043
JDS-2020.390.2817.671.157.293.393.071.30.180.0859.272.620.794.320.045
JDS-3030.330.3917.810.927.023.483.051.30.170.0759.852.10.764.460.043
JDS-35b35.310.4617.541.246.843.432.971.30.170.0859.782.430.775.230.044
JDS-40b40.280.3816.791.537.423.133.141.390.180.0859.842.70.747.620.044
JDS-45b45.250.1816.183.027.432.913.221.380.210.1157.792.570.777.470.048
JDS-50b50.221.6416.811.276.193.363.061.350.170.0659.792.530.697.510.041
JDS-55b55.22.3216.891.546.033.343.241.350.150.0557.993.240.675.460.04
JDS-60b60.172.0315.812.976.613.143.091.250.170.0857.34.440.678.130.042
JDS-65b65.142.2515.663.036.353.13.251.280.160.0856.83.90.658.10.042
JDS-70b70.113.4315.092.946.173.0831.340.150.0756.375.460.639.440.042
JDS-73b73.14.0114.223.445.432.942.871.380.180.0656.755.670.612.530.042
JDS-75b75.093.6813.932.695.733.052.631.30.160.0558.337.070.5515.010.039
JDS-77b77.084.2910.763.13.522.342.180.990.170.0565.23.850.4431.740.041
JDS-78b77.974.3812.743.453.922.92.631.150.240.0559.74.60.5220.080.041
JDS-80b79.374.0813.782.984.043.292.671.120.190.0557.695.420.5814.830.042
JDS-81a79.895.4214.123.114.433.773.070.610.240.0655.055.730.5911.140.042
DanquancunDQC-21209.4410.160.215.812.220.610.120.0260.987.840.3929.380.038
DQC-192410.4110.870.036.582.310.60.940.110.0157.948.460.4124.130.038
DQC-18268.8211.660.065.832.540.731.130.130.0259.837.570.4323.570.037
DQC-17288.8911.60.035.422.420.650.780.120.0259.627.210.4323.540.037
DQC-143212.545.891.893.931.320.690.610.10.0369.854.610.2351.530.039
DQC-133611.077.120.263.431.660.460.690.150.0167.952.880.2845.810.039
DQC-114111.6810.640.75.832.370.621.70.290.0257.893.920.5424.80.051
DQC-9459.5411.322.576.092.482.011.830.220.0454.666.490.5819.450.051
DQC-74810.3711.133.335.892.162.312.240.20.0650.24.270.6115.590.055
DQC-6507.3312.641.377.372.861.182.170.20.0454.5810.70.6915.270.055
Table 4. Pore structure parameters were obtained by the Nonlocal Density Functional Theory (NLDFT) Method.
SectionSampleDepthTOCComposited N2 and CO2 NLDFT Model
(m)(%)Surface Areas (m2/g)Pore Volumes (mL/100g)
SmicSmesSmacStotalVmicVmesVmacVtotal
Jindingshan-1JDS-109.950.495.751.760.057.570.160.970.211.34
JDS-1514.920.294.981.630.056.660.140.920.221.28
JDS-2020.390.285.111.660.066.820.121.030.211.36
JDS-2525.360.246.262.640.119.010.1610.221.3
JDS-3030.330.3961.580.057.620.160.860.191.21
JDS-3535.310.466.441.860.068.360.171.060.261.49
JDS-4040.280.386.421.820.058.290.180.980.221.38
JDS-4545.250.185.821.830.067.720.161.070.251.48
JDS-5050.221.6413.072.30.0615.430.361.160.241.76
JDS-5555.22.3215.972.970.0719.010.461.410.292.16
JDS-6060.172.0313.442.990.0816.510.381.530.322.23
JDS-6262.162.5414.512.930.0817.520.41.480.332.21
JDS-6363.152.513.962.440.0616.450.371.230.241.83
JDS-6565.142.2514.312.250.0616.610.41.080.221.7
JDS-6666.142.5814.082.210.0516.340.371.070.211.65
JDS-6767.132.6313.552.370.0615.980.341.210.271.82
JDS-6868.123.1216.22.430.0618.680.431.190.241.85
JDS-6969.122.4213.722.390.0616.170.381.20.261.84
JDS-7070.113.4316.732.730.0619.520.431.520.232.17
JDS-7171.113.1717.12.270.0519.420.441.110.191.74
JDS-7272.13.9117.482.180.0519.710.421.050.211.68
JDS-7373.14.0117.962.320.0620.340.431.110.231.78
JDS-7474.093.2215.072.340.0617.460.381.120.221.72
JDS-7575.093.6816.782.430.0619.270.421.150.251.81
JDS-7676.083.8416.032.520.0618.610.391.190.261.83
JDS-7777.084.2917.642.630.0720.340.421.290.292.01
JDS-7878.074.3816.592.330.0618.980.371.120.241.73
JDS-7979.064.2116.422.580.0719.060.381.290.291.96
JDS-8080.064.0816.983.10.120.190.381.660.422.46
JDS-81a80.565.4220.882.760.0723.710.461.280.292.02
DanquancunDQC-192410.415.030.550.055.630.090.650.291.03
DQC-17288.897.330.880.078.280.140.940.251.33
DQC-153112.775.920.620.036.570.110.580.140.82
DQC-143212.5432.447.30.0539.80.952.440.193.58
DQC-133611.0717.433.930.0421.40.3220.142.47
DQC-114111.6815.792.580.0418.420.31.430.181.91
DQC-9459.5431.277.520.0438.830.92.380.153.44
DQC-8469.1922.815.290.0628.160.561.870.222.65
DQC-6507.3318.914.040.0422.980.481.330.141.95
DQC-5521.5117.712.240.0419.990.350.760.141.26
DQC-4530.8415.381.970.0417.390.290.750.141.18
DQC-353.50.360.030.060.010.100.090.050.14
Publisher’s Note: MDPI stays neutral with regard to jurisdictional claims in published maps and institutional affiliations.

