
Iron Ore Sinter Macro- and Micro-Structures, and Their Relationships to Breakage Characteristics


Pyrometallurgy Innovation Centre (PYROSEARCH), School of Chemical Engineering, The University of Queensland, Brisbane Q4072, Australia
*
Author to whom correspondence should be addressed.
Minerals 2022, 12(5), 631; https://0-doi-org.brum.beds.ac.uk/10.3390/min12050631
Submission received: 24 March 2022
/
Revised: 9 May 2022
/
Accepted: 11 May 2022
/
Published: 16 May 2022
(This article belongs to the Special Issue Mineralogy of Iron Ore Sinters, Volume II)
Abstract
:A systematic analysis of industrial iron ore sinter product and associated sinter returns was undertaken. The samples were characterised through identification of the major macro- and micro-structural types present in these materials. Examination of the breakage surfaces of the particles indicates a strong correlation between mechanical sinter strength and sinter microstructure. Preferential breakage was observed to occur in sinter materials having high porosity and those microstructures consisting of isolated hematite grains in a glass matrix. The bulk of the sinter product consisted of material with a microstructure of magnetite and silico-ferrite of calcium and aluminium (SFCA). The phases formed and the reaction sequences responsible for the formation of the principal microstructure types are explained by the non-equilibrium solidification of melts in the “Fe2O3”-Al2O3-CaO-SiO2 system.
Keywords:
iron ore sinter; sinter return; breakage; microstructure; hematite; magnetite; SFCA; solidification1. Introduction
It has been established that the productivities in the iron blast furnace operations are dependent on the physical and chemical properties of the iron ore feed [1,2,3,4]. As a result, several empirical tests are routinely used as sinter quality control measures in industrial practice, including the following:
Previous studies have shown that iron ore sinter properties depend on the bulk chemical composition of the sinters [11,12,13,14], the phases present and the volume fractions of these phases [11,15,16]. Fundamental research has established the influence of bulk composition, temperature and oxygen partial pressure on the phases formed under equilibrium [17,18,19,20] and non-equilibrium conditions [21,22,23,24,25,26]. Pownceby et al. [17,18] investigated the phase equilibria in the Fe-rich region of the FeO-Fe2O3-CaO-SiO2 system in air and in oxygen partial pressure pO2 = 5 × 10⁻³ atm from 1240 to 1300 °C. Chen et al. [19] and Cheng et al. [20] subsequently expanded the phase equilibria study in air to investigate the full extent of the primary phase field of SFC (silico-ferrite of calcium solid solution) which is believed to be a critical phase that enhances sinter quality [14]. Nicol et al. [21,22,23,24,25] investigated the non-equilibrium cooling behaviour of the melt in the FeO-Fe2O3-CaO-SiO2 system in air as an effect of bulk compositions and cooling rates. Significant undercoolings of the slag phase were identified and it was indicated that the formation of SFC(A) phase in iron ore sinters is principally controlled by kinetic processes. The non-equilibrium cooling study was further extended to the FeO-Fe2O3-CaO-SiO2-Al2O3 system in air [26]; preferential nucleation of the SFCA phase at the liquid-magnetite interface was observed. These studies have provided information that has been essential for the development of a clear understanding of the key process variables and the mechanisms of formation of the various microstructures in industrial sinter making.
The macro- and micro-structures present in industrial sinters are not uniform; they are complex and variable. Systematic information about how the various phases and microstructures are distributed, and how these might influence the macro-properties of the products is important for further improvements of industrial processes.
High mechanical resistance to breakage is one of these key properties of sinters as under-sized sinters (<~5–6 mm) are categorised as return fines and sent back to the feeding hoppers for reprocessing. Hence, it is important to maintain desirable size of the sinter lumps (as opposed to being fractured into under-sized materials). Whereas most previous studies of iron ore sinter characteristics have been primarily focussed on the measurement of the bulk or average properties, the focus of the present study is on the sinter breakage surface to identify i) the microstructures of the weakest areas compared to the stronger, unfractured areas and ii) the conditions and operational parameters that could result in those weak microstructures. The methodology of the present study is as follows:
- Perform macroscopic (mm to cm) examination of sinter and return samples including but not limited to the breakage surfaces;
- Introduce classification of sinter Macro-Types based on macro-appearances;
- Perform microstructural analysis and phase identifications using scanning electron microscope (SEM) electron probe X-ray microanalysis (EPMA);
- Introduce classification of sinter microstructures;
- Demonstrate the relationship between the macro-scale and micro-scale structural features of the materials, with the focus on the microstructures corresponding to the breakage surfaces;
- Conclude on impacts of the industrial operational parameter on the sinter microstructures and Macro-Types, with focus on the breakage properties of sinters, and finally, the sinter strength.
2. Overview of Sample Information
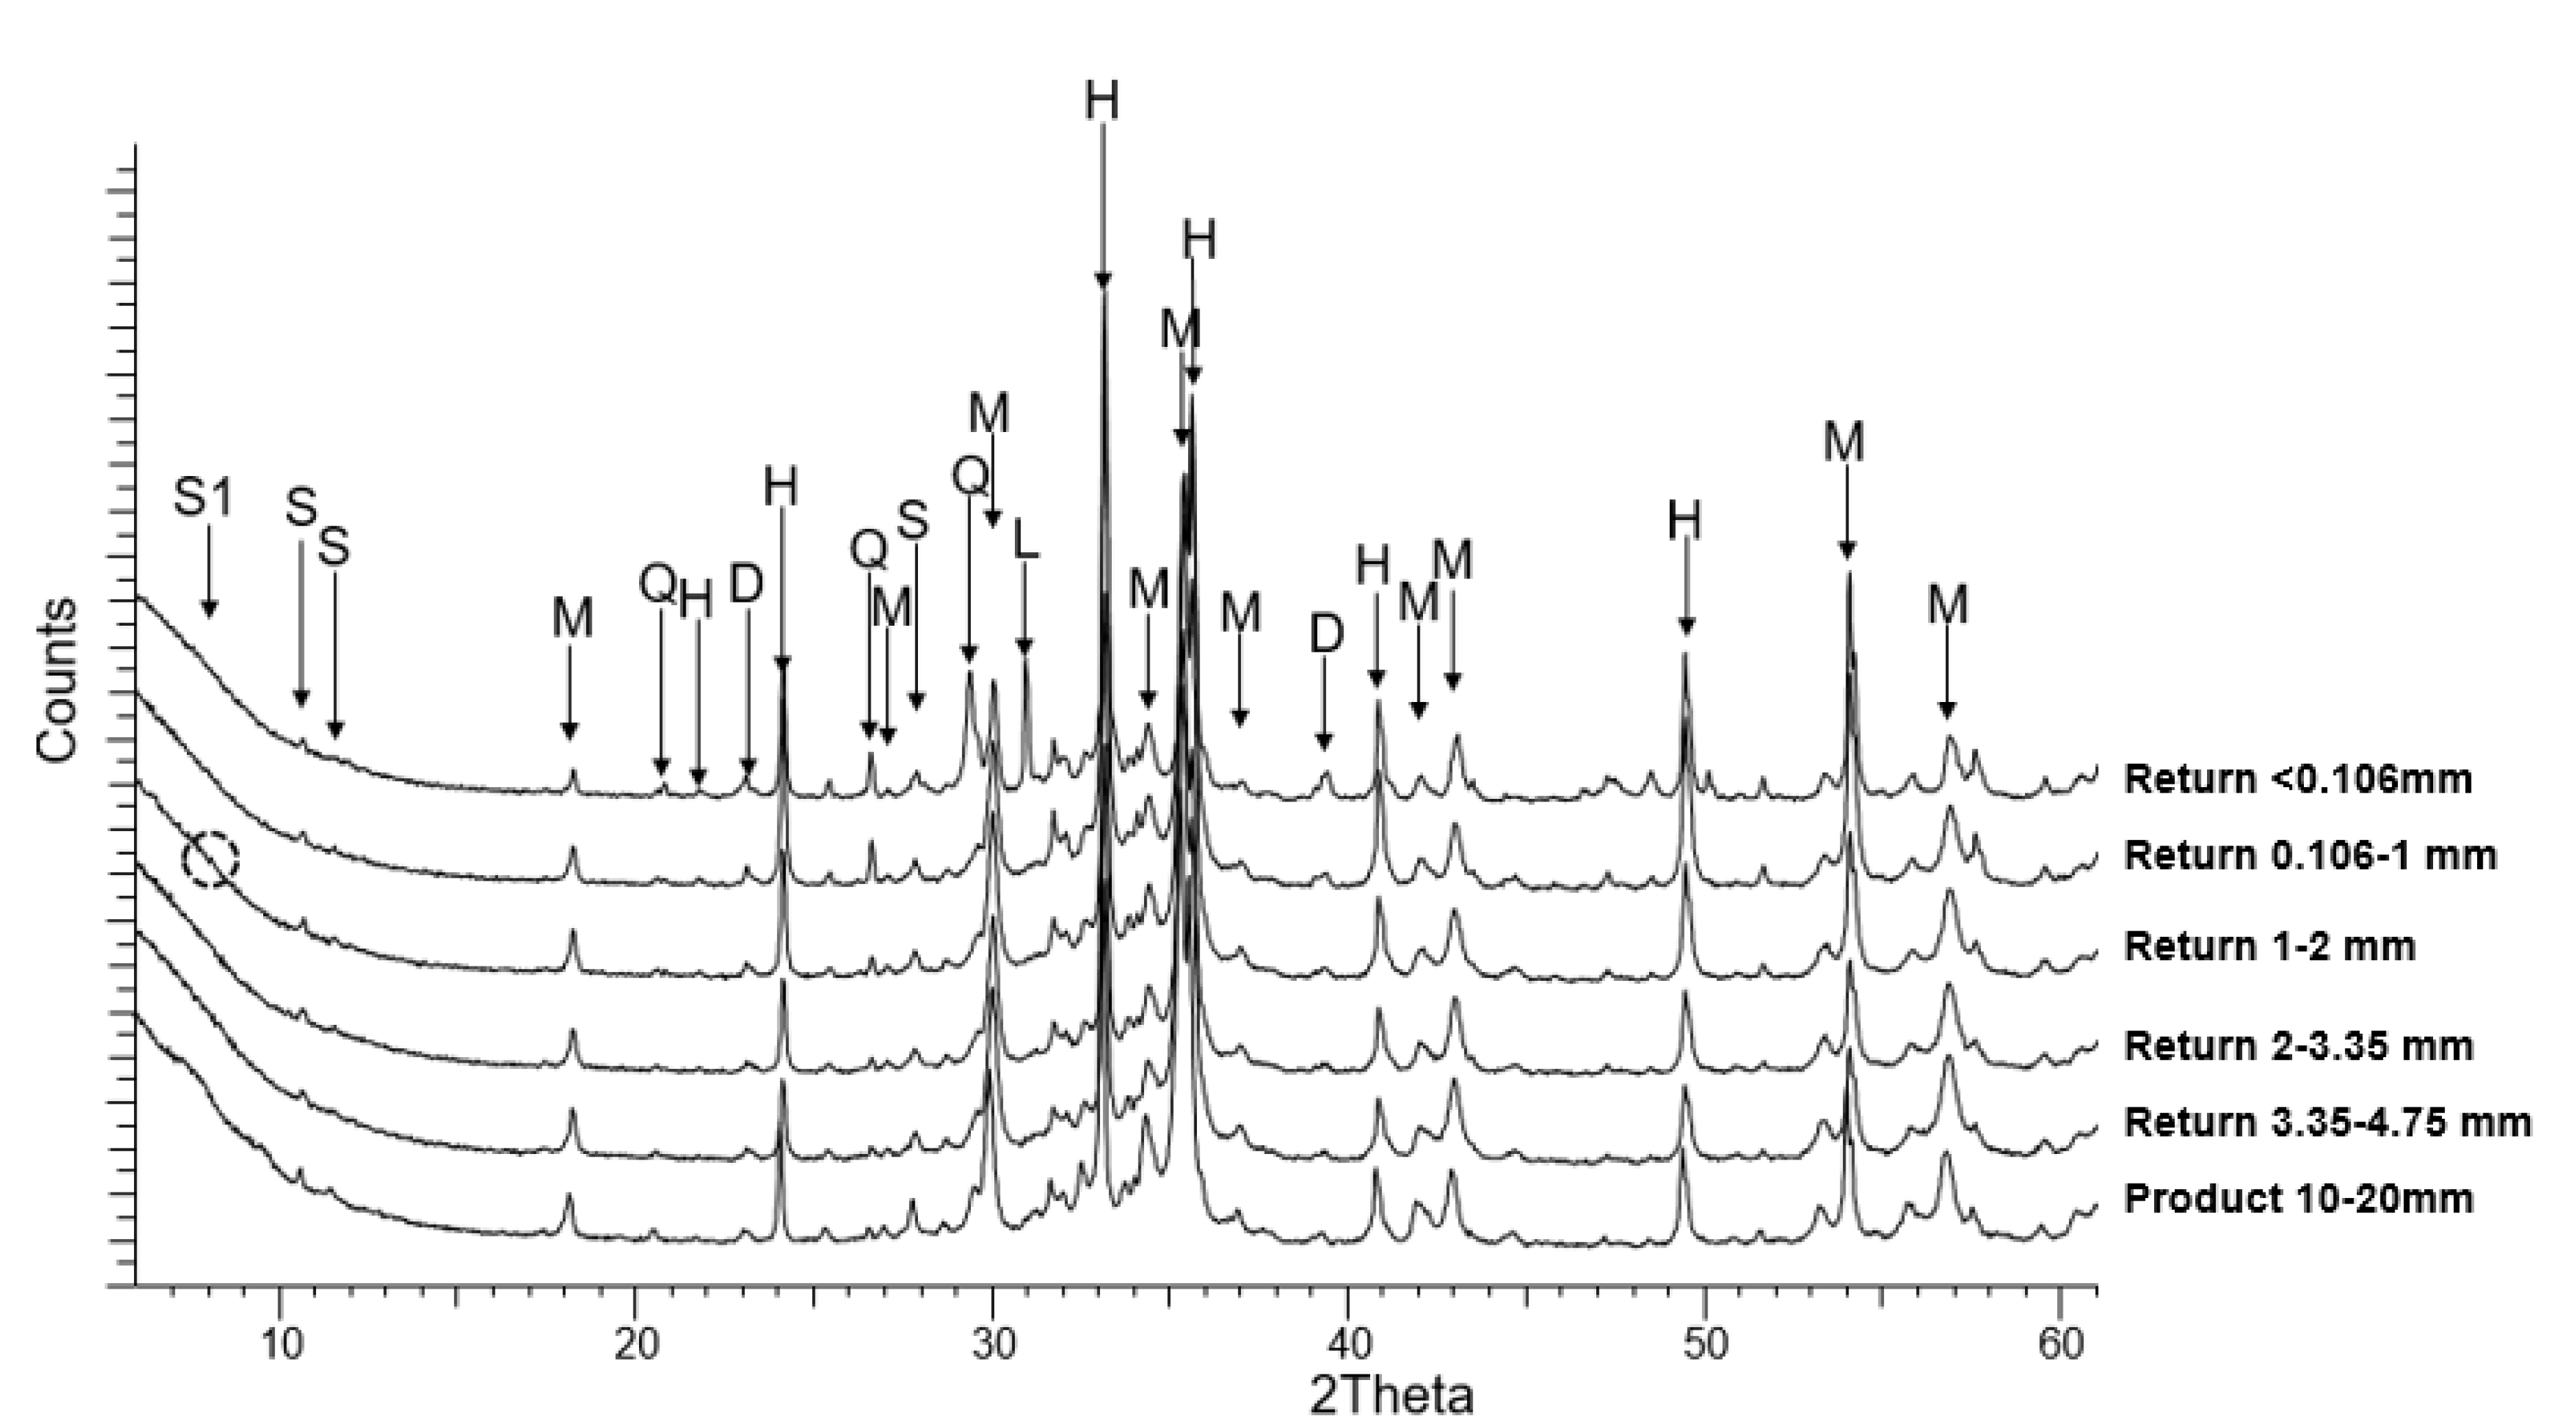
The industrial iron ore sinter product and return fine samples examined in the present study are the same as those reported in a previous study [27]. The bulk compositions of the sinter samples are adapted with permission from Ref. [27] in Table 1. X-ray powder diffraction (XRD) (Rigaku, Tokyo, Japan) studies (see Figure 1) undertaken using Cu Kα radiation showed the presence of D = dicalcium-silicate (C2S), H = hematite ([Fe,Al]2O3), M = magnetite ([Fe,Ca,Mg]O·[Fe,Al]2O3), Q = quartz (SiO2) and S = silico-ferrite of calcium and aluminium solid solutions (usually referred to as SFCA, where S, F, C, A indicate SiO2, Fe2O3, CaO, and Al2O3—these abbreviations will be also used in this paper to describe the chemical formulae of calcium silicates) in all size fractions of the product and return sinter. Free lime, CaO, was only found to be present in the <1 mm return sinter particles.
3. Macroscopic Examination and Classification of Macro-Types of Sinter Products
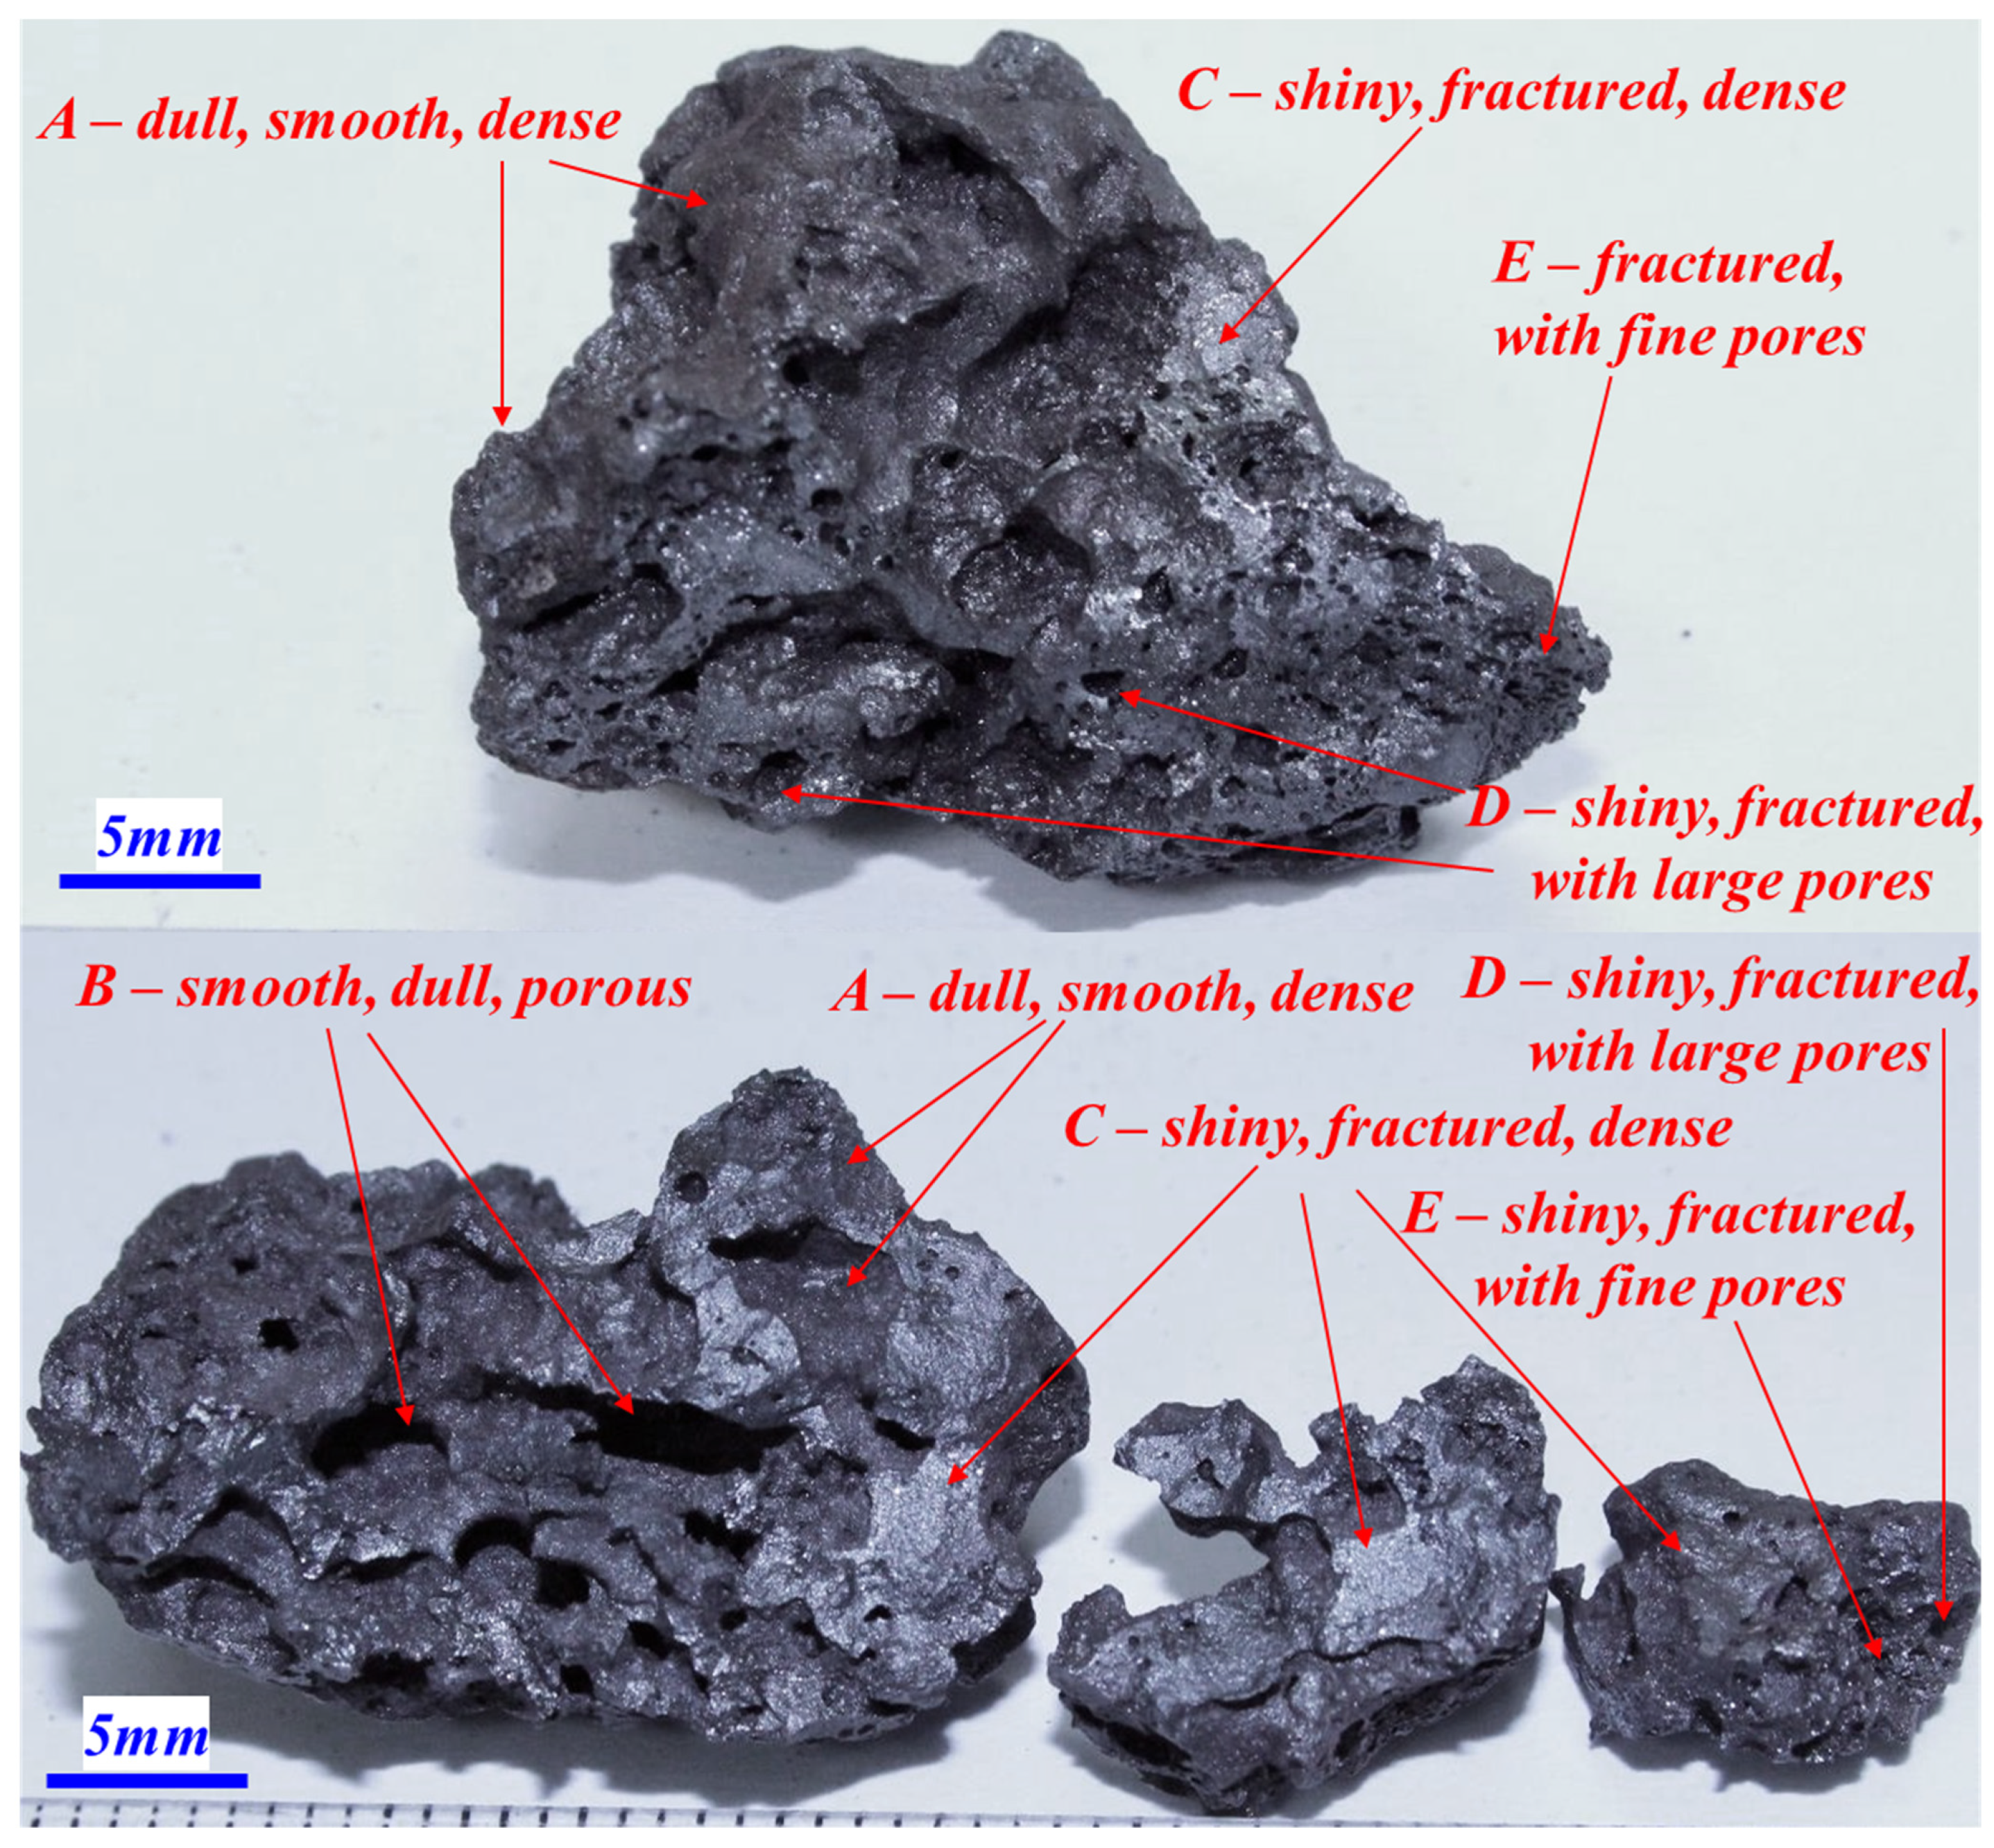
The as-received product and return sinter particles in the selected size fractions were initially subjected to macroscopic examination to identify the macrostructural features present in these materials. Classifications of Macro-Types were introduced to describe all features observed on the sinters. Based on the visual examination of the external surfaces of the materials, five main Macro-Type features, designated here as types (A–E) common to all sinter product samples were identified (see Figure 2). During visual observations, particular attention was given to the identification of fractured surfaces which were shiny, light-reflective, usually flat and with sharp edges, as opposed to the molten, unfractured surfaces which were dull, smooth, usually convex, rounded outward and without sharp edges. In addition, on the porous, fractured surfaces, areas with the locally agglomerated fine pores (with most of the pore-size less than 1mm) were observed—these are classified as Macro-Type E as opposed to the isolated, non-agglomerated, relatively larger (>1 mm) cavities which are classified as Macro-Type D. It should be noted that the understanding and assumption was that the sinter breaks at the regions with locally low mechanical strength. The present investigation was to identify the macro- and micro-structural difference between the fractured (weak) and unfractured (strong) regions on the sinter.
- Macro-Type A—molten surface, dull, smooth, dense, pore-free,
- Macro-Type B—molten surface, dull, smooth, porous,
- Macro-Type C—fractured surface, shiny, dense, pore-free,
- Macro-Type D—fractured surface, shiny, with large pores,
- Macro-Type E—fractured surface, shiny, with fine pores.
The identification and characterisation of breakage surfaces is important as these areas are where the sinter pieces broke, therefore these are the weakest areas that define the sinter strength.
4. Sinter Microstructures Analysis and Classification
Specific portions of the samples corresponding to the Macro-Types indicated above were then selected for further analysis to enable the microstructures associated with the different Macro-Types to be examined using optical metallography and SEM, and the phases to be identified using phase compositions measured with EPMA.
Direct measurements of the chemical compositions of the phases present in the sinter samples were performed using EPMA, JEOL JXA 8200L (trademark of Japan Electron Optics Ltd., Tokyo, Japan) at an acceleration voltage of 15 keV, probe current of 20 nA, and a probe diameter of 0 µm. The Duncumb Philibert ZAF correction procedure supplied with the JEOL JXA 8200L probe was applied. Appropriate reference materials Al2O3, CaSiO3, MgO, Fe2O3, TiO2, KAlSi3O8, Ca5(PO4)3 and Mn3Al2Si3O12 from Charles M. Taylor, (Stanford, CA, USA) were used as standards to calibrate Al, Ca, Si, Mg, Fe, Ti, K, P and Mn respectively. Phase compositions were recalculated to selected oxidation states (i.e., Al2O3, CaO, SiO2, MgO, Fe2O3, TiO2, K2O, P2O5 and MnO) and normalised for presentation purposes.
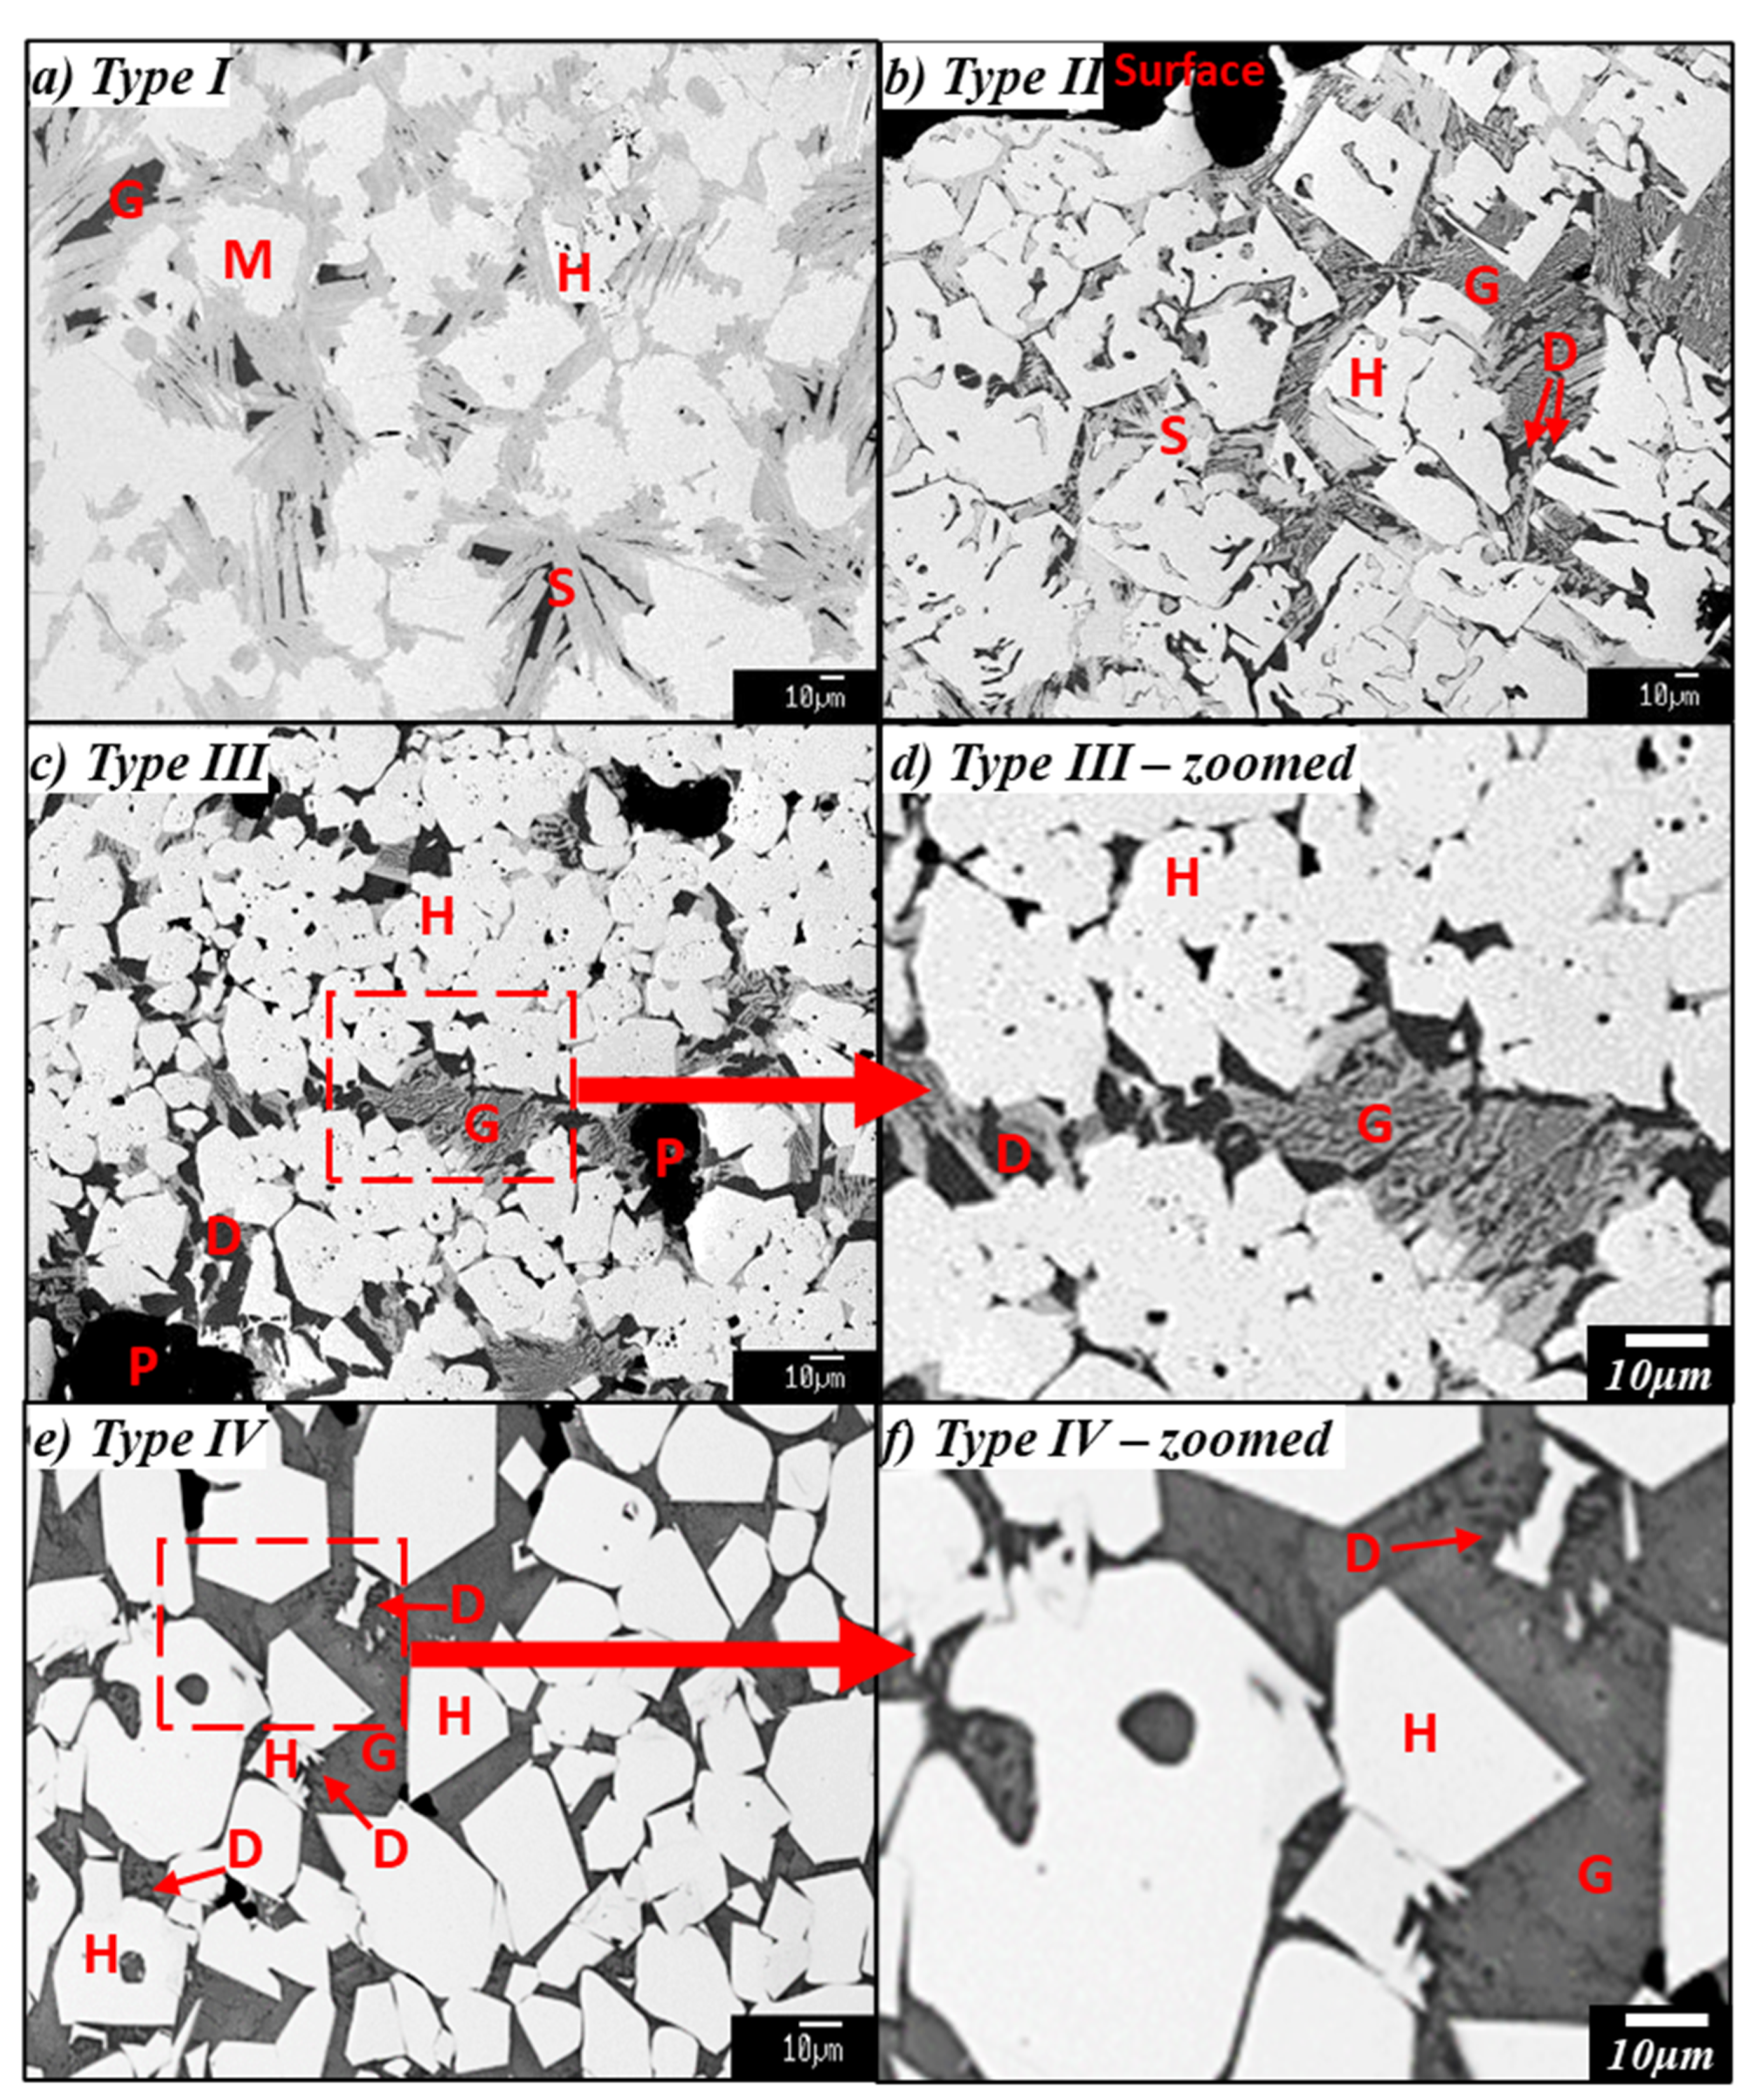
Following examination of polished cross sections of the sinter product materials, four main microstructural types (types I–IV) were identified (see Figure 3):
- Micro-Type I Glass (minor) + magnetite (rounded, irregular) + hematite (minor) + SFCA (plate-like);
- Micro-Type II Glass + hematite (angular/dendritic) + SFCA (minor, blocky) + dicalcium silicate (C2S);
- Micro-Type III Glass + hematite (rounded, micropores isolated/connected) + dicalcium silicate (C2S) + very little SFCA (fine and dendritic); and
- Micro-Type IV Glass + magnetite (rounded to euhedral) + hematite (euhedral) + dicalcium silicate (C2S, minor).
5. Description of and Correlation between Sinter Macro- and Micro-Structure Types
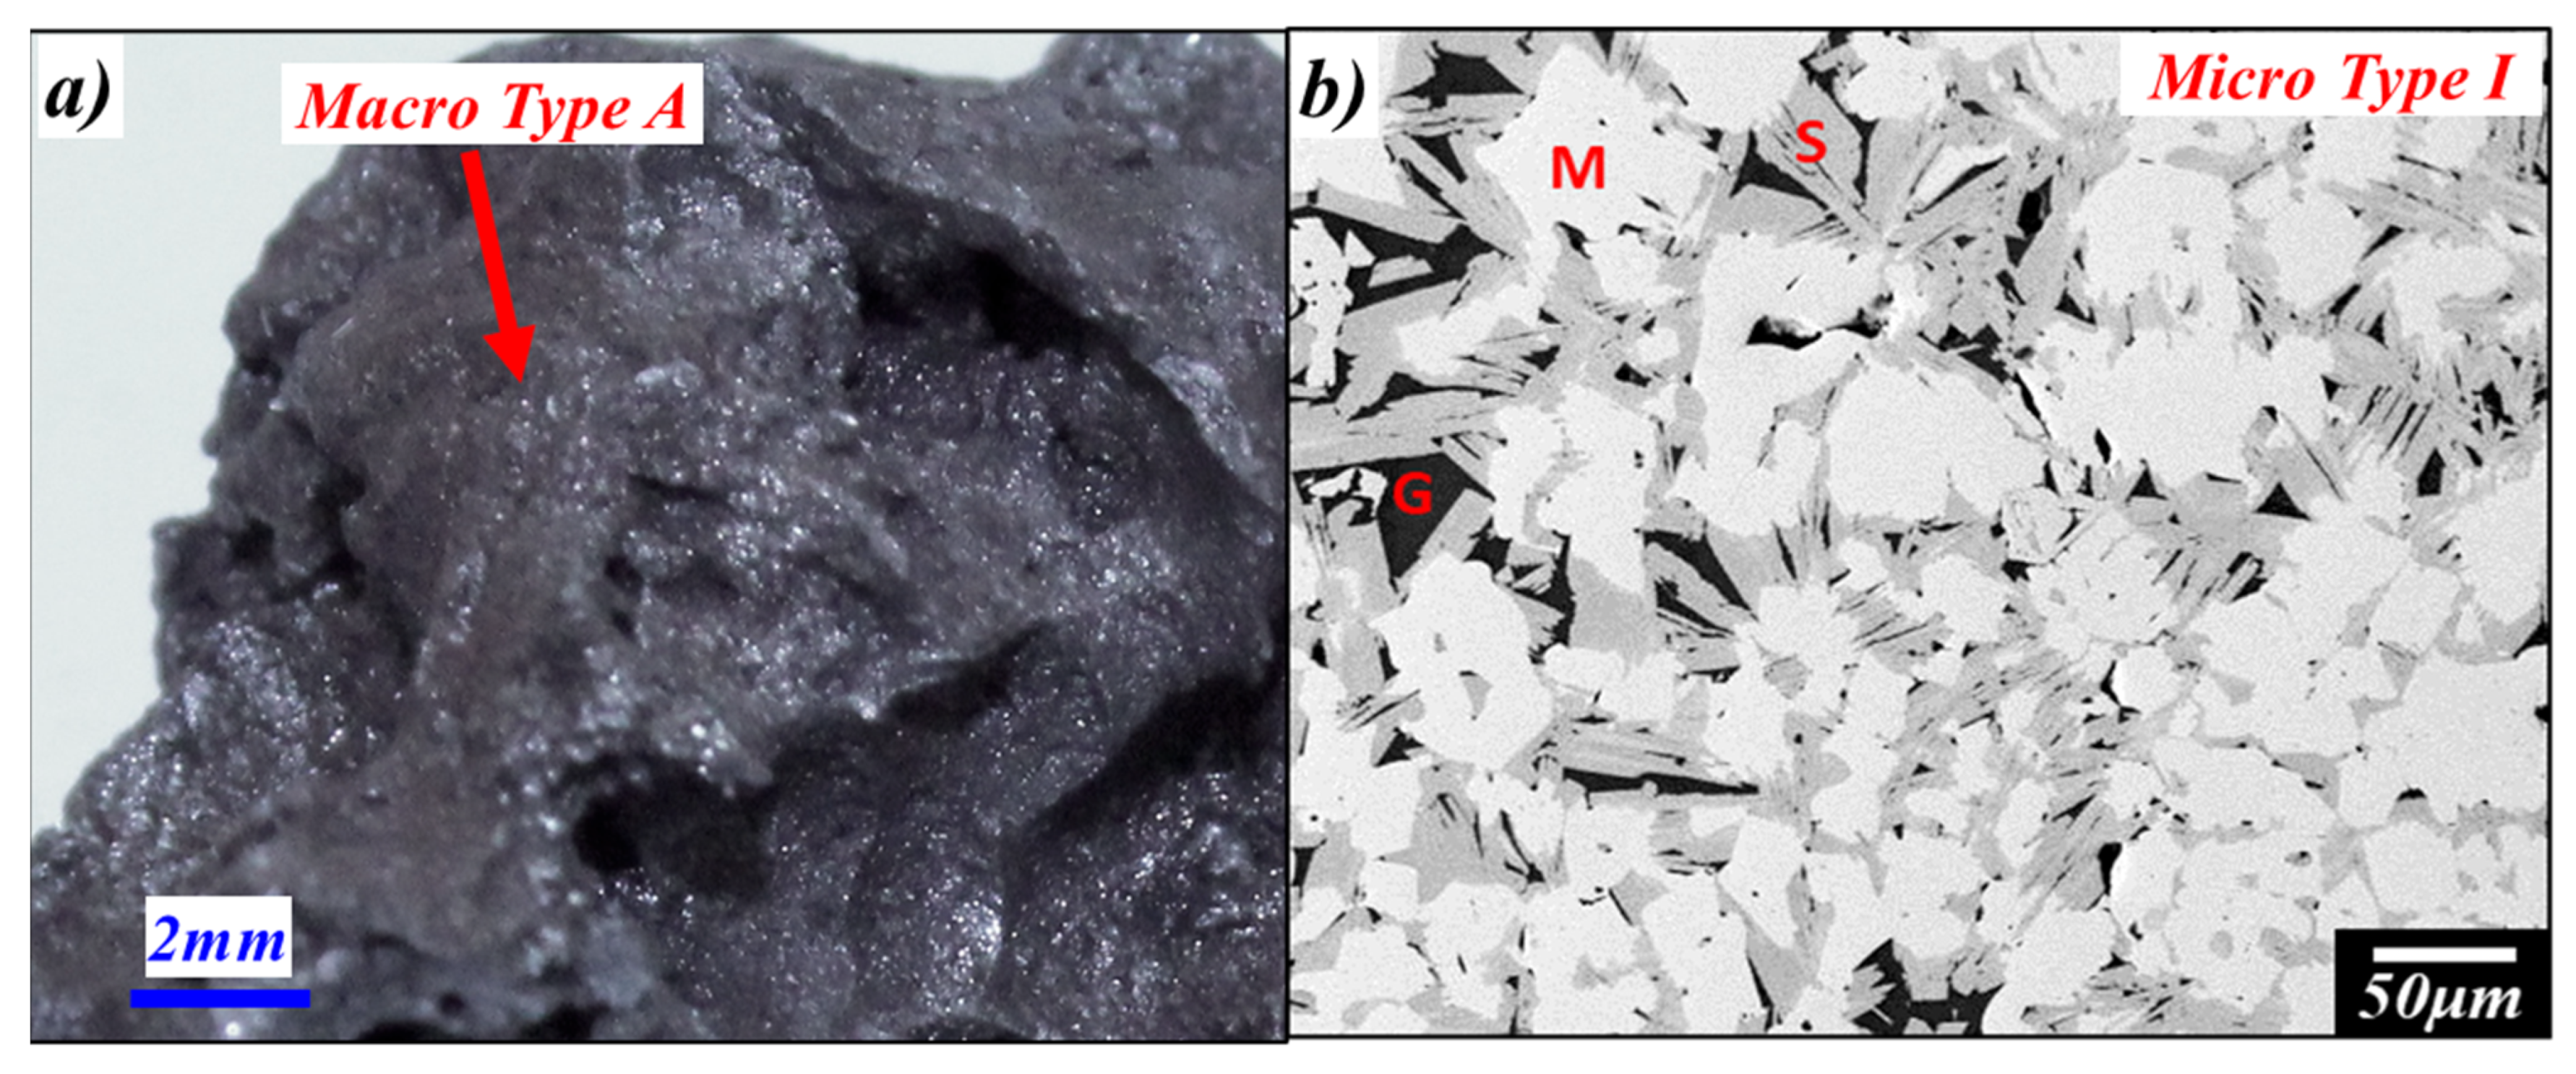
Macro-Type A material has a smooth, dense surface (no pores observed), it is dull in colour and relatively high in strength. This is likely to be the molten surface of the original sinter piece. The phase assemblage corresponding to this Macro-Type A is relatively uniform, consisting of typically Type I microstructure [glass (~9%)] + [magnetite + SFCA (>90%)] (see Figure 4b). Minor amounts of unreduced hematite (<~1%) are also observed in-between the magnetite-SFCA matrix. The isolated magnetite grains are irregular but relatively round in shape and ~10–100 μm in diameter. The SFCA is plate-like with high aspect ratio and growing in different directions in the matrix between the magnetite grains. The glass occupies the space between the SFCA crystals. This microstructure is relatively dense, without apparent micro-pores present.
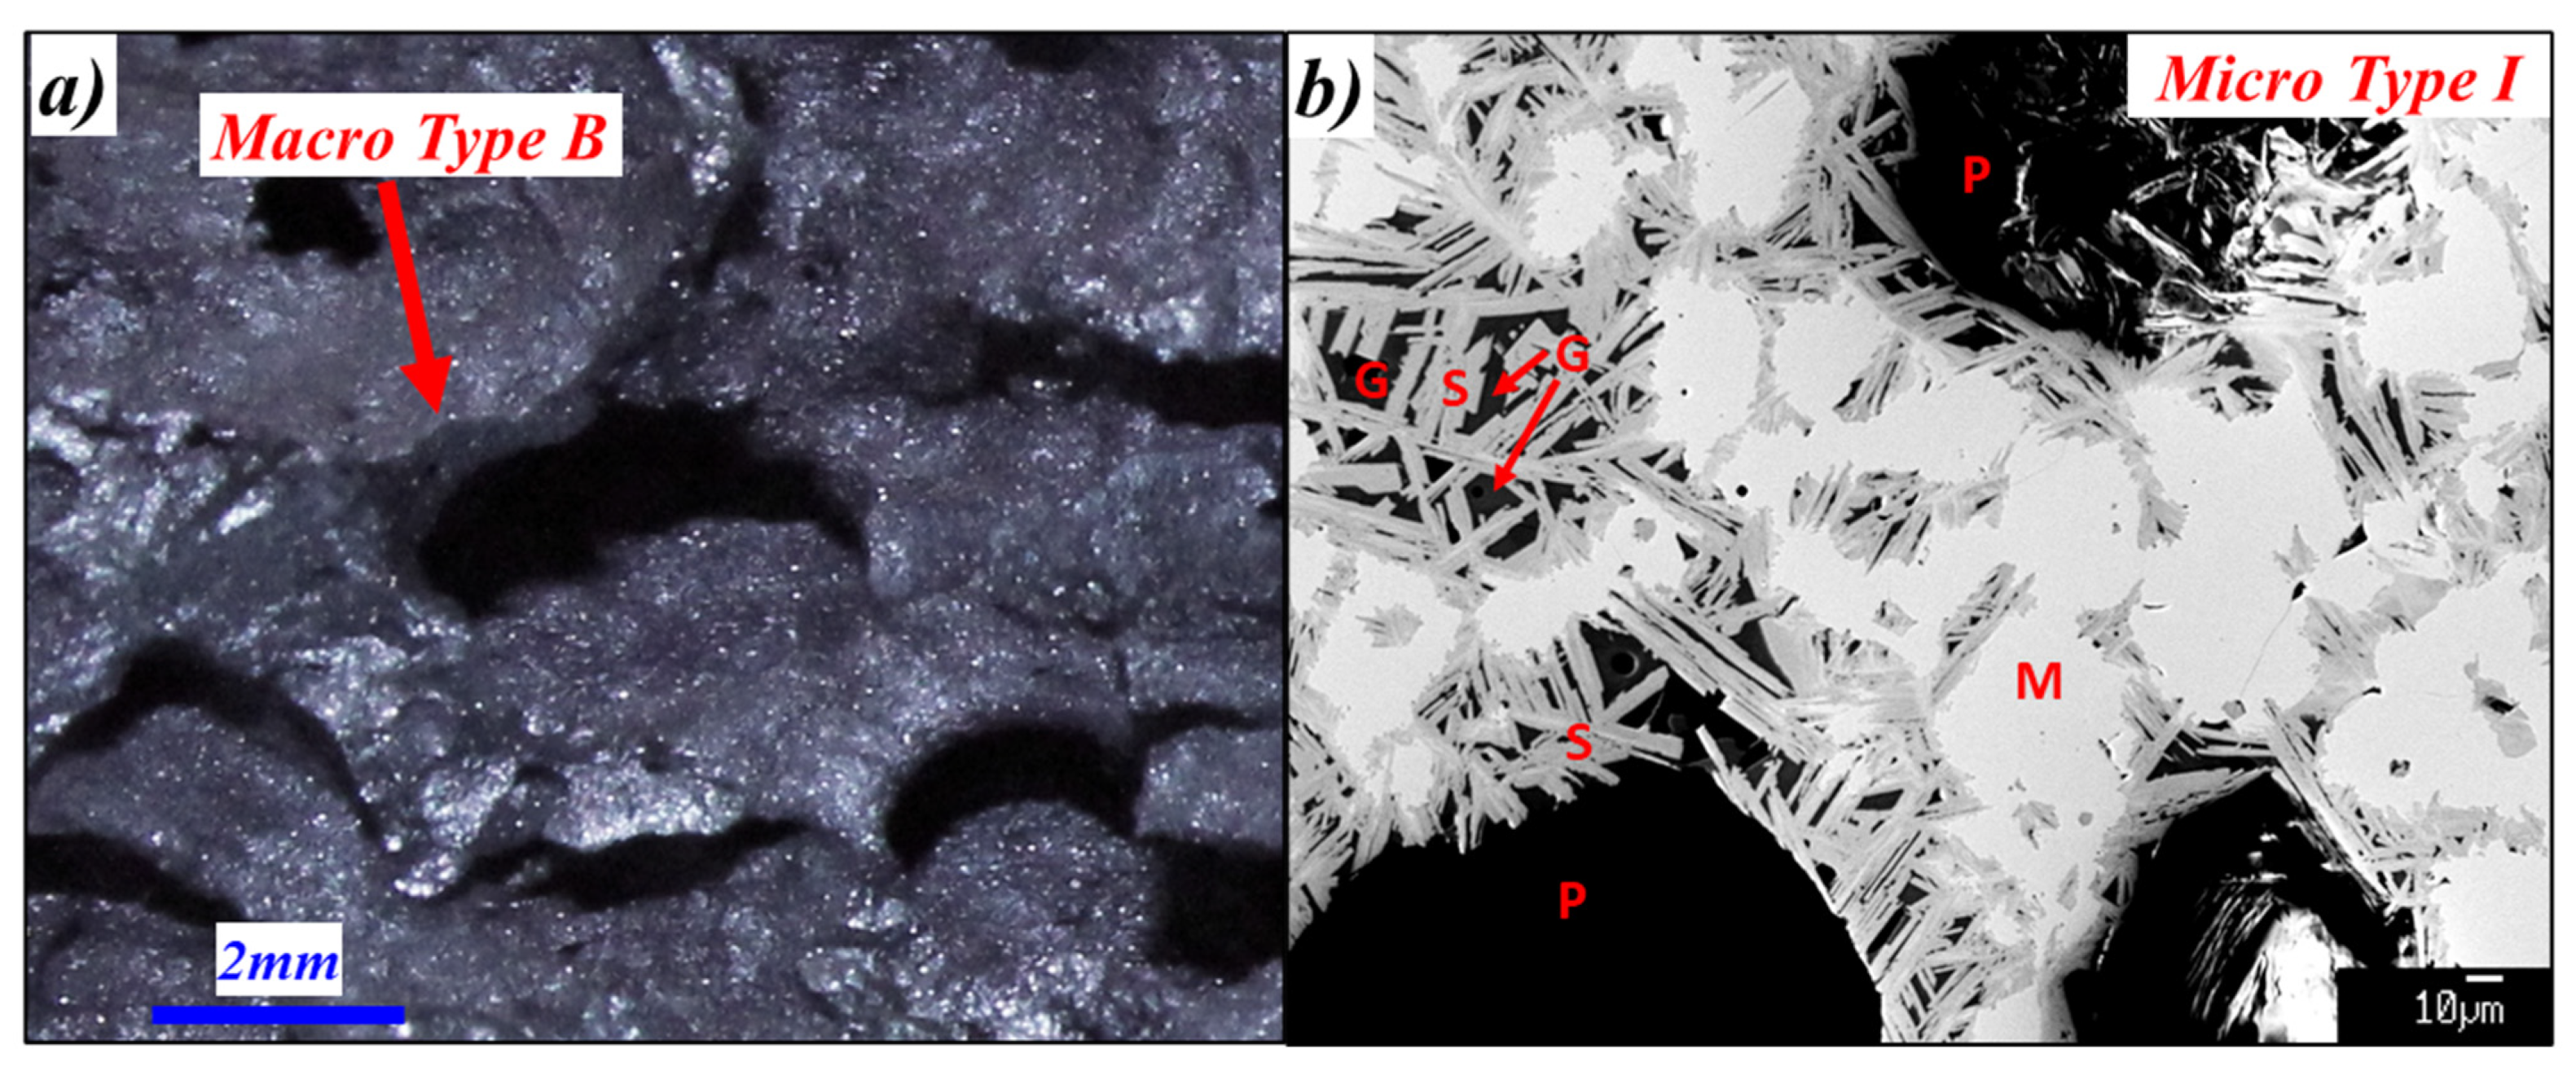
The surface of Macro-Type B material is smooth but different from Type A, this portion of the material has a number of large gas pores (50–500 μm in diameter), it is dull in colour and relatively high in strength. This is also likely to be formed from the molten surface of the original sinter piece (similar to Macro-Type A) however with large gas bubbles entrapped or cavities unfilled during sintering. The microstructure of the Type B material (Figure 5b) is also predominantly Type I—glass + magnetite and SFCA (major) + hematite (minor). The formation of the SFCA crystals appears to be a combined result of heterogeneous nucleation on the existing magnetite crystals and homogeneous nucleation from the slag phase. The SFCA crystallisation is terminated on the interfaces with the gas bubbles/pores where the slag phase is absent.
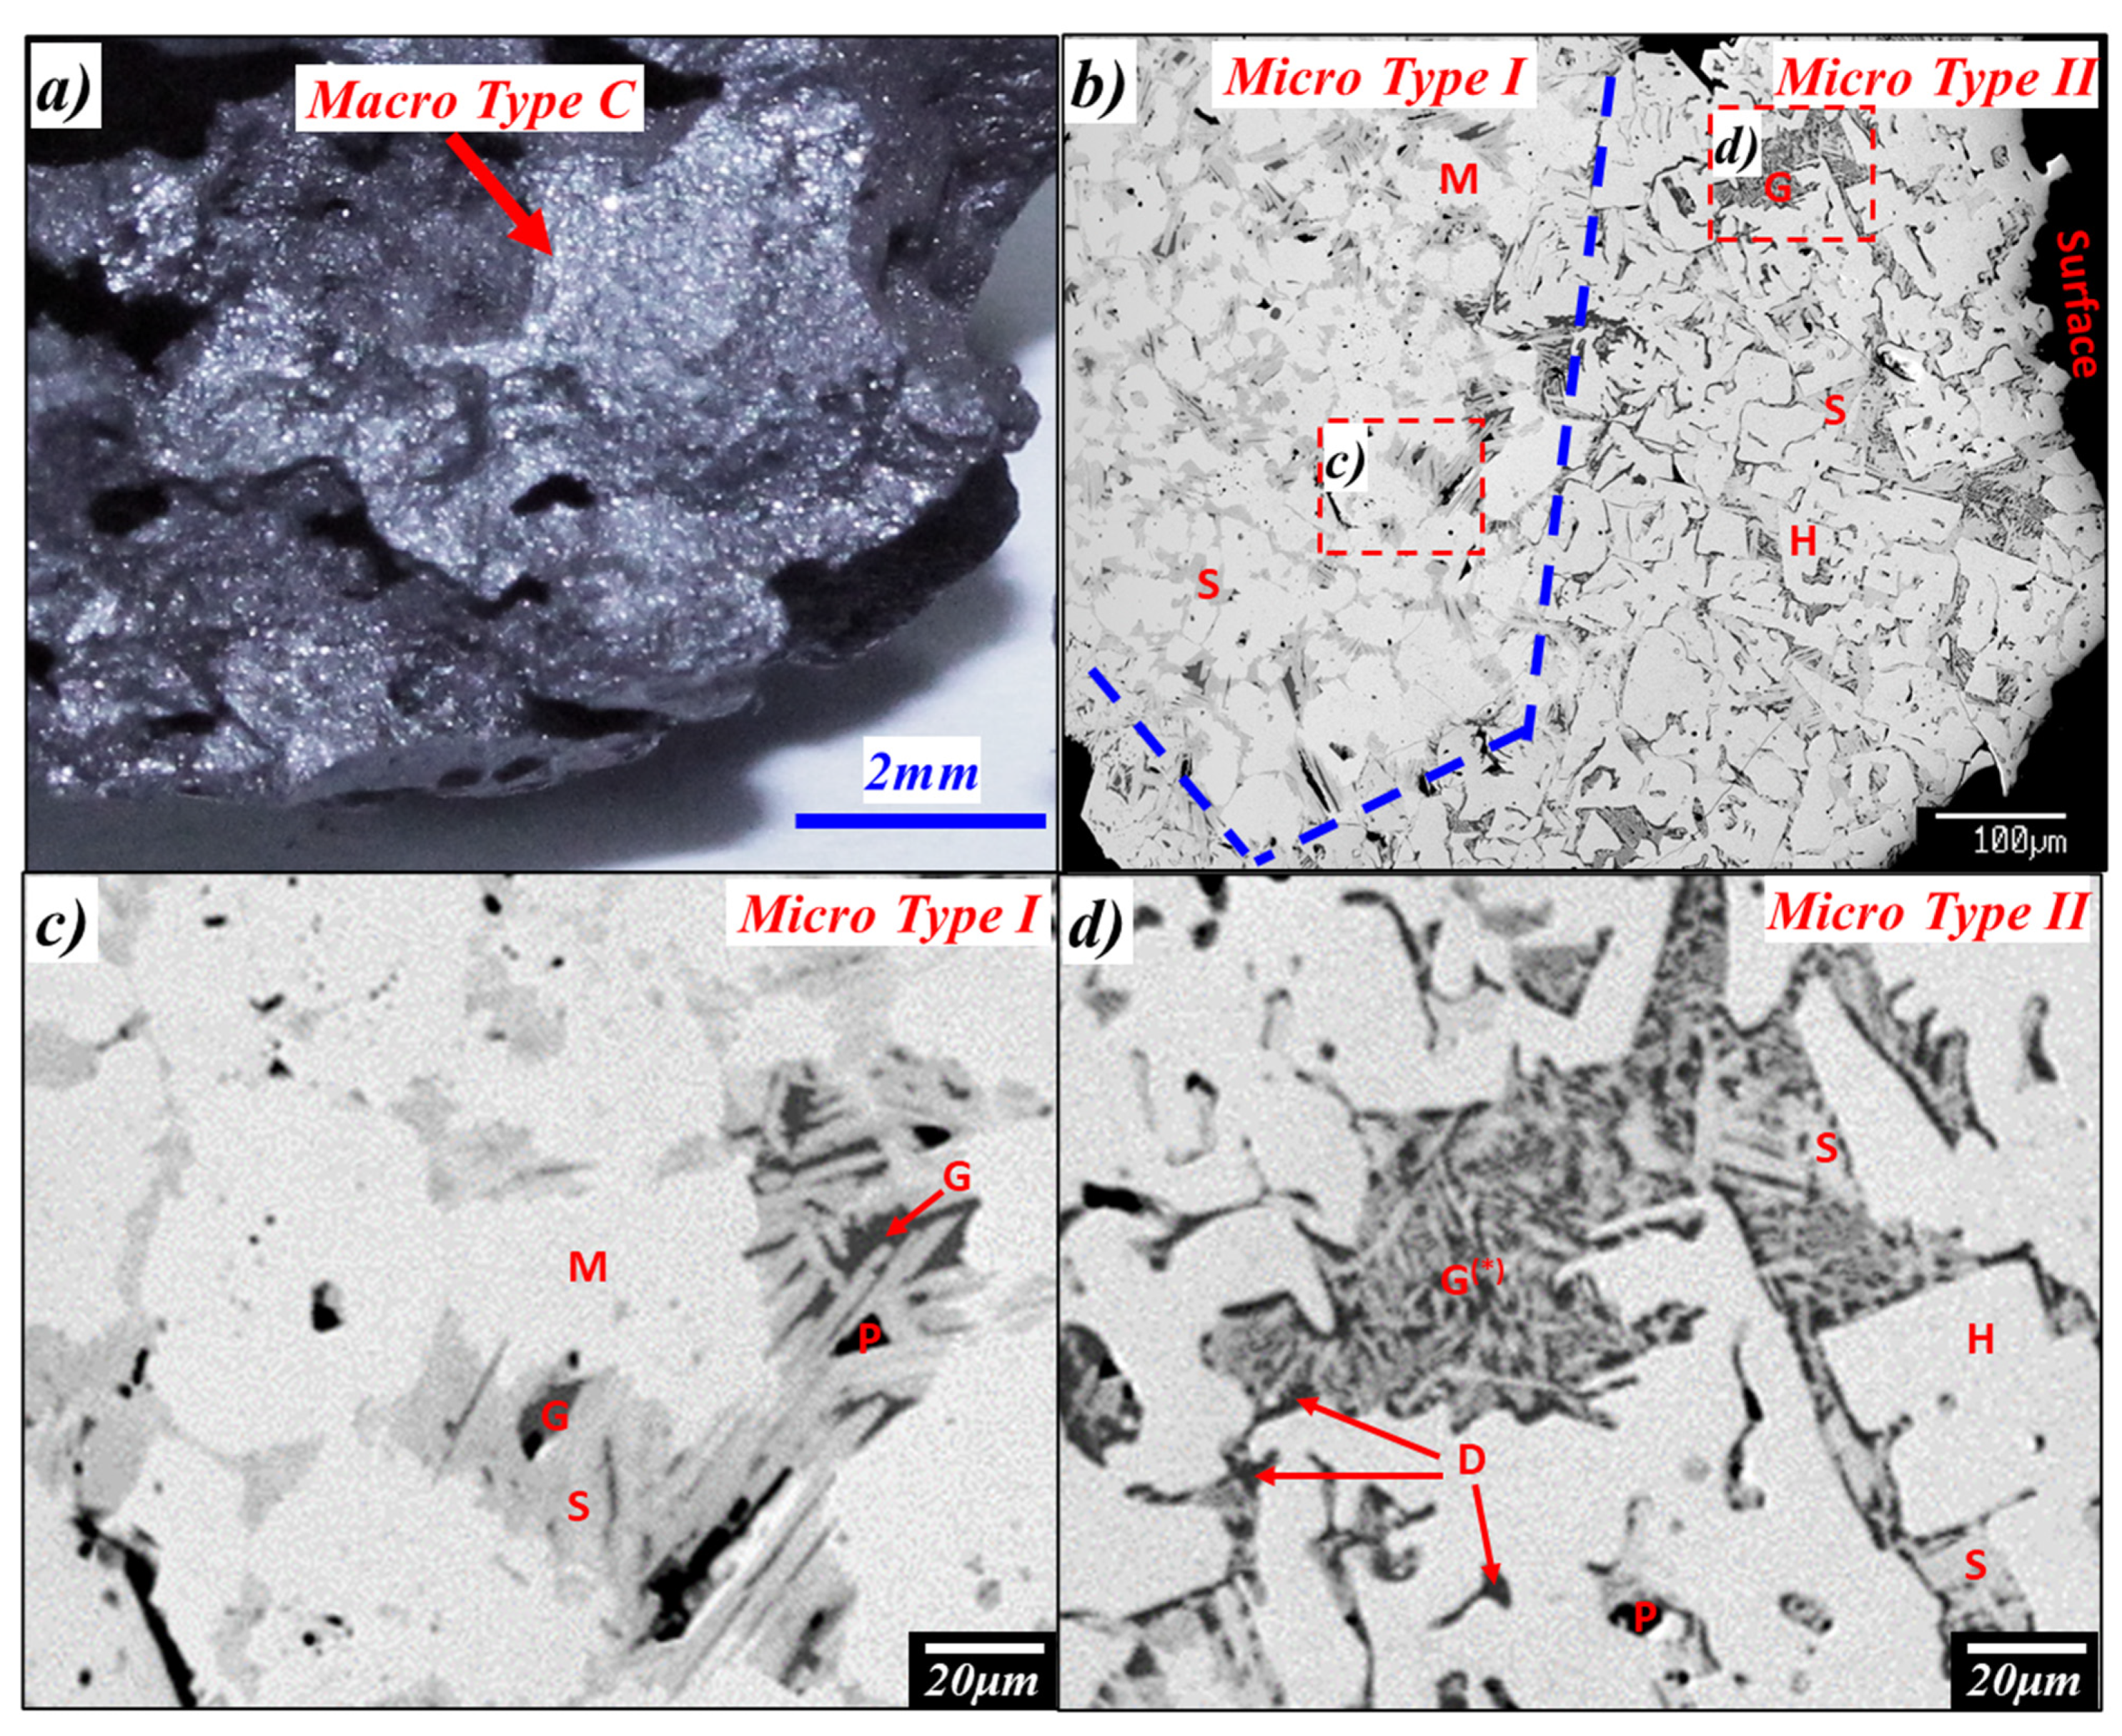
Macro-Type C has a fractured and dense (no pores) surface, is shiny and light-reflective, grey in colour, and relatively weak in strength (tendency to break easily during handling) compared to Macro-Types A and B. This is the region which originally had locally low mechanical endurance and broke during crushing, leaving these fractured areas on the surface of the sinter products. Microstructural analysis of Type C (Figure 6b) areas shows the presence of a surface layer (thickness of ~100–250 μm) of Type II [glass (~12%)] + [euhedral hematite (~69%)] + [minor fine SFCA + C2S (~19%)] adjacent to a bulk material structure Type I (glass + magnetite + plate-like SFCA). There is a clear boundary separating these two micro-structures, indicated by blue dashed lines in Figure 6b. In the microstructure (Type-II) when compared to the bulk material microstructure (Type-I) in the vicinity of the fractured surface, on average it appears that: (i) the proportion of SFCA is significantly lower; (ii) the hematite grains are larger in diameter (~50–100 μm) while the magnetite grains in the underlying bulk material are smaller (~10–100 μm); (iii) the proportion of the glass phase is higher. This may indicate that the mechanical strength of the microstructure Type II (glass + euhedral hematite + minor fine SFCA + C2S) is lower than that of the microstructure Type I (glass + magnetite + plate-like SFCA), in other words, the SFCA network provides a stronger mechanical bonding compared to the glass.
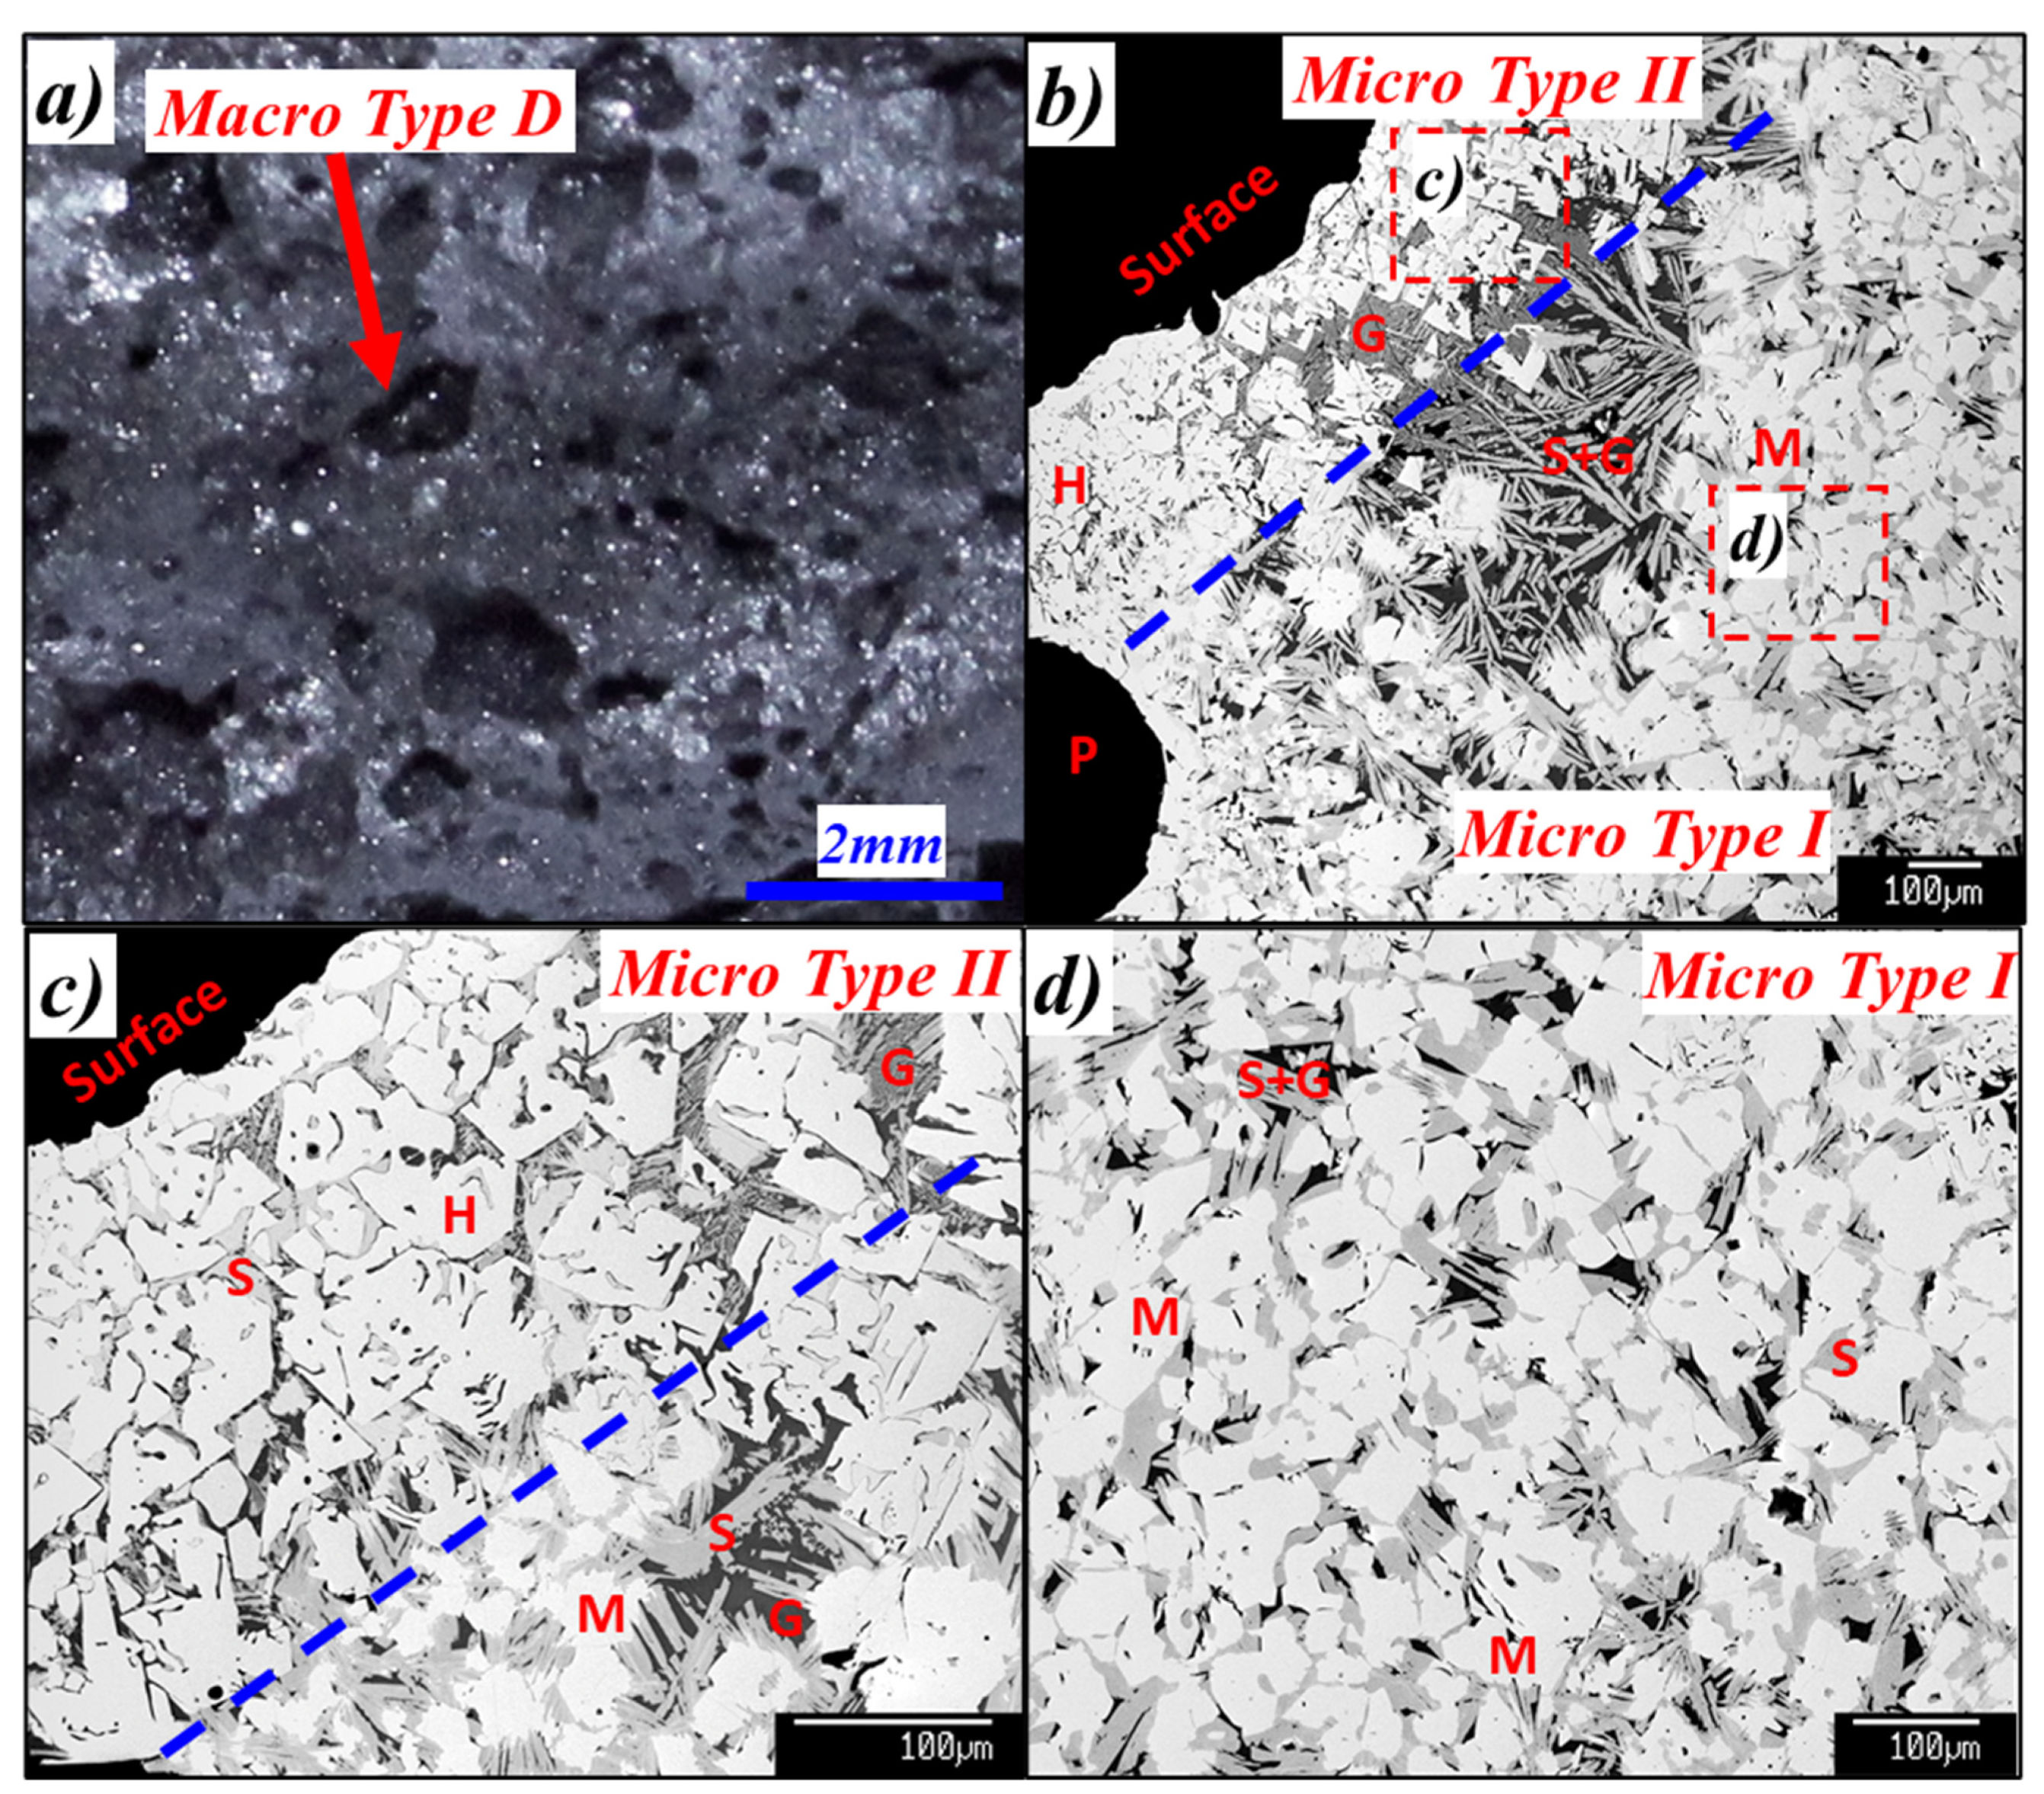
Macro-Type D has a fractured, porous surface (mm to cm-scale diameter pores), is shiny and light-reflective, grey in colour and also relatively weak in strength compared to Types A and B. This is the region with locally low mechanical endurance and subsequently fractured (similar to Macro-Type C). The microstructures in Type D (Figure 7b–d) areas are like those of Type C, where a layer of Type II (glass + euhedral hematite + minor fine SFCA + C2S, Figure 7c) is found on the surface layer of the bulk Type I structure (Figure 7d). The major difference between Types C and D is the high proportion of mm-sized pores in Type D.
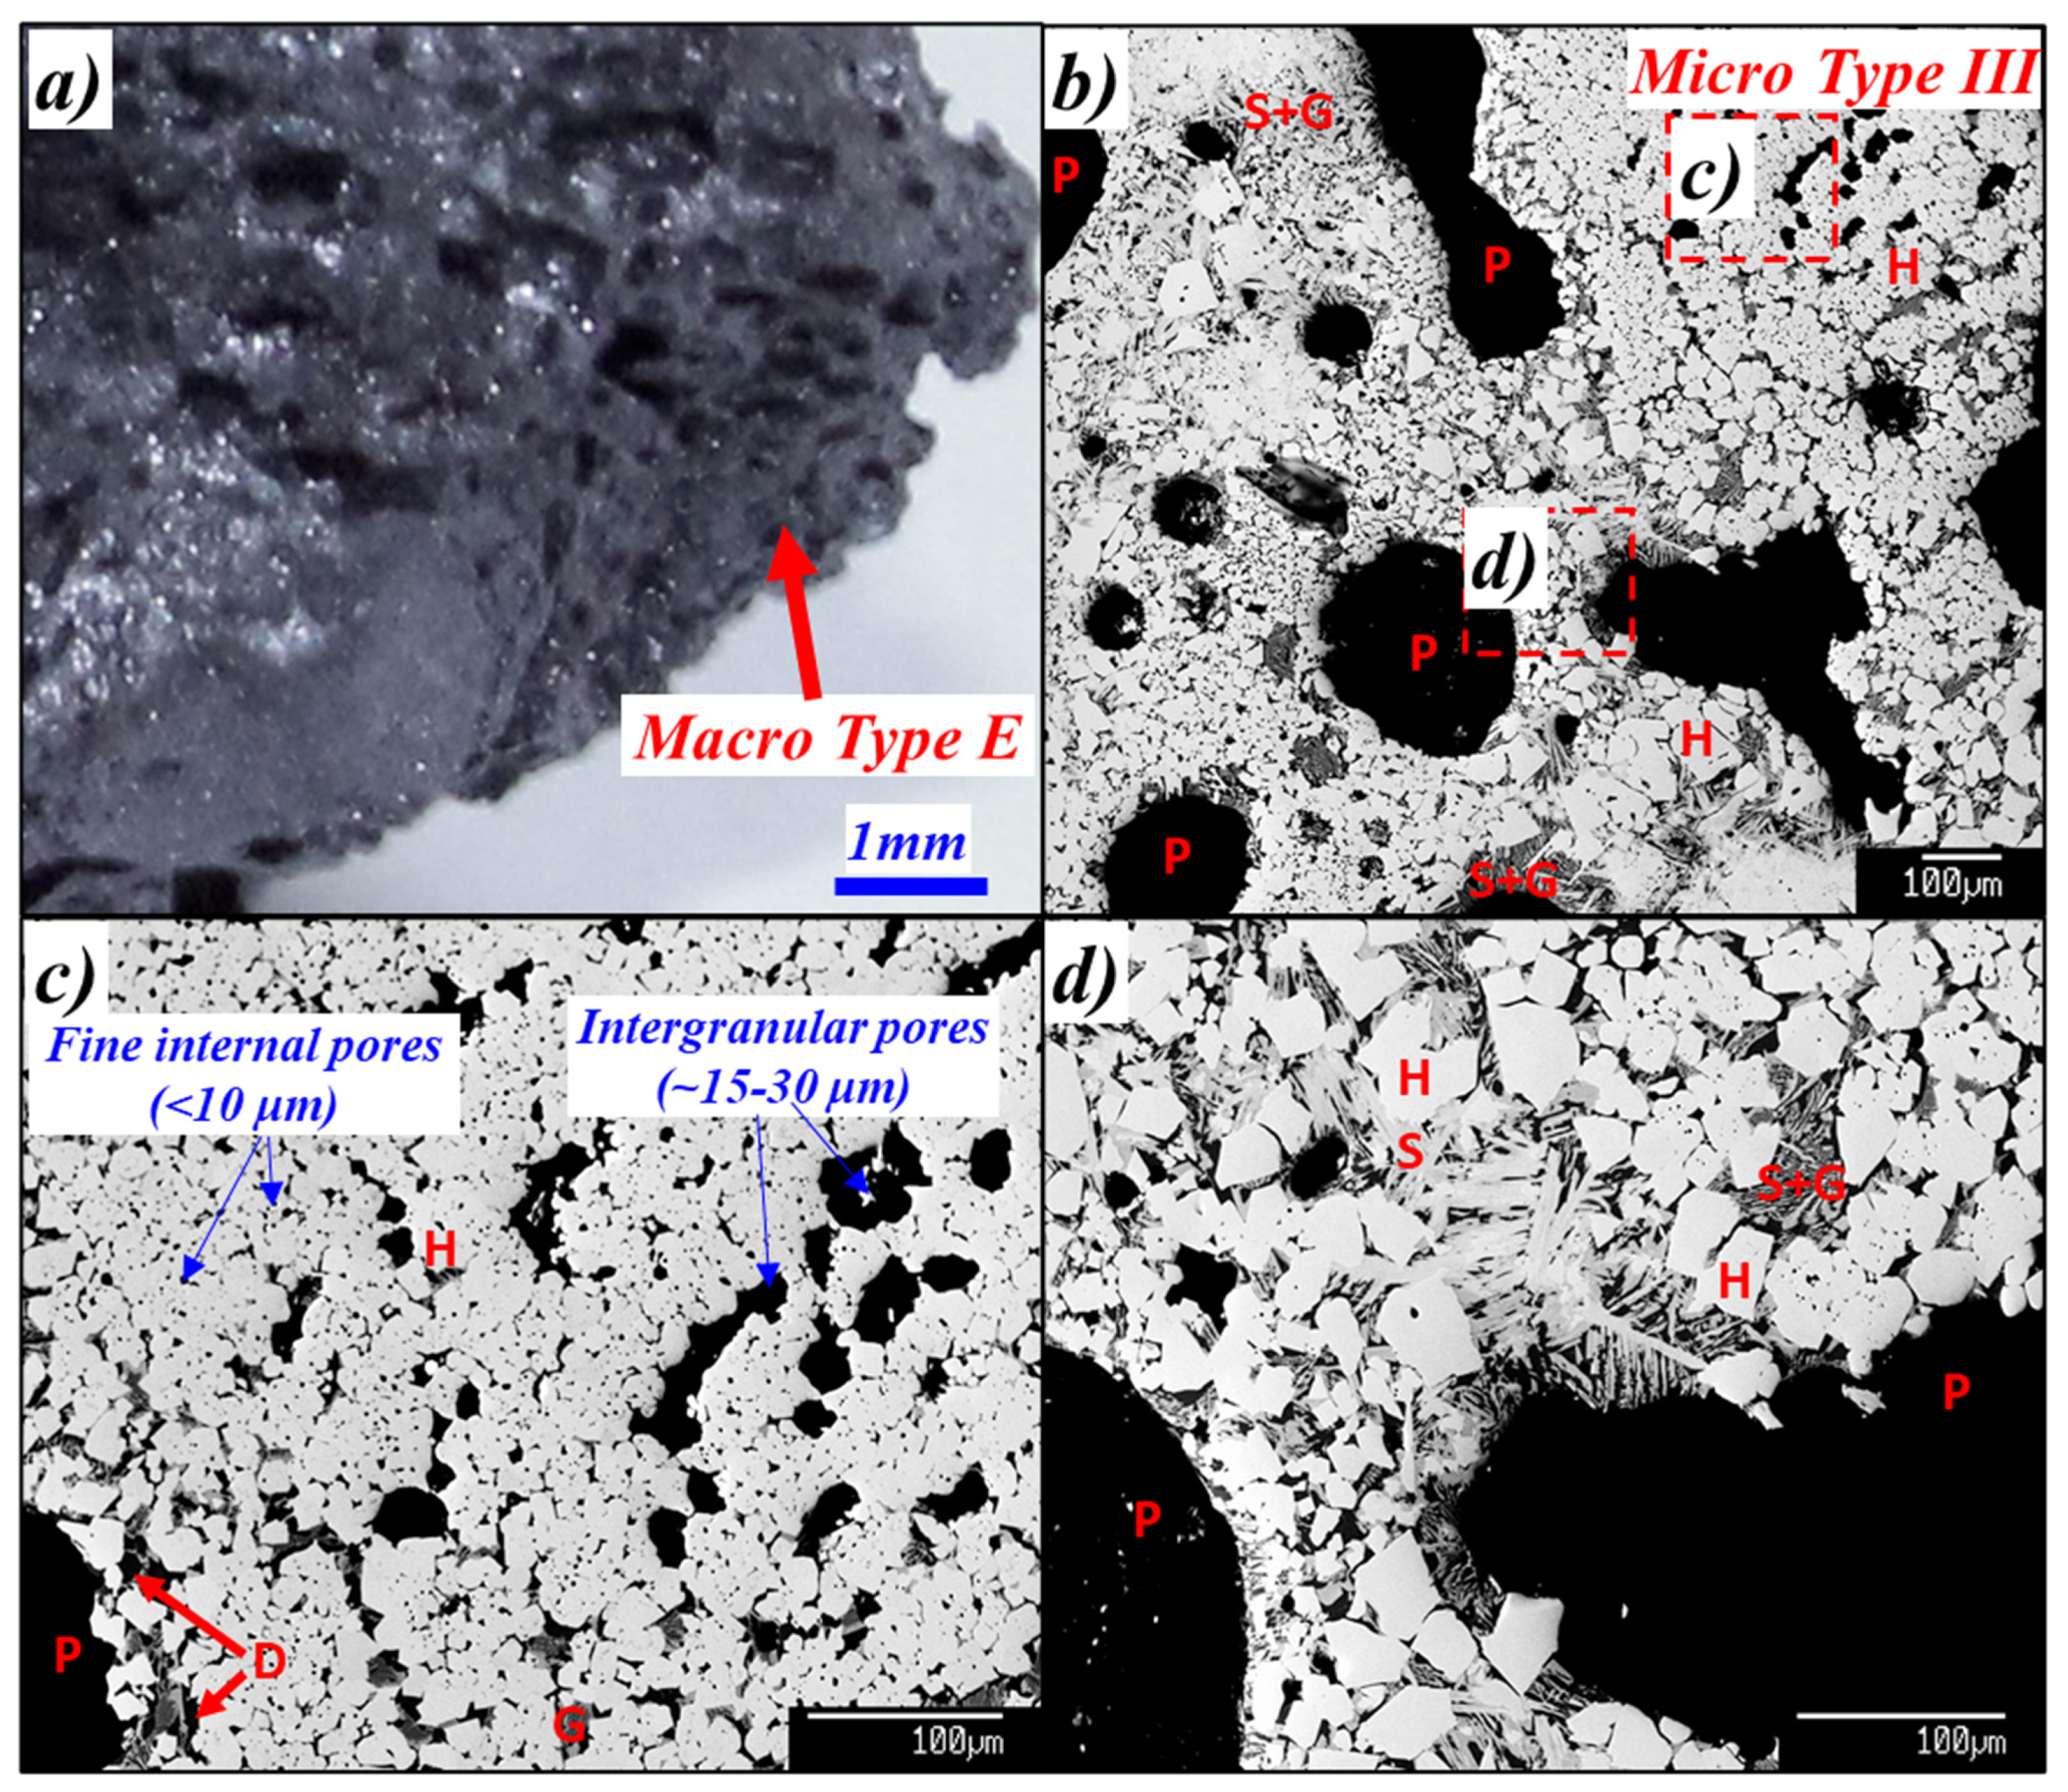
Macro-Type E has a fractured, porous surface (numerous, fine pores sizes <1 mm in diameter), is shiny and light-reflective, grey in colour, and relatively weak in strength compared to Types A and B. Microstructural analysis of Type E (Figure 8) areas shows the presence of predominantly fine, rounded hematite grains which are significantly smaller (<~10–30 μm diam.) than the angular hematite in Type C and D (~50–90 μm diam.) and of large >~30% volume fraction of gas pores (present as either intergranular pores ~15–30 μm or circular closed pores <10 μm in diameter). The vast majority of these hematite crystals were found to associate with dicalcium silicate (C2S) and a glass phase (Figure 8c) while in some local regions, hematite was surrounded by fine, platy, dendritic SFCA crystals associated with a glass phase (Figure 8d). Several large, macro-pores (~100–500 μm diam.) are also observed in this microstructure. No magnetite has been identified locally in this Macro-Type E.
6. Description of and Correlation between Return Macro- and Micro-Structure Types
Examinations of macro- and micro-structures were carried out on the return samples. Five main Macro-Types (F–K) based on their macro-appearances common to all size fractions of return sinter samples were identified.
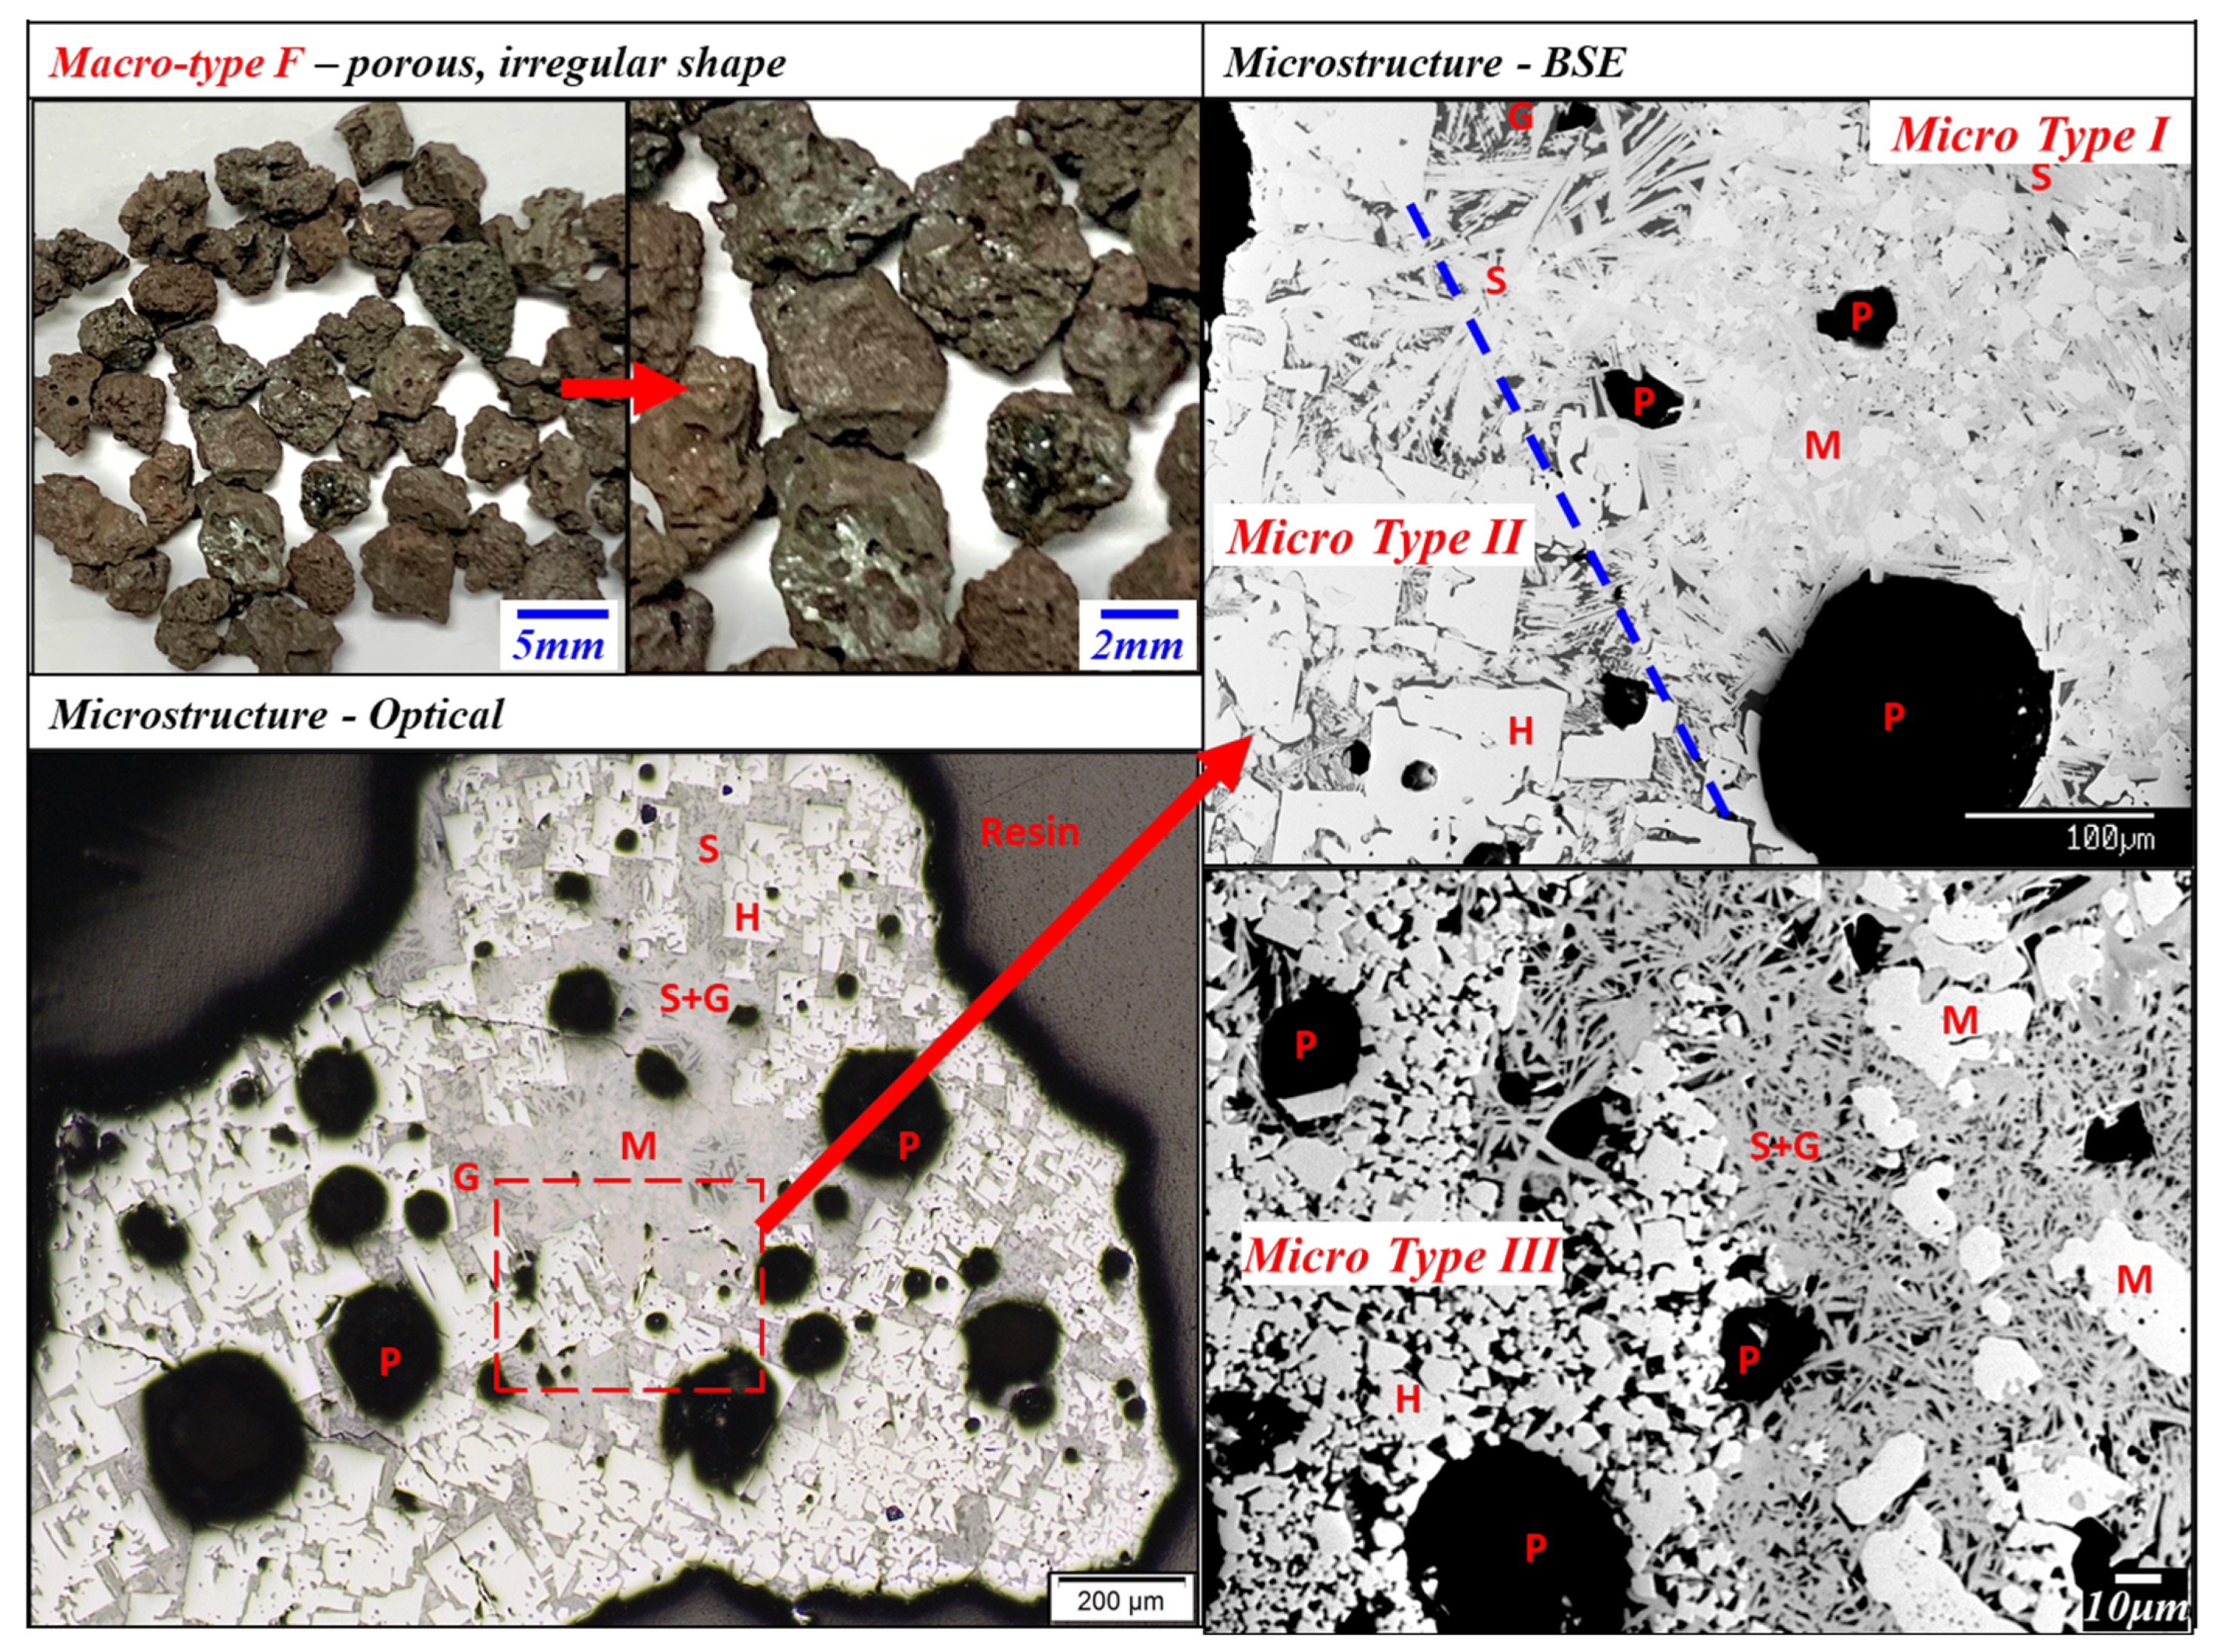
Macro-Type F (~45%) has a porous surface, is irregular in shape, dull (not shiny), and brown to grey in colour. It appears to be formed as the material broken from the bulk sinter product pieces during crushing. The two major microstructures observed in Type F (Figure 9) are: (a) Micro-Type II layered (glass + hematite) on the surface and Micro-Type I (glass + magnetite + acicular SFCA) in the bulk of the particles, which is comparable to the sinter product Macro-Type D; and (b) Micro-Type III (glass + fine hematite with interconnecting pores + fine, platy, dendritic SFCA).
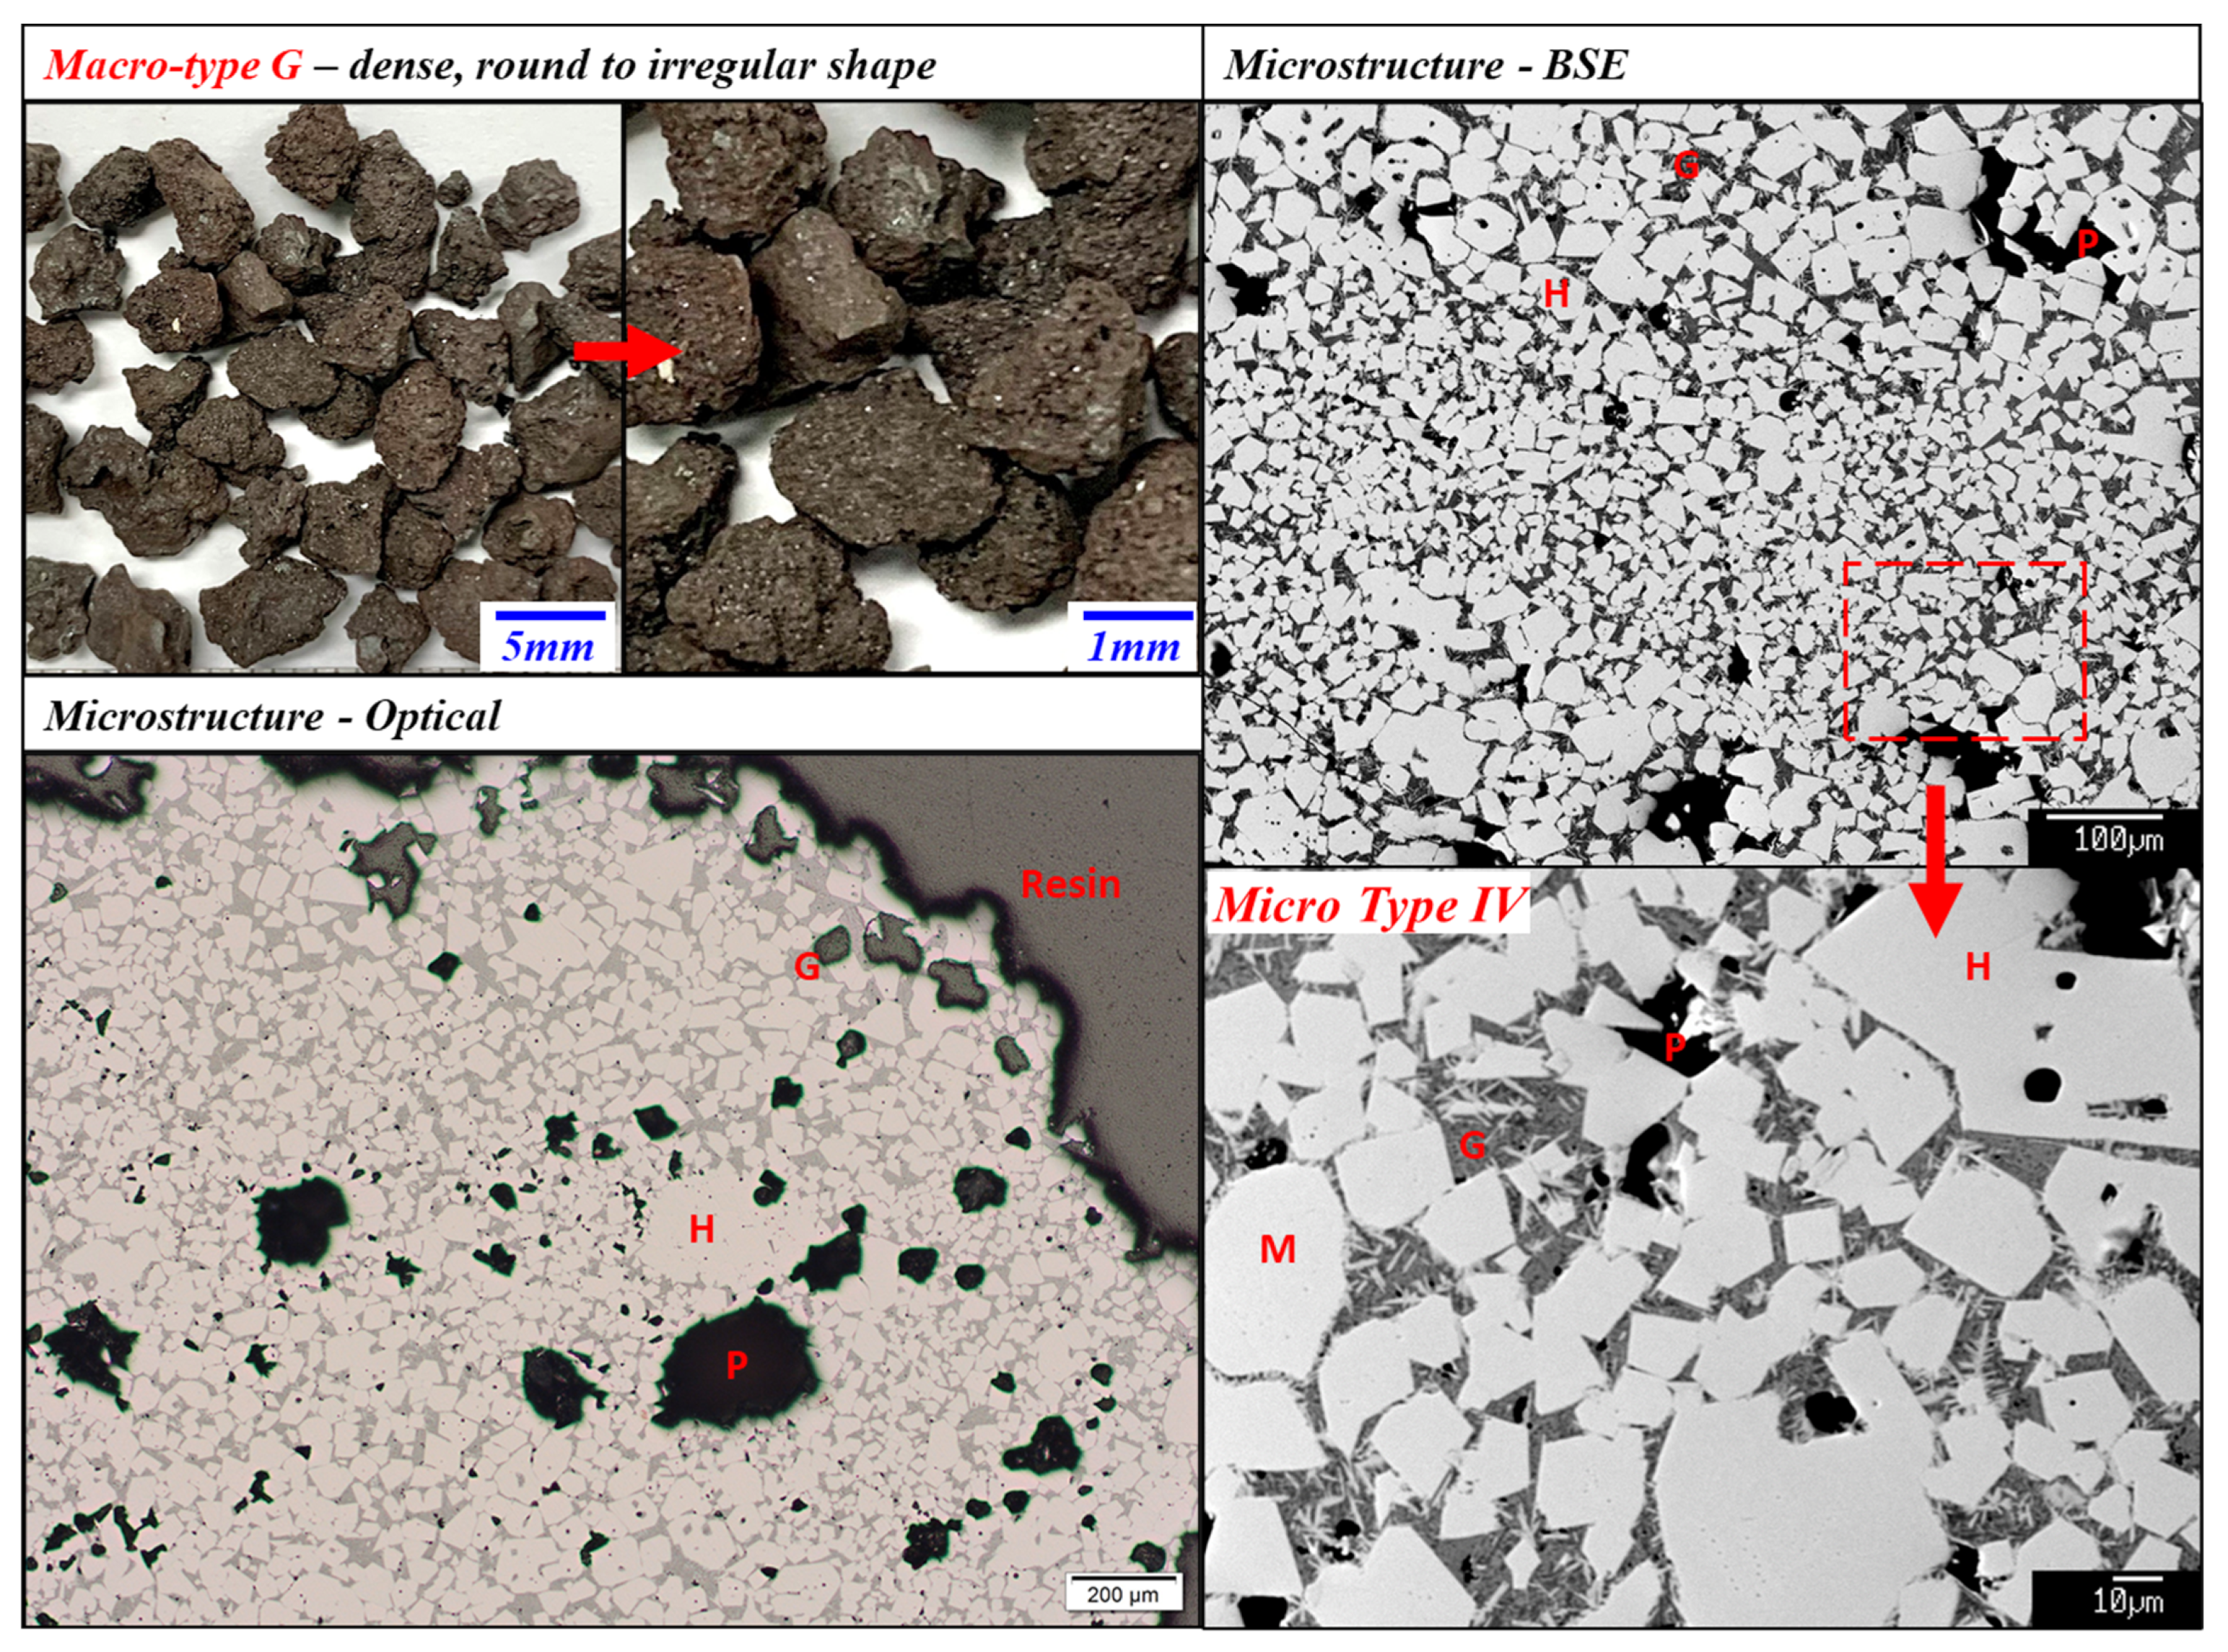
Macro-Type G (~45%) is a dense material (no apparent surface pores), round to irregular in shape, brown to grey in colour (Figure 10) that appears to be formed similar to Macro-Type F. The microstructure predominantly consists of Micro-Type IV—isolated magnetite and hematite grains in a glass matrix; no SFCA is present. Fine hematite crystals present in the glass originating at the surfaces of the iron oxide grains appear to form on solidification of the sinter.
The remaining (~10%) return sinter material consisted of the following Macro-Types:
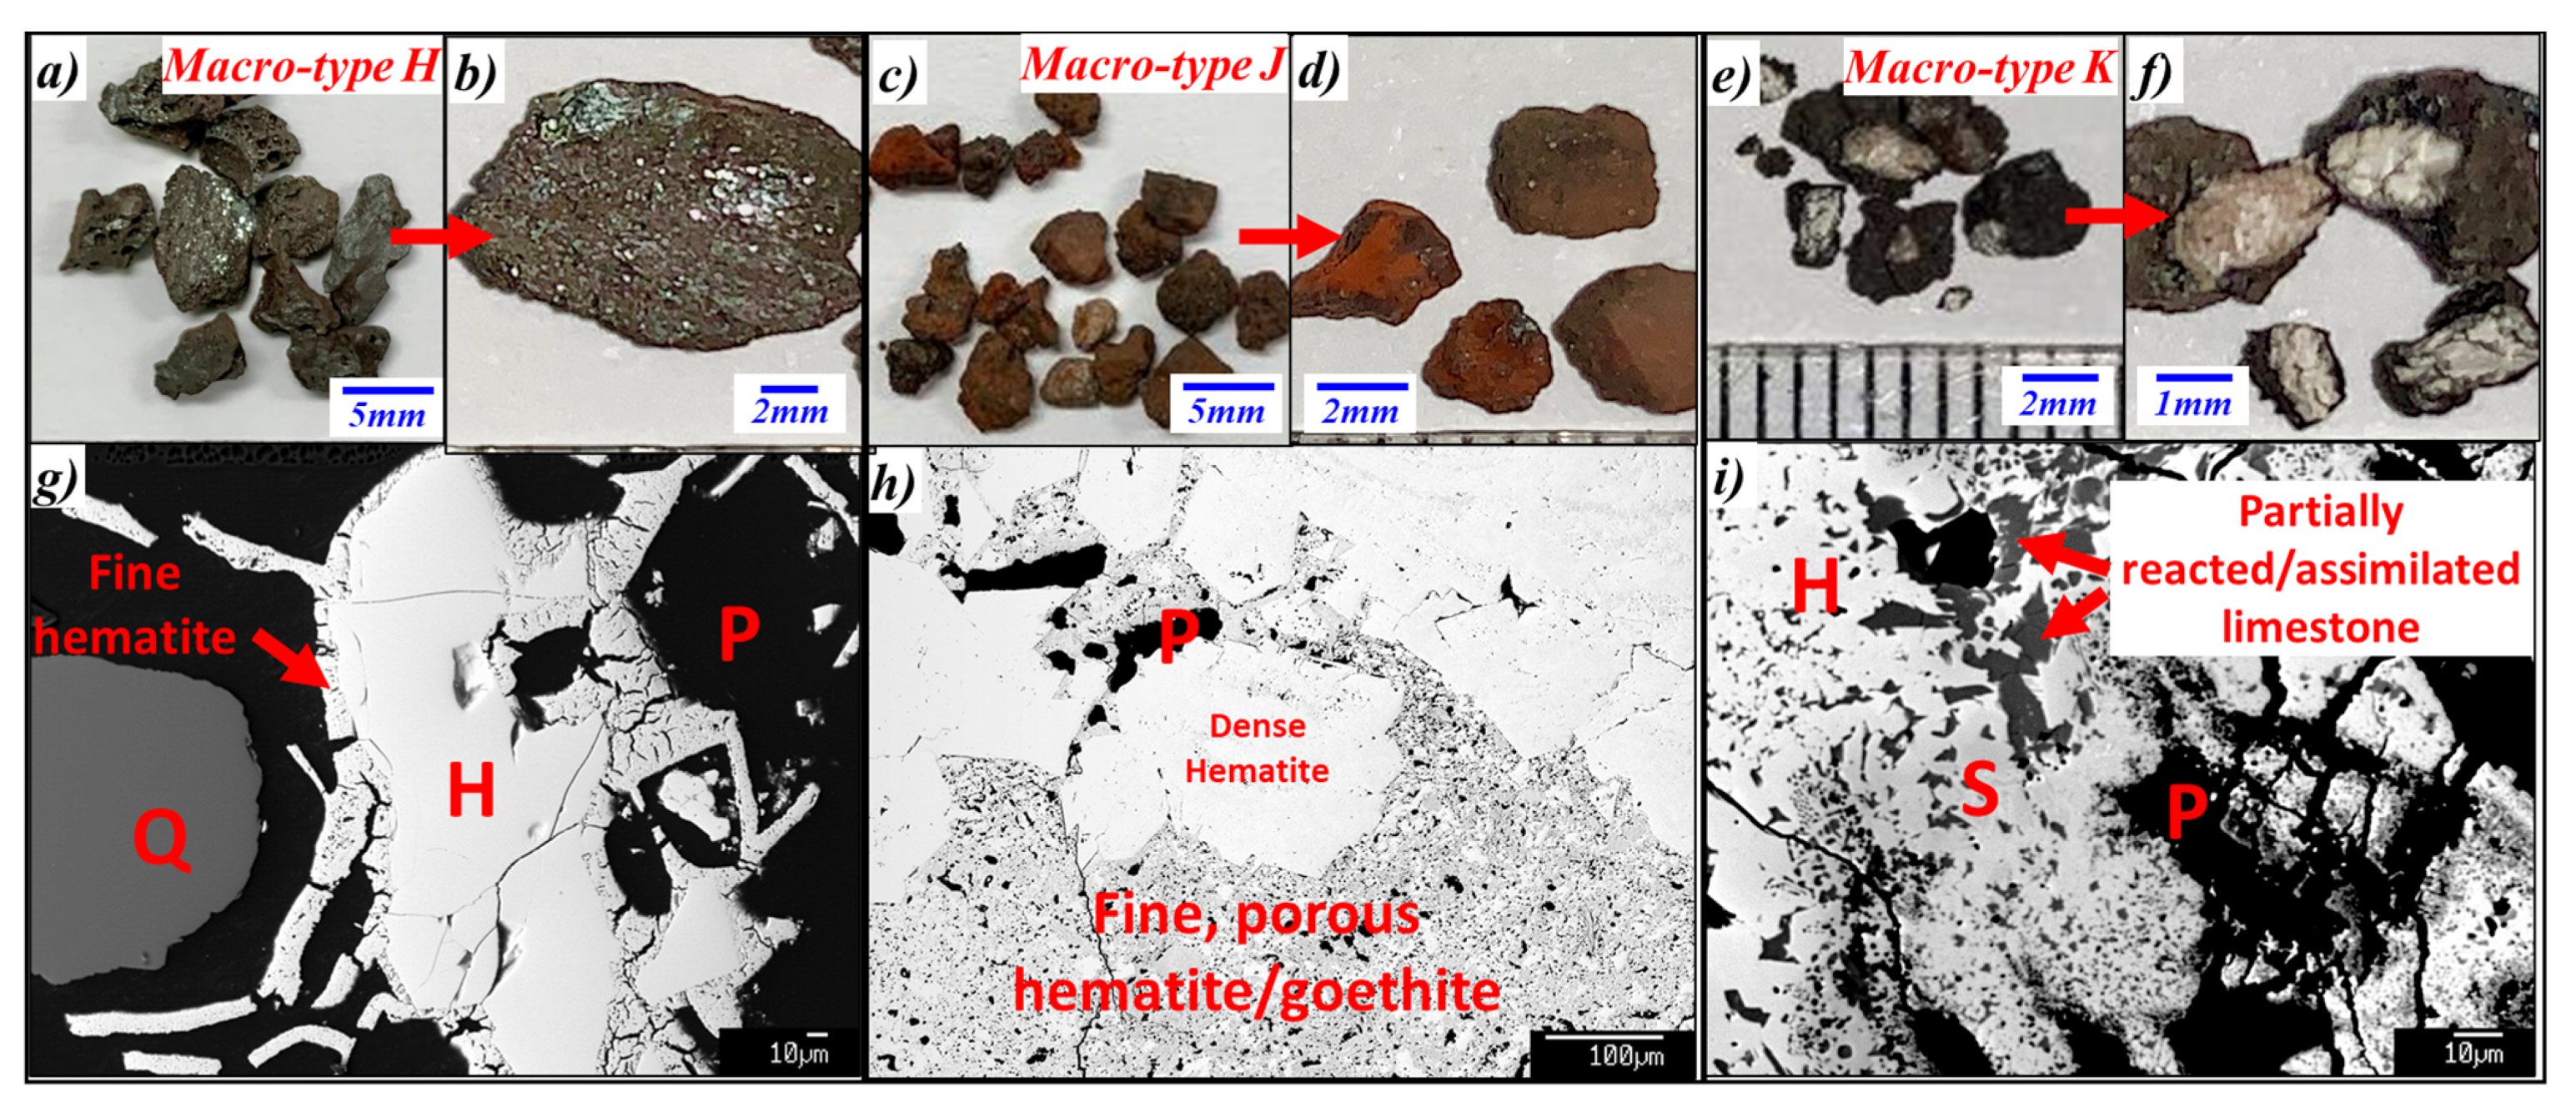
Macro-Type H (~5%) is an irregular shaped material, with light-reflective surfaces, grey in colour (Figure 11a,b,g) and consisting of hematite associated with large unreacted quartz particles (~50–200 μm);
Macro-Type J (~3%) is a mixture of dense and fine porous materials, brown to red in colour, which appears to be a relict hematite ore (Figure 11c,d,h). Interestingly, Macro-Type J sinter return containing Type E microstructure, consisting of fine hematite grains and fine pores, is only a small fraction of the sinter returns;
Macro-Type K (~2%) is white, partially assimilated lime, with the CaO attached to hematite (Figure 11e,f,i).
7. Formation of Sinter Microstructures from Oxide Melts
The normalised compositions of the phases present measured using EPMA and the original analytical totals of oxides (indicated as “old total”) are reported in Table 3. Volume proportions of the phases estimated using Image J software 1.51k (developed by Wayne Rasband, National Institutes of Health, Bethesda, MD, USA) [28] are also included.
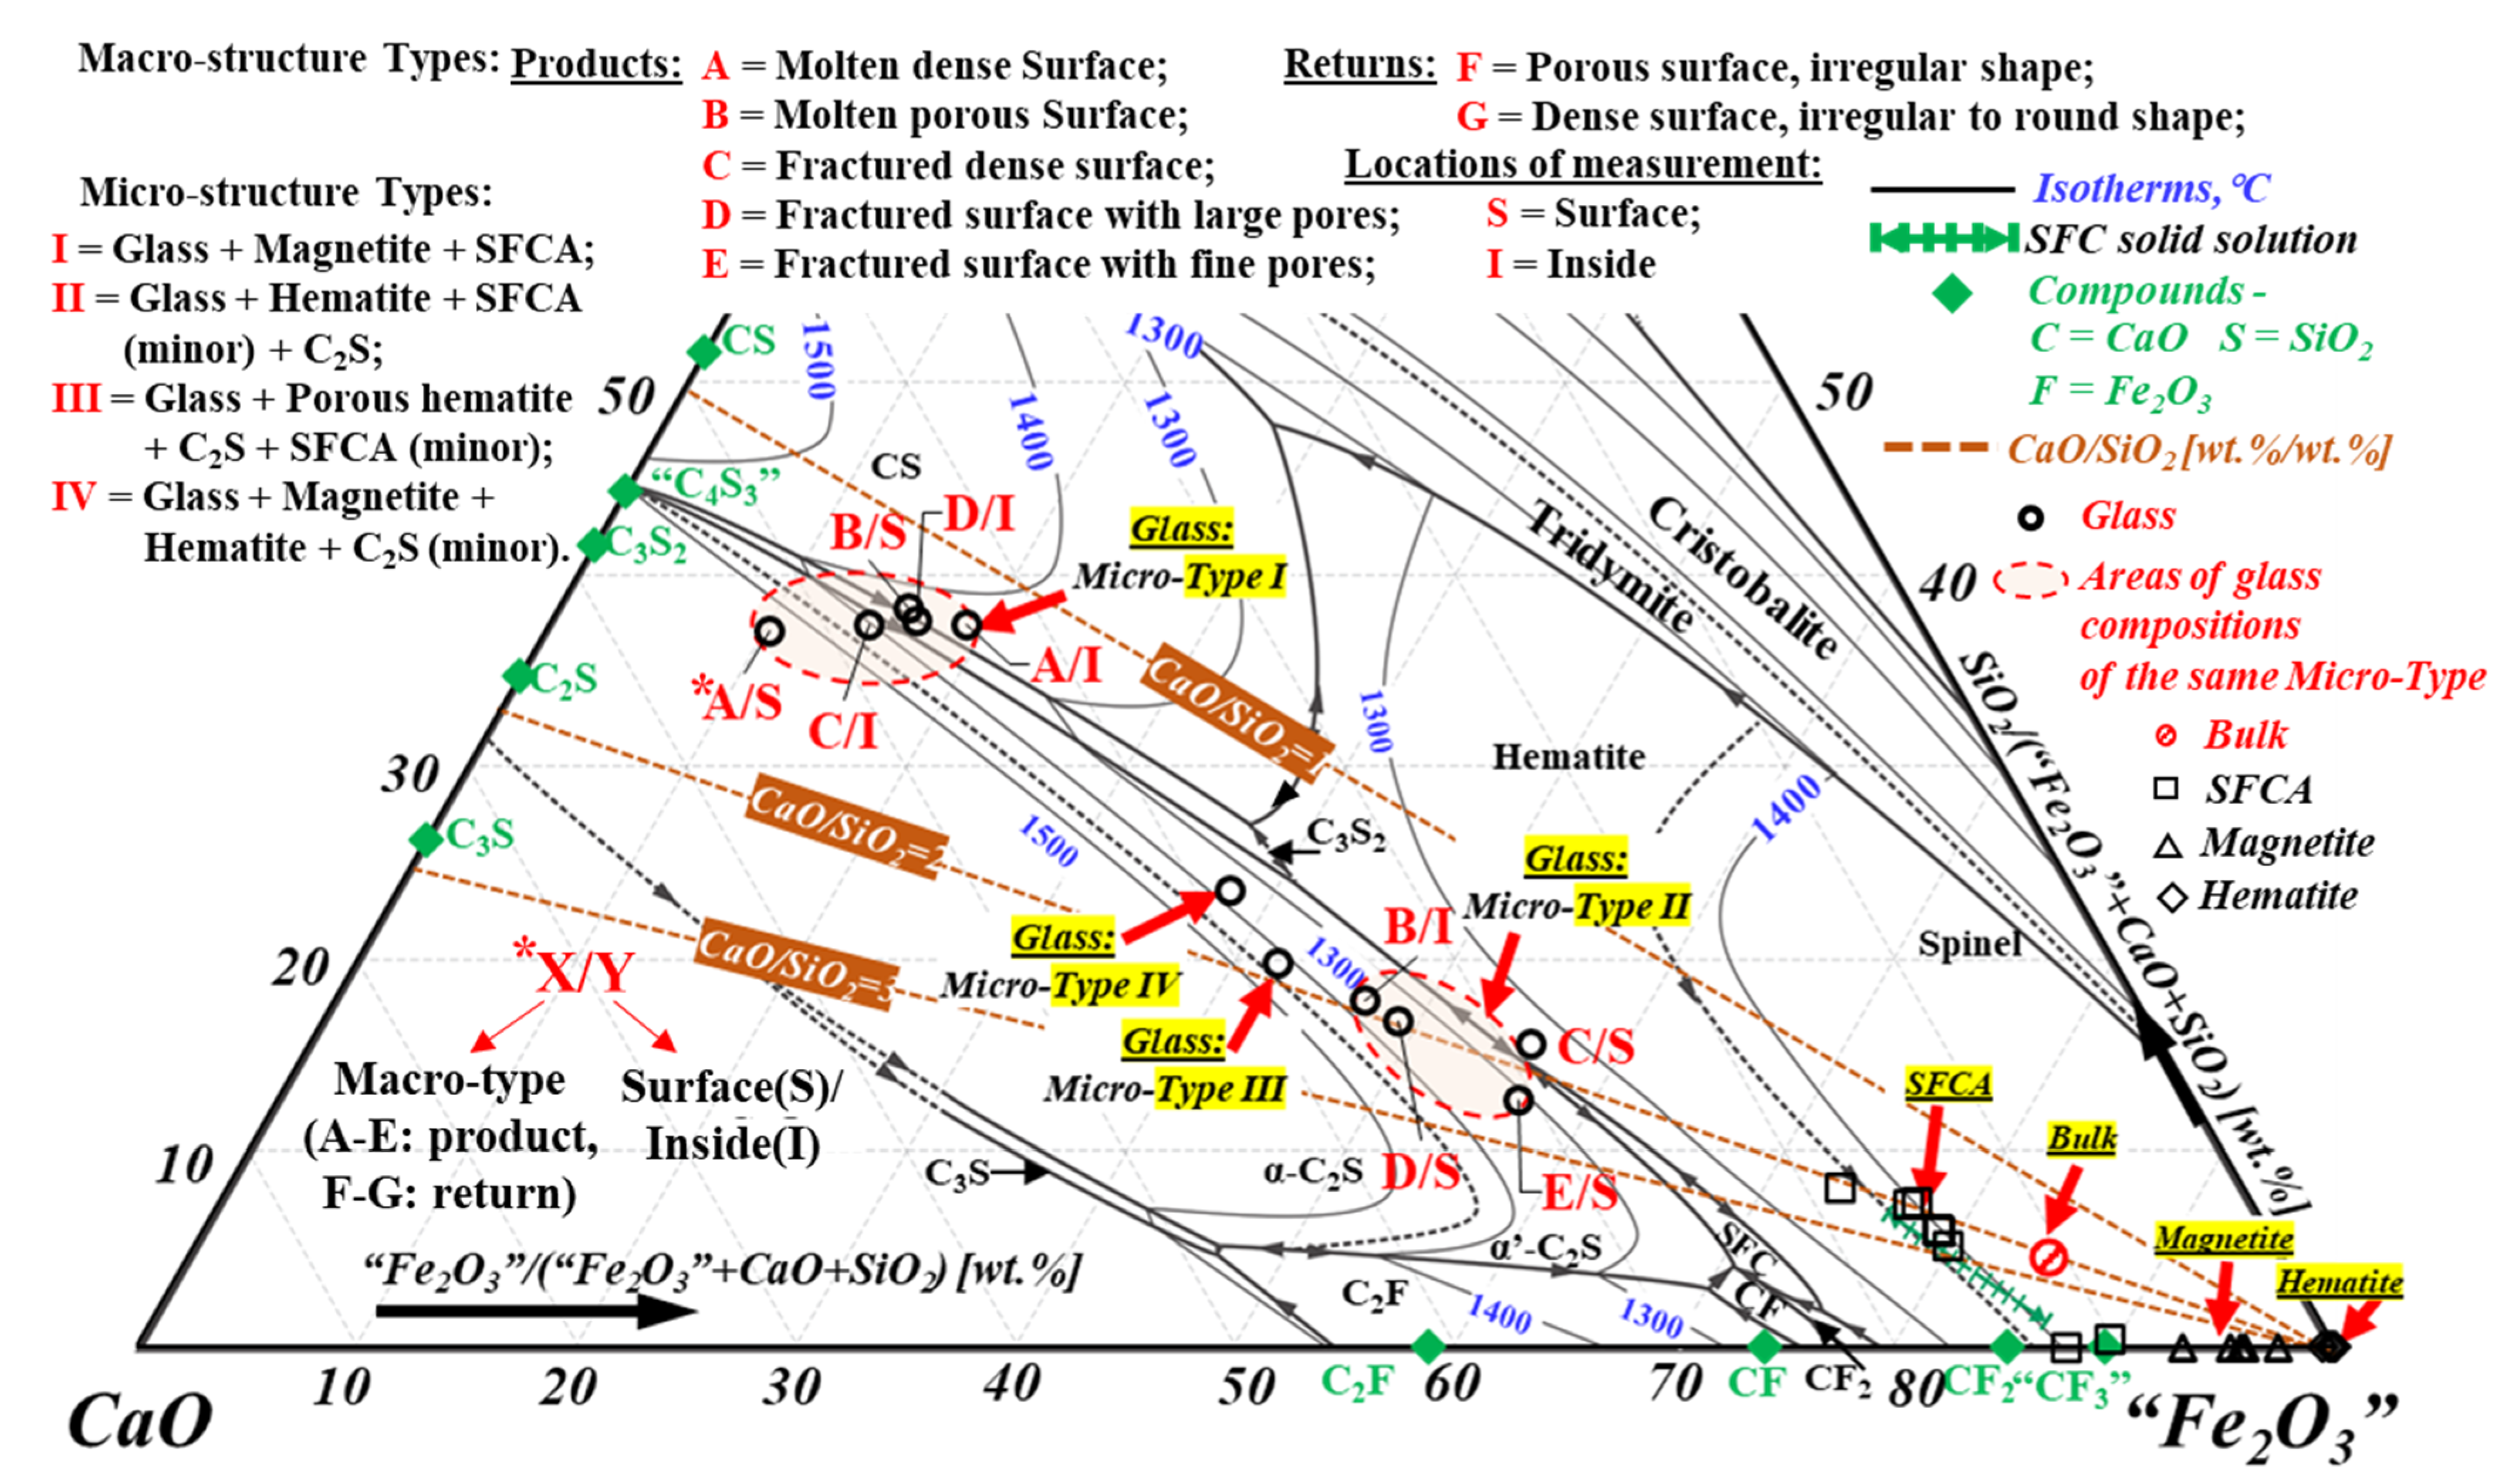
The normalised compositions of the phases present in the sinter microstructures, Types I–IV reported in Table 3, projected onto the liquidus of the pseudo-ternary “Fe2O3”-CaO-SiO2 system in air [20], are shown in Figure 12.
The projection of the glass (formerly liquid) compositions measured in different Mic rostructure-Types (I~IV) are located in different regions of the diagram describing the liquidus of the “Fe2O3”-CaO-SiO2 diagram in air. The microstructures and the corresponding liquid compositions appear to neither agree with those anticipated from equilibrium solidification based on the liquidus of the system, nor do they follow the Scheil–Gulliver solidification behaviour, indicating that a more complex, non-equilibrium solidification behaviour took place during sintering.
In Microstructure-Type I areas containing glass, magnetite and SFCA phases, the glass has an average composition of approximately 14 wt% “Fe2O3”, 45 wt% CaO and 36 wt% SiO2, CaO/SiO2 = 1.26. Inspection of Figure 12 indicates that equilibrium solidification of liquid of this composition would result in the formation of the C2S, CS and C3S2 phases in addition to hematite on solidification. However, none of these calcium silicate phases were formed in the samples. In addition, the SFCA phase is present in contact with the liquid of the CaO/SiO2 wt. ratio = 1.26, but based on the phase diagram on Figure 12, this phase is only formed from melts with the CaO/SiO2 wt. ratio greater than 1.9 (corresponding to the C2S-hematite join).
This microstructure could be explained by two hypotheses:
Hypothesis 1.
The impurities (mostly Al2O3, and P2O5, TiO2, MgO, etc.) present in the liquid phase substantially change the shape of the liquidus surface in this system relative to the pseudo-ternary “Fe2O3”-CaO-SiO2 system.
Hypothesis 2.
Kinetic factors that change the sequence of solidification and the resulting phase assemblage.
Any hypothesis should satisfactorily explain the microstructural features. Inspection of the effect of alumina on the liquidus provided in the Slag Atlas [29] (based on the data by Kalmanovitch and Williamson [30]) shows that this is not consistent with Hypothesis 1, only minor changes in the position of the phase boundaries take place for these low concentrations of Al2O3.
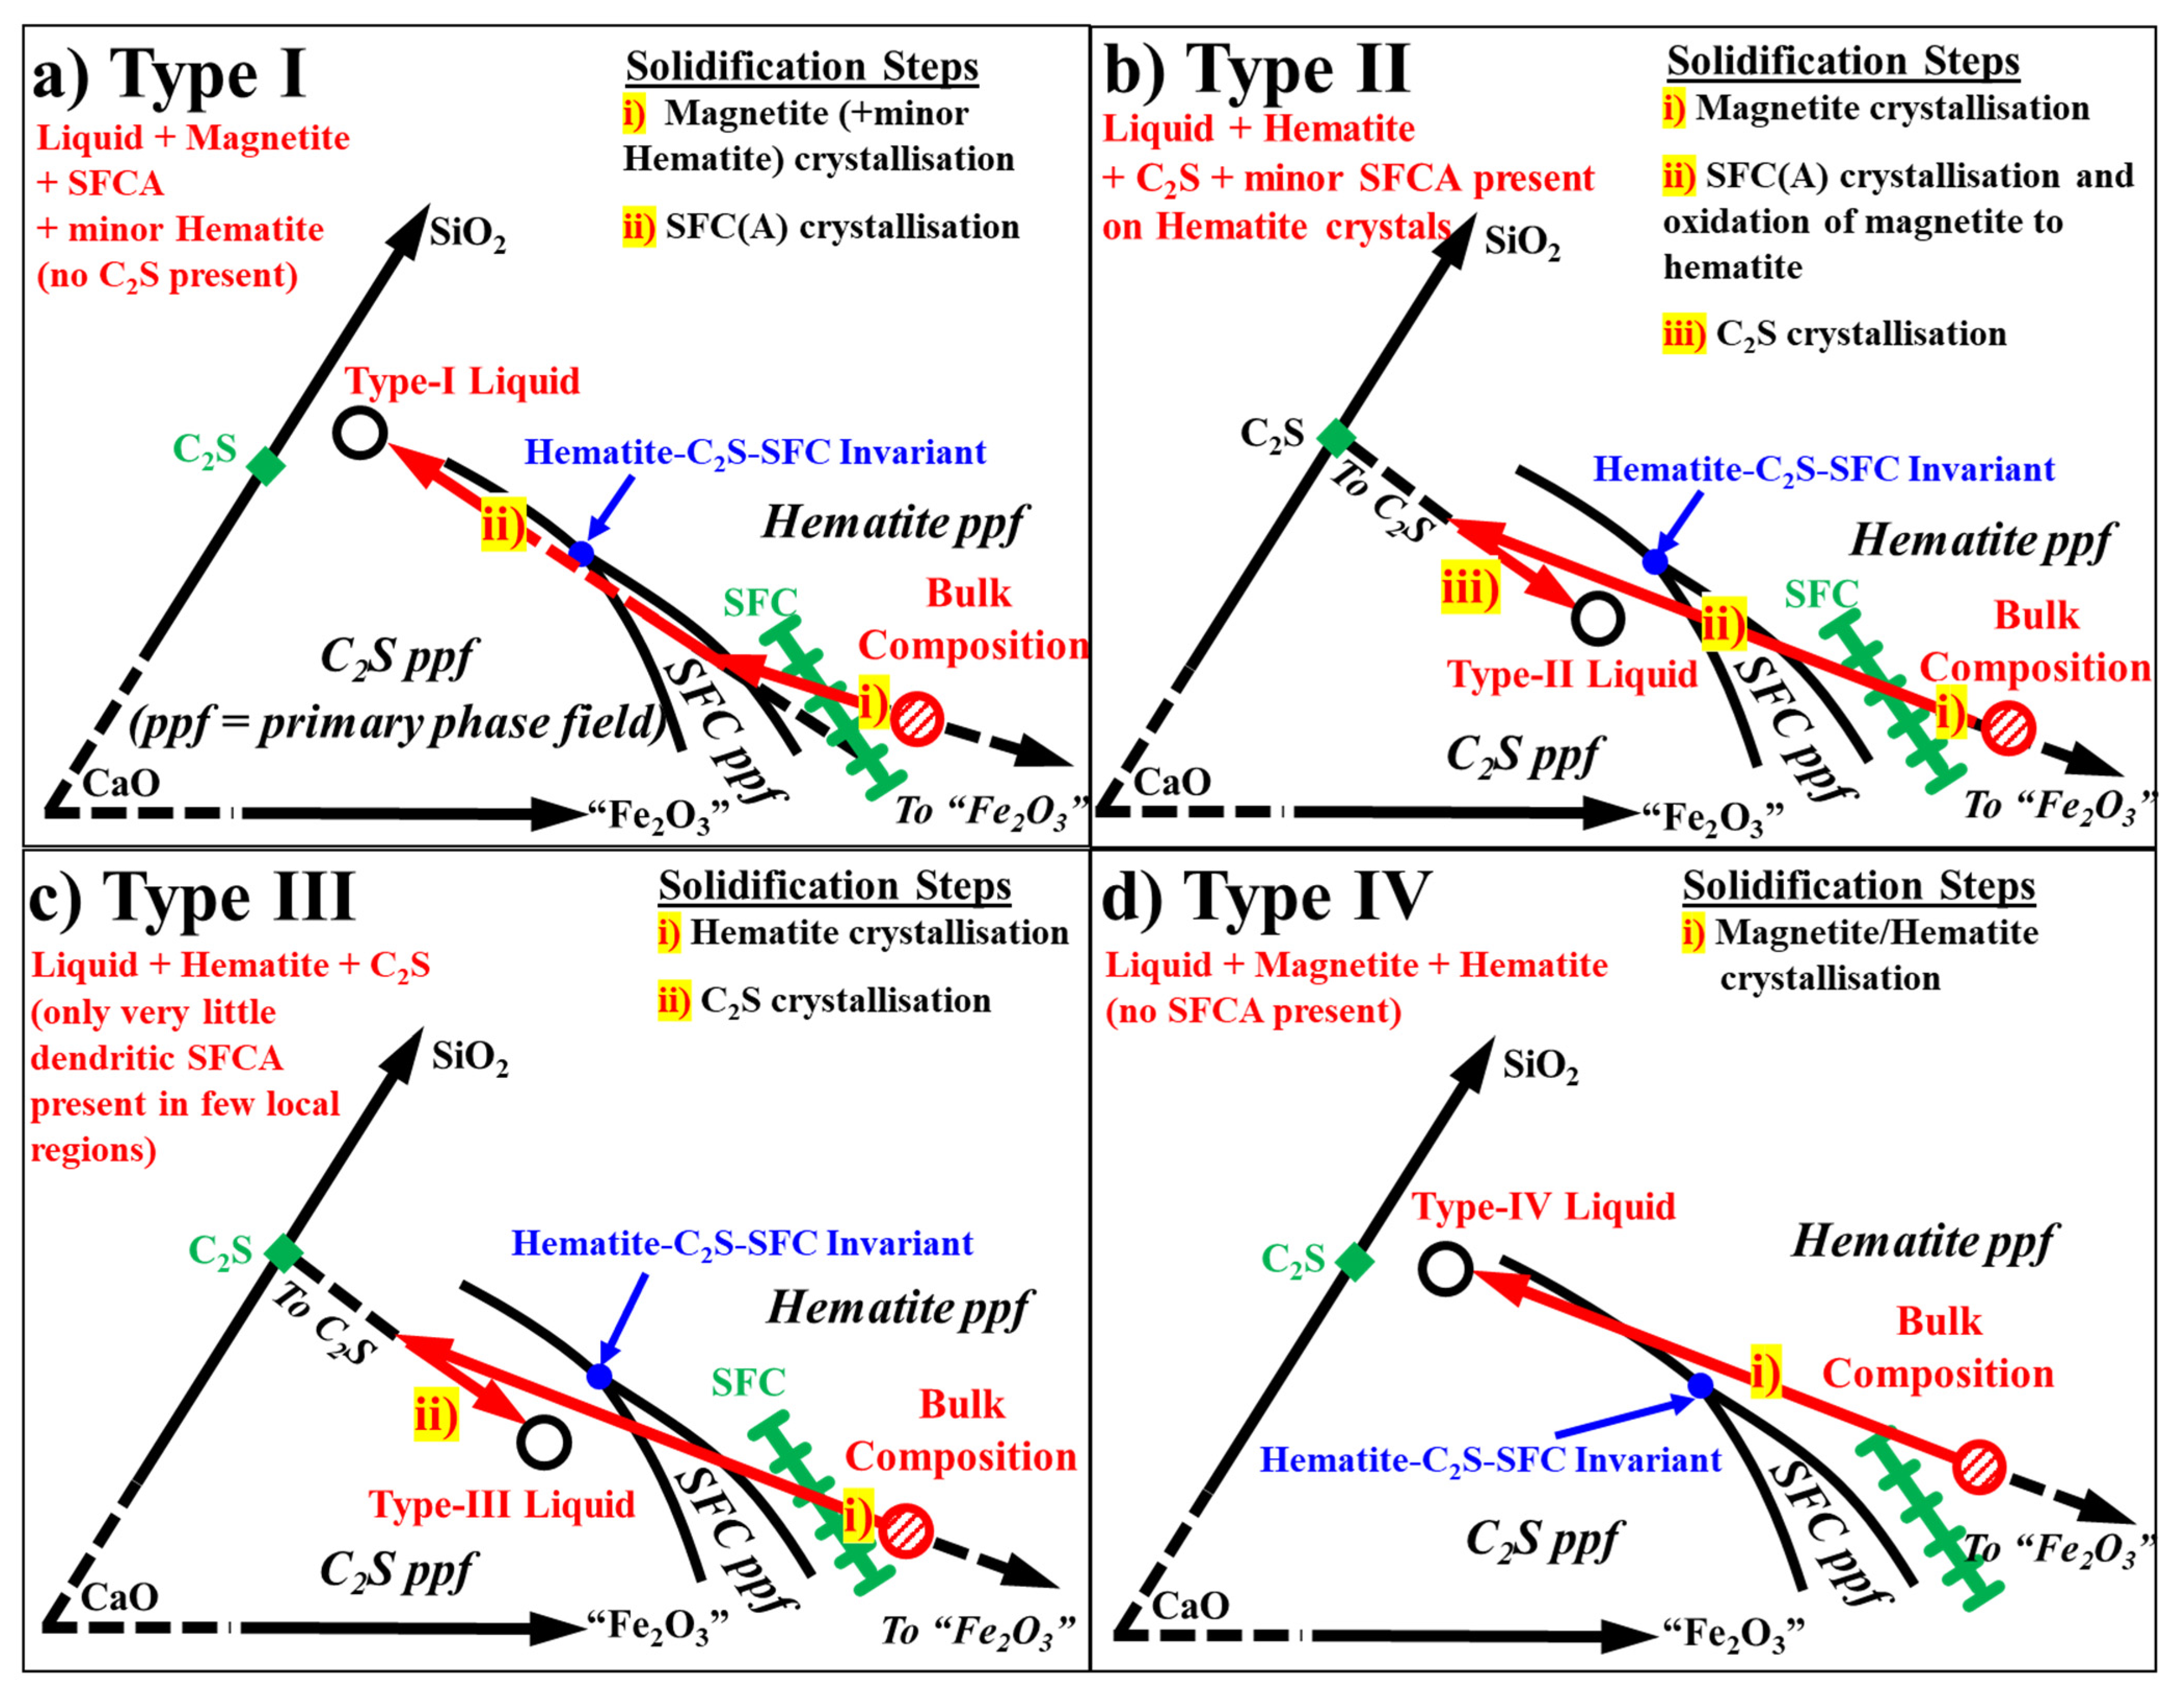
Magnetite + SFCA contributes to approximately 90% volumetric fraction of the Microstructure-Type I; there is no evidence of the presence of C2S. The presence of the SFCA phase in this microstructure means that the original liquid in this portion of the sinter contained CaO/SiO2 greater than 1.9. The presence of predominantly magnetite rather than hematite indicated a relatively low pO2 at the start of the crystallisation. Previous studies undertaken on the solidification of phases in the “Fe2O3”-CaO-SiO2 system [25,26,31] demonstrated that the kinetics of nucleation and growth of complex oxides are slow and that solidification reactions do not follow those anticipated from the equilibrium or Sheil–Gulliver crystallisation. The second hypothesis of kinetics factors affecting the solidification sequence appears to explain formation of the microstructure Type I. The following non-equilibrium solidification path from the starting bulk composition is proposed and is schematically shown in Figure 13a:
Step (i) Magnetite solidification: The solidification of the bulk liquid from peak bed temperatures and lower pO2 (with the presence of coke) results in the nucleation and growth of the primary phase magnetite. As the temperature decreases the proportion of magnetite increases and the liquid composition changes directly away from the “Fe2O3” apex of the “Fe2O3”-CaO-SiO2 diagram.
Step (ii) SFCA formation: As solidification continues, the liquid composition meets the SFC(A) primary phase field, which results in the heterogeneous nucleation of SFC(A) on the magnetite–liquid interface by a peritectic reaction: (Liquid + Magnetite → SFCA). The preferential nucleation of SFCA on magnetite has been described and reported by Nicol et al. [26]. Some of the SFC(A) could also have precipitated from the liquid through homogeneous nucleation on solidification. The CaO/SiO2 ratio in the SFCA is greater than in the remaining liquid so more CaO than SiO2 was removed on solidification from the melt, moving the liquid composition on a trajectory towards lower CaO/SiO2 ratios and lower iron oxide concentrations.
Step (iii): It was then anticipated from equilibrium or Scheil–Gulliver solidification that C2S would form upon complete solidification. However, the current microstructure indicates that the heterogeneous nucleation of the C2S phase on the pre-existing magnetite and SFCA does not readily occur and SFCA continues to solidify extracting more CaO, Fe2O3 and SiO2 from the bulk liquid.
Step (iv): Upon further solidification, the undercooled liquid transitions to a glassy state in which the components are no longer mobile, limiting further crystallisation and the liquid is retained as a metastable glass phase to room temperature.
Large, acicular SFCA crystals are commonly observed in close association with the magnetite crystals (in Micro-Type-I), while significantly less SFCA is found in the vicinity of hematite crystals. This is consistent with the preferential heterogeneous nucleation and growth of SFCA on magnetite surfaces over hematite, the mechanism proposed in the recent study on melt solidification in this system [26].
In sinters with Microstructure-Types II containing predominantly hematite, liquid and C2S phases, the liquid has a composition of approximately 47 wt% “Fe2O3”, 32 wt% CaO and 16 wt% SiO2, CaO/SiO2 wt. ratio = ~2.0. Inspection of Figure 12 indicates that equilibrium solidification of the initial melt corresponding to the liquid of this composition would result in the formation of the SFC(A) through the peritectic reaction: (Liquid + Hematite → SFCA). However, the microstructure (Figure 3b and Figure 7c) contains little SFCA present and on only some of the hematite crystals (in contrast to the microstructure in Type I where the “host” magnetite was completely encapsulated by SFCA). In addition, C2S is found to be present on the surface of the hematite crystals and within the partially crystallised glass phase. The hematite grains are ~50–90 μm diameter and angular in shape, significantly different from those found in Types I, III and IV. The microstructures can be explained by similar consideration of the kinetic factors as discussed in Type I. A non-equilibrium solidification path from the starting bulk composition is proposed and schematically shown in Figure 13b:
Step (i): It is proposed that this hematite grain structure is, in fact, that of secondary hematite, formed by the oxidation of the primary magnetite. It can be seen in Figure 6 and Figure 7 that Type II microstructures are only to be found as reaction layers formed on the Type I microstructures, indicating that Type-II microstructures could have been originally exposed to oxygen sources in the gas phase. Based on the findings reported in the study by Nicol et al. [26], it is argued that the first step in the formation of Type II structures is the solidification of primary magnetite (Type I—Step (i)).
Step (ii): On solidification, as outlined for the formation of Type I structures, the liquid composition meets the SFCA primary phase field, which results in the heterogeneous nucleation of SFCA on the magnetite–liquid interface by a peritectic reaction: (Liquid + Magnetite → SFCA). Some of the SFC(A) could also have precipitated from the liquid through homogeneous nucleation on solidification. This is the same as Type I—Step (ii)). At the same time, with exposure to the oxidising gas atmosphere at high temperature, oxidation of the previously formed magnetite can take place. The mechanism of the liquid-assisted oxidation reaction was described in detail by Nicol et al. [26]. This exothermic reaction has the effect of locally heating the material and redissolving most of the SFCA, increasing the fraction of liquid phase and transforming the magnetite to hematite through a liquid phase oxidation mechanism, and promoting growth in the diameter of the resulting angular hematite grains.
Step (iii) C2S formation: As the material is further cooled, the liquid composition enters the C2S primary phase field, however, the rate of nucleation of this phase is slow and the liquid becomes undercooled with respect to this new phase. As was observed in previous studies by Nicol et al. [21,22,23,24,25] the composition of this liquid moves into the C2S primary phase field. Nucleation of C2S, when it does occur, takes place preferentially by heterogeneous nucleation of C2S on the interface between liquid and the pre-existing hematite grains (see Figure 3b). The precipitation of C2S results in the extraction of CaO and SiO2 from the liquid phase therefore moving the liquid composition on a trajectory towards higher “Fe2O3” concentrations in the “Fe2O3”-CaO-SiO2 system. Some residual glass is formed.
In sinters with Microstructure-Types III containing predominantly hematite, liquid and C2S phases, the liquid has a composition of approximately 40 wt% “Fe2O3”, 36 wt% CaO and 19 wt% SiO2, CaO/SiO2 wt. ratio = ~1.9. It should be noted that the hematite grains present in this Microstructure-Type are relatively fine (20–50 μm diameter) and round in shape associated with a number of external and intergranular pores (see Figure 3 and Figure 8). These are different from the large, angular, and euhedral hematite formed in Microstructure-Type II, indicating the hematite in Type III could be the primary (relic) hematite that was transformed from goethite in the original ore. Based on Figure 12 it can be expected that equilibrium solidification of liquid of this composition would result in the formation of the SFC(A) through the peritectic reaction: (Liquid + Hematite → SFCA) or through homogeneous nucleation from the liquid, however very little fine, dendritic SFCA is found in this microstructure (only observed in some local regions). The microstructures of these dendritic SFCA being closely associated with the glass phase rather than the hematite crystals (see Figure 8d) indicated that these SFCA could have precipitated from the liquid. Their fine, dendritic structures do not seem to contribute to the overall sinter mechanical strength, and these microstructures do contain C2S.
The microstructures can be explained by non-equilibrium solidification from the proposed starting bulk composition which is schematically shown in Figure 13c):
Step (i) Hematite solidification: The solidification of the bulk liquid from peak bed temperatures results in the nucleation and growth of the primary phase hematite or transformation of primary goethite from original ore to hematite. The presence of hematite rather than magnetite indicates a history of relatively higher pO2 or lower temperature locally in this region during sintering. As the temperature decreases the proportion of hematite increases and the liquid composition changes directly away from the Fe2O3 apex of the “Fe2O3”-CaO-SiO2 diagram. Minor SFCA was also precipitated from the liquid phase upon further solidification.
Step (ii) C2S formation: As solidification further continues, the liquid composition enters the C2S primary phase field, which results in the heterogeneous nucleation of C2S on the interface between liquid and the pre-existing hematite grains (Figure 3c and Figure 8c) or on the interface between liquid and the pre-existing SFCA grains (Figure 8d). The precipitation of C2S is associated with the extraction of CaO and SiO2 from the liquid phase therefore moving the liquid composition on a trajectory towards higher “Fe2O3” concentrations in the “Fe2O3”-CaO-SiO2 system. This type of solidification behaviour from the bulk liquid was reported in previous solidification studies in the same “Fe2O3”-CaO-SiO2 system by Nicol et al. [21,22,23,24,25]. In comparison with the liquid composition in Micro-Type II, given the similar proportion of C2S in these two Micro-Types, the resulting CaO concentration in the liquid/glass in Type III is slightly greater than in Type II since no SFCA is present in Type III.
In sinters with Microstructure-Types IV containing predominantly magnetite, hematite and liquid, the liquid has a composition of approximately 33 wt% “Fe2O3”, 38 wt% CaO and 24 wt% SiO2, CaO/SiO2 = ~1.6. Inspection of Figure 12 indicates that (i) solidification of the original liquid would not result in the formation of SFC(A) as this CaO/SiO2 ratio is lower than the critical condition defined by the join between C2S and Fe2O3; (ii) the formation of C2S is anticipated to occur. The current microstructure supports the first indication that no SFCA is present while it does not support the second as almost no C2S is present (only identified on some of the hematite grains which are found to be extremely fine, <1–2 μm) in this microstructure. This could be explained by the similar under cooling phenomena reported in previous solidification studies carried out on bulk compositions with relatively low CaO/SiO2 ratios in this system by Nicol et al. [23] and Hayes et al. [31]. The proposed solidification path is schematically shown in Figure 13d. As the magnetite/hematite solidify, the liquid continues to change away from the Fe2O3 apex. The nucleation of C2S on the hematite crystals occurs when the hematite-C2S univariant line is met, although in this case, the growth of C2S appears to be limited, which could be an indication of a relatively rapid cooling rate locally in this region and as a result, the liquid has transitioned to a glass and terminates further growth of the C2S phase.
The major differences between Microstructure-Types I, II, III and IV are: (i) the presence or otherwise of magnetite on solidification, and (ii) the CaO/SiO2 ratios in the final liquid compositions. The observations that SFCA scarcely formed in Type III (although the liquid composition passes through the SFC primary phase field on solidification) appears to be due to the low commonality in crystal structures between SFCA and hematite compared to that between SFCA and magnetite. As a result, the heterogeneous nucleation of SFCA occurred on the pre-existing magnetite crystals in Type I, while it did not occur on the hematite crystals in Type III on solidification. Instead, the formation of C2S on the hematite crystals occurred in Type III, which appears to have a further detrimental effect on the overall sinter strength due to the polymorphic transformation from β-C2S to γ-C2S on cooling that is accompanied with significant volume change (14%) and spontaneous breakage of the crystals due to the internal stresses generated [32].
8. Microstructures in Return Sinters
Of particular concern to industrial practice is the formation of sinter return fines. Understanding the mechanism of fines formation can assist in identifying strategies that might be employed to reduce the fraction of return sinter since this will result in increased productivity of the sinter operation.
Most of the material in the sinter returns is of Macro-Type F (~45%) and Macro-Type G (~45%).
Examination of the microstructures indicates that these fine materials are present for different reasons.
The microstructural analysis of the cross sections of the sinter return particles having Macro-Type F (Figure 9) shows that the large isolated acicular hematite crystals + glass (Type II) structure is formed on the open connected pore walls of the sinter. The breakage path appears to preferentially track through this material rather than the magnetite + acicular SFCA (Type I). Another structure in this Macro-Type F, having fine hematite with interconnecting pores + fine, platy, dendritic SFCA + glass, is also observed which is comparable to the sinter product-Micro-Type III. It can be seen that although the SFCA phase is present in the sample, it does not have significant contribution to the overall sinter mechanical strength given (i) the fine and dendritic shape of these crystals, and (ii) the exterior surface where they are formed and the close association with the glass phase.
Macro-Type G (Figure 10) also consists predominantly of isolated hematite crystals embedded in a glass matrix (Micro-Type IV). Since the glass phase has the least strength of all the phases in the sinter, this is inherently weakest of the microstructures present in the sinters and preferential breakage of this material is anticipated.
The remaining ~10% of the return sinter material consisted of Type H (~5%) unreacted quartz particles (~50–200 μm) (Figure 11g), Type J (~3%) relict hematite ore/porous hematite transformed from goethite (Figure 11h) and Type K (~2%) partially assimilated lime, CaO (Figure 11i). All appear to be the result of incomplete reactions during the sintering process. These structures are associated with low temperatures and/or short residence experienced by the material in the sinter bed.
Examination of the microstructure of Macro-Type J at high magnification indicates that solid hematite grains have been sintered together rather than formed by crystallisation from the melt. In the relatively short times, the material is at temperature in the sintering process, this microstructure is unlikely to form by solid state diffusion alone. Rather it is entirely feasible that material rearrangement and densification takes place by the mechanism of liquid phase sintering at sub-liquidus temperatures. The formation of strong solid-state bonds between the sintered hematite grains may increase the strength of the material despite the presence of the micro-pores in the structure.
9. Discussions and Implications for Industrial Practice
The effects of sintering temperature, residence time at high temperature and sintering atmosphere on sinter properties have been investigated in many previous studies [33,34,35,36,37]. The present study focuses on the details of conditions in terms of temperatures, compositions and atmospheres potentially affecting sinter properties through (a) the identifications of the breakage surfaces of industrial iron ore sinter product and returns, (b) understanding of the sinter microstructures and (c) relating those to phase equilibria information. These details can assist in the optimisation of process parameters such as raw material composition, fluxing, sintering temperature, coke rate, etc. The present study indicates the following:
- The glass + magnetite + SFCA + (Type I) microstructure is the predominant microstructure in the unfractured regions of the sinter products and is associated with low porosity and high sinter strength;
- The glass + large, angular/dendritic hematite + minor SFCA + C2S (Type II) microstructure, and the glass+ fine, porous hematite + C2S (Type III) microstructure, both having no or low proportions of SFCA with isolated hematite crystals in a continuous glass phase matrix, are found to be the predominant microstructures present around the fractured surfaces of the product and return sinters. These structures therefore appear to be associated with weak sinter strength. In addition, the porous structures (in particular, locally agglomerated fine pores) result in the thinner bonding “bridges” observed on the Macro-Types D and E of the sinter product with a further detrimental effect on the overall mechanical strength.
- The layers around sinter breakage surfaces in the Macro-Types C and D of the sinter product, and F and G in the sinter returns have Type II structures consisting of glass + hematite (200–500 μm thick) on the underlying glass + magnetite + SFCA (Type I) bulk material. The hematite and glass microstructure is associated with the surfaces of connected pores (Type III) in the sinter and has been shown [26] to be formed as a result of oxidation of the Type I structure previously formed. Almost half of the sinter fines contain material having this microstructure.
The presence of low strength, brittle areas within the sinter material is undesirable since this can be the source of micro-cracks and result in large proportion of fines/returns. This weak structure is exemplified by Type II microstructures, formed by reoxidation of the sinter surface on solidification. The reported increase in sinter performance by flue gas recirculation, a practice that lowers the oxygen concentration in the gas flow during the solidification of the sinter [36,37], may result in reduction in the extent of sinter reoxidation, and of the formation of the weaker Type II microstructure, and therefore reduced generation of sinter fines.
The current characterisation study confirmed that the formation of SFCA may be favoured by: (i) the presence of magnetite [26], and (ii) material having high (optimal) CaO/SiO2 ratio [19,20] in air (pO2 = 0.21). Longer residence times at above solidus temperatures also promote the nucleation and growth of the SFCA phase and the minimisation of the volume fraction of the residual glass phase. This could be achieved by, for example, decreasing the thermal load in the bed or adjusting process parameters to match the heat velocity and combustion fronts.
Low peak bed temperatures and short times above solidus temperatures appear to result in limited densification and sintering, high connected pore volume, and rapid oxidation of any original or primary magnetite that may be present to secondary hematite; these factors contribute to low mechanical strength.
Whilst these factors may be already recognised and appreciated by many practitioners, the present study adds scientifically based explanations for the process outcomes. The availability of 3D tomography techniques, as described by Wang et al. [38] may be a useful approach to provide further understanding of the heterogeneous and non-uniform structures formed in iron ore sinters, and their links to sinter properties.
10. Conclusions
The present study of the surfaces of sinter product and sinter returns has provided further evidence that the strength and breakage behaviours of iron ore sinters are dependent not only on the phases and microstructures present in the materials but also the distribution of the microstructures in these highly heterogeneous materials.
Dense material consisting of predominantly Magnetite + SFCA (Type I) microstructure is present in the bulk of the sinter product.
Porous materials and materials consisting of isolated hematite grains in a glass matrix, (Type II) microstructures, are present at the breakage surfaces of the sinter product and represent major fractions of the sinter return materials. This is indicative of a link between sinter fines generation in the return sinter and liquid phase-assisted oxidation of the original magnetite primary phase during the solidification period of the sintering process.
The phases and major microstructures present in industrial sinters can be explained by the non-equilibrium solidification of melts in the “Fe2O3”-Al2O3-CaO-SiO2 system. It was demonstrated that the sequences of formation of the phases can be deduced by reference to the primary phase fields and liquidus of this system.
Author Contributions
Conceptualization, E.J., P.C.H. and S.C.; methodology, E.J., P.C.H. and S.C.; software, S.C.; validation, E.J., P.C.H. and S.C.; formal analysis, S.C.; investigation, S.C., P.C.H. and E.J.; resources, P.C.H. and E.J.; data curation, S.C.; writing—original draft preparation, S.C.; writing—review and editing, S.C., P.C.H. and E.J.; visualization, S.C., P.C.H. and E.J.; supervision, P.C.H. and E.J.; project administration, P.C.H. and E.J.; funding acquisition, P.C.H. and E.J. All authors have read and agreed to the published version of the manuscript.
Funding
The authors would like to acknowledge the Australian Research Council Linkage Program LP200100175 and Umicore, BHP and Swerim for their financial support to enable this research to be carried out.
Acknowledgments
The authors would like to thank Jiang Chen and Maksym Shevchenko at the University of Queensland for valuable comments and suggestions, and the Centre for Microscopy and Microanalysis at the University of Queensland for providing electron microscope facilities, and scientific and technical assistance.
Conflicts of Interest
The authors declare no conflict of interest.
References
- Biswas, A.K. Principles of Blast Furnace Ironmaking: Theory and Practice; Cootha: Brisbane, Australia, 1981. [Google Scholar]
- The Iron and Steel Institute of Japan; The Committee on Reaction within Blast Furnace. Blast Furnace Phenomena and Modelling, 1st ed.; Springer: Dordrecht, The Netherlands, 1987. [Google Scholar]
- Geerdes, M.; Chaigneau, R.; Kurunov, I. Modern Blast Furnace Ironmaking: An Introduction, 3rd ed.; IOS Press: Amsterdam, The Netherlands, 2015. [Google Scholar]
- Lu, L.; Pan, J.; Zhu, D. Quality requirements of iron ore for iron production. In Iron Ore: Mineralogy, Processing and Environmental Sustainability; Lu, L., Ed.; Woodhead Publishing—Elsevier: Cambridge, UK, 2015; pp. 475–504. [Google Scholar]
- ISO 3271:2007. Iron Ores for Blast Furnace and Direct Reduction Feedstocks—Determination of the Tumble and Abrasion Indices; ISO: Geneva, Switzerland, 2007. [Google Scholar]
- ISO 7992:2007. Iron Ores for Blast Furnace Feedstocks—Determination of Reduction Under Load; ISO: Geneva, Switzerland, 2007. [Google Scholar]
- ISO 7215:2007. Iron Ores for Blast Furnace Feedstocks—Determination of the Reducibility by the Final Degree of Reduction Index; ISO: Geneva, Switzerland, 2007. [Google Scholar]
- ISO 8371:2007. Iron Ores for Blast Furnace Feedstocks—Determination of the Decrepitation Index; ISO: Geneva, Switzerland, 2007. [Google Scholar]
- ISO 4696-1:2007. Iron Ores for Blast Furnace Feedstocks—Determination of Low-Temperature Reduction-Disintegration Indices by Static Method—Part 1: Reduction with CO, CO2, H2 and N2; ISO: Geneva, Switzerland, 2007. [Google Scholar]
- ISO 4696-2:2007. Iron ores for Blast Furnace Feedstocks—Determination of Low-Temperature Reduction-Disintegration Indices by Static Method—Part 2: Reduction with CO and N2; ISO: Geneva, Switzerland, 2007. [Google Scholar]
- Heikkinen, E.; Iljana, M.; Fabritius, T. Review on the Phase Equilibria in Iron Ore Sinters. ISIJ Int. 2020, 60, 2633–2648. [Google Scholar] [CrossRef]
- Heinänen, K. Mineralogy and Metallurgical Properties of Iron Ore Sinter Based on Magnetite Fines. Ph.D. Thesis, University of Helsinki, Helsinki, Finland, 1993. [Google Scholar]
- Iljana, M.; Kemppainen, A.; Paananen, T.; Mattila, O.; Heikkinen, E.; Fabritius, T. Evaluating the Reduction-Softening Behaviour of Blast Furnace Burden with an Advanced Test. ISIJ Int. 2016, 56, 1705–1714. [Google Scholar] [CrossRef] [Green Version]
- Honeyands, T.; Manuel, J.; Matthews, L.; O’Dea, D.; Pinson, D.; Leedham, J.; Zhang, G.; Li, H.; Monaghan, B.; Liu, X.; et al. Comparison of the Mineralogy of Iron Ore Sinters Using a Range of Techniques. Minerals 2019, 9, 333. [Google Scholar] [CrossRef] [Green Version]
- Dawson, P. Part 2 Research Studies on Sintering and Sinter Quality. Ironmak. Steelmak. 1993, 20, 137–143. [Google Scholar]
- Mežibrický, R.; Fröhlichová, M.; Mašlejová, A. Phase Composition of Iron Ore Sinters Produced with Biomass as a Substitute for the Coke Fuel. Arch. Metall. Mater. 2015, 60, 2955–2963. [Google Scholar] [CrossRef]
- Pownceby, M.I.; Clout, J.M.F.; Fisher-White, M.J. Phase equilibria for the Fe2O3-rich part of the system Fe2O3-CaO-SiO2 in air at 1240–1300 °C. Trans. Inst. Min. Metall. Sect. C 1998, 107, C1–C9. [Google Scholar]
- Pownceby, M.I.; Clout, J.M.F. Phase relations in the Fe-rich part of the system Fe2O3(-Fe3O4)-CaO-SiO2 at 1240–1300 °C and oxygen partial pressure of 5 × 10⁻³ atm: Implications for iron ore sinter. Trans. Inst. Min. Metall. Sect. C 2000, 109, C36–C48. [Google Scholar]
- Chen, J.; Shevchenko, M.; Hayes, P.C.; Jak, E. A phase equilibrium study of the iron-rich corner of the CaO–FeO–Fe2O3–SiO2 system in air and the determination of the SFC primary phase field. ISIJ Int. 2019, 59, 795–804. [Google Scholar] [CrossRef] [Green Version]
- Cheng, S.; Shevchenko, M.; Hayes, P.C.; Jak, E. Experimental Phase Equilibria Studies in the FeO-Fe2O3-CaO-SiO2 System in Air: Results for the Iron-Rich Region. Metall. Mater. Trans. B 2019, 51, 1587–1602. [Google Scholar] [CrossRef]
- Nicol, S.; Jak, E.; Hayes, P.C. Effect of Cooling Rate on the Controlled Solidification of “Fe2O3”–CaO–SiO2 Liquids in Air in Synthetic Iron Ore Sinter. ISIJ Int. 2020, 60, 865–875. [Google Scholar] [CrossRef]
- Nicol, S.; Jak, E.; Hayes, P.C. Effects of the Bulk Fe2O3 Concentration on the Controlled Solidification of “Fe2O3”–CaO–SiO2 Liquids in Air. ISIJ Int. 2020, 60, 876–886. [Google Scholar] [CrossRef]
- Nicol, S.; Jak, E.; Hayes, P.C. Effect of the CaO/SiO2 ratio on the controlled solidification of “Fe2O3”-CaO-SiO2 melts in air. Min. Proc. Ext. Metall. 2020. [Google Scholar] [CrossRef]
- Nicol, S.; Jak, E.; Hayes, P.C. Controlled Solidification of Liquids Within the SFC Primary Phase Field of the ‘‘Fe2O3”-CaO-SiO2 System in Air. Metall. Mater. Trans. B 2019, 50, 3027–3038. [Google Scholar] [CrossRef]
- Nicol, S.; Jak, E.; Hayes, P.C. Microstructure Evolution During Controlled Solidification of “Fe2O3”-CaO-SiO2 Liquids in Air. Metall. Mater. Trans. B 2019, 50, 2706–2722. [Google Scholar] [CrossRef] [Green Version]
- Nicol, S.; Cheng, S.; Jak, E.; Hayes, P.C. Mechanisms of Phase and Microstructure Formation during the Cooling of “Fe2O3”–CaO–SiO2–Al2O3 Melts in Air and Implications for Iron Ore Sintering. ISIJ Int. 2020, 60, 2659–2668. [Google Scholar] [CrossRef]
- Chen, J.; Jak, E.; Hayes, P.C. Factors influencing the microstructures of iron ore sinters. Miner. Process. Extr. Metall. 2021, 130, 181–191. [Google Scholar] [CrossRef]
- Schneider, C.A.; Rasband, W.S.; Eliceiri, K.W. NIH Image to ImageJ: 25 years of image analysis. Nat. Methods 2012, 9, 671–675. [Google Scholar] [CrossRef]
- Allibert, M.; Gaye, H.; Geiseler, J.; Janke, D.; Keene, B.J.; Kirner, D.; Kowalski, M.; Lehmann, J.; Mills, K.C.; Neuschutz, D.; et al. Slag Atlas, 2nd ed.; Verlag Stahleisen GmbH: Düsseldorf, Germany, 1995; p. 616. [Google Scholar]
- Kalmanovitch, D.P.; Williamson, J. Miner. Matter Ash Coal. ACS Symp. Ser. 1986, 301, 234–255. [Google Scholar]
- Hayes, P.C.; Nicol, S.; Jak, E. Solidification of oxide melts. In Proceedings of the 11th International Conference on Molten Slags, Fluxes and Salts, E-Proceedings, EA20191127–0704. Virtual, Seoul, Korea, 21–25 February 2021. [Google Scholar]
- Hayes, P.C. Chapter 4.5—Phase Formation Reactions. In Treatise on Process Metallurgy; Seetharaman, S., Ed.; Elsevier: Boston, MA, USA, 2014; pp. 875–889. [Google Scholar] [CrossRef]
- Lu, L.; Ishiyama, O. Iron ore sintering. In Iron Ore: Mineralogy, Processing and Environmental Sustainability; Lu, L., Ed.; Woodhead Publishing—Elsevier: Cambridge, UK, 2015; pp. 395–433. [Google Scholar]
- Nicol, S.; Chen, J.; Qi, W.; Mao, X.; Jak, E.; Hayes, P.C. Measurement of Process Conditions Present in Pilot Scale Iron Ore Sintering. Minerals 2019, 9, 374. [Google Scholar] [CrossRef] [Green Version]
- Harvey, T.; Pownceby, M.I.; Chen, J.; Webster, N.A.S.; Nguyen, T.B.T.; Matthews, L.; O’Dea, D.; Honeyands, T. Effect of Temperature, Time, and Cooling Rate on the Mineralogy, Morphology, and Reducibility of Iron Ore Sinter Analogues. Jom 2021, 73, 345–355. [Google Scholar] [CrossRef]
- Fan, X.; Yu, Z.; Gan, M.; Chen, X.; Huang, Y. Mineralisation behaviour of iron ore fines in sintering bed with flue gas recirculation. Ironmak. Steelmak. 2016, 43, 712–719. [Google Scholar] [CrossRef]
- Chen, X.L.; Fan, X.H.; Gan, M.; Huang, W.S.; Yu, Z.Y. Sintering behaviours of iron ore with flue gas circulation. Ironmak. Steelmak. 2018, 45, 434–440. [Google Scholar] [CrossRef]
- Wang, W.; Chen, X.; Xu, R.; Li, J.; Shen, W.; Wang, S. Research progress on multiscale structural characteristics and characterization methods of iron ore sinter. J. Iron Steel Res. Int 2020, 27, 367–379. [Google Scholar] [CrossRef]
Figure 1.
XRD pattern of sinter product and return samples reported by Chen et al. [27] (Cu Kα, 40kv), S = SFCA solid solution, H = hematite; M = magnetite; Q = quartz; D = dicalcium-silicate C2S; L = lime.
Figure 1.
XRD pattern of sinter product and return samples reported by Chen et al. [27] (Cu Kα, 40kv), S = SFCA solid solution, H = hematite; M = magnetite; Q = quartz; D = dicalcium-silicate C2S; L = lime.

Figure 2.
Example of Macro-Types A~E on industrial sinter products.

Figure 3.
Four main microstructural types I~IV in the sinter samples, (a) Micro-Type I; (b) Micro-Type II; (c) Micro-Type-III; (d) zoomed details of Micro-Type II; (e) Micro-Type IV; and (f) zoomed details of Micro-Type IV, G = Glass; H = Hematite; M = Magnetite; S = SFCA solid solution; D = Dicalcium silicate (C2S); P = Pores.

Figure 4.
(a) Details of macro-features of type A (smooth/dull, molten, dense surface) taken by digital camera; (b) backscattered electron image of microstructure Macro-Type A, G = Glass; H = Hematite; M = Magnetite; S = SFCA solution; D = Dicalcium silicate (C2S); P = Pores.
Figure 4.
(a) Details of macro-features of type A (smooth/dull, molten, dense surface) taken by digital camera; (b) backscattered electron image of microstructure Macro-Type A, G = Glass; H = Hematite; M = Magnetite; S = SFCA solution; D = Dicalcium silicate (C2S); P = Pores.

Figure 5.
(a) Details of macro-features of type B (smooth/dull, porous, molten surface) taken by digital camera; (b) backscattered electron image of microstructures in Macro-Type B, G = Glass; H = Hematite; M = Magnetite; S = SFCA solid solution; D = Dicalcium silicate (C2S); P = Pores.
Figure 5.
(a) Details of macro-features of type B (smooth/dull, porous, molten surface) taken by digital camera; (b) backscattered electron image of microstructures in Macro-Type B, G = Glass; H = Hematite; M = Magnetite; S = SFCA solid solution; D = Dicalcium silicate (C2S); P = Pores.

Figure 6.
(a) Details of macro-features of type C (shiny/fractured, dense surface) taken by digital camera; (b) backscattered electron image of microstructures in Macro-Type C; (c) and (d) details from different locations of (b), G = Glass; H = Hematite; M = Magnetite; S = SFCA solid solution; D = Dicalcium silicate (C2S); P = Pores, (*) microcrystalline material, formerly liquid slag.

Figure 7.
(a) Details of macro-features of type D (shiny/fractured surface large pores) taken by digital camera; (b) overview of interface between two microstructures in Macro-Type D; (c,d) details from different locations of (b), G = Glass; H = Hematite; M = Magnetite; S = SFCA solid solution; D = Dicalcium silicate (C2S); P = Pores.

Figure 8.
(a) Details of macro-features of type E (shiny/fractured surface fine pores) taken by digital camera; (b) overview of the microstructure in Macro-Type E; (c,d) details from different locations of (b), G = Glass; H = Hematite; S = SFCA solid solution; D = Dicalcium silicate (C2S); P = Pores.

Figure 9.
Typical microstructures of return samples Macro-Type F, porous and in irregular shape, taken on optical microscope and back scattered electron microscope, G = Glass; H = Hematite; M = Magnetite; S = SFCA solid solution; and P = Pores.
Figure 9.
Typical microstructures of return samples Macro-Type F, porous and in irregular shape, taken on optical microscope and back scattered electron microscope, G = Glass; H = Hematite; M = Magnetite; S = SFCA solid solution; and P = Pores.

Figure 10.
Typical microstructures of return samples Macro-Type G, dense, round to irregular shape, taken on optical microscope and back scattered electron microscope, G = Glass; H = Hematite; M = Magnetite; and P = Pores.
Figure 10.
Typical microstructures of return samples Macro-Type G, dense, round to irregular shape, taken on optical microscope and back scattered electron microscope, G = Glass; H = Hematite; M = Magnetite; and P = Pores.

Figure 11.
Macro-features of other return samples: (a,b) Macro-Type H; (c,d) Macro-Type J; (e,f) Macro-Type K; and their respective typical microstructures: (g) Macro-Type H; (h) Macro-Type J and (i) Macro-Type K, H = Hematite; S = SFCA solid solution; P = Pores; and Q = Quartz.
Figure 11.
Macro-features of other return samples: (a,b) Macro-Type H; (c,d) Macro-Type J; (e,f) Macro-Type K; and their respective typical microstructures: (g) Macro-Type H; (h) Macro-Type J and (i) Macro-Type K, H = Hematite; S = SFCA solid solution; P = Pores; and Q = Quartz.

Figure 12.
Compositions of phases in Microstructure-Types I–IV measured by EPMA projected onto the “Fe2O3”-CaO-SiO2 system in air based on the study by Cheng et al. [20], compositions in wt%, temperature in °C, *X denotes sample Macro-Types, Y denotes locations of measurement taken.
Figure 12.
Compositions of phases in Microstructure-Types I–IV measured by EPMA projected onto the “Fe2O3”-CaO-SiO2 system in air based on the study by Cheng et al. [20], compositions in wt%, temperature in °C, *X denotes sample Macro-Types, Y denotes locations of measurement taken.

Figure 13.
Schematic representation of changes in liquid composition during solidification in different Microstructure-Types, (a) Type I; (b) Type II; (c) Type III, and (d) Type IV in the sinter.
Figure 13.
Schematic representation of changes in liquid composition during solidification in different Microstructure-Types, (a) Type I; (b) Type II; (c) Type III, and (d) Type IV in the sinter.


Table 1.
Bulk compositions of the sinter samples (in wt%) [27].
Table 1.
Bulk compositions of the sinter samples (in wt%) [27].
| Sample | Total Fe | Fe2O3 | FeO | MgO | Al2O3 | CaO | SiO2 | P2O5 | S | TiO2 | CaO/SiO2 |
|---|---|---|---|---|---|---|---|---|---|---|---|
| Return <1 mm | 57.9 | 75.6 | 6.4 | 1.2 | 1.8 | 8.6 | 4.9 | 0.1 | 0.05 | 0.1 | 1.8 |
| Return 1–2 mm | 58.2 | 73.9 | 8.4 | 1.2 | 1.8 | 9.3 | 4.6 | 0.1 | 0.02 | 0.1 | 2.0 |
| Return 2–3 mm | 58.3 | 72.5 | 9.7 | 1.3 | 1.8 | 9.4 | 4.4 | 0.1 | 0.02 | 0.1 | 2.1 |
| Return 3–5 mm | 58.2 | 71.9 | 10.1 | 1.3 | 1.7 | 9.7 | 4.5 | 0.1 | 0.02 | 0.1 | 2.2 |
| Sinter Product 10–20 mm | 58.4 | 73.7 | 8.7 | 1.2 | 1.6 | 9.3 | 4.1 | 0.1 | 0.02 | 0.1 | 2.3 |
Table 2.
List of phases identified in sinter samples, their chemical formulae and abbreviations used in this paper.
Table 2.
List of phases identified in sinter samples, their chemical formulae and abbreviations used in this paper.
| Phase | Chemical Formula | Label |
|---|---|---|
| Glass (formerly liquid) | Fe-Ca-Si-Al-Mg-Ti-P-O-... | G |
| Magnetite | [Fe,Ca,Mg]O·[Fe,Al]2O3 | M |
| Hematite | [Fe,Al]2O3 | H |
| SFCA solid solution | “CaO·3Fe2O3”-“CaO·3Al2O3”-“4CaO·3SiO2”-… | S |
| Quartz | SiO2 | Q |
| Dicalcium silicate | 2CaO·SiO2 (C2S) | D |
| Pore | - | P |
Table 3.
EPMA results of phases in microstructure types I–IV in the sample (compositions in wt% and normalised to 100% for presentation purpose only). G = Glass; H = Hematite; M = Magnetite; S = SFCA solid solution; D = Dicalcium silicate (C2S); P = Pores, estimated proportions (%) of the phases through image analysis are also included.
| Type I—Glass (minor) + magnetite (rounded, irregular) + hematite (minor) + SFCA (plate-like) | ||||||||||||
 | Phases (Proportion%) | Al2O3 | SiO2 | Fe2O3 | CaO | MgO | TiO2 | P2O5 | K2O | MnO | Oldtotal | CaO/SiO2 |
| Glass (~9%) | 2.02 | 35.9 | 13.9 | 45.3 | 0.22 | 0.83 | 1.27 | 0.47 | 0.03 | 99.4 | 1.26 | |
| Magnetite (~41%) | 1.10 | 0.00 | 94.8 | 1.97 | 1.95 | 0.02 | 0.00 | 0.00 | 0.17 | 103.7 | - | |
| Hematite (~1%) | 1.11 | 0.00 | 98.3 | 0.08 | 0.08 | 0.32 | 0.00 | 0.00 | 0.07 | 101.3 | - | |
| SFCA (~49%) | 3.54 | 6.50 | 74.1 | 15.1 | 0.48 | 0.14 | 0.03 | 0.01 | 0.05 | 101.2 | 2.33 | |
| Type II—Glass + hematite (angular/dendritic) + SFCA (minor) + dicalcium silicate (C2S) | ||||||||||||
 | Phases (Proportion%) | Al2O3 | SiO2 | Fe2O3 | CaO | MgO | TiO2 | P2O5 | K2O | MnO | Old total | CaO/SiO2 |
| Glass (~12%) | 3.99 | 16.0 | 46.9 | 31.9 | 0.56 | 0.10 | 0.36 | 0.08 | 0.11 | 101.6 | 1.99 | |
| Hematite (~69%) | 0.92 | 0.01 | 98.8 | 0.04 | 0.03 | 0.11 | 0.00 | 0.02 | 0.04 | 101.1 | - | |
| SFCA (~9%) | 1.51 | 0.12 | 88.2 | 3.25 | 6.28 | 0.02 | 0.01 | 0.00 | 0.56 | 102.2 | - | |
| C2S (~10%) | N/A due to too small crystal size | - | ||||||||||
| Type III—Glass + hematite (rounded, micropores isolated/connected) + dicalcium silicate (C2S) + SFCA (fine, dendritic, minor) | ||||||||||||
 | Phases (Proportion%) | Al2O3 | SiO2 | Fe2O3 | CaO | MgO | TiO2 | P2O5 | K2O | MnO | Old total | CaO/SiO2 |
| Glass (~16%) | 4.56 | 18.8 | 39.6 | 35.9 | 0.55 | 0.04 | 0.31 | 0.13 | 0.11 | 103.7 | 1.95 | |
| Hematite (~68%) | 0.70 | 0.00 | 99.0 | 0.04 | 0.04 | 0.10 | 0.00 | 0.02 | 0.06 | 101.1 | - | |
| C2S (~16%) | 0.06 | 32.2 | 1.96 | 63.0 | 0.03 | 0.00 | 2.48 | 0.28 | 0.02 | 100.5 | - | |
| Type IV – Glass + magnetite (rounded to euhedral) + hematite (euhedral) + dicalcium silicate (C2S, minor) | ||||||||||||
 | Phases (Proportion%) | Al2O3 | SiO2 | Fe2O3 | CaO | MgO | TiO2 | P2O5 | K2O | MnO | Old total | CaO/SiO2 |
| Glass (~19%) | 3.40 | 24.0 | 33.0 | 38.5 | 0.09 | 0.21 | 0.63 | 0.16 | 0.04 | 101.6 | 1.60 | |
| Magnetite (~7%) | 1.18 | 0.01 | 95.0 | 1.78 | 1.77 | 0.02 | 0.00 | 0.01 | 0.20 | 103.6 | - | |
| Hematite (~72%) | 0.93 | 0.01 | 98.5 | 0.25 | 0.01 | 0.23 | 0.00 | 0.00 | 0.07 | 101.6 | - | |
| C2S (~2%) | N/A due to too small crystal size | - | ||||||||||
Publisher’s Note: MDPI stays neutral with regard to jurisdictional claims in published maps and institutional affiliations. |
© 2022 by the authors. Licensee MDPI, Basel, Switzerland. This article is an open access article distributed under the terms and conditions of the Creative Commons Attribution (CC BY) license (https://creativecommons.org/licenses/by/4.0/).
Share and Cite
MDPI and ACS Style
Cheng, S.; Hayes, P.C.; Jak, E. Iron Ore Sinter Macro- and Micro-Structures, and Their Relationships to Breakage Characteristics. Minerals 2022, 12, 631. https://0-doi-org.brum.beds.ac.uk/10.3390/min12050631
AMA Style
Cheng S, Hayes PC, Jak E. Iron Ore Sinter Macro- and Micro-Structures, and Their Relationships to Breakage Characteristics. Minerals. 2022; 12(5):631. https://0-doi-org.brum.beds.ac.uk/10.3390/min12050631
Chicago/Turabian StyleCheng, Siyu, Peter Charles Hayes, and Evgueni Jak. 2022. "Iron Ore Sinter Macro- and Micro-Structures, and Their Relationships to Breakage Characteristics" Minerals 12, no. 5: 631. https://0-doi-org.brum.beds.ac.uk/10.3390/min12050631
Note that from the first issue of 2016, this journal uses article numbers instead of page numbers. See further details here.