
Geoenvironmental Model for Roll-Type Uranium Deposits in the Texas Gulf Coast
by
 , ,
, ,
Katherine Walton-Day
1,* ,
,
Johanna Blake
2,
Robert R. Seal II
3,
Tanya J. Gallegos
3,†,
Jean Dupree
4,‡ and
Kent D. Becher
4,‡ 1
Colorado Water Science Center, U.S. Geological Survey, Denver, CO 80225, USA
2
New Mexico Water Science Center, U.S. Geological Survey, Albuquerque, NM 87113, USA
3
Geology, Energy and Mineral Resources Science Center, U.S. Geological Survey Mineral, Reston, VA 20192, USA
4
Oklahoma-Texas Water Science Center, U.S. Geological Survey, Austin, TX 78754, USA
*
Author to whom correspondence should be addressed.
†
Current address: Mineral Resources Program, U.S. Geological Survey, Albuquerque, NM 87113, USA.
‡
Now retired.
Minerals 2022, 12(6), 780; https://0-doi-org.brum.beds.ac.uk/10.3390/min12060780
Submission received: 8 April 2022
/
Revised: 12 June 2022
/
Accepted: 15 June 2022
/
Published: 20 June 2022
(This article belongs to the Special Issue Environmentally Sound In-Situ Recovery Mining of Uranium)
Abstract
:Geoenvironmental models were formulated by the U.S. Geological Survey in the 1990s to describe potential environmental effects of extracting different types of ore deposits in different geologic and climatic regions. This paper presents a geoenvironmental model for roll-front (roll-type) uranium deposits in the Texas Coastal Plain. The model reviews descriptive and quantitative information derived from environmental studies and existing databases to depict existing conditions and potential environmental concerns associated with mining this deposit type. This geoenvironmental model describes how features of the deposits including host rock; ore and gangue mineralogy; geologic, hydrologic, and climatic settings; and mining methods (legacy open-pit and in situ recovery [ISR]) influence potential environmental effects from mining. Element concentrations in soil and water are compared to regulatory thresholds to depict ambient surface water and groundwater conditions. Although most open-pit operations in this region have been reclaimed, concerns remain about groundwater quality at three of the four former mills that supported former open-pit mines and are undergoing closure activities. The primary environmental concerns with ISR mining are (1) radon gas at active ISR operations, (2) radiation or contaminant leakage during production and transport of ISR resin or yellowcake, (3) uranium excursions into groundwater surrounding active ISR operations, and (4) contamination of groundwater after ISR mining. Although existing regulations attempt to address these concerns, some problems remain. Researchers suggest that reactive transport modeling and a better understanding of geology, stratigraphy, and geochemistry of ISR production areas could minimize excursions into surrounding aquifers and improve results of groundwater restoration.
1. Introduction
The U.S. Geological Survey (USGS) first developed geoenvironmental models in the 1990s [1,2]. Geoenvironmental models (GEMs) describe potential environmental effects of mining different mineral deposit types based on geologic and mineralogic characteristics of the mineral deposit, the hydrologic and climatic environment in which the deposit occurs, and the type(s) of mining methods employed. Initial models were largely descriptive and followed a prescribed outline [2]. Geoenvironmental models have many purposes, including understanding the environmental behavior of mineralized/hydrothermally altered areas; identifying regions with anomalous natural backgrounds; determining baseline conditions prior to mining or understanding premining conditions; and providing information for land-use planners and mining companies involved in mine permitting, planning, mining, or reclamation to limit or mitigate environmental effects of proposed, active, or abandoned mines [3,4]. The models are best used as guidelines for the potential environmental effects of particular mineral deposit types in particular geographic and climatic regions and are not intended to replace detailed site characterization studies that occur during mine permitting and planning [5].
Geoenvironmental models have evolved from their initial descriptive outline [1,2]. For example, geoenvironmental features, including pre-mining chemical signatures of water and sediment, mining and ore treatment methods, mine-waste characteristics, ecosystem issues, and human health considerations have been incorporated as components of recent USGS mineral deposit models (e.g., [6,7]). The USGS has proposed that GEMs augment descriptive information with quantitative data [4], but this change has not been formally implemented, as for example in any new proposed outlines or formats for GEMs. The utility of GEMs as a decision support tool for environmental assessment of contamination at mine sites has been recognized [8]. There may be a role for GEMs in sustainable mining practices and mine life-cycle models (e.g., [9,10]), but, again, no exact niche or format for GEMs in this realm has been identified, perhaps representing an opportunity for an evolution of GEMs beyond the scope of this paper. Herein, we present a descriptive GEM for the South Texas uranium (STU) region as part of the geoenvironmental assessment of these deposits [11,12], and as a complement to the USGS resource assessment of these deposits [13]. In this paper, a GEM is defined as a descriptive model that combines the characteristics of the deposit type–derived from literature review and a published ore-deposit model–with the geographic, climatic, and regulatory framework existing where the ore deposits occur, to identify the potential environmental effects associated with mining the deposits. This descriptive model is the only GEM available for any type of sandstone-hosted uranium (U) deposit, and only the second GEM constructed for any U deposit type other than the GEM for solution-collapse breccia-pipe U deposits in northern Arizona [14].
The objective of this paper is to present a GEM for the STU region that reviews existing descriptive information and combines it with more quantitative information derived from environmental studies and existing databases to identify the potential environmental considerations associated with mining this type of deposit in the STU region. The framework for the geoenvironmental assessment of undiscovered U deposits [11] suggests the GEM needs to contain a summary of mining and ore processing methods, information on how ore and mine waste weather, and geochemical characteristics of surface and groundwater resources. It further suggests that the GEM should address how climate, geology, and hydrology in the area contribute to the potential transport or accumulation of mine waste products through runoff, wind erosion, air stagnation (radon accumulation), aquifer recharge, and surface and groundwater transport. In this GEM, we address these topics by first reviewing the geologic and geochemical characteristics of the mineral deposits and follow with discussions of potential environmental effects of mining derived from literature review and some analysis of existing data. The accompanying geoenvironmental assessment of a portion of the STU area [12] takes this analysis further in identifying geographic areas within the STU region where specific environmental concerns are more likely to occur.
2. Geology and Mining
2.1. Deposit Type
Sandstone-hosted U deposits are the most prolific U-producing deposits in the United States [13]. There are four main types of sandstone-hosted deposits (basal, tabular, roll front, and tectonolithologic [15]) with roll front and tabular being the two most important classes of these deposits in terms of U.S. uranium production. The STU deposits are classified as roll front, though the most recent ore-deposit model refers to them as roll type [15,16].
The STU region is located within the broad, flat Texas Coastal Plain bordering the Gulf of Mexico (Figure 1) and is the smallest of the three major sandstone-hosted U regions in the United States after the Colorado Plateau and Wyoming basin [16]. Uranium mineralization in the STU region occurs in roll front-type deposits (Figure 2) in Tertiary sandstones that form a curvilinear belt almost 500 km long and 25 to 50 km wide, containing 254 known U occurrences including 169 deposits, 74 prospects, 6 showings, and 5 anomalies (Figure 1; [16,17]). The majority occur southwest of the San Marcos arch [16]. A recently completed U resource assessment of the region estimated a potential undiscovered resource mean of 99,790 metric tons (220 million pounds) of recoverable U oxide (U3O8), distributed among three delineated permissive tracts north and south of the San Marcos Arch (Figure 1; [13]). Permissive tracts are regions that are permissive for the occurrence of deposits, as guided by analysis of known deposits and a descriptive mineral deposit model [13]. Other estimates have indicated undiscovered resources of up to about 680 million metric tons (1.5 billion pounds) U3O8 in the STU region [18].
The geologic and climatic factors combined in this region to create favorable conditions for the development of mineable concentrations of U hosted by Eocene through Pliocene sandstones [16]. Briefly, roll-front deposits are formed by the precipitation of reduced U minerals that occurs when U-enriched, oxidized groundwater encounters reducing components in sandstone aquifers. Reductants include in-situ organic matter and disseminated pyrite, or other reductants (such as hydrogen sulfide [H2S]) entrained in formation water or transported into host rocks along geologic structures [16,20] (Figure 2). In Texas, the reductant is sometimes organic debris, but more often, plumes of reductants (H2S gas) are related to nearby oil and gas systems; more rarely, the reductants are pyrite or marcasite [16]. The oxidized groundwater may have relatively low concentrations of U [21]. The deposits are formed in areas where sandstone aquifers are confined above and below by less permeable strata [22]. Sedimentary sequences deposited in dry climate regimes are more likely to develop roll-type deposits than those deposited in more humid climates [16]. Uranium ore bodies in the STU are described as being deposited in C-shaped roll fronts, as viewed in the cross section (Figure 2), although in detail, individual ore zones have a complex geometry controlled by sand facies variations and the availability and location of reductants [16].
Texas roll-front U deposits are smaller and leaner in grade compared to similar sandstone-hosted, roll-front deposits elsewhere in the United States and in the world [20]. Texas deposits seldom exceed 5 meters (m) in thickness, are generally less than 100 m wide, and rarely occur as stacked (exceptions include the Alta Mesa and Goliad deposits (Figure 3)) or multiple-front deposits [20]. However, mineralized fronts can extend several miles. Deposit depths reported by one investigator varied from 23 to 450 m, with depths around 100 m being more typical [17]. Deposit size varies from about 0.4 metric tons (900 pounds) of U3O8 in small open-pit mines to greater than 450 metric tons (1 million pounds) of U3O8 for larger mines [16]. The average grade ranges from 0.08 percent to 0.11 percent U3O8 [16,17,20]. The relatively small deposit size in the STU is likely partly an operational artifact of the difficulty of securing and developing large tracts of private land [20].
Uranium production in the STU region has been nearly continuous since the discovery of the first deposits in the 1950s and has totaled about 36,300 metric tons (about 80 million pounds) U3O8 through 2013. An estimated 27,200 metric tons (about 60 million pounds) of U3O8 are known remaining in place [16,23]. Presently (2022), there are five entities holding active licenses to operate eight in situ recovery (ISR) uranium mining projects in the STU (Table 1).
2.2. Host Rock
Generally, the Tertiary and Quaternary formations in the STU region form northeast-southwest-trending arcs overlapped toward the Gulf of Mexico by successively younger units (Figure 1 and Figure 4). These units were deposited in fluvial, deltaic, and marginal marine environments where repeated sea-level changes and basin subsidence yielded a complex suite of discontinuous sands, silts, clays, and gravels. The heterogeneity of these sediments and related permeability changes have strongly influenced past and present groundwater movement and the present shape, orientation, and continuity of U mineralization [20].
Although U anomalies occur in multiple formations as old as the Paleocene, to date, four units in the Eocene through Pliocene strata are known to host economic U deposits: (1) the Eocene Whitsett Formation of the Jackson Group; (2) the Oligocene to Miocene Catahoula Formation; (3) the Miocene Oakville Sandstone of the Fleming Formation; and (4) the Pliocene Goliad Sand (Figure 4; [16,17]). Together, the Catahoula Formation and the Oakville Sandstone account for about 60 percent of produced STU resources [16] (Figure 1 and Figure 4). The recent assessment of undiscovered U resources in the STU of 99,790 metric tons U3O8 [13] is distributed among three permissive tracts (Figure 1; [13]). Permissive tract 1 contains the oldest geologic units, the Eocene Claiborne and Jackson Groups. Permissive tract 2 contains the Catahoula Formation and the Oakville Sandstone. Permissive tract 3 contains the youngest geologic units, the Goliad Sand, the Pleistocene Willis Sand, and Lissie Formation (Figure 4). Permissive tract 3 was the object of a proof-of-concept application of a new geoenvironmental assessment methodology [12] to parallel U.S. Geological Survey’s resource assessment methodology [13].
2.3. Surrounding Geologic Terrane
Stratigraphic units in the Texas Coastal Plain form a monocline dipping gently toward the Gulf of Mexico [32]. Tertiary sandstones that host STU occurrences were deposited either in fluvial–deltaic environments or in marginal marine areas that are collectively part of a more than 14-kilometer-thick Tertiary wedge derived from the erosion of the Rocky Mountains and the Sierra Madre Oriental in northern Mexico [17]. Rapid, massive sediment loading triggered the development of syndepositional growth faults, which are associated with both structurally controlled hydrocarbon accumulations and U mineralization [16,20]. Compared to other U.S. sandstone U deposits, STU deposits contain little detrital carbonaceous material, except for the near-shore marine sandstones of the Whitsett Formation [20].
Volcanic activity in the West Texas Trans-Pecos region and from the Sierra Madre Occidental contributed volcanic ash to the Tertiary sedimentary section throughout the Gulf of Mexico region [20]. Volcanic detritus and ash-fall materials form a substantial part of the Catahoula Formation, as well as much lesser parts of the older Jackson Group (including the Whitsett Formation) and of the overlying Oakville Sandstone and Goliad Sand [33,34]. The weathering of volcanic materials, particularly ash in the Catahoula Formation, was probably the source for U and likely for arsenic (As), molybdenum (Mo), selenium (Se), and vanadium (V) that migrated in groundwater to the presently mineralized sandstones [35,36,37]. Bentonite and opalized clay horizons and areas of zeolites, montmorillonite, opal, and chalcedony are present throughout the Catahoula Formation and indicate alteration of tuffaceous materials [38].
2.4. Wall-Rock Alteration
The STU deposits were formed by groundwater movement at near-surface temperatures, and therefore, the alteration in these deposits is relatively low-temperature compared to ore deposits whose formation is associated with thermal (igneous or volcanic) activity. The House-Seale deposit (Figure 3), for example, reportedly had fresh (unaltered) volcanic glass in the ore zone [20]. The most distinctive alteration pattern in these deposits is repeated oxidation and partial re-reduction of U-hosting sandstones [17]. This alteration was primarily manifested by changes in iron mineralogy and in rock color. Abundant detrital titano-magnetite and titano-hematite provided the source of iron in these occurrences. In reduced sand downdip from the roll fronts, iron-titanium oxides have been completely destroyed and replaced by pyrite. Limonite and hematite are the representative iron minerals in oxidized areas. Marcasite is particularly abundant relative to pyrite in the vicinity of the roll fronts (Figure 2) [39,40].
2.5. Nature of Ore
Uranium minerals in the STU region usually occur as grain coatings and intergranular fillings in the sandstones [33,41] or as replacements of sand-size and smaller grains. Less commonly, U minerals occur in clay aggregates, in volcanic rock fragments, or as replacements of carbonaceous plant debris [42]. Uranyl humates are common in deposits in the Whitsett Formation, which contains organic material [33]. Uranium has been reported to be adsorbed onto titanium oxides in the Oakville Sandstone in the Ray Point district, in the Catahoula Formation at the Benavides deposit, and in the Goliad Sand at the Alta Mesa mine [17,39,41] (Figure 1 and Figure 3).
2.6. Primary and Gangue Mineralogy
In reduced zones, the U minerals are very fine-grained or amorphous, and deposit mineralogy is often not reported. Reported primary U minerals include pitchblende, sooty pitchblende, uraninite, and coffinite [17,20,43]. In oxidized zones of the deposits, U(VI) minerals have been found, including uranyl phosphates, vanadates, and silicates [44]. The STU roll fronts often show a classic chromatographic chemical zonation along redox gradients. From up- to downgradient, the order of precipitation is Se–U–Mo, each successive constituent representing a slight drop in Eh. Arsenic probably occurs as a minor constituent of pyrite; selenium can occur as the native element. In reduced areas, Mo can occur as molybdenite or jordisite [33,43,45,46,47].
Common accessory minerals include marcasite, pyrite, montmorillonite, calcite, opal, zeolites, chalcedony, and in some districts, clinoptilolite [20,41,48,49]. Sphalerite has been reported in at least one deposit [48]. The potentially acid-generating minerals pyrite and marcasite occur in essentially all deposits [37]; however, because of the high hardness and elevated bicarbonate content of surface waters in this region [50,51,52] and because the Tertiary section contains carbonate materials as sandstone cement, fragments, and nodules [49,53], there are natural neutralizers for acid generation in both surface water and groundwater.
2.7. Secondary Mineralogy
In oxidized areas, U occurs as U(VI) and has a varied mineralogy, but the most common secondary U mineral in STU deposits is autunite [33]. The uranyl vanadates, tyuyamunite and carnotite, are not as common because STU mineralization contains relatively little vanadium [33]. Other reported secondary minerals include the uranyl carbonate schroeckingerite, the uranyl hydroxide schoepite [48], uranyl molybdates (iriginite, umohoite), uranyl arsenates, and uranyl silicates (such as uranophane, boltwoodite, and weeksite) [37,43,54]. In oxidized areas, As can also occur as orpiment or realgar [54], and Se can occur as ferroselite [45]. Limonite, jarosite, and hematite are the commonly observed iron minerals in oxidized areas [33].
2.8. Background and Deposit Trace Element Content
Analysis of background or non-mining affected concentrations in different media (soil and water, for example) can help establish whether elevated concentrations of potential contaminants from ore deposits existed prior to mining activity. These concentrations can help guide closure, remediation, or reclamation activities. Pre-mining background characterization is a compulsory part of modern mine permitting in the United States. For abandoned mines, remediation or closure goals are more problematic, and estimates of pre-mining backgrounds of geologically similar deposits may be of value in planning site remediation [55].
Dickinson [56] analyzed soil weathering profiles from about 1 to 7 m deep above the Whitsett and Catahoula Formations. The report documented average U concentrations between 2.7 parts per million (ppm) and 17.3 ppm, and average thorium (Th) concentrations between 13.0 ppm and 30.0 ppm. Henry and Kapadia [54] determined As, Cu, Se, and Mo (but not U) concentrations in 256 soil samples randomly distributed from the Whitsett and Catahoula Formations and Oakville Sandstone (background samples), and in 182 soil samples non-randomly distributed near U mining areas (mining-affected samples). Their background (random) samples indicated that soils above the Catahoula Formation and Oakville Sandstone, and above parts of the Whitsett Formation away from minor, near-surface U mineralization, had Mo, As, and Se concentrations similar to published average values from other multiple locations. Soils in mineralized, but non-mined, Whitsett Formation soils had elevated Mo and Se concentrations. In mining-affected samples, As, Mo, or Se were elevated in areas of shallow, but unmined mineralization, and in areas of older abandoned mines where elevated concentrations resulted from runoff from the mines [54]. These data indicate that concentrations of As, Mo, and Se were naturally elevated near shallow U mineralization prior to mining activities.
Large sets of stream sediment data from the National Uranium Resource Evaluation (NURE) [57,58] and soil data from USGS [59,60] were used to examine the variability of As, Mo, Se, U, and V concentrations in these media within each resource assessment permissive tract. These concentrations can be compared to the Texas Risk Reduction Program total soil combined pathway for residential 0.5-acre (about 0.2 hectare) source area noncarcinogenic human-health protective concentration levels (TRRP PCL) [61] (Figure 5). The Supplemental Information describes methods used to process the datasets.
NURE wet and dry stream sediment samples were collected during the 1970s and 1980s [57]. The USGS soil samples [59] were collected from 2007 to 2013 and included samples from 0–5 cm below the surface (regardless of horizon), and composites of the A horizon and C horizons. As such, neither dataset represents absolute pre-mining background conditions because U mining began in Texas in the 1950s. However, the data are representative of ambient conditions at the time of sample collection and may represent background conditions for mining operations that ensue(d) after samples were collected and where the spatial extent of the samples coincides with these future mines. Concentration ranges for NURE and USGS soil data are compared to median values for the top 5 cm in soils in the Conterminous United States (CONUS) (CONUS median soil 0–5 cm) [59]. Concentration values in U tailings samples are compared to crustal averages reported in [65] that were acquired from [66] All values are also compared to TRRP PCL [61].
The NURE stream sediment data have a larger range of concentrations than soil concentrations in each permissive tract for As, Mo, Se, U, and V (Figure 5). The NURE stream sediment samples also have greater median concentrations than all soil samples and greater concentrations than CONUS median soil 0–5 cm values in all permissive tracts for Mo, Se, and U. Median As concentrations in NURE samples are less than median concentrations in all soils and permissive tracts and are less than CONUS median soil 0–5 cm values. NURE median V concentrations fall in the middle of median concentrations in all permissive tract soils and are similar to the CONUS median soil 0–5 cm values. All sample types and elements have some samples with concentrations greater than CONUS median soil 0–5 cm values. Median NURE Mo and U concentrations in all permissive tracts are elevated relative to CONUS median soil 0–5 cm values. In permissive tract soil samples, in general, median concentrations are greater in C horizon samples than surface and A horizon samples. Arsenic and V have some sample concentrations greater than the TRRP PCL, whereas no samples in NURE or USGS soil samples in any permissive tract exceed Mo, Se, or U TRRP PCL concentrations. In general, these sample sets indicate slightly elevated U and Mo in stream (NURE) samples relative to CONUS median soil 0–5 cm values. They also provide a point of comparison that could inform environmental impact statements or permit applications.
Uranium ore in Texas is enriched in As, Mo, Se, V, and chromium [21]. Other elements reported include phosphorous [44], and beryllium and cobalt [45]. We did not locate any comprehensive analyses of the trace element content of the STU deposits. However, by analogy, bulk geochemical analysis of U mill tailings indicates what elements were present in the mined U ore, and how much U remained after ore processing (Figure 5). The sample results presented here (Figure 5) are from multiple sources and include samples from mill tailings from (1) sandstone deposits in Colorado and Utah that are tabular, rather than roll-front deposits; (2) unconformity U deposits; (3) intrusive (pegmatitic) deposits; (4) quartz-pebble conglomerate deposits; and (5) metasomatic deposits [62,63,64]. None of the sandstone deposits were from Texas, but they are expected to be geologically similar to those in Texas [15]. Tailings from other types of U deposits are presented to place the results from the mill tailings from sandstone deposits in a broader context. The Supplemental Information section “1.0 Processing of data from Existing Data Sets” contains details on sample sources and processing.
As expected, the concentrations of As, Mo, Se, U, and V are greater in the sandstone mill tailings samples than in almost all the NURE and soil samples by up to about 2 orders of magnitude for U and overlapping only upper outlier samples for As, Mo, Se, and V (Figure 5). Concentrations in samples in both groupings of U tailings are greater than crustal abundance except for 1 sample each for As and Mo, and 2 samples for V (Figure 5). These results are expected because the samples are from ore zones that are by definition enriched relative to crustal averages and that can be enriched in elements that co-occur with U in each particular deposit type. In addition, the concentrations of all elements plotted in the sandstone tailings, except U, are generally greater than concentrations in the other U tailings, likely because As, Mo, Se, and V are known to be enriched in sandstone deposits and are not necessarily enriched in the other deposit types. The lower concentrations of U in sandstone versus other U tailings likely occur because the ore grades of sandstone deposits are generally lower than the other deposit types, so less U would remain after ore processing. Finally, concentrations in samples from all types of U tailings are less than TRRP PCL for Mo and Se but straddle the threshold for the other three elements. These data illustrate the range of concentrations of these elements to be expected in the STU deposits (roughly analogous to the sandstone category), and relative enrichment of concentrations in tailings (ore) samples versus soil and stream-sediment samples.
2.9. Spatially and Genetically Related Deposits
Oil and gas resources; undeveloped geothermal resources [67]; and deposits of crushed stone, lignite, sulfur, salt, high-quality calcium bentonite, Fullers earth, and zeolites are found in the same Tertiary geologic setting as the STU occurrences [33,67,68]. Several U deposits are aligned along the same faults that are traps for highly productive oil and gas fields [69]. Uranium-mineralized conglomerates above the La Palangana salt dome (near the Palangana licensed uranium facility, Figure 3) locally contain impregnations of oil [70], and methane was reported in mine water in the Ray Point district (Figure 1) [49].
2.10. Mining and Ore Processing Methods
The weakly cemented and unconsolidated nature of the Tertiary ore-hosting sandstones and the low-grade ore generally preclude underground mining; instead, these deposits have been mined using either open-pit or ISR methods. One attempt at underground U mining was made in the Goliad Sand near the La Palangana salt dome (near the Palangana licensed uranium facility, Figure 3), but it was halted because of abundant H2S in the mine workings [20].
Uranium ore deposits were first developed in the STU region using open-pit mining methods combined with mill facilities to crush and process excavated ore. A total of 86 open-pit mines were operated [16], 23 of which were mined and abandoned before 1975 [71]. After 1977, all surface mining and exploration was subject to the requirements of the Texas Surface Mining and Reclamation Act (see Section 3). Four conventional U mills operated in Texas between 1961 and 1992: the Falls City mill in Karnes County [72], the Ray Point mill (Live Oak County) [73], the Conquista mill (Karnes County) [74], and the Panna Maria mill (Karnes County) [75] (Figure 3).
The state of Texas is an agreement state with the Nuclear Regulatory Commission (NRC), meaning that the NRC relinquishes regulatory authority to the state to license and permit facilities that handle radioactive material [76,77]. When facilities are decommissioned, the state works with the licensee to remediate the site, which is eventually decommissioned and transferred to the U.S. Department of Energy (DOE) for long term surveillance and monitoring (LTS&M) [77,78]. Additional regulatory considerations are provided in Section 3. Remediation has been completed at the Falls City mill, which is a former Uranium Mill Tailings Radiation Control Act (UMTRCA) legacy site that is currently (2022) administered by the DOE [72]. Reclamation of surface structures and tailings facilities is complete at the other three UMTRCA Title II sites, and the State of Texas and licensees are working to transfer all three sites to LTS&M with DOE [73,74,75,79].
Presently (2022), there are no active open-pit U mines in the STU region, and all mines since the mid-1990s have exclusively used ISR extraction methods (Figure 6) (also referred to as in-situ leach, or ISL methods), which have the advantages of less surface disturbance, have a smaller environmental effect under the appropriate hydrogeological conditions, and are operationally cheaper than other methods of U mining [80,81]. The first ISR mine was developed in Texas in 1975 and was one of the earliest ISR mines worldwide [16].
During ISR, a lixiviant solution is pumped into the production area via injection wells to oxidize and dissolve U in the subsurface (Figure 6). The most commonly used lixiviants in the United States are either a combination of sodium bicarbonate and oxygen gas or a solution saturated with oxygen and carbon dioxide gases under pressure [80]. Earlier operations used ammonium-based alkaline solutions, which complicated post-mining remediation and are no longer used [83,84]. Extraction wells remove groundwater and pregnant (U-rich) lixiviant solution from the aquifer. Total pumping rate is usually 1 to 3 percent higher than injection rate to ensure inward flow gradient and to control lixiviant flow [85]. As ISR mining continues, oxidation changes the chemically reducing conditions that existed in the production area prior to mining; this oxidation dissolves the U minerals and carries them in solution. Iron sulfides are oxidized by the lixiviant solution and iron is reprecipitated as iron oxides and oxyhydroxides. Sulfide is oxidized to sulfate and exits the aquifer with the lixiviant solution. The pregnant lixiviant is retrieved from extraction wells and piped to a processing plant, where ion-exchange strips U from the water onto resin beads (Figure 6). After processing, lixiviant solution is re-fortified with lixiviant reagents and returned to the production area to capture more U [80]. In Texas, U is converted to yellowcake (a U concentrate [80]) at facilities remote from most of the mines [86]. There are four facilities in Texas licensed to chemically strip U from resin and convert it to yellowcake: Hobson, Kingsville Dome, Alta Mesa, and Panna Maria (Table 1, Figure 3). In Texas, U-saturated ion exchange resin beads are collected from the mine sites and transported to the processing sites where the U is stripped from the resin beads using salt-water solutions. The U-rich solutions are then treated with hydrochloric acid and hydrogen peroxide to precipitate a uranyl peroxide yellowcake. This yellowcake slurry is filtered, washed to remove additional dissolved components, dried, and packed into steel drums for shipping to customers [87]. Typical extraction efficiencies range from 60 to 80 percent of the U depending on the chemistry of the leach solution [80].
Small amounts of solid wastes and liquid effluents are generated aboveground from ISR operations. Solid wastes such as contaminated equipment, spent resin beads, and pond sediments are typically transported to licensed disposal facilities. Liquid waste from the well field, process circuit, and aquifer restoration is injected into deep waste disposal wells [80]. More detail on waste streams, management, and hazard analysis is provided in the Supplemental Information section “2. Waste Types Produced During In Situ Recovery Mining”, and in [88]. Regulations and permitting requirements are discussed in Section 3.
3. Regulatory Framework
Uranium mining in Texas is covered by Federal and State regulations. Herein, we provide a brief overview of relevant agencies and permits. This overview provides context for the following discussions and is not intended to be an exhaustive review, nor a guide to obtaining the proper permits. Additional information is provided in the references cited.
In 1978, the United States enacted the Uranium Mill Tailings Radiation Control Act (UMTRCA). The law designated sites closed prior to 1978 as Title I sites (legacy sites). Title II sites are those licensed to handle radioactive materials after 1978; Title II sites are licensed to handle radioactive material by either the NRC or by “agreement” states, such as Texas, that have licensing authority under agreements with the NRC [76,77]. Under the authority of the Texas Uranium Surface Mining and Reclamation Act, the Texas Railroad Commission regulates U surface mining and exploration and reclaims U mines abandoned before 1975 [89,90]. The Texas Commission on Environmental Quality (TCEQ) currently (2022) regulates ISR U mining and issues the necessary licenses and permits, including a Production Area Authorization (PAA), a radioactive materials license, and permits for class I deep-injection disposal wells and class III (lixiviant) injection wells among others [91]. Permits for the Class III injection wells contain technical requirements for post-mining aquifer restoration [79].
ISR mining occurs in aquifers containing groundwater resources. Mineral extraction can occur in aquifers that are exempt from provisions of the Safe Drinking Water Act (42 U.S.C. 300f et seq. [1974]). The Texas Railroad Commission manages aquifer exemptions subject to approval of each decision by the U.S. Environmental Protection Agency (EPA). To obtain an aquifer exemption, it is necessary to demonstrate that the aquifer is not being used for drinking water and likely will not be used as a future drinking water source, or that the total dissolved solids content is between 3000 and 10,000 milligrams per liter (mg/L) and therefore is not reasonably expected to supply a public water system. Further, if demonstrated that the aquifer contains minerals in a commercially producible quantity and location, that is evidence that the aquifer will not serve as a future source of drinking water. Obtaining an aquifer exemption is a separate process from permitting and may be completed concurrently or after permitting [92].
Following ISR mining, groundwater quality needs to be restored to a standard specified by conditions in each operation license and determined through pre-mining baseline sampling [88]. Techniques used to restore groundwater quality after ISR mining include groundwater sweeps, reverse osmosis treatment, subsurface injection of chemical reductants, bioremediation, and monitored natural attenuation, or a combination of any of the listed techniques [93,94]. Amendments to U.S. Federal Regulations concerning health and environmental protection standards for U and thorium mill tailings (40 CFR Part 192) were designed to increase regulation on ISR groundwater monitoring and restoration, were proposed in 2015 and 2017, but were not adopted [95]. Additional discussion of post-mining groundwater quality is in Section 5.3.4.
4. Water Resources and Water Quality
4.1. Groundwater
Groundwater provides about 60 percent of all water used in Texas for all purposes. It is extensively studied, modeled, and monitored by state agencies, particularly the Texas Water Development Board [96]. Herein, we provide a brief overview of Tertiary aquifers that occur within the geologic units that host the STU deposits–the Gulf Coast aquifer system (GCAS), and the Yegua-Jackson, Sparta, Queen City, and Carizzo-Wilcox aquifers (Figure 4). Additional information is provided in [32] and references cited. A brief review of water quality derived from existing data and studies is also provided.
The GCAS is a major Texas aquifer system that contributes more than 1.4 billion cubic meters (1.1 million acre-feet) of water to irrigation and to the communities and metropolitan areas along the Texas Gulf Coast [97]. The GCAS is classified into five hydrostratigraphic units, which are, from youngest to oldest: (1) the Chicot aquifer (contained in the Pleistocene to Holocene) alluvial deposits, Beaumont Formation, Lissie Formation, and Willis Sand; (2) the Evangeline aquifer (contained in the Pliocene Goliad Sand); (3) the Burkeville confining unit (contained in the upper and lower parts of the Miocene Lagarto Clay subunit of the Miocene Fleming Formation); (4) the Jasper aquifer (contained primarily in the Miocene Fleming Formation and composed mostly of Oakville Sandstone, but also includes the lower part of the overlying Lagarto Clay, and in some locations includes sandy parts of the upper portions of the underlying Oligocene to Miocene Catahoula Formation); and (5) the Catahoula confining unit [29,30,31,32] (Figure 4). Water quality is generally good in the shallower part of the aquifer; groundwater containing less than 500 mg/L dissolved solids is usually encountered to a maximum depth of about 1 km from the San Antonio River basin northeastward to Louisiana [98]. From the San Antonio River basin southwestward to Mexico, quality deteriorates because of increased chloride concentration and saltwater encroachment along the coast, and little of this water is suitable for prolonged irrigation due to high salinity, high alkalinity, or both [98].
The Yegua-Jackson aquifer (contained in the Eocene Yegua Formation of the Claiborne Group and the Jackson Group) is a minor aquifer bounded at the base by a confining unit contained in the Eocene Cook Mountain Formation of the Claiborne Group in the Houston embayment and the time equivalent Laredo Formation in the Rio Grande embayment and at the top by a confining unit (contained in the Oligocene Vicksburg Formation) [26]. The upper part of the Jackson Group (which includes the Whitsett Formation) contains several sands that locally function as sources of slightly saline to highly saline water. Good-quality, non-brackish water occurs erratically, and nearly all aquifer utilization occurs in the unconfined portion. Water quality quickly degrades downdip into the confined portion, where it becomes unsuitable for use without treatment [99]. The Sparta aquifer is contained in the Eocene Sparta Sand of the Claiborne Group; the minor Queen City aquifer is contained in the Eocene Queen City Sand of the Claiborne Group. The Carizzo-Wilcox aquifer, which is contained in the Paleocene to Eocene Wilcox Formation and the Eocene Carrizo Sand, crosses the base of permissive tract 1 but does not overlap any known U production (Figure 4). Water quality in confined and unconfined portions of the aquifer typically has total dissolved content of less than 1000 mg/L but ranges between 1000 and 7000 mg/L in limited more saline parts of the aquifer [72,100].
Two large groundwater datasets were used to examine variation in As, Mo, radium226, Se, U, and V concentrations in groundwater in permissive tracts 1, 2, and 3 (Figure 7). The NURE dataset [57,101] contains data from groundwater samples collected from the 1970s to the 1980s and contained no radium226 data. The Texas Water Development Board (TWDB) dataset [102] contains data from groundwater samples collected from 1907 to 2021. The Supplemental Information section “1.3 Water Resources and Water Quality Section” provides detail on dataset processing.
The range of concentrations of As, Mo, U, and V are similar between the NURE and TWDB data across the three permissive tracts (Figure 7). However, Se concentrations are lower in the NURE data across all three permissive tracts. The reasons for these differences are possibly due to different time periods over which data were collected, or different analytical methods, particularly for Se; however, as the other elements do not show similar differences, the cause is unknown. Although the majority of results for As, Se, and U are below maximum contaminant levels (MCLs), both datasets have samples that exceed the EPA MCL for As and U, but only the TWDB data exceed the EPA MCL for selenium (Figure 7). A report investigating elevated As concentrations in southwestern parts of the Texas Gulf Coast aquifer system concluded that correlations of As with Mo and V indicated that volcanic ash in the Catahoula Formation was the likely source for elevated As groundwater concentrations [106]. A report that examined naturally occurring chemical constituents in major and minor aquifers for Texas indicated that the probability of exceeding any primary MCL was greater in the southwestern portion of the Gulf Coast and Carrizo-Wilcox aquifers than in the northeastern portion of these aquifers (Figure 29 in [107]). They found the greatest percentage exceedance was 14 percent of samples exceeding As MCLs in the Gulf Coast aquifer system and 16 percent for combined radium (radium226 and radium228; [226Ra and 228Ra]) in the Carrizo-Wilcox aquifer. Probability of exceeding any primary MCL in the minor Yegua-Jackson, Sparta, and Queen City aquifers is greatest in the Yegua-Jackson aquifer and varies moving from the southwest to northeast portions of the aquifer (see Figure 30 in [107]).
Hall compiled data on baseline and post-remediation groundwater quality at ISR mines available from public records [104,108]. Baseline data are shown in Figure 7 and baseline and post-remediation water quality are compared in Section 5.3.4. Arsenic, Mo, Se, and U median values are greater than median values of the NURE and TWDB samples. Further, all the As and U baseline data exceed MCLs except for the lower outliers. There were no V data available in this dataset. Multiple studies have reported elevated concentrations of these and some other analytes (226Ra) in groundwater associated with the STU deposits [80,109]. Data for 226Ra from the TWDB data set (Figure 7) show similar concentrations across the three permissive tracts with a few samples in each permissive track having concentrations greater than the EPA MCL of 0.185 Bq/L. The Hall data set shows much greater 226Ra concentrations than the TWDB data set with almost all samples having concentrations greater than the EPA MCL. This result is expected as ore deposits are areas of elevated concentrations of the target resource commodity and other elements that are associated with that commodity. Additional discussion of water quality near ISR mines is in Section 5. Clearly, groundwater in Texas faces numerous water-quality challenges from natural, geologic sources, including U deposits, that occur in aquifers.
4.2. Surface Water
Surface water supplies about 40 percent of all water used in Texas for all purposes [110]. From south to north, rivers that cross the three permissive tracts of the U resource assessment area [13] are the Rio Grande, the Nueces, the San Antonio, Guadalupe, Lavaca, Colorado, Brazos, San Jacinto, Trinity, Neches, and Sabine (Figure 1). Known U occurrences lie in the Rio Grande, Nueces, San Antonio, Guadalupe, Lavaca, Colorado, and Brazos River Basins (Figure 1). Few studies have evaluated the effects of past mining and mill operations on these drainages. A study of the Nueces River Basin found that As concentrations in the basin are related to interactions of surface water with groundwater from U- and As-rich geological formations and are not sourced from past U operations [111]. Three of the major rivers within the permissive tracts–the Nueces, the San Antonio, and the Guadalupe Rivers–drain large areas of limestone in south central Texas and consequently have hardness ranging from moderately hard to very hard [50,51,52]. Although interaction of surface-water resources with U extraction activities is less of a concern for ISR mining than for open-pit mining, it is possible that flooding caused by hurricanes could potentially cause excursions of contaminated material from ISR operations, though evaluation of flooding potential is part of the permitting process [90].
Results of Synthetic Precipitation Leaching Procedure (SPLP) tests (EPA Method 1312) [105] on U mill tailings samples are a rough proxy for dissolved concentrations that could be derived from U ore-deposit material weathering at the surface. The SPLP tests have a pH of about 5 and are designed to mimic interaction of rain with waste material. The SPLP tests were conducted on most of the tailings samples (the Moab sandstone-hosted U mill tailings sample and all samples from the non-sandstone hosted U deposit tailings, [62]) having bulk chemistry in Figure 5 except for the sandstone-hosted mill tailings from [63]. More details are provided in the Supplemental Information section “1.2.1 Sources of samples and data”. Results indicate the range of leachate chemistry generally falls within the range of NURE and TWDB chemistry for all five analytes (As, Mo, Se, U, and V) (Figure 7). In addition, As, Se, and U have leach samples above and below the MCL. The one sandstone-hosted sample has greater concentrations of As, Mo, Se, and V (but not U) than samples from the other U tailings types (Figure 7), likely due to the generally lower amount of U in the sandstone tailings relative to the other U deposit types (Figure 5).
All the major rivers in the assessment area discharge to the Gulf of Mexico in estuarine environments that contribute to the economic and environmental health of Texas. Further, several of these estuaries host National Wildlife Refuges. In particular, the Rio Grande Valley and Laguna Atascosa National Wildlife Refuges lie in estuarine and coastal environments north of the Rio Grande and the Aransas National Wildlife Refuge lies south of the mouth of Guadalupe River (Figure 3). All present-day U mining in the STU upstream from these locations utilizes ISR mining and thus has minimal effect on surface-water supplies. However, exceptional circumstances such as hurricanes could result in flooding and accidental releases of product or overtopping of evaporative basins. For example, in 2017, Hurricane Harvey produced over 152 centimeters of rainfall in some areas of Texas over an 8-day period, producing abundant coastal and inland flooding [112,113]; however, there were no known problems at U facilities during this event. No reports were found documenting potential effects on coastal and estuarine environments from mining STU deposits.
5. Environmental Considerations
The environmental effects of mining STU deposits largely depend on interactions of geology, hydrology, climate, and mining method. The latter is perhaps the most important determinant of environmental effects, within the context of the other factors listed. Due to the generally shallow nature of the known resources and the lack of favorable conditions for underground mining, conventional surface mining and ISR mining are the two most likely mining techniques to be utilized. Although newly discovered deposits could be mined using ISR, some shallow undiscovered resources may not be amenable to ISR techniques, for example, if they were not in a confined aquifer. This section provides a brief overview of how current climate influences the environmental effects of mining the STU deposits and then focuses on the following environmental effects of surface mining:
- past releases into streams or groundwater or windblown releases to soil from mills or open-pit mines that occurred before such releases were regulated;
- uranium, radiation, or trace element leakage from reclaimed open-pit mines or mills;
- acid-mine drainage caused by the presence of iron sulfides in older mine-spoil piles or mill tailings;
and effects from ISR mining:
- 4.
- radon gas at active ISR operations;
- 5.
- radiation or contaminant leakage during production and transport of ISR resin or yellowcake;
- 6.
- uranium excursions into groundwater surrounding active ISR operations; and
- 7.
- contamination of groundwater after ISR mining.
5.1. Effects of Current Climate on Environmental Signatures
The STU region crosses several climate regions and varies from semiarid in the southwest to semi humid in the northeast. Monthly mean temperatures range from about 13 °C in January to about 30 °C in August. Mean annual precipitation varies in the STU region from less than 51 cm per year in the southwest to slightly more than about 90 cm per year in the northeast [33]. Because of the mild climate, ISR lines carrying solution to and from the well field do not have to be buried, and capital costs are about two-thirds less than in ISR operations in Wyoming [67]. As this region is in the Texas Gulf Coast, there is a risk of facility damage by hurricanes and tornadoes. The variations in climate from southwest to northeast across this region contribute to greater potential for air stagnation, and hence to radon accumulation in the southwest versus greater potential for runoff of wastes and excursions to surface and groundwater systems in the northeast [12].
5.2. Environmental Concerns from Surface Mining
5.2.1. Pre-Regulation Releases to Streams, Groundwater, or Soils
A few studies have evaluated the effects of past mining and mill operations in the STU region on surface-water quality with results indicating limited effects. Practices common before regulations started in the late 1970s, such as dewatering open pits into adjacent drainages, had potential to affect surface water [23,54]. One study indicated that elevated arsenic concentrations in a reservoir were related to interactions of surface water with groundwater from U- and As-rich geological formations and were not caused by past U-mining operations [111]. Sediment sampled from a stock pond adjacent to an open-pit mine, which was converted to a mill tailings disposal site near the Falls City mill (Figure 3), showed a threefold increase in 226Ra from the early 1960’s to the early 1970’s, and afterwards a decline to nearly pre-mining concentrations, indicating that the environmental effect of the operation was likely restricted to the time when the facility was active [114]. Another study in the same pond found U concentrations in the pond water were comparable to those in pristine aquatic systems [111]. The DOE concluded there were no surface-water effects to tributaries of the Nueces and San Antonio Rivers from groundwater releases from the Falls City mill [115].
Prior to regulations implemented in the late 1970s, spoil piles at open-pit mines and mill tailings piles often were exposed to erosion that potentially could have affected surface water, groundwater, or soils through windblown transport [23,54]. Elevated concentrations of trace elements in soils in several mining areas were attributed to the pumping of pit water into adjacent drainages for disposal and (or) erosion of abandoned spoil piles into drainages. The same study found trace element concentrations were similar upwind and downwind from mine locations and were also similar to background concentrations, indicating that windblown dust is not causing elevated trace element concentrations near studied mine sites [54]. In contrast, the DOE reported that before reclamation, windblown contamination occurred near the Falls City mill tailings [116]. Another study found a reduced DNA repair response in residents who had lived for more than 10 years within 1.6 km downwind from mine and mill operations near Karnes City but found no significant increase in chromosome aberrations [117]. A study of Karnes County residents living near areas of U processing found no unusual patterns of cancer mortality over a 50-year period [118]. Elevated concentrations of Mo in soil relative to copper likely were responsible for incidents of molybdenosis (a disease caused by excess molybdenum relative to copper in feed) in cattle. The cause of elevated Mo was attributed both to the effects of U mining [23] and to naturally high Mo concentrations in soils [115].
Degradation of groundwater quality has been reported at all four prior U mill sites (Falls City, Ray Point, Conquista, and Panna Maria (Figure 3)). There has been disagreement about whether contamination at the sites is natural and related to U mineralization in the aquifer or is related to pre-regulation activities at the mills [23,116]. No information was located on groundwater contamination at open-pit mine reclamation sites. At the Falls City mill site, groundwater in underlying aquifers is classified as Class III due to widespread naturally occurring elevated levels of sulfate, total dissolved solids, and U unrelated to milling activities but likely related to U mineralization [72,119]. (Note, in the United States, Class I groundwaters are those that are highly vulnerable to contamination, or are highly valuable as a drinking water source, or that supply water to important ecological habitat. Class II groundwaters are current and potential sources of drinking water and water having other beneficial uses and comprise most groundwater in the United States. Class III groundwaters are not a source of drinking water and are of limited beneficial use [120]). Other reports indicate that there are two acidic, metal-rich groundwater plumes under the site that are related to site activities [23]. Groundwater resources at the three UMTRCA title II sites (Conquista, Panna Maria, and Ray Point former U mills) “contain contaminants which have seeped from old, pre-regulation unlined impoundments” (p. 45 [78]). Discussions about groundwater remedies and compliance at these three sites are ongoing (2022) [73,74,75].
5.2.2. Leakage from Reclaimed Mills or Open-Pit Mines
There is potential for lingering problems from reclaimed mill and mine sites. Uranium is still present in the reclaimed mill tailings because the extraction efficiency of the milling process ranged from 80 to 95 percent [23]. During mill tailings reclamation, a clay cover is used to attain decommissioning standards, which include reducing radon gas emissions to standards, providing infiltration control, attaining background gamma levels, reducing U and 226Ra concentrations in all radioactive materials to standards, stabilizing the tailings impoundment and disposal cell, and demonstrating that groundwater quality does not exceed standards [82,121]. As described in Section 5.2.1, groundwater degradation has occurred at the four former U mill sites.
Reclamation of abandoned open-pit mines typically consisted of pit-dewatering, highwall reduction, burial of radioactive and acidic spoil, recontouring, installation of erosion and drainage control structures, and revegetation [122]. Most ponds at restored mine sites have been certified by the State as producing fish that are safe for human consumption [23].
5.2.3. Acid-Mine Water
Oxidation of pyrite and marcasite, both common in STU deposits, releases acid and metals to water. The Tertiary sedimentary sequence (and related soils and paleo-caliche horizons) that host the STU deposits contains calcium carbonate as sandstone cement, granules, and clasts that are expected to help neutralize acid mine drainage [33,49,53,97]. Neutralization is also aided by the overall reported surface-water hardness in the region [50,51,52].
Although the close contact of acid-generating and acid-neutralizing materials in aquifers may preclude development of acid plumes in groundwater, open-pit mining in the STU region experienced some acidity problems. Acidic material was reported in spoil piles at Stoeltje, Weddington North, and Brown (abandoned) U mines in Karnes County and at the Mabel New-Superior abandoned mine in Live Oak County [123] (locations in Figure 3). The Searcy U mine open pit contained acidic water prior to its reclamation in 1990 [71].
5.3. Environmental Concerns from ISR Mining
The primary environmental concerns from ISR mining are (1) radon gas at active ISR operations, (2) radiation or contaminant leakage during production and transport of ISR resin or yellowcake, (3) uranium excursions into groundwater surrounding active ISR operations, and (4) contamination of groundwater after ISR mining. A conceptual source to receptor model developed for the geoenvironmental assessment of mining undiscovered U resources in the STU region (Figure 8; [12]) reinforces how some of these concerns might affect air, surface water, and groundwater. Pathway 1 represents the generation of radon during mining operations and(or) from waste associated with mining (concern 1). Pathways 2 and 3 represent the potential for contaminants that might leak during wellfield production, transport of ISR resin, and production of yellowcake to contaminate surface and groundwater resources (concern 2). Pathway 4 represents the potential for groundwater contamination to occur, either from excursions (concern 3) or after mining (concern 4). The source to receptor model was used in the geoenvironmental assessment [12] to guide data collection to depict areas where contaminants introduced in pathways 1–4 might occur and persist in air, surface water, and groundwater. Herein, environmental concerns 1–4 are described in more detail along with published evidence that supports (or sometimes refutes) the concerns.
5.3.1. Radon Gas at Active ISR Operations (Pathway 1)
Radon (222Rn) gas is a short-lived (half-life = 3.8 days) radioactive decay product of radium (226Ra), which is itself formed through radioactive decay of 238U. Radon, when inhaled, decays to three isotopes of polonium that further decay in the lungs, releasing energy that can lead to cell damage and lung cancer [124,125]. Radon gas concentrations have been reported at greater than 37,000 Becquerel/liter (Bq/L) in U ore bodies [126], and are elevated between about 300 to 6990 Bq/L in pregnant lixiviant solutions [127], compared to a proposed EPA regulatory limit of about 11 Bq/L (300 picocuriesCi/L [pCi/L]) in drinking water [126]. Consequently, radon gas is a potential health concern during ISR mining of U deposits. As long as lixiviant solutions are in closed loop operations, radon is expected to be contained, except during planned bleed of the lines and in the case of accidental breach of the closed loop processes [127]. Radon gas could also be released from evaporation ponds that are used in some ISR operations to reduce waste volume (p. 10 [81]). However, Brown and Chambers reported that operating experience consistently shows that radon gas emitted from these ponds is below dose limits because radon generated from radioactive decay of 226Ra in solids in the pond decays before migrating upward to the water/solids interface [128], as long as the solids are covered with sufficient water. Gallegos et al. [84] estimated radon generated per kilogram of U3O8 produced using available data for Texas ISR mines in the Goliad Sand, and assumed that all radon gas dissolved in pregnant lixiviant solutions would be released to the atmosphere (in contrast to the closed-loop discussions of [127]). They concluded that radon generation at Texas ISR mines (about 106 gigabecquerel/tonne [GBq/t] U3O8) was about twice that reported for ISR mines in Australia (54 GBq/t U3O8), but much less than radon release reported during underground mining of U deposits (1088 GBq/t U3O8) [84]. Radon generation from tailings piles and ponds remains a concern associated with conventional surface and underground U mining and production. Dry piles containing U-bearing materials emanate more radon than wet [129]. Reclamation of these tailings piles includes addition of cover to limit or retard radon emanation [22].
5.3.2. Radiation or Product Leakage during ISR Production and Transport of Resin or Yellowcake (Pathways 2 and 3)
During ISR mining, in general, a relatively small amount of U daughter products is mobilized by the lixiviant solution. As previously mentioned, radon gas in the pregnant lixiviant can be considerable. In contrast, up to only about 15 percent of radium in the host formation may be mobilized [127]. The mobilized 226Ra has the same chemical characteristics as calcium and forms radium carbonates and sulfates in calcite slurry-bleed streams and associated wastes. Where solid wastes are processed and stored, or during maintenance, this 226Ra is an external exposure or contamination source. In addition, during maintenance activities when normally closed systems are opened, aged process material could be present that may exhibit elevated beta activity due to short-lived thorium-234 and protactinium-234 [127]. Consequently, external exposure monitoring is recommended where large quantities of U concentrates are processed and where radium concentrates could accumulate [127]. Up to 2009 (the time period covered in the cited study), the Smith-Ranch Highland site, an ISR operation in Wyoming, had several spills of injection fluids ranging from about 200 to almost 758,000 liters and containing from 0.5 to about 150 milligrams per liter U [130]. During our literature review, no evidence for spills of this magnitude was found for the STU region. Though controls are in place for much of the ISR activities, extreme weather, unforeseen circumstances, accidents, or human error could potentially contribute to excursions of this material and associated radiation to the areas around ISR facilities.
Ion-exchange resin beads, which are processed to make yellowcake, have low U content though one study scenario calculated risks from a resin spill and used an assumed concentration of 1.04 × 10⁷ Bq/L, which is roughly 1.9 × 10⁸ ug/L [88]. Radiological consequences of a spill of resin with this U content resulted in 7.4 × 10⁻⁵ sievert exposure, which is far below the annual occupational exposure of 0.05 sievert [88]. At some mines yellowcake is produced onsite. Small operations may drain and transport resin to off-site facilities for processing to yellowcake [126]. Yellowcake has a relatively low level of radioactivity because although it is about 70 to 80 percent U by weight, more than 99 percent of yellowcake is 238U, the least radioactive U isotope because of its long radioactive half-life (4.5 × 10⁹ years). Radioactive decay of 238U emits weak gamma rays and alpha particles, which are less penetrating than other forms of radiation. As long as it remains outside the body, yellowcake poses little health hazard [131]. However, yellowcake is toxic after prolonged exposure if inhaled or swallowed, causing damage to the kidneys, liver, and lungs. Risk of inhalation or ingestion, however, is minimal because yellowcake is so dense and heavy that there is minimal dust generation, and toxicity risks are low because it is effectively insoluble [131,132]. In contrast, Ref. [133] in 2014 reviewed (then) recent studies on the solubility of U products from ISR plants and concluded that U products are “very soluble” and that workers exposed to soluble yellowcake concentrates need to have weekly monitoring for biomarkers associated with kidney (renal) injury. The NRC oversees the transportation safety of yellowcake through regulatory requirements, package certification, inspections, and a monitoring system [134]. Yellowcake is shipped in 55-gallon drums (about 208 L), and such shipments have a good safety record. However, in 2014 the NRC reported nine known instances at different sites where problems with over-pressurized drums caused U uptake by an unspecified number of workers. The NRC addressed this issue by extending required venting times before sealing the drums [134].
Any incident that releases product or process solutions to the ground represents potential for contamination of soil and surface water or shallow groundwater resources (pathways 2 and 3, Figure 8). The geoenvironmental assessment of the STU region used data published on hydrologic and geochemical properties of surface water and groundwater and erosion potential to identify areas in permissive tract three (Figure 1), where contamination from such spills would be more likely to occur and persist in those resources. This approach might be useful for identifying areas vulnerable to contamination after such spills where additional preventative measures might be installed to mitigate effects of accidental spills.
5.3.3. Excursions from Active ISR Well Fields to Surrounding Groundwater (Pathway 4)
Excursions are when lixiviant or well field groundwater containing U and other trace elements moves beyond the boundaries of the production area either horizontally beyond the well field or vertically into overlying or underlying aquifers [130] (Figure 6). Excursions are caused by (1) improper water balance between injection and extraction wells, (2) unknown zones of high permeability or faults, (3) improperly abandoned exploration wells, (4) discontinuous confining layers, (5) poor well construction that causes leaking joints or a cracked well casing, and (6) hydrofracturing of the ore zone or surrounding geologic units [21,130]. Excursions of groundwater from active ISR well fields/production areas to surrounding groundwater are a concern that is theoretically mitigated by extensive groundwater monitoring in ISR well fields [21]. Monitoring wells at ISR sites are typically spaced at distances governed by regulatory requirements that are generally less than 150 m apart and are completed in the ore-bearing aquifer (Figure 9) [85]. These wells surround the production zone at some range of distances from the outermost production area wells, as required by regulations, and are typically about 122 to 152 m from the outermost production-area wells (Figure 9). Monitoring wells are also completed in aquifers overlying and underlying the ore zone (Figure 6). In the production area there is a mixture of injection wells to deliver lixiviant, and extraction wells to withdraw pregnant lixiviant for transfer to the ion exchange columns (Figure 6 and Figure 9). The pattern of injection and extraction wells varies with the size of the production area and local conditions such as permeability, sand thickness, and ore grade and distribution [86]. Inside the production area, the extraction rate exceeds the injection rate by about 1 to 3 percent [85] to create a hydraulic gradient that draws groundwater outside the mine area into the production area to prevent excursions of the lixiviant. Flow rates are regularly monitored to assess operational conditions and mineral royalties [80,109]. If movement of mining fluids out of the production zone is detected, the operator needs to have operating procedures to analyze an excursion and determine how to remediate it [130].
Despite the intentions and existence of extensive monitoring networks, excursions have occurred. An early report relative to the history of ISR mining in Texas [135] discussed the history of excursions to monitoring wells from production areas up to that time (1986). The report concluded that horizontal excursions are relatively well-controlled by keeping injection rates less than pumping rates, and by shutting down injection while continuing to pump if necessary to control an excursion. However, it also identified vertical excursions to overlying aquifers through improperly plugged exploration wells as an issue. They recommended analyzing monitoring well samples for nonreactive ionic species found in the lixiviant solutions to better detect these excursions. Rice [136] discussed excursions in production areas at the Kingsville Dome mine (Figure 3), focused on concerns about which data to use to identify excursions, and recommended constructing nested wells instead of wells screened in the entire producing interval to better detect excursions [136].
5.3.4. Contamination of Groundwater after ISR Mining (Pathway 4)
Texas regulations stipulate that after U extraction from an ISR production area, groundwater needs to be restored to baseline values for as many as 26 constituents (calcium, magnesium, sodium, potassium, carbonate, bicarbonate, sulfate, pH, chloride, nitrate as nitrogen, fluoride, silica, total dissolved solids, conductance, alkalinity, ammonia, arsenic, cadmium, iron, lead, manganese, mercury, molybdenum, selenium, uranium, and radium226). Restored aquifers are monitored for one year to verify that concentrations have stabilized [137,138]. Aquifer restoration may be accomplished via techniques that can include groundwater sweeps, reverse osmosis treatment, subsurface injection of chemical reductants, bioremediation and monitored natural attenuation, or a combination of any of the listed techniques [88,94]. Several studies have shown that it is challenging to restore groundwater at ISR operations to pre-mining baseline concentrations [108,136,139]. Other studies document successful remediation [109].
During ISR remediation, dissolved U concentrations are controlled by multiple geochemical factors including pH, Eh, adsorption/desorption, mineral precipitation/dissolution, and U oxidation state. The oxidized form of U, U(VI), is more mobile than the reduced form of U, U(IV) ([22] and references therein). The aqueous speciation of U(VI) depends on the pH and concentrations of strong complexing entities such as inorganic carbon (dissolved carbonate species), phosphorous, and fluoride, and ternary complexing entities including dissolved magnesium and calcium [22]. The presence of these strong complexing entities, some of which are common constituents of groundwater (calcium, magnesium, and dissolved carbonate species), complicates removal of U(VI) from groundwater. Furthermore, the redox chemistry of U is sensitive to multiple chemical redox couples besides dissolved oxygen and can also be influenced by microbial processes. For example, the redox transition of U(IV)/U(VI) occurs near the Fe(II)/Fe(III) transition [140]. The redox potential at which the U(IV)/U(VI) transition occurs varies with the aqueous speciation of U(VI) with regard to calcium and inorganic carbon complexing agents (see Figure 1 in [140]). Consequently, U(VI) can occur in oxic, suboxic, and anoxic conditions where the kinetics of biogeochemical reactions control oxidation state [22]. These are only a few examples of the possible multiple factors that govern the solubility of U(VI), and which complicate remediation by increasing the number of parameters that must be measured, modeled, and accounted for during ISR groundwater restoration.
A recent study of ISR operations in Wyoming, USA, demonstrates the detailed data and modeling that can be used to understand the long-term effects of groundwater restoration at ISR sites. This study at one mining area at the Smith Ranch–Highland operation employed detailed mineralogic and geochemical characterization of aquifer materials from the production and downgradient aquifers combined with reactive transport modeling to suggest that elevated concentrations of some constituents that remain after restoration will be attenuated when they encounter reducing materials such as pyrite and organic carbon in downgradient aquifer materials [141]. Experimental work has also shown that reductants downgradient from mining areas may help attenuate elevated U concentrations [142]. Ultimately, the success of restoration is subject to the geochemical constraints at each site combined with the choice of restoration techniques [143], which vary from site to site, and even possibly vary within different production areas at the same mines.
As an example of the effects of mining and groundwater restoration on water quality, data are presented from Hall [108] who compared baseline to post-remediation groundwater-quality concentrations in the STU area at 22 of 77 production areas (13 of 36 mines) having available data [104]. The data indicate that As, Mo, 226Ra, Se, and U in some or all samples have post-restoration concentrations greater than baseline concentrations (Figure 10). However, all constituents except U also have samples where post-restoration concentrations are below baseline concentrations (below the 1:1 line in Figure 10). Uranium and Se have the poorest restoration performance, having more samples falling above the 1:1 line than shown in the graphs for As, Mo, and 226Ra (Figure 10). The EPA MCLs are exceeded in more samples for As, 226Ra, and U than for Se. There is no MCL value for Mo. The MCL values are shown for comparison. It is recognized that the samples come from exempted aquifers that had poor water quality with respect to most of these constituents prior to mining (e.g., [130,136]). These diagrams illustrate that water quality was poor prior to mining, particularly for As, 226Ra, and U (Figure 10). In addition, some of these constituents did not have MCLs when the samples were obtained, or MCLs have become lower since samples were collected [109]. Finally, these data and interpretations [104,108] were the subject of one discussion that questioned how well the data represented baseline conditions [109].
6. Considerations to Improve Environmental Outcomes
Research continues to focus on improving outcomes after ISR restoration. Multiple studies have recommended and implemented groundwater modeling strategies to help improve understanding of aquifer hydrologic and geochemical conditions in areas using ISR mining. Davis and Curtis [144] recommended that developing a conceptual model backed up by a geochemical modeling using computer code that has reactive transport capabilities that includes groundwater flow, solute transport, and geochemical reactions at a particular site (such as PHREEQC–PH REdox Equilibrium, a public domain geochemical modelling software package [145]), can be used to estimate the number of pore volumes of flush (and thus cost) to restore groundwater after mining. In one example, groundwater modeling and calculated doses and risks to receptors using groundwater downgradient from a hypothetical ISR site were used to evaluate the consequences of hypothetical scenarios where contaminants from ISR were released beyond the operating perimeters of the mine [130]. This report [130] noted that modeling results indicated rigorous regulatory regimes were needed at ISR operations, but also that rigorous monitoring could minimize potential for the modeled scenarios to occur and expose downgradient water users. In another example, a reactive transport model was used to better understand the biological and transport processes controlling experimental biostimulation to decrease U concentrations in a groundwater plume associated with a legacy U mill [146]. Although this application was not specific to ISR, it illustrates some of the breadth of modeling applications that are relevant to understanding the environmental effects of ISR mining. Saunders et al. [21] discussed how modeling could be used to better understand remediation at ISR sites and noted data gaps that increase aquifer vulnerability to ISR mining. Data gaps include poorly understood stratigraphy of mined aquifers, undetected preferential flow paths, insufficient understanding of the capture zones of nearby wells, and poorly understood geochemistry downgradient from ISR mining. These data gaps argue for increased geologic, hydrologic, and geochemical characterization to develop effective post-ISR monitoring programs and outcomes. Since then (2016), one way these data gaps have been filled is through increasing use of reactive transport models for industrial and environmental applications. Specifically, some applications of reactive transport models that are used to better aid decision making during the mining of uranium also aid in controlling environmental impacts [147]. In a recent example [148], a reactive transport model was constructed and used to redesign the production well field to maximize production. The model simulated a 28 percent increase U production with the new well-field design that was matched by actual production that deviated less than 10 percent from the model simulations. It is conceivable that this model might also be used to aid simulating and improving restoration outcomes. Other research gaps whose closure could aid environmental outcomes at ISR mine include new technology for U fixation and long-term stability in post-ISR environments; biostimulation methods that selectively encourage the growth of native bacteria to reduce U(VI) and other elements of concern; and studies on mechanisms that control (a) adsorption/desorption, (b) oxidation/reduction, and (c) dissolution/precipitation of radionuclides and potentially toxic metals in groundwater ISR environments [149].
7. Summary
This paper conducts a review of existing literature and data to develop a GEM for the U deposits of the STU region which describes the geology and mineralogy of the deposits, regulatory framework, water resources and water quality in the region, and the primary environmental concerns associated with mining these U deposits. This GEM is collocated with the area covered in a USGS uranium mineral resource assessment [13] and supports the geoenvironmental assessment of permissive tract 3 of the resource assessment area [12]. However, the outline and approach applied in this GEM, as well as much of the information and references cited, are widely applicable to other types of sandstone-hosted U deposits and could be used as a basis to construct a GEM for those types of deposits in different geographical, climatic, and regulatory environments beyond South Texas.
The STU deposits are located within the broad, flat Texas Coastal Plain bordering the Gulf of Mexico. They are roll-type deposits in Tertiary sandstones that form a curvilinear belt almost 500 km long 25 to 50 km wide that contains 254 known U occurrences, most of which are south of the San Marcos Arch. Mean estimated undiscovered resources are 99,790 metric tons U3O8 [13]. Deposits occur in aquifers at redox fronts showing progressive enrichment in Se, then U, then Mo moving downgradient along the groundwater flow direction. In addition to U, the deposits are enriched in As, Mo, Se, and V. Soils may also show this enrichment due to natural processes or due to contamination from legacy open-pit mining operations.
Mining and ore processing methods in the STU have evolved through time with open-pit mining dominating near the start of mining in the 1950s and ISR methods beginning in the 1970s. The ISR methods are the sole method utilized today (2022) in this region and are the most likely method to be used moving forward due to lower operating and environmental costs than open-pit mining. Since the late 1970s, U exploration and mining have been covered by regulations that are promulgated by the Texas Railroad Commission and the Texas Commission on Environmental Quality.
Despite progress reclaiming open-pit U mining areas in the STU, there are lingering environmental concerns, including: (1) past releases into streams or groundwater or windblown releases to soil from mills or open-pit mines before such releases were regulated; (2) uranium, radiation, or trace element leakage from reclaimed open-pit mines or mills; and (3) acid-mine drainage caused by the presence of iron sulfides in older mine-spoil piles or mill tailings. These concerns have been largely mitigated by reclamation activity, though licensees at three of the four U mills that closed since the end of open-pit mining are still (2022) undergoing closure activities.
The primary environmental concerns with ISR mining in the STU are (1) radon gas at active ISR operations, (2) radiation or contaminant leakage during production and transport of ISR resin or yellowcake, (3) excursions of U and other trace elements enriched in the STU deposits into groundwater surrounding active ISR operations, and (4) contamination of groundwater after ISR mining. Although existing regulations attempt to minimize all these concerns, good control over (3) and (4) is difficult to achieve. Accidental releases influence (1) and (2). These concerns are likely not unique to the STU and could be a starting point for ranking environmental concerns in other areas where ISR mining is employed. For example, radon gas might be less of a concern in areas where air stagnation is infrequent, such as Wyoming, USA, an area containing sandstone-hosed uranium deposits mined by ISR. Researchers suggest that reactive transport modeling and a better understanding of geology, stratigraphy, and geochemistry of ISR production areas could improve results of groundwater restoration and minimize excursions into surrounding groundwater.
Supplementary Materials
Author Contributions
Conceptualization, K.W.-D., J.B., R.R.S.II, T.J.G. and J.D.; methodology, K.W.-D., J.B., R.R.S.II and J.D.; validation, K.W.-D., J.B., K.D.B. and J.D.; formal analysis, K.W.-D., J.B., R.R.S.II, K.D.B. and J.D.; investigation, K.W.-D., R.R.S.II, K.D.B. and J.D.; resources, K.W.-D., J.B. and R.R.S.II; data curation, K.W.-D., J.B., R.R.S.II, K.D.B. and J.D.; writing—original draft preparation, K.W.-D., J.B., R.R.S.II, K.D.B. and J.D.; writing—review and editing, K.W.-D., J.B., R.R.S.II, K.D.B. and J.D.; visualization, K.W.-D., J.B. and T.J.G.; supervision, K.W.-D. and T.J.G.; project administration, K.W.-D.; funding acquisition, K.W.-D. All authors have read and agreed to the published version of the manuscript.
Funding
This paper was funded by Environmental Health Program within the Ecosystems Mission area, and by the Energy and Minerals Resource Programs in the Energy and Minerals Mission Area at the U.S. Geological Survey.
Data Availability Statement
The NURE stream sediment data presented in Figure 5 are available for download at [58]. The USGS soil data presented in Figure 5 are available for download at [60]. Data for U tailings samples presented in Figure 5 and Figure 7 are available at [62]. The NURE groundwater data presented in Figure 7 are available for download at [101]. The TWDB data presented in Figure 7 are available at [102]. Baseline and post-restoration groundwater data for ISR mines shown in Figure 7 and Figure 10 are available at [104].
Acknowledgments
Helpful information was provided by individuals from the Texas Railroad Commission and the Texas Commission on Environmental Quality. Andrew Teeple from USGS assisted with stratigraphic information. Lynne Fahlquist (retired), George Ozuna, Kate Campbell, and Susan Hall (all USGS) provided helpful discussions, contacts, and information. Kelli Palko assisted article formatting. Helpful reviews were provided by Richard Wanty, Bradley Van Gosen, and Chris Braun (all USGS), 2 anonymous reviewers and the editors of the guest volume. Any use of trade, firm, or product names is for descriptive purposes only and does not imply endorsement by the U.S. Government.
Conflicts of Interest
The authors declare no conflict of interest.
References
- du Bray, E.A. Preliminary Compilation of Descriptive Geoenvironmental Mineral Deposit Models; Open-File Report 95-831; U.S. Geological Survey: Denver, CO, USA, 1995; p. 275.
- Plumlee, S.G.; Nash, T.J. Geoenvironmental Models of Mineral Deposits—Fundamentals and Applications; Open-File Report 95-831; U.S. Geological Survey: Denver, CO, USA, 1995; pp. 1–9.
- Wanty, R.W.; Berger, B.R.; Plumlee, G.S.; King, T.V.V. Geoenvironmental Models—An Introduction. In Deposit and Geoenvironmental Models for Resource Exploitation and Environmental Security, NATO Science Series, 2. Environmental Security; Fabbri, A.G., Gaal, G.R., McCammon, B., Eds.; Kluwer Academic Publishers: Dordrecht, The Netherlands, 2003; Volume 80, pp. 3–42. [Google Scholar]
- Seal, R.R., II; Foley, N.K.; Wanty, R.B. Introduction to geoenvironmental models of mineral deposits. In Progress on Geoenvironmental Models for Selected Mineral Deposit Types; Open-File Report 02-195; Seal, R.R., II, Foley, N.K., Eds.; U.S. Geological Survey: Reston, VA, USA, 2002; pp. 1–7. [Google Scholar]
- Seal, R.R., II; Piatak, N.M.; Kimball, B.E.; Hammarstrom, J.M. Environmental considerations related to mining of nonfuel minerals. In Critical Mineral Resources of the United States—Economic and Environmental Geology and Prospects for Future Supply; Schulz, K.J., DeYoung, J.H., Jr., Seal, R.R., II, Bradley, D.C., Eds.; U.S. Geological Survey Professional Paper 1802; U.S. Geological Survey: Reston, VA, USA, 2017; p. 16. [Google Scholar]
- Verplanck, P.L.; Van Gosen, B.S.; Seal, R.R.; McCafferty, A.E. A Deposit Model for Carbonatite and Peralkaline Intrusion-Related Rare Earth Element Deposits; Scientific Investigations Report. 2010-5070-J; U.S. Geological Survey: Denver, CO, USA, 2014; p. 58.
- Taylor, R.D.; Hammarstrom, J.M.; Piatak, N.M.; Seal, R.R., II. Arc-Related Porphyry Molybdenum Deposit Model; Scientific Investigations Report. 2010-5070-D; U.S. Geological Survey: Denver, CO, USA, 2014; p. 64.
- Jordan, G.; Abdaal, A. Decision support methods for the environmental assessment of contamination at mining sites. Environ. Monit. Assess. 2013, 185, 7809–7832. [Google Scholar] [CrossRef] [PubMed]
- von Gleich, A.; Ayres, R.U.; Gössling-Reisemann, S. (Eds.) Sustainable Metals Management; Springer: Dordrecht, The Netherlands, 2006; p. 607. [Google Scholar]
- Parra, C.; Lewis, B.; Ali, S.H. (Eds.) Mining, Materials, and the Sustainable Development Goals; CRC Press: Boca Raton, FL, USA, 2021; p. 212. [Google Scholar]
- Gallegos, T.J.; Walton-Day, K.; Seal, R.R., II. Conceptual Framework and Approach for Conducting a Geoenvironmental Assessment of Undiscovered Uranium Resources; Scientific Investigations Report 2018-5104; U.S. Geological Survey: Denver, CO, USA, 2020; p. 28.
- Gallegos, T.J.; Stengel, B.G.; Walton-Day, K.; Blake, J.; Teeple, A.; Humberson, D.; Cahan, S.; Yager, D.B.; Becher, K.D. A Novel Method for Conducting a Geoenvironmental Assessment of Undiscovered ISR Amenable Uranium Resources: Proof of concept in the South Texas Coastal Plain. Minerals 2022, 12, 747. [Google Scholar] [CrossRef]
- Mihalasky, M.J.; Hall, S.M.; Hammarstrom, J.M.; Tureck, K.R.; Hannon, M.T.; Breit, G.N.; Zielinski, R.A. Assessment of Undiscovered Sandstone-Hosted Uranium Resources in the Texas Coastal Plain, 2015; U.S. Geological Survey Fact Sheet 2015-3069; U.S. Geological Survey: Reston, VA, USA, 2015; p. 4.
- Wenrich, K.J.; Van Gosen, B.S.; Finch, W.I.; du Bray, E.A. Solution-Collapse Breccia Pipe U Deposits; U.S. Geological Survey Open-File Report 95-831; U.S. Geological Survey: Denver, CO, USA, 1995; pp. 244–251.
- Kyser, K.; Cuney, M. Sandstone-Hosted Uranium Deposits; Chapter 9; Mineralogical Association of Canada: Quebec, QC, Canada, 2009; Volume 39.
- Hall, S.M.; Mihalasky, M.J.; Tureck, K.R.; Hammarstrom, J.M.; Hannon, M.T. Genetic and grade and tonnage models for sandstone-hosted roll-type uranium deposits, Texas Coastal Plain, USA. Ore Geol. Rev. 2017, 80, 716–753. [Google Scholar] [CrossRef]
- Dahlkamp, F.J. Texas Coastal Plain Uranium Region. In Uranium Deposits of the World: USA and Latin America; Springer: Berlin, Germany, 2010; pp. 311–355. [Google Scholar]
- U.S. Department of Energy. An Assessment Report on Uranium in the United States of America; GJO-111(80); U.S. Department of Energy: Washington, DC, USA, 1980; p. 148.
- King, P.B.; Beikman, H.M.; Edmonston, G.J. Geologic Map of the United States (Exclusive of Alaska and Hawaii); U.S. Geological Survey: Denver, CO, USA, 1974.
- Adams, S.S.; Smith, R.B. Geology and Recognition Criteria for Sandstone Uranium Deposits in Mixed Fluvial-Shallow Marine Sedimentary Sequences, South Texas; Report GJBX-4(81); U.S. Department of Energy: Grand Junction, CO, USA, 1981; p. 154.
- Saunders, J.A.; Pivetz, B.E.; Voorhees, N.; Wilkin, R.T. Potential Aquifer Vulnerability in Regions Down-Gradient from Uranium In Situ Recovery (ISR) Sites; Elsevier: Amsterdam, The Netherlands, 2016; pp. 67–83. [Google Scholar]
- Campbell, K.M.; Gallegos, T.J.; Landa, E.R. Biogeochemical Aspects of Uranium Mineralization, Mining, Milling, and Remediation. Appl. Geochem. 2015, 57, 206–235. [Google Scholar] [CrossRef] [Green Version]
- Parker, R.L.; Herbert, B.E. History, geochemistry and environmental impacts of contaminants released by uranium mining in south Texas. In Proceedings of the South Texas Environmental Conference, Corpus Christi, TX, USA, 18–20 October 2000; p. 15. [Google Scholar]
- Texas Commission on Environmental Quality. Central Registry Query—Additional ID Search. 2022. Available online: https://www15.tceq.texas.gov/crpub/index.cfm?fuseaction=addnid.IdSearch (accessed on 18 March 2022).
- Baker, E.T., Jr. Stratigraphic Nomenclature and Geologic Sections of the Gulf Coastal Plain of Texas; U.S. Geological Survey Open-File Report 94-461; U.S. Geological Survey: Austin, TX, USA, 1995; p. 34.
- Eargle, D.H. Nomenclature of Formations of Claiborne Group, Middle Eocene, Coastal Plain of Texas; U.S. Geological Survey Bulletin 1251-D; U.S. Geological Survey: Denver, CO, USA, 1968; p. 25.
- U.S. Geological Survey. The National Geologic Map Database. 2022. Available online: https://ngmdb.usgs.gov/ngmdb/ngmdb_home.html (accessed on 7 January 2022).
- Galloway, W.E.; Ganey-Curry, P.E.; Li, X.; Buffler, R.T. Cenozoic depositional history of the Gulf of Mexico basin. AAPG Bull. 2000, 84, 1743–1774. [Google Scholar]
- Young, S.C.; Knox, P.R.; Baker, E.; Budge, T.; Hamlin, S.; Galloway, B.; Kalbouss, R.; Deeds, N. Hydrostratigraphy of the Gulf Coast Aquifer from the Brazos River to the Rio Grande; Texas Water Development Board: Austin, TX, USA, 2010; p. 203.
- Young, S.C.; Ewing, T.; Hamlin, S.; Baker, E.; Lupton, D. Updating the Hydrogeologic Framework of the Northern Portion of the Gulf Coast Aquifer; Texas Water Development Board: Austin, TX, USA, 2012; p. 285.
- Young, S.C.; Draper, C. The Delineation of the Burkeville Confining Unit and the Base of the Chicot Aquifer to Support the Development of the Gulf 2023 Groundwater Model. 2020, p. 75. Available online: https://hgsubsidence.org/wp-content/uploads/2021/06/Final_HGSD_FBSD_Burkeville_Report_final.pdf (accessed on 28 December 2021).
- Teeple, A.; Becher, K.D.; Walton-Day, K.; Humberson, D.G.; Gallegos, T.J. A Composite Hydrogeologic Framework for the Goliad, Willis, Lissie, and Beaumont Formations Permissive for Undiscovered Uranium Deposits in the Texas Coastal Plain. Minerals 2022, 12, 420. [Google Scholar] [CrossRef]
- Nicot, J.-P.; Scanlon, B.R.; Yang, C.; Gates, J.B. Geological and Geographical Attributes of the South Texas Uranium Province; Prepared for the Texas Commission on Environmental Quality; Texas Bureau of Economic Geology: Austin, TX, USA, 2010; p. 157.
- Carothers, T.A. Technical Report for Uranium Energy Corp’s Goliad Project In-Situ Recovery Uranium Property, Goliad County, Texas; Clyde, O.H., Thomas, A.C., Eds.; Thomas A. Carothers: Clyde, OH, USA, 2008; p. 89. [Google Scholar]
- Weeks, A.D.; Eargle, D.H. Relation of Diagenetic Alteration and Soil-Forming Processes to the Uranium Deposits of the Southeast Texas Coastal Plain; MacMillan: New York, NY, USA, 1961; pp. 23–41. [Google Scholar]
- Dickinson, K.A. Uranium Potential of the Texas Coastal Plain; U.S. Geological Survey Open File Report 76-879; U.S. Geological Survey: Denver, CO, USA, 1976; p. 9.
- Galloway, W.E.; Finley, R.J.; Henry, C.D. South Texas Uranium Province—Geologic Perspective; Field Trip Guidebook 18; Bureau of Economic Geology: Austin, TX, USA, 1979; p. 81. [Google Scholar]
- Gates, J.B.; Nicot, J.P.; Scanlon, B.R.; Reedy, R.C. Arsenic enrichment in unconfined sections of the southern Gulf Coase aquifer system, Texas. Appl. Geochem. 2011, 26, 421–431. [Google Scholar] [CrossRef]
- Goldhaber, M.B.; Reynolds, R.O.; Rye, R.O. Origin of a South Texas roll-type uranium deposit II: Sulfide petrology and sulfur isotope studies. Econ. Geol. 1978, 73, 1690–1705. [Google Scholar] [CrossRef]
- Reynolds, R.L.; Goldhaber, M.B. Origin of a South Texas roll-type uranium deposit; I, Alteration of iron-titanium oxide minerals. Econ. Geol. 1978, 73, 1677–1689. [Google Scholar] [CrossRef]
- Bomber, B.J.; Ledger, E.B.; Tieh, T.T. Ore petrography of a sedimentary uranium deposits, Live Oak County, Texas. Econ. Geol. 1986, 81, 131–142. [Google Scholar] [CrossRef]
- Dahl, H.M.; Palmer, H.A.; Chandler, C.A. Mineralogy and petrology of Texaco’s Hobson uranium deposit, Karnes County, Texas (abs.). AAPG Bull. 1981, 65, 916. [Google Scholar]
- Dickinson, K.A.; Duval, J.S. Trend areas and exploration techniques: South-Texas uranium: Geologic controls, exploration techniques, and potential. In Geology of Alternate Energy Resources in the South-Central Unites States; Campbell, M.D., Ed.; Houston Geologic Society: Houston, TX, USA, 1977; pp. 45–66. [Google Scholar]
- Dahlkamp, F.J. Uranium Ore Deposits; Springer Science and Business Media: New York, NY, USA, 1993; p. 94. [Google Scholar]
- Harshman, E.N. Distribution of elements in some roll-type uranium deposits. In Formation of Uranium Ore Deposits; IAEA-SM-183/4; International Atomic Energy Agency: Vienna, Austria, 1974; pp. 169–183. [Google Scholar]
- Goldhaber, M.B.; Reynolds, R.L.; Rye, R.O. Role of fluid mixing and fault-related sulfide in the origin on the Ray Point uranium district, South Texas. Econ. Geol. 1983, 78, 1043–1063. [Google Scholar] [CrossRef]
- Adidas, E.O. Ground-Water Quality and Availability in and around Bruni, Webb County, Texas; Texas Water Development Board: Austin, TX, USA, 1991; p. 57.
- Davidson, D.F. Selenium in Some Oxidized Sandstone-Type Uranium Deposits; U.S. Geological Survey Bulletin 1162-C; U.S. Government Printing Office: Washington, DC, USA, 1963; p. 44.
- Galloway, W.E.; Henry, C.D.; Smith, G.E. Depositional Framework, Hydrostratigraphy, and Uranium Mineralization of the Oakville Sandstone (Miocene), Texas Coastal Plain; Report of Investigations 113; Bureau of Economic Geology: Austin, TX, USA, 1982; p. 51. [Google Scholar]
- Rawson, J. Reconnaissance of the Chemical Quality of Surface Waters of the Guadalupe River Basin, Texas; Texas Water Development Board: Austin, TX, USA, 1968; p. 37.
- Rawson, J. Reconnaissance of the Chemical Quality of Surface Waters of the San Antonio River Basin, Texas; Texas Water Development Board: Austin, TX, USA, 1969; p. 25.
- Kunze, H.L. Reconnaissance of the Chemical Quality of Surface Waters of the Nueces River Basin, Texas; Texas Water Development Board: Austin, TX, USA, 1971; p. 34.
- Galloway, W.E. Uranium mineralization in a coastal-plain fluvial aquifer system: Catahoula Formation, Texas. Econ. Geol. 1978, 73, 1655–1676. [Google Scholar] [CrossRef]
- Henry, C.D.; Kapadia, R.R. Trace Elements in Soils of the South Texas Uranium District: Concentrations, Origin, and Environmental Significance; Report of Investigations No. 101; Bureau of Economic Geology: Austin, TX, USA, 1980; p. 52. [Google Scholar]
- Runnells, D.D.; Shepherd, T.A.; Angino, E.E. Determining Natural Background Concentrations in Mineralized Areas. Environ. Sci. Technol. 1992, 26, 2316–2323. [Google Scholar] [CrossRef]
- Dickinson, K.A. Uranium and Thorium Distribution in Soils and Weathered Bedrock in South Texas; U.S. Geological Survey Open-File Report 77-764; US Geological Survey: Denver, CO, USA, 1977; p. 18.
- Smith, S.M. National Geochemical Database—Reformatted Data from the National Uranium Resource Evaluation (NURE) Hydrogeochemical and Stream Sediment Reconnaissance (HSSR) Program; U.S. Geological Survey Open-file Report; US Geological Survey: Denver, CO, USA, 2006.
- U.S. Geological Survey. Geochemistry of Sediments in the US from the NURE-HSSR Database. 2022. Available online: https://mrdata.usgs.gov/nure/sediment/ (accessed on 31 March 2022).
- Smith, D.B.; Solana, F.; Woodruff, L.G.; Cannon, W.F.; Ellefsen, K.J. Geochemical and Mineralogical Maps, with Interpretation, for Soils of the Conterminous United States; U.S. Geological Survey Scientific Investigations Report 2017-5118; U.S. Geological Survey: Denver, CO, USA, 2019.
- Smith, D.B.; Cannon, W.F.; Woodruff, L.G.; Solana, F.; Kilburn, J.E.; Fey, D.L. Geochemical and Mineralogic Data for Soils of the Conterminous United States; Data Series 801; U.S. Geological Survey: Denver, CO, USA, 2013; p. 19.
- Texas Commission on Environmental Quality. TRRP Protective Concentration Levels. 2021. Available online: https://www.tceq.texas.gov/remediation/trrp/trrppcls.html (accessed on 4 January 2022).
- Green, C.J.; Seal, R.R., II; Piatak, N.M. Bulk Solid Geochemical Data and Leachate Aqueous Geochemical Data from Mill Tailings and Other Ore Processing Materials; U.S. Geological Survey Data Release; U.S. Geological Survey: Reston, VA, USA, 2022.
- Morrison, S.J.; Cahn, L.S. Mineralogical residence of alpha-emitting contamination and implications for mobilization from uranium mill tailings. J. Contam. Hydrol. 1991, 8, 1–21. [Google Scholar] [CrossRef]
- Seal, R.R., II; Piatak, N.M. Environmental Attributes and Resource Potential of Mill Tailings from Diverse Mineral Deposit Types. In Proceedings of the 13th International Mine Water Association Congress, Mine Water and Circular Economy, Rauha, Finland, 25–30 June 2017; p. 7. [Google Scholar]
- Smith, K.S.; Huyck, H.L.O. An overview of the abundance, relative mobility, bioavailability, and human toxicity of metals. In The Environmental Geochemistry of Mineral Deposits; Processes, Techniques, and Health Issues; Plumlee, G.S., Logsdon, M.J., Eds.; Society of Economic Geologists: Littleton, CO, USA, 1999; Volume 6A, pp. 29–70. [Google Scholar]
- Rickwood, P.C. Crustal abundance, distribution, and crystal chemistry of the elements. In Handbook of Exploration Geochemistry Vol 3 Rock Geochemistry in Mineral Exploration; Govett, G.J.S., Ed.; Elsevier Scientific Publishing Company: Amsterdam, The Netherlands, 1983; pp. 347–387. [Google Scholar]
- Combs, S. The Energy Report; Texas Comptroller of Public Accounts: Austin, TX, USA, 2008; p. 443.
- Callaghan, R.M. 2014 Minerals Yearbook Texas; U.S. Geological Survey: Reston, VA, USA, 2019; p. 8.
- Eargle, D.H.; Weeks, A.M. Possible Relation between Hydrogen Sulfide-Bearing Hydrocarbons in Fault-Line Oil Fields and Uranium Deposits in the Southeast Texas Coastal Plain; U.S. Geological Survey Professional Paper 424-D; U.S. Geological Survey: Washington, DC, USA, 1961; pp. 7–9.
- Weeks, A.D.; Eargle, D.H. Uranium at Palangana Salt Dome, Duval County, Texas; U.S. Geological Survey Professional Paper 400-B; U.S. Geological Survey: Washington, DC, USA, 1960; pp. 48–52.
- Texas Railroad Commission. Texas Abandoned Mine Land Reclamation Projects; Railroad Commission of Texas, Surface Mining and Reclamation Division: 2002. Available online: https://rrc.texas.gov/media/nfebuevw/texasamlprojects.pdf (accessed on 28 December 2021).
- U.S. Department of Energy. Falls City, Texas, Disposal Site—An UMTRCA Title 1 Site. 2021; p. 3. Available online: https://www.energy.gov/sites/default/files/2021-08/FallsCityFactSheet.pdf (accessed on 28 December 2021).
- U.S. Nuclear Regulatory Commission. Exxon Mobil Corporation—Ray Point. 2021. Available online: https://www.nrc.gov/info-finder/decommissioning/uranium/exxon-mobil-highlands.html (accessed on 28 December 2021).
- U.S. Nuclear Regulatory Commission. Conoco-Phillips Company—Conquista Project. 2021. Available online: https://www.nrc.gov/info-finder/decommissioning/uranium/conoco-phillips-company (accessed on 28 December 2021).
- U.S. Nuclear Regulatory Commission. Rio Grande Resources Corporation—Panna Maria. 2021. Available online: https://www.nrc.gov/info-finder/decommissioning/uranium/rio-grande-resources-corp.html (accessed on 28 December 2021).
- Agreement State Program. 2021. Available online: https://www.nrc.gov/about-nrc/state-tribal/agreement-states.html (accessed on 28 December 2021).
- U.S. Nuclear Regulatory Commission. Backgrounder on Uranium Mill Tailings. 2021. Available online: https://www.nrc.gov/reading-rm/doc-collections/fact-sheets/mill-tailings.html (accessed on 2 January 2022).
- Texas Groundwater Protection Committee. Joint Groundwater Monitoring and Contamination Report—2014; SFR-056/14; Texas Groundwater Protection Committee: Austin, TX, USA, 2015; p. 271.
- Texas Commission on Environmental Quality. In-Situ Leach and Conventional Uranium-Recovery Methods. 2021. Available online: https://www.tceq.texas.gov/permitting/radmat/uranium/process.html (accessed on 29 December 2021).
- Pelizza, M.S. In-situ recovery of uranium. Southwest Hydrol. 2008, 7, 28–30. [Google Scholar]
- International Atomic Energy Association. In Situ Leach Uranium Mining: An Overview of Operations; IAEA Nuclear Energy Series No. NF-T-1.4; International Atomic Energy Association: Vienna, Austria, 2016. [Google Scholar]
- Sheridan, E.I.T.; Zornberg, J.G.; Gilbert, R.B. Evaluation of Settlements at the Conquista Tailings Impoundment; Report to Texas Commission on Environmental Quality; University of Texas at Austin: Austin, TX, USA, 2012; p. 63. [Google Scholar]
- Buma, G.; Johnson, P.H.; Bienek, G.K.; Watson, C.G.; Noyes, J.; Capuona, R. Analysis of Groundwater Criteria and Recent Restoration Attempts after In Situ Uranium Leaching; PB-82-246018; Resource Engineering and Development, Inc.: Midvale, UT, USA, 1981. [Google Scholar]
- Gallegos, T.J.; Scott, A.M.; Stengel, V.; Teeple, A.P. Water use, surface areas and aquifer volumes affected and radon releases during In-situ recovery of uranium from sandstone hosted uranium deposits in the south Texas Coastal Plain, USA. Minerals 2022, 12, 369. [Google Scholar] [CrossRef]
- Way, T. Well-Field Mechanics for In-Situ Mining; White Paper; In-Situ, Inc.: Fort Collins, CO, USA, 2013; p. 3. Available online: https://www.infinitpipe.com/PDF/Well-Field%20Mechanics.pdf (accessed on 4 January 2022).
- World Nuclear Association. In Situ Leach Mining of Uranium. 2020. Available online: https://world-nuclear.org/information-library/nuclear-fuel-cycle/mining-of-uranium/in-situ-leach-mining-of-uranium.aspx (accessed on 4 January 2022).
- Uranium Energy Corp. (UEC). In situ recovery (ISR) technology. UEC Uranium Energy Corp. 2022. Available online: https://www.uraniumenergy.com/projects/isr/https://www.uraniumenergy.com/projects/isr/ (accessed on 1 June 2022).
- Mackin, P.C.; Daruwalla, D.; Winterle, J.; Smith, M.; Pickett, D.A. A Baseline Risk-Informed, Performance-Based Approach for In Situ Leach Uranium Extraction Leases; Nuclear Regulatory Commission NUREG/CR-6733; Nuclear Regulatory Commission, Office of Nuclear Material Safety and Safeguards: Washington, DC, USA, 2001; p. 197.
- Texas Railroad Commission. Regulations and Statutes: Coal/Lignite, Uranium, Iron Ore; Texas Railroad Commission: Austin, TX, USA, 2021.
- Justia. 2019 Texas Statutes Natural Resources Code Title 4—Mines and mining Chapter 131—Uranium Surface Mining and Reclamation Act. Web page. 2021. Available online: https://law.justia.com/codes/texas/2019/natural-resources-code/title-4/chapter-131/ (accessed on 7 April 2022).
- Texas Commission on Environmental Quality. Source Material Recovery and By-Product Material Disposal; Texas Commission on Environmental Quality: Austin, TX, USA, 2021.
- Cheung, W. Aquifer Exemptions at Uranium ISR Sites; U.S. Environmental Protection Agency: Denver, CO, USA, 2014. Available online: http://nma.org/pdf/2014urw/Wendy%20Cheung%20NMA%20Workshop.pdf (accessed on 27 December 2021).
- Borch, T.; Roche, N.; Johnson, T.E. Determination of contaminant levels and remediation efficacy in groundwater at a former in situ recovery uranium mine. J. Environ. Monit. 2012, 14, 1814–1823. [Google Scholar] [CrossRef]
- U.S. Environmental Protection Agency. Aquifer Restoration after Uranium Recovery; Technical Brief. EPA/600/F-17/342; U.S. Environmental Protection Agency: Washington, DC, USA, 2017; p. 2. Available online: https://www.epa.gov/sites/default/files/2017-11/documents/aquifer_restoration_after_uranium_recovery_epa-600f-17-342.pdf (accessed on 2 January 2022).
- U.S. Environmental Protection Agency. 40 CFR Part 192: Proposed Rulemaking and Background Documents. 2019. Available online: https://www.epa.gov/radiation/40-cfr-part-192-proposed-rulemaking-and-background-documents (accessed on 8 January 2022).
- Texas Water Development Board. Groundwater; Texas Water Development Board: Austin, TX, USA, 2021. Available online: https://www.twdb.texas.gov/groundwater/ (accessed on 28 December 2021).
- Chowdhury, A.H.; Turco, M.J. Geology of the Gulf Coast Aquifer; Texas Water Development Board Report 365 Chapter 2; Texas Water Development Board: Austin, TX, USA, 2010; pp. 23–50.
- Ashworth, J.B.; Hopkins, J. Aquifers of Texas; Texas Water Development Board Report 345; Texas Water Development Board: Austin, TX, USA, 1995. Available online: https://www.twdb.texas.gov/publications/reports/numbered_reports/doc/R345/R345Complete.pdf (accessed on 28 December 2021).
- Deeds, N.E.; Yan, T.; Singh, A.; Jones, T.L.; Kelley, V.A.; Know, P.R.; Young, S.C. Final Report Groundwater Availability Model for the Yegua-Jackson Aquifer; Texas Water Development Board: Austin, TX, USA, 2010; p. 582. Available online: http://www.twdb.texas.gov/groundwater/models/gam/ygjk/ygjk_model_report.pdf (accessed on 28 December 2021).
- Texas Water Development Board. Carizo-Wilcox Aquifer. 2022. Available online: https://www.twdb.texas.gov/groundwater/aquifer/majors/carrizo-wilcox.asp (accessed on 10 March 2022).
- U.S. Geological Survey. Geochemistry of Water Samples in the U.S. from the NURE-HSSR Database. 2022. Available online: https://mrdata.usgs.gov/nure/water/ (accessed on 31 March 2022).
- Texas Water Development Board. Groundwater Database Reports. 2021. Available online: https://www.twdb.texas.gov/groundwater/data/gwdbrpt.asp (accessed on 10 March 2022).
- United States Environmental Protection Agency. National Primary Drinking Water Regulations; United States Environmental Protection Agency: Washington, DC, USA, 2021. Available online: https://www.epa.gov/ground-water-and-drinking-water/national-primary-drinking-water-regulations#Inorganic (accessed on 8 January 2022).
- Hall, S.M.; Hennesy, T.B. Historic Groundwater Quality of In Situ Recovery ISR Uranium Mines, Texas; U.S. Geological Survey data release; U.S. Geological Survey: Denver, CO, USA, 2014.
- U.S. Environmental Protection Agency. Method 1312 Synthetic Precipitation Leaching Procedure; Part of Test Methods for Evaluating Solid Wastes, Physical/Chemical Methods; U.S. Environmental Protection Agency: Washington, DC, USA, 1994.
- Scanlon, B.R.; Nicot, J.P.; Reedy, R.C.; Tachovsky, J.A.; Nance, S.H.; Smyth, R.C.; Keese, K. Evaluation of Arsenic Contamination in Texas; Prepared for the Texas Commission on Environmental Quality under Umbrella Contract No. 582-4-56385; Texas Bureau of Economic Geology: Austin, TX, USA, 2005; p. 167. [Google Scholar]
- Reedy, R.C.; Scanlon, B.R.; Walden, S.; Strassberg, G. Naturally Occurring Groundwater Contamination in Texas; University Texas at Austin, Bureau of Economic Geology: Austin, TX, USA, 2011; p. 203. [Google Scholar]
- Hall, S. Groundwater Restoration at Uranium In-Situ Recovery Mines, South Texas Coastal Plain; U.S. Geological Survey Open-File Report 2009-1143; U.S. Geological Survey: Denver, CO, USA, 2009; p. 32.
- Anthony, H.L.; Holmes, C.W. Groundwater Restoration at In Situ Uranium Recovery Operations (ISR) in Texas: A Regulatory Perspective on Its Success. 2014. Available online: http://www.hanthony.com/aes/Library/GW%20Restoration%20at%20ISR%20Sites.pdf (accessed on 30 December 2021).
- Texas Water Development Board. Texas Water Conditions & Data. 2022. Available online: https://www.twdb.texas.gov/surfacewater/conditions/index.asp (accessed on 8 January 2022).
- Brandenberger, J.; Louchouarn, P.; Herbert, B.; Tissot, P. Geochemical and hydrodynamic controls on arsenic and trace metal cycling in a seasonally stratified US sub-tropical reservoir. Appl. Geochem. 2004, 19, 1601–1623. [Google Scholar] [CrossRef]
- Watson, K.M.; Harwell, G.R.; Wallace, D.S.; Welborn, T.L.; Stengel, V.G.; McDowell, J.S. Characterization of Pearl Streamflows and Flood Inundation of Selebetd Areas in Southeastern Texas and Southwestern Louisiana from the August and September 2017 Flood Resulting from Hurricane Harvey; U.S. Geological Survey Scientific Investigations Report 2018-5070; U.S. Geological Survey: Reston, VA, USA, 2018.
- Watson, K.M.; Welborn, T.L.; Stengel, V.G.; Wallace, D.S.; McDowell, J.S. Data Used to Characterized Peak Streamflows and Flood Inundation Resulting from Hurricane Harvey of Selected Areas in Sougheastern Texas and Southwestern Louisiana, August–September 2017; U.S. Geological Survey Data Release; U.S. Geological Survey: Reston, VA, USA, 2018. [CrossRef]
- Smith, C.M.; Tissot, P.E.; Beaman, M.; Parker, R.L.; Brandenberger, J.M.; Williams, M.; Louchouarn, P. Historical Environmental Impact of Uranium Mining through the Gamma Ray Analysis of Livestock Pond Sediments (abs); Geological Society of America: Denver, CO, USA, 2002.
- U.S. Department of Energy. Baseline Risk Assessment of Ground Water Contamination at the Uranium Mill Tailings Site Near Falls City, Texas; DOE/A;/62350-64; U.S. Department of Energy: Washington, DC, USA, 1994; p. 162. Available online: https://digital.library.unt.edu/ark:/67531/metadc1275379/ (accessed on 29 December 2021).
- U.S. Department of Energy. Environmental Assessment of Ground-Water Compliance at the Falls City, Texas Uranium Mill Tailings Site; DOE/EA-1227; U.S. Department of Energy: Grand Junction, CO, USA, 1998; p. 25.
- Au, W.W.; Lane, R.G.; Legator, M.S.; Whorton, E.B.; Wilkinson, G.S.; Gabehart, G.J. Biomarker Monitoring of a Population Residing Near Uranium Mining Activities. Environ. Health Perspect. 1995, 103, 466–470. [Google Scholar] [CrossRef]
- Boice, J.D.; Mumma, M.; Schweitzer, S.; Blot, W.J. Cancer mortality in a Texas county with prior uranium mining and milling activities, 1950–2001. J. Radiol. Prot. 2003, 23, 247. [Google Scholar] [CrossRef] [PubMed]
- U.S. Department of Energy. Final Environmental Assessment of Remedial Action at the Falls City Uranium Mill Tailings Site, Falls City, Texas; DOE/EA-0468; U.S. Department of Energy: Albuquerque, NM, USA, 1991.
- U.S. Environmental Protection Agency. Guidelines for Ground-Water Classification Under the EPA Ground-Water Protection Strategy; U.S. Environmental Protection Agency: Washington, DC, USA, 1988; p. 274. Available online: https://nepis.epa.gov/Exe/ZyNET.exe/9100L950.txt?ZyActionD=ZyDocument&Client=EPA&Index=1986%20Thru%201990&Docs=&Query=%28Class%20I%29%20OR%20FNAME%3D%229100L950.txt%22%20AND%20FNAME%3D%229100L950.txt%22&Time=&EndTime=&SearchMethod=1&TocRestrict=n&Toc=&Toc (accessed on 18 May 2022).
- Department of Energy, Energy Info. Administration. Decommissioning of U.S. Uranium Production Facilities; DOE/EIA-0592; Department of Energy: Washington, DC, USA, 1995.
- Texas Railroad Commission. Abandoned Mine Land. 2021. Available online: https://www.rrc.texas.gov/surface-mining/programs/abandoned-mine-land-program/ (accessed on 20 December 2021).
- Texas Railroad Commission. Abandoned Mine Land Reclamation Projects Gallery. 2021. Available online: https://rrc.texas.gov/surface-mining/programs/abandoned-mine-land-program/abandoned-mine-land-reclamation-projects-gallery/ (accessed on 28 December 2021).
- National Institutes of Health, National Cancer Institute. Radon and Cancer. 2011. Available online: https://www.cancer.gov/about-cancer/causes-prevention/risk/substances/radon/radon-fact-sheet (accessed on 31 December 2021).
- Sethi, T.K.; El-Ghamry, M.N.; Kloecker, G.H. Radon and lung Cancer. JNCI J. Natl. Cancer Inst. 1989, 81, 745–758. [Google Scholar]
- Uranium Producers of America. In Situ Recovery Uranium In Situ Recovery Technology. 2014. Available online: http://www.theupa.org/uranium_technology/in_situ_recovery/ (accessed on 21 December 2021).
- Brown, S.H. Occupational radiation protection aspects of alkaline leach uranium in situ recovery (ISR) facilities in the United States. Health Phys. 2019, 117, 106–113. [Google Scholar] [CrossRef] [PubMed]
- Brown, S.; Chambers, D. Radon emissions from tailings and evaporation ponds. In Proceedings of the Nuclear Regulatory Commission, Uranium Recovery Licensing Workshop, Denver, CO, USA, 11–12 January 2011; Available online: https://www.nrc.gov/materials/uranium-recovery/public-meetings/ur-workshops/sbrown-dchambers-senes.pdf (accessed on 21 December 2021).
- Landa, E. Isolation of Uranium Mill Tailings and Their Component Radionuclides from the Biosphere—Some Earth Science Perspectives; Geological Survey Circular 814; U.S. Geological Survey: Arlington, VA, USA, 1980; p. 32.
- Cohen, S. Ground Water Modeling Studies at In Situ Leaching Facilities and Evaluation of Doses and Risks to Off-Site Receptors from Contaminated Ground Water Revision 2; EPA-402-D-14-002; Office of Radiation and Indoor Air, Radiation Protection Division; U.S. Environmental Protection Agency: Washington, DC, USA, 2012; p. 185.
- Institute for Energy and Environmental Research. Uranium: Its Uses and Hazards. 2022. Available online: https://ieer.org/resource/factsheets/uranium-its-uses-and-hazards/ (accessed on 1 January 2022).
- Australian Government. Guide to Safe Transport of Uranium Oxide Concentrate; Department of Resources, Energy and Tourism: Canberra, Australia, 2012.
- Brown, S.H.; Chambers, D.B. Worker protection implications of the solubility and human metabolism of modern uranium mill products in the U.S. Health Phys. 2014, 107, 403–409. [Google Scholar] [CrossRef] [Green Version]
- U.S. Nuclear Regulatory Commission. Exothermic Reactions Involving Dried Uranium Oxide Powder (Yellowcake); NRC Information Notice 1999-03, Rev. 1; Nuclear Regulatory Commission Office of Federal and State Materials and Environmental Management Programs: Washington, DC, USA, 2014; p. 18.
- Staub, W.P.; Hinkle, N.E.; Williams, R.E.; Anastasi, F.; Osiensky, J.; Rogness, D. An Analysis of Excursions at Selected In Situ Uranium Mines in Wyoming and Texas; NUREG/CR-3967 and ORNL/TM-9956; U.S. Nuclear Regulatory Commission: Washington, DC, USA, 1986; p. 298.
- Rice, G. Effects of URI’s Kingsville Dome Mine on Groundwater Quality, Final Report; Prepared for the Kleburg County URI Citizen Review Board; Kleberg County URI Citizen Review Board: Kingsville, TX, USA, 2006; p. 134.
- Texas Administrative Code. Rule §331.104 Establishment of Baseline and Control Parameters for Excursion Detection. 2009. Title 30 Part 1 Chapter 331 Subchapter F. Available online: https://texreg.sos.state.tx.us/public/readtac$ext.TacPage?sl=R&app=9&p_dir=&p_rloc=&p_tloc=&p_ploc=&pg=1&p_tac=&ti=30&pt=1&ch=331&rl=104 (accessed on 14 June 2022).
- Texas Administrative Code. Rule §331.107 Restoration. 2018. Title 30 Part 1 Chapter 331 Subchapter F. Available online: https://texreg.sos.state.tx.us/public/readtac$ext.TacPage?sl=R&app=9&p_dir=&p_rloc=&p_tloc=&p_ploc=&pg=1&p_tac=&ti=30&pt=1&ch=331&rl=107 (accessed on 14 June 2022).
- Darling, B.K. Report on Findings Related to the Restoration of Groundwater at In-Situ Uranium Mines in South Texas; Southwest Groundwater Consulting, LLC: Houston, TX, USA, 2008; Available online: http://www.powertechexposed.com/BK_Darling%20Report_Complete_Sept_30.pdf (accessed on 9 June 2022).
- Ginder-Vogel, M.; Criddle, C.S.; Fendorf, C. Thermodynamic constraints on the oxidation of biogenic UO2 by Fr(III) (hydr)oxides. Environ. Sci. Technol. 2006, 40, 3544–3550. [Google Scholar] [CrossRef]
- Enchemica LLC. Geochemical Evaluation and Groundwater Transport Model for the Smith Ranch—Highland Uranium Project Mine Unit 1. 2018. Available online: https://www.nrc.gov/docs/ML1818/ML18186A337.pdf (accessed on 2 June 2022).
- Morrison, J.M.; Campbell, K.M.; Fuller, C.C.; Gallegos, T.J.; Walton-Day, K. Processes controlling the natual attenuating capacity of an aquifer downgradient from a uranium roll-front deposit, Wyoming, USA [abs.]. In Proceedings of the Geological Society of America Annual Meeting, Indianapolis, IN, USA, 4–7 November 2018; Available online: https://gsa.confex.com/gsa/2018AM/meetingapp.cgi/Paper/323075 (accessed on 3 June 2022).
- Reimus, P.; Clay, J.; Jemison, N. Restoration insights gained from a field deployment of dithionite and acetate at a uranium in situ recovery mine. Minerals 2022, 12, 711. [Google Scholar] [CrossRef]
- Davis, J.A.; Curtis, G.P. Consideration of Geochemical Issues in Groundwater Restoration at Uranium In-Situ Leach Mining Facilities; NUREG/CR-6870; U.S. Nuclear Regulatory Commission: Washington, DC, USA, 2007.
- Parkhurst, D.L.; Apello, C.A.J. Description of Input and Examples for PHREEQC Version3—A Computer Program for Speciation, Batch-Reaction, One-Dimensional Transport, and Inverse Geochemical Calculations; U.S. Geological Survey Techniques and Methods, Book 6, Chap A43; U.S. Geological Survey: Denver, CO, USA, 2013; p. 497.
- Yabusaki, S.B.; Fang, Y.; Long, P.E.; Resch, C.T.; Peacock, A.D.; Komlos, J.; Jaffe, P.R.; Morrison, S.J.; Dayvault, R.D.; White, D.C.; et al. Uranium removal from groundwater via in situ biostimulation: Field-scale modeling of transport and biological processes. J. Contam. Hydrol. 2007, 93, 216–235. [Google Scholar] [CrossRef]
- Lagneau, V.; Regnault, O.; Descostes, M. Industrial deployment of reactive transport simulation: An application to uranium in situ recovery. Rev. Mineral. Geochem. 2019, 85, 499–528. [Google Scholar] [CrossRef] [Green Version]
- Collet, A.; Regnault, O.; Ozhogin, A.; Imantayeva, A.; Garnier, L. Three-dimensional reactive transport simulation of Uranium in situ recovery: Large-scale well field applications in the Shu Saryssu Basin, Tortkuduk deposit, (Kazakhstan). Hydrometallurgy 2022, 211, 105873. [Google Scholar] [CrossRef]
- Sun, Z.; Ma, W.; Liu, Y.; Liu, J.; Zhou, Y. 150 Research Progress on groundwater contamination and remediation in in situ leaching uranium mines. Earth Sci. Front. 2021, 28, 215. [Google Scholar]
- ESRI. ArcGIS 10.4.1; ESRI: Redlands, CA, USA, 2015. [Google Scholar]
Figure 1.
Location map showing the South Texas uranium region; uranium deposits and other types (prospects, showings, and anomalies) of occurrences with host geologic units at those locations; the Houston and Rio Grande embayments; the San Marcos arch; three permissive tracts of the U.S. Geological Survey’s recent assessment of undiscovered uranium resources in South Texas [13]; and location of Figure 3 inset. Modified from [16]. Geology from [19].

Figure 2.
Cross section of generic roll front-type uranium deposit showing redox zoning, and changes in mineralogy and ground-water components along groundwater flow path direction, modified from [22].
Figure 2.
Cross section of generic roll front-type uranium deposit showing redox zoning, and changes in mineralogy and ground-water components along groundwater flow path direction, modified from [22].

Figure 3.
Locations of uranium deposits, licensed uranium facilities, former uranium mills, abandoned uranium mines, and wildlife refuges mentioned in this report.
Figure 3.
Locations of uranium deposits, licensed uranium facilities, former uranium mills, abandoned uranium mines, and wildlife refuges mentioned in this report.

Figure 4.
Stratigraphic section showing Tertiary and Quaternary geologic units along the Texas Gulf Coast, formations that host uranium deposits and occurrences, known uranium resources, permissive tracts, and hydrogeologic units (aquifers and confining units). Modified from [16]. Stratigraphy from [25,26]. Geologic names conform to the USGS National Geologic Map Database [27]. Epoch boundary ages from [28]. Permissive tract extents from [13,16]. Hydrogeologic units from [29,30,31].

Figure 5.
Arsenic, molybdenum, selenium, uranium, and vanadium concentrations in stream sediments from NURE [57,58]; USGS soils from [59,60] (Top 5 centimeter (cm), A horizon, C horizon); from sandstone-hosted uranium deposit tailings from mills in Utah and Colorado [62,63]; and from other types of uranium deposit tailings including unconformity uranium deposits; intrusive (pegmatitic) deposits; quartz-pebble conglomerate deposits; and metasomatic deposits from [62,64]. Stream sediment and soil data are grouped into permissive tracts 1, 2, and 3. The Texas Risk Reduction Program total soil combined pathway for residential 0.5-acre source area noncarcinogenic human-health protective concentration levels (TRRP PCL) [61] are shown. In addition, the median concentrations reported in 0–5 cm depth for soils in the United States ([Conterminous United States] CONUS median soil 0–5 cm) [59] and crustal averages from [65] are shown for comparison.

Figure 6.
Cross section of basic components of in situ recovery (ISR) uranium mining operation. Modified from [82].
Figure 6.
Cross section of basic components of in situ recovery (ISR) uranium mining operation. Modified from [82].

Figure 7.
Arsenic, molybdenum, radium226, selenium, uranium, and vanadium concentrations in groundwater from the NURE [57,101] data (NURE groundwater) and Texas Water Development Board (TWDB) data [102]. Data are separated by permissive tracts 1, 2, and 3. The EPA maximum contaminant level (MCL) is shown where available for particular elements [103]. Baseline data are from Hall [104]. Leachate data [62] were produced for some of the tailings samples shown in Figure 5, using EPA Method 1312 [105].

Figure 8.
Conceptual source-to-receptor model for in situ uranium recovery (ISR) of undiscovered uranium resources in the Texas Coastal Plain. Modified from [12].
Figure 8.
Conceptual source-to-receptor model for in situ uranium recovery (ISR) of undiscovered uranium resources in the Texas Coastal Plain. Modified from [12].

Figure 9.
Schematic of in-situ-recovery mine showing production area, mine area, and monitoring wells (gray dots) 122 m (about 400 ft) from production area. Modified from [109].
Figure 9.
Schematic of in-situ-recovery mine showing production area, mine area, and monitoring wells (gray dots) 122 m (about 400 ft) from production area. Modified from [109].

Figure 10.
Graphs showing baseline As, Mo, U, and Se in milligrams per liter (mg/L), and 226Ra concentrations in becquerels per liter (Bq/L) versus post-restoration concentrations. One to one lines and EPA maximum contaminant levels (MCLs) are shown [103]. Data from [104].


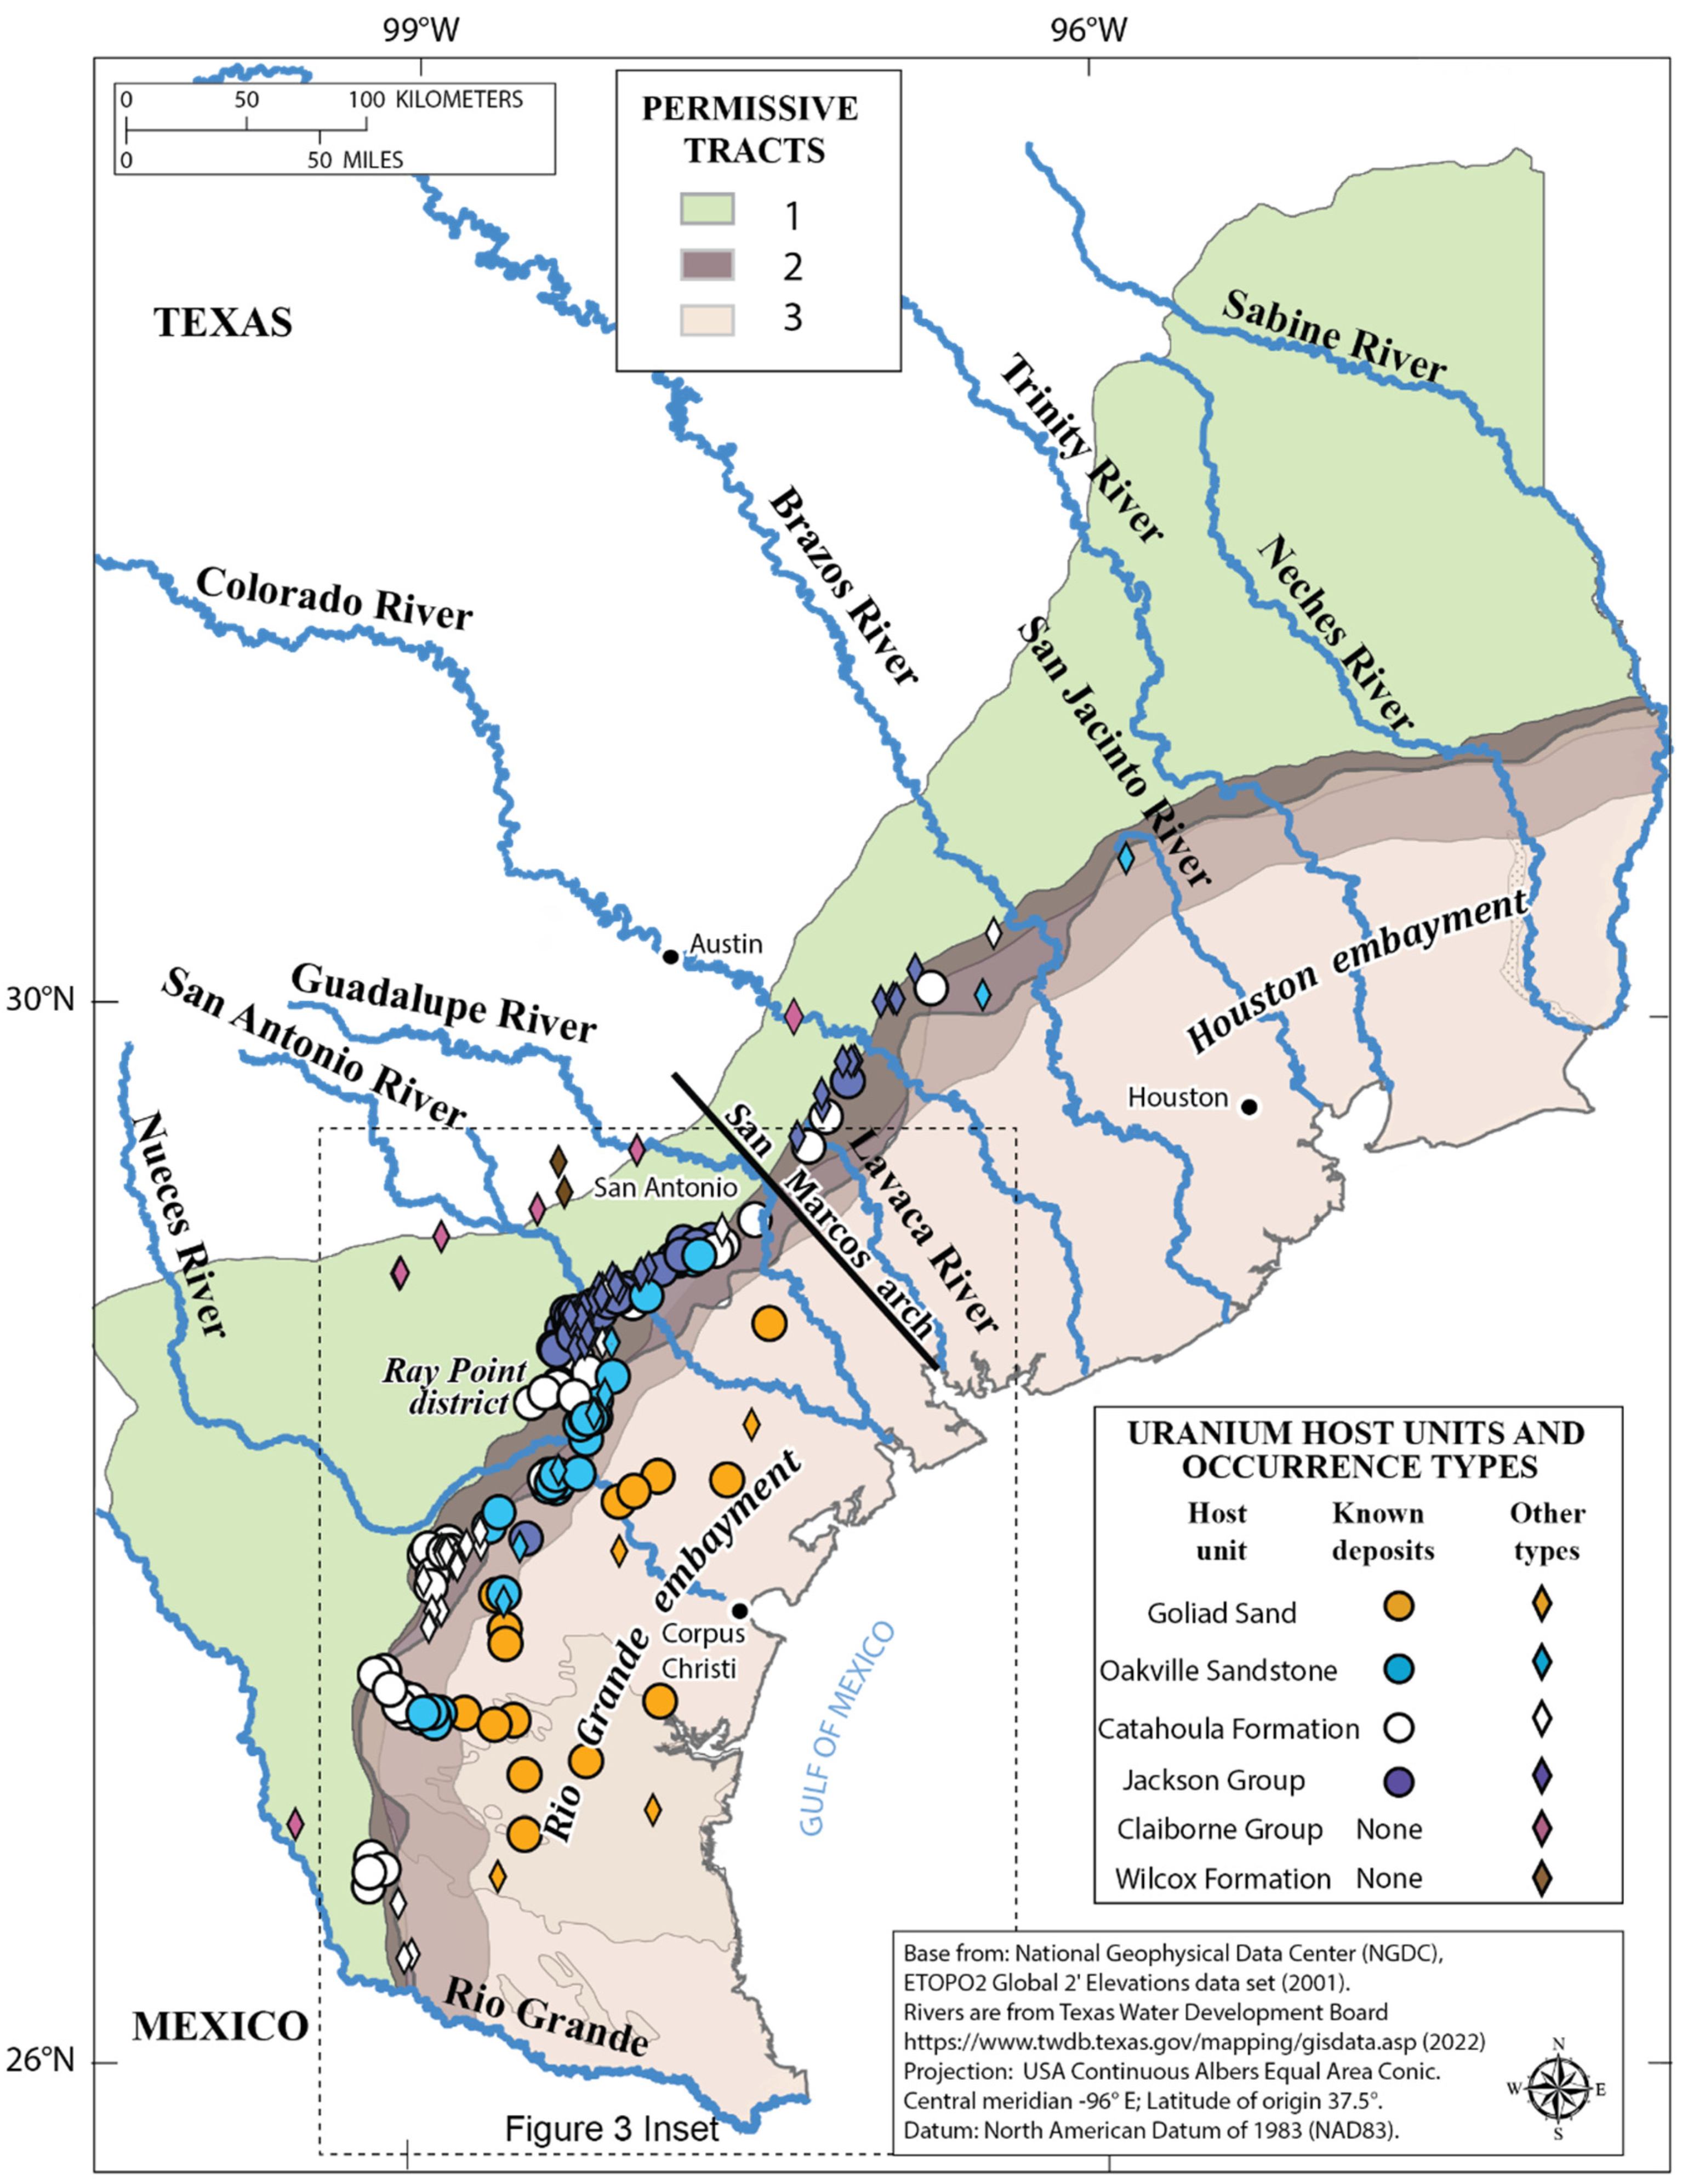
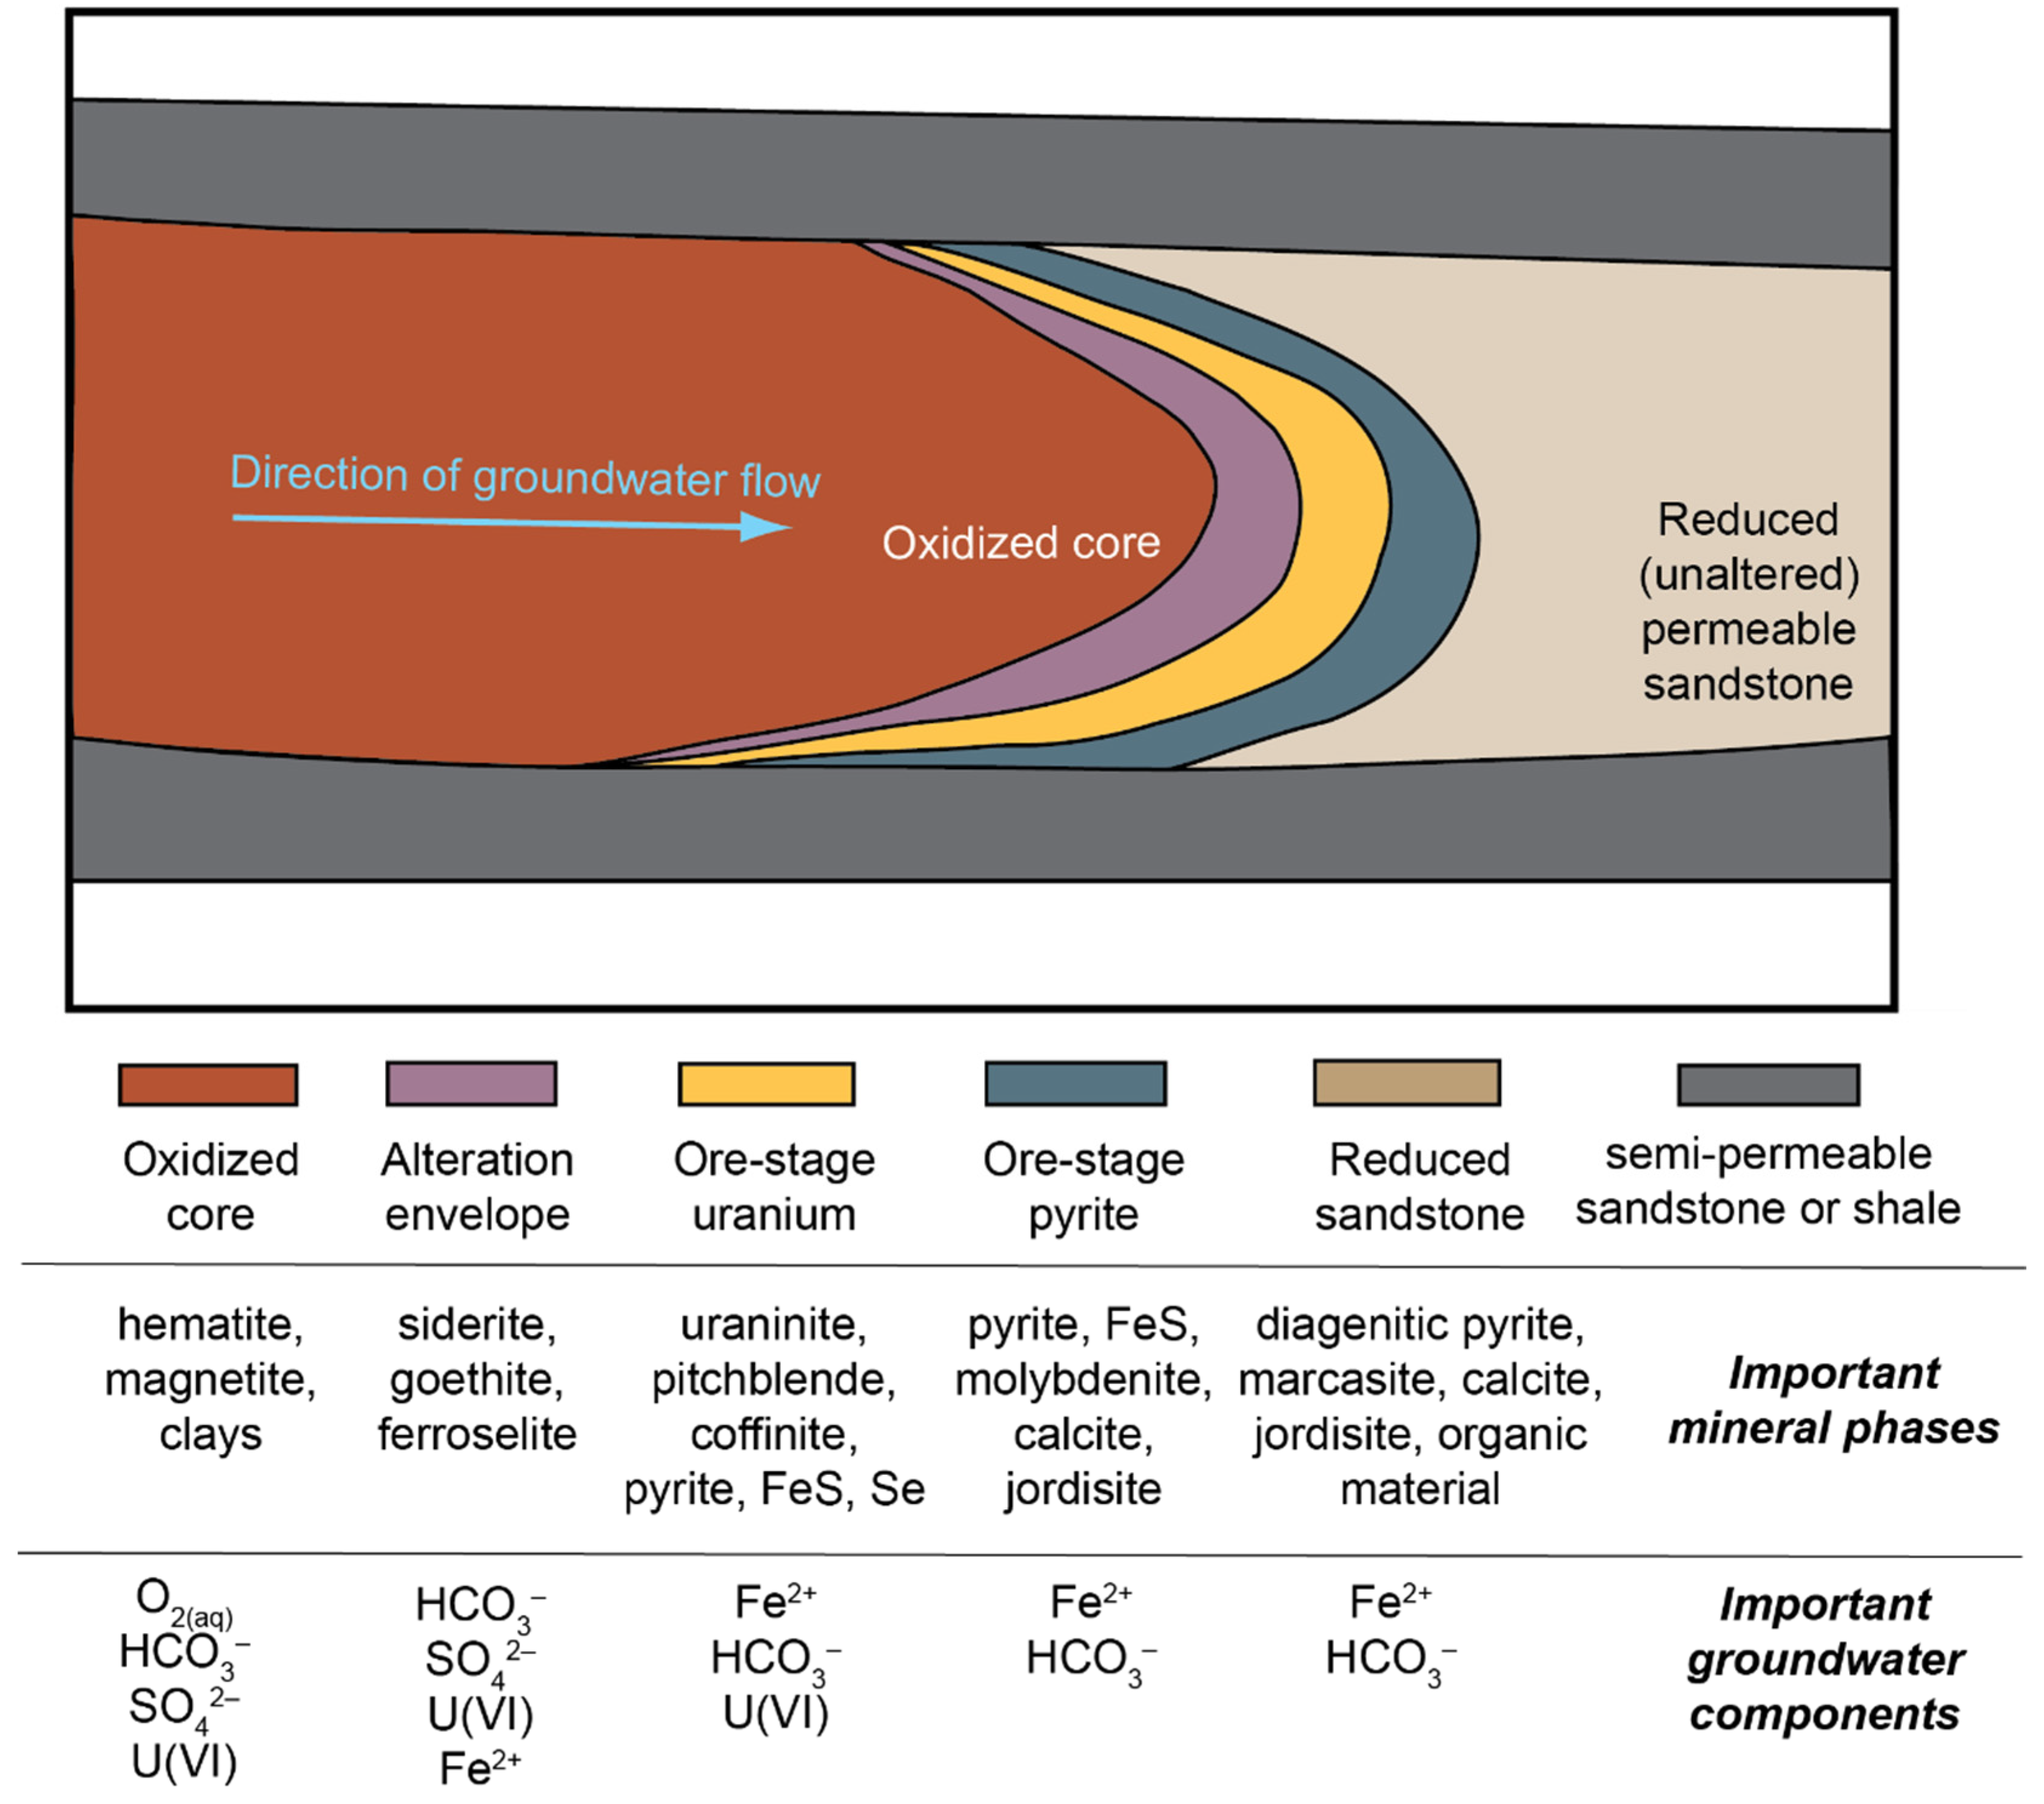
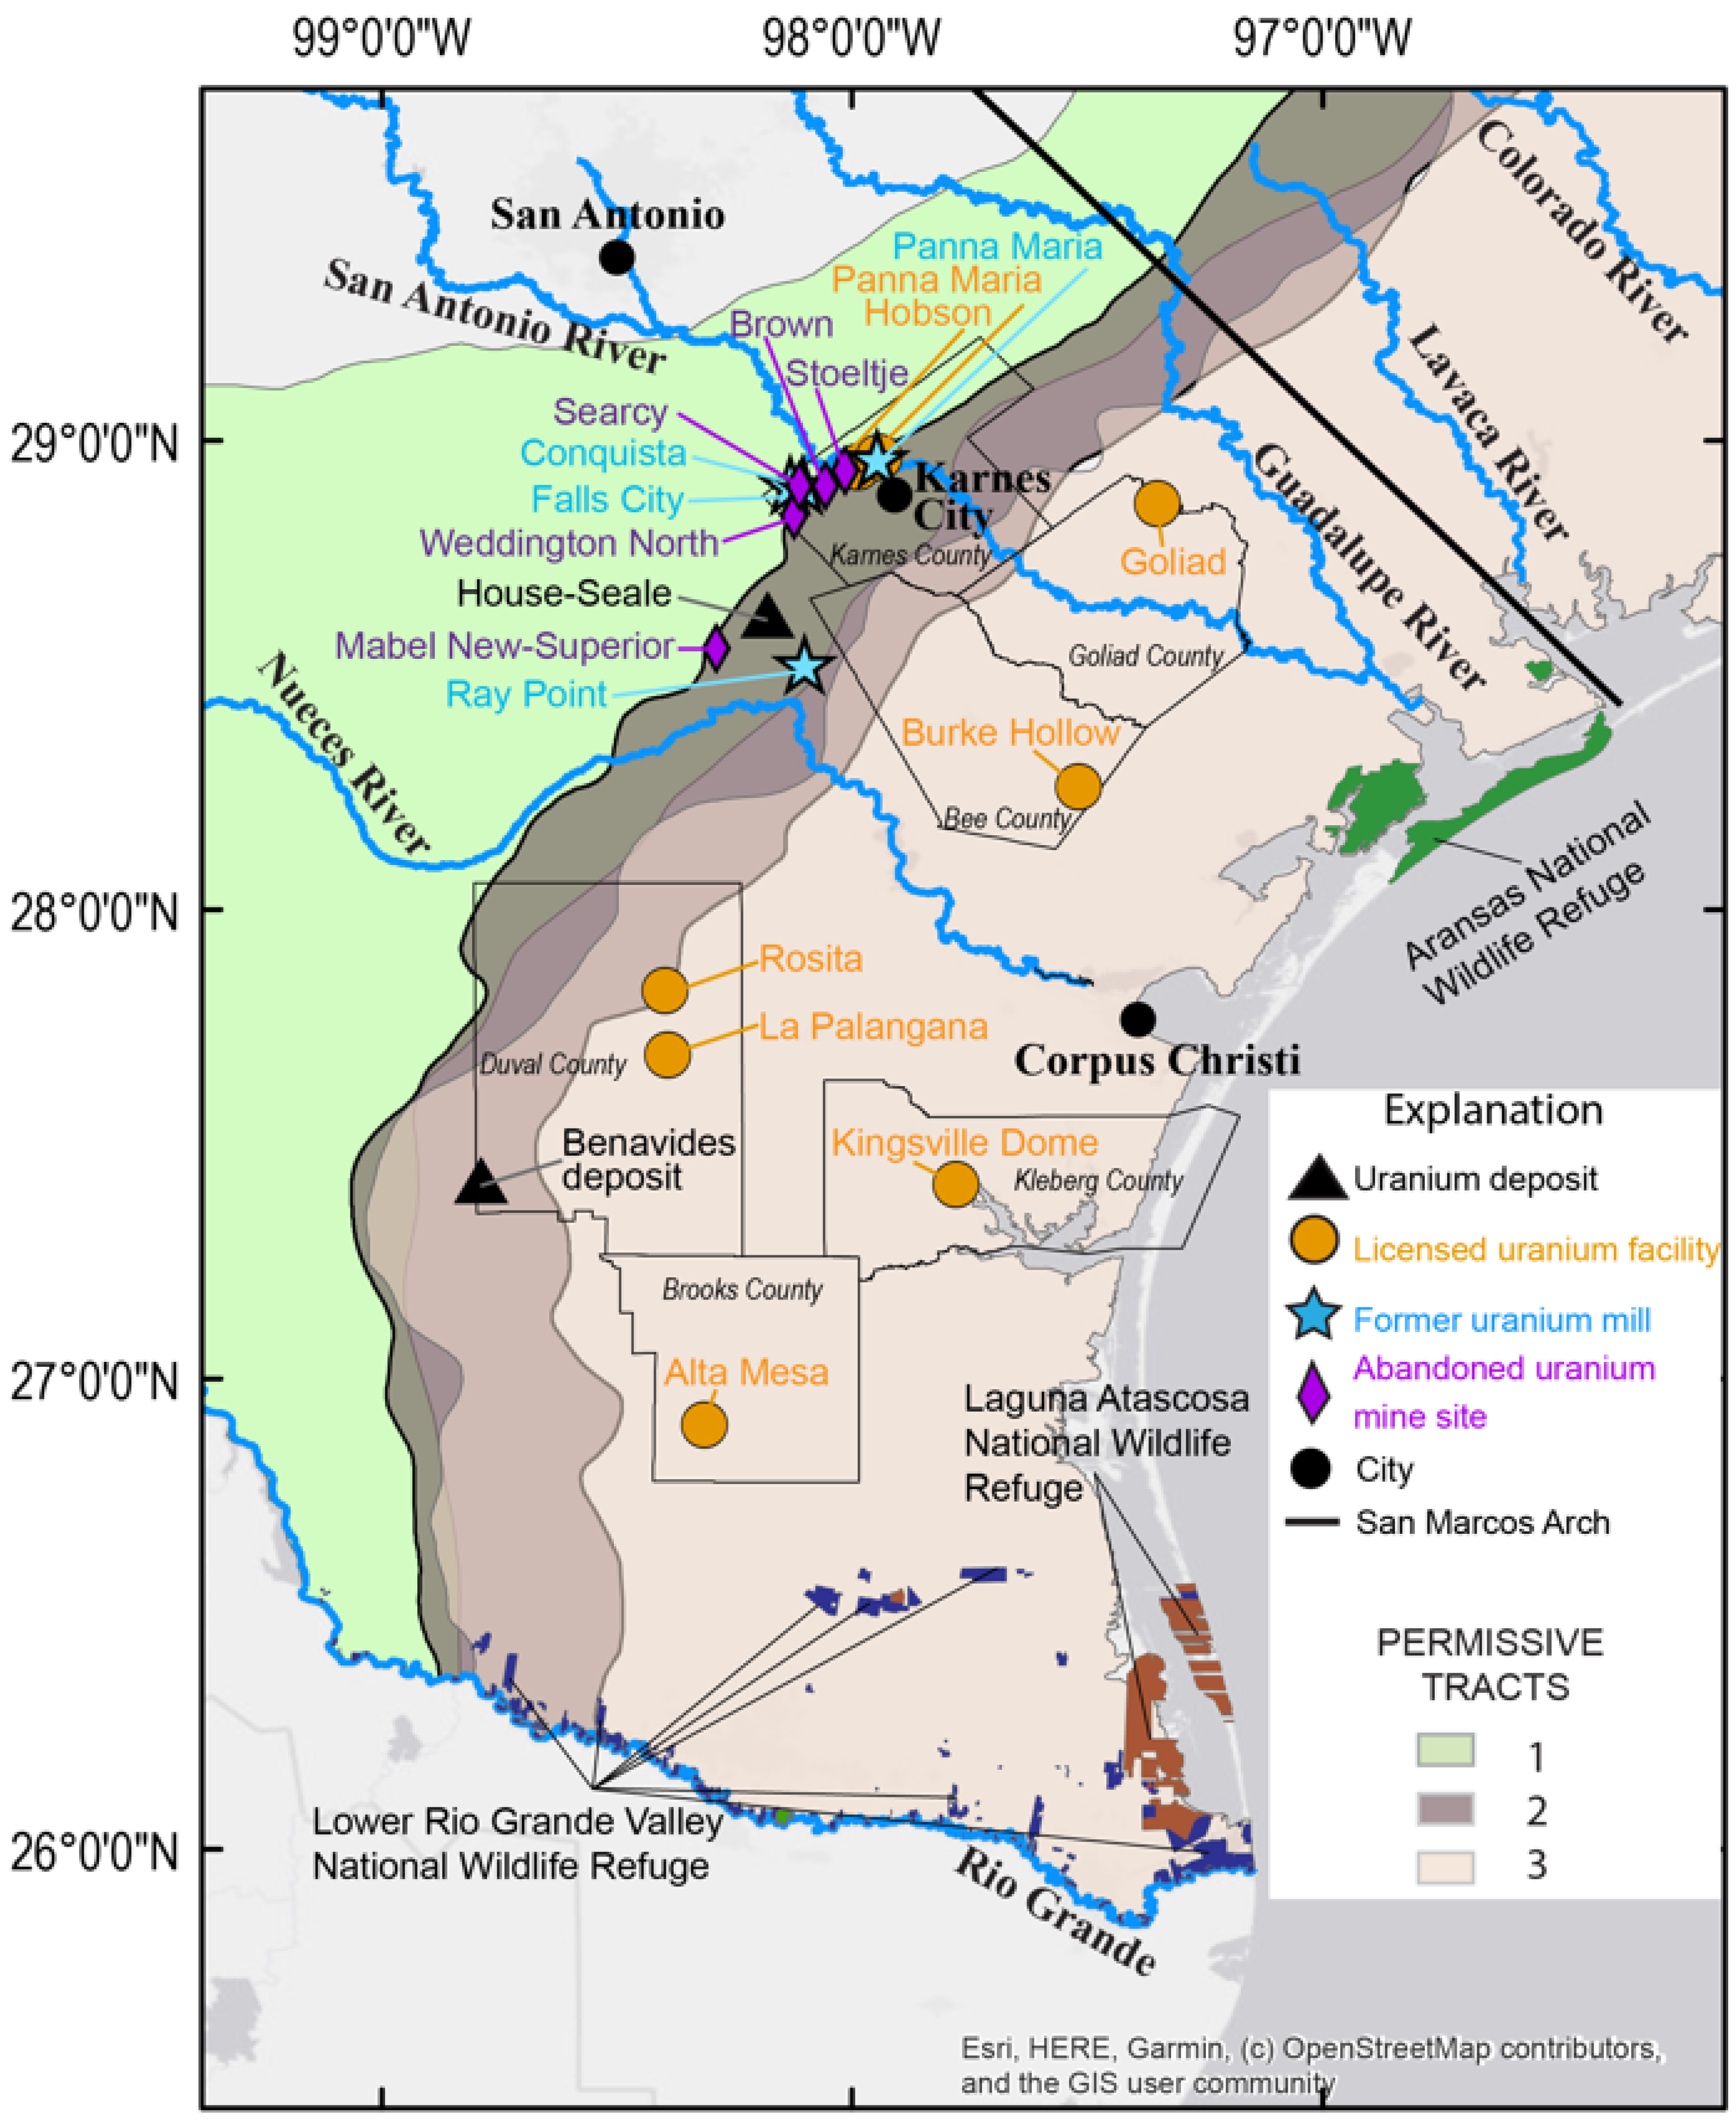
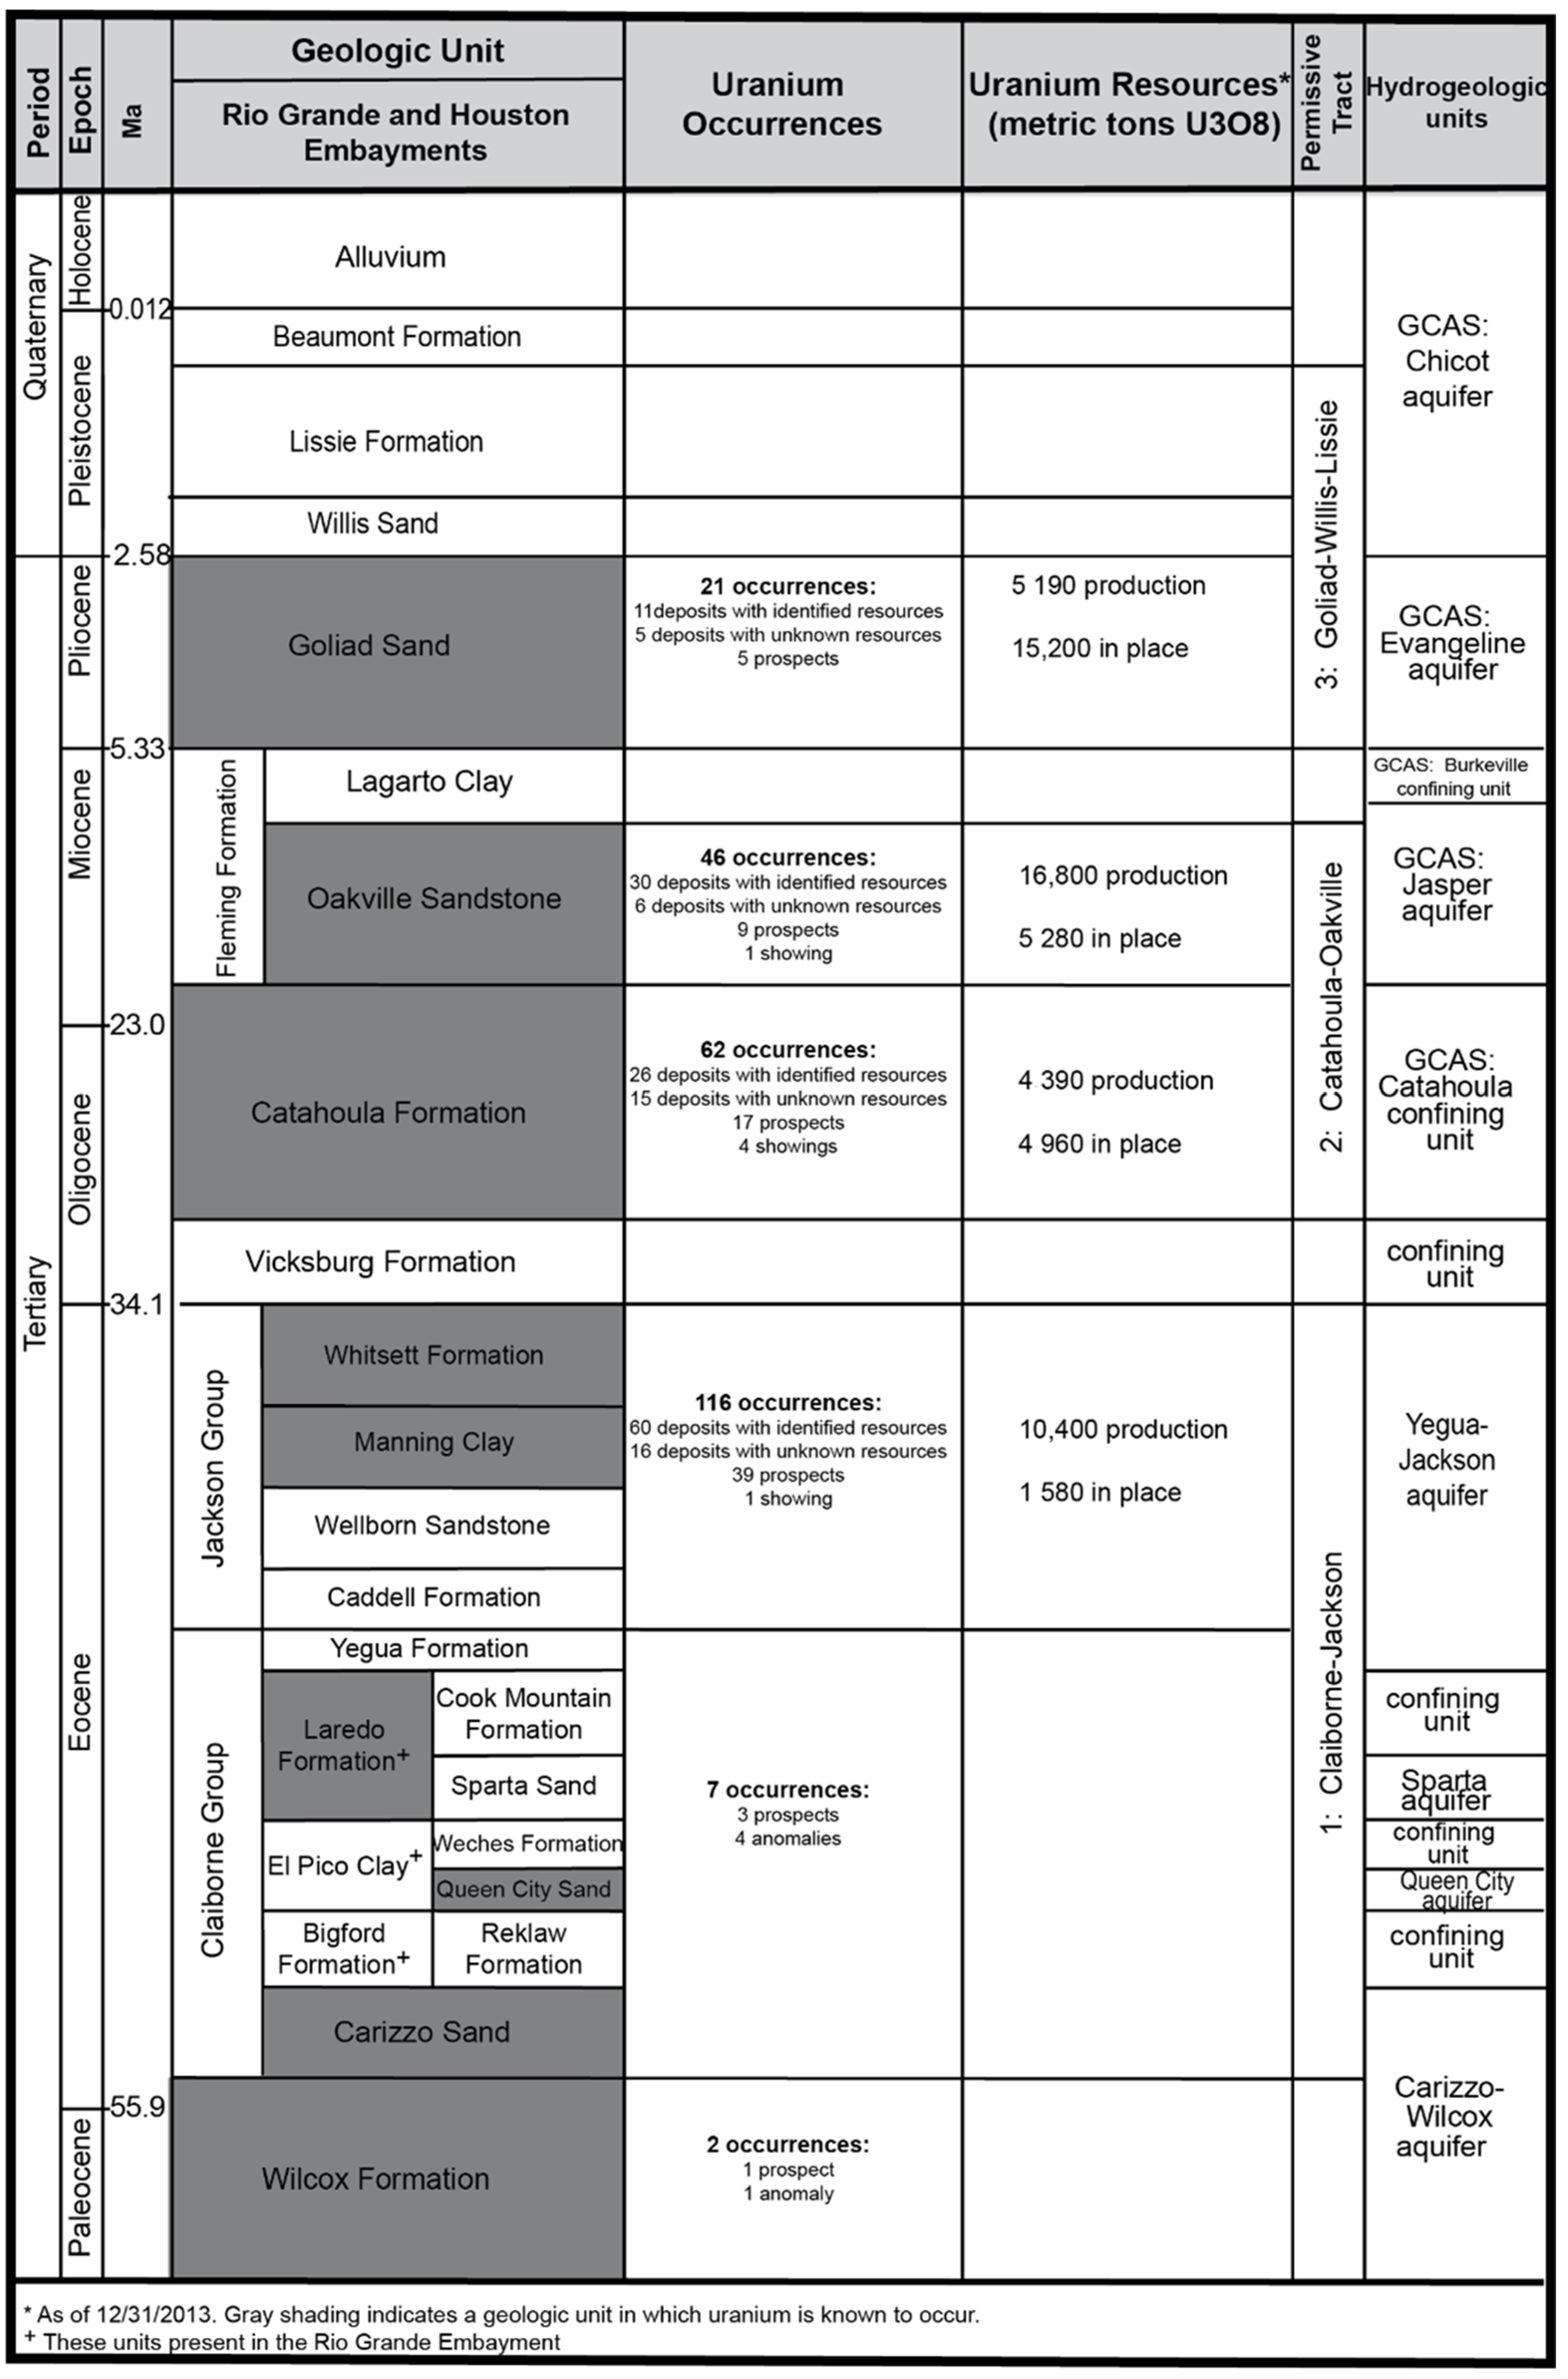
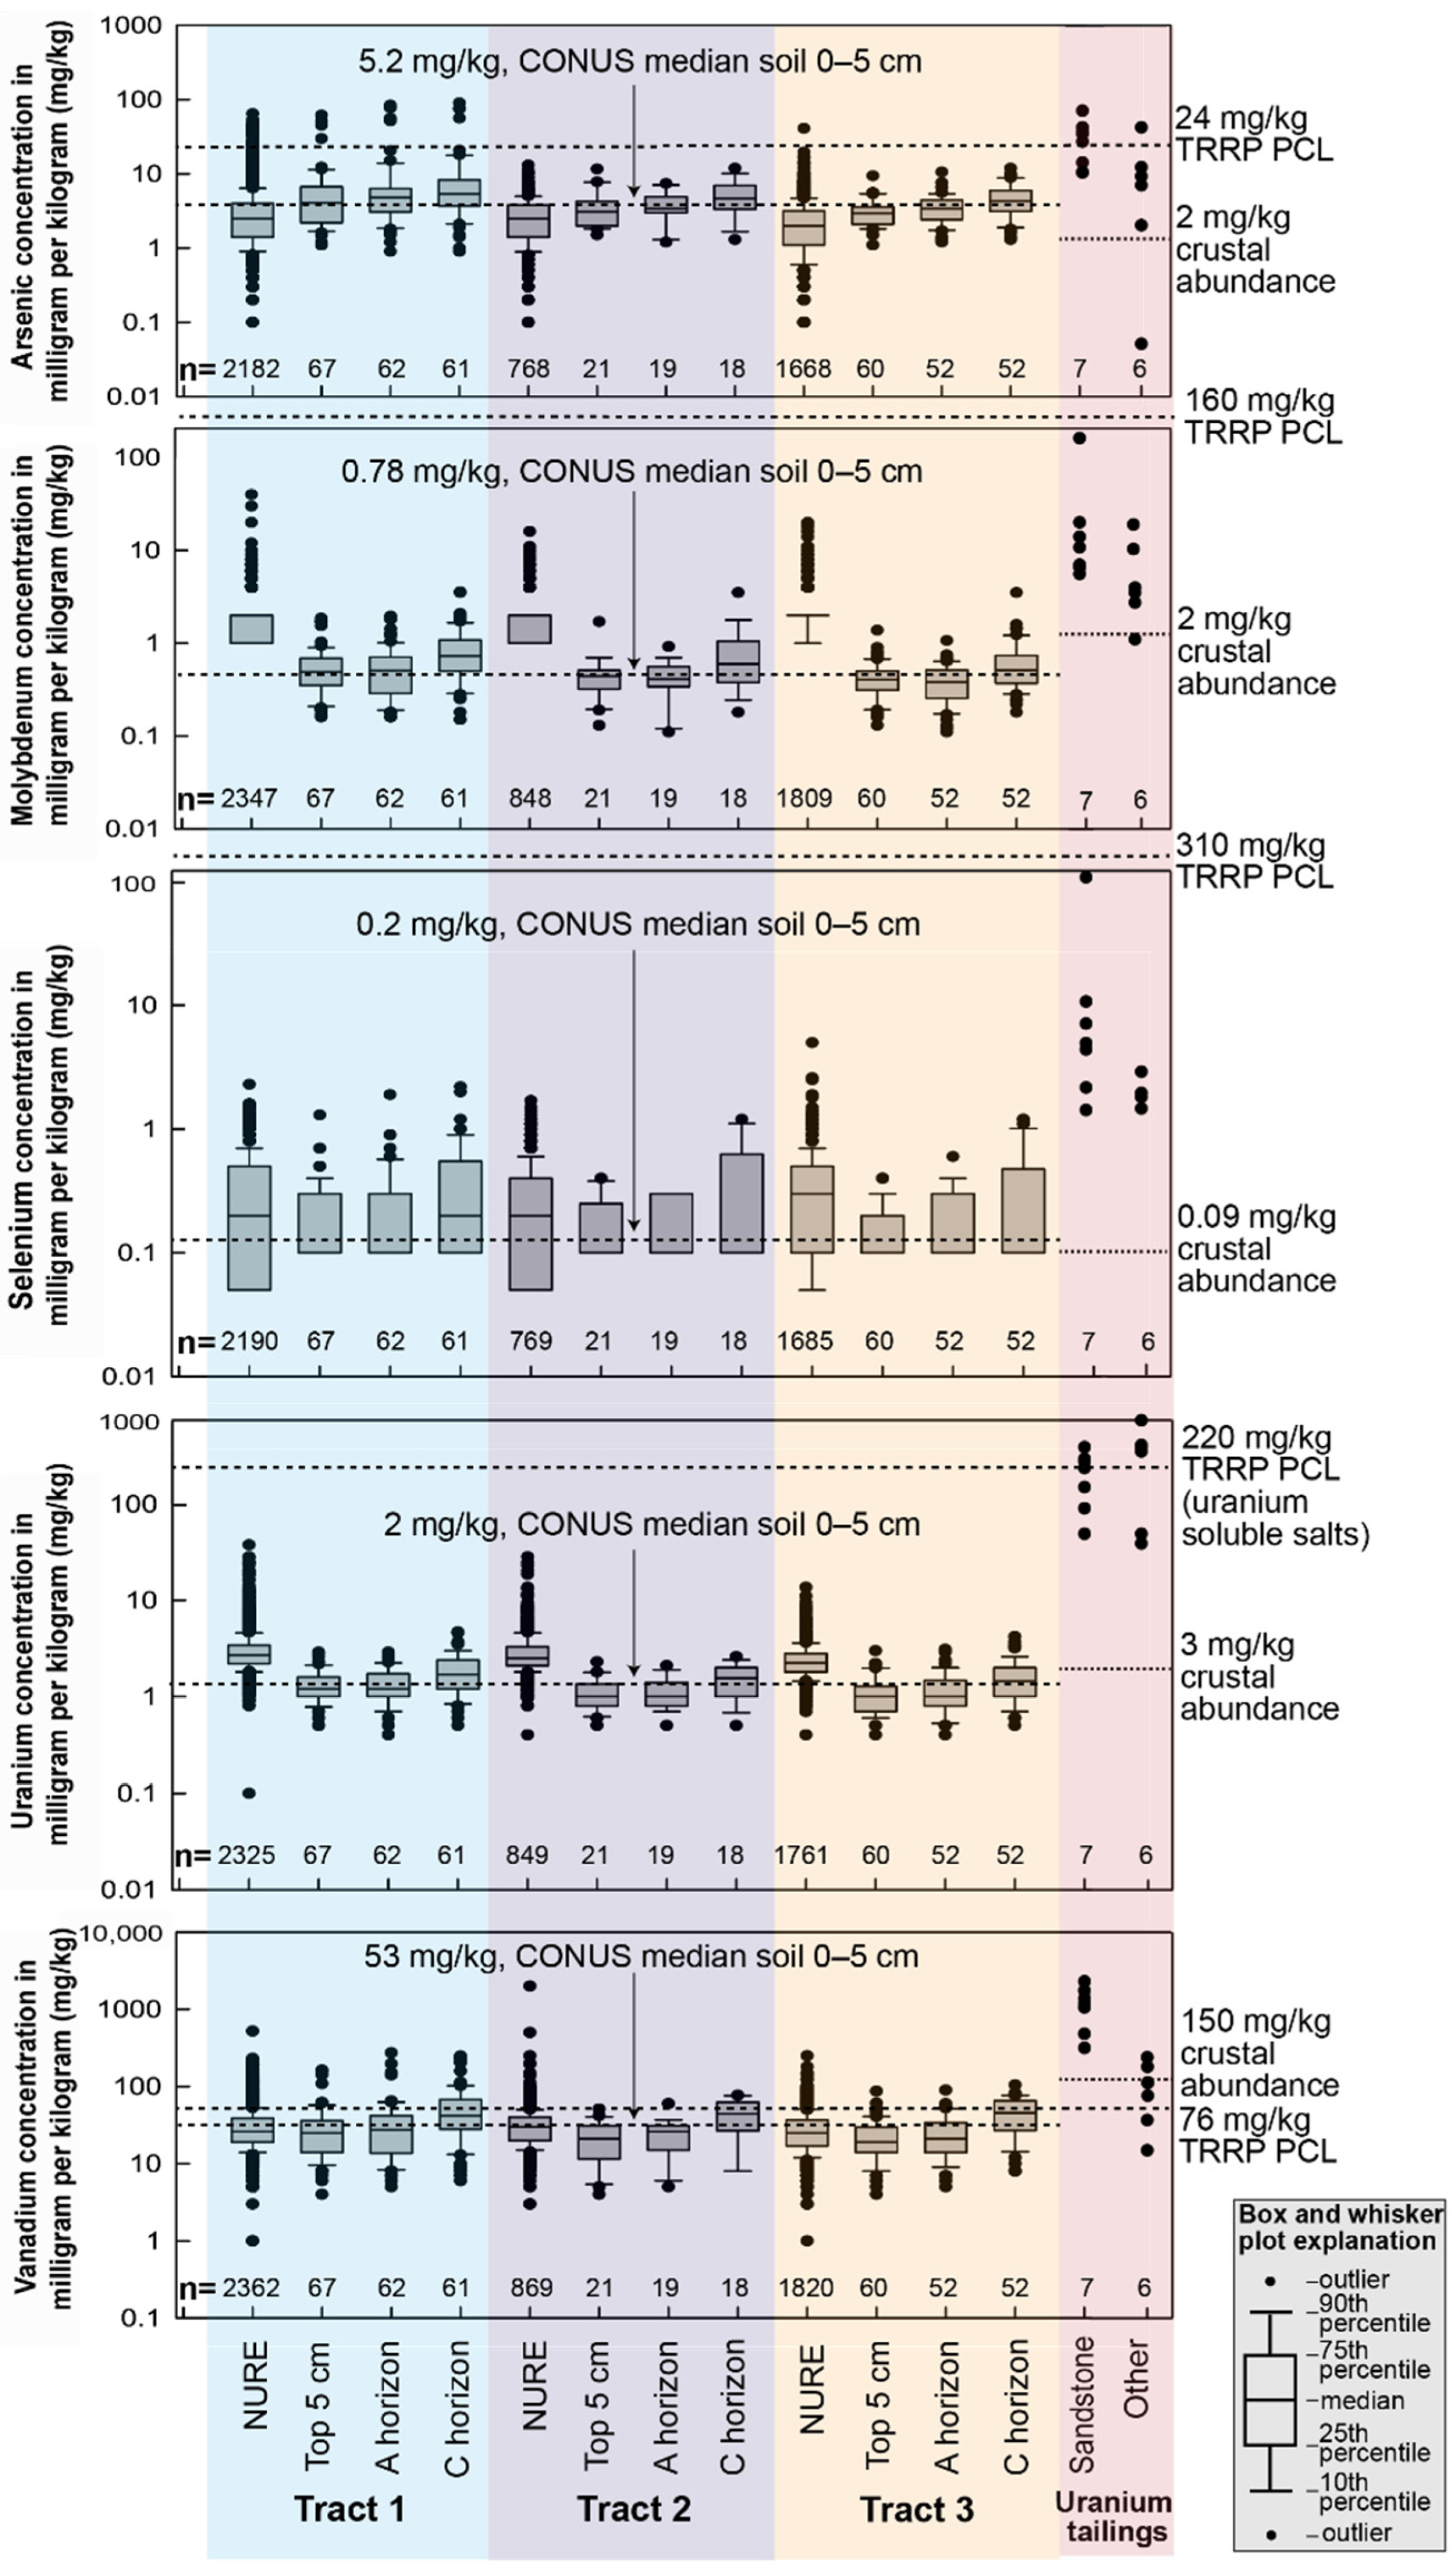
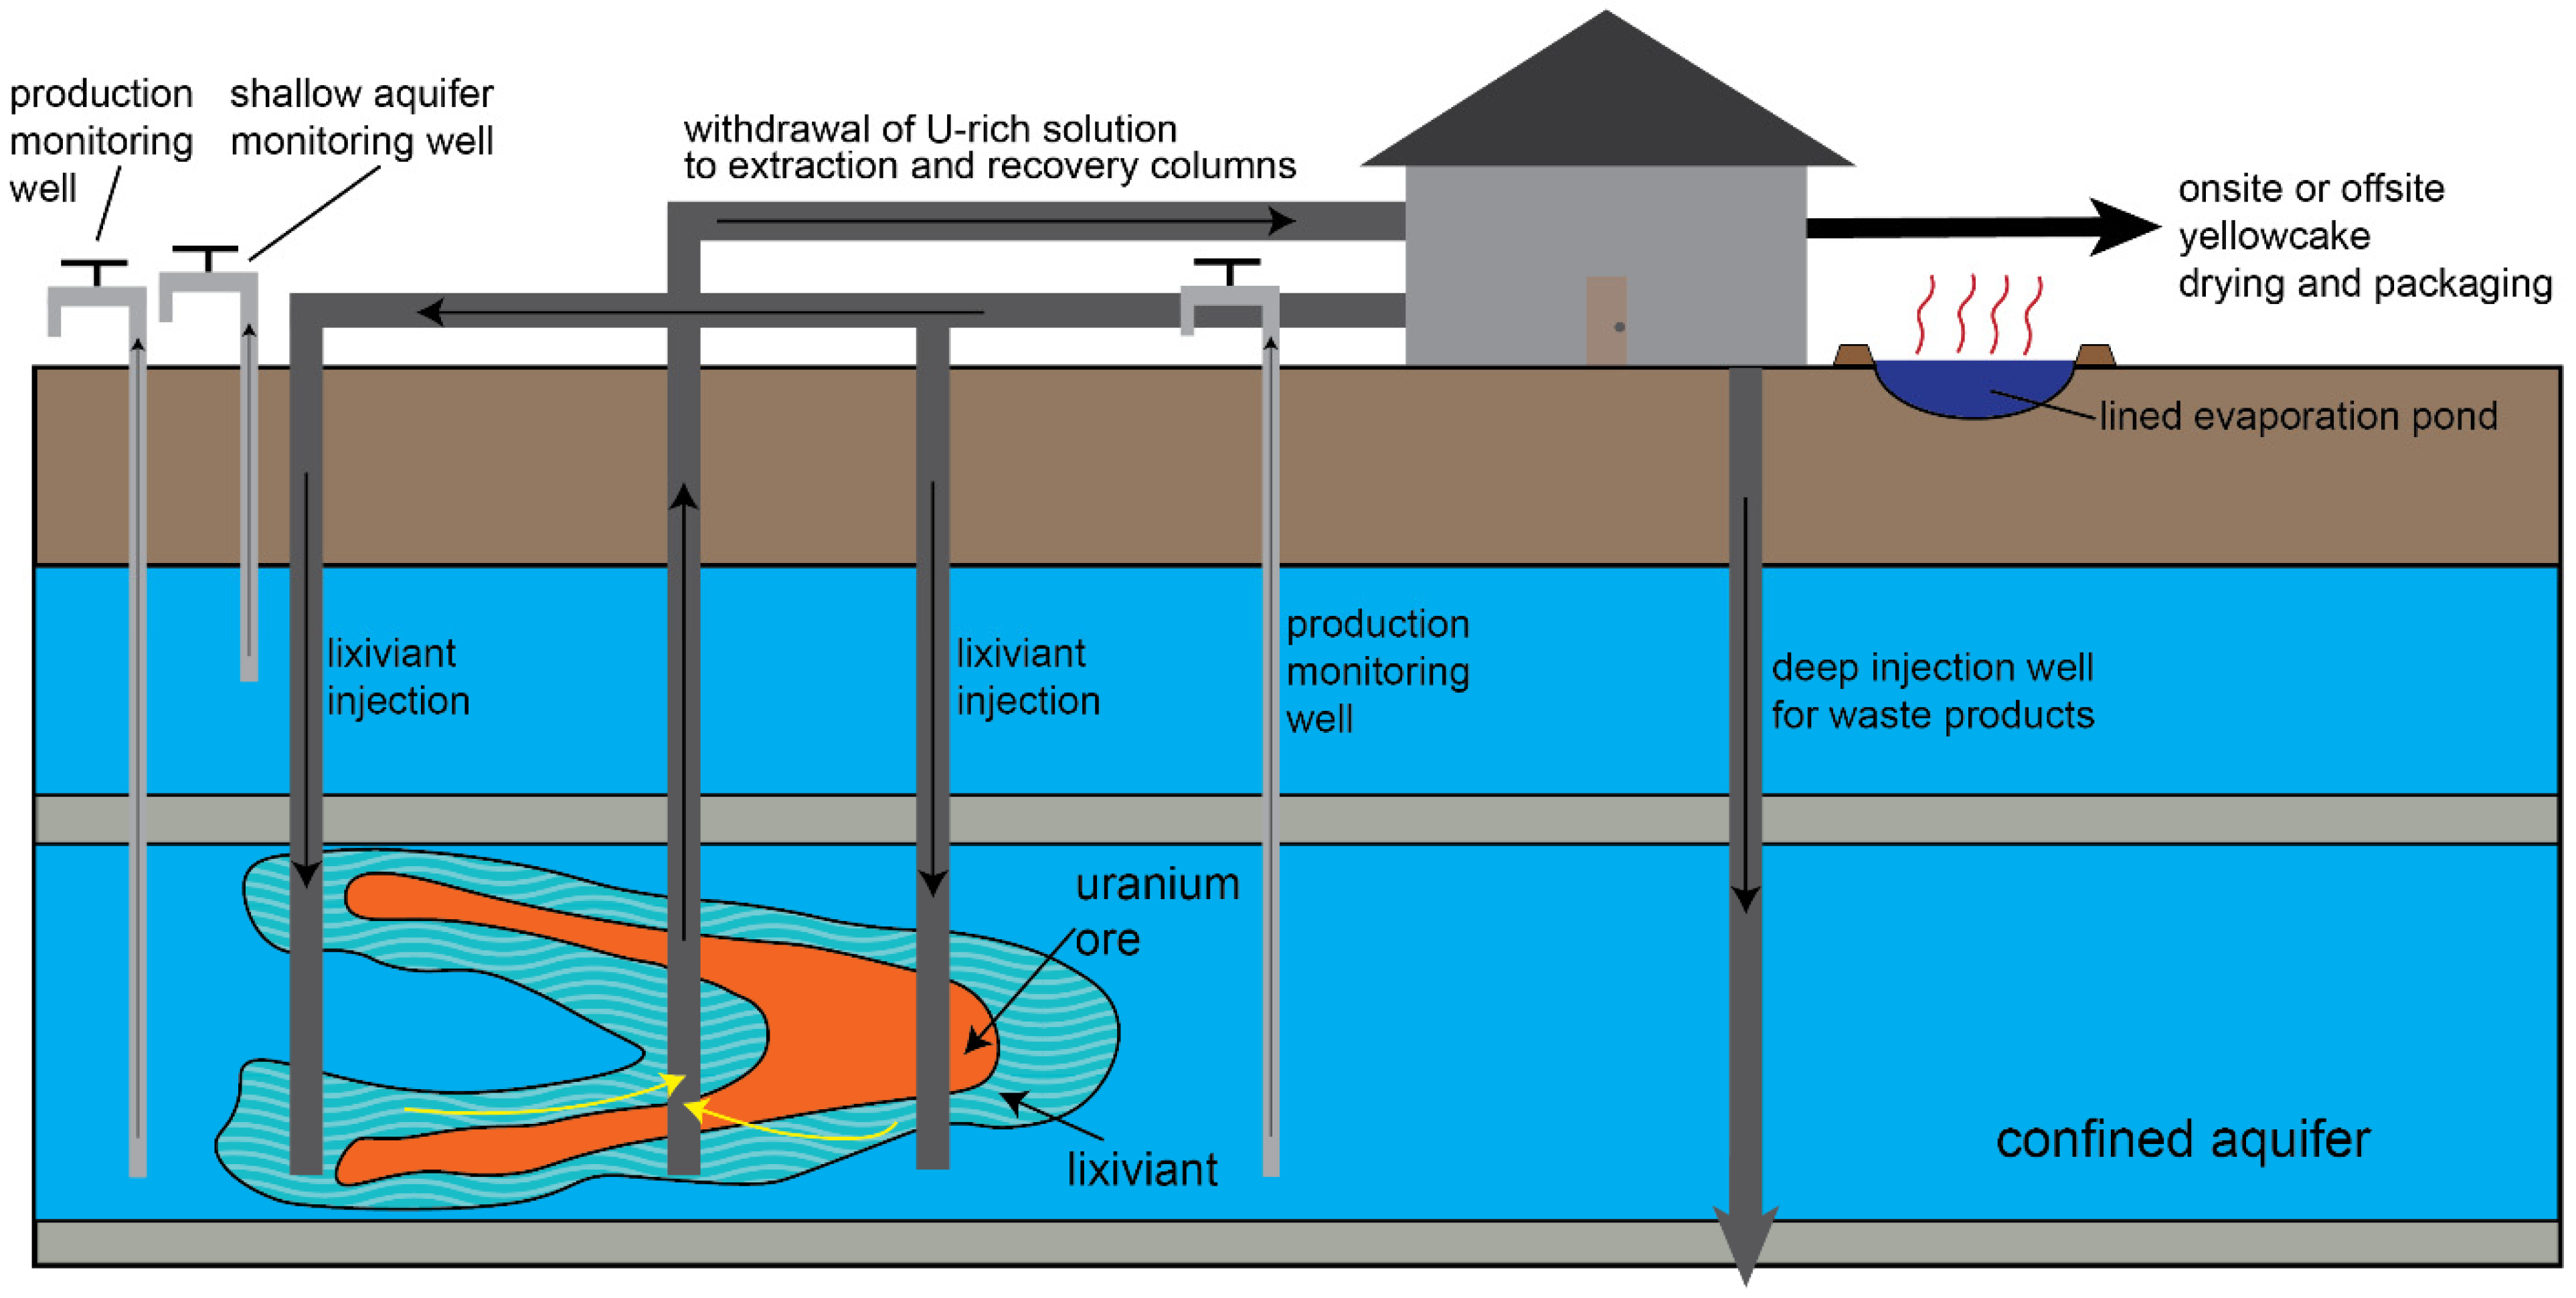
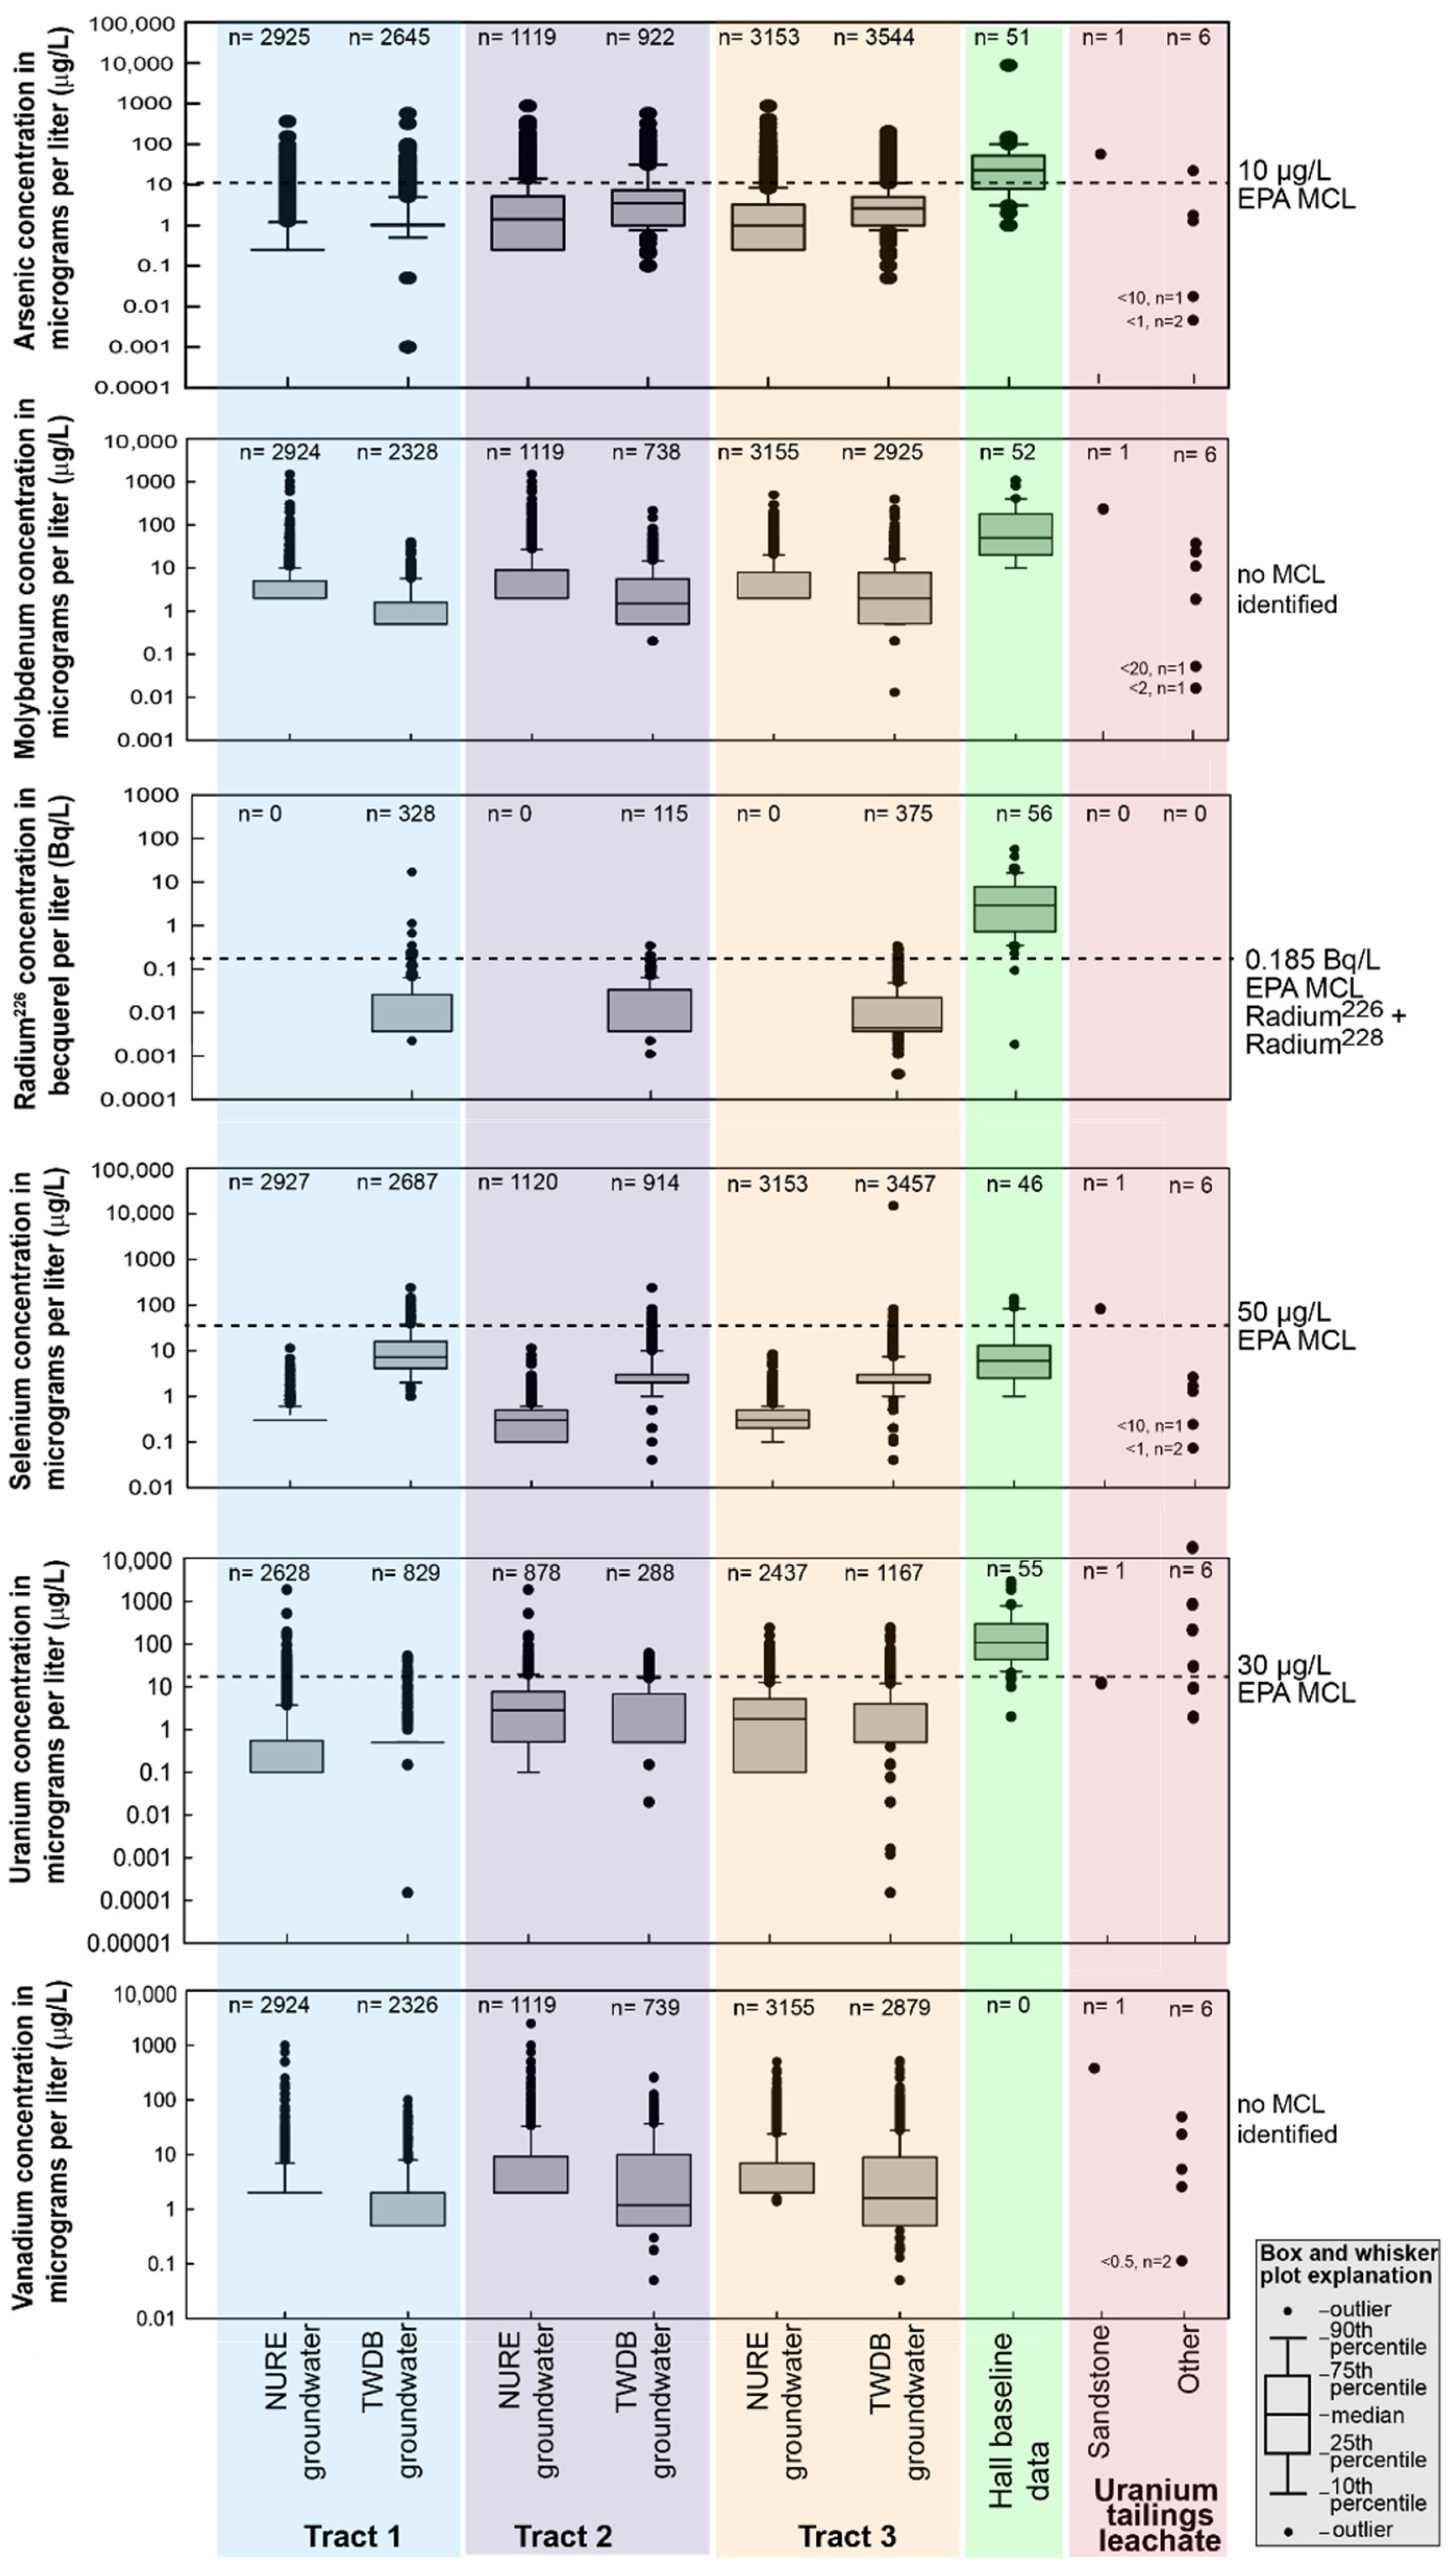
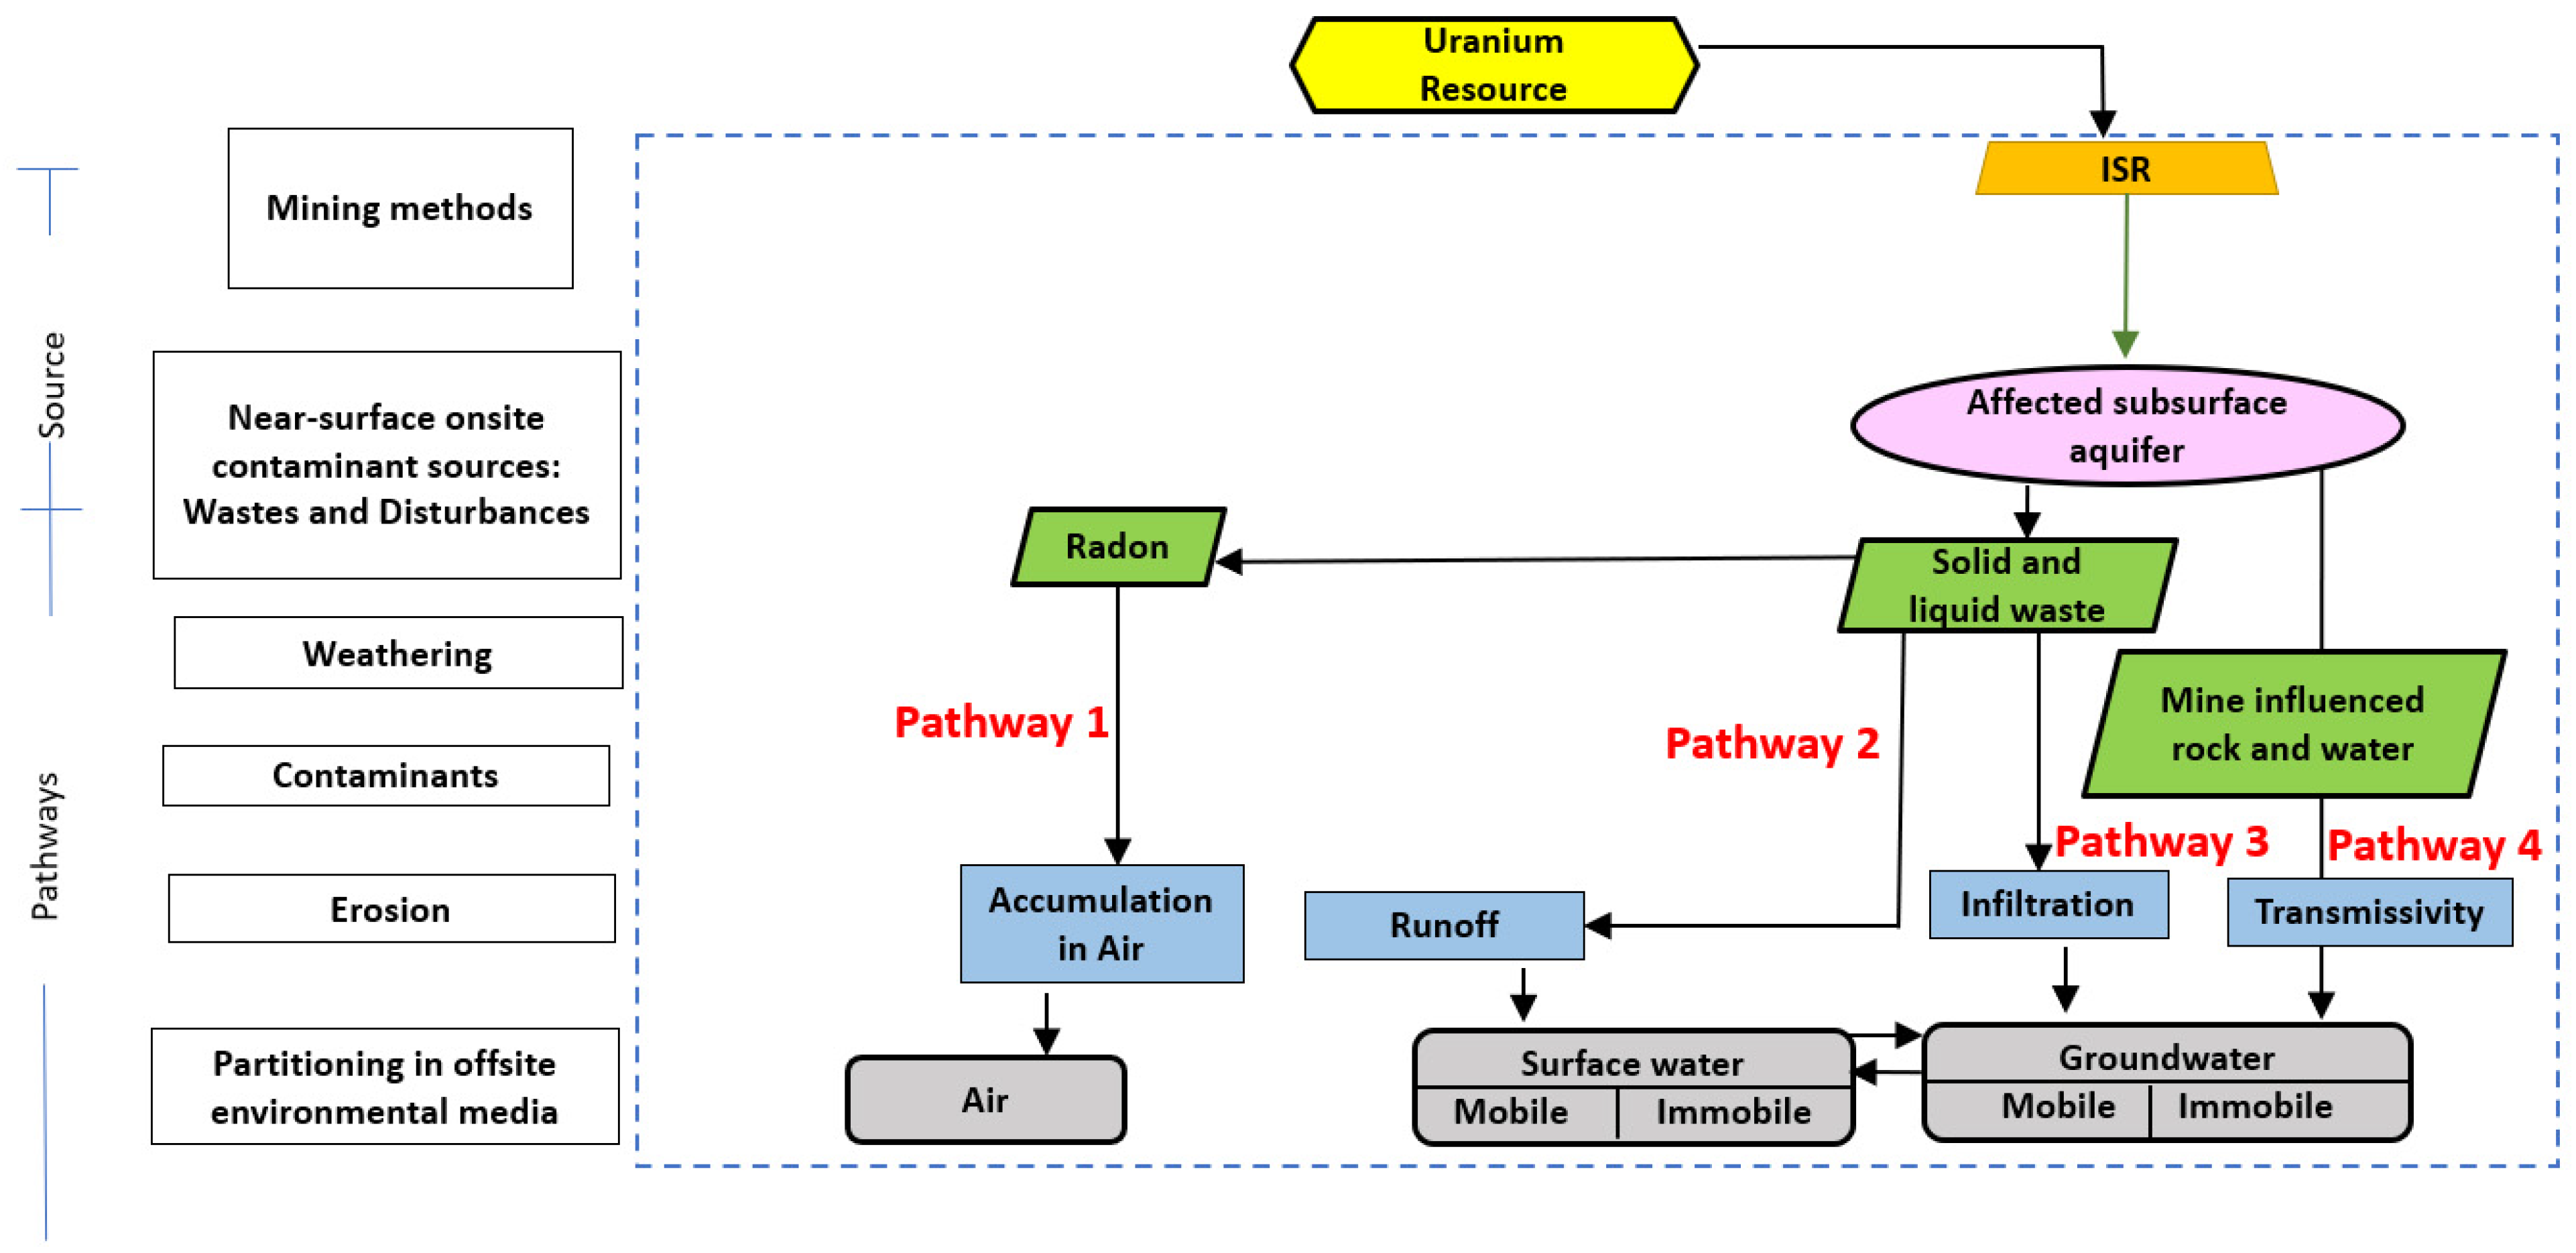
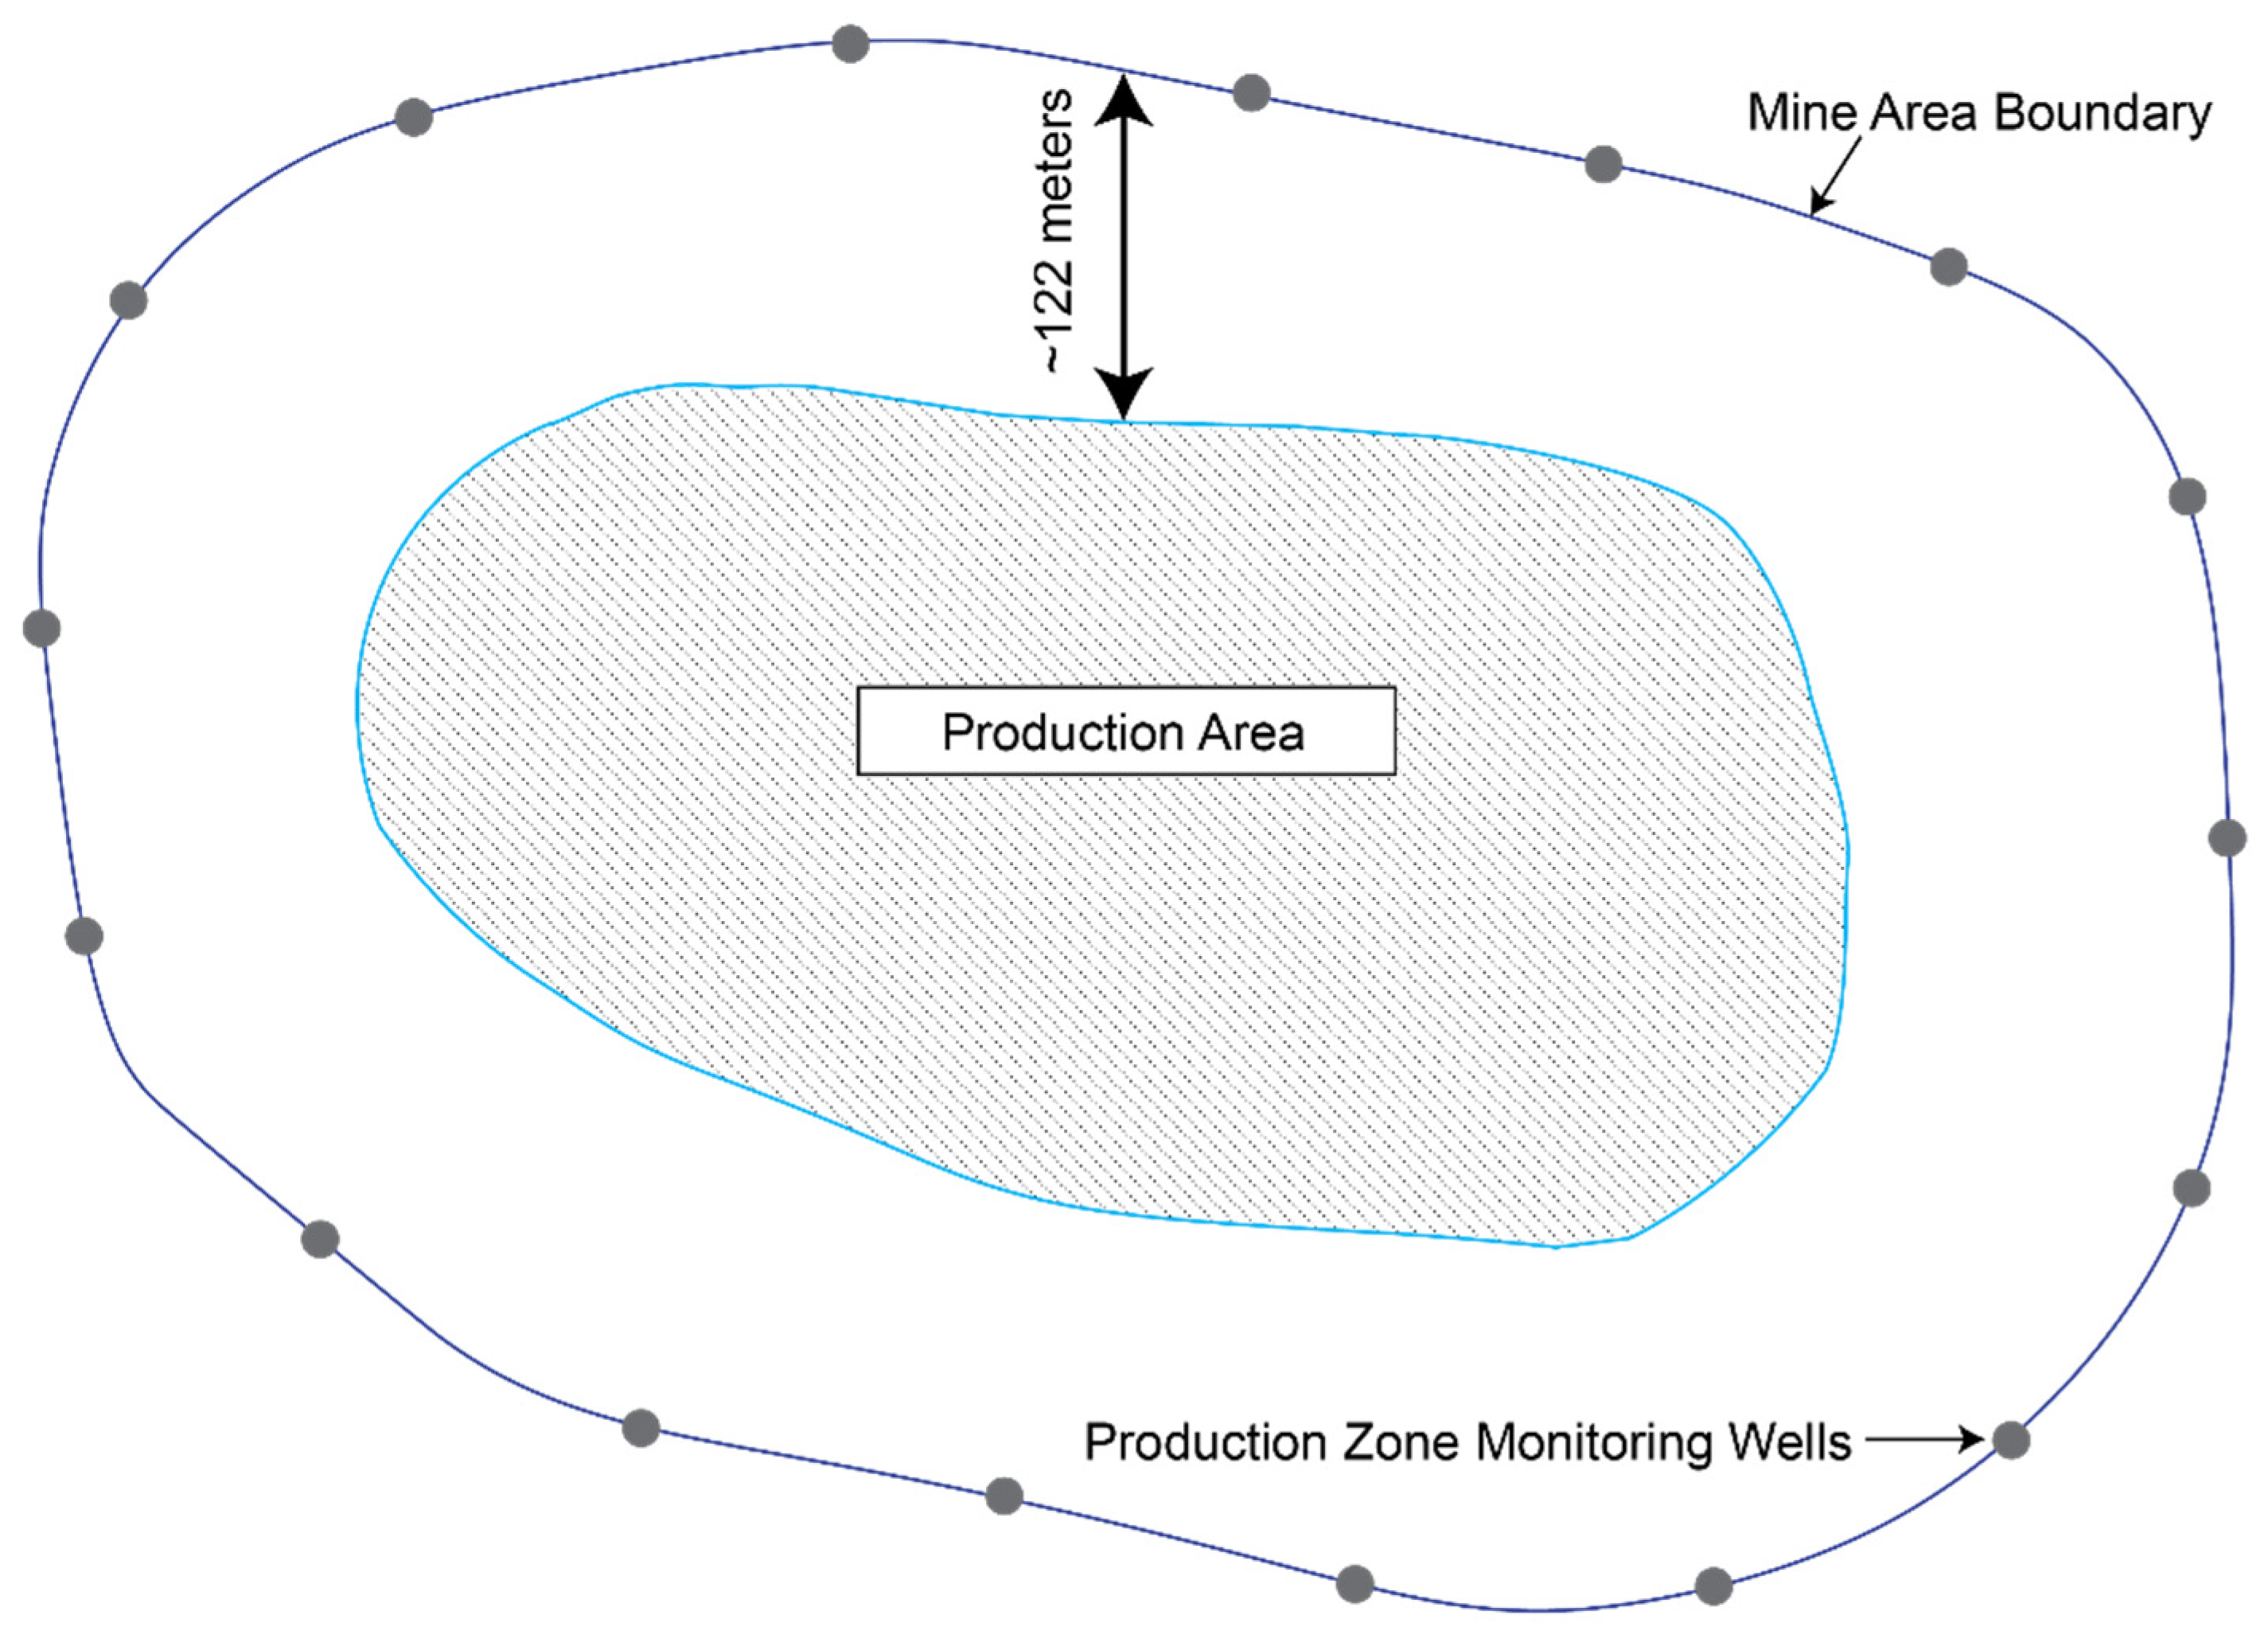
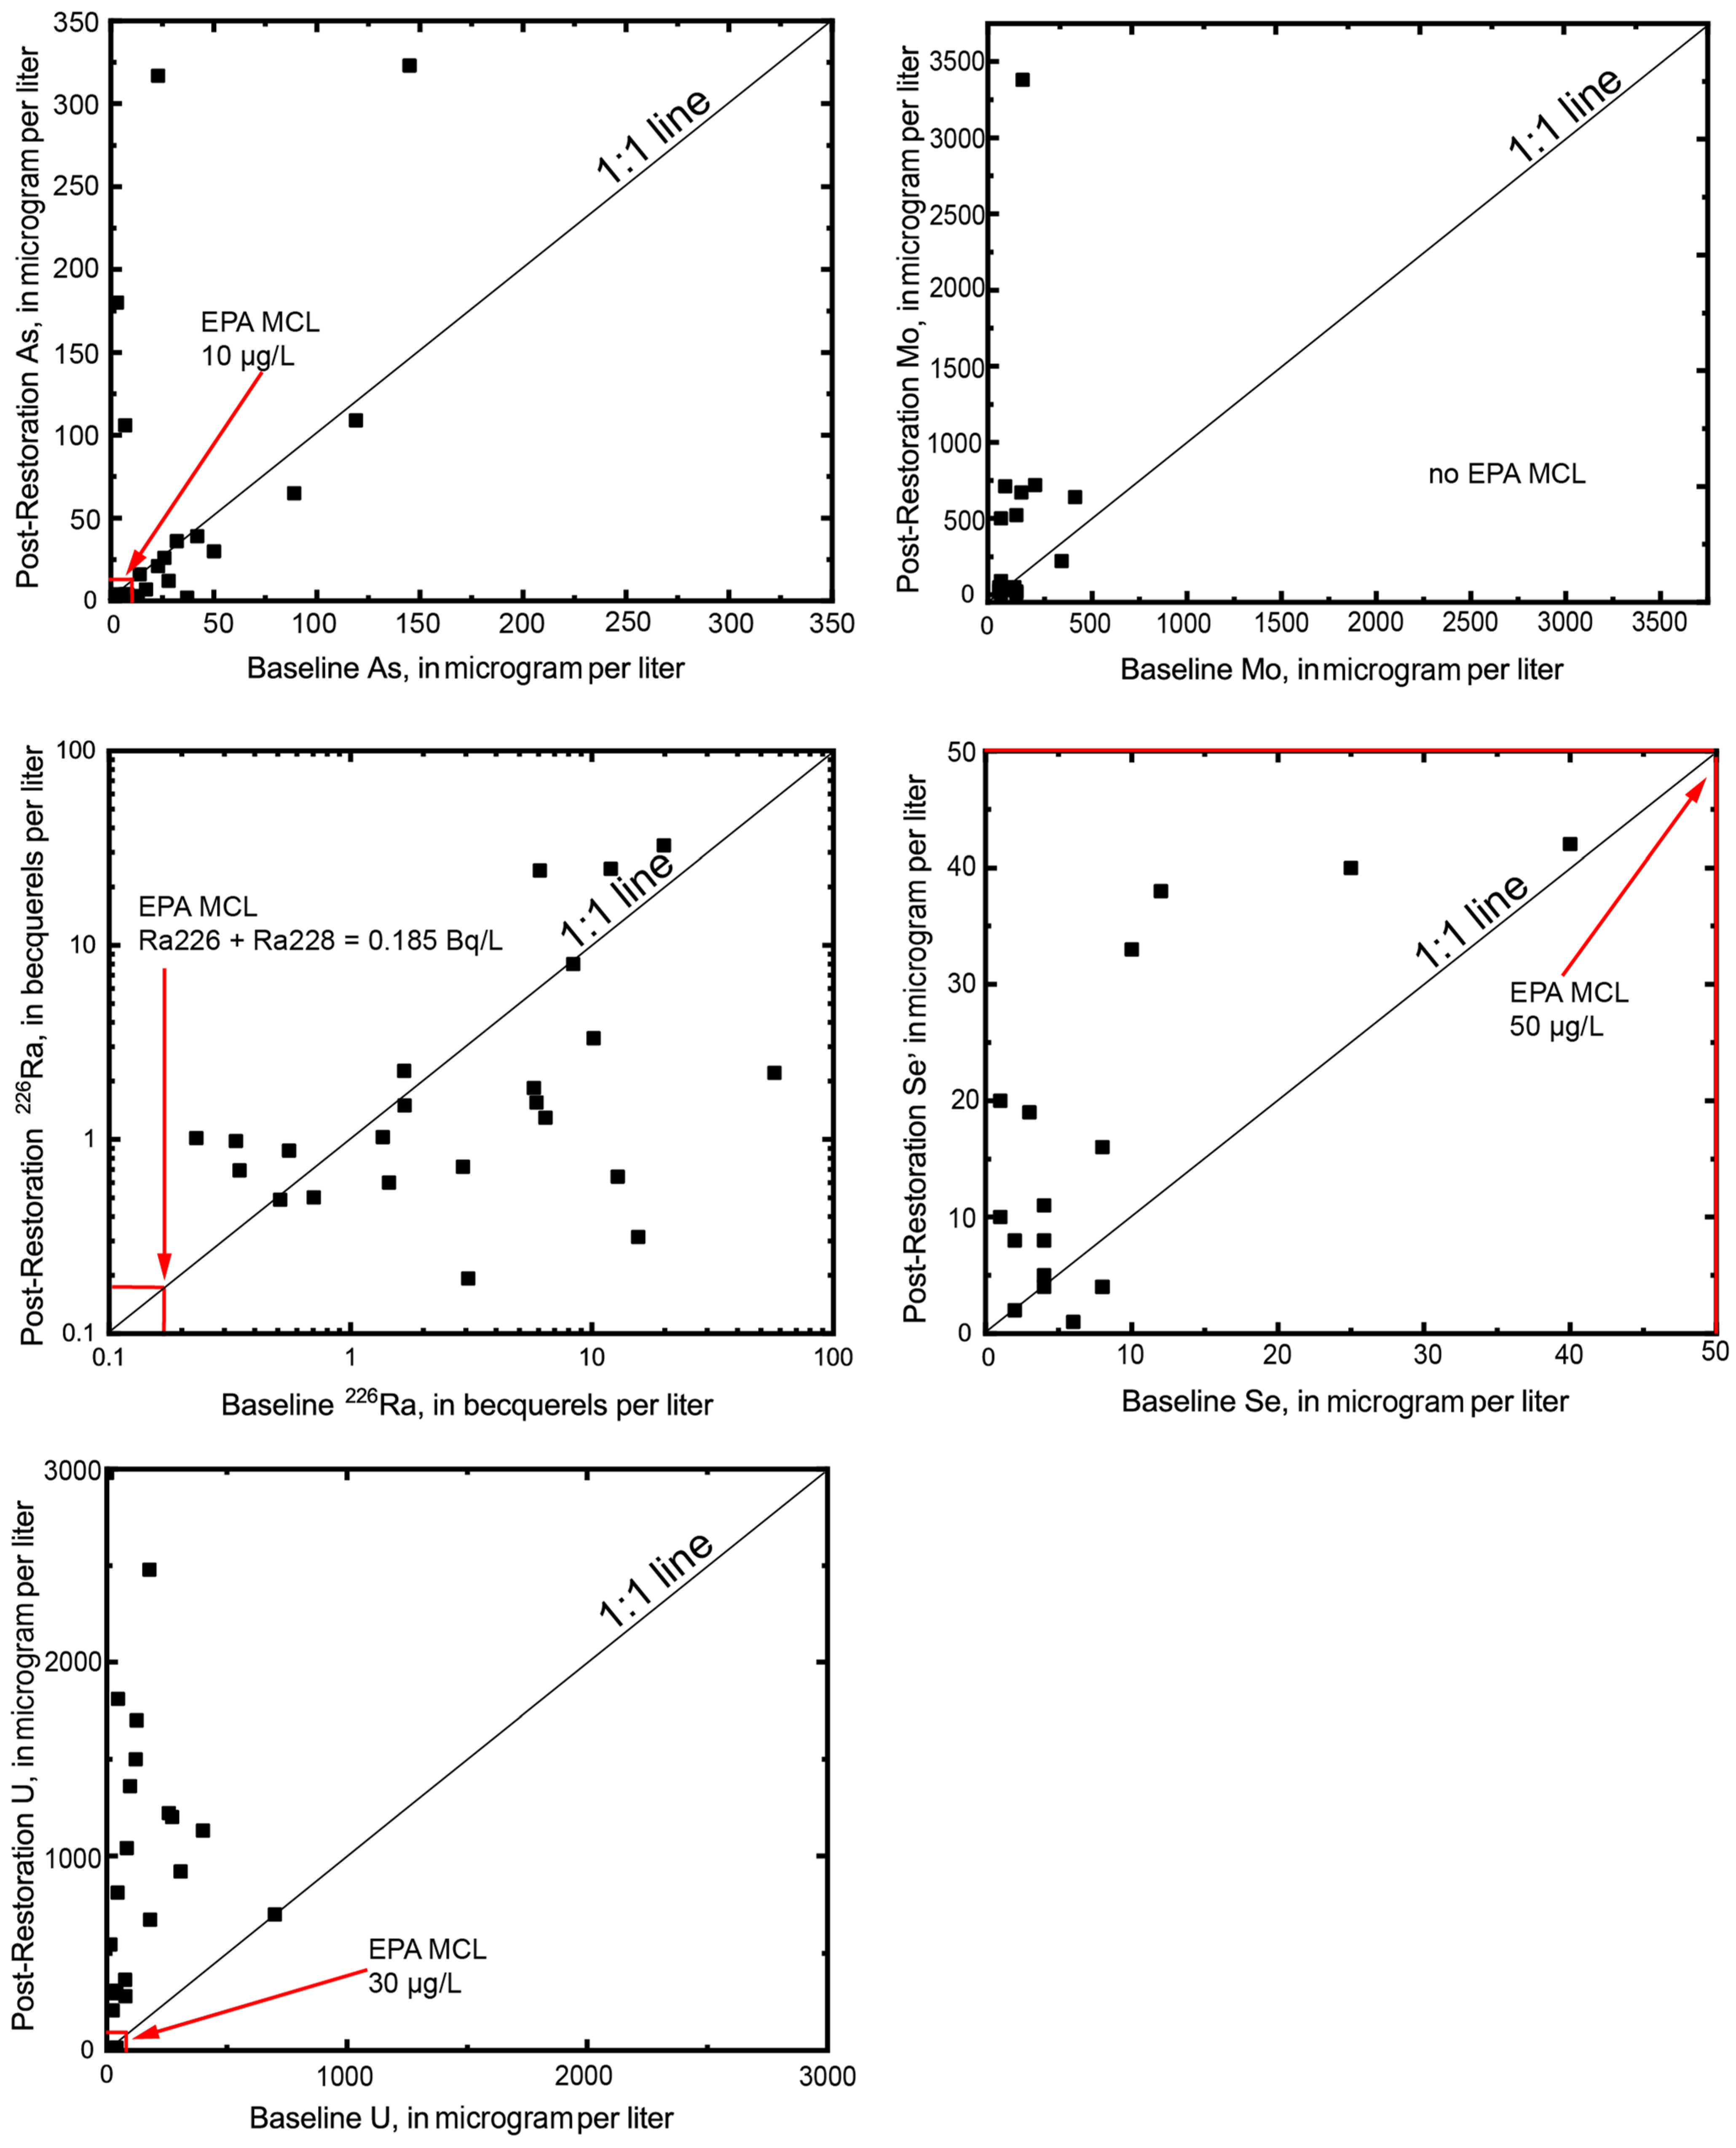
Table 1.
License numbers and owners, project name, and county of facilities licensed to handle uranium in Texas as of December 29, 2021. Information obtained from the Texas Commission on Environmental Quality. (* indicates the licensee and facility are authorized to process ion exchange resin to yellowcake; locations shown on Figure 3).
| License Number 1 | Owner | Project Name | County |
|---|---|---|---|
| R03626 * | South Texas Mining Venture (formerly Everest Exploration) | Hobson * | Karnes |
| R03653 * | URI, Inc | Kingsville Dome * Rosita | Kleberg Duval |
| R05360 * | EFR Alta Mesa (formerly Mesteña Uranium LLC) | Alta Mesa * | Brooks |
| R06062 | South Texas Mining Venture | La Palangana Uranium in situ recovery | Duval |
| R06063 * | Rio Grande Resources Corporation | Panna Maria * | Karnes |
| R06064 | Uranium Energy Corporation | Goliad | Goliad |
| R06066 | Uranium Energy Corporation | Burke Hollow | Bee |
1 License information can be accessed at [24].
Publisher’s Note: MDPI stays neutral with regard to jurisdictional claims in published maps and institutional affiliations. |
© 2022 by the authors. Licensee MDPI, Basel, Switzerland. This article is an open access article distributed under the terms and conditions of the Creative Commons Attribution (CC BY) license (https://creativecommons.org/licenses/by/4.0/).
Share and Cite
MDPI and ACS Style
Walton-Day, K.; Blake, J.; Seal, R.R., II; Gallegos, T.J.; Dupree, J.; Becher, K.D. Geoenvironmental Model for Roll-Type Uranium Deposits in the Texas Gulf Coast. Minerals 2022, 12, 780. https://0-doi-org.brum.beds.ac.uk/10.3390/min12060780
AMA Style
Walton-Day K, Blake J, Seal RR II, Gallegos TJ, Dupree J, Becher KD. Geoenvironmental Model for Roll-Type Uranium Deposits in the Texas Gulf Coast. Minerals. 2022; 12(6):780. https://0-doi-org.brum.beds.ac.uk/10.3390/min12060780
Chicago/Turabian StyleWalton-Day, Katherine, Johanna Blake, Robert R. Seal, II, Tanya J. Gallegos, Jean Dupree, and Kent D. Becher. 2022. "Geoenvironmental Model for Roll-Type Uranium Deposits in the Texas Gulf Coast" Minerals 12, no. 6: 780. https://0-doi-org.brum.beds.ac.uk/10.3390/min12060780
Note that from the first issue of 2016, this journal uses article numbers instead of page numbers. See further details here.