
Using Long-Lived Thorium Isotopes to Quantify the Lithogenic Inputs to the Lakes in Qaidam Basin, China

 , ,
, ,
Abstract
:1. Introduction
2. Methodology
2.1. Study Sites
2.2. Sampling Design and Methods
2.3. Analytical Methods
2.4. Theory
3. Results
3.1. Spatial Characteristics of Dissolved Th Isotope in the Lake Water
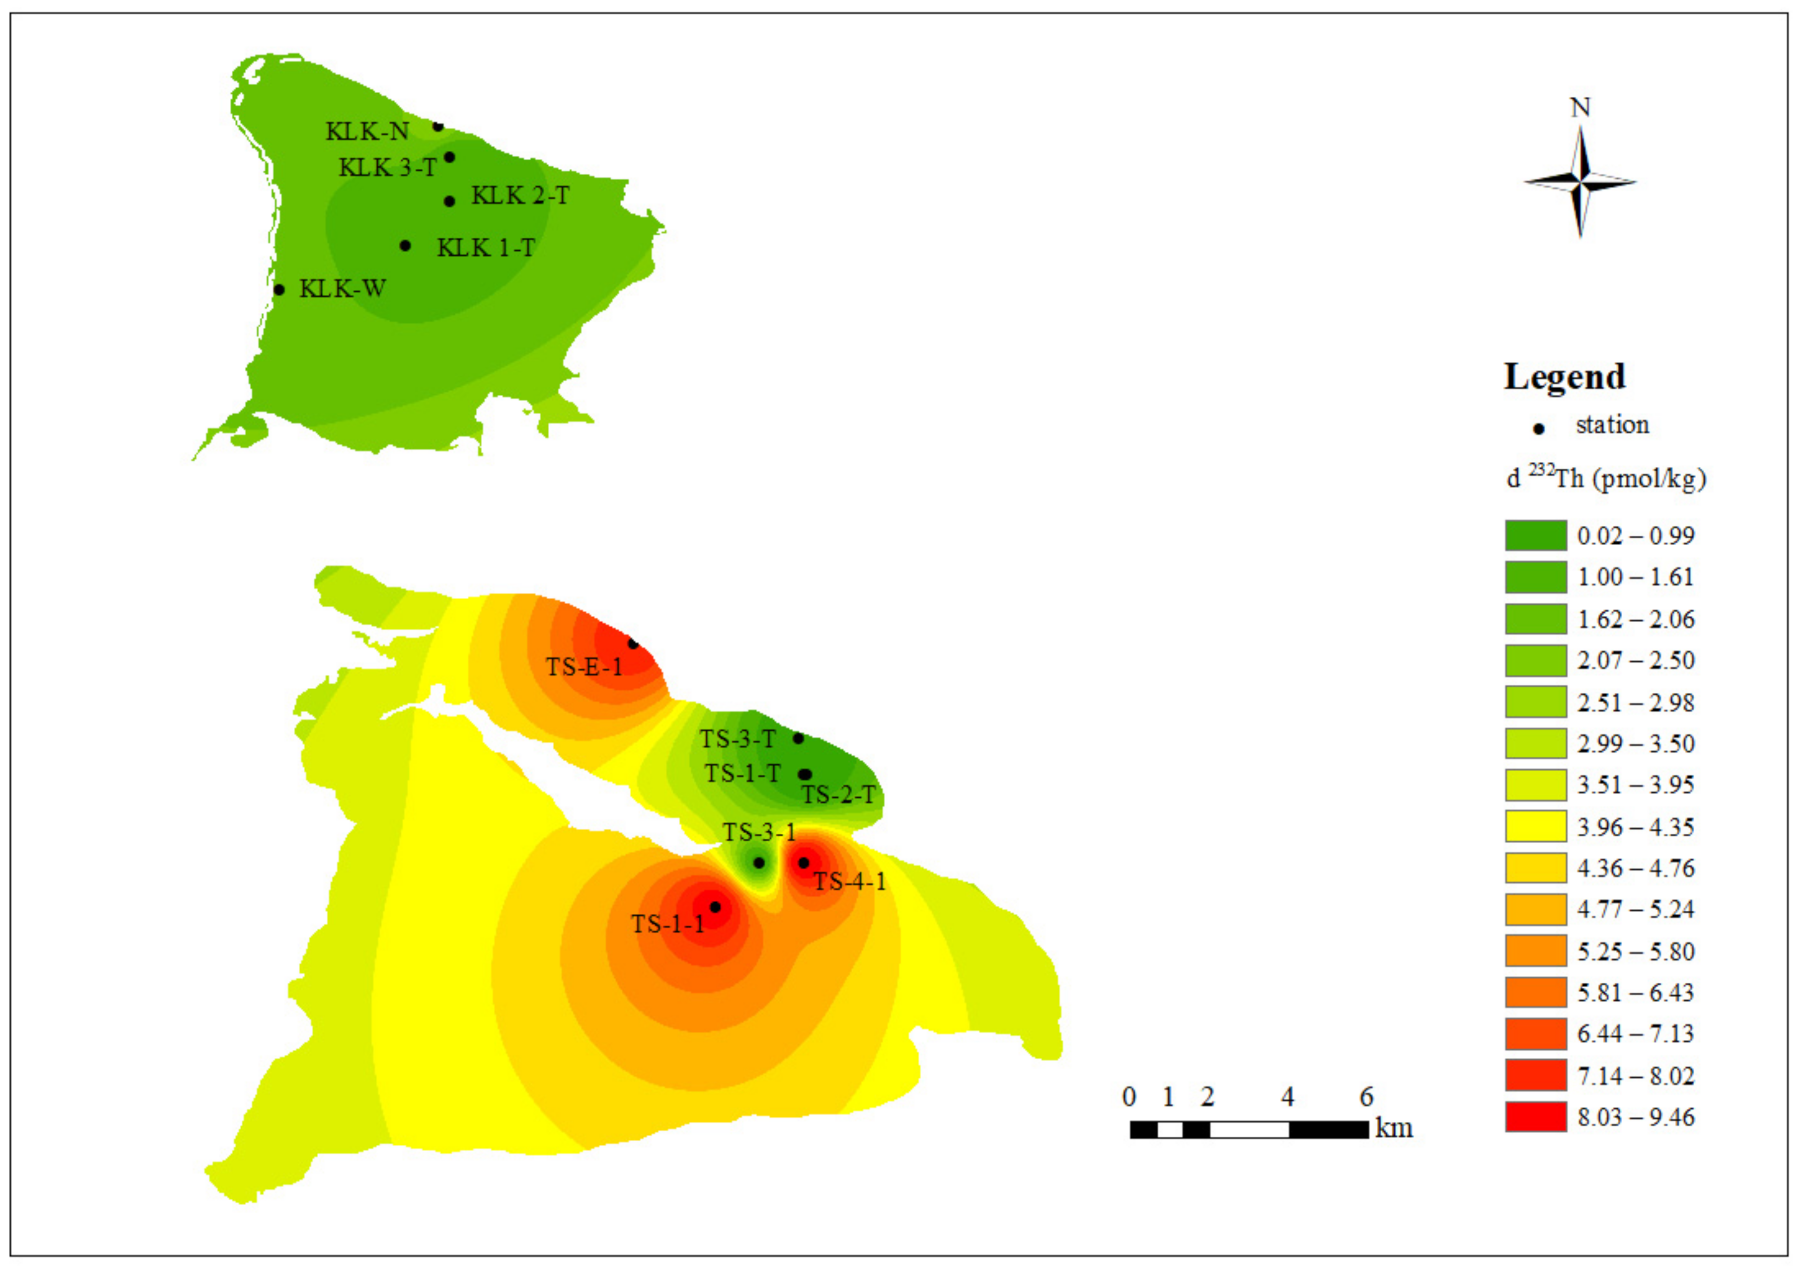
3.1.1. Surface Features of Dissolved Th Isotope in Surface Lake Water
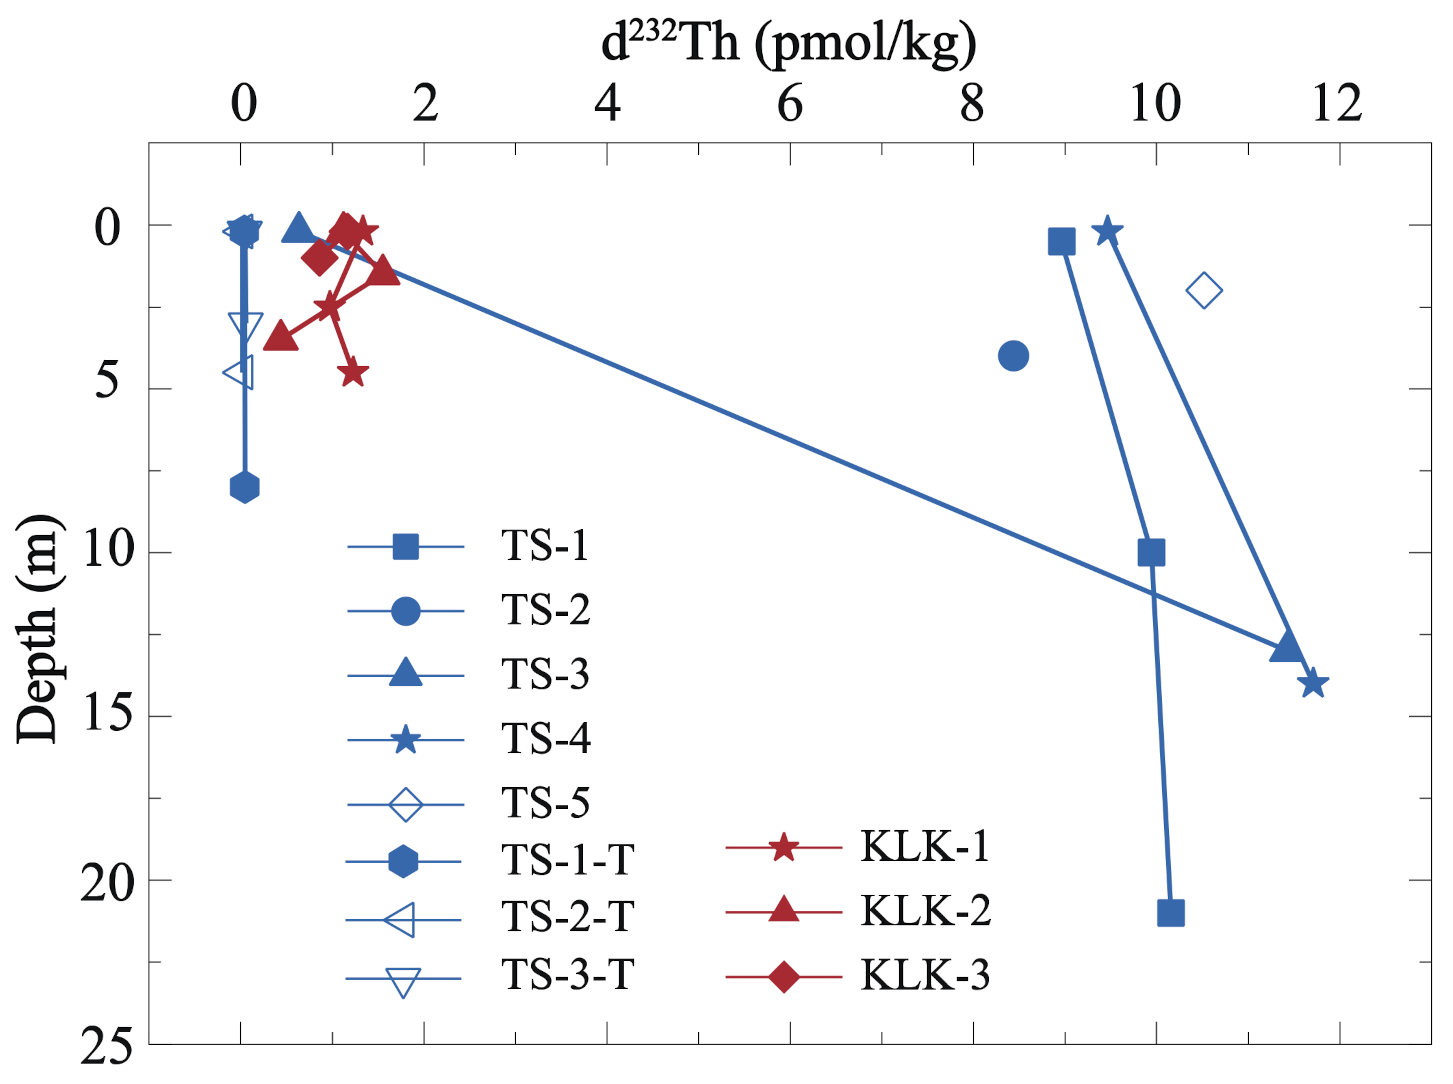
3.1.2. Distribution Features of Dissolved Th Isotope in Depth Profiles of Lake Water
3.2. Seasonal Distribution Characteristics of Dissolved Th Isotope in Lake Water
3.3. Features of Dissolved Th Isotope Concentration Distribution in Exogenous Recharged River Waters
4. Discussion
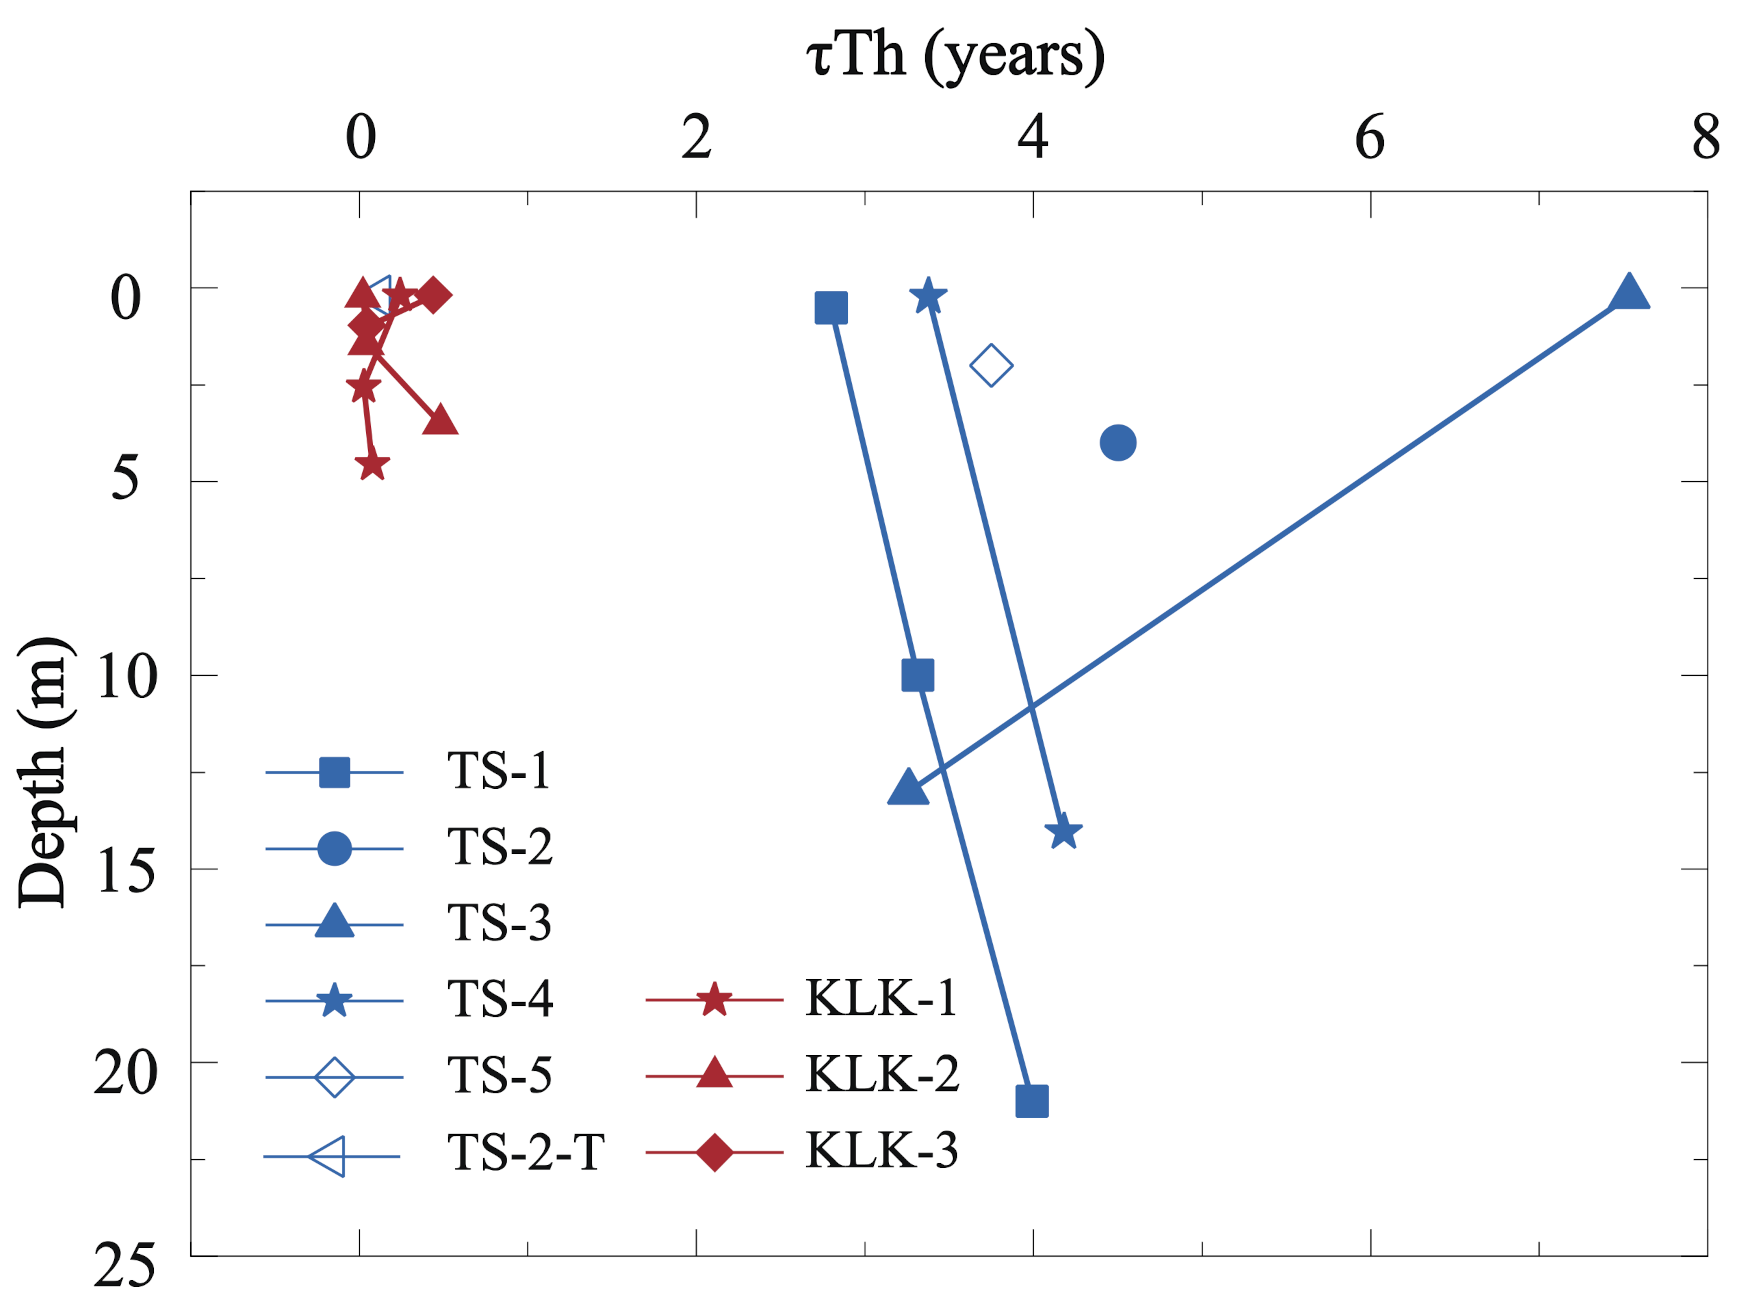
4.1. Th Scavenging Residence Time in Lake Water
4.1.1. Th Scavenging Residence Time in Surface Lake Water
4.1.2. Th Scavenging Residence Time in Depth Profiles of Lake Water
4.2. Thorium-Derived Dissolved 232Th Flux and Lithogenic Flux to Tuosu Lake and Keluke Lake
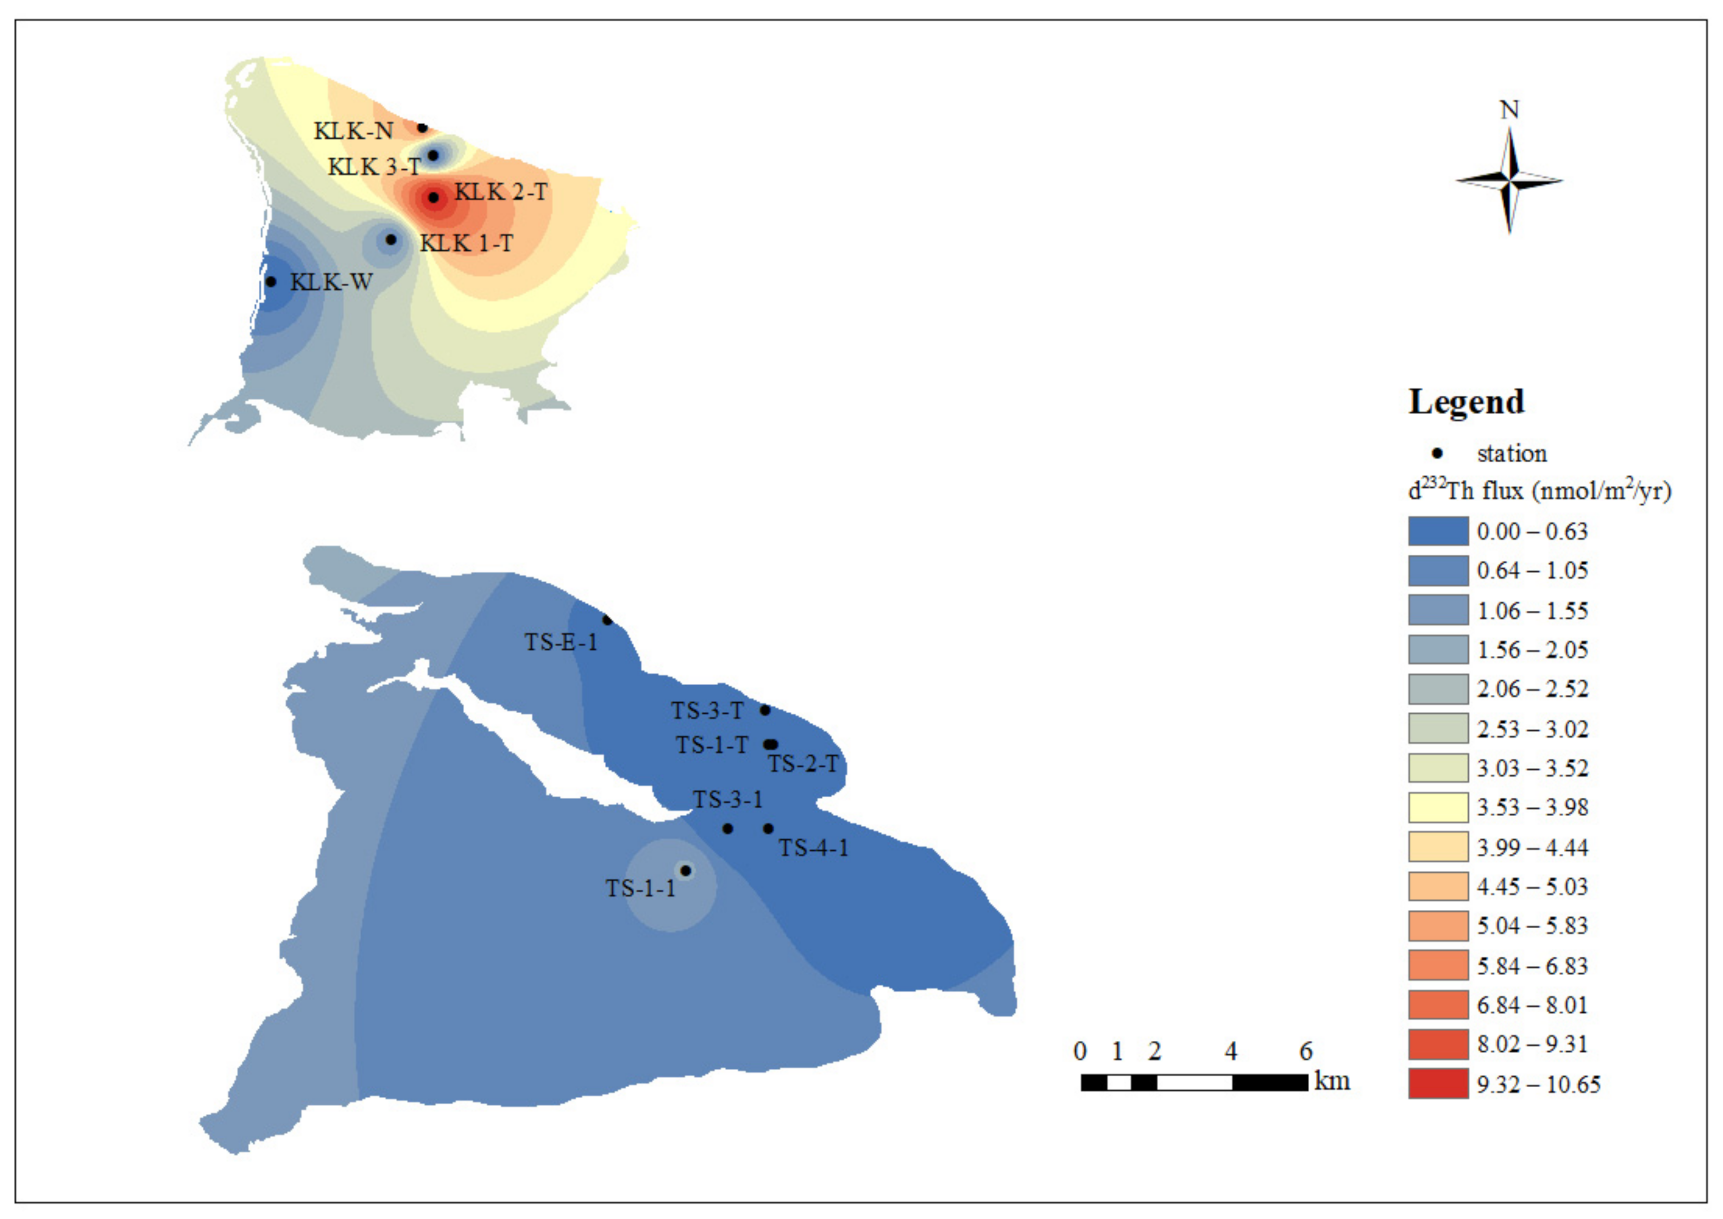
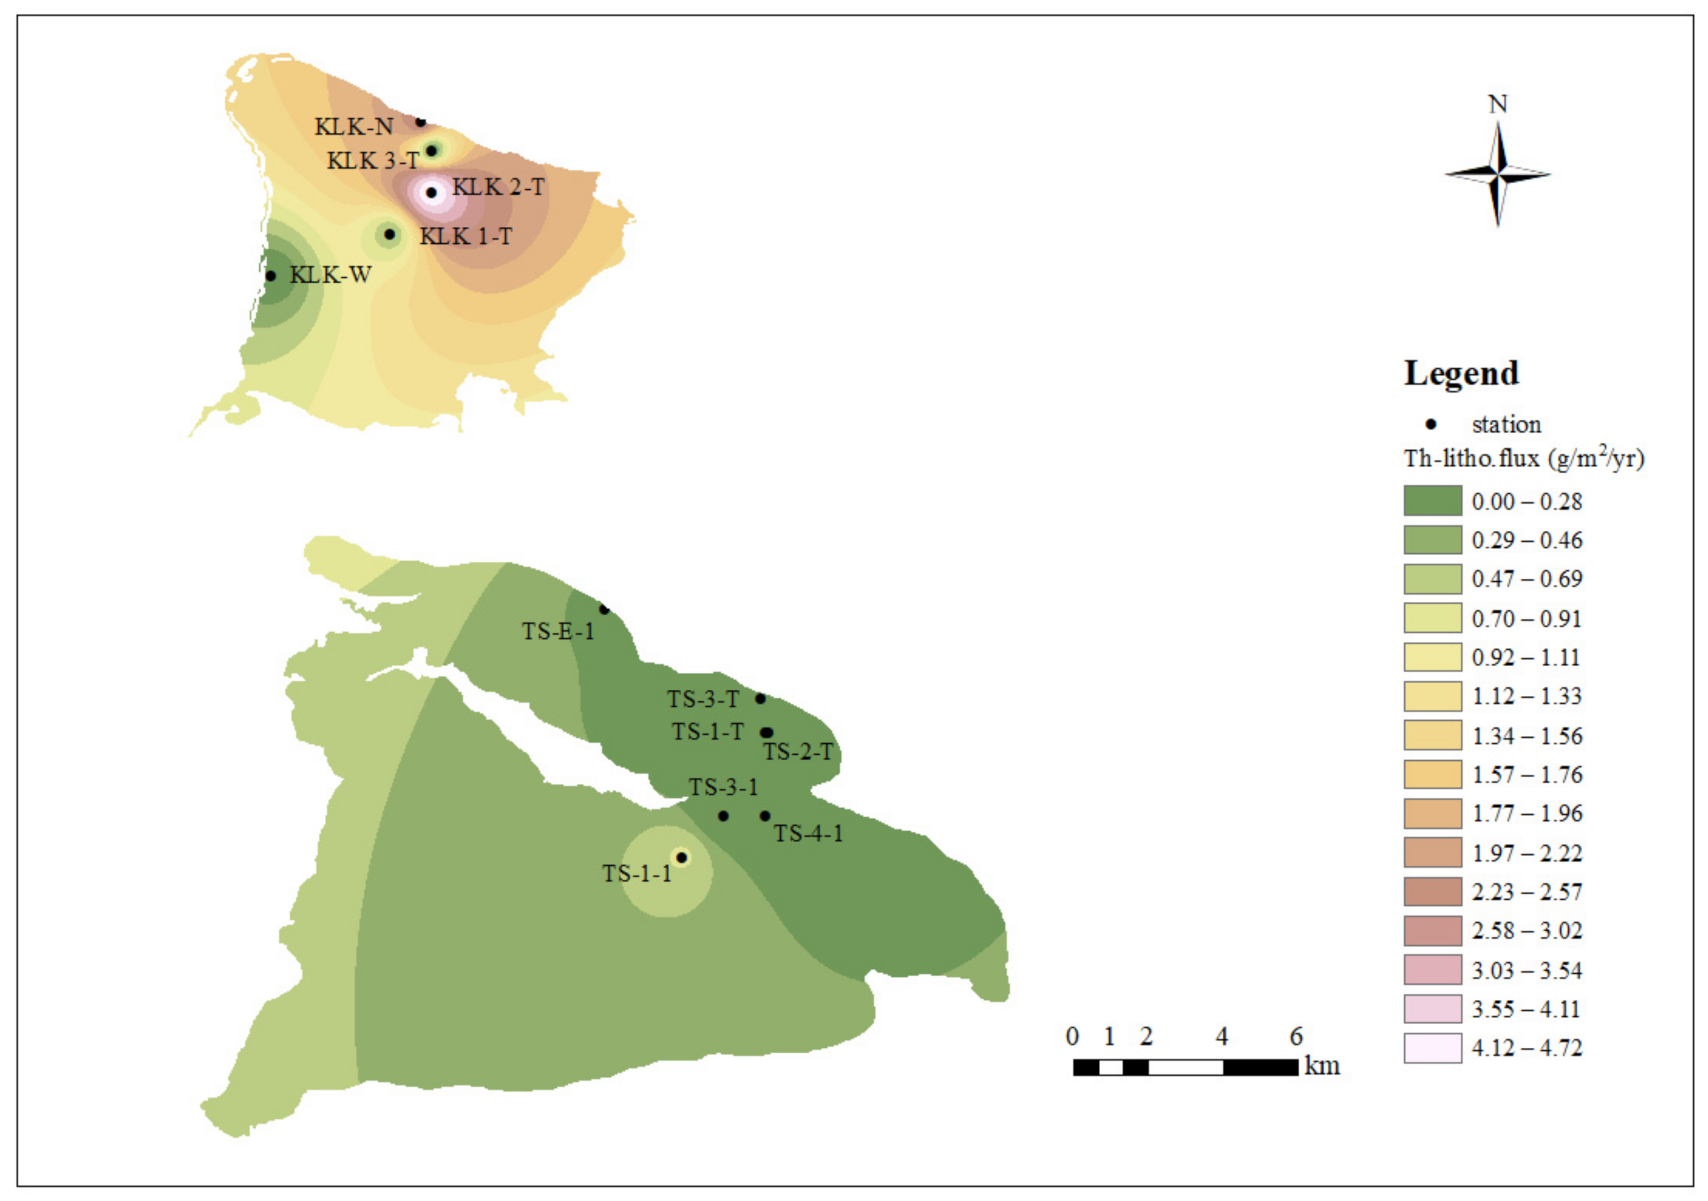
4.2.1. The Spatial Trends of Dissolved 232Th Flux and Lithogenic Flux in Lake Water
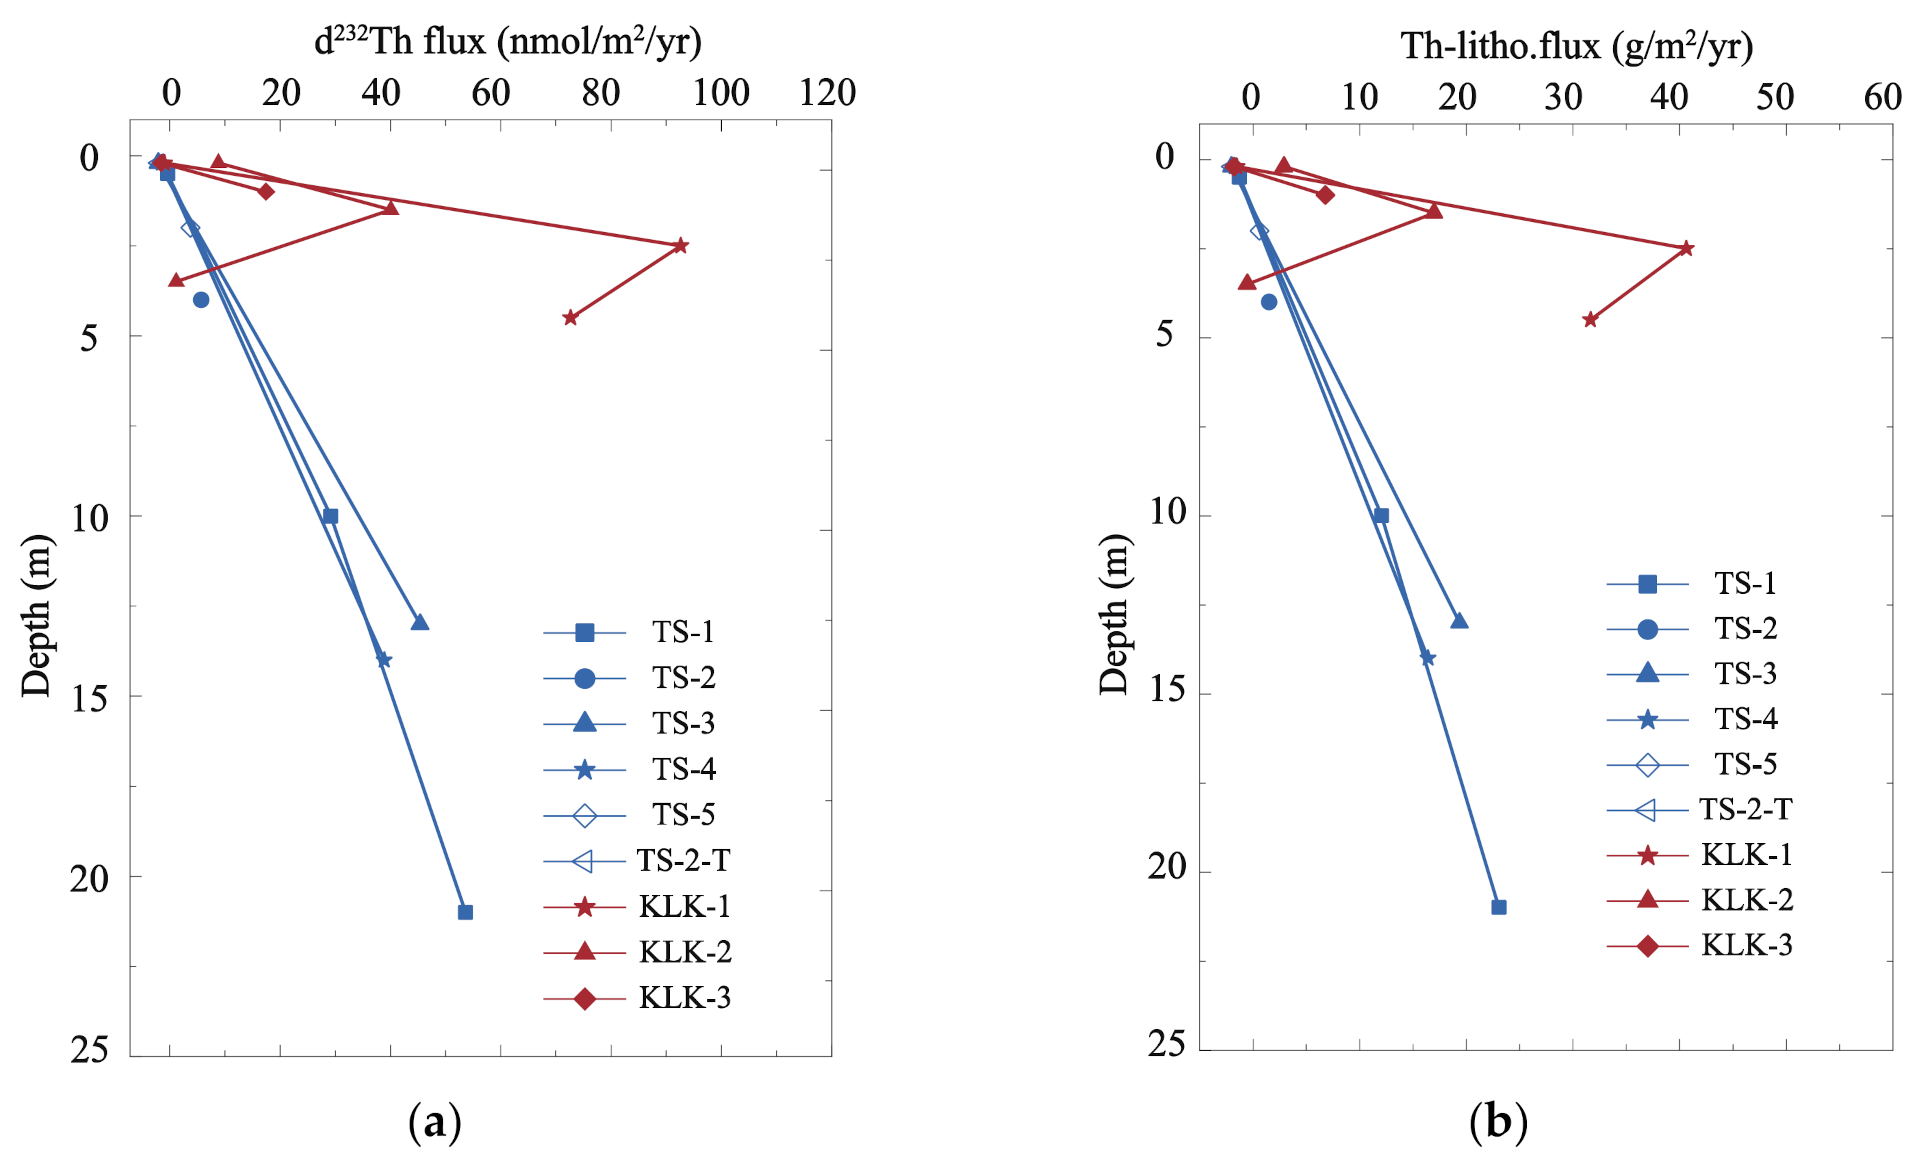
4.2.2. The Depth Trends of Dissolved 232Th Flux and Lithogenic Flux in Lake Water
4.2.3. Seasonal Changes in Dissolved 232Th Flux and Lithogenic Flux in Lake Water
4.3. Contribution of Recharging River and Atmospheric Dust to 232Th Fluxes in Lake Water Column
5. Conclusions
Author Contributions
Funding
Data Availability Statement
Acknowledgments
Conflicts of Interest
References
- Rea, D.K. The paleoclimatic record provided by eolian deposition in the deep sea: The geologic history of wind. Rev. Geophys. 1994, 32, 159–195. [Google Scholar] [CrossRef] [Green Version]
- Martin, J.H.; Gordon, R.M. Northeast Pacific iron distributions in relation to phytoplankton productivity. Deep-Sea Res. 1988, 35, 177–196. [Google Scholar] [CrossRef]
- Jickells, T.D.; An, Z.S.; Andersen, K.K.; Baker, A.R.; Bergametti, G.; Brooks, N.; Cao, J.J.; Boyd, P.W.; Duce, R.A.; Hunter, K.A.; et al. Global iron connections between desert dust, ocean biogeochemistry, and climate. Science 2005, 308, 67–71. [Google Scholar] [CrossRef] [Green Version]
- Martin, J.H.; Fitzwater, S.E. Iron deficiency limits phytoplankton growth in the north-east Pacific subarctic. Nature 1988, 331, 341–343. [Google Scholar] [CrossRef]
- Duce, R.A.; Tindale, N.W. Atmospheric transport of iron and its deposition in the ocean. Limnol. Oceanogr. 1991, 36, 1715–1726. [Google Scholar] [CrossRef]
- Martin, J.H. Glacial-interglacial CO2 change: The Iron Hypothesis. Paleoceanography 1990, 5, 1–13. [Google Scholar] [CrossRef]
- Cruz, J.A.; McDermott, F.; Turrero, M.J.; Edwards, R.L.; Martin-Chivelet, J. Strong links between Saharan dust fluxes, monsoon strength, and North Atlantic climate during the last 5000 years. Sci. Adv. 2021, 7, eabe6102. [Google Scholar] [CrossRef]
- Mahowald, N.M.; Baker, A.R.; Bergametti, G.; Brooks, N.; Duce, R.A.; Jickells, T.D.; Kubilay, N.; Prospero, J.M.; Tegen, I. Atmospheric global dust cycle and iron inputs to the ocean. Glob. Biogeochem. Cycles 2005, 19, 1–15. [Google Scholar] [CrossRef]
- Measures, C.I.; Brown, E.T. Estimating dust input to the Atlantic Ocean using surface water Aluminium Concentrations. In The Impact of Desert Dust across the Mediterranean; Springer: Dordrecht, The Netherlands, 1996. [Google Scholar]
- Hsieh, Y.T.; Henderson, G.M.; Thomas, A.L. Combining seawater 232Th and 230Th concentrations to determine dust fluxes to the surface ocean. Earth Planet. Sci. Lett. 2011, 312, 280–290. [Google Scholar] [CrossRef]
- Ojovan, M.I.; Lee, W.E. Naturally Occurring Radionuclides. In An Introduction to Nuclear Waste Immobilisation; Ojovan, M.I., Lee, W.E., Eds.; Elsevier: Oxford, UK, 2014; pp. 31–39. [Google Scholar]
- Pérez-Tribouillier, H.; Noble, T.L.; Townsend, A.T.; Bowie, A.R.; Chase, Z. Quantifying lithogenic inputs to the southern ocean using long-lived Thorium isotopes. Front. Mar. Sci. 2020, 7, 207. [Google Scholar] [CrossRef] [Green Version]
- Bacon, M.P.; van der Loeff, M.M.R. Removal of thorium-234 by scavenging in the bottom nepheloid layer of the ocean. Earth Planet. Sci. Lett. 1989, 92, 157–164. [Google Scholar] [CrossRef]
- Clegg, S.L.; Whitfield, M. A generalized model for the scavenging of trace metals in the open ocea—I. Particle cycling. Deep Sea Res. 1990, 37, 809–832. [Google Scholar] [CrossRef]
- Clegg, S.L.; Whitfield, M. A generalized model for the scavenging of trace metals in the open ocean—II. Thorium scavenging. Deep Sea Res. 1991, 38, 91–120. [Google Scholar] [CrossRef]
- Dunne, J.P.; Murray, J.W.; Young, J.; Balistrieri, L.S.; Bishop, J. 234Th and particle cycling in the central equatorial Pacific. Deep Sea Res. Part II 1997, 44, 2049–2083. [Google Scholar] [CrossRef]
- Murray, J.W.; Downs, J.N.; Strom, S.; Wei, C.L.; Jannasch, H.W. Nutrient assimilation, export production and 234Th scavenging in the eastern equatorial Pacific. Deep Sea Res. 1989, 36, 1471–1489. [Google Scholar] [CrossRef]
- Buesseler, K.O. The decoupling of production and particle export in the surface ocean. Glob. Biogeochem. Cycles 1998, 12, 297–310. [Google Scholar] [CrossRef]
- Benitez-Nelson, C.; Buesseler, K.O.; Karl, D.M.; Andrews, J. A time-series study of particulate matter export in the North Pacific Subtropical Gyre based on 234Th: 238U disequilibrium. Deep Sea Res. 2001, 48, 2595–2611. [Google Scholar] [CrossRef]
- Moore, W.S. The thorium isotope content of ocean water. Earth Planet. Sci. Lett. 1981, 53, 419–426. [Google Scholar] [CrossRef]
- Anderson, R.F.; Fleisher, M.Q.; Biscaye, P.E.; Kumar, N.; Dittrich, B.; Kubik, P.; Suter, M. Anomalous boundary scavenging in the Middle Atlantic Bight: Evidence from 230Th, 231Pa, 10Be and 210Pb. Deep Sea Res. 1994, 41, 537–561. [Google Scholar] [CrossRef]
- Santschi, P.H.; Guo, L.; Walsh, I.D.; Quigley, M.S.; Baskaran, M. Boundary exchange and scavenging of radionuclides in continental margin waters of the Middle Atlantic Bight: Implications for organic carbon fluxes. Cont. Shelf Res. 1999, 19, 609–636. [Google Scholar] [CrossRef]
- Smoak, J.M.; Moore, W.S.; Thunell, R.C. Influence of boundary scavenging and sediment focusing on 234Th, 228Th and 210Pb fluxes in the Santa Barbara Basin. Estuar. Coast. Shelf Sci. 2000, 51, 373–384. [Google Scholar] [CrossRef]
- Yu, E.F.; Francois, R.; Bacon, M.P. Similar rates of modern and last-glacial ocean thermohaline circulation inferred from radiochemical data. Nature 1996, 379, 689–694. [Google Scholar] [CrossRef]
- Marchal, O.; François, R.; Stocker, T.F.; Joos, F. Ocean thermohaline circulation and sedimentary 231Pa/230Th ratio. Paleoceanography 2000, 15, 625–641. [Google Scholar] [CrossRef]
- Moran, S.B.; Shen, C.C.; Edmonds, H.N.; Weinstein, S.E.; Smith, J.N.; Edwards, R.L. Dissolved and particulate 231Pa and 230Th in the Atlantic Ocean: Constraints on intermediate/deep water age, boundary scavenging, and 231Pa/230Th fractionation. Earth Planet. Sci. Lett. 2002, 203, 999–1014. [Google Scholar] [CrossRef]
- Santschi, P.H.; Murray, J.W.; Baskaran, M.; Benitez-Nelson, C.R.; Guo, L.D.; Hung, C.C.; Lamborg, C.; Moran, S.B.; Passow, U.; Roy-Barman, M. Thorium speciation in seawater. Mar. Chem. 2006, 100, 250–268. [Google Scholar] [CrossRef] [Green Version]
- Bourdon, B.; Turner, S.; Dosseto, A. Dehydration and partial melting in subduction zones: Constraints from U-series disequilibria. J. Geophys. Res. 2003, 108, 2291. [Google Scholar] [CrossRef] [Green Version]
- Krishnaswami, S.; Cochran, J.K. Uranium-Thorium series radionuclides in ocean profiles. Encycl. Ocean Sci. 2016, 1, 377–391. [Google Scholar]
- Krishnaswami, S.; Cochran, J.K. Radioactivity in the Environment; Elsevier: Amsterdam, The Netherlands, 2008. [Google Scholar]
- Zhang, P.; Cheng, H.; Liu, W.G.; Mo, L.T.; Li, X.Z.; Ning, Y.F.; Ji, M.; Zong, B.Y.; Zhao, C. Geochemical and isotopic (U, Th) variations in lake waters in the Qinghai Lake Basin, Northeast Qinghai-Tibet Plateau, China: Origin and paleoenvironmental implications. Arab. J. Geosci. 2019, 12, 92. [Google Scholar] [CrossRef]
- Costa, K.; McManus, J. Efficacy of 230Th normalization in sediments from the Juan de Fuca Ridge, northeast Pacific Ocean. Geochim. Cosmochim. Acta 2017, 197, 215–225. [Google Scholar] [CrossRef] [Green Version]
- Broecker, W.S.; Kaufman, A.; Trier, R.M. The residence time of thorium in surface sea water and its implications regarding the rate of reactive pollutants. Earth Planet. Sci. Lett. 1973, 20, 35–44. [Google Scholar] [CrossRef]
- Scholten, J.C.; Loeff, M.; Michel, A. Distribution of 230Th and 231Pa in the water column in relation to the ventilation of the deep Arctic basins. Deep Sea Res. Part II Top. Stud. Oceanogr. 1995, 42, 1519–1531. [Google Scholar] [CrossRef]
- Chase, Z.; Anderson, R.F.; Fleisher, M.Q.; Kubik, P.W. Scavenging of 230Th, 231Pa and 10Be in the Southern Ocean (SW Pacific sector): The importance of particle flux, particle composition and advection. Deep Sea Res. Part II Top. Stud. Oceanogr. 2003, 50, 739–768. [Google Scholar] [CrossRef]
- Hayes, C.T.; Anderson, R.F.; Fleisher, M.Q.; Serno, S.; Winckler, G.; Gersonde, R. Quantifying lithogenic inputs to the North Pacific Ocean using the long-lived thorium isotopes. Earth Planet. Sci. Lett. 2013, 383, 16–25. [Google Scholar] [CrossRef] [Green Version]
- Hayes, C.T.; Rosen, J.; Mcgee, D.; Boyle, E.A. Thorium distributions in high- and low-dust regions and the significance for iron supply. Glob. Biogeochem. Cycles 2017, 31, 328–347. [Google Scholar] [CrossRef]
- Hayes, C.T.; Fitzsimmons, J.N.; Boyle, E.A.; McGee, D.; Anderson, R.F.; Weisend, R.; Morton, P.L. Thorium isotopes tracing the iron cycle at the Hawaii Ocean Time-series Station ALOHA. Geochim. Cosmochim. Acta 2015, 169, 1–16. [Google Scholar] [CrossRef] [Green Version]
- Deng, F.F.; Thomas, A.L.; Rijkenberg, M.J.A.; Henderson, G.M. Controls on seawater 231Pa, 230Th and 232Th concentrations along the flow paths of deep waters in the Southwest Atlantic. Earth Planet. Sci. Lett. 2014, 390, 93–102. [Google Scholar] [CrossRef]
- Zhang, P.; Pei, X.Z.; Cao, C.Y.; Chen, C.; Gong, Z.Q.; Li, X.R.; Pang, J.Y.; Liang, L.H.; Li, X.Z.; Ning, Y.F.; et al. A novel tracer technique to quantify the lithogenic input fflux of trace elements to Qinghai Lake. Front. Earth Sci. 2022, 10, 866314. [Google Scholar] [CrossRef]
- Zhao, Y.; Yu, Z.; Liu, X.; Zhao, C.; Chen, F.; Zhang, K. Late Holocene vegetation and climate oscillations in the Qaidam Basin of the northeastern Tibetan Plateau. Quat. Res. 2010, 73, 59–69. [Google Scholar] [CrossRef]
- Lister, G.S.; Kelts, K.; Chen, K.Z.; Yu, J.Q.; Niessen, F. Lake Qinghai, China: Closed-basin like levels and the oxygen isotope record for ostracoda since the latest Pleistocene. Palaeogeogr. Palaeoclimatol. Palaeoecol. 1991, 84, 141–162. [Google Scholar] [CrossRef]
- Henderson, A.; Holmes, J.A. Palaeolimnological evidence for environmental change over the past millennium from Lake Qinghai sediments: A review and future research prospective. Quat. Int. 2009, 194, 134–147. [Google Scholar] [CrossRef]
- Zhao, Y.; Yu, Z.; Chen, F.; Liu, X.; Ito, E. Sensitive response of desert vegetation to moisture change based on a near-annual resolution pollen record from Gahai Lake in the Qaidam Basin, northwest China. Glob. Planet. Chang. 2008, 62, 107–114. [Google Scholar] [CrossRef]
- Dietze, E.; Wünnemann, B.; Hartmann, K.; Diekmann, B.; Jin, H.; Stauch, G.; Yang, S.; Lehmkuhl, F. Early to mid-Holocene lake high-stand sediments at Lake Donggi Cona, northeastern Tibetan Plateau, China. Quat. Res. 2013, 79, 325–336. [Google Scholar] [CrossRef] [Green Version]
- Rao, Z.; Jia, G.; Qiang, M.; Zhao, Y. Assessment of the difference between mid- and long chain compound specific δDn-alkanes values in lacustrine sediments as a paleoclimatic indicator. Org. Geochem. 2014, 76, 104–117. [Google Scholar] [CrossRef]
- Wang, S.P.; Jia, G.D.; Zhao, Y.; Rao, Z.G. Plant wax n-alkanes record of the Holocene paleoclimatic changes from a core sediment of Hurleg lake in the Qaidam Basin. Quat. Sci. 2010, 30, 1098–1104. (In Chinese) [Google Scholar]
- Zhao, Y.; Yu, Z.; Chen, F.; Ito, E.; Zhao, C. Holocene vegetation and climate history at Hurleg Lake in the Qaidam Basin, northwest China. Rev. Palaeobot. Palynol. 2007, 145, 275–288. [Google Scholar] [CrossRef]
- Chen, Z.Y.; Dong, Z.B.; Wang, Q.C.; Chong, Y.E.; Liu, F. Characteristics of wind regime and sand drift potential in Qaidam Basin of China. J. Desert Res. 2020, 40, 195–203. (In Chinese) [Google Scholar]
- Bao, F.; Dong, Z.B.; Zhang, Z.C. Wind regime in the Qaidam Basin desert. J. Desert Res. 2015, 35, 549–554. (In Chinese) [Google Scholar]
- Wang, Y.H.; Liu, Y.X.; Liu, H.H.; Liu, X.L.; Lu, Z.K.; Li, J. Chemical composition and heavy metal distribution in surface water of typical inland rivers in Qinghai. Chin. J. Ecol. 2018, 37, 734–742. (In Chinese) [Google Scholar]
- Yi, X.; Yang, D.; Xu, W. China Regional Hydrogeology Survey Report–Toson Lake Map (J–47–[25] 1:200,000); Qaidam Integrative Geology Survey: Golmud, Qinghai, China, 1992. (In Chinese) [Google Scholar]
- Zhao, C.; Yu, Z.; Zhao, Y.; Ito, E. Possible orographic and solar controls of Late Holocene centennial-scale moisture oscillations in the northeastern Tibetan Plateau. Geophys. Res. Lett. 2009, 36, 1–6. [Google Scholar] [CrossRef] [Green Version]
- Long, Q.F.; Feng, X.Y.; Liu, J.; Zhang, X.; Shen, G.P.; Zhu, D.R. Microbial diversity of Keluke-Tuosu Lake wetland reserve in Qinghai-Tibet Plateau. Earth Environ. 2017, 45, 399–407. (In Chinese) [Google Scholar]
- Wang, S.M.; Dou, H.S. Lakes in China; Science Press: Beijing, China, 1998. (In Chinese) [Google Scholar]
- Fu, X.; Zhang, J.W.; Wang, L.; Cui, X.L.; Ma, X.Y.; Zhang, Y.Z. Rencent human impacts on sedimentary record: A case from Lake Toson. Quat. Sci. 2016, 36, 1456–1465. (In Chinese) [Google Scholar]
- Cheng, H.; Edwards, R.L.; Hoff, J.; Gallup, C.D.; Richards, D.A.; Asmerom, Y. The half-lives of uranium-234 and thorium-230. Chem. Geol. 2000, 169, 17–33. [Google Scholar] [CrossRef]
- Cheng, H.; Edwards, R.L.; Shen, C.C.; Polyak, V.J.; Asmerom, Y.; Woodhead, J.; Hellstrom, J.; Wang, Y.J.; Kong, X.G.; Spötl, C.; et al. Improvements in 230Th dating, 230Th and 234U half-life values, and U–Th isotopic measurements by multi-collector inductively coupled plasma mass spectrometry. Earth Planet. Sci. Lett. 2013, 371–372, 82–91. [Google Scholar] [CrossRef]
- Shen, C.C.; Edwards, R.L.; Cheng, H.; Dorale, J.A.; Thomas, R.B.; Moran, S.B.; Weinstein, S.E.; Edmonds, H.N. Uranium and thorium isotopic and concentration measurements by magnetic sector inductively coupled plasma mass spectrometry. Chem. Geol. 2002, 185, 165–178. [Google Scholar] [CrossRef]
- Shen, C.C.; Wu, C.C.; Cheng, H.; Edwards, R.L.; Hsieh, Y.T.; Gallet, S.; Chang, C.C.; Li, T.Y.; Lam, D.D.; Kano, A.; et al. High-precision and high-resolution carbonate 230Th dating by MC-ICP-MS with SEM protocols. Geochim. Cosmochim. Acta 2012, 99, 71–86. [Google Scholar] [CrossRef]
- Roy-Barman, M.; LemaîTre, C.; Ayrault, S.; Jeandel, C.; Souhaut, M.; Miquel, J.C. The influence of particle composition on Thorium scavenging in the Mediterranean Sea. Earth Planet. Sci. Lett. 2009, 286, 526–534. [Google Scholar] [CrossRef]
- Ankney, M.; Bacon, C.; Valley, J.; Beard, B.; Johnson, C. Oxygen and U-Th isotopes and the timescales of hydrothermal exchange and melting in granitoid wall rocks at Mount Mazama, Crater Lake, Oregon. Geochim. Cosmochim. Acta 2017, 213, 137–154. [Google Scholar] [CrossRef]
- Edmonds, H.N.; Moran, S.B.; Hai, C.; Edwards, R.L. 230Th and 231Pa in the Arctic Ocean: Implications for particle fluxes and basin-scale Th/Pa fractionation. Earth Planet. Sci. Lett. 2004, 227, 155–167. [Google Scholar] [CrossRef]
- Hayes, C.T.; Black, E.E.; Anderson, R.F.; Baskaran, M.; Buesseler, K.O.; Charette, M.A.; Cheng, H.; Cochran, J.K.; Edwards, R.L.; Fitzgerald, P.; et al. Flux of particulate elements in the North Atlantic Ocean constrained by multiple radionuclides. Glob. Biogeochem. Cycles 2018, 32, 1738–1758. [Google Scholar] [CrossRef]
- Wang, X.Q.; Zhou, J.; Xu, S.F.; Chi, Q.H.; Nie, L.S.; Zhang, B.M.; Yao, W.S.; Wang, W.; Liu, H.L.; Liu, D.S.; et al. China soil geochemical baselines networks: Data characteristics. Geol. China 2016, 43, 12. (In Chinese) [Google Scholar]
- Cochran, J.K.; Hirschberg, D.J.; Livingston, H.D.; Buesseler, K.O.; Robert, M.K. Natural and anthropogenic radionuclide distributions in the Nansen Basin, Arctic ocean: Scavenging rates and circulation timescales. Top. Stud. Oceanogr. 1995, 42, 1495–1517. [Google Scholar] [CrossRef]
- Edmonds, H.N.; Moran, S.B.; Hoff, J.A.; Smith, J.N.; Edwards, R.L. Protactinium-231 and thorium-230 abundances and high scavenging rates in the western arctic ocean. Science 1998, 280, 405–407. [Google Scholar] [CrossRef] [PubMed]
- Huh, C.A.; Bacon, M.P. Thorium-232 in the eastern Caribbean Sea. Nature 1985, 316, 718–721. [Google Scholar] [CrossRef]
- Moore, W.S.; Sackett, W.M. Uranium and thorium series inequilibrium in sea water. J. Geophys. Res. 1964, 69, 5401–5405. [Google Scholar] [CrossRef]
- Zhao, C.; Zhang, P.; Li, X.Z.; Ning, Y.F.; Tan, L.C.; Edwards, R.L.; Yao, X.N.; Cheng, H. Distribution characteristics and influencing factors of uranium isotopes in saline lake waters in the northeast of Qaidam Basin. Minerals 2020, 10, 74. [Google Scholar] [CrossRef] [Green Version]
- Kretschmer, S.; Geibert, W.; Loeff, M.; Mollenhauer, G. Grain size effects on 230Thxs inventories in opal-rich and carbonate-rich marine sediments. Earth Planet. Sci. Lett. 2010, 294, 131–142. [Google Scholar] [CrossRef] [Green Version]
- Chase, Z.; Anderson, R.F.; Fleisher, M.Q.; Kubik, P. The influence of particle composition and particle flux on scavenging of Th, Pa and Be in the ocean. Earth Planet. Sci. Lett. 2002, 204, 215–229. [Google Scholar] [CrossRef]
- Honjo, S.; Francois, R.; Manganini, S.; Dymond, J.; Collier, R. Particle fluxes to the interior of the Southern Ocean in the Western Pacific sector along 170-degree W. Deep Sea Res. II 2000, 47, 3521–3548. [Google Scholar] [CrossRef]
- Measures, C.I.; Vink, S. On the use of dissolved aluminum in surface waters to estimate dust deposition to the ocean. Glob. Biogeochem. Cycles 2000, 14, 317–327. [Google Scholar] [CrossRef]
- Chase, Z.; Anderson, R.F.; Fleisher, M.Q.; Kubik, P.W. Accumulation of biogenic and lithogenic material in the Pacific sector of the Southern Ocean during the past 40,000 years. Deep Sea Res. Part II 2003, 50, 799–832. [Google Scholar] [CrossRef]


| Location | Sample No. | Depth (m) | Latitude (°N) and Longitude (°E) | Date | Batch |
|---|---|---|---|---|---|
| Tuosu Lake | TS-1-1 | 0.5 | 37°08′40″, 96°57′24″ | 9 December 2017 | 1 |
| TS-1-2 | 10 | 9 December 2017 | |||
| TS-1-3 | 21 | 9 December 2017 | |||
| TS-2 | 4 | 37°09′11″, 96°57′49″ | 9 December 2017 | ||
| TS-3-1 | 0.2 | 37°09′05″, 96°58′18″ | 9 December 2017 | ||
| TS-3-2 | 13 | 9 December 2017 | |||
| TS-4-1 | 0.2 | 37°09′11″, 96°58′58″ | 9 December 2017 | ||
| TS-4-2 | 14 | 9 December 2017 | |||
| TS-5 | 2 | 37°09′18″, 96°59′31″ | 9 December 2017 | ||
| TS-1-T | 0.2 | 37°10′21″, 96°58′35″ | 16 June 2018 | 2 | |
| TS-1-M | 8 | 16 June 2018 | |||
| TS-2-T | 0.2 | 37°10′27″, 96°58′59″ | 16 June 2018 | ||
| TS-2-M | 4.5 | 16 June 2018 | |||
| TS-3-T | 0.2 | 37°10′36″, 96°58′57″ | 16 June 2018 | ||
| TS-3-M | 3 | 16 June 2018 | |||
| TS-E-1 | 0.2 | 37°12′29″, 96°56′46″ | 22 July 2019 | 3 | |
| TS-12-F | 0.2 | 37°10′09″, 96°59′59″ | 27 February 2021 | 4 | |
| Keluke Lake | KLK 1-T | 0.2 | 37°17′24″, 96°53′34″ | 16 June 2018 | 2 |
| KLK 1-M | 2.5 | 16 June 2018 | |||
| KLK 1-B | 4.5 | 16 June 2018 | |||
| KLK 2-T | 0.2 | 37°17′55″, 96°53′42″ | 16 June 2018 | ||
| KLK 2-M | 1.5 | 16 June 2018 | |||
| KLK 2-B | 3.5 | 16 June 2018 | |||
| KLK 3-T | 0.2 | 37°18′27″, 96°53′55″ | 16 June 2018 | ||
| KLK 3-M | 1 | 16 June 2018 | |||
| KLK-W | 0.2 | 37°17′1″, 96°51′35″ | 22 July 2019 | 3 | |
| KLK-N | 0.2 | 37°18′56″, 96°54′7″ | 22 July 2019 | ||
| KLK-10-F | 0.2 | 37°17′03″, 96°51′42″ | 27 February 2021 | 4 | |
| Bayin River | BY-1 | 0.2 | 37°14′9″, 97°1′23″ | 22 July 2019 | 3 |
| BY-2 | 0.2 | 37°22′37″, 97°26′44″ | 22 July 2019 | ||
| BY-3 | 0.2 | 37°26′33″, 97°44′19″ | 22 July 2019 | ||
| BY-4 | 0.2 | 37°22′30″, 97°21′43″ | 22 July 2019 | ||
| KLK–TS River | KLK-TS-R | 0.2 | 37°13′11″, 96°49′44″ | 22 July 2019 | 3 |
| Location | Sample No. | Depth | d234U | d232Th | d230Th | d230Thxs | Date |
|---|---|---|---|---|---|---|---|
| (m) | (measured) | (pmol/kg) | (μBq/kg) | (μBq/kg) | |||
| Tuosu Lake | TS-1-1 | 0.5 | 464.0 | 8.962 | 10.55 | 4.29 | 9 December 2017 |
| TS-3-1 | 0.2 | 463.2 | 0.640 | 11.97 | 11.52 | 9 December 2017 | |
| TS-4-1 | 0.2 | 463.8 | 9.464 | 11.79 | 5.17 | 9 December 2017 | |
| TS-1-T | 0.2 | 461.9 | 0.042 | - | - | 16 June 2018 | |
| TS-2-T | 0.2 | 461.6 | 0.019 | 0.19 | 0.17 | 16 June 2018 | |
| TS-3-T | 0.2 | 460.3 | 0.045 | - | - | 16 June 2018 | |
| TS-E-1 | 0.2 | 457.3 | 7.926 | 9.84 | 4.30 | 22 July 2019 | |
| TS-1-2 | 10 | 462.1 | 9.942 | 12.00 | 5.06 | 9 December 2017 | |
| TS-1-3 | 21 | 461.8 | 10.158 | 13.18 | 6.08 | 9 December 2017 | |
| TS-2 | 4 | 462.2 | 8.437 | 12.77 | 6.87 | 9 December 2017 | |
| TS-3-2 | 13 | 460.4 | 11.423 | 12.94 | 4.95 | 9 December 2017 | |
| TS-4-2 | 14 | 460.4 | 11.710 | 14.53 | 6.34 | 9 December 2017 | |
| TS-5 | 2 | 461.2 | 10.520 | 13.06 | 5.71 | 9 December 2017 | |
| TS-1-M | 8 | 462.0 | 0.045 | - | - | 16 June 2018 | |
| TS-2-M | 4.5 | 461.1 | 0.022 | - | - | 16 June 2018 | |
| TS-3-M | 3 | 462.1 | 0.057 | - | - | 16 June 2018 | |
| Keluke Lake | KLK 1-T | 0.2 | 505.5 | 1.336 | 1.34 | 0.41 | 16 June 2018 |
| KLK 2-T | 0.2 | 503.9 | 1.126 | 0.82 | 0.04 | 16 June 2018 | |
| KLK 3-T | 0.2 | 501.7 | 1.167 | 1.54 | 0.73 | 16 June 2018 | |
| KLK-W | 0.2 | 476.4 | 1.699 | 2.96 | 1.78 | 22 July 2019 | |
| KLK-N | 0.2 | 451.0 | 2.551 | 1.92 | 0.13 | 22 July 2019 | |
| KLK 1-M | 2.5 | 506.4 | 0.975 | 0.61 | 0.04 | 16 June 2018 | |
| KLK 1-B | 4.5 | 503.4 | 1.228 | 0.98 | 0.13 | 16 June 2018 | |
| KLK 2-M | 1.5 | 505.9 | 1.552 | 1.18 | 0.09 | 16 June 2018 | |
| KLK 2-B | 3.5 | 503.6 | 0.442 | 1.11 | 0.80 | 16 June 2018 | |
| KLK 3-M | 1 | 504.0 | 0.864 | 0.68 | 0.07 | 16 June 2018 | |
| Bayin River | BY-1 | 0.2 | 464.4 | 4.771 | 4.43 | 1.09 | 22 July 2019 |
| BY-2 | 0.2 | 401.9 | 1.583 | 0.86 | 0.31 | 22 July 2019 | |
| BY-3 | 0.2 | 392.1 | 3.181 | 1.60 | 0.49 | 22 July 2019 | |
| BY-4 | 0.2 | 408.8 | 0.599 | 0.02 | - | 22 July 2019 | |
| KLK-TS River | KLK-TS-R | 0.2 | 482.1 | 1.078 | 0.88 | 0.13 | 22 July 2019 |
| Location | Sample No. | Depth | d234U | d232Th | d230Th | d230Thxs | Latitude (°N) and Longitude (°E) | Date |
|---|---|---|---|---|---|---|---|---|
| (m) | (measured) | (pmol/kg) | (μBq/kg) | (μBq/kg) | ||||
| Tuosu Lake | TS-4-1 | 0.2 | 463.8 | 9.464 | 11.79 | 5.17 | 37°09′11″, 96°58′58″ | 9 December 2017 |
| TS-2-T | 0.2 | 461.6 | 0.019 | 0.19 | 0.17 | 37°10′27″, 96°58′59″ | 16 June 2018 | |
| TS-E-1 | 0.2 | 457.3 | 7.926 | 9.84 | 4.30 | 37°12′29″, 96°56′46″ | 22 July 2019 | |
| TS-12-F | 0.2 | 472.2 | 86.286 | 69.07 | 8.77 | 37°10′09″, 96°59′59″ | 27 February 2021 | |
| Keluke Lake | KLK 1-T | 0.2 | 505.5 | 1.336 | 1.34 | 0.41 | 37°17′24″, 96°53′34″ | 16 June 2018 |
| KLK-W | 0.2 | 476.4 | 1.699 | 2.96 | 1.78 | 37°17′1″, 96°51′35″ | 22 July 2019 | |
| KLK-10-F | 0.2 | 504.3 | 18.432 | 13.59 | 0.71 | 37°17′03″, 96°51′42″ | 27 February 2021 |
| Location | Sample No. | Depth | Density | d232Th | τTh | d232Th flux | Th-litho.flux STh = 5% | Th-litho.flux STh = 10% | Date |
|---|---|---|---|---|---|---|---|---|---|
| (m) | (kg/m3) | (pmol/kg) | (years) | (nmol/m2/yr) | (g/m2/yr) | (g/m2/yr) | |||
| Tuosu Lake | TS-1-1 | 0.5 | 1021 | 8.962 | 2.80 | 1.634 | 0.722 | 0.361 | 9 December 2017 |
| TS-3-1 | 0.2 | 0.640 | 7.54 | 0.017 | 0.008 | 0.004 | 9 December 2017 | ||
| TS-4-1 | 0.2 | 9.464 | 3.38 | 0.572 | 0.253 | 0.126 | 9 December 2017 | ||
| TS-1-T | 0.2 | 0.042 | - | - | - | - | 16 June 2018 | ||
| TS-2-T | 0.2 | 0.019 | 0.11 | 0.034 | 0.015 | 0.008 | 16 June 2018 | ||
| TS-3-T | 0.2 | 0.045 | - | - | - | - | 16 June 2018 | ||
| TS-E-1 | 0.2 | 7.926 | 2.85 | 0.568 | 0.251 | 0.125 | 22 July 2019 | ||
| TS-1-2 | 10 | 1021 | 9.942 | 3.31 | 30.632 | 13.536 | 6.768 | 9 December 2017 | |
| TS-1-3 | 21 | 10.158 | 3.99 | 54.571 | 24.115 | 12.057 | 9 December 2017 | ||
| TS-2 | 4 | 8.437 | 4.50 | 7.650 | 3.380 | 1.690 | 9 December 2017 | ||
| TS-3-2 | 13 | 11.423 | 3.26 | 46.512 | 20.554 | 10.277 | 9 December 2017 | ||
| TS-4-2 | 14 | 11.710 | 4.17 | 40.119 | 17.729 | 8.864 | 9 December 2017 | ||
| TS-5 | 2 | 10.520 | 3.75 | 5.727 | 2.531 | 1.265 | 9 December 2017 | ||
| TS-1-M | 8 | 0.045 | - | - | - | - | 16 June 2018 | ||
| TS-2-M | 4.5 | 0.022 | - | - | - | - | 16 June 2018 | ||
| TS-3-M | 3 | 0.057 | - | - | - | - | 16 June 2018 | ||
| Keluke Lake | KLK 1-T | 0.2 | 1000 | 1.336 | 0.24 | 1.099 | 0.486 | 0.243 | 16 June 2018 |
| KLK 2-T | 0.2 | 1.126 | 0.02 | 10.695 | 4.726 | 2.363 | 16 June 2018 | ||
| KLK 3-T | 0.2 | 1.167 | 0.44 | 0.532 | 0.235 | 0.117 | 16 June 2018 | ||
| KLK-W | 0.2 | 1.699 | 1.13 | 0.301 | 0.133 | 0.066 | 22 July 2019 | ||
| KLK-N | 0.2 | 2.551 | 0.09 | 5.747 | 2.539 | 1.270 | 22 July 2019 | ||
| KLK 1-M | 2.5 | 1000 | 0.975 | 0.03 | 92.787 | 41.003 | 20.501 | 16 June 2018 | |
| KLK 1-B | 4.5 | 1.228 | 0.08 | 73.243 | 32.366 | 16.183 | 16 June 2018 | ||
| KLK 2-M | 1.5 | 1.552 | 0.06 | 41.303 | 18.252 | 9.126 | 16 June 2018 | ||
| KLK 2-B | 3.5 | 0.442 | 0.48 | 3.218 | 1.422 | 0.711 | 16 June 2018 | ||
| KLK 3-M | 1 | 0.864 | 0.05 | 19.158 | 8.466 | 4.233 | 16 June 2018 |
| Sample | Particle | Water | ||
|---|---|---|---|---|
| 232Th(pg/g) | 230Th(fg/g) | 232Th(pg/g) | 230Th(ag/g) | |
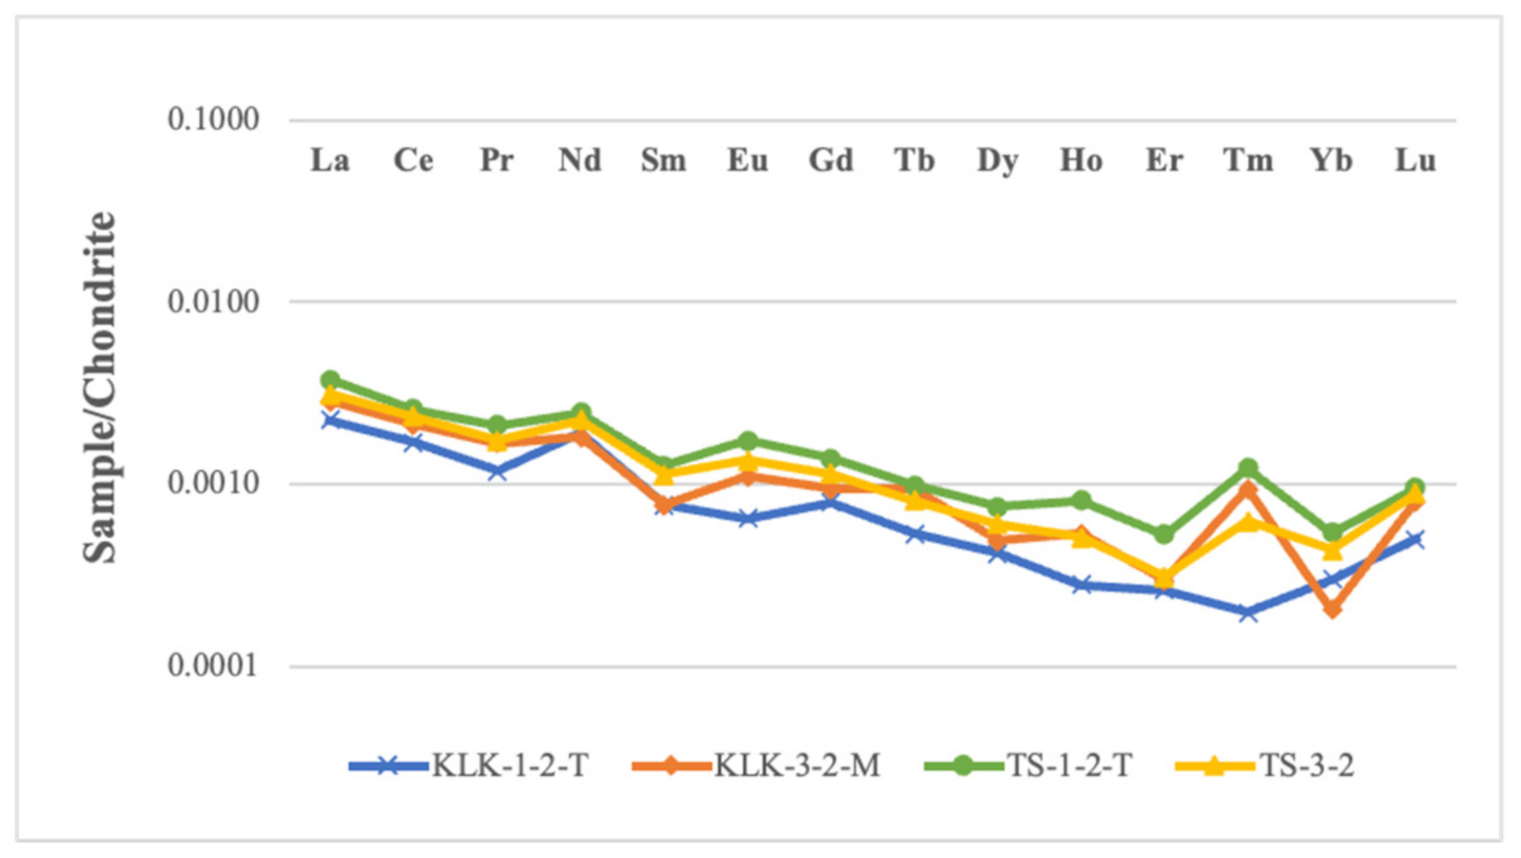
| KLK-1-2-T | 5.312 | 0.026 | 0.310 | 2.120 |
| KLK-3-2-M | 5.607 | 0.027 | 0.200 | 1.242 |
| TS-1-2-T | 7.058 | 0.033 | 9.693 | 0.349 |
| TS-3-2 | 8.411 | 0.037 | 11.835 | 0.290 |
| Location | Sample No. | Depth | Density | d232Th | τTh | d232Th flux | Th-litho.flux STh = 5% | Th-litho.flux STh = 10% | Date |
|---|---|---|---|---|---|---|---|---|---|
| (m) | (kg/m3) | (pmol/kg) | (years) | (nmol/m2/yr) | (g/m2/yr) | (g/m2/yr) | |||
| Tuosu Lake | TS-4-1 | 0.2 | 1021 | 9.464 | 3.38 | 0.572 | 0.253 | 0.126 | 9 December 2017 |
| TS-2-T | 0.2 | 0.019 | 0.11 | 0.034 | 0.015 | 0.008 | 16 June 2018 | ||
| TS-E-1 | 0.2 | 7.926 | 2.85 | 0.568 | 0.251 | 0.125 | 22 July 2019 | ||
| TS-12-F | 0.2 | 86.286 | 5.62 | 3.133 | 1.384 | 0.692 | 27 February 2021 | ||
| Keluke Lake | KLK 1-T | 0.2 | 1000 | 1.336 | 0.24 | 1.099 | 0.486 | 0.243 | 16 June 2018 |
| KLK-W | 0.2 | 1.699 | 1.13 | 0.301 | 0.133 | 0.066 | 22 July 2019 | ||
| KLK-10-F | 0.2 | 18.432 | 0.42 | 8.690 | 3.840 | 1.920 | 27 February 2021 |
Publisher’s Note: MDPI stays neutral with regard to jurisdictional claims in published maps and institutional affiliations. |
© 2022 by the authors. Licensee MDPI, Basel, Switzerland. This article is an open access article distributed under the terms and conditions of the Creative Commons Attribution (CC BY) license (https://creativecommons.org/licenses/by/4.0/).
Share and Cite
Cao, C.; Chen, C.; Zhang, P.; Cui, J.; Pei, X.; Li, X.; Cheng, T.; Liang, L.; Edwards, R.L. Using Long-Lived Thorium Isotopes to Quantify the Lithogenic Inputs to the Lakes in Qaidam Basin, China. Minerals 2022, 12, 931. https://0-doi-org.brum.beds.ac.uk/10.3390/min12080931
Cao C, Chen C, Zhang P, Cui J, Pei X, Li X, Cheng T, Liang L, Edwards RL. Using Long-Lived Thorium Isotopes to Quantify the Lithogenic Inputs to the Lakes in Qaidam Basin, China. Minerals. 2022; 12(8):931. https://0-doi-org.brum.beds.ac.uk/10.3390/min12080931
Chicago/Turabian StyleCao, Chenyang, Chi Chen, Pu Zhang, Jiahui Cui, Xuezheng Pei, Xiangzhong Li, Tiane Cheng, Lihua Liang, and R. Lawrence Edwards. 2022. "Using Long-Lived Thorium Isotopes to Quantify the Lithogenic Inputs to the Lakes in Qaidam Basin, China" Minerals 12, no. 8: 931. https://0-doi-org.brum.beds.ac.uk/10.3390/min12080931