Article

Produced Gas and Condensate Geochemistry of the Marcellus Formation in the Appalachian Basin: Insights into Petroleum Maturity, Migration, and Alteration in an Unconventional Shale Reservoir

by
Christopher D. Laughrey
Stratum Reservoir, Geochemical Interpretive Services, Evergreen, CO 80439, USA
Submission received: 16 June 2022 / Revised: 14 September 2022 / Accepted: 15 September 2022 / Published: 27 September 2022
(This article belongs to the Special Issue Shale and Tight Reservoir Characterization and Resource Assessment)

Abstract

:
The Middle Devonian Marcellus Formation of North America is the most prolific hydrocarbon play in the Appalachian basin, the second largest producer of natural gas in the United States, and one of the most productive gas fields in the world. Regional differences in Marcellus fluid chemistry reflect variations in thermal maturity, migration, and hydrocarbon alteration. These differences define specific wet gas/condensate and dry gas production in the basin. Marcellus gases co-produced with condensate in southwest Pennsylvania and northwest West Virginia are mixtures of residual primary-associated gases generated in the late oil window and postmature secondary hydrocarbons generated from oil cracking in the wet gas window. Correlation of API gravity and C7 expulsion temperatures, high heptane and isoheptane ratios, and the gas geochemical data confirm that the Marcellus condensates formed through oil cracking. Respective low toluene/nC7 and high nC7/methylcyclohexane ratios indicate selective depletion of low-boiling point aromatics and cyclic light saturates in all samples, suggesting that water washing and gas stripping altered the fluids. These alterations may be related to deep migration of hot basinal brines. Dry Marcellus gases produced in northeast Pennsylvania and northcentral West Virginia are mixtures of overmature methane largely cracked from refractory kerogen and ethane and propane cracked from light oil and wet gas. Carbon and hydrogen isotope distributions are interpreted to indicate (1) mixing of hydrocarbons of different thermal maturities, (2) high temperature Rayleigh fractionation of wet gas during redox reactions with transition metals and formation water, (3) isotope exchange between methane and water, and, possibly, (4) thermodynamic equilibrium conditions within the reservoirs. Evidence for thermodynamic equilibrium in the dry gases includes measured molecular proportions (C1/(C1 − C5) = 0.96 to 0.985) and δ13C1 values significantly greater than δ13CKEROGEN. Noble gas systematics support the interpretation of hydrocarbon–formation water interactions, constrain the high thermal maturity of the hydrocarbon fluids, and provide a method of quantifying gas retention versus expulsion in the reservoirs.

1. Introduction

The Middle Devonian Marcellus Formation in the Appalachian basin of North America is an iconic stratigraphic interval. It is the most prolific hydrocarbon play in the basin, the second largest producer of natural gas in the United States, and, in combination with the Ordovician Utica shale, the largest source of natural gas and natural gas liquids (NGL) in the world [1,2]. Proven natural gas reserves for the Marcellus Formation total more than 129 tcf and proven lease condensate reserves total 247 million barrels [3]. The Marcellus is also a prospective CO2 sequestration reservoir and a potential seal for Carbon Capture and Underground Storage (CCUS) and NGL storage [4,5]. It is a potential source of critical minerals [6]. In contrast to its natural resource utility, the Marcellus is a potential source of stray gas contamination in ground water supplies and building structures as well as fugitive emissions of atmospheric methane [7,8,9,10].
Several critical geologic factors define the Marcellus play in the Appalachian basin. These factors are thermal maturity, pressure, thickness, porosity and permeability, gas-in-place, natural fracturing, mineralogy, depth, structural setting, rock mechanics, target landing issues, diagenesis, and hydrocarbon alteration [11,12,13]. Thermal maturity appears to define specific wet gas and dry gas production in the Appalachian basin [1] (Figure 1). Condensate production occurs in the western part of the basin where wet gases with approximately 1400 MMBtu/Mcf are recovered from reservoir depths of −1067 to −1524 m (−3500 to −5000 ft.) subsea with reported vitrinite reflectance (VRo) of 1.0 to 2.8%. Dry gas with 1000 to 1080 MMBtu/Mcf is produced from reservoir depths of approximately −914 to −1981 m (−3000 to −6500 ft.) subsea with reported VRo from 2.0 to >3.0%.
In this contribution, integrated from twenty-four years of study of Marcellus natural gas/condensate chemical and isotope data, I argue that regional differences in fluid chemistry reflect variations in thermal maturity, hydrocarbon alteration, and geological processes active in the petroleum system. These differences not only define specific wet gas and dry gas production in the basin BUT predict relative productivity as well. Marcellus Formation hydrocarbon composition, isotope, and noble gas geochemistry provide a quantitative methodology independent of rock data, choke management, and completion design for defining and mapping economic production limits. Noble gas systematics provide a method of quantifying hydrocarbon maturity and gas retention versus fluid expulsion or loss from the reservoirs. The data and geochemical trends documented in this report can also facilitate the identification of sources of stray gas contamination and provide fundamental baseline measurements for comparison with data derived from recent atmospheric measurements conducted to monitor fugitive emissions of atmospheric methane [7,8,9,10].

2. Geological Framework and Current Status of Marcellus Formation Research

The Appalachian basin and its foreland represent mountain building throughout most of the Paleozoic on the former eastern convergent margin of North America [14]. The Devonian Appalachian basin was a retroarc foreland basin that developed adjacent to the Acadian orogenic belt, a mountain chain built by oblique collision of the North American continental margin with Avalon terrane [14,15,16,17]. Crustal loading by the resultant fold and thrust belt caused subsidence of an elongate foreland basin which was mostly filled with siliciclastic sediments eroded from the uplifted orogen. Sediment supply from the uplifting and eroding Appalachian Mountains generally exceeded subsidence during the late Devonian Acadian and Pennsylvanian-Permian Alleghenian orogenies resulting in mostly clastic terrestrial deposits that spread across the basin and foreland in a broad, westward coalescing coastal plain [18]. Periods of high eustasy and/or reduced sediment supply resulted in marine incursions and both clastic and carbonate deposition across the region. The consequent Middle to Upper Devonian sedimentary section comprises the Catskill Delta succession of which the Marcellus Formation is an important component [19] (Figure 2).
The Marcellus Formation includes the oldest of a dozen or so regionally extensive organic-rich petroliferous black shale deposits associated with the Catskill delta in eastern North America [23]. The Marcellus Formation is the basal unit of the Hamilton Group (Figure 2). It is about 305 m (1000 ft.) thick in central Pennsylvania, but thins to the north, the west, and the south and feathers out of the sequence in the subsurface of eastern Ohio, western West Virginia, and southwestern Virginia [23]. Throughout much of the basin, the Marcellus Formation comprises two black shale members separated by a sequence of limestone, shale, and lesser sandstone of variable thickness [24] (Figure 2). In eastern West Virginia, however, these two shale members are only mappable to the point where the medial Cherry Valley Member limestone can be recognized [25]. The Cherry Valley Member then becomes very thin and loosely defined moving from northeast to southwest across most of West Virginia [25]. The Marcellus Formation encompasses two third-order transgressive–regressive sequences, the thicknesses of which reflect the interplay of Acadian thrust-load-induced subsidence, short-term base-level fluctuations, and recurrent basement tectonics [24]. Sea-level changes, which influenced clastic dilution and organic carbon production and preservation, were the principal control for organic matter accumulation in the black shales [26]. Sea-level rise led to sediment starvation and organic carbon concentration in distal basin sediments.
Marcellus Formation reservoir shales are dominated by nine principal mineral phases including quartz, muscovite, illite, pyrite, chlorite, albite, calcite, dolomite, and barite [12,27]. Variable amounts of anhydrite, kaolinite, and apatite are reported in some cores [12]. Four distinct mineralogical facies within the Marcellus shales reflect depositional influences on the variability of total organic carbon (TOC) between the upper and lower black shale members [27]. The medial Cherry Valley Member limestones contrast lithologically and petrophysically with the bounding organic-rich shales and comprise three distinct carbonate depositional facies [28].
Organic matter in the Marcellus Formation is dominated by originally hydrogen-rich unstructured (amorphous) bituminite and unicellular alginite [29,30,31,32]. Minor amounts of mostly oxidized and recycled humic material occur in most of the samples directly studied for this investigation. In the wet gas-producing region, the originally amorphous organic matter is severely degraded and converted to approximately equal amounts of solid hydrocarbon and pyrobitumen (Figure 3). VRo in the wet gas region explicitly measured during this investigation is between 1.59 and 1.78%. Pyrobitumen dominates the organic matter in the dry gas-producing region where VRo specifically measured during this study is between 2.35 and 4.61% (Figure 4). Pyrobitumen in the highest maturity Marcellus rocks (>3.0% VRo) is highly aromatic and has undergone partial graphitization [12,30]. The Marcellus Formation in the subsurface of northeastern Pennsylvania is metagenetic and characterized by prehnite–pumpellyte to incipient greenschist metamorphic facies [12,30].
Porosity in Marcellus Formation reservoirs is a function of compaction, cementation, and organic matter thermal maturation through the occlusion of primary void space and the development of secondary porosity [12,29,30]. Organic matter-hosted porosity provides the most significant portion of effective porosity and free-gas storage capacity in the reservoirs [12,29] (Figure 5). Matrix porosity is also present within the clay mineral aggregates and at the interface between rigid clasts and clay minerals [12,29].
Modeled maximum burial of Marcellus Formation strata in the wet gas-producing region was between 3.4 and 4 km (11,220 and 13,400 ft.) followed by uplift and erosion of 1.04 to 2.4 km (3419.6 to 8049.8 ft.) of Carboniferous and Permian overburden which was removed during post-Alleghenian uplift [33,34]. Modeled maximum burial in the dry gas-producing region was between 4.89 and 4.95 km (16,050 and 16,250 ft.) with subsequent uplift and erosion of 2.6 to 2.9 km (8550 to 9650 ft.) of overburden [33,34]. Higley and Enomoto [33] assigned the following rates of erosion of overburden sediments based on modeled thicknesses of erosion of nine wells in the study area: (A) 8.78 to 11.3 m/m.y. (28.8 to 37.1 ft./m.y.) from 260 Ma to Present; (B) 12.8 to 21.3 m/m.y. (42 to 70 ft./m.y.) from 140 to 90 Ma; and (C) 50.3 to 83.8 m/m.y. (165 to 275 ft./m.y.) from 23.5 to 5.3 Ma. The latter two rates (B and C) represent two time periods of increased uplift and erosion.

3. Materials and Methods

Sixty-seven production gases were collected at the wellhead or separator in pressurized stainless-steel cylinders or Isotubes® and shipped to Isotech Laboratories in Champaign, IL, USA for processing and analyses (Table 1 and Table 2). Thirty-four of these produced gas samples were collected in the dry gas region of northeast Pennsylvania (Bradford, Sullivan, Susquehanna, and Wyoming Counties). Two additional dry gas samples were collected in Upshur County, West Virginia. Twelve additional dry gas samples were collected from Marcellus Formation pressure core recovered from a well in Susquehanna County, Pennsylvania (Table 3). These 12 gas samples were collected during direct gas-in-place resource assessment in the laboratory. Thirty-one wet gas samples were collected in northwest and northcentral West Virginia (Tyler, Richie, Wetzel, Doddridge, and Harrison Counties) and southwest Pennsylvania (Washington County).
All gas samples were analyzed for chemical composition using a Shimadzu 2010 gas chromatograph. Quantification of fixed gases was done by thermal conductivity detector. Compositional data were processed on GC Solutions software and PC. Isotopic analyses were performed using traditional offline sample preparation techniques followed by dual inlet mass spectrometric 13C/12C measurement on a Finnigan MAT Delta S Isotope Ratio mass spectrometer. 2H/1H measurements were performed on a Finnigan Delta Plus XL isotope ratio mass spectrometer. Sample results were compared with accepted reference standards (NGS #1, #2, or #3); isotope ratio determinations involved multiple direct comparisons of the sample to the reference standard (generally at least 6 comparisons). Stable carbon and hydrogen isotope compositions are reported as the difference between the ratios of the two isotopes of interest in the sample and the ratio in a primary reference standard. That is,
Xsample = [(Rsample − Rstandard)/Rstandard] × 1000,
where X represents the isotope of interest, in this case 13C and 2H or deuterium (D), and R represents the ratio of 13C/12C or 2H/1H. The value is expressed in terms of per mil (‰), or parts per thousand.
Noble gas measurements were made on second splits of selected produced dry gas samples collected in stainless-steel pressurized cylinders at the same time as the gas samples analyzed at Isotech Laboratories (Table 4 and Table 5). Noble gas measurements were performed using a ThermoFisher Helix Split Flight Type noble gas mass spectrometer at Smart Gas Sciences laboratories in Columbus, OH, USA.
Twenty-three condensate samples, co-produced with the wet gases described above, were collected as dead oil (i.e., collected at atmospheric pressure and lacking volatiles) at the separator in glass jars with Teflon lids and shipped to Stratum Reservoir Laboratories in Houston, Texas USA (Table 6). High-Resolution Gas Chromatography (HRGC) was performed using an Agilent 6890 GC-FID instrument. API gravity was derived from measurement of specific gravity by hydrometer (ASTM D1298).
Excepting the pressure core gas samples, all of the fluid samples were collected from horizontal wells stimulated by hydraulic fracturing. The Marcellus reservoir samples represent the landing zones of the wells and are not necessarily from the exact petroleum source rock intervals of the produced gas and condensate.

4. Results and Discussion

4.1. Bulk Composition and Stable Isotopes of Produced Gases

Samples collected in the wet gas-producing region exhibit bulk compositions and isotope ratios characteristic of oil-associated thermogenic gases [35,36,37,38] (Figure 6). Methane (C1) concentrations range from 69.37 to 92.27 mole%, with δ13C1 ranging from −46.74 to −40.15‰ VPDB and δDCH4 from −243.8 to −167.2‰ VSMOW. Ethane (C2) and propane (C3) concentrations are between 5.27 and 16.68 and 0.5 and 7.81 mole%, respectively.
All but one of the production gas samples collected in the dry gas-producing region exhibit bulk compositions typical of high-maturity thermogenic gas [35,36,37,38] (Figure 6). The gases are composed primarily of methane, with small volumes of ethane and trace contributions of propane and butane+ (C4+). Methane concentrations range from 94.45 to 97.87 mole%. One anomalous sample contains only 55.27 mole% C1 due to a high nitrogen (N2) content related to air contamination as confirmed by a N2/Ar ratio similar to that of air. Isotope ratios of hydrocarbon gases are consistent with a thermogenic origin, with δ13C1 ranging from −39.2 to −23.53‰ VPDB and δDCH4 from −163.9 to −157.7‰ VSMOW (Figure 6b). Both ranges indicate a thermogenic origin of methane without any contribution from a microbial source [33,34,35,36] (Figure 6). The one produced gas sample with only 55.25 mole% C1 is an exception: it has a δ13CCH4 of −59.58‰ VPDB and a C1/(C2 + C3) ratio of 2763.5 indicating mixing with microbial methane [32,33] (Figure 6a).
The Marcellus Formation gases from both the dry gas-producing region and the wet gas-producing region show a general trend of enrichment in 13C as the gases become richer in methane (Figure 6a). However, there is considerable scatter in 13C1 of the dry gas samples compared to the wet gas samples due to the shifting fields for kerogen type on the plot of 13C1 against C1/(C2 + C3). The shift from kerogen type II to kerogen type III exhibited by the dry gas samples in Figure 6a is a function of increasing thermal maturity accompanied by decreasing atomic H/C in the parent organic matter, and not due to variation in organic facies. Hydrogen Index (HI) and Oxygen Index (OI) decrease across the basin from average respective values of 529–582 mg hydrocarbon/g TOC and 15–34 mg CO2/g TOC in thermally immature to mature Marcellus samples [31,32] to 6–31 mg hydrocarbon/g TOC and 7–9 mg CO2/g TOC in overmature Marcellus samples [12]. Respective H/C and O/C ratios in the latter are as low as 0.40 and 0.06 [12].
The respective δ13C values of ethane and propane in the wet gas samples range between −35.87 and −31.2‰ and −31.22 and −25.67‰ (Figure 7a). The wet gases exhibit normal kinetic isotope trends on the natural gas plot shown in Figure 7a, with δ13C1 < δ13C2 < δ13C3. Deviations from a straight line in Figure 7a indicate a mixture of source inputs, heterogeneity in the organic source material, and/or secondary hydrocarbon gas alteration effects [39,40]. By contrast, the ethane δ13C of dry gas samples ranges from −42.11 to −29.59‰ and the propane δ13C of the dry gases ranges from −43 to −31.4‰ (Figure 7b). All the samples collected from the dry gas-producing region exhibit full carbon isotope reversals with δ13C1 > δ13C2 > δ13C3 (Figure 7b). The δD ratios of the dry gas samples are reversed as well with δDCH4 > δDC2 (Figure 8). Wet gases, by comparison, exhibit normal hydrogen isotope trends with δDCH4 < δDC2 (Figure 8). The carbon and hydrogen isotope reversals observed in the dry gas samples are considered in detail in Section 4.6 below.
Figure 9 is a plot of gas wetness versus δ13C2 for all the samples from both the wet and dry gas-producing regions. Beginning at measured VRo = 1.59%, the wet gases plot along the expected thermal maturity trend defined by decreasing wetness and increasing δ13C2. However, the most thermally mature wet gas sample does not follow the expected maturity trend. It “rolls over”, i.e., exhibits decreasing wetness accompanied by decreasing δ13C2. Rollover occurs at a wetness of about 5.9% and VRo = 1.78%. Dry gases with full isotopic reversals (Figure 7 and Figure 8) exhibit rapidly decreasing wetness (~4 to 1.4%) and sharply increasing δ13C2 between measured VRo values of 2.35 and 4.61%.
Non-hydrocarbon gases produced from the Marcellus reservoirs are present in much smaller amounts, with CO2 concentrations up to 0.21 mole% in the wet gas-producing region and 0.061 mole% in the dry gas-producing region. δ13CO2 was measured for two dry produced gas samples. δ13CO2 = −26.5‰ in the DG12 gas and −31.8‰ in the DG19 gas (Table 2). These values indicate an organic, high maturity thermogenic origin for the CO2 [37]. Excepting the one air-contaminated sample (DG19), N2 concentrations in the dry gas region are between 0.4 and 2.04 mole%. δ15N was measured in the DG12 sample and is −10.2‰ (Table 2). Nitrogen concentrations in the wet gas region are between 0.33 and 1.4 mole%. δ15N measured in three of the wet gas samples is between −13.9 and −12.7‰. These isotopically light δ15N values indicate a thermogenic organic nitrogen source [37].

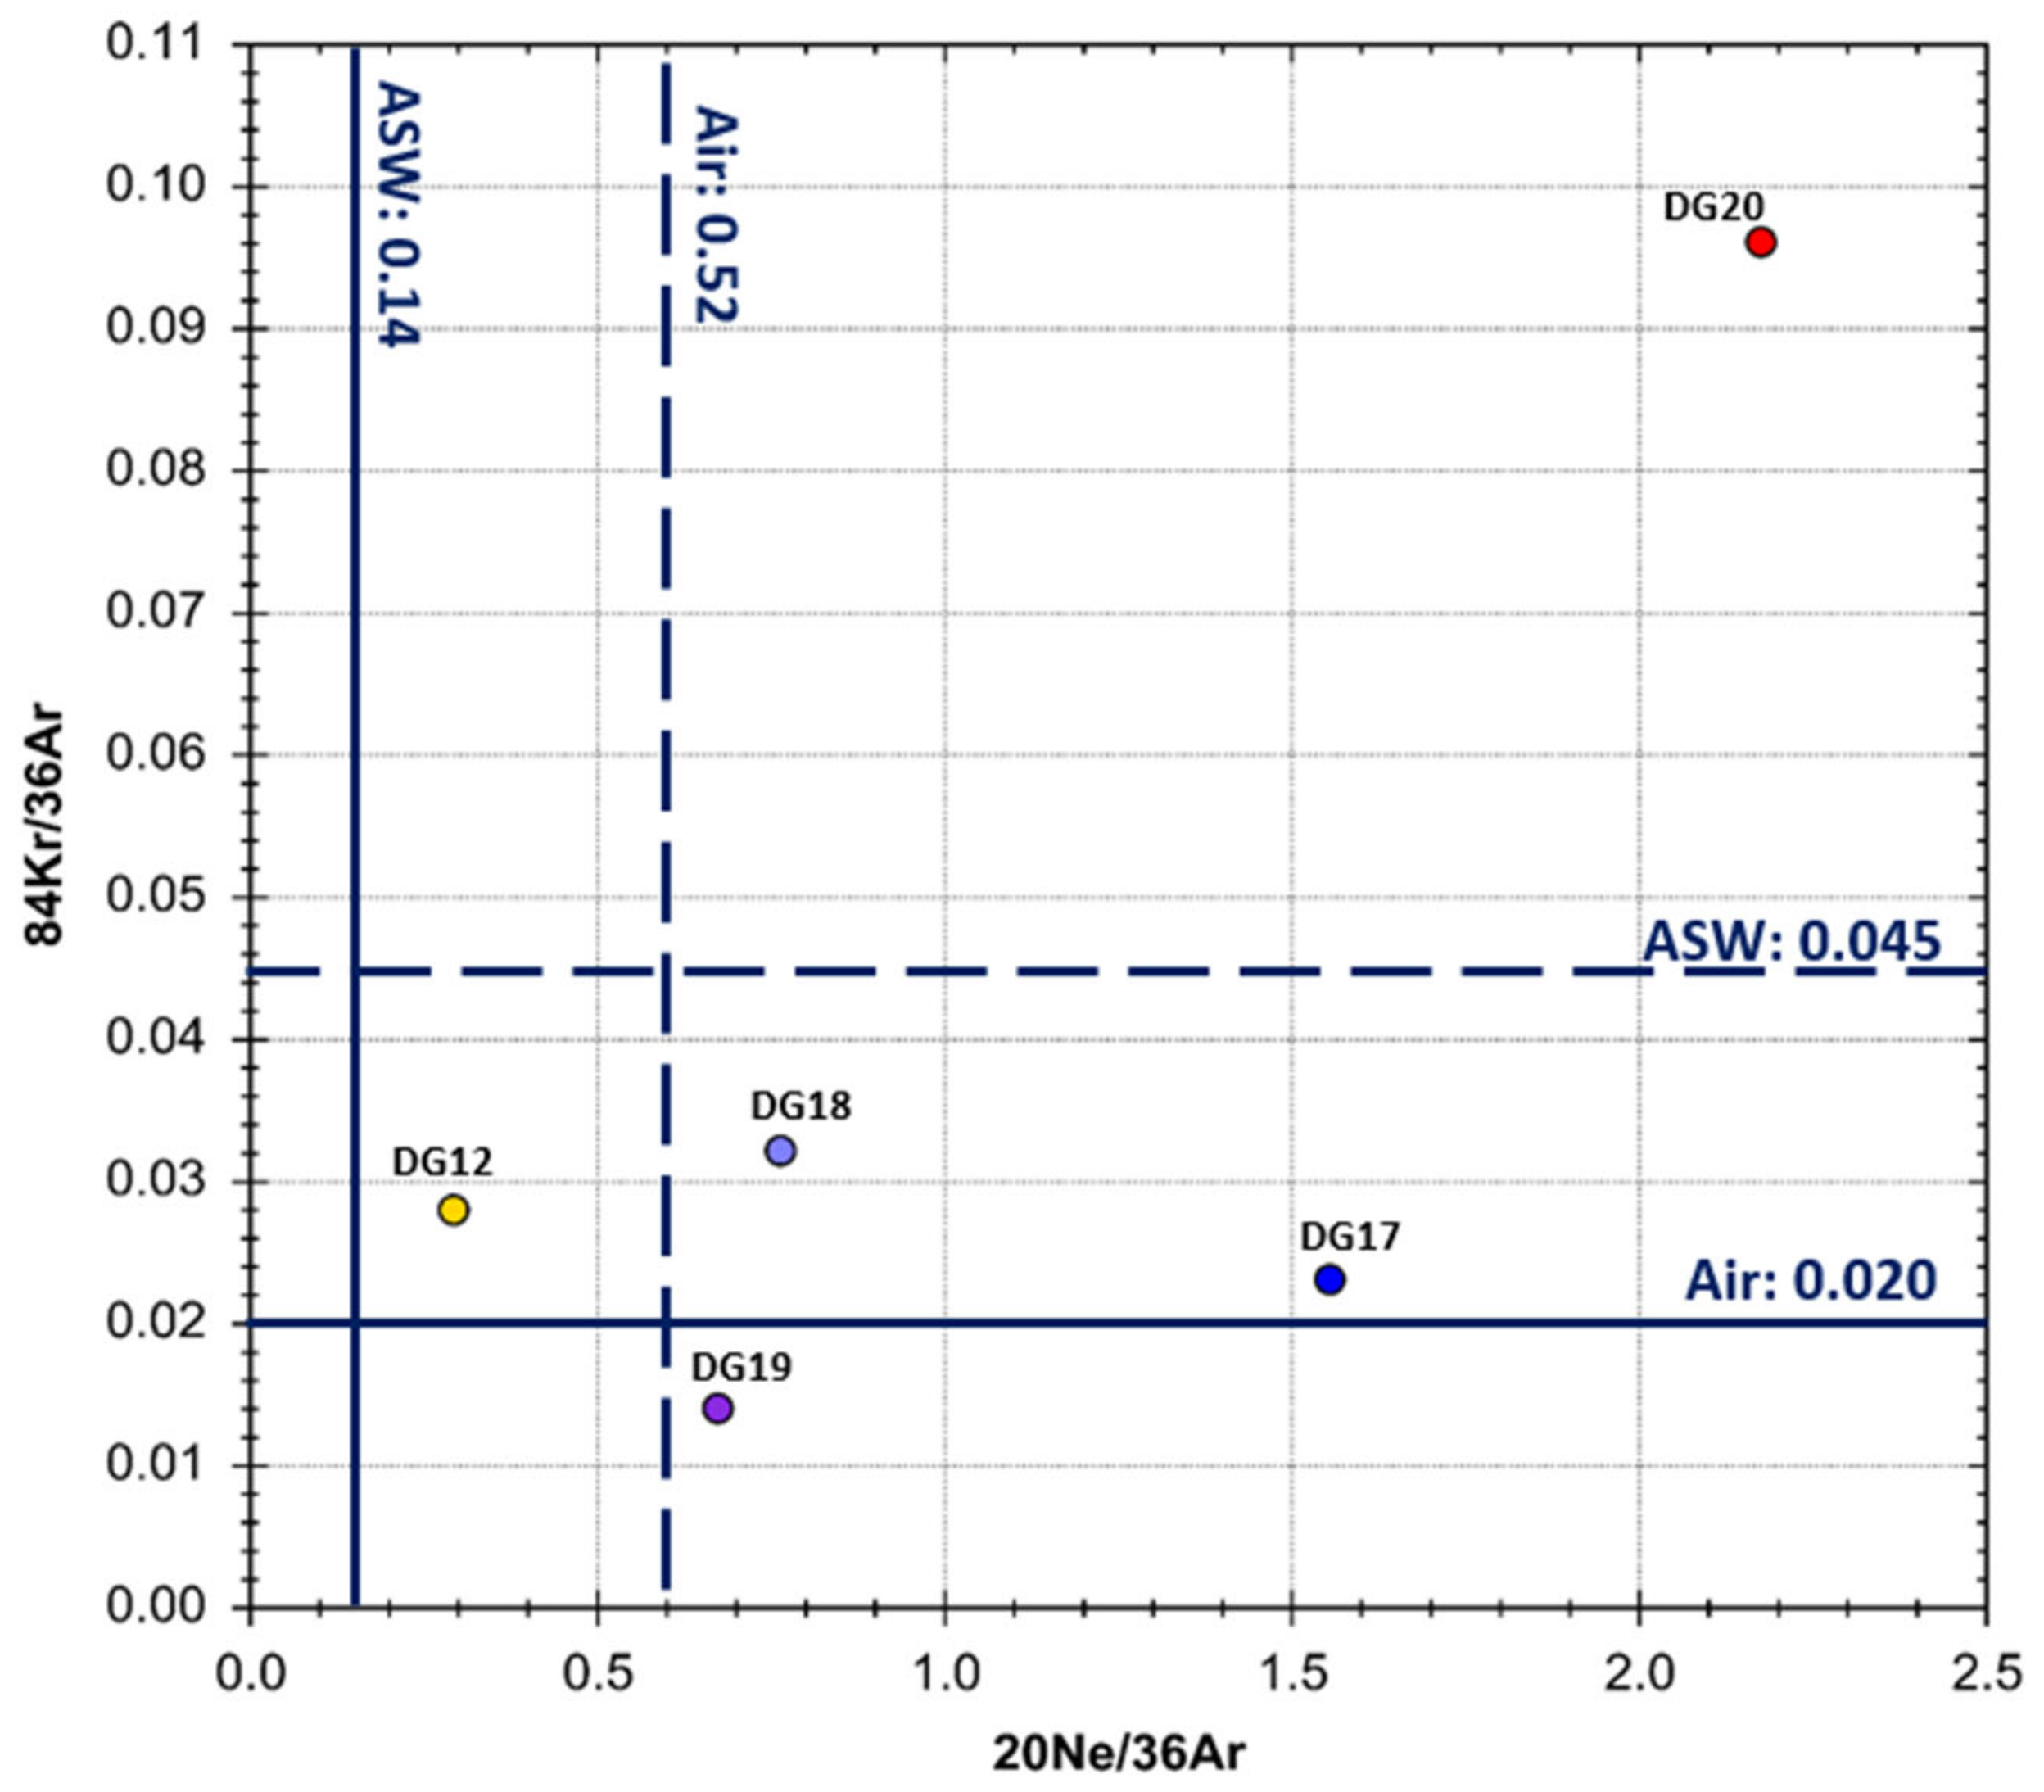
4.2. Noble Gas Isotopic Analyses of Dry Gas Samples

Helium concentrations in a subset of gas samples collected from the dry gas-producing region range from 276.2 to 774.3 µcc/cc for 4He and 4.56 to 41.17 pcc/cc for 3He (Table 4). Helium isotope ratios are reported relative to the atmospheric ratio Ra = 1.4 × 10⁻⁶ and range from 0.011 to 0.071Ra (Table 3 and Table 4 and Figure 10a). 4He/20Ne ratios are between 76.8 and 11,704.3, which by comparison with the atmospheric 4He/20Ne ratio (0.188) shows that atmospheric helium contributions are negligible. Helium isotope ratios can therefore be considered as two-endmember mixing between crustal radiogenic helium (0.02Ra) and minute contributions of 3He-enriched mantle helium, for which sub-continental lithospheric mantle 3He/4He is 6.1Ra [44,45,46]. 3He/4He ratios > 0.1Ra are attributed to mantle fluid contributions [44]. Most of helium in the Marcellus Formation dry gases is derived from crustal radiogenic production (Figure 10a).
Neon isotope ratios in the dry Marcellus Formation gases show a slight excess of radiogenically produced 21Ne and/or 22Ne relative to air, for which atmospheric 20Ne/22Ne is 9.81 and 21Ne/22Ne is 0.029 [45] (Figure 10b). 20Ne/22Ne in the Marcellus samples ranges from 8.223 to 9.674. 21Ne/22Ne is between 0.0289 and 0.0341. The samples mostly follow the crustal neon production-air mixing line, but scatter among some samples possibly reflects mass-dependent fractionation effects [44,46] (Figure 10b). Atmospheric 20Ne concentrations range from 0.07 to 6.53 µcc/cc. The highest value is in the air contaminated DG19 sample and is considered anomalous and non-representative of Marcellus fluids.
Argon isotope ratios (40Ar/36Ar) show a modest excess of radiogenically produced 40Ar, ranging from 315.69 to 404.1, compared with the air ratio of 298.6 [44,45,46,47]. Atmospheric 36Ar is introduced into the subsurface dissolved in groundwater and in sediment pore water, and its concentration in the gas phase is controlled by solubility-dependent partitioning upon water-gas interaction. 40Ar/36Ar values in excess of the atmospheric ratio are due to contribution of radiogenic 40Ar (designated 40Ar*) produced by 40K decay within the crust. The Marcellus 40Ar/36Ar ratios indicate variable additions of radiogenic 40Ar* to atmospheric, groundwater-derived Ar (Figure 11a). The 4He/40Ar* ratios of the dry Marcellus gases indicate crustal production ratios reflecting very high thermal stress for the source material of the produced hydrocarbons (Figure 11b) [45,46,47,48,49].
Krypton and xenon abundances in the Marcellus Formation gas samples range from 11.1 to 231.9 ncc/cc and 0.6 to 17.5 ncc/cc, respectively (Table 4). Krypton and xenon ratios of gases produced from the DG17 and DG19 wells are indistinguishable from air and are slightly elevated relative to air in the DG12 and DG18 samples (Table 4 and Table 5). In sample DG20, Kr abundance is enriched relative to Ar when compared to air or ASW values (Figure 12). 84Kr and 132Xe are fission products of uranium and their concentrations are dependent upon the uranium content of the crustal rocks. Previous studies suggest that excess Kr and Xe may be sourced from organic-rich shales themselves due to preferential sorption of the heavier noble gases onto clay or kerogen [47,48,49]. Figure 12 is a plot of 20Ne/36Ar against 84Kr/36Ar for dry Marcellus gases. Most of the gas samples lie near to the air and air-saturated water (ASW) values for 84Kr/36Ar indicating gas/water phase equilibrium. Three of the samples show variably high fractionation in 20Ne/36Ar suggesting that equilibration of groundwater with an earlier oil phase may have increased 20Ne/36Ar in the water phase [45,47]. One gas sample (DG20) exhibits high 20Ne/36Ar and extreme fractionation of 84Kr/36Ar (Figure 12). This may reflect release of atmosphere-derived Kr originally adsorbed and trapped in organic-rich sediment but might also indicate non-equilibrium diffusion or multiple stages of exsolution and dissolution [48,49].

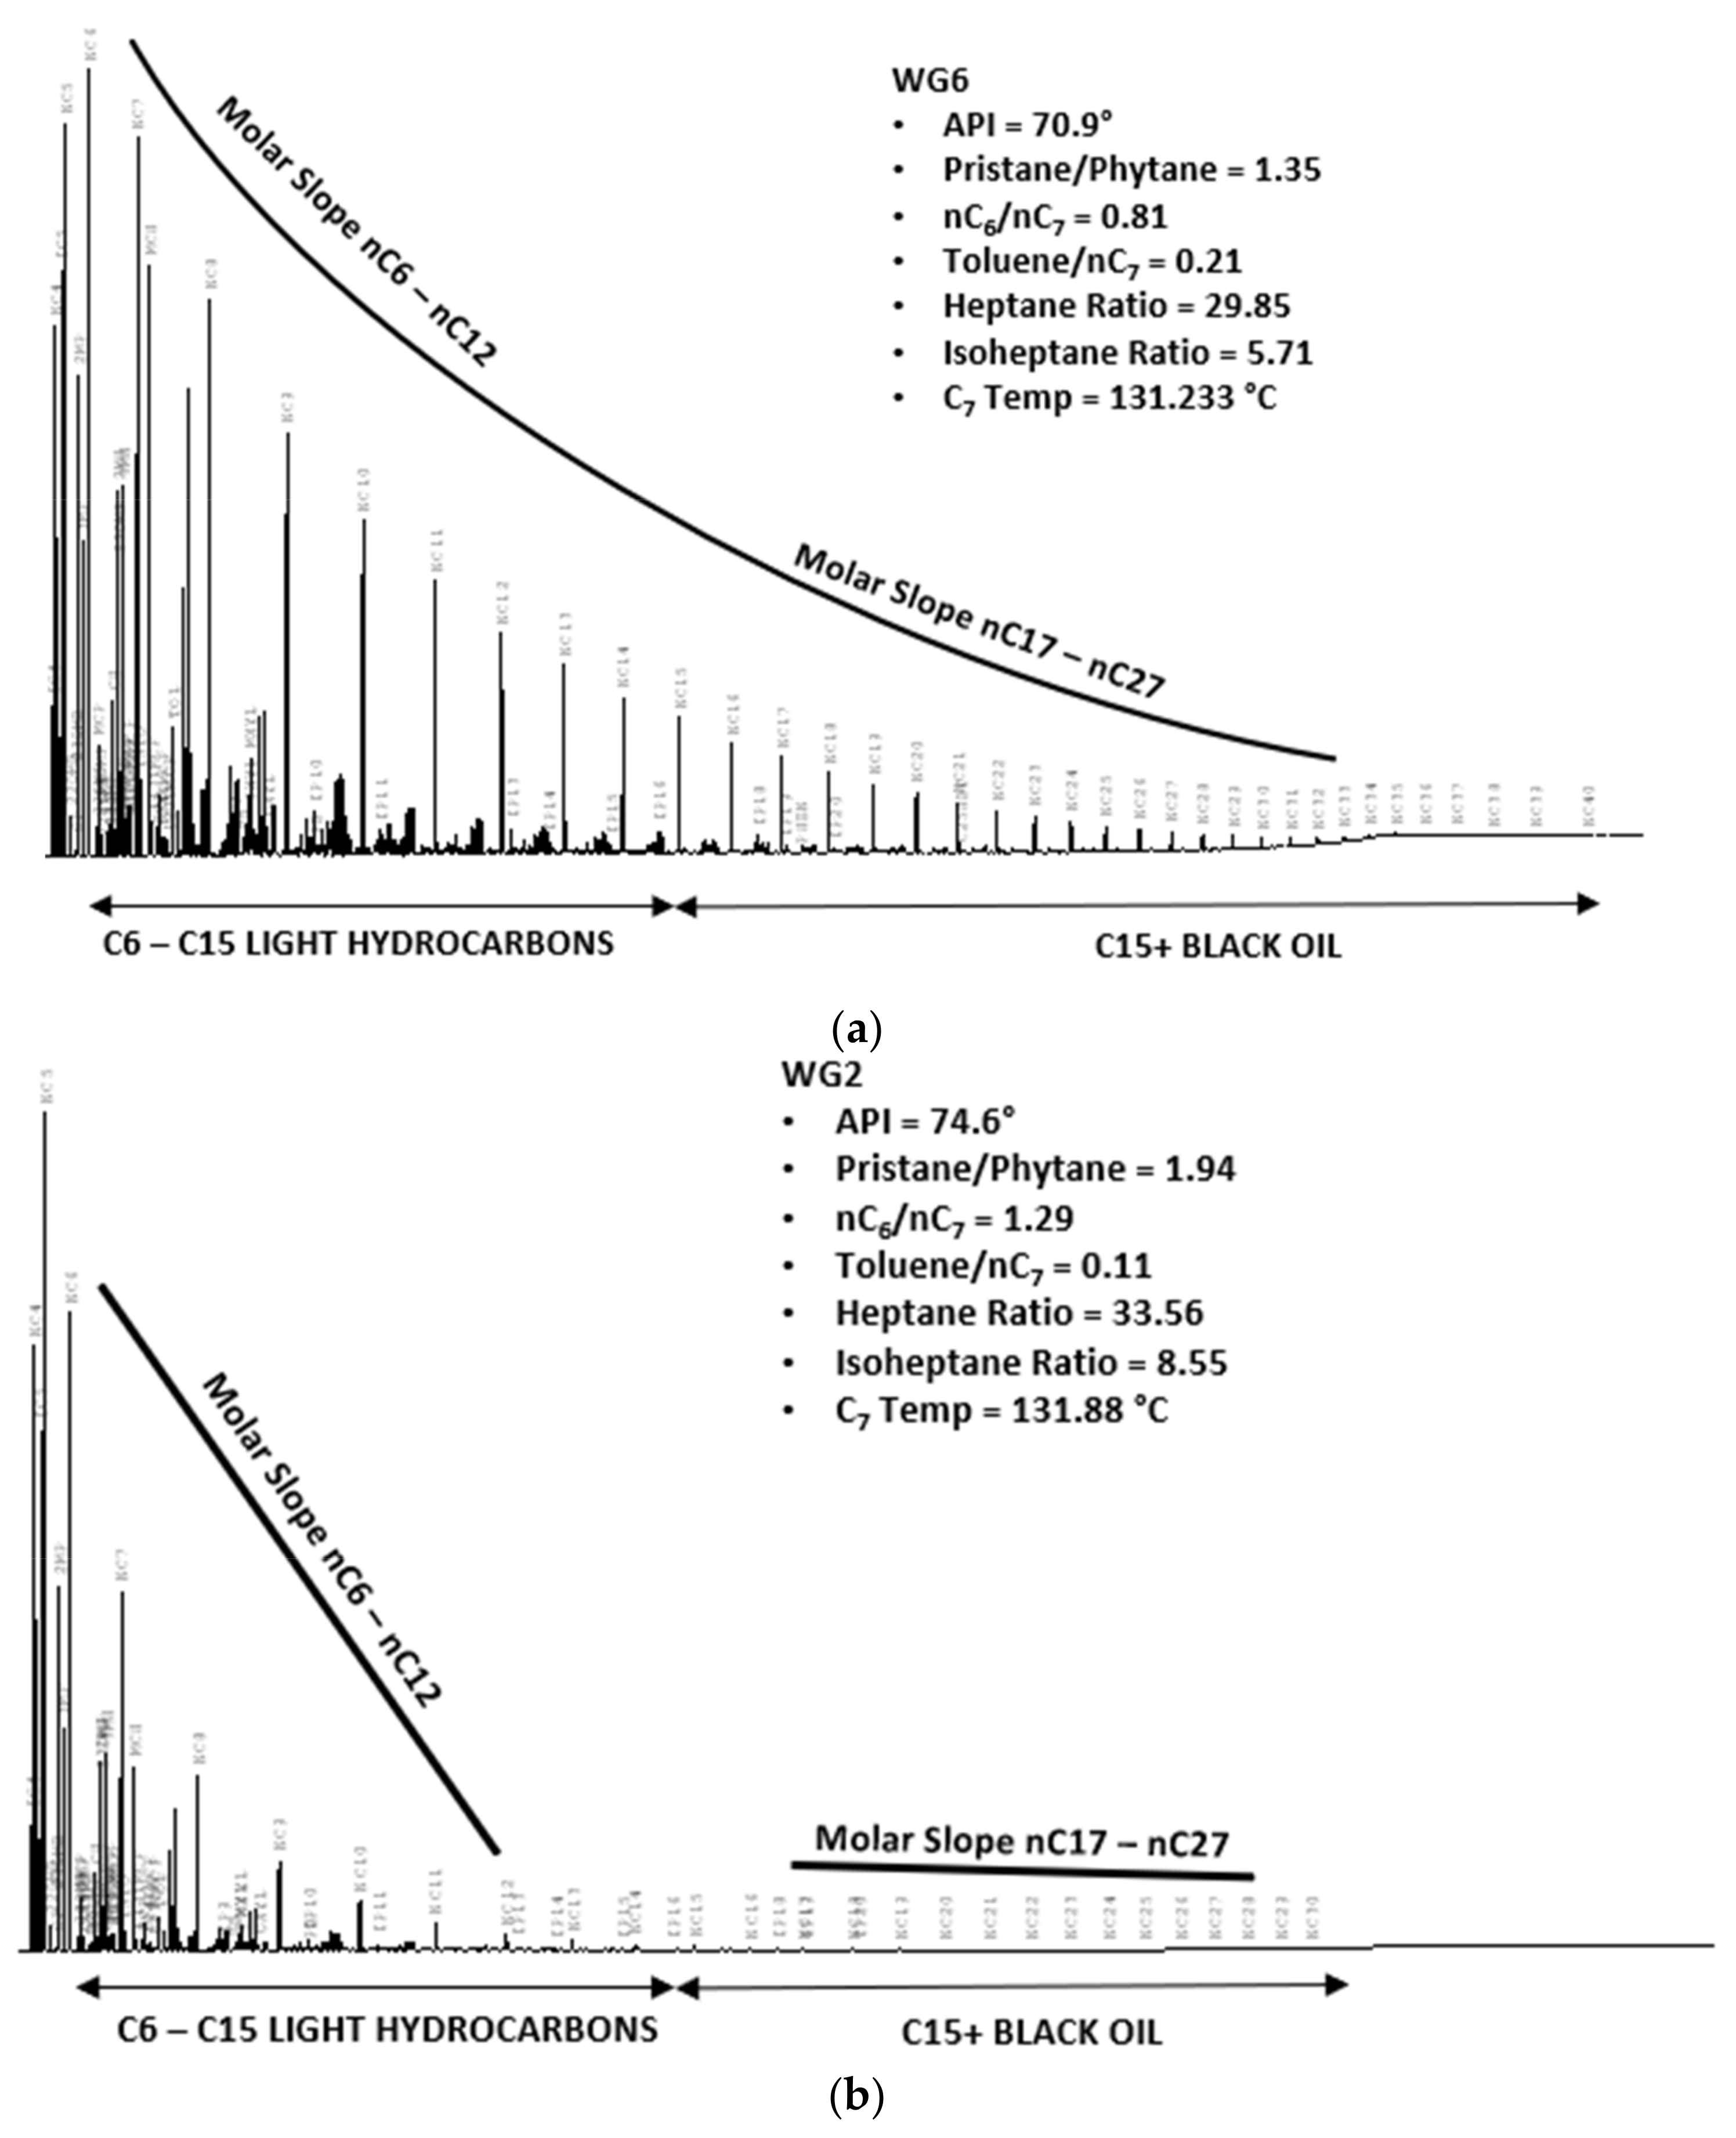
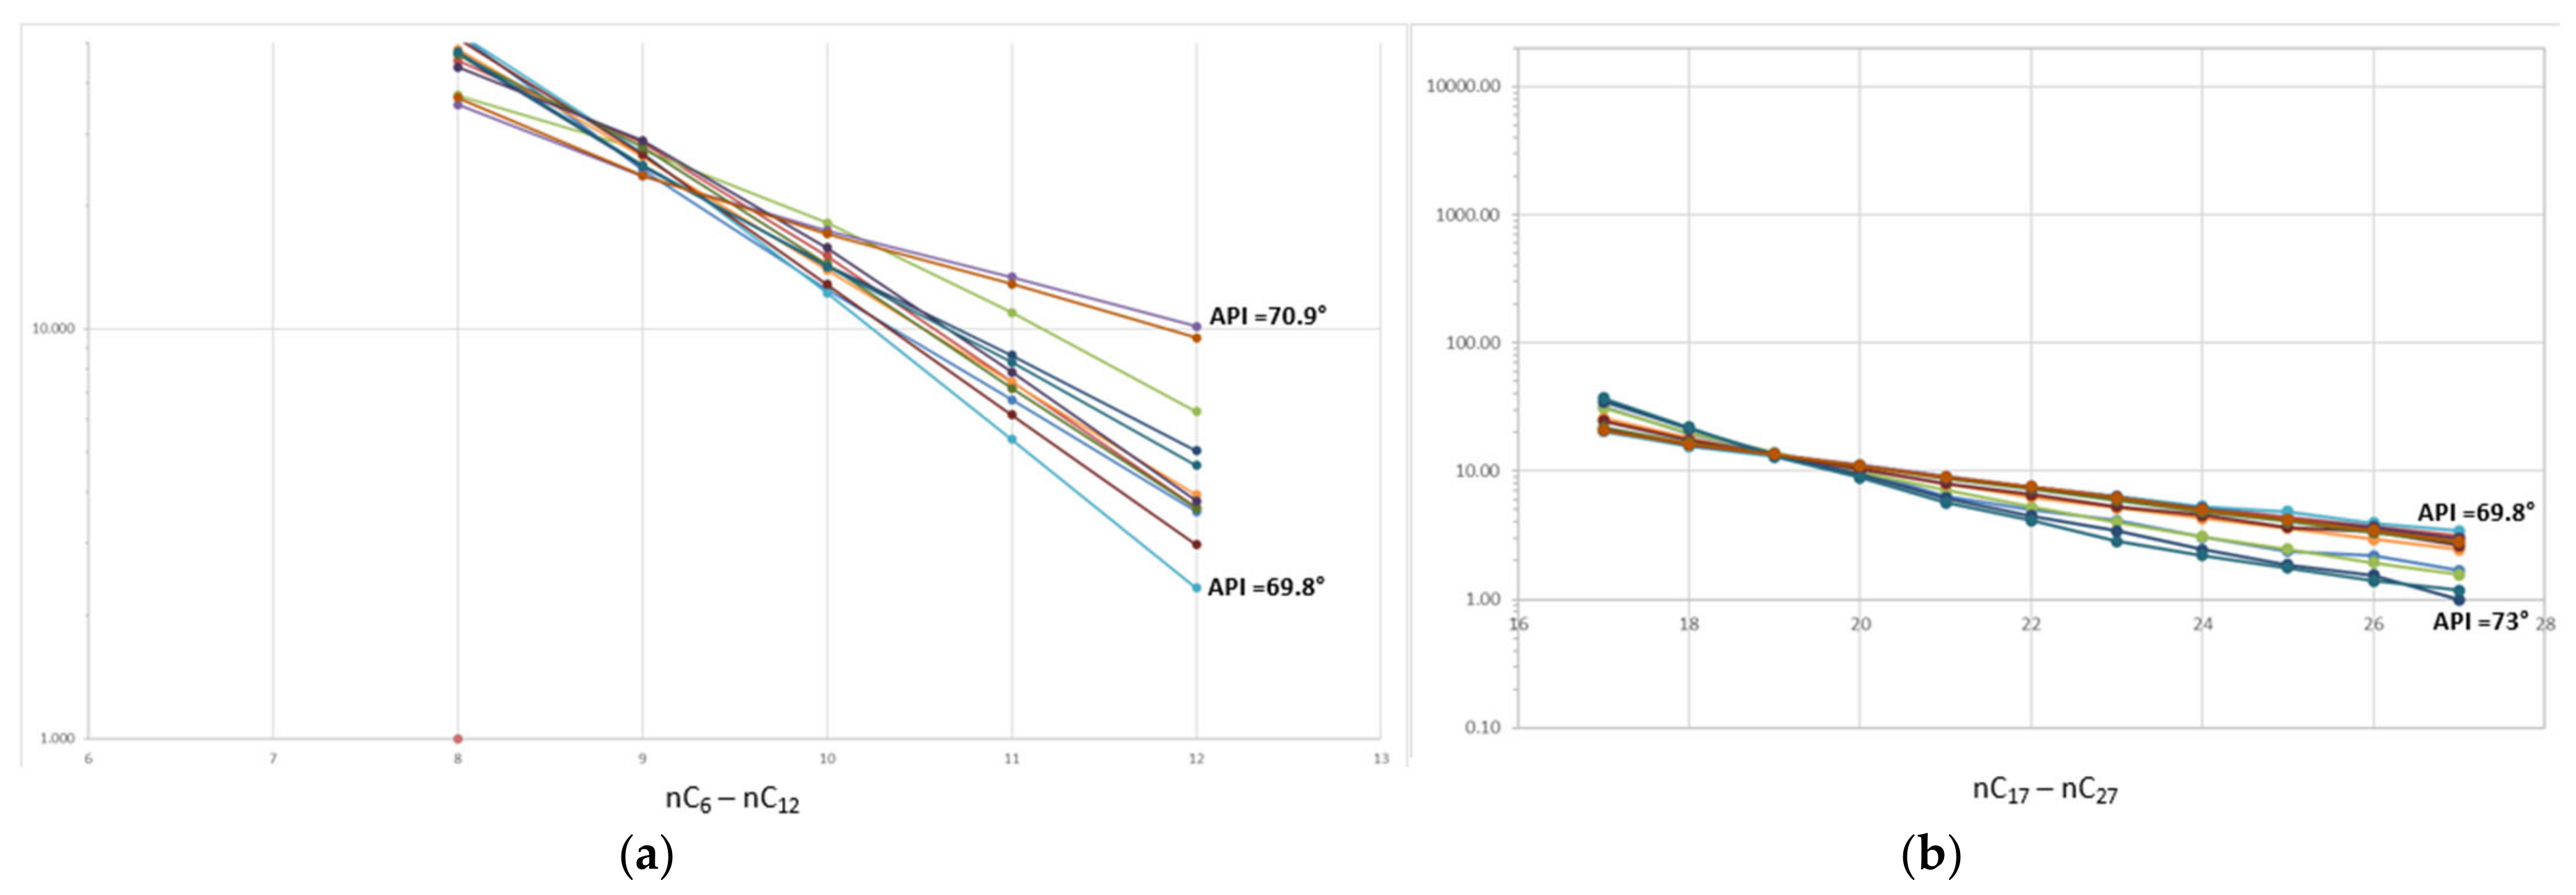
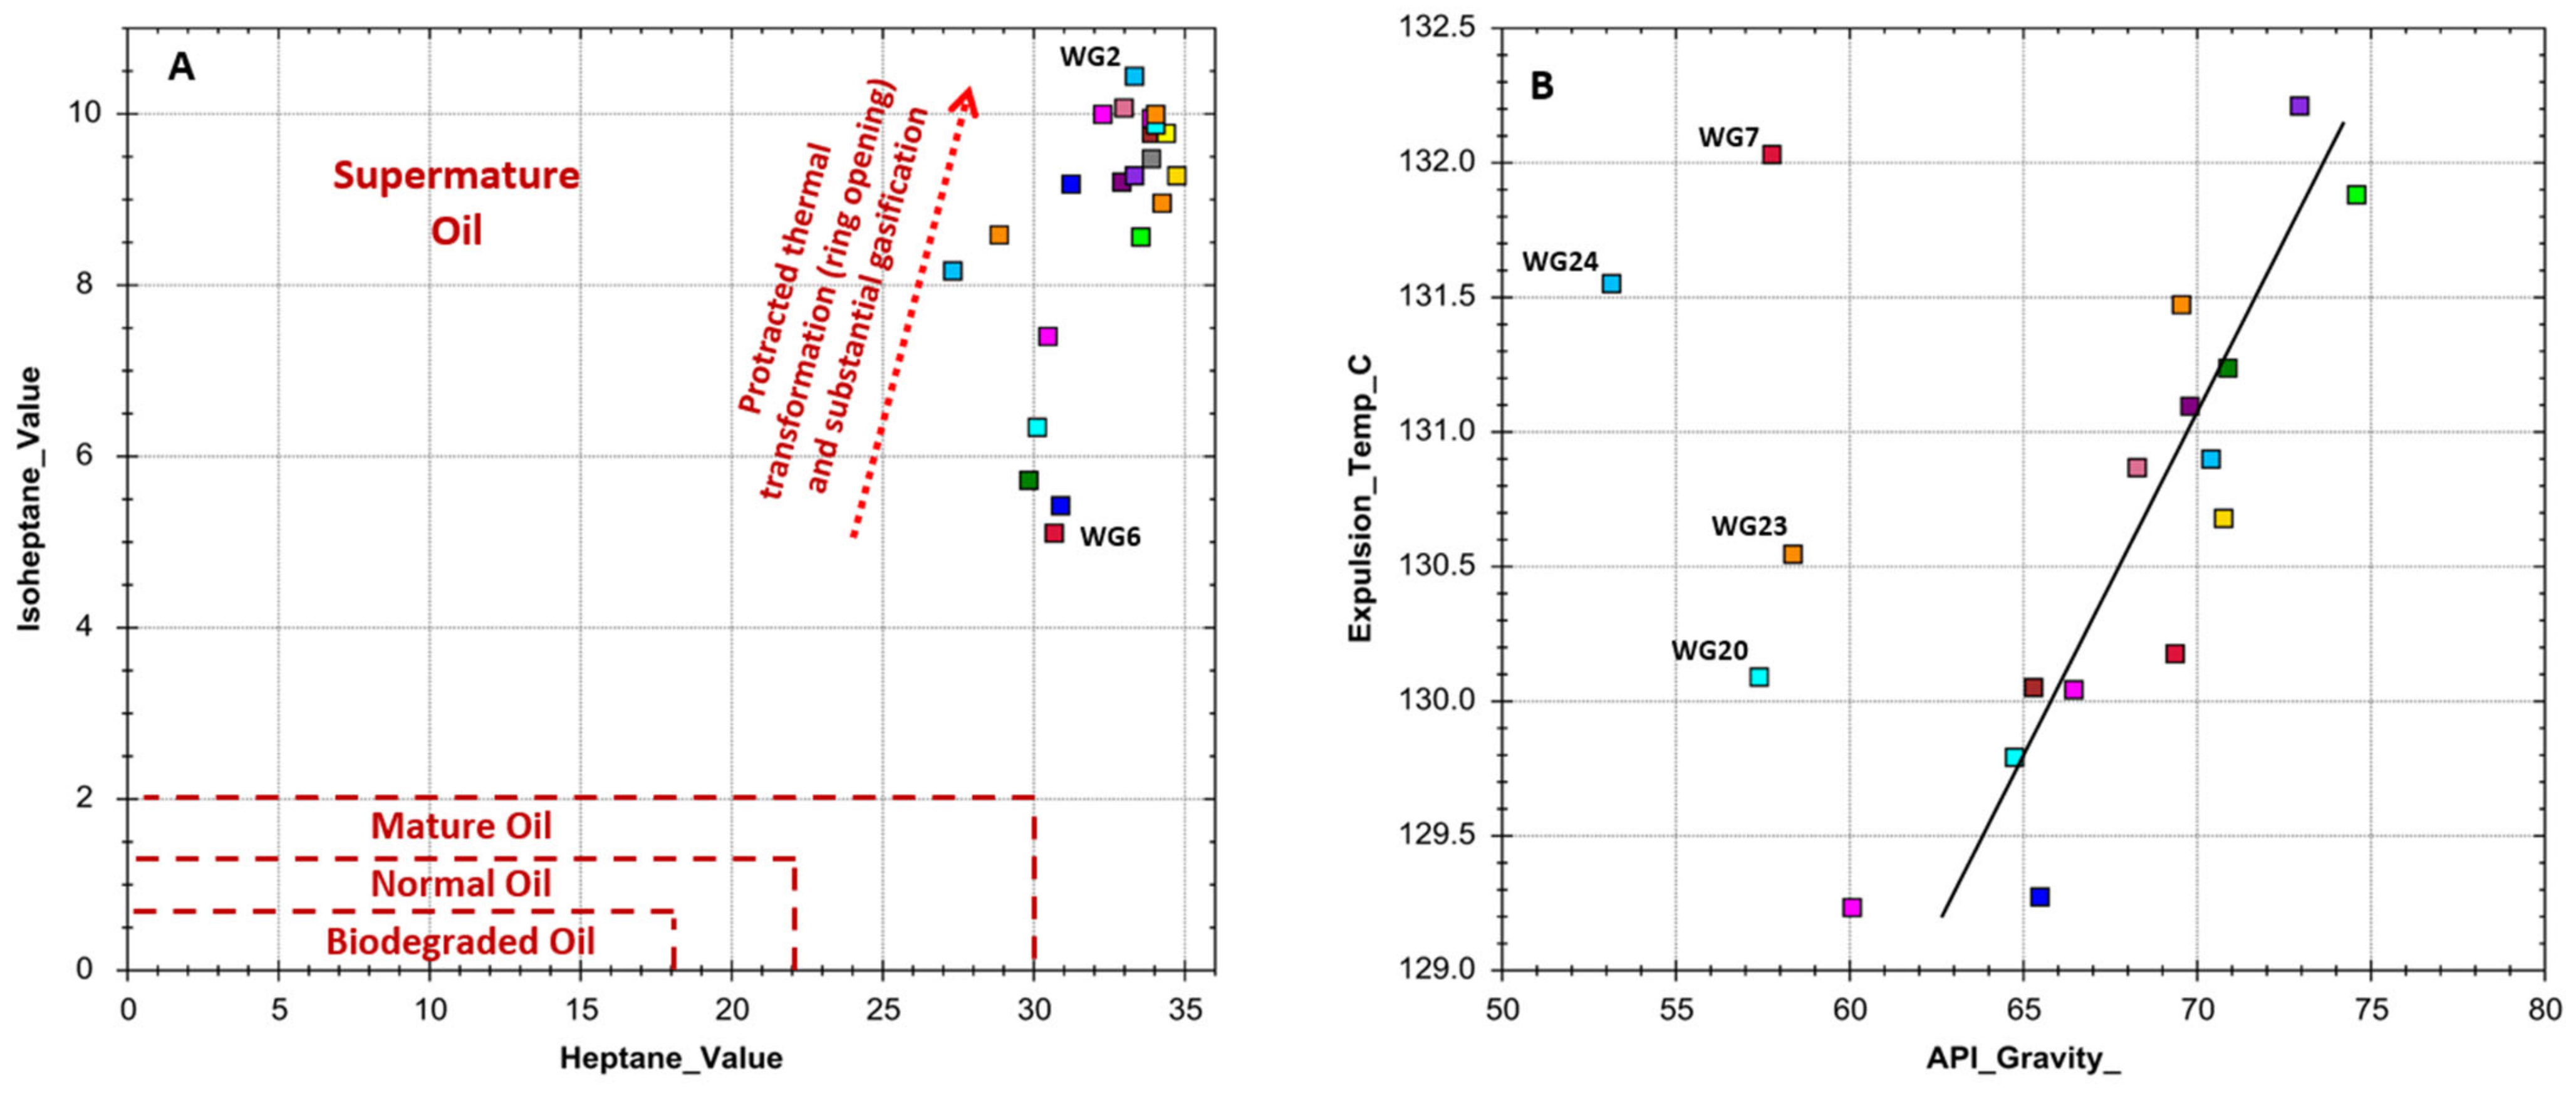
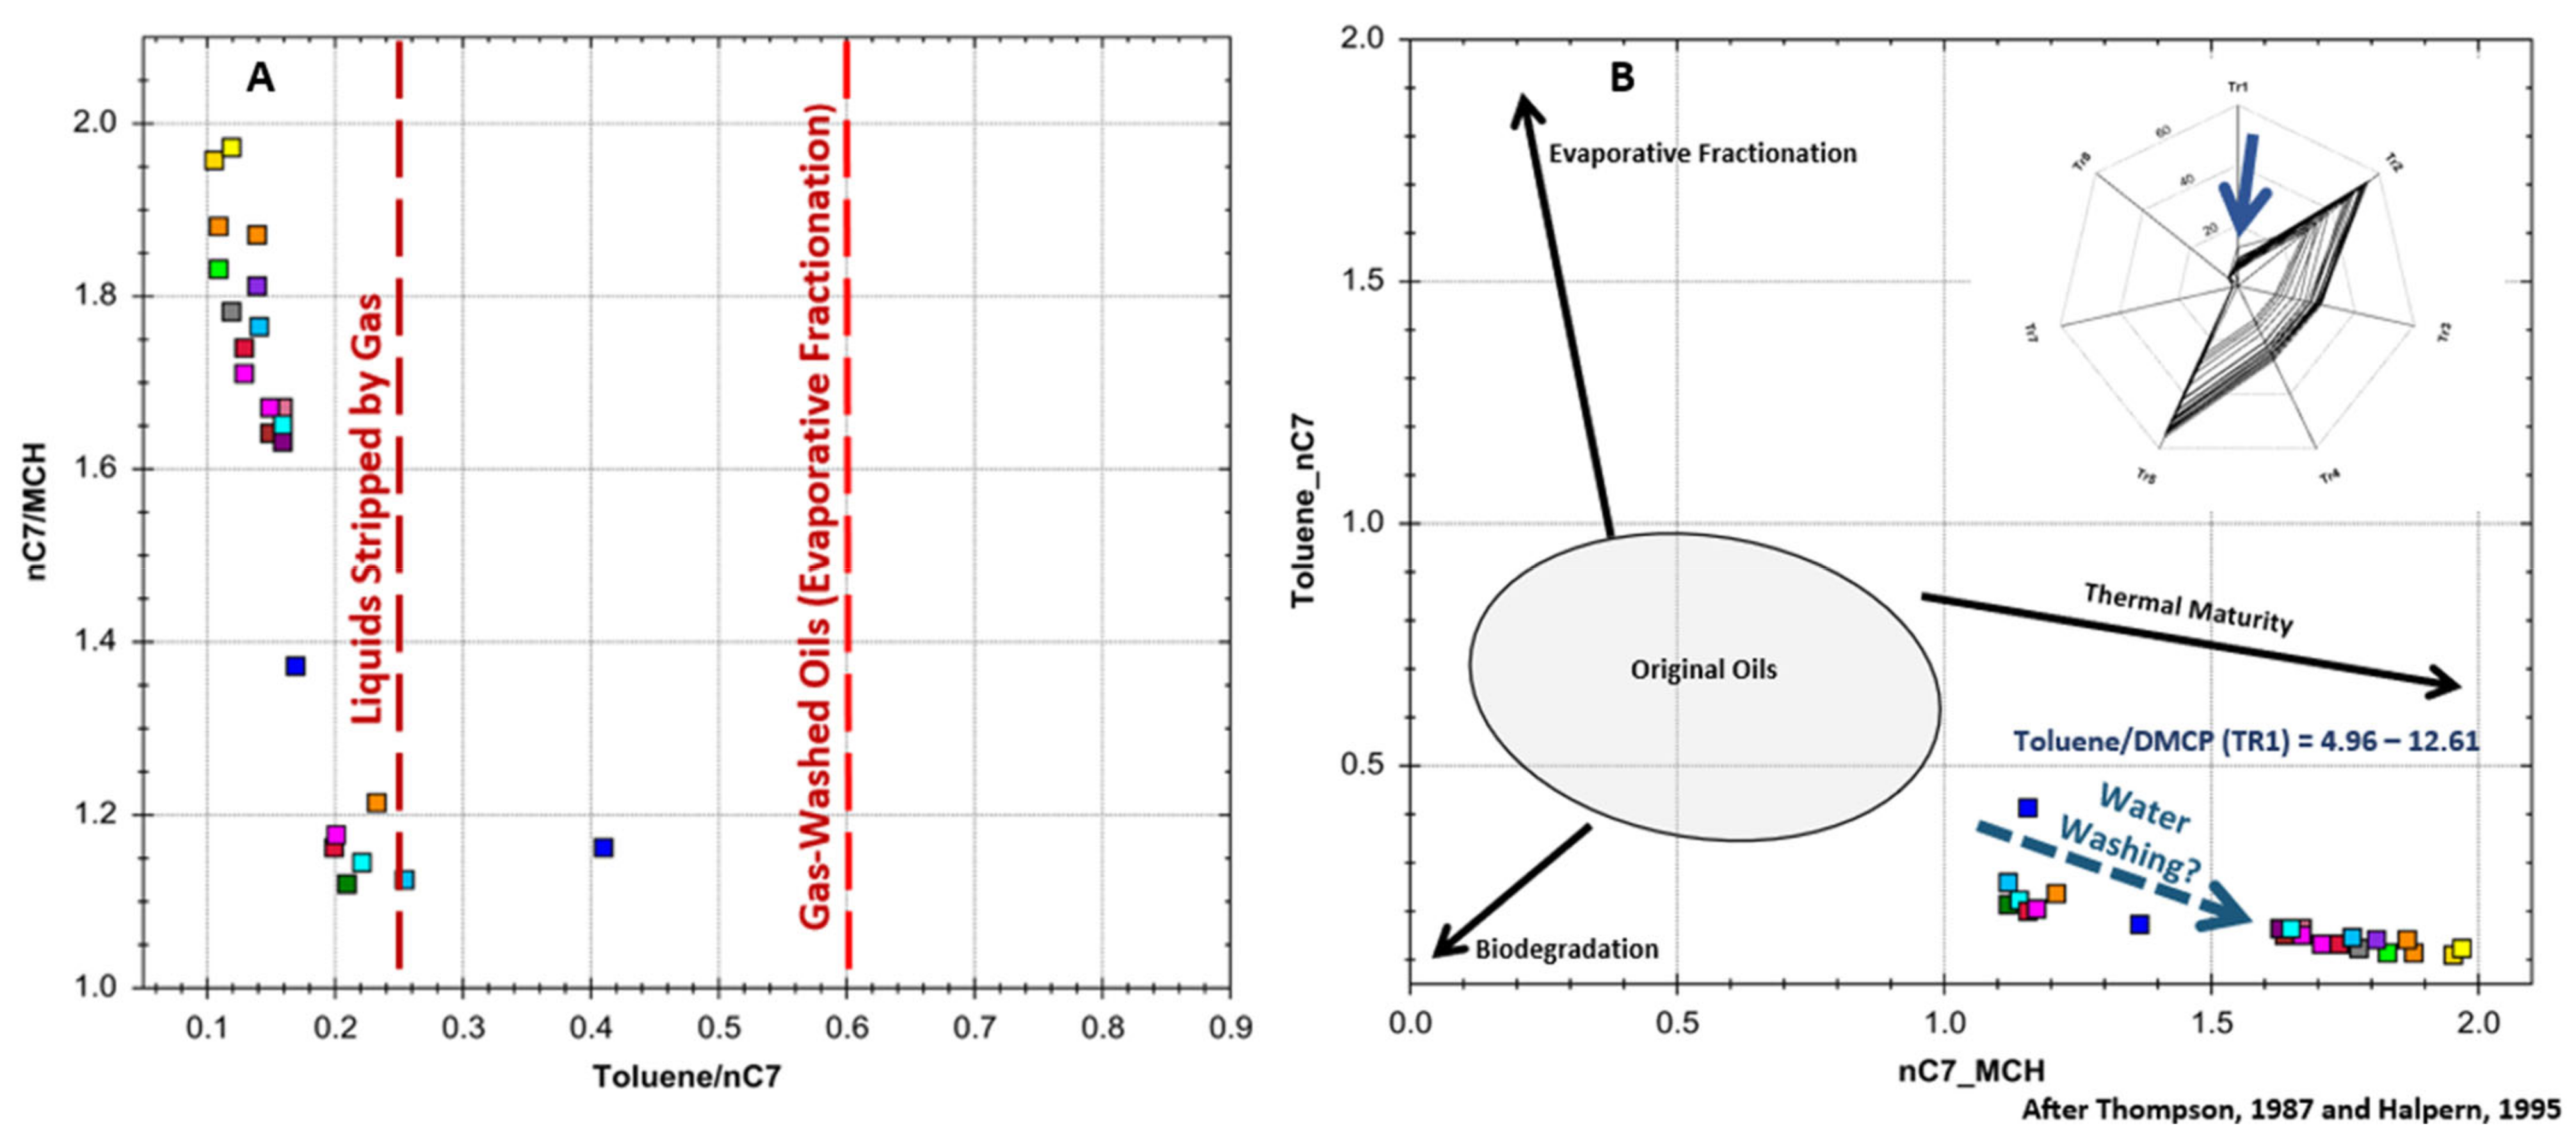
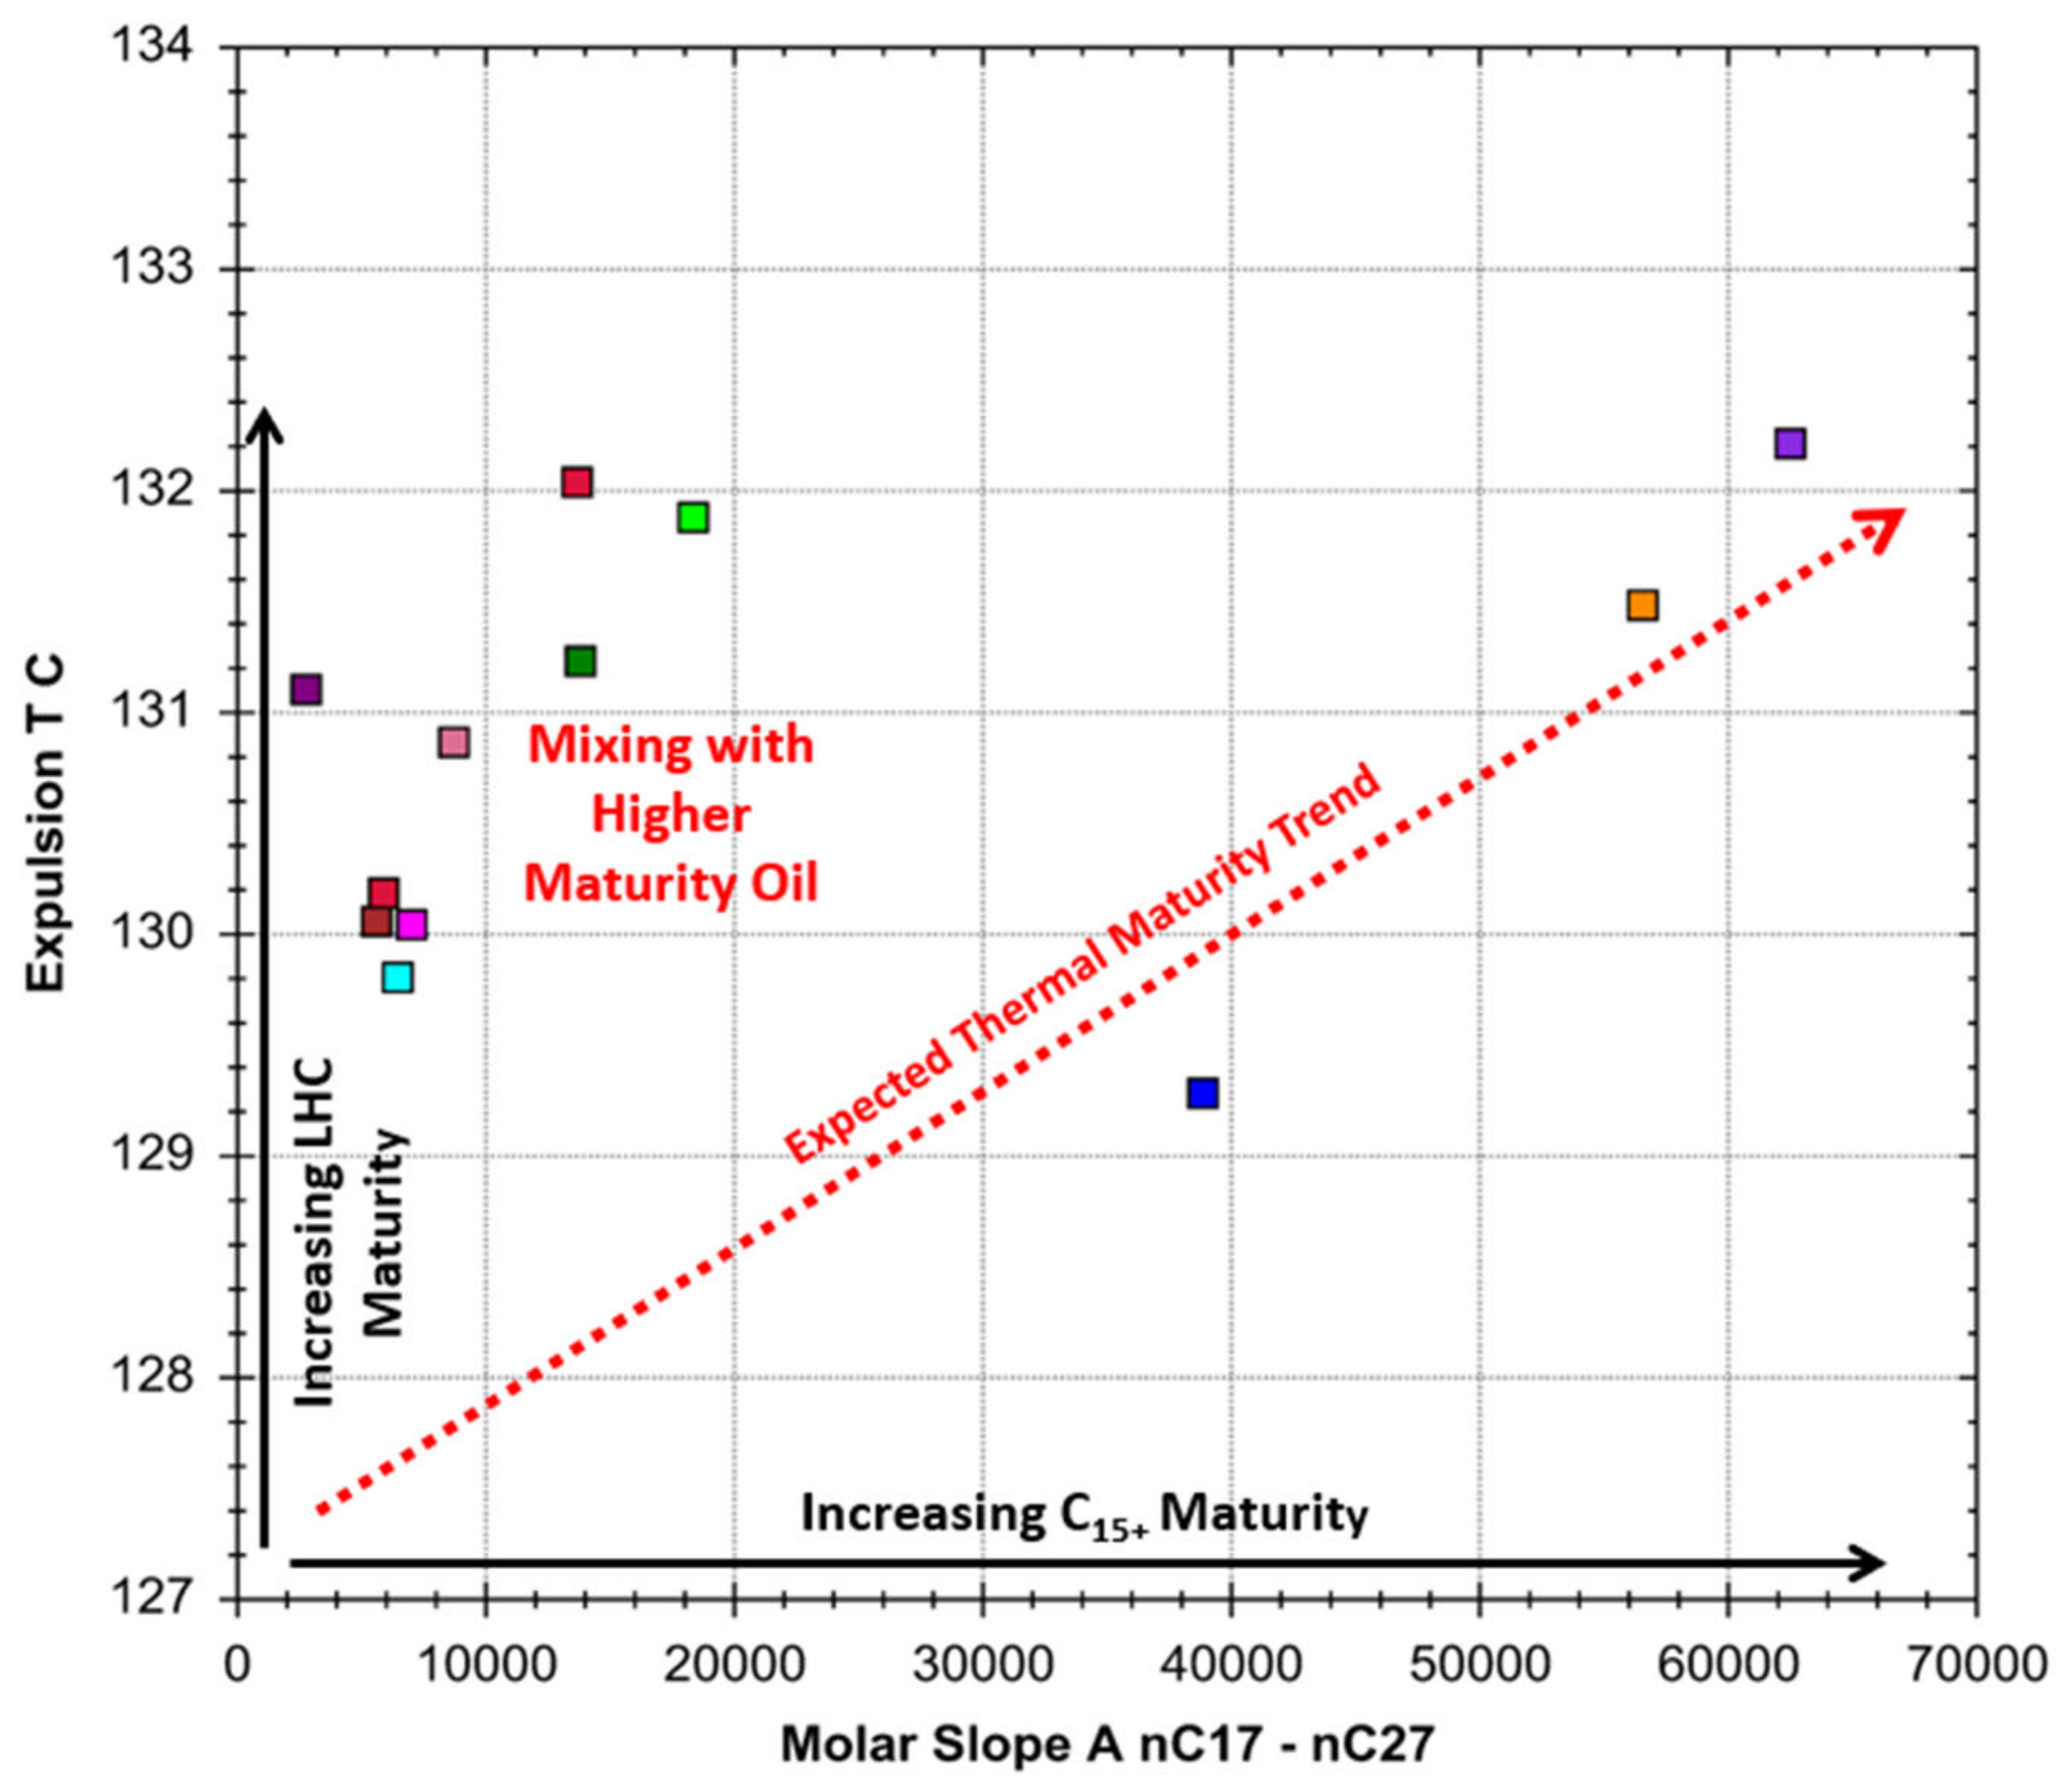
4.3. API Gravity and High-Resolution Gas Chromatography (HRGC) Analyses of Condensate Samples

The API Gravity of produced fluids measured in the wet gas region ranges from 57.8 to 74.6° (Table 6). All the samples are reported as condensate (>45° API) [52]. The condensates are dominated by light hydrocarbons mostly in the C6 to C15 range. Figure 13 shows two HRGC chromatograms of condensates produced in the wet gas region. The WG6 condensate exhibits a unimodal n-alkane distribution with a maxima at nC6 and resolvable hydrocarbons out to nC40. The WG2 condensate also exhibits a unimodal n-alkane distribution, with maxima at nC5, but GC peak responses are much diminished beyond nC12 and the resolvable hydrocarbons only extend out to nC30. All the produced condensate samples listed in Table 6 exhibit unimodal n-alkane distributions that vary between these two extremes with maxima between nC5 and nC7 and resolvable hydrocarbons between nC4 and nC40. Differences in the molar slopes of the light hydrocarbons (nC6–nC12) and the black oil C15+ hydrocarbons (nC17–nC27) observed on the HRGC chromatograms of the Marcellus samples (Figure 13 and Figure 14) reflect various primary and secondary processes that affected the produced fluids such as maturity and thermal alteration, expulsion and migration, mixing, gas stripping, water washing, and plausibly production fractionation [53,54].
Thompson [55] developed several C6–C7 ratios that are useful for describing light hydrocarbon distributions by compound class. A cross-plot of two of these ratios, the heptane and isoheptane ratios, is useful for assessing light oil maturity [56], including maturity of the Marcellus fluids (Figure 15a). The heptane and isoheptane ratios reflect the relative abundance of C7 structural isomers in the fluid [55]. The heptane ratio of the WG6 condensate is 29.85 and its isoheptane ratio is 5.71 (Table 6). The respective heptane and isoheptane ratios of the WG2 condensate are 33.56 and 8.55 (Table 6). These ratios suggest that the condensates are so-called supermature light oils. The supermature classification indicates that all of the light Marcellus oils were thermally cracked [55]. The fluids experienced protracted thermal transformation, i.e., ring opening, and substantial gasification (Figure 15a).
BeMent et al. [57] and Mango [58] concluded that the ratio of 2,4-dimethylpentane/2,3-dimethylpentane in light oil corresponds to the temperature of petroleum generation and expulsion from organic matter in a source rock:
°C7TEMPERATURE = 140 + 15((ln [2,4-dimethylpentane/2,3-dimethylpentane]).
C7 expulsion temperatures in the Marcellus Formation condensates range from 130 to 132 °C (Figure 15b) indicating late-mature hydrocarbons [52]. These temperatures are less than those indicated by post mature VRo values in the wet gas reservoirs (Figure 3 and Figure 9). Accurate C7 temperatures based on 2,4-dimethylpentane/2,3-dimethylpentane ratios are limited to a range of about 95 to 135 °C, the temperatures associated with intense generation and expulsion; subsequent thermal decomposition of oil expelled from parent kerogen into the pore space of the rock is unimportant [57,58]. I conclude that (1) primary Marcellus oils were mostly generated in the late oil window at burial temperatures of approximately 130 to 132 °C and subsequently (2) thermally cracked and altered to yield lighter hydrocarbons and gas. The API values of most condensates correlate with C7 expulsion temperatures (Figure 15b).
The two plots of toluene/nC7 against nC7/methylcyclohexane (MCH) shown in Figure 16 suggest additional alteration processes in the Marcellus condensates. Toluene/nC7 is an aromaticity ratio and nC7/MCH is a paraffinicity ratio. Unaltered marine oils have toluene/nC7 between about 0.2 and 0.6 and nC7/MCH between 0.4 and 1.5 [55,56]. Toluene/nC7 in the Marcellus condensates is between 0.11 and 0.21 and nC7/MCH is between 1.12 and 1.87 (Figure 16). Most of the Marcellus Formation liquids produced in the wet gas region appear to have been stripped by gas, i.e., migrating gas dissolved light end alkanes into itself [54]. Furthermore, the plots in Figure 16 shows systematic depletion of soluble toluene accompanied by increasing nC7 which suggests the hydrocarbons were affected by hydrodynamic flow and water washing [55]. Low concentrations of water-soluble benzene (0.62 to 1.19%) in the liquids support this interpretation [59]. Very low TR7 (1-trans−3-dimethylcyclopentane/1,1-dimethylcyclopentane) and TR8 (2-methylhexane + 3-methylhexane/2,2-DMP +2,3-DMP +2,4-DMP + 3,3-DMP + 3-ethylpentane) suggest migration and secondary alteration effects [59].
Figure 17 is a plot of C7 expulsion temperature versus molar slope A (nC17–nC27) for the Marcellus condensates. The plot provides a comparison of the thermal maturities of the light hydrocarbons (nC6–nC12) and the C15+ hydrocarbons in the oils. While a few samples follow the expected thermal maturity trend for normal unaltered oils, most samples plot up and to the left of that trend indicating mixing with higher maturity oil [54]. Most Marcellus Formation condensates produced in the wet gas region are mixtures of primary late-mature light oils cracked from kerogen and secondary liquids cracked from residual oils in the shales.

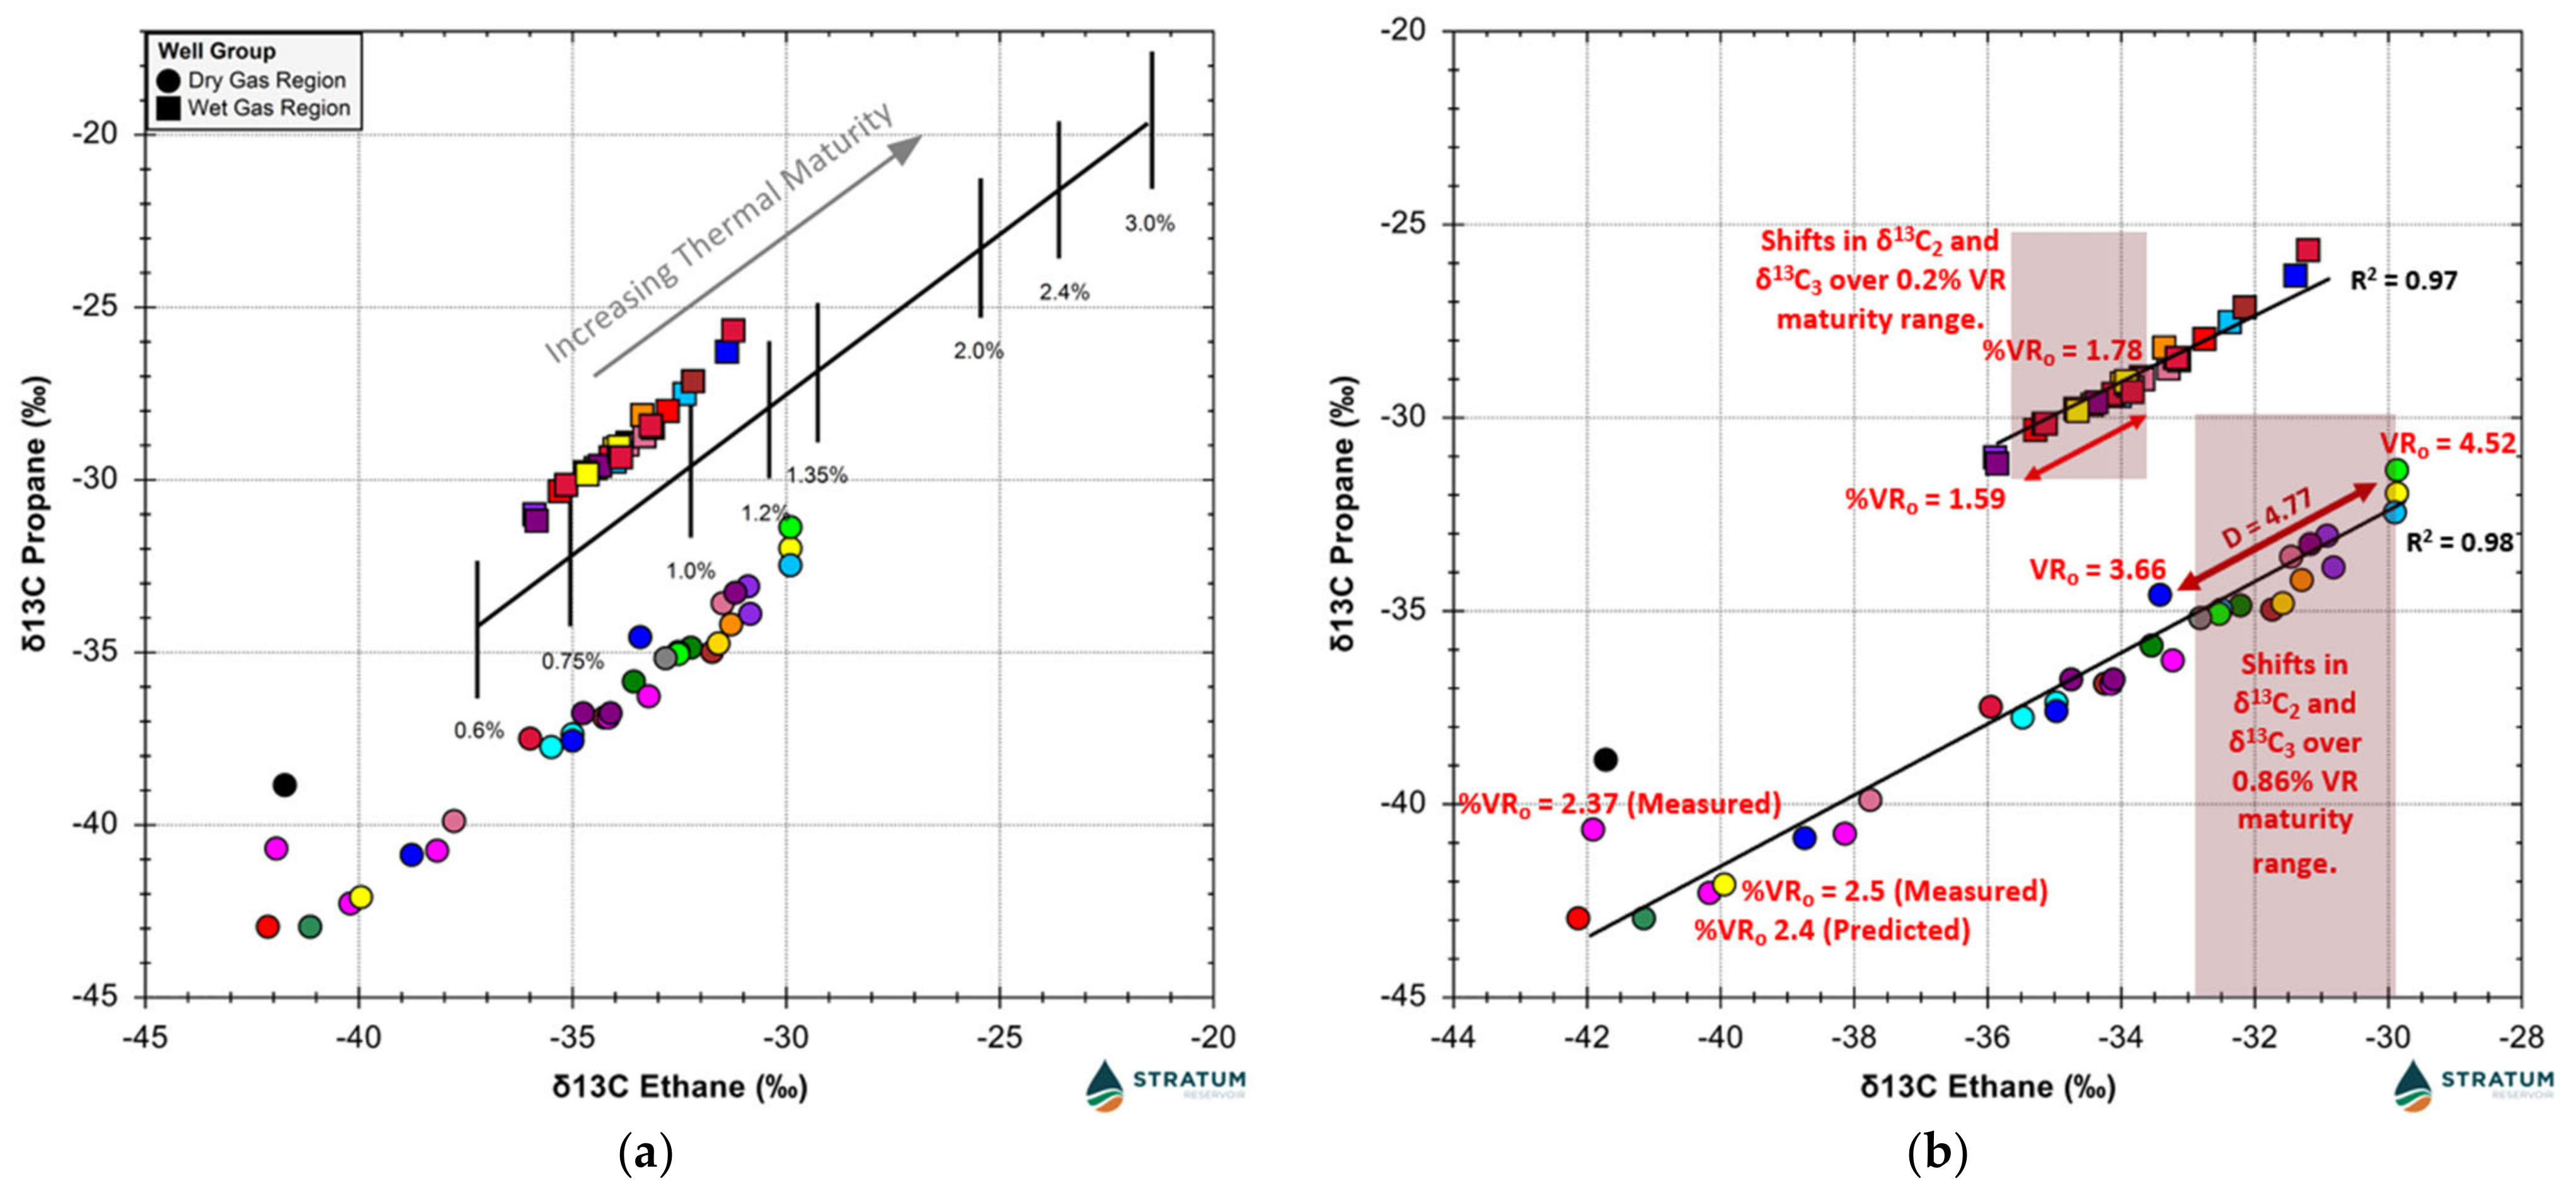
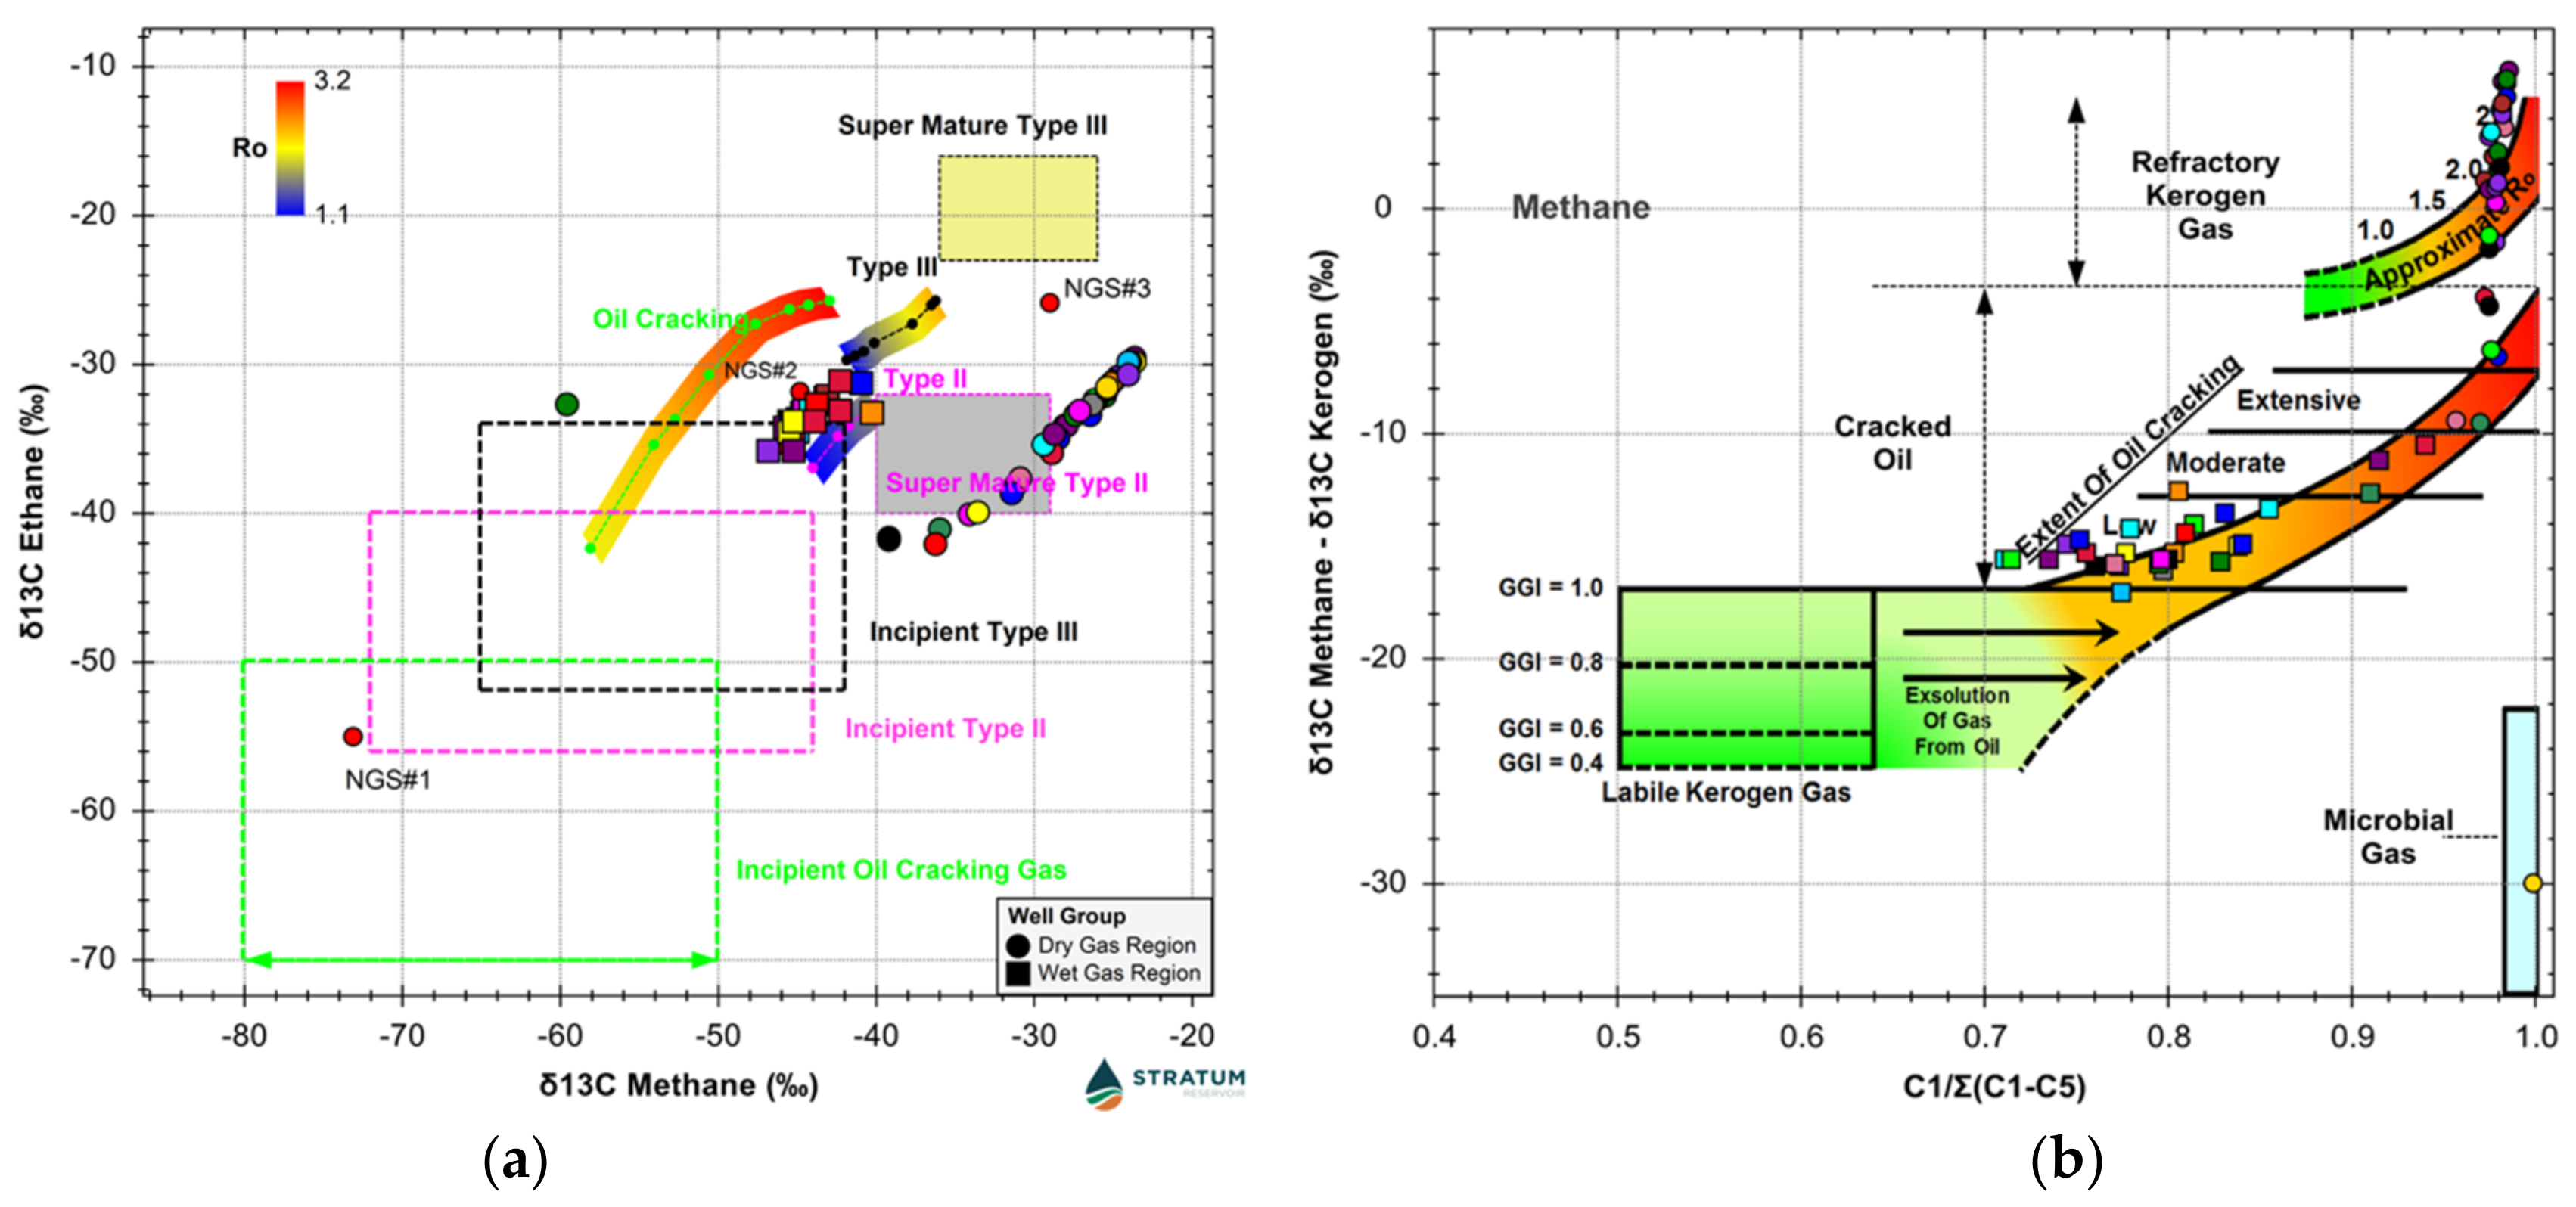
4.4. Variations in Thermal Maturity of Marcellus Formation Hydrocarbon Gases

As stated earlier, condensate production in the basin is from reservoirs with reported VRo of 1.0 to 2.8%. Dry gas production is from reservoirs with reported VRo from 2.0 to >3.0%. While VRo is considered a critical parameter for maturity assessment in the Marcellus play [1,11], it is a difficult value to accurately measure in these rocks [32]. Published vitrinite reflectance data and maps show VRo contours ranging from 0.5% in western New York, northwestern Pennsylvania, and eastern Ohio to between 2.5 and 3.5% in eastern New York, northeastern Pennsylvania, western Maryland, and central/eastern West Virginia [2,32,33]. On these maps, wet gas production in western Pennsylvania and northwest West Virginia is bound by VRo = 1.0 to 1.6% and dry gas production is bound by VRo = 2.0 to 3.5% [2]. This contrasts significantly with the carefully sampled and measured VRo completed for this study (Figure 3 and Figure 4) and in published site-specific investigations [29,30,31,32]. Published burial history reconstructions indicate modeled VRo of 1.3 to 1.8% in the wet gas region and 2.3 to 3.2% in the western part of the dry gas region [33,34]. Interestingly, reported measured VRo in samples collected from the same modeled wells are 0.75 to 1% in the wet gas region and ±2.0% in the dry gas region [33]. These large reported VRo discrepancies are due to numerous sources of error including sample type (core, cuttings, outcrop) and handling, contamination, lithology, and organic matter identification [32]. Organic matter in thermally post mature and overmature Marcellus Formation reservoirs consists mostly of a solid bitumen/pyrobitumen organic matrix with sparse inertinite (Figure 3 and Figure 4) [12,30]. Vitrinite is largely absent or difficult to recognize and oil-prone kerogens have been converted to hydrocarbons (Figure 4 and Figure 5) [30]. Consequently, many workers have endeavored to identify and utilize different geochemical proxies for rapid and practical maturity assessment during Marcellus reservoir development [12,30,32,60,61]. These include produced gas composition and stable gas isotopes [62,63,64].
Figure 18a is a popular maturity model from Whiticar [65] based on mathematical models published by Faber [66] and Whiticar [67]. This model grossly underestimates the actual thermal maturity of the Marcellus gases due secondary effects discussed below [65]. However, this plot of δ13C2 versus δ13C3 exhibits strong congruence for the gas isotopic values suggesting that the data do reflect thermal maturity [65,68,69]. Calculating distance between δ13C2 and δ13C3 of the Marcellus gas samples (Figure 18b) provides calibration of the carbon isotope correlation trends to measured and modeled maturity parameters.
Figure 19a is a plot of methane δ13C versus ethane δ13C. The trends for the wet and dry gas samples are again highly congruent although some scatter in δ13C1 values suggests mixing of gases cracked from kerogen and gases cracked from oil (discussed further below). In this model, the wet gas maturities do approximate those observed in the Marcellus Formation organic matter. The dry gas data, however, shift away from the modelled maturity trends and lie within the field of a so-called super mature Type II kerogen source.
Noble gas data also constrain the thermal maturity of dry gases collected in northeastern Pennsylvania (Figure 11b and Table 5). Hunt et al. [50] demonstrated that post mature to overmature gases in the northern Appalachian basin have δ13C2–δ13C1 ratios of −7.10 to 7.20 and 4He/40Ar* ratios of 12 to 65. The δ13C2–δ13C1 ratios of most Marcellus Formation hydrocarbons produced in the dry gas region are between −7.32 and −5.33. Most Marcellus 4He/40Ar* ratios range from 1.6 to 6.34, values within or below crustal noble gas production ratios due to high-temperature release of He, Ne, and Ar from the rocks [50]. 21Ne/40Ar* ratios (1.06 × 10⁻⁵ to 2.18 × 10⁻⁵) are below crustal production ratios as well [50].

4.5. Secondary Effects

Several secondary effects have altered the chemical composition and isotopic ratios of the produced Marcellus Formation gases. The documented range of carbon isotopic compositions of Marcellus organic matter suggests that some part of the range of isotopic compositions of the produced gases might be due to mixing of gases generated from kerogen with variable δ13C (Figure 7). However, a plot of gas dryness against the per-mil difference between kerogen δ13C and methane δ13C (Figure 19b) indicates that all the wet gas samples and several of the dry gas samples were altered by incipient to extensive oil cracking in the wet gas window. This is consistent with the heptane and isoheptane ratios in the condensates discussed above (Figure 15a). Gases derived from oil cracking are isotopically heavier than gases derived directly from kerogen cracking and become heavier with increasing maturity due to Rayleigh fractionation [68]. Gas derived from oil cracking mixes with earlier-formed gas derived from kerogen cracking which remained dissolved in the oil undergoing cracking [68]. Thus, the methane δ13C of the wet gas samples is a weighted average of the isotope ratio of the gas cracked from oil and earlier-formed gas cracked from kerogen [68,69]. Wet gas mixing and maturation trends are linear and highly congruent on the plots of methane δ13C versus methane δD (Figure 20a) and methane concentration (Figure 20b). The C2/C3 ratios and difference between δ13C2 and δ13C3 in these samples are 2.1 to 4.4 and −4.62 to −4.97‰, respectively, indicating secondary oil cracking [70]. Rayleigh-type fractionation should cause the isotope ratios of individual hydrocarbon components to be a linear function of the natural logarithm of the concentration as shown in Figure 21 [71,72]. Ethane isotope ratios of the wet gases plot on a straight line as a function of the inverse of concentration, indicating progressive depletion of δ13C2 with decreasing concentration (Figure 21). Wet Marcellus gases are mixtures of residual associated gases generated in the late-oil window and post-mature hydrocarbons generated from oil cracking in the wet gas window.
Most of the samples collected from the dry gas-producing region fall within the genetic field for methane cracked from refractory kerogen at VRo equivalents of approximately 1.5 to ≥ 2.5% on the plot of C1/∑C1-C5 versus the per-mil difference between methane and total source kerogen (Figure 19b). Actual thermal stress in these Marcellus rocks is much higher based on carefully measured VRo, illite crystallinity, H/C and O/C ratios, noble gas data, and calibrated stable gas isotope ratios (Figure 3, Figure 4, Figure 11 and Figure 18). Published mineral and fluid inclusion data indicate burial temperatures of 250–300 °C [30,72,73,74,75,76,77]. Lewan and Kotarba [78] experimentally demonstrated that primary gas generation from oil-prone and gas-prone kerogen and associated bitumen ends by a VRo of 2.0% because no alkyl moieties remain to source hydrocarbons. Secondary gas generation from oil cracking occurs primarily between VRo 1.7 and 2.9% [78]. Hydrocarbon gases already generated and trapped, however, can remain in the shales to much higher temperatures [78,79,80]. The productivity of Marcellus Formation reservoirs in the dry gas region is a function of shale reservoir properties (porosity, permeability, fluid saturations, rock mechanics) and hydrocarbon retention versus expulsion; productivity is not a function of thermal maturity [12,30,81,82]. The noble gas data listed in Table 3 support this interpretation. In Figure 22, mixing is evident between two atmosphere-derived end members, 20Ne and 36Ar. 20Ne is highly fractionated. 36Ar is non-fractionated. Atmospheric 36Ar exhibits a negative correlation with 20Ne/36Ar (Figure 22). Gas collected from economically productive wells have high 20Ne/36Ar. Gases sampled from poor producing wells with high water cut have low 20Ne/36Ar similar to unfractionated groundwater. Decreasing gas productivity and decreasing gas retention are correlated with decreasing 20Ne/36Ar (Figure 22).
Like the wet gases described above, the dry gas isotope ratios are cumulative so mixing of wet gas components generated by extensive oil cracking and methane derived from postmature refractory kerogen cracking is implied by the plot in Figure 19b [68]. The dry gas samples exhibit depletion in 2H as methane becomes progressively enriched in 13C (Figure 20a). This uncommon trend is also observed in deeper non-associated Silurian through Ordovician conventional and unconventional reservoir gases in the study area [72]. Burruss and Laughrey [72] suggested that isotopic exchange with formation water is one mechanism that could explain 2H depletion in methane produced from these deeper reservoirs. Isotopic exchange with formation water is a possible mechanism for 2H depletion in the dry Marcellus gases as well.
The isotopically heaviest methane measured in the Marcellus Formation to date, sampled from mud gases recovered from non-productive shale wells drilled in Luzerne County, Pennsylvania, has δ13C1 between −18.9 and −23.8‰ and δDC1 between −186 and −166‰ [12]. The dry gas mixing and maturation plots in Figure 20 are reflective of mixing with this isotopically heavy, postmature late-stage methane derived from refractory kerogen. C2/C3 ratios in the dry gas samples are between 20.5 and 44.4, and the difference between δ13C2 and δ13C3 is between 2.41 and 1.4‰ indicating secondary gas cracking [70]. The dry gas samples exhibit Rayleigh fractionation trends consistent with ethane and propane destruction during secondary gas cracking accompanied by redox reactions [72] (Figure 21).
One of the dry gas region samples (DG19) has an unusually light methane δ13C of −59.58‰ indicating a microbial gas component (Figure 6, Figure 7 and Figure 19b). Ethane δ13C is −37.2‰. The gas is a mix of microbial and thermogenic hydrocarbons. This sample has unusually high crustal 40Ar (3088.4 µcc/cc) and relatively high atmospheric 36Ar (9.65 µcc/cc) compared to other noble gas concentrations in this region (Table 4 and Figure 22). The high 36Ar concentration suggests recent interaction with atmospheric gases [44,45,46,47]. This sample has a 20Ne/36Ar ratio of 0.677 which approximates the upper limit for single-stage equilibrium for fractionation between groundwater and gas [44,45,46,47] (Figure 22). The sample also contained 17.2 mole% hydrogen suggesting hydrolysis and casing corrosion.

4.6. Isotopic Reversals: Origin and Significance

Experimental and field evidence indicates that most terrestrial thermogenic hydrocarbons have so-called normal δ13C and δD alkane patterns such as those exhibited by Marcellus Formation samples collected from the wet gas-producing region [37,38,39,40] (Figure 7a and Figure 8). This normal pattern, with δ13C1< δ13C2< δ13C3 and so on, and δDC1< δDC2 < δDC3 and so on, is the result of kinetic isotope fractionation in which the lighter carbon and hydrogen isotopes are more reactive than their heavier counterparts and take part in petroleum-generating reactions more readily [39,40]. Terrestrial hydrocarbons generated at high temperatures and pressures deeper within the crust, however, can have reversed δ13C and δD patterns [62,63,72,83,84,85,86,87,88,89,90,91,92]. Marcellus gases in the dry gas-producing region of the basin exhibit reversed patterns (Figure 7b and Figure 8).
The origin of isotopic reversals in dry gas is a controversial topic [85,86,87,88,89,90,91,92,93,94,95,96,97,98,99,100]. Reversed thermogenic δ13C and δD alkane patterns have been interpreted as diagnostic evidence for:
  • Mixing of different sources of alkanes or of hydrocarbons generated from the same source at different levels of thermal maturity [62,63,83,84,85,86,87];
  • A combination of mixing with either Rayleigh fractionation (for carbon isotopes) or the exchange of methane hydrogen with formation water [72];
  • Destruction and subsequent reformation of C2+ alkanes via gas-phase radical recombination reactions at high temperatures and pressures [90];
  • Depletion of 13C in residual ethane and propane as their molar fractions decrease during thermal decomposition [94];
  • Diffusive gas leakage [95];
  • Water reforming followed by Fischer–Tropsch synthesis [96];
  • Carbon exchange at high temperature [97];
  • Aerobic and anaerobic microbial oxidation of select alkane components [98];
  • Thermochemical sulfate reduction [99];
  • Isotopic fractionation during desorption from uplifted and de-pressurized late-mature shale resulting in isotope reversals in residual gas [92]; and
  • Hydrogen and carbon isotope distributions reflecting thermodynamic equilibrium either at the conditions of gas formation or during reservoir storage [100].
Two of these proposed mechanisms for generating isotopic reversals, microbial oxidation and thermal sulfate reduction, can be ruled out for the dry Marcellus gases based on geologic setting. Diffusive gas leakage is eliminated as a possible mechanism because the Marcellus reservoirs produce both isotopically heavy hydrocarbons and enriched light noble gases [50]. The Marcellus 4He/CH4 ratios (283.1 to 907.6) are consistent with in situ Marcellus reservoir gases [8]. While C2–4 alkane synthesis from methane during gas-phase radical recombination reactions at high temperatures and pressures, resulting in isotopic reversals, has been demonstrated experimentally and for some abiogenic hydrocarbon reservoirs [88,89,90,91], maximum burial temperatures for the Marcellus Formation in northeast Pennsylvania fall short of those needed for these reactions [91]. Any argument for water reforming followed by Fischer–Tropsch synthesis remains equivocal because supporting carbon isotope measurements for CO2 are mostly lacking in this dataset. The δ13CO2 of the DG12 and DG19 gas samples (−26.5‰ and −31.8‰, respectively) suggest that hydrocarbon oxidation might have affected these gas samples so might support such an interpretation [38,96]. However, mud gas δ13CO2 of wells in the study area are between −19.7‰ and −10.2‰, values more indicative of kerogen decarboxylation and high thermal stress [36,37,38].
Depletion of 13C in residual ethane and propane during thermal decomposition [94] is a plausible hypothetical explanation for the carbon isotopic reversals observed in the Marcellus dry gas samples. However, the hydrogen isotope reversals (Figure 8) and variable, but significant, concentrations of atmospheric noble gas components (20Ne, 36Ar, 84Kr) in the produced gases provide strong supporting evidence for the role of water-involved reactions in generating the isotope reversals [44,45,46,47,50,51,72,100].
Carbon and hydrogen isotopic reversals in the dry Marcellus Formation gases resemble those described by Burruss and Laughrey [72] for deeper Silurian and Ordovician conventional and unconventional reservoirs in northeastern and north-central Pennsylvania and south-central New York state. As in those deeper reservoirs, mixing combined with Rayleigh fractionation for the carbon isotopes (Figure 20 and Figure 21) and the exchange of methane hydrogen with formation water for the hydrogen isotopes provides a plausible model for the Marcellus isotope reversals shown in Figure 7b and Figure 8. Methane δD in the dry Marcellus gas samples ranges from −163.9 to −157.7‰ (Figure 8). Produced Marcellus brines in the dry gas region have reported δD between −49.1 and −41.5‰ [101]. Methane δD is depleted by approximately −118.8‰ relative to co-produced water. Methane equilibrated with formation water of the reported isotopic composition should have δD compositions of about −183‰ to −160‰ assuming maximum burial temperatures of 250 to 300 °C [72,102]. Measured δD in the dry Marcellus gas samples has this composition (Figure 6b and Figure 20a; Table 1). The noble gas data discussed above indicate gas/water phase equilibrium for most Marcellus dry gases (Figure 12). Whyte and Darrah [103] argued that hydrocarbon isotope reversals are generated in relatively closed systems that retain greater amounts of ASW noble gas components as observed in the Marcellus gases and in the deeper Silurian and Ordovician fluids in the study area [72]. Finally, experimental work published by Gao et al. [104] demonstrated that water facilitates secondary cracking of C2+ hydrocarbons to methane, possibly via a hydrated surface with catalytic activity, thus supporting the Burruss and Laughrey [72] model for isotopic reversals.
Milkov et al. [92] examined a comprehensive global data set of shale-gas composition and isotope data and observed that samples with carbon isotope reversals generally occur in onshore shale plays with overmature organic matter that underwent significant tectonic uplift. They hypothesized that isotope fractionation during desorption induced by significant basin inversion and depressurization of overmature shale source rocks leads to carbon isotope reversals. They concluded that the amount of uplift and associated depressurization is more important to creating isotopic reversals than thermal maturity in shale plays. Milkov et al. [92] noted that produced Marcellus gases with isotopic reversals occur in areas with 3 to 5 km of uplift and VRo between 2 and 4% while produced Marcellus gases without reversals occur in areas with 1 to 2 km of uplift and VRo between 1 and 2%. Milkov et al.’s samples without reversals are from wells completed along the up-dip margins of the Appalachian basin in western and central New York and in northwestern and western Pennsylvania [86,92,105]. The Marcellus wet gas samples without reversals in this paper’s data set (Figure 7a) are from deeper locations that experienced ~1.04 to 2.4 km of erosion and uplift, have maturities of 1.59 to 1.78% VRo, and are within the boundaries of the Rome Trough, a northeast-trending graben that is one of the major Cambrian interior rift system elements that extends into the Appalachian foreland basin [106]. In addition to burial temperatures, the thermal history of Devonian black shales within the Rome Trough was affected by excess heating connected to hot brine migration within the structure [107]. Marcellus dry gas samples with reversals in this paper’s data set are from locations that experienced ~2.6 to 2.9 km of erosion and uplift and have maturities of 2.35 to 4.61% VRo. The Marcellus gases without reversals in this paper’s data set fall within the maturity parameters of such gases as defined by Milkov et al. [92] but experienced greater uplift. The Marcellus gases with reversals in this paper’s data set are within the maturity range of such gases as defined by Milkov et al. [92] but experienced somewhat less uplift than those classified as reversed by those authors. However, uplift in the dry gas region was more rapid than in other parts of the basin and was accompanied by more rapid post-Alleghenian cooling and unroofing [108].
The Milkov et al. [92] hypothesis is compelling, particularly because it is based on a large global data set. However, the Marcellus produced gas isotope data do not entirely support their conclusion that uplift and associated depressurization is more important than thermal maturity for generating isotopic reversals in shale plays. In Figure 7b, the gases produced from Marcellus Formation shale with VRo = 2.37% exhibit partial reversals with δ13C1 > δ13C2 < δ13C3. Uplift and erosion amounted to ~2.6 km at this well location (WVDG1 and WVDG2 in Upshur County, WV) [33,34]. All of the remaining dry gas samples exhibit full carbon isotopic reversals, with δ13C1 > δ13C2 > δ13C3, with the δ13C of each gas component essentially increasing in parallel with increasing VRo without any significant change in slope (Figure 7b). Furthermore, gas accumulations in Middle and Upper Devonian conventional sandstone reservoirs sourced by the Marcellus shale exhibit partial to full carbon isotopic reversals in several different parts of north central and western Pennsylvania, most of which experienced ≤2 km of uplift and erosion [7,62,109,110]. Petroleum generation and expulsion in Marcellus source rocks, and migration/accumulation in these conventional reservoirs occurred between ~359 and 225 Ma [33] suggesting that the isotopic compositions of the conventional reservoir gases are cumulative [66,69]. Combined oil and gas geochemical systematics of Marcellus-Upper Devonian sandstone petroleum system elements in Bradford County, Pennsylvania show carbon isotope reversals generated in-situ in a conventional Lock Haven Formation reservoir due to mixing of primary hydrocarbons and secondary gases from oil cracking [111]. Finally, comparisons of δ13C1–3 variations observed during laboratory degassing of Marcellus pressure core with time-lapse production gas isotopic measurements (discussed below) contradict the hypothesis that molecular and isotopic fractionation during desorption after depressurization (from uplift and production fractionation) is the principal mechanism causing isotopic reversals in the Marcellus dry gas reservoirs.
Thiagarajan et al. [100] proposed that C2+ n-alkane gases are initially produced by irreversible cracking chemistry, but, as thermal maturity increases, the isotope distribution of these species approaches thermodynamic equilibrium, either at the conditions of gas formation or during reservoir storage. They argue that at higher maturities the conversion of C2+-rich wet gas to methane-dominated dry gas is controlled by thermodynamic conditions (temperature, fO2, and fH2). In this model, the spatial and temporal distributions, and chemical/isotopic compositions, of major gas components and their breakdown products are controlled by their relative thermodynamic stabilities. Highly mature gases (VRo > 2%) such as the dry Marcellus fluids attain thermodynamic equilibrium. Turner et al. [112] concurred showing that (1) thermogenic gases may form in hydrogen isotopic equilibrium with co-occurring formation water and (2) that CH4-CO2 carbon isotopic equilibrium is a function of temperature in thermogenic shale-gas settings. Isotopic reversals observed in both unconventional and conventional reservoirs may be a function of quasi-equilibrium chemistry [100,112]. Modeled gas mixing in combination with Rayleigh fractionation and methane hydrogen exchange with formation water (Figure 20 and Figure 21) is useful for describing isotopic enrichment or depletion as material moves between reservoirs in an equilibrium process and is consistent with these recently proposed thermodynamic equilibrium models.
Although the actual mechanism (or mechanisms) responsible for isotopic reversals in natural gases are debatable and consensus remains elusive, plots of δ13C ratio distributions in reversed gases such as those shown in Figure 7b have pragmatic utility for identifying and mapping economic production limits in deep basins [72].

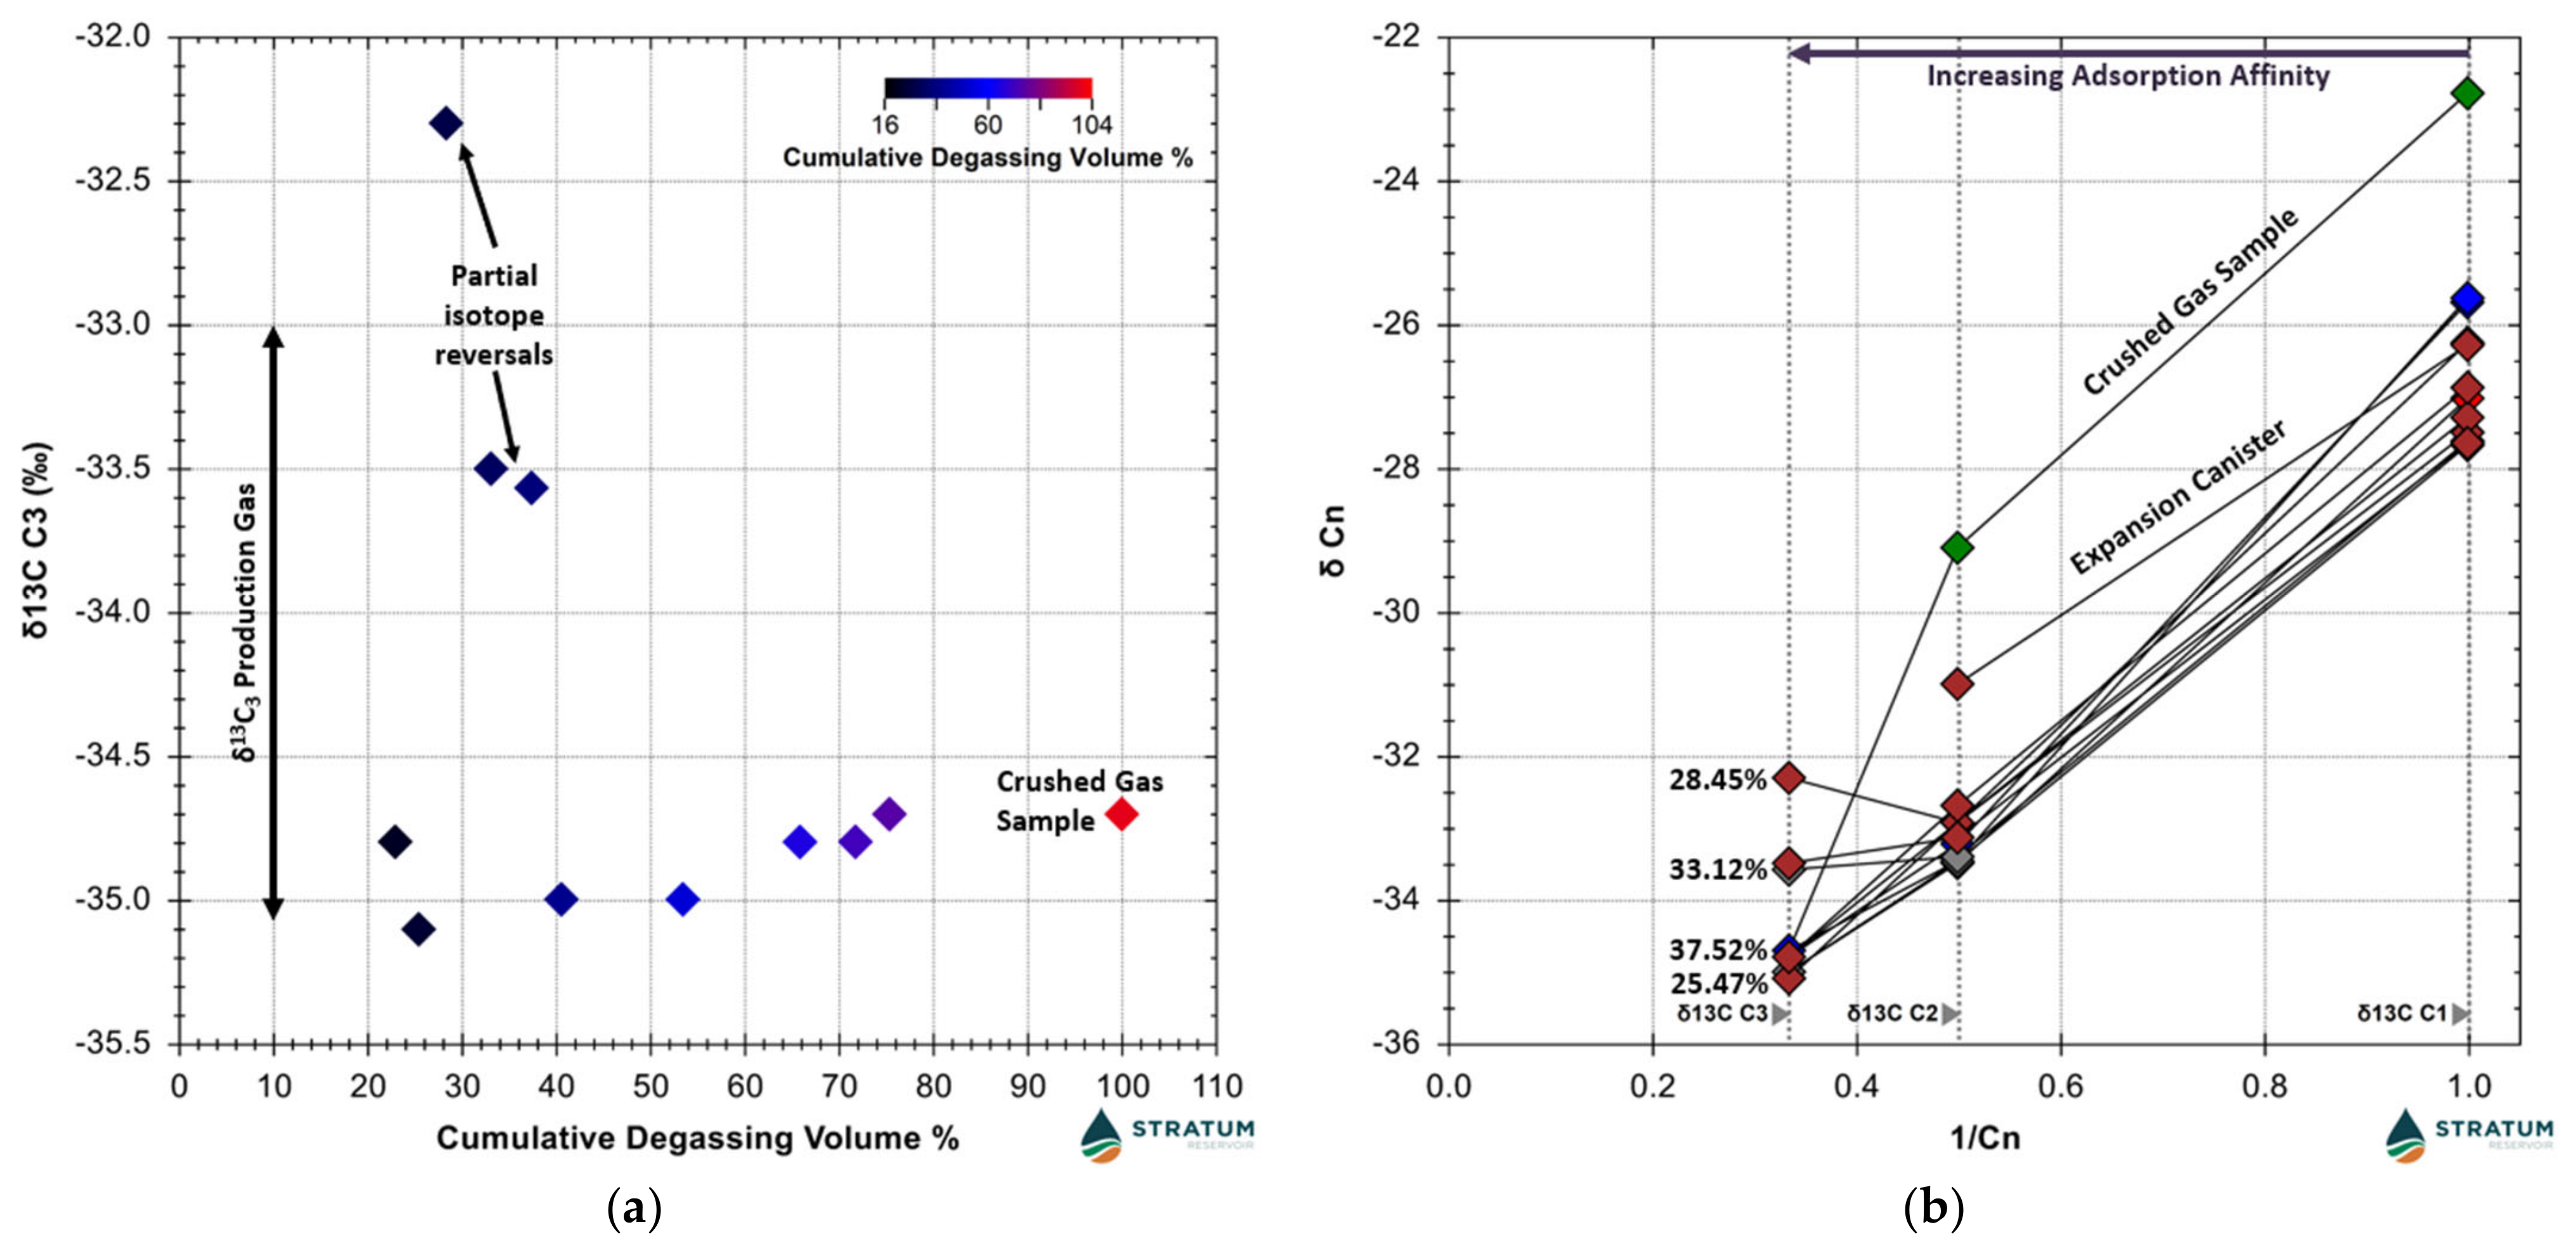
4.7. Stable Isotope Systematics of Marcellus Formation Shale-Gas during Pressure Core Degassing and Production

Unconventional shale-gas and shale-oil core delivered to the surface in pressurized sealed containers, which maintain formation pressure, facilitate direct gas-in-place measurements in the laboratory [113,114]. The cores are drilled under reservoir pressure and lifted to the surface without any loss of reservoir gas during transit. Controlled release of pressurized core samples in the laboratory permits accurate measurements of gas volumes extracted from natural high-pressure mudrocks. This laboratory procedure also provides an opportunity to collect a time-lapse series of reservoir gas chemical and isotopic analyses to document geochemical changes that occur during degassing of the core samples. Degassing is defined as expulsion of both gas phase and adsorbate phase gas molecules from the rock matrix [115]. These data reveal diagnostic geochemical trends that systematically vary with degassing time and cumulative hydrocarbon yield. Should such laboratory data anticipate gas compositional and isotopic variations during production, then they might provide useful predictive information about well performance over the operational life of the well [113].
The Marcellus pressure core samples listed in Table 3 provided a time-lapse data set of carbon isotopic measurements that document changes that occurred during degassing of the rock. Methane δ13C measured during direct gas-in-place analysis of the Marcellus pressure core shows changes that vary systematically with cumulative degassing volume (Figure 23a). Initially, the methane became depleted in 13C with increasing degassing time with a corresponding negative shift in 13C of 1.38‰ at ~34% cumulative degassing volume. This early fractionation was due to the drop in partial pressure and the diffusivity difference of the isotopolouges [115]. Adsorption/desorption within the reservoir pores was coupled with diffusion and delayed mass transport. 12C was preferentially desorbed. This trend was followed by enrichment in methane 13C beginning at approximately 40% of the cumulative degassing volume. Enrichment in 13C1 continued with increasing degassing time with a positive isotope shift of 2.05‰ by 75.35% of the cumulative degassing volume. δ13C increased towards the carbon isotope composition of crushed gas, i.e., gas liberated from the shale by mechanical crushing at the end of the degassing experiment. Methane concentration of the crushed gas sample was 0.794 mole% and the final observed positive shift in 13C towards the crushed gas was 4.88‰.
Ethane and propane δ13C showed very different variations during direct gas-in-place measurements of Marcellus pressure core mostly due to increasing adsorption affinity from C1 to C3. The pattern of ethane δ13C variation was, at first, similar to that of methane (Figure 23a,b). The initial ethane δ13C of −31‰ approximated the median δ13C2 of production gases in the region, but rapidly decreased to −33.5‰ by 53.53% of the cumulative degassing volume (Figure 23b). This decrease was followed by a small positive δ13C shift of 0.56‰ at 66.03% of the cumulative degassing volume before it resumed a decreasing δ13C trend with increasing cumulative degassing volume. However, the ethane δ13C of the crushed gas sample was −29.1‰, a positive shift of 4.14‰ from the final degassing sample measured at 71.81% cumulative degassing volume. Propane δ13C initially decreased by 0.3‰ between 22.93 and 25.47% of the cumulative degassing volume before exhibiting significant 13C enrichment between 28.45 and 37.52% of the cumulative degassing volume, with a positive shift of 2.8‰ (Figure 24a). Propane δ13C then decreased to −35‰ at 40.69% of the cumulative degassing volume followed by steady 13C enrichment until the end of the degassing experiment. The crushed gas δ13C of −34.7‰ is consistent with the average propane δ13C of 34.9‰ in the immediate field vicinity.
Diffusion and desorption are the principal processes affecting the carbon isotope ratios of the Marcellus pressure core samples during laboratory degassing measurements. The variable direction and magnitude of isotope fractionations in the shale-gas samples during degassing are a function of these secondary processes. The plots in Figure 23 and Figure 24 support the model predictions of Xia and Tang [115] who postulated that large isotopic fractionation due to gas transport would be observed under laboratory conditions with significant degassing.
The natural gas plot of the pressure core carbon isotope results reflects these secondary processes as well as those inherent in the Marcellus reservoir prior to drilling. The plot exhibits both partial and full carbon isotope reversals, with mostly non-linear trends (Figure 24b). The fully reversed natural gas plots of most of the pressure core degassing samples align with those of production gases in the study area (Figure 7b). However, there are three exceptions to this generalization. First, the ethane δ13C of the initially released expansion canister gas is distinctly enriched in 13C compared to all the other pressure core samples. There was insufficient propane in this sample for isotopic analysis. Second, propane in three of the degassing samples is enriched in 13C compared to the other samples and consequently exhibits partial carbon isotopic reversals with δ13C1 > δ13C2 < δ13C3 (or approximately equal to δ13C3; Figure 24a). Third, the δ13C of methane and ethane in the crushed gas sample is significantly enriched in 13C relative to the other degassing samples. This is not surprising because the ratio of adsorbed gas to free gas should be largest in the crushed gas samples resulting in larger observed fractionations [115]. The natural gas plot for the crushed gas is like that of the most thermally mature (VRo ≥ 4.5%) and marginally productive Marcellus shale-gas wells in the basin (Figure 7b).
Unlike the pressure core degassing samples, limited time-lapse geochemical analyses of Marcellus Formation natural gases in the northern Appalachian basin do not reveal significant or systematic changes of stable carbon isotope ratios that vary with production (samples noted in bold dark blue in Table 1). In the dry gas-producing region, for example, methane δ13C of mud gas samples collected from the vertical and horizontal legs of the DG11/DG12 well on 2/21/2011 ranged between −25.0 and −22.8‰. Methane δ13C of production gas collected from the well on 10/19/2011 was −24.04‰ (DG11 in Table 1). Methane δ13C of production gas collected on 12/18/2014 was −23.90‰ (DG12 in Table 1). Ethane and propane carbon isotopic data exhibit similar invariance. The δ13C2 of mud gases collected on 2/21/2011 ranged between −30.3 and −28.9‰ and the δ13C3 was between −32.6 and −30.8‰. Ethane and propane δ13C of production gas collected from the well on 10/19/2011 were −29.9 and −32.5‰, respectively. On 12/18/2014, the production gas δ13C2 was −29.86‰ and the δ13C3 was −31.4‰. Similarly, in the wet gas-producing region, the respective methane δ13C values of gas samples WG2/WG13/WG14 (same well) collected in April and May 2019 and January 2020 were −45.5, −45.23 and −45.5‰ (Table 1). Ethane δ13C of gas collected on these dates was −35.28, −35.12 and −35.14‰. Respective propane δ13C of wet gas collected in April 2019 and in May 2019 was −30.34 and −30.34‰. Propane δ13C was −30.2 in January 2020. These observations are consistent with the model predictions of Xia and Tang [115]. Although δ value variations of up to 10‰ can occur during laboratory degassing experiments, depending on the cumulative degassing volume, production gas flowing from shale-gas reservoirs should be dominated by advective flux through stimulated fractures which has little fractionation effect [115].

4.8. Relevance to Environmental Issues in the Marcellus Play of the Appalachian Basin

In addition to energy production (heating and electricity generation), natural gas provides critical feedstock for a variety of necessities in modern economies such as basic chemicals, plastics, synthetic fibers, resins, dyes, foams, adhesives, explosives, synthetic rubber, paints and coatings, industrial chemicals, and numerous medical supplies. NGL directly contribute to the manufacture of solar panels and wind turbines. The mining of critical minerals needed to manufacture electric batteries and fuel cells is dependent on the energy supplied by fossil fuels. Natural gas extraction will continue as a fundamentally important societal resource well into the 21st Century. The Marcellus Formation in the Appalachian basin will continue to serve as one of the world’s most significant natural resources for some time to come [5]. However, the commercial success of the Marcellus unconventional play has led to public apprehension about the safety of shale-gas and shale-oil extraction. Concerns about the safety of petroleum development in the region are focused on stray gas migration to shallow groundwater aquifers and wells, buildings, and the atmosphere, as well as the potential for contamination from toxic materials in produced brine or hydraulic fracturing fluid during drilling, transport, and disposal [7,8,9,10,116,117,118,119,120]. Hydrocarbon migration into shallow groundwater aquifers in the study area occurs both naturally [117,118,119,121] and as a consequence of oil and gas well operations [116,120]. The geochemical data and interpretations provided in this report comprise a significant contribution to the available regional background dataset against which stray gas investigations may be conducted [7,118,119,121].
Methane is the third most important greenhouse gas (after water vapor and CO2) and thus an important contributor to global climate change [120]. Fossil fuels represent an obvious and important potential source of increasing atmospheric methane concentrations due to growing global production. Milkov et al. [122] utilized a global dataset of δ13C1 measurements from >1600 shale-gas wells to constrain the contribution of shale-gas emissions to the observed atmospheric increases in the global CH4 load and concluded that increases in atmospheric CH4 since 2008 are not dominated by emissions from shale-gas operations. Their conclusions are supported by the observation that increasing CH4 concentrations are accompanied by 13C depletion. Milkov et al.’s [122] conclusions are consistent with studies by Schaefer et al. [123] and Schwietzke et al. [124] who argue that the recent increase in atmospheric CH4 concentrations is a result of increasing microbial methane emissions with lesser to no significant increased contributions from fossil fuel emissions [125]. Howarth [126] challenged this interpretation and claimed that emissions from shale-gas, and probably shale-oil, production make up more than half of the total increase in fossil fuel emissions since 2008. He based his interpretation on the erroneous claim that the δ13C1 of shale-gas is notably lighter than that of conventionally produced hydrocarbons. Lewan [125] thoroughly disputed and dismissed Howarth’s [126] argument by reviewing several shale-gas datasets, including Marcellus Formation mud gas data published by Baldassare et al. [7]. The production gas isotopic dataset provided in this report support and refine the arguments of Milkov et al. [122] and Lewan [125]. The dataset for this report should also help supplement and facilitate ongoing research related to atmospheric methane and ethane emissions in the study area [10,127,128].

5. Conclusions

Regional differences in Marcellus thermal maturity and hydrocarbon alteration effects define specific wet gas and dry gas production in the Appalachian basin. Thermal maturity and hydrocarbon alteration are best constrained by fluid chemistry. Marcellus hydrocarbons recovered in the wet gas region are mixtures of residual primary-associated gases generated in the late-oil window and post-mature secondary hydrocarbons generated from oil cracking in the wet gas window. Condensate production in the wet gas region is constrained by increasing maturity in conjunction with oil cracking and gasification. Most Marcellus liquids also have been stripped by gas and altered by hydrodynamic flow and water washing. Gas stripping results in enhanced expulsion and migration in some wells resulting in reduced liquid reserves related to depletion of more volatile hydrocarbon components [129]. Water washing also removed more water-soluble compounds to varying degrees within the sample set discussed in this report. Although water washing in low permeability mudrocks may seem unlikely to many readers, several investigators have published evidence that supports this interpretation. Repetski et al. [130] speculated that a westward bulging salient in Devonian conodont alteration indices mapped in north central West Virginia reflets the migration of hot, basin-derived brines. Dorobek [131] published fluid inclusion evidence for hot basinal fluid migration through Devonian rocks in the study area. Evans [132] and Evans et al. [133] published evidence for the influx of low-salinity, CH4-saturated brines during the Alleghenian orogeny. Tamulonis and Carter [134] recently published unequivocal evidence for hydrothermal alteration in Devonian shales in the Rome Trough. And Atwah et al. [135] documented water washing in the analogous Woodford Shale of the Anadarko basin.
Marcellus hydrocarbons recovered in the dry gas-producing region are mixtures of residual methane cracked from overmature refractory organic matter and hydrocarbons generated by extensive oil and wet gas cracking. Production in the dry gas region is largely constrained by relative gas retention versus expulsion as controlled by regional and local structure, and by seal integrity. Noble gas systematics reveal gas retention versus migration trends in the produced fluids. Thermal maturity also influences productivity where declining well performance is correlated with increasing relative proportions of late-stage residual methane and decreasing amounts of gas generated by oil/wet gas cracking. This trend is accompanied by increased aromatization, graphitization, and loss of the interconnected organic porosity within a pyrobitumen network [30] (Figure 25).
The data provided by this report also facilitate the identification of sources of stray gas contamination and provide new baseline measurements for comparison with atmospheric greenhouse gas measurements conducted to monitor fugitive emissions of atmospheric methane.

Funding

This study was financed by Stratum Reservoir.

Data Availability Statement

Numerical data are presented in Table 1, Table 2, Table 3 and Table 4. Well names and locations for the data listed in Table 1, Table 2, Table 3 and Table 4 remain proprietary.

Acknowledgments

The author thanks Mark McCaffrey, Tim E. Ruble, and Matt Flannery (Stratum Reservoir) for early internal reviews of the original draft manuscript and for their encouragement and support over the course of this work. Tim Ruble in particular, and several colleagues cited in reference 12], collaborated on, debated, and co-published much of the background and ancillary data discussed in this report. The author also has benefitted from many lively discussions with Robert Burruss, Fred Baldassare, Dennis Coleman, Martin Schoell, Xinyu Xia, Yongchun Tang, Barbara Tilley, Daniel Jarvie, Stephen Brown, Wallace Dow (deceased), Michael Lewan, Thomas Darrah, Richard Drozd, and John Curtis about the origin of isotopic reversals in natural gas. The debate will continue. Wayne Knowles (Stratum Reservoir) performed and interpreted all of the organic petrographic data reported for this study. Kris Carter and John Harper (Pennsylvania Geological Survey) kindly supplied the stratigraphic diagrams in Figure 2 and their permission to publish them in this paper. William Zagorski (Range Resources) shared the SEM image in Figure 5a and provided encouragement and support for my earliest work on Marcellus Formation gases. I thank the Pennsylvania Geological Survey, Range Resources, EQT, Chief Oil and Gas, Ovintiv Inc. (formerly Encana Natural Gas), and Antero Natural Resources for permission to utilize the data provided in this report. Geochemical analyses were performed at Stratum Reservoir (formerly Weatherford Laboratories) facilities in Houston, Texas and Champaign, Illinois (Isotech Laboratories), and at SmartGas Science in Columbus, Ohio.

Conflicts of Interest

The author declares no conflict of interest.

References

  1. Popova, O. Marcellus shale play geology review. U.S. Energy Administration Updates to Marcellus Shale Play Maps; U.S. Department of Energy: Washington, DC, USA, 2017; p. 14.
  2. Higley, D.K.; Leathers-Mills, H.M.; Enomoto, C.B. Controls on petroleum resources for the Devonian Marcellus Shale in the Appalachian basin province, Kentucky, West Virginia, Ohio, Pennsylvania, and New York. Mt. Geol. 2019, 56, 323–364. [Google Scholar] [CrossRef]
  3. U.S. Energy Information Administration. Proved Reserves of Crude Oil and Natural Gas in the United States; U.S. Energy Information Administration: Washington, DC, USA, 2022; p. 51.
  4. Khosrokhavar, R.; Griffiths, S.; Wolf, K.-H. Shale-gas formations and their potential for carbon storage: Opportunities and outlook. Environ. Process. 2014, 1, 595–611. [Google Scholar] [CrossRef]
  5. Carter, K.M.; Patchen, D.G. A geologic study to determine the potential to create an Appalachian storage hub for natural gas liquids. Final. Rep. Appalach. Oil Nat. Gas. Res. Consort. 2018, 3, 162. [Google Scholar]
  6. Blood, D.R.; Douds, A.S.B.; Wright, M. A proposed model for quantifying critical mineral occurrence from unconventional sources: An example from the Marcellus shale, Appalachian basin, USA. In Proceedings of the 50th Annual Eastern Section AAPG Meeting Program with Abstracts, Pittsburgh, PA, USA, 3–5 October 2021; p. 19. [Google Scholar]
  7. Baldassare, F.J.; McCaffrey, M.A.; Harper, J.A. A geochemical context for stray gas investigations in the northern Appalachian basin: Implications of analyses of natural gases from Neogene-through Devonian-age strata. AAPG Bull. 2014, 98, 341–372. [Google Scholar] [CrossRef]
  8. Darrah, T.H.; Vengosh, A.; Jackson, R.B.; Warner, N.R.; Poreda, R.J. Noble gases identify the mechanisms of fugitive gas contamination in drinking-water wells overlying the Marcellus and Barnett Shales. Proc. Natl. Acad. Sci. USA 2014, 111, 14076–14081. [Google Scholar] [CrossRef]
  9. Molofsky, L.; Connor, J.A.; Van De Ven, C.J.C.; Hemingway, M.P.; Richardson, S.D.; Strasert, B.A.; McGuire, T.M.; Paquette, S.M. A review of physical, chemical, and hydrogeologic characteristics of stray gas migration: Implications for investigation and remediation. Sci. Total Environ. 2021, 779, 146234. [Google Scholar] [CrossRef]
  10. Miles, N.L.; Martins, D.K.; Richardson, S.J.; Rella, C.W.; Arata, C.; Lauvaux, T.; Davis, K.J.; Barkley, Z.R.; McKain, K.; Sweeney, C. Calibration and field testing of cavity ring-down laser spectrometers measuring CH4, CO2, and δ13CH4 deployed on towers in the Marcellus Shale region. Atmos. Meas. Tech. 2018, 11, 1273–1295. [Google Scholar] [CrossRef]
  11. Zagorski, W.A.; Wrightstone, G.R.; Bowman, D.C. The Appalachian basin Marcellus gas play: Its history of development, geologic controls on production, and future potential as a world-class reservoir. Shale Reserv. AAPG Mem. 2012, 97, 15–18. [Google Scholar]
  12. Laughrey, C.D.; Lemmens, H.; Ruble, T.E.; Butcher, A.R.; Walker, G.; Kostelnik, J.; Barnes, J.; Knowles, W. Black shale diagenesis: Insights from integrated high-definition analyses of post-mature Marcellus Formation rocks, northeastern Pennsylvania. In Critical Assessment of Shale Resource Plays; AAPG Memoir 103; AAPG: Tulsa, OK, USA, 2013. [Google Scholar]
  13. Laughrey, C.D. Produced gas and condensate geochemistry of the Marcellus Formation: Insights into petroleum maturity, migration, and alteration in an unconventional shale reservoir. URTeC Paper 5195. In Proceedings of the Unconventional Resource Technology Conference, Houston, TX, USA, 16–18 November 2020. [Google Scholar]
  14. Faill, R.T. A geologic history of the north-central Appalachians; Part 2. The Appalachian basin from the Silurian through the Carboniferous. Am. J. Sci. 1997, 7, 729–761. [Google Scholar] [CrossRef]
  15. Ettensohn, F.R. Controls on the development of Catskill Delta complex basin-facies. Geol. Soc. Am. Spec. Pap. 1985, 201, 65–77. [Google Scholar]
  16. Beaumont, C.; Quinlan, B.; Hamilton, J. Orogeny and stratigraphy: Numerical models of the Paleozoic in the eastern interior of North America. Tectonics 1988, 7, 389–416. [Google Scholar] [CrossRef]
  17. Arthur, M.A.; Sageman, B.B. Sea-level control on source-rock development: Perspectives from the Holocene Black Sea, the mid-Cretaceous western interior basin of North America, and the Late-Devonian Appalachian basin. The deposition of carbon-rich sediments: Models, mechanisms, and consequences. SEPM Spec. Publ. 2005, 82, 35–59. [Google Scholar]
  18. Faill, R.T. The Acadian orogeny and the Catskill Delta. Geol. Soc. Am. Spec. 1985, 201, 15–37. [Google Scholar]
  19. Ettensohn, F.R. The Catskill delta complex and the Acadian orogeny. Geol. Soc. Am. Spec. 1985, 201, 39–49. [Google Scholar]
  20. Carter, K.M.; Harper, J.A.; Schmid, K.W.; Kostelnik, J. Unconventional natural gas resources in Pennsylvania: The backstory of the modern Marcellus shale play. AAPG Bull. 2011, 18, 217–257. [Google Scholar] [CrossRef]
  21. Harper, J.A.; Anthony, R.V.; Carter, K.; Schmid, K.W.; Dunst, B.J.; Cooney, M. Correlation of Middle and Upper Devonian shales in the Marcellus-producing regions of Pennsylvania. In Proceedings of the Geological Society of North America Joint 52nd Northeastern Annual Section/51st North-Central Annual Section Meeting Abstracts with Programs, Pittsburgh, PA, USA, 20 March 2017; p. 49. [Google Scholar] [CrossRef] [Green Version]
  22. Carter, K.M. Subsurface Lithostratigraphy of the Oil-and Gas-Producing Regions of Pennsylvania. Pennsylvania Geological Survey Fourth Series, Open-File Oil and Gas. Report 19-01.1; 1 Plate, 1 Appendix, and 6 Stratigraphic Cross Sections. 2019; p. 5. Available online: https://maps.dcnr.pa.gov/publications/Default.aspx?id=985 (accessed on 22 April 2022).
  23. De Witt, W., Jr.; Roen, J.B.; Wallace, L.G. Stratigraphy of Devonian Black Shales and Associated Rocks in the Appalachian Basin; United States Geological Survey Bulletin 1909: Reston, VA, USA, 1993.
  24. Lash, G.G.; Engelder, T. Thickness trends and sequence stratigraphy of the Middle Devonian Marcellus Formation, Appalachian basin: Implications for Acadian foreland basin evolution. AAPG Bull. 2011, 95, 61–103. [Google Scholar] [CrossRef]
  25. Boswell, R.; Pool, S. Lithostratigraphy of Middle and Upper Devonian organic-rich shales in West Virginia. WVGES Rep. Investig. 2018, 35, 55. [Google Scholar]
  26. Sageman, B.B.; Murphy, A.E.; Werne, J.P.; Ver Straeten, C.A.; Hollander, D.J.; Lyons, T.W. A tale of shales: The relative roles of production, decomposition, and dilution in the accumulation of organic-rich strata, Middle-Upper Devonian, Appalachian basin. Chem. Geol. 2003, 195, 229–273. [Google Scholar] [CrossRef]
  27. Hupp, B.N.; Donovan, J.J. Quantitative mineralogy for facies definition in the Marcellus Shale (Appalachian basin, USA) using XRD-XRF integration. Sediment. Geol. 2018, 371, 16–31. [Google Scholar] [CrossRef]
  28. Root, J.C. Petrological and Isotopic Evidence for Diagenetic Evolution in the Cherry Valley Carbonates and Adjacent Mudrocks of the Marcellus ‘Shale’ from West Virginia, Pennsylvania, and New York. Master’s Thesis, Cornell University, Ithaca, NY, USA, May 2018. [Google Scholar]
  29. Milliken, K.L.; Rudnicki, M.; Awwiller, D.N.; Zhang, T. Organic matter-hosted pore system, Marcellus Formation (Devonian), Pennsylvania. AAPG Bull. 2013, 97, 177–200. [Google Scholar] [CrossRef]
  30. Deller Piane, C.; Bourdet, J.; Josh, M.; Clennell, M.B.; Rickard, W.D.A.; Saunders, M.; Sherwood, N.; Le, Z.; Dewhurst, D.N.; Raven, M.D. Organic matter network in post-mature Marcellus Shale: Effects on petrophysical properties. AAPG Bull. 2018, 102, 2305–2332. [Google Scholar] [CrossRef]
  31. Obermajer, M.; Fowler, M.G.; Goodarzi, F.; Snowdon, L.R. Organic petrology and organic geochemistry of Devonian black shales in southwestern Ontario, Canada. Org. Geochem. 1997, 26, 229–246. [Google Scholar] [CrossRef]
  32. Hackley, P.C.; Ryder, R.T. Organic geochemistry and petrology of Devonian shale in eastern Ohio: Implications for petroleum system assessment. AAPG Bull. 2021, 105, 543–573. [Google Scholar] [CrossRef]
  33. Higley, D.K.; Enomoto, C.B. Burial history reconstruction of the Appalachian basin in Kentucky, West Virginia, Ohio, Pennsylvania, and New York, using 1D petroleum system models. Mt. Geol. 2019, 56, 365–3696. [Google Scholar] [CrossRef]
  34. Rowan, E.L. Burial and thermal history of the central Appalachian basin based on three 2-D models of Ohio, Pennsylvania, and West Virginia. U.S. Geol. Surv. Open-File Rep. 2006, 1019, 35. [Google Scholar]
  35. Bernard, B.; Brooks, J.M.; Sackett, W.M. A geochemical model for characterization of hydrocarbon gas sources in marine sediments. In Proceedings of the 9th Annual Offshore Technology Conference (OTC 2934), Houston, TX, USA, 2–5 May 1977; pp. 435–438. [Google Scholar]
  36. Schoell, M. Genetic characterization of natural gases. AAPG Bull. 1983, 67, 2225–2238. [Google Scholar]
  37. Golding, S.M.; Boreham, C.J.; Esterle, J.S. Stable isotope geochemistry of coal bed and shale gas and related production waters: A review. Int. J. Coal Geol. 2013, 120, 24–40. [Google Scholar] [CrossRef]
  38. Milkov, A.V.; Etiope, G. Revised genetic diagrams for natural gases based on a global dataset of >20,000 samples. Org. Geochem. 2018, 125, 109–120. [Google Scholar] [CrossRef]
  39. Chung, H.M.; Gormly, J.R.; Squires, R.M. Origin of gaseous hydrocarbons in subsurface environments: Theoretical considerations of carbon isotope distributions. Chem. Geol. 1988, 71, 97–103. [Google Scholar] [CrossRef]
  40. Rooney, M.A.; Claypool, G.E.; Chung, H.M. Modeling thermogenic gas generation using carbon isotope ratios of natural gas hydrocarbons. Chem. Geol. 1995, 126, 219–232. [Google Scholar] [CrossRef]
  41. Zumberge, J.; Ferworn, K.; Brown, S.D. Isotopic reversal (“rollover”) in shale gas produced from the Mississippian Barnett and Fayetteville formations. Mar. Pet. Geol. 2012, 31, 43–52. [Google Scholar] [CrossRef]
  42. Tilley, B.; Muehlenbachs, K. Isotopic reversals and universal stages and trends of gas maturation in sealed, self-contained petroleum systems. Chem. Geol. 2013, 339, 194–204. [Google Scholar] [CrossRef]
  43. Curiale, J.A.; Curtis, J.B. Organic geochemical applications to the exploration for source-rock reservoirs—A review. J. Unconv. Oil Gas. Resour. 2016, 13, 1–31. [Google Scholar] [CrossRef]
  44. Pinti, D.L.; Marty, B. Noble gases in oil and gas fields: Origins and processes. In Fluids Basin Evolution; Mineralogical Association of Canada: Quebec, Canada, 2000; Volume 28, pp. 160–196. [Google Scholar]
  45. Ballentine, C.J.; Burgess, R.; Marty, B. Tracing fluid origin, transport, and interaction in the crust. Rev. Mineral. Geochem. 2002, 47, 539–614. [Google Scholar] [CrossRef]
  46. Byrne, D.J.; Barry, P.H.; Lawson, M.; Ballentine, C.J. Noble gases in conventional and unconventional petroleum systems. Geol. Soc. Lond. 2017, 468, 23. [Google Scholar] [CrossRef]
  47. Ballentine, C.J.; Burnard, P.G. Production, release, and transport of noble gases in the continental crust. Rev. Mineral. Geochem. 2002, 47, 481–538. [Google Scholar] [CrossRef]
  48. Podosek, F.A.; Bernatowicz, T.J.; Kramer, F.E. Adsorption of xenon and krypton on shales. Geochim. Cosmochim. Acta 1981, 45, 2401–2415. [Google Scholar] [CrossRef]
  49. Marrocchi, Y.; Marty, B. Experimental determination of the xenon isotopic fractionation during adsorption. Geophys. Res. Lett. 2013, 40, 4165–4170. [Google Scholar] [CrossRef] [Green Version]
  50. Hunt, A.G.; Darrah, T.H.; Poreda, R.J. Determining the source and genetic fingerprint of natural gases using noble gas geochemistry: A northern Appalachian basin case study. AAPG Bull. 2012, 96, 1785–1811. [Google Scholar] [CrossRef]
  51. Battani, A.; Sarda, P.; Prinzhofer, A. Basin scale natural gas source, migration and trapping traced by noble gases and major elements: The Pakistan Indus basin. Earth Planet. Sci. Lett. 2000, 8, 229–249. [Google Scholar] [CrossRef]
  52. Miles, J.A. Illustrated Glossary of Petroleum Geochemistry; Clarendon Press-Oxford: Oxford, UK, 1994; p. 137. [Google Scholar]
  53. Holba, A.G.; Bone, R.L.; Huizinga, B.J.; Vasquez, J.R.; Stokes, S.M. Petroleum-fluid property prediction from gas chromatographic analysis of rock extracts or fluid samples. U. S. Pat. Appl. Publ. 2014, 31, 23. [Google Scholar]
  54. Adams, J.; Kornacki, A.S. Tailoring geochemical production monitoring for tight reservoirs that contain migrated oil. In Proceedings of the AAPG Hedberg Conference, The Evolution of Petroleum Systems Analysis, Houston, TX, USA, 4–6 March 2019; Available online: https://www.searchanddiscovery.com/abstracts/html/2019/hedberg-90349/abstracts/164.html (accessed on 22 April 2022).
  55. Thompson, K.F.M. Classification and thermal history of petroleum based on light hydrocarbons. Geochim. Cosmochim. Acta 1983, 11, 573–590. [Google Scholar] [CrossRef]
  56. Radke, M.; Horsfield, B.; Little, R.; Rullkötter, J. Petroleum and Basin Evolution, Chapter 3. In Maturation and Petroleum Generation; Welte, D.H., Horsfield, B., Baker, D.R., Eds.; Springer: Berlin/Heidelberg, Germany, 1997; pp. 169–229. [Google Scholar]
  57. BeMent, W.O.; Levey, R.A.; Mango, F.D. The Temperature of Oil Generation as Defined with C7 Chemistry Maturity Parameter (2-4-DMP/2,3-DMP Ratio). In Organic Geochemistry: Developments and Applications in Energy, Climate, Environment, and Human History; AIGOA: Donostia-San Sebastian, Spain, 1995; pp. 505–507. [Google Scholar]
  58. Mango, F.D. The light hydrocarbons in petroleum: A critical review. Org. Geochem. 1997, 26, 417–440. [Google Scholar] [CrossRef]
  59. Halpern, H.I. Development and applications of light-hydrocarbon-based star diagrams. AAPG Bull. 1995, 79, 801–815. [Google Scholar]
  60. Agrawal, V.; Sharma, S. Molecular characterization of kerogen and its implications for determining hydrocarbon potential, organic matter sources, and thermal maturity in Marcellus Shale. Fuel 2018, 228, 429–437. [Google Scholar] [CrossRef]
  61. Agrawal, V.; Sharma, S. Testing utility of organogeochemical proxies to assess sources of organic matter, paleo redox conditions, and thermal maturity in mature Marcellus shale. Front. Energy Res. 2018, 6, 42. [Google Scholar] [CrossRef]
  62. Laughrey, C.D.; Baldassare, F.J. Geochemistry and origin of some natural gases in the Plateau Province, central Appalachian basin, Pennsylvania and Ohio. AAPG Bull. 1998, 82, 317–335. [Google Scholar]
  63. Xia, X.; Chen, J.; Braun, R.; Tang, Y. Isotopic reversals with respect to maturity trends due to mixing of primary and secondary products in source rocks. Chem. Geol. 2013, 339, 205–212. [Google Scholar] [CrossRef]
  64. Stolper, D.A.; Lawson, M.; Davis, C.L.; Ferreira, A.A.; Santos Neto, E.V.; Ellis, G.S.; Lewan, M.D.; Martini, A.M.; Tang, Y.; Schoell, M.; et al. Formation temperatures of thermogenic and biogenic methane. Science 2014, 344, 1500–1503. [Google Scholar] [CrossRef] [PubMed]
  65. Whiticar, M.J. Correlation of Natural Gases with their Sources; AAPG Memoir 60: Tulsa, OK, USA, 1994; pp. 261–283. [Google Scholar]
  66. Faber, E. Zur Isotopengeochemie gasförmiger Kohlenwasserstoffe. Erdöl Eerdgas Kohle 1987, 103, 210–218. [Google Scholar]
  67. Whiticar, M.J. A geochemical perspective of natural gas and atmospheric methane. Adv. Org. Geochem. 1990, 16, 531–547. [Google Scholar] [CrossRef]
  68. Clayton, C. Carbon isotope fractionation during natural gas generation from kerogen. Mar. Pet. Geol. 1991, 8, 232–240. [Google Scholar] [CrossRef]
  69. Xia, X.; Tang, Y. Application of gas isotopes to the thermal history analysis of basins. SEPM Spec. Publ. 2012, 103, 147–152. [Google Scholar]
  70. Prinzhofer, A.; Battani, A. Gas isotope tracing: An important tool for hydrocarbons exploration. Oil Gas. Sci. Technol. 2003, 58, 299–311. [Google Scholar] [CrossRef]
  71. Kendall, C.; Caldwell, E.A. Isotope Tracers in Catchment Hydrology. In Fundamentals of Isotope Geochemistry; Kendell, C., McDonnell, J.J., Eds.; Elsevier: Amsterdam, The Netherlands, 1998; pp. 51–86. [Google Scholar]
  72. Burruss, R.C.; Laughrey, C.D. Carbon and hydrogen isotopic reversals in deep basin gas: Evidence for limits to the stability of hydrocarbons. Org. Geochem. 2010, 41, 1285–1296. [Google Scholar] [CrossRef]
  73. Harrison, M.J.; Marshak, S.; Onasch, C.M. Stratigraphic control of hot fluids on anthricitization, Lackawanna synclinorium, Pennsylvania. Tectonophysics 2004, 378, 85–103. [Google Scholar] [CrossRef]
  74. Kisch, H.J.; van den Kerkhof, A.M. CH4-rich inclusions from quartz veins in the Valley and Ridge province and the anthracite fields of the Pennsylvania Appalachians. Am. Mineral. 1991, 76, 230–240. [Google Scholar]
  75. Cook, J.E.; Dunne, W.M.; Onasch, C.M. Development of a dilatant damage zone along a thrust relay in a low-porosity quartz arenite. J. Struct. Geol. 2006, 28, 776–792. [Google Scholar] [CrossRef]
  76. O’Kane, A.; Onasch, C.M.; Farver, J.R. The role of fluids in low temperature fault-related deformation of quartz arenite. J. Struct. Geol. 2007, 29, 819–836. [Google Scholar] [CrossRef]
  77. Onasch, C.M.; Dunne, W.M.; Cook, J.E.; O’Kane, A. The effect of fluid composition on the behavior of well cemented, quartz-rich sandstone during faulting. J. Struct. Geol. 2009, 31, 961–971. [Google Scholar] [CrossRef]
  78. Lewan, M.D.; Kotarba, M.J. Thermal-maturity limits for primary thermogenic-gas generation from humic coals as determined by hydrous pyrolysis. AAPG Bull. 2014, 98, 2581–2610. [Google Scholar] [CrossRef]
  79. Lewan, M.D.; Law, B.E.; Wilson, M. Fundamental Issues on Thermogenic Gas Generation from Source-Rock Maturation and Reservoir-Oil Cracking. In Innovative Gas Exploration Concepts Symposium; Rocky Mountain Association of Geologists: Denver, CO, USA, 2020; Volume 4. [Google Scholar]
  80. Burruss, R.C. Stability and flux of methane in the deep crust—A review. U. S. Geol. Surv. Prof. Pap. 1993, 1570, 21–29. [Google Scholar]
  81. Schloemer, S.; Krooss, B.M. Molecular transport of methane, ethane, and nitrogen and the influence of diffusion on the chemical and isotopic composition of natural gas accumulations. Geofluids 2004, 4, 81–108. [Google Scholar] [CrossRef]
  82. Zhang, T.; Krooss, B.M. Experimental investigation on the carbon isotope fractionation of methane during gas migration by diffusion through sedimentary rocks at elevated temperature and pressure. Geochim. Cosmochim. Acta 2001, 65, 2723–2742. [Google Scholar] [CrossRef]
  83. Fuex, A.N. The use of stable carbon isotopes in hydrocarbon exploration. J. Geochem. Explor. 1977, 7, 155–188. [Google Scholar] [CrossRef]
  84. Jenden, P.D.; Kaplan, I.R. Analysis of Gases in the Earth’s Crust: Final Report to the Gas; Contract No. 5081-360-0533; National Technical Information Service Accession Number PB91-104273/XAB; Research Institute: Chicago, IL, USA, 1989. [Google Scholar]
  85. Jenden, P.D.; Kaplan, I.R. Abiogenic hydrocarbons and mantle helium in oil and gas fields. Future Energy Gases 1993, 1570, 31–56. [Google Scholar]
  86. Jenden, P.D.; Drazan, D.J.; Kaplan, I.R. Mixing of thermogenic natural gases in northern Appalachian basin. AAPG Bull. 1993, 77, 980–998. [Google Scholar]
  87. Laughrey, C.D.; Harper, R.M. Play Obe: Upper Ordovician Bald Eagle Formation fractured anticlinal play. In Atlas of Major Appalachian Gas Plays; West Virginia Economical and Geologic Survey Publication V-25: Morgantown, WV, USA, 1996; pp. 164–167. [Google Scholar]
  88. Sherwood Lollar, B.; Westgate, T.D.; Ward, J.A.; Slater, G.F.; Lacrampe-Couloume, G. Abiogenic formation of alkanes in the Earth’s crust as a minor source for global hydrocarbon reservoirs. Nature 2002, 416, 522–524. [Google Scholar] [CrossRef]
  89. Sherwood Lollar, B.; Lacrampe-Couloume, G.; Slater, G.F.; Ward, J.A.; Moser, D.P.; Gihring, T.M.; Lin, L.-H.; Onstott, T.C. Unraveling abiogenic and biogenic sources of methane in the earth’s deep subsurface. Chem. Geol. 2006, 226, 328–339. [Google Scholar] [CrossRef]
  90. Telling, J.; Lacrampe-Couloume, G.; Sherwood Lollar, B. Carbon and hydrogen isotopic composition of methane and C2+ alkanes in electrical spark discharge: Implications for identifying sources of hydrocarbons in terrestrial and extraterrestrial setting. Astrobiology 2013, 13, 480–483. [Google Scholar] [CrossRef]
  91. Sephton, M.A.; Hazen, R.M. On the origin of deep hydrocarbons. Rev. Mineral. Geochem. 2013, 75, 449–465. [Google Scholar] [CrossRef]
  92. Milkov, A.V.; Faiz, M.; Etiope, G. Geochemistry of shale gases from around the world: Composition, origins, isotope reversals and rollovers, and implications for the exploration of shale plays. Org. Geochem. 2020, 143, 103997. [Google Scholar] [CrossRef]
  93. Liu, Q.; Wu, X.; Wang, X.; Jin, Z.; Zhu, D.; Meng, Q.; Huang, S.; Liu, J.; Fu, Q. Carbon and hydrogen isotopes of methane, ethane, and propane: A review of genetic identification of natural gas. Earth-Sci. Rev. 2019, 190, 247–272. [Google Scholar] [CrossRef]
  94. Xia, X.; Gao, Y. Depletion of 13C in residual ethane and propane during thermal decomposition in sedimentary basins. Org. Geochem. 2018, 121–128. [Google Scholar] [CrossRef]
  95. Prinzhofer, A.; Huc, A.Y. Genetic and post-genetic molecular and isotopic fractionations in natural gases. Chem. Geol. 1995, 126, 281–290. [Google Scholar] [CrossRef]
  96. Tang, Y.; Xia, X. Kinetics and mechanism of shale gas formation: A quantitative interpretation of gas isotope “rollover” for shale gas formation. In Critical Assessment of Shale Resource Plays; AAPG Memoir 103; AAPG: Tulsa, OK, USA, 2013. [Google Scholar]
  97. Dai, J.; Xia, X.; Qin, S.; Zhao, J. Origins of partially reversed alkane δ13C values for biogenic gases in China. Org. Geochem. 2004, 35, 405–411. [Google Scholar] [CrossRef]
  98. James, A.T.; Burns, B.J. Microbial alteration of subsurface natural gas accumulations. AAPG Bull. 1984, 68, 957–960. [Google Scholar]
  99. Krouse, H.R.; Viau, C.A.; Eliuk, L.S.; Ueda, A.; Halas, S. Chemical and isotopic evidence of thermochemical sulfate reduction by light hydrocarbons in deep carbonate reservoirs. Nature 1988, 333, 415–419. [Google Scholar] [CrossRef]
  100. Thiagarajan, N.; Xie, H.; Ponton, C.; Kitchen, N.; Peterson, B.; Lawson, M.; Formolo, M.; Xiao, Y.; Eiler, J. Isotopic evidence for quasi-equilibrium chemistry in mature natural gas. Proc. Natl. Acad. Sci. USA 2020, 117, 3989–3995. [Google Scholar] [CrossRef]
  101. Rowan, E.L.; Engle, M.A.; Kraemer, T.F.; Schroeder, K.T.; Hammack, R.W.; Doughten, M.W. Geochemical and isotopic evolution of water produced from Middle Devonian Marcellus shale gas wells, Appalachian basin, Pennsylvania. AAPG Bull. 2015, 99, 181–206. [Google Scholar] [CrossRef]
  102. Horibe, Y.; Craig, H. D/H fractionation in the system methane-hydrogen-water. Geochim. Cosmochim. Acta 1995, 59, 5209–5217. [Google Scholar] [CrossRef]
  103. Whyte, C.; Darrah, T. Integrating noble gas geochemistry to better understand hydrocarbon stable isotope reversals. AAPG Search and Discovery abstract 2019, AAPG Annual Convention and Exhibition, San Antonio, Texas, 19–22 May 2019. Available online: https://www.searchanddiscovery.com/abstracts/html/2019/ace2019/abstracts/2180.html (accessed on 22 April 2022).
  104. Gao, L.; Schimmelmann, A.; Tang, Y.; Mastalerz, M. Isotope rollover in shale gas observed in laboratory pyrolysis experiments: Insight to the role of water in thermogenesis of mature gas. Org. Geochem. 2014, 68, 95–106. [Google Scholar] [CrossRef]
  105. Osborn, S.G.; McIntosh, J.C. Chemical and isotopic tracers of the contribution of microbial gas in Devonian organic-rich shales and reservoir sandstones, northern Appalachian basin. Appl. Geochem. 2010, 25, 456–471. [Google Scholar] [CrossRef]
  106. Gao, D.; Shumaker, R.C.; Wilson, T.H. Along-axis segmentation and growth history of the Rome Trough in the central Appalachian basin. AAPG Bull. 2000, 84, 75–99. [Google Scholar]
  107. Curtis, J.; Faure, G. Accumulation of organic matter in the Rome Trough of the Appalachian basin and its subsequent thermal history. AAPG Bull. 1997, 81, 424–437. [Google Scholar]
  108. Roden, M.K.; Miller, D.S. Apatite fission-track thermochronology of the Pennsylvania Appalachian basin. Geomorphology 1989, 2, 39–51. [Google Scholar] [CrossRef]
  109. Laughrey, C.D.; Billman, D.A.; Canich, M.R. Petroleum geology and geochemistry of the Council Run gas field, north central Pennsylvania. AAPG Bull. 2004, 88, 213–239. [Google Scholar] [CrossRef]
  110. Glick, E.V. Connectivity of the Oriskany Sandstone with the Marcellus Shale: Effects on Shale-Gas Operations in North Central Pennsylvania. Master’s Thesis, University of Pittsburgh, Pittsburgh, PA, USA, 2017. [Google Scholar]
  111. Laughrey, C.D.; Baldassare, F.J. Petroleum Geochemistry of Devonian Rocks and Produced Oil and Natural Gas in the Caseman-Gross Unit #1 Well, Bradford County, Pennsylvania. AAPG Search and Discovery Abstract. 2016. Available online: https://www.searchanddiscovery.com/abstracts/html/2016/90258es/abstracts/1.50.html (accessed on 11 May 2022).
  112. Turner, A.C.; Korol, R.; Eldridge, D.L.; Bill, M.; Conrad, M.E.; Miller, T.F.; Stolper, D.A. Experimental and theoretical determinations of hydrogen isotopic equilibrium in the system CH4-H2-H2O from 3 to 200 °C. Geochim. Cosmochim. Acta 2021, 314, 223–269. [Google Scholar] [CrossRef]
  113. Niemann, M.; Whiticar, M.J. Stable isotope systematics of coalbed gas during desorption and production. Geosciences 2017, 7, 43. [Google Scholar] [CrossRef]
  114. Mahzari, P.; Mitchell, T.M.; Jones, A.P.; Westacott, D.; Striolo, A. Direct gas-in-place measurements prove much higher production potential than expected for shale formations. Nat. Sci. Rep. 2021, 11, 10775. [Google Scholar] [CrossRef]
  115. Xia, X.; Tang, Y. Isotope fractionation of methane during natural gas flow with coupled diffusion and adsorption/desorption. Geochim. Cosmochim. Acta 2012, 77, 489–503. [Google Scholar] [CrossRef]
  116. Osborn, S.G.; Vengosh, A.; Warner, N.R.; Jackson, R.B. Methane contamination of drinking water accompanying gas-well drilling and hydraulic fracturing. Proc. Natl. Acad. Sci. USA 2011, 108, 172–178. [Google Scholar] [CrossRef]
  117. Warner, N.R.; Jackson, R.B.; Darrah, T.H.; Osborn, S.G.; Down, A.; Zhao, K.; White, A.; Vengosh, A. Geochemical evidence for possible natural migration of Marcellus Formation brine to shallow aquifers in Pennsylvania. Proc. Natl. Acad. Sci. USA 2012, 109, 11961–11966. [Google Scholar] [CrossRef]
  118. Darrah, T.H.; Jackson, R.B.; Vengosh, A.; Warner, N.R.; Whyte, C.J.; Walsh, T.B.; Kondash, A.J.; Poreda, R.J. The evolution of Devonian hydrocarbon gases in shallow aquifers in the northern Appalachian basin: Insights from integrating noble gas and hydrocarbon chemistry. Geochim. Cosmochim. Acta 2014, 170, 321–355. [Google Scholar] [CrossRef]
  119. Molofsky, L.J.; Connor, J.A.; Wylie, A.S.; Wagner, T.; Farhat, S.K. Evaluation of methane sources in groundwater in northeastern Pennsylvania. Groundwater 2018, 51, 333–349. [Google Scholar] [CrossRef]
  120. Hammond, P.A.; Wen, T.; Brantley, S.L.; Engelder, T. Gas well integrity and methane migration: Evaluation of published evidence during shale-gas development in the USA. Hydrol. J. 2020, 28, 1481–1502. [Google Scholar] [CrossRef]
  121. Reese, S.O.; Neboga, V.V.; Pelepko, S.; Kosmer, W.J.; Beattie, S. Groundwater and petroleum resources of Sullivan County, Pennsylvania. Pa. Geol. Surv. Fourth Ser. Water Resour. Rep. 2014, 71, 142. [Google Scholar]
  122. Milkov, A.V.; Schwietzke, S.; Allen, G.; Sherwood, O.; Etiope, G. Using global isotopic data to constrain the role of shale gas production in recent increases in atmospheric methane. Nat. Res. Sci. Rep. 2020, 10, 4199. [Google Scholar] [CrossRef]
  123. Schaefer, H.; Mikaloff-Fletcher, S.E.; Veidt, C.; Lassy, K.R.; Brailsford, G.W.; Bromley, T.M.; Dlubokencky, E.J.; Michel, S.E.; Miller, J.B.; Levin, I.; et al. A 21st Century shift from fossil-fuel to biogenic methane emissions indicated by 13CH4. Science 2016, 352, 80–84. [Google Scholar] [CrossRef]
  124. Schwietzke, S.; Sherwood, O.; Bruhwiler, L.M.P.; Miller, J.B.; Etiope, G.; Dlubokencky, E.J.; Michel, S.E.; Arling, V.A.; Vaugn, B.H.; White, J.W.C.; et al. Upward revision of global fossil fuel methane emissions based on isotope database. Nature 2016, 538, 88–91. [Google Scholar] [CrossRef]
  125. Lewan, M.D. Comments on “Ideas and perspectives: Is shale-gas a major driver of recent increase in global atmospheric methane?” by Robert, W. Howarth (2019). Biogeosci. Discuss. 2020. preprint. [Google Scholar] [CrossRef]
  126. Howarth, R.W. Ideas and perspectives: Is shale-gas a major driver of recent increase in global atmospheric methane? Biogeosciences 2019, 16, 3033–3046. [Google Scholar] [CrossRef]
  127. Barkley, Z.R. Estimating methane emissions from underground coal and natural gas production in southwestern Pennsylvania. Geophys. Res. Lett. 2019, 46, 4531–4540. [Google Scholar] [CrossRef]
  128. Barkley, Z.R.; Davis, K.J.; Feng, S.; Cui, Y.Y.; Fried, A.; Weibring, P.; Richter, D.; Walega, J.G.; Miller, S.M.; Eckl, M.; et al. Analysis of oil and gas ethane and methane emissions in the southcentral and eastern United States using four seasons of continuous aircraft ethane measurements. J. Geophys. Res. Atmos. 2021, 126, e2020JD034194. [Google Scholar] [CrossRef]
  129. Smith, C.; Pool, S.; Dinterman, P.; Moore, J.; Vance, T.; Smith, T.; Gordon, P.; Smith, M. Evaluating the liquids potential and distribution of West Virginia’s Marcellus liquids fairway. In Proceedings of the URTeC Paper 5540 Unconventional Resource Technology Conference, Houston, TX, USA; 2020; p. 22. [Google Scholar]
  130. Repetski, J.E.; Ryder, R.T.; Avary, K.L.; Trippi, M.H. Thermal maturity patterns (CAI and %Ro) in the Ordovician and Devonian rocks of the Appalachian basin in West Virginia. USGS Open File Rep. 2005, 1078, 69. [Google Scholar]
  131. Dorobek, S. Migration of orogenic fluids through the Silurio-Devonian Helderberg Group during late Paleozoic deformation: Constraints on fluid sources and implications for thermal histories of sedimentary basins. Tectonophysics 1989, 159, 25–45. [Google Scholar] [CrossRef]
  132. Evans, M.A. Fluid inclusions in veins from the Middle Devonian shales: A record of deformation conditions and fluid evolution in the Appalachian Plateau. Geol. Soc. Am. Bull. 1995, 107, 327–339. [Google Scholar] [CrossRef]
  133. Evans, M.A.; Battles, D.A. Fluid inclusion and stable isotope analyses of veins from the central Appalachian Valley and Ridge Province: Implications for regional synorogenic hydrologic structure and fluid migration. Geol. Soc. Am. Bull. 1999, 111, 1841–1860. [Google Scholar] [CrossRef]
  134. Tamulonis, K.L.; Carter, K.M. Evidence of hydrothermal alteration in Devonian shales from the Eastern Gas Shales Project 2 core of the Rome Trough, Appalachian basin, United States. AAPG Bull. 2021, 28, 1–24. [Google Scholar] [CrossRef]
  135. Atwah, I.; Sweet, S.; Pantano, J.; Knap, A. Light hydrocarbon geochemistry: Insight into Mississippian crude oil sources from the Anadarko basin, Oklahoma, USA. Geofluids 2019, 2019, 2795017. [Google Scholar] [CrossRef] [Green Version]
  136. Lemmens, H.; Richards, D. Multiscale Imaging of Shale Samples in the Scanning Electron Microscope. Electron Microsc. Shale Hydrocarb. Reserv. AAPG Mem. 2013, 102, 27–35. [Google Scholar]
Figure 1. Map showing regional distribution of wet gas and dry gas produced from the Marcellus Formation in the Appalachian basin. Contours are depth in feet to the base of the Marcellus. Downloaded from the Pennsylvania State University Marcellus Center for Outreach and Research, http://www.marcellus.psu.edu/resources/images/wet-dry–line–with–depth.gif. (Accessed on 6 April 2022).
Minerals 12 01222 g001
Figure 2. (a) Correlation diagram of Middle and Upper Devonian stratigraphic intervals in western and north-central Pennsylvania. From Carter et al. [20]. Also see Harper et al. [21] and Carter [22]. Stratigraphic units above the Middle Devonian Onondaga Limestone comprise the siliciclastic successions of the Castskill Delta. FM.—Formation; SH—Shale; GR—Group; LS—Limestone; CHT—Chert. (b) Diagram of parts of a wireline geophysical log showing the stratigraphic nomenclature for the Marcellus Formation in the subsurface of Pennsylvania. From Carter et al. [20]. CAL—Caliper; GR—Gamma Ray; DEN—Bulk Density; NØ—Neutron Porosity; DØ—Density Porosity.
Minerals 12 01222 g002
Figure 3. Photomicrographs of Marcellus Formation organic matter in Upshur County, West Virginia. Measured VRo = 2.37%. (a) Thermally transformed amorphous organic matter (AOM) with background matrix, mineral grains (M), framboidal pyrite (Pf) and interpreted algal body (Al). (b): Angular pyrobitumen (Ba) and interface with mineral matrix. Inert AOM comprises 46.1 to 57.9% of the kerogen. Solid hydrocarbon makes up between 25 and 40% of the organic matter. Conversion of AOM to hydrocarbon is estimated between 84.2 and 92.7%. Photomicrographs, composition interpretation, and VRo measurements by Dr. Wayne Knowles, Stratum Laboratories, UK.
Minerals 12 01222 g003
Figure 4. (a) Whole rock photomicrograph of pyrobitumen (Py) lenses and angular fragments, solid hydrocarbon (SHC), and mineral matrix in overmature (VRo = 4.56%) Marcellus Formation recovered in the Bennett #1 well, Sullivan County, Pennsylvania. (b) Backscatter electron (BE) SEM photomicrograph of the same sample. From Laughrey et al. [12].
Minerals 12 01222 g004
Figure 5. (a) Well-developed kerogen-hosted porosity, wet gas region southwestern Pennsylvania (SEM image courtesy William Zagorski, Range Resources). (b) Pyrobitumen-hosted organic porosity, dry gas region, northeastern Pennsylvania (from Laughrey et al. [12]). SEM images in (a) and (b) are the same scale. (c) 3D focused ion beam SEM model of interconnected pyrobitumen-hosted organic porosity in the same sample shown in (b). Red—pyrobitumen. Yellow—interconnected porosity. Horizontal field width = 8 µm.
Minerals 12 01222 g005
Figure 6. (a): Methane δ13C versus C1/(C2/C3) for wet (squares) and dry (circles) Marcellus Formation produced gases in the Appalachian basin (after Bernard et al. [35]). The different colors represent the various gas samples listed in Table 1 (b) Schoell [36] plot of methane δD versus δ13C for the Marcellus produced gases in the Appalachian basin.
Minerals 12 01222 g006aMinerals 12 01222 g006b
Figure 7. (a): Natural gas plot for wet Marcellus Formation produced gases (after Chung et al. [39]). Kerogen and oil/bitumen δ13C range [12] is shifted right of the y-axis for clarity. (b) Natural gas plot for dry Marcellus Formation produced gases. VRo measurements by Dr. Wayne Knowles, Stratum Laboratories.
Minerals 12 01222 g007
Figure 8. Natural gas plot of hydrogen isotope ratios for wet (squares) and dry (circles) Marcellus Formation produced natural gases in the Appalachian basin (after Chung et al. [39]).
Minerals 12 01222 g008
Figure 9. Plot of percent gas wetness (wh) against ethane δ13C for Marcellus Formation produced natural gases. VRo values noted next to selected data points were measured by Dr. Wayne Knowles, Stratum Reservoir. Dashed arrows show increasing maturity trends. Most wet gases follow a normal maturity trend with decreasing wetness accompanied by increasing δ13C2. Isotopic rollover [41,42] occurs at a wetness of about 5.9% where decreasing wetness is accompanied by 13C depletion. Isotopic reversals [37,38,42,43] begin at a wetness of 4% where the dry gases exhibit decreasing wetness accompanied by rapidly increasing δ13C2.
Minerals 12 01222 g009
Figure 10. (a): Plot of 4He concentration versus R/Ra for five selected dry Marcellus Formation produced gases collected in northeastern Pennsylvania (Table 4). (b) 21Ne/22Ne versus 20Ne/22Ne for the five Marcellus Formation dry gases samples.
Minerals 12 01222 g010
Figure 11. (a): 40Ar concentration versus 40Ar/36Ar for five selected Marcellus Formation dry produced gases collected in northeastern Pennsylvania (Table 4). (b) 4He/40Ar* versus δ13C2 − δ13C1 for the five selected dry gas samples (after Hunt et al. [50]).
Minerals 12 01222 g011
Figure 12. Plot of 20Ne/36Ar versus 84Kr/36Ar for five selected Marcellus Formation dry produced gases collected in northeastern Pennsylvania. Four of the gas samples lie near to air and ASW values for 84Kr/36Ar indicating gas/water phase equilibrium [44,45,46,47]. Samples DG17 and DG20 show higher fractionation in 20Ne/36Ar. 20Ne concentrations are strongly dependent on thermal maturity. Sample DG20 exhibits extreme fractionation of 84Kr/36Ar which may be due to release of atmosphere-derived Kr originally adsorbed and trapped in organic-rich sediment [48,49,50] or to non-equilibrium diffusion [51].
Minerals 12 01222 g012
Figure 13. High resolution gas chromatograms of two produced condensates collected in the wet gas-producing region. The solid black lines illustrate the molar slope(s) [53] of n-alkane peak heights for light (nC6–nC12) and C15+ hydrocarbons. These two chromatograms represent end member compositional extremes observed in Marcellus condensates in the basin. (a): The WG6 condensate exhibits a unimodal n-alkane distribution with a maxima at nC6, resolvable hydrocarbons out to nC40, and a smooth transition of molar slope between light hydrocarbons and black oil. (b): The WG2 fluid shows has a maxima at nC5, but GC peak responses are much diminished beyond nC12 and there is a distinct break in the molar slopes of the light hydrocarbons and black oil.
Minerals 12 01222 g013
Figure 14. Normalized percent molar n-alkanes plotted against carbon number for Marcellus Formation condensates collected in the wet gas-producing region. % molar n-alkanes = A*e-B*Cn where A and B are regression factors used for correlation to oil parameters of interest (API, GOR, maturity) [51,52]. (a) nC6–nC15 alkanes. (b) nC17–nC27 alkanes.
Minerals 12 01222 g014
Figure 15. (A) Heptane ratio versus isoheptane ratio for Marcellus Formation condensates produced in the wet gas region. The heptane and isoheptane ratios reflect the relative abundance of C7 structural isomers in the fluid [52]. (B) API gravity versus C7 generation/expulsion temperature for Marcellus Formation condensates produced in the wet gas region. The API values of most condensates correlate with C7 expulsion temperatures. The well ID (Table 6) of the four samples falling off of the correlation is shown next to the data point.
Minerals 12 01222 g015
Figure 16. (A) Thompson [55] plot showing increasing evaporative fractionation (gas washing) can cause the residual liquid to be heavier and more aromatic (down and to the right) but the migrating gas will become more liquid rich (up and to the left). Here most of the Marcellus liquids appear to have been stripped by gas (dry gas picks up light hydrocarbons, i.e., the gas dissolves light end alkanes into itself [54]). (B) Halpern [59] interpretive plot shows low toluene/nC7 and systematically increasing nC7/MCH trends suggestive of water washing. This interpretation is supported by low toluene/DMCP (TR1 on the insert star plot), and very low amounts of benzene. Very low TR7 suggest migration and secondary alteration effects [59].
Minerals 12 01222 g016
Figure 17. Plot of molar slope A for C15+ hydrocarbons against C7 oil generation/expulsion temperature for Marcellus Formation condensates produced in the wet gas region (after Adams and Kornacki [54]). The plot indicates mixing of higher maturity light hydrocarbons (LHC) and variable maturity C15+ hydrocarbons.
Minerals 12 01222 g017
Figure 18. (a) Modeled vitrinite reflectance equivalents based on calculations published by Faber [66] and Whiticar [67]. (b) The same plot including calibration to actual VRo measurements based on the distance calculated for the relevant δ13C2–δ13C3 pairs (method suggested by Jennifer Adams, Stratum Reservoir, 2019 personal communication).
Minerals 12 01222 g018
Figure 19. (a) Plot of methane δ13C versus ethane δ13C for produced Marcellus Formation natural gases. VRo maturity trends after Rooney et al. [40]. NGS#1, NGS#2, and NGS#3 are natural gas standards employed during isotopic analyses of the Marcellus samples. Wet gases lie between the fields for late mature gases generated from Type II oil-prone kerogen and postmature hydrocarbons generated by oil cracking. Dry gases plot within or near the fields of supermature (same as overmature and defined as VRo > 2.0%) hydrocarbons. (b) Clayton [68] plot of gas dryness (C1/∑C1–C5) versus the per-mil difference between methane and total source kerogen for produced Marcellus Formation natural gases. GGI is the Gas Generation Index, i.e., the ratio of total gas generated from labile (oil-prone) kerogen to the total gas generation potential of that kerogen. The wet Marcellus gases and some dry gases plot along a Rayleigh fractionation trend defined for hydrocarbons generated by oil cracking. Most dry gases plot congruently along a mixing trend between methane cracked from refractory kerogen and hydrocarbons derived from oil cracking. Note that one gas sample (DG19 in Table 1) plots in the microbial methane field.
Minerals 12 01222 g019
Figure 20. (a) Schoell plot [36] of δ13C versus δD for methane in Marcellus Formation wet and dry gas samples from the Appalachian basin. Isotope compositions fall on two distinct trends. The wet gases (squares) plot along a mixing trend (R2 = 0.7) showing progressive enrichment in 13C and 2H characteristic of a thermal maturation sequence [36]. The dry gases (circles) show depletion in 2H as methane becomes progressively more enriched in 13C (R2 = 0.67). The extension of this trend to Late-Stage δ13CH4 is discussed in the text. These two trends are identical to those published by Burruss and Laughrey [72] for Ordovician and Silurian gases produced from conventional and unconventional reservoirs in the basin. (b) Variation of methane isotopic composition with concentration in Marcellus Formation wet and dry gas samples. The wet gases fall along the maturation/mixing trend on the Schoell plot in 20a and along the Rayleigh fractionation trend for hydrocarbons generated by oil cracking shown in Figure 19b. The dry gases show a mixing trend consistent with the trend shown on the Schoell plot (20a) that extends to the Late-Stage CH4 end member. These trends are also identical to those exhibited by wet and dry Ordovician and Silurian gases produced in the basin [72].
Minerals 12 01222 g020
Figure 21. Evidence for mixing and Rayleigh fractionation secondary effects on ethane in Marcellus Formation gases. The isotopic composition of ethane in both the wet and dry gases is a linear function of the natural logarithm of the concentration indicating Rayleigh fractionation [71,72]. Wet gases (squares) exhibit chemical and isotopic compositions consistent with oil cracking [70]. Dry gases (circles) exhibit compositions consistent with secondary gas cracking [70].
Minerals 12 01222 g021
Figure 22. 20Ne/36Ar versus the reciprocal of 36Ar concentration in five Marcellus dry gas samples. Mixing is evident between the two atmosphere-derived end members, one highly fractionated and the other non-fractionated. DG12 20Ne/36Ar is similar to unfractionated groundwater. DG19 and DG18 have elevated 20Ne/36Ar which plot near the upper limit for single-stage equilibrium for fractionation between groundwater and gas (~0.6) [44,45,46,47,51]. DG17 and DG 20 have unusually high 20Ne/36Ar [45,47]. Excepting DG19 sample, atmospheric 36Ar exhibits a negative correlation with 20Ne/36Ar (R2 = 0.8). Hunt and others [50] observed this negative correlation in other northern Appalachian natural gases, including Marcellus Formation gas. They noted that a negative correlation exists between ASW 36Ar as 20Ne/36Ar approaches solubility, indicating the diffusion of Ne as fluids migrate. The DG19 gas is altered by mixing with secondary microbial CH4, and by apparent hydrolysis/corrosion. The high 36Ar (9.65 μcc/cc) likely reflects recent interaction with atmospheric gases.
Minerals 12 01222 g022
Figure 23. (a) Methane δ13C versus cumulative degassing volume for Marcellus Formation pressure core compared with the range of produced gas δ13C1 in adjacent wells in Susquehanna County, Pennsylvania. (b) Ethane δ13C versus cumulative degassing volume for Marcellus Formation pressure core compared with the range of produced gas δ13C2 in adjacent wells in Susquehanna County, Pennsylvania.
Minerals 12 01222 g023
Figure 24. (a) Propane δ13C versus cumulative degassing volume for Marcellus Formation pressure core compared with the range of produced gas δ13C3 in adjacent wells in Susquehanna County, Pennsylvania. (b) Natural gas plot of twelve Marcellus Formation pressure core degassing samples. The δ13C values for the gas components δ13Cn (n = 1–3) are plotted as a function of 1/n, where n is the number of carbon atoms in the molecule [39]. The non-linear fit of the data indicates a mixture of source inputs, gas derived from heterogeneous organic matter, or chemically altered gas [40]. Numbers plotted next to four of the propane δ13C data points are cumulative degassing volumes (% of total).
Minerals 12 01222 g024
Figure 25. High-resolution large-scale mosaic of focused ion beam (FIB) BE SEM images [136] of non-productive, non-porous Marcellus shale sample from the Buda #1 well drilled in Luzerne County, Pennsylvania. Compare with Figure 5. This SEM image is 2.2-mm-wide. TOC is as high as 8.36 wt. % (mean = 4.2 wt. %) and measured VRo averages 3.2%. Average Sw is 72.1% of pore volume and average Sg is 21.4% of pore volume, with average gas-filled porosity only 0.8% of bulk volume. The Marcellus shale in this non-producing well contains only residual adsorbed and isotopically heavy Late-Stage CH4 (Figure 20) due to the loss of organic-hosted pore space. The respective H/C ratio and O/C ratio of the pore-filling pyrobitumen in this sample are 0.4 and 0.06 [12]. Electron microscopy performed by Dr. Herman Lemmens, FEI.
Minerals 12 01222 g025
Table 1. Marcellus Formation produced gas samples, chemical composition, and isotope ratios. nd—not detected. nm—not measured. * Concentration too small to measure isotope compositions. Sample data in bold blue print are time-lapse data discussed in the text. DG—dry gas. WG—wet gas. WV—West Virginia. PA—Pennsylvania.
Well ID/GroupO2
Mole%
CO2
Mole%
N2
Mole%
C1
Mole%
C2
Mole%
C3
Mole%
iC4
Mole%
nC4
Mole%
iC5
mole%
nC5
Mole%
C6+
Mole%
δ13C1
δDC1
δ13C2
δ13C3
DG10.0990.020.4797.451.870.07550.00170.00470.00130.00080.0076−27.08−158.5−33.2−36.3
DG20.0860.0390.4297.381.970.08650.00330.00650.00270.00140.009−28.69−157.7−34.74−36.79
DG30.130.0190.597.51.790.05610.00070.0024ndnd0.0018−27.85−158.2−34.1−36.8
DG40.160.0180.5797.351.840.05940.00080.0027ndnd0.001−27.85−159.3−34.13−36.9
DG50.0710.0180.497.541.90.06590.0010.00330.00010.00010.0004−27.95−158.2−34.22−36.9
DG60.130.0230.5397.391.860.0630.00090.0028ndndnd−28.5−157.8−34.96−37.4
DG70.060.0210.4797.791.610.04860.00060.0022ndndnd−26.09−159.1−32.52−35.1
DG80.0150.0230.497.821.690.04910.00060.0017ndndnd−25.96−159.9−32.48−35
DG90.160.0170.7397.321.710.06070.00090.00320.00010.0001nd−25.41−158.4−32.19−34.9
DG100.0370.0160.5797.621.690.06390.0010.00330.00010.0001nd−24−158.6−30.8−33.9
DG110.360.0222.0496.121.410.04250.00060.00170.00010.00010.0004−24.04−163.9−29.9−32.5
DG12nd0.0610.5797.871.420.0320.00040.0008ndndnd−23.9nm−29.86−31.4
DG130.0250.0090.4897.691.740.05710.00080.00250.00010.0001nd−25.27−161.5−31.58−34.8
DG140.0940.0190.697.61.630.05130.00070.0022ndndnd−25.03−160.3−31.28−34.2
DG150.160.0310.6897.371.70.05650.00080.0025ndndnd−25.36−161.1−31.72−35
DG160.190.0330.796.742.220.1080.00210.00670.00030.0002nd−26.23−158.3−32.79−35.2
DG17nd0.0110.3997.521.930.0350.00030.0011ndndnd−36.2nm−42.11−43
DG18nd0.0170.3897.052.410.0930.00160.00580.00020.0002nd−31.41nm−38.73−40.9
DG190.0430.06527.0655.270.02ndnd0.0001ndnd0.0009−59.58nm−32.7*
DG20nd0.0280.2397.572.090.0570.00070.002ndndnd−29.34nm−35.46−37.8
DG210.060.0210.497.022.370.08680.00140.00470.00020.0001nd−30.8nm−37.74−39.9
DG220.0160.0420.2897.332.210.07160.0010.00330.00010.0001nd−35.91nm−41.13−43
DG230.0270.010.3896.42.630.1010.00160.00540.00020.0001nd−33.57nm−39.94−42.1
DG240.0560.0290.4296.992.370.09480.00160.00550.00020.0002nd−28.78nm−35.95−37.5
DG250.110.0370.6196.782.330.09260.00150.0040.00010.0001nd−26.44nm−33.4−34.6
DG260.015nd0.3794.452.480.1050.00180.00620.00030.0002nd−28.36nm−34.97−37.6
DG270.0390.0120.3796.9420.05050.0010.00670.00040.0003nd−31.12nm−38.13−40.8
DG280.0380.0090.6996.462.310.08120.00130.00450.00020.00010.0049−33.98nm−40.16−42.3
DG290.20.0141.0296.442.110.06390.00090.0023ndndnd−27.29nm−33.52−35.9
DG300.0550.0310.5597.561.710.04540.00050.0014ndndnd−24.94nm−31.16−33.3
DG310.0450.0260.4997.621.740.04470.00050.0014ndndnd−25.13nm−31.44−33.6
DG320.0480.030.6297.811.390.03360.00040.0011ndndnd−23.53nm−29.86−32
DG330.05200.7496.780.5460.0048ndndndndnd−23.59nm−29.59*
DG340.0340.0150.9697.421.440.03850.00050.0012ndnd0.0054−24.63nm−30.89−33.1
WVDG1ndndnd95.82.260.13290.00030.00641.820.0130.003−39.1nm−41.7−38.9
WVDG2ndndnd971.8450.05790.00030.00341.0740.00450.0069−39.2nm−41.9−40.7
WG10.0160.150.480.8512.953.680.4710.8170.220.1870.236−43.7−189.2−32.74−28
WG2nd0.170.5175.415.615.490.5731.40.2720.3170.223−45.5−200.8−35.28−30.34
WG30.0170.150.4878.9413.724.260.4931.020.2550.2550.351−45.73−201.4−34.34−29.63
WG40.0150.140.4876.4114.885.20.6141.370.2990.3190.243−45.41−201.5−34.41−29.7
WG50.0130.170.4377.0214.834.870.5561.210.2810.30.284−44.97−196.6−34.1−29.39
WG60.0110.180.4779.6213.364.10.5280.9640.2550.2250.247−44.94−191.1−33.67−29.04
WG70.0150.170.5479.2113.284.260.5411.070.2770.2740.328−45.21−195.4−34.01−29.48
WG80.0110.160.4478.7713.874.320.5081.050.2550.2590.31−45.25−197.5−33.98−29.13
WG90.0110.140.4678.8413.714.380.5381.090.2740.2680.246−45.38−198.2−33.94−29.17
WG10
WG11
0.015
0.013
0.16
0.16
0.44
0.44
78.77
78.94
13.85
13.83
4.31
4.27
0.506
0.495
1.05
1.02
0.258
0.245
0.267
0.25
0.328
0.289
−45.22
−45.24
−198.4
−198.3
−33.9
−33.91
−29.08
−29.11
WG120.0120.140.576.6114.695.120.6181.350.3170.3260.288−45.5−203.1−34.63−29.87
WG130.0950.160.7169.3716.686.860.8542.330.5780.811.53−45.23−197.6−35.12−30.15
WG140.0120.150.571.8916.146.140.8471.840.3810.4690.83−45.19−200.9−35.14−30.2
WG150.0140.210.3490.497.561.040.1180.1150.02880.01370.0235−42.25−174.4−31.2−25.67
WG160.320.141.492.275.270.4570.03330.03560.00580.00290.004−40.15−167.2−33.34−28.18
WG17nd0.150.5476.5214.525.110.6321.40.3040.2690.456−46.74−210.6−35.87−31.05
WG18nd0.180.4284.5110.642.410.3580.5070.1840.1330.568−42.98−179.5−32.15−27.18
WG19nd0.20.3390.967.350.8760.0820.08970.02020.01080.0456−40.83−172.1−31.38−26.33
WG20nd0.180.4380.3513.423.750.4730.8050.1970.1590.192−44.06−186.6−33.11−28.54
WG21nd0.150.4479.213.844.230.4980.9980.2130.2050.185−45.27−192.5−33.9−29.13
WG22nd0.150.3982.4812.383.10.3920.5990.1570.1120.205−43.21−179.4−32.37−27.56
WG23nd0.160.4883.3711.492.980.3790.6240.1640.1240.177−44.53−184.9−33.17−28.48
WG24nd0.160.4783.1411.413.10.4270.6910.1960.1430.204−44.61−186.7−33.28−28.75
WG25nd0.150.4974.9316.485.580.5491.250.1980.2210.125−44.97−200.4−34.66−29.78
WG260.0140.150.5281.8512.293.320.3590.5980.1640.1750.502−45.29−196−33.89−29.18
WG27nd0.120.3973.0715.616.010.8681.730.3690.4090.813−44.5−242.8−33.82−29.25
WV280.0150.130.3973.4915.215.650.8521.620.3780.4131.18−44.36−197.7−33.69−28.96
PAWG1nd0.0860.5770.6416.427.810.7922.20.3870.5550.49−45.23−212.3−35.84−31.22
PAWG2nd0.0850.4977.2414.485.240.5441.150.2150.2430.249−43.82−193.5−33.83−29.37
PAWG3nd0.0840.4779.7912.674.320.5191.10.2610.2870.434−42.19−185.4−33.15−28.46
Table 2. Additional isotope ratios for selected samples. nm—not measured.
Well ID/GroupδDC2
δ13CO2
δ15N2
DG1−188.2nmnm
DG2−190.6nmnm
DG3−191.6nmnm
DG4−191.5nmnm
DG5−192nmnm
DG6−189.7nmnm
DG7−188.9nmnm
DG8−192.6nmnm
DG9−191.3nmnm
DG10−190.4nmnm
DG11−189.4nm−10.223
DG12nm−26.5nm
DG13−192.9nmnm
DG14−189.4nmnm
DG15−190.9nmnm
DG16−190.9nmnm
DG19nm−31.8nm
PAWG1−171.4nm−13.9
PAWG2−162.7nm−13.3
PAWG3−162.4nm−12.7
Table 3. Pressure core isotope ratio and cumulative degassing volume results. Nm—not measured.
Cumulative Degassing Volume %δ13C1
δ13C2
δ13C3
21.77−26.3−31nm
22.93−26.88−32.7−34.8
33.12−27.64−33.15−33.5
25.47−27.31−32.93−35.1
28.45−27.49−32.92−32.3
37.52−27.62−33.39−33.57
40.69−27.68−33.45−35
53.53−27.03−33.5−35
66.03−26.25−32.94−34.8
75.35−25.63−33.45−34.7
71.81−25.69−33.24−34.8
100 (crushed gas)−22.8−29.1−34.7
Table 4. Noble gas concentrations and isotope ratios of selected Marcellus Formation dry gas samples. Concentration prefixes are p = pico (10−12), n = nano (10−9), µ = micro (10−6). R/Ra is the ratio of helium isotopes in the sample divided by the ratio in air = (3He/4He)measured/(3He/4He)air. Selected characteristic noble gas ratios for water and crust are included for comparison. Note that the water ratios are determined from the relative solubility of atmospheric noble gases in contact with water. The 84Kr and 132Xe are fission products of uranium and their concentrations are dependent upon the uranium content of the crustal rocks. 21Ne is generated by the α particle produced by uranium decay reacting with oxygen and magnesium in the rock. 40Ar is produced by the radioactive decay of K.
Well3He
pcc/cc
4He
µcc/cc
20Ne
µcc/cc
21Ne
µcc/cc
22Ne
µcc/cc
Ne
µcc/cc
36Ar
µcc/cc
38Ar
µcc/cc
40Ar
µcc/cc
Ar
µcc/cc
84Kr
ncc/cc
Kr
ncc/cc
132Xe
ncc/cc
Xe
ncc/cc
DG1939.67501.66.532.60993.259.149.651.973088.43100.0132.14231.93.72013.8
DG174.56298.20.450.0020.060.460.290.06108.6109.06.6311.60.1640.6
DG1241.17774.30.070.0010.050.070.220.0490.991.16.3311.10.3351.2
DG2027.42276.21.460.0050.181.460.670.13216.7217.564.00112.34.71317.5
DG1817.23300.10.230.0010.030.230.300.0693.994.29.4616.60.3771.4
WellR/Ra20Ne
22Ne
21Ne
22Ne
38Ar
36Ar
40Ar
36Ar
82Kr
84Kr
83Kr
84Kr
86Kr
84Kr
128Xe
132Xe
129Xe
132Xe
130Xe
132Xe
131Xe
132Xe
134Xe
132Xe
136Xe
132Xe
DG190.0579.5970.02890.204320.1000.1940.2480.2970.1460.9730.1480.8280.3940.354
DG170.0118.2230.03320.189373.2000.1900.2470.2940.1350.9850.1550.8020.4520.422
DG120.0389.6740.03110.189404.1000.1940.2420.2890.1810.9920.1600.8210.4110.348
DG200.0719.4720.02900.200324.6000.1900.2520.2950.1140.9650.1340.8000.3960.365
DG180.0419.5970.03410.198315.6900.1760.2240.2770.1570.9650.1360.7990.3980.346
Table 5. Select sample noble gas ratios compared to water and crustal ratios.
R/Ra20Ne
22Ne
21Ne
22Ne
40Ar
36Ar
84Kr
36Ar
132Xe
84Kr
4He
40Ar*
21Ne*
40Ar*
20Ne
36Ar
84Kr
36Ar
Water19.80.029295.50.0380.021
Crust0.020.090.45030000.0290.138
DG190.0579.5970.0289320.1000.01370.028196.700.6770.014
Dg170.0118.2230.0332373.2000.02280.0251.120.431.5590.023
DG120.0389.6740.0311404.1000.02810.0531.6000.2940.028
DG200.0719.4720.0290324.6000.09590.0746.34302.1800.096
DG180.0419.5970.0341315.6900.03180.0404.4243.30.7650.032
Table 6. Condensate data for selected wells.
Well
ID/Group
°API
Gravity
C7 Temp °CPristane/PhytaneToluene/nC7nC7/MCHHeptane
Ratio
Isoheptane
Ratio
WG165.5129.271.840.171.3731.39.16
WG274.6131.881.940.111.8333.568.55
WG369.8131.091.480.161.6332.939.18
WG469.6131.472.050.141.8734.059.98
WG569.4130.171.420.131.7433.959.92
WG670.9131.231.350.211.1229.855.71
WG757.8132.031.350.21.1630.725.09
WG865.3130.051.580.151.6433.919.75
WG968.3130.861.70.161.6732.9910.05
WG1066.5130.041.620.151.6733.919.93
WG1164.8129.791.610.161.6534.079.86
WG1273132.211.940.141.8133.369.26
WG13-131.21.910.111.8834.298.94
WG1470.8130.71.920.1061.9534.89.25
WG1860.1129.231.880.21.1730.457.34
WG2057.4130.11.380.221.1430.166.34
WG2170.4130.92.210.141.7633.3610.43
WG23-130.51.610.2321.2128.868.58
WG2458.4131.551.430.21.1227.338.15
WG2553.2131.11.890.121.9734.459.77
WG26-131.61.380.411.1630.95.41
WG27-131.520.121.7833.929.46
WV28-131.71.820.171.7132.329.97
PAWG174.6------
PAWG253.2------
Publisher’s Note: MDPI stays neutral with regard to jurisdictional claims in published maps and institutional affiliations.

