
In Situ Determination of Radioactivity Levels and Radiological Doses in and around the Gold Mine Tailing Dams, Gauteng Province, South Africa
 , , ,
, , ,
Abstract
:1. Introduction
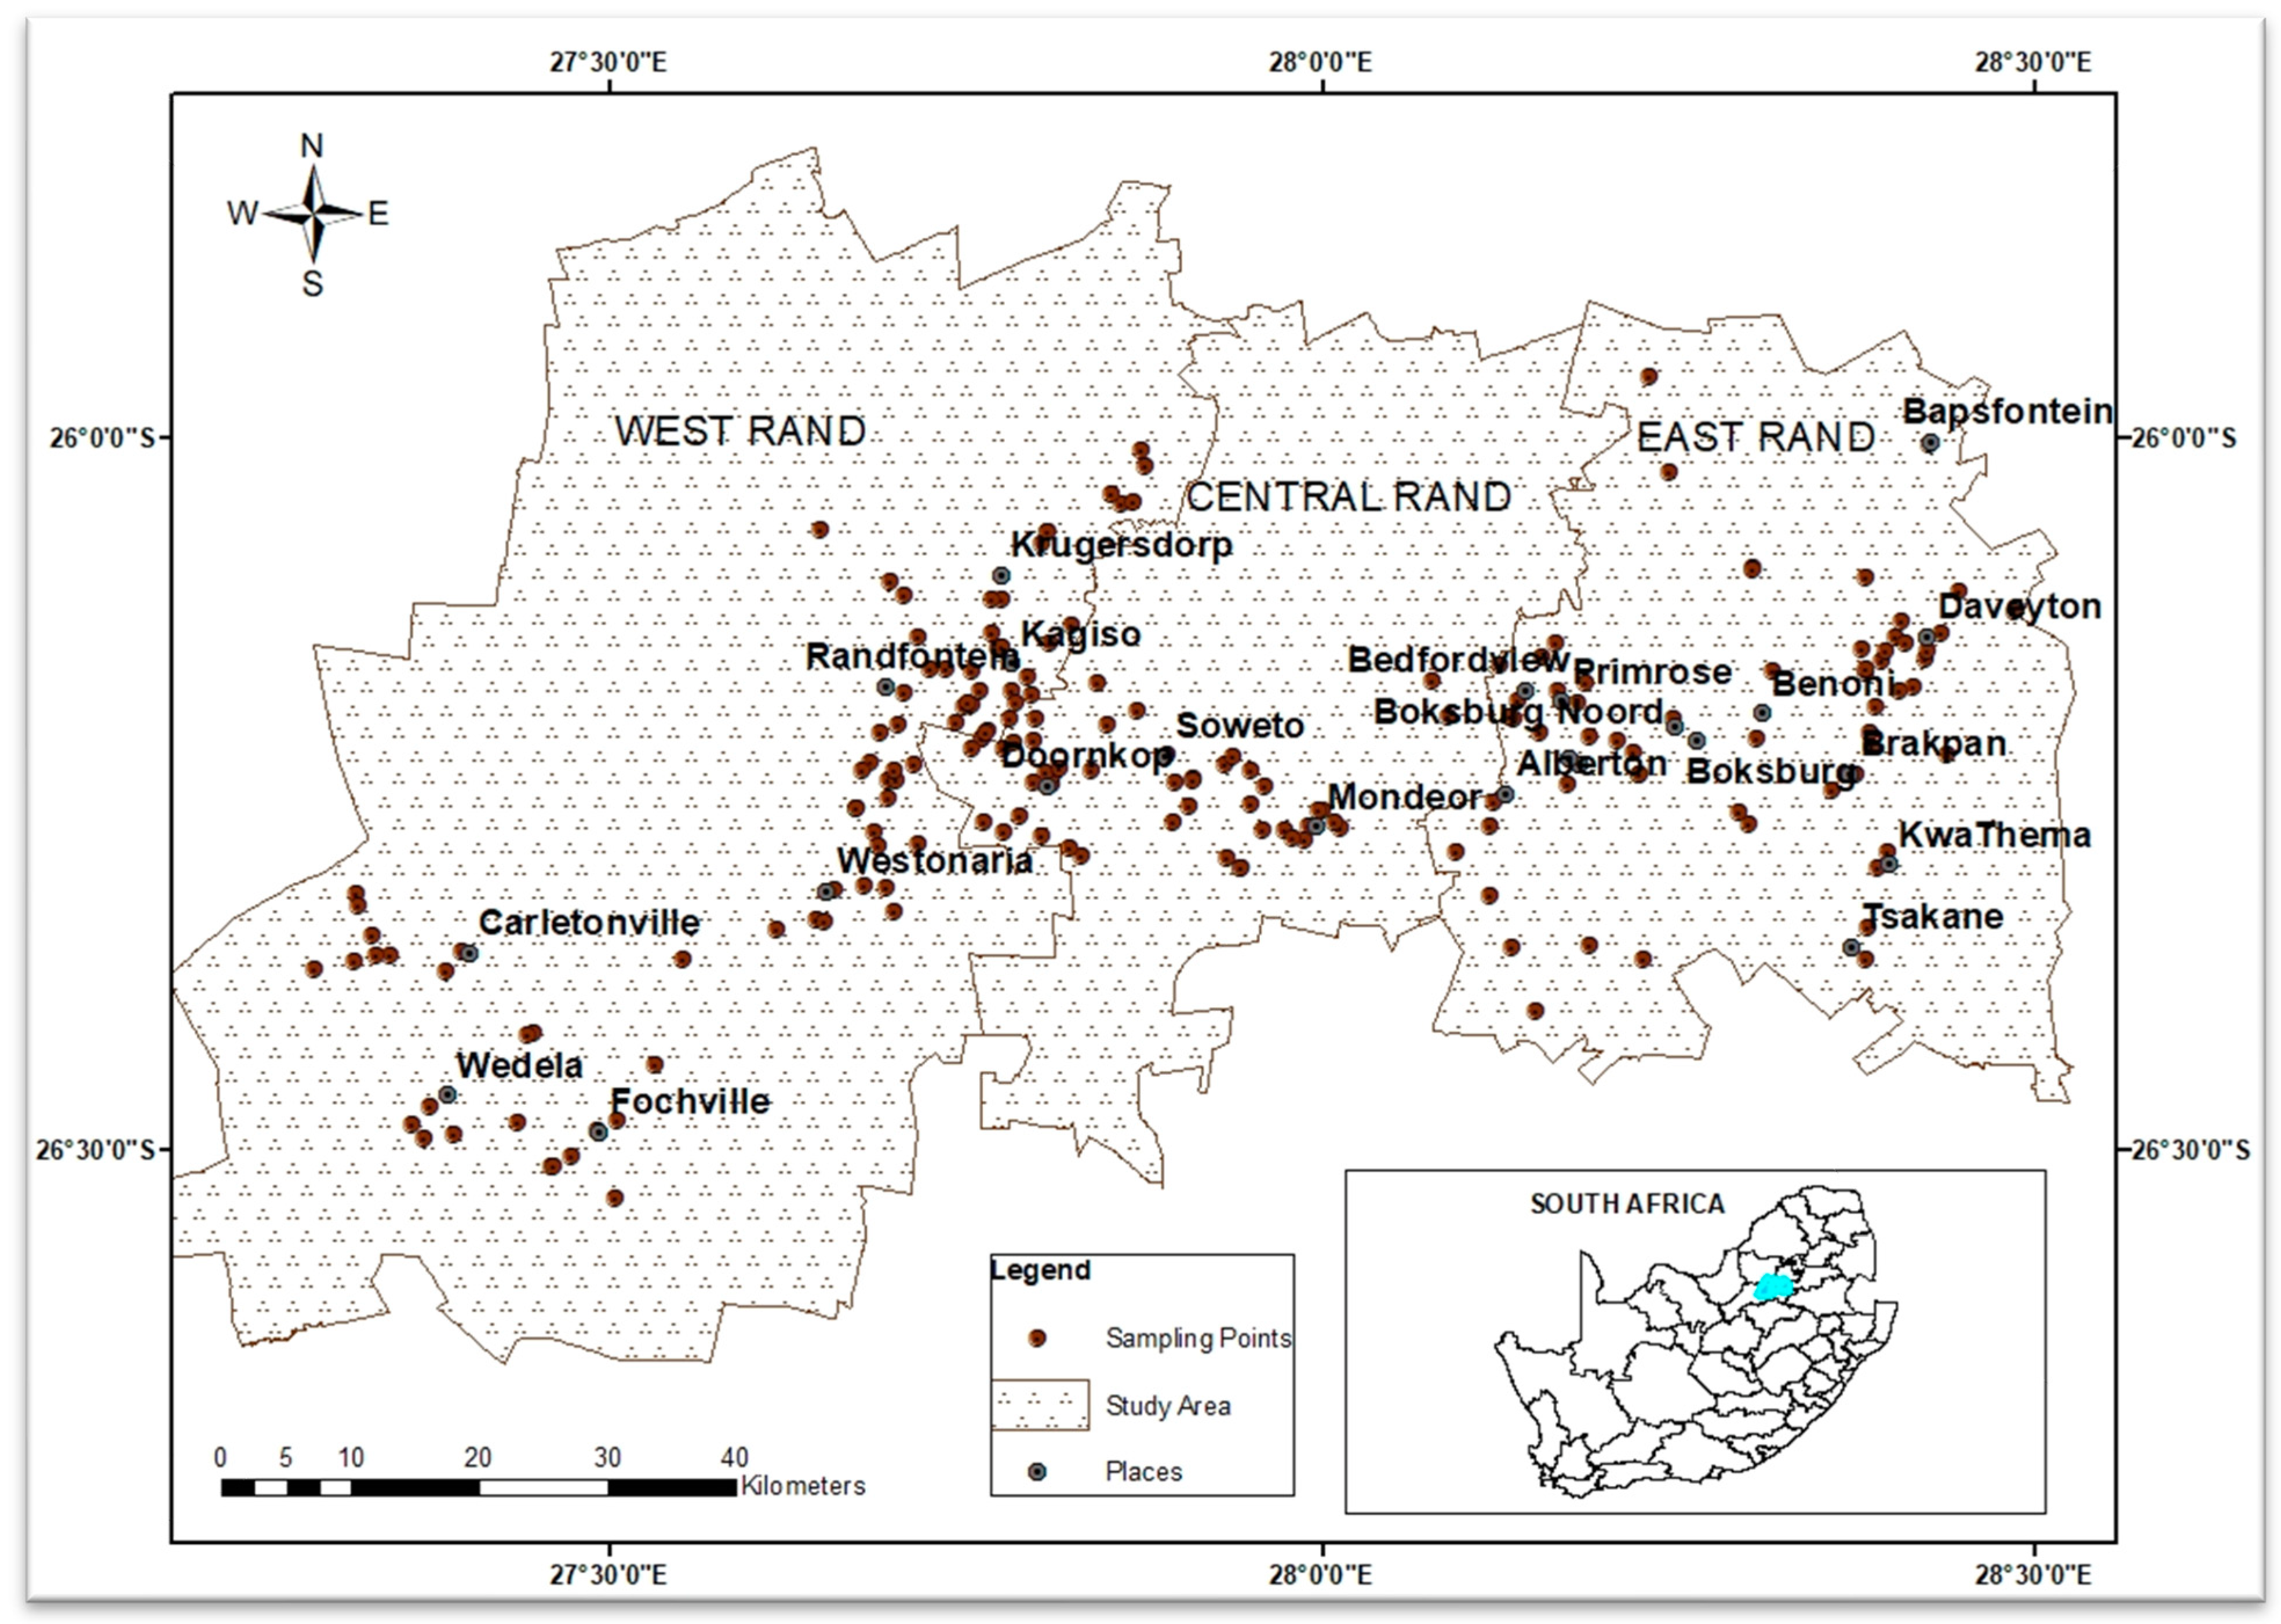
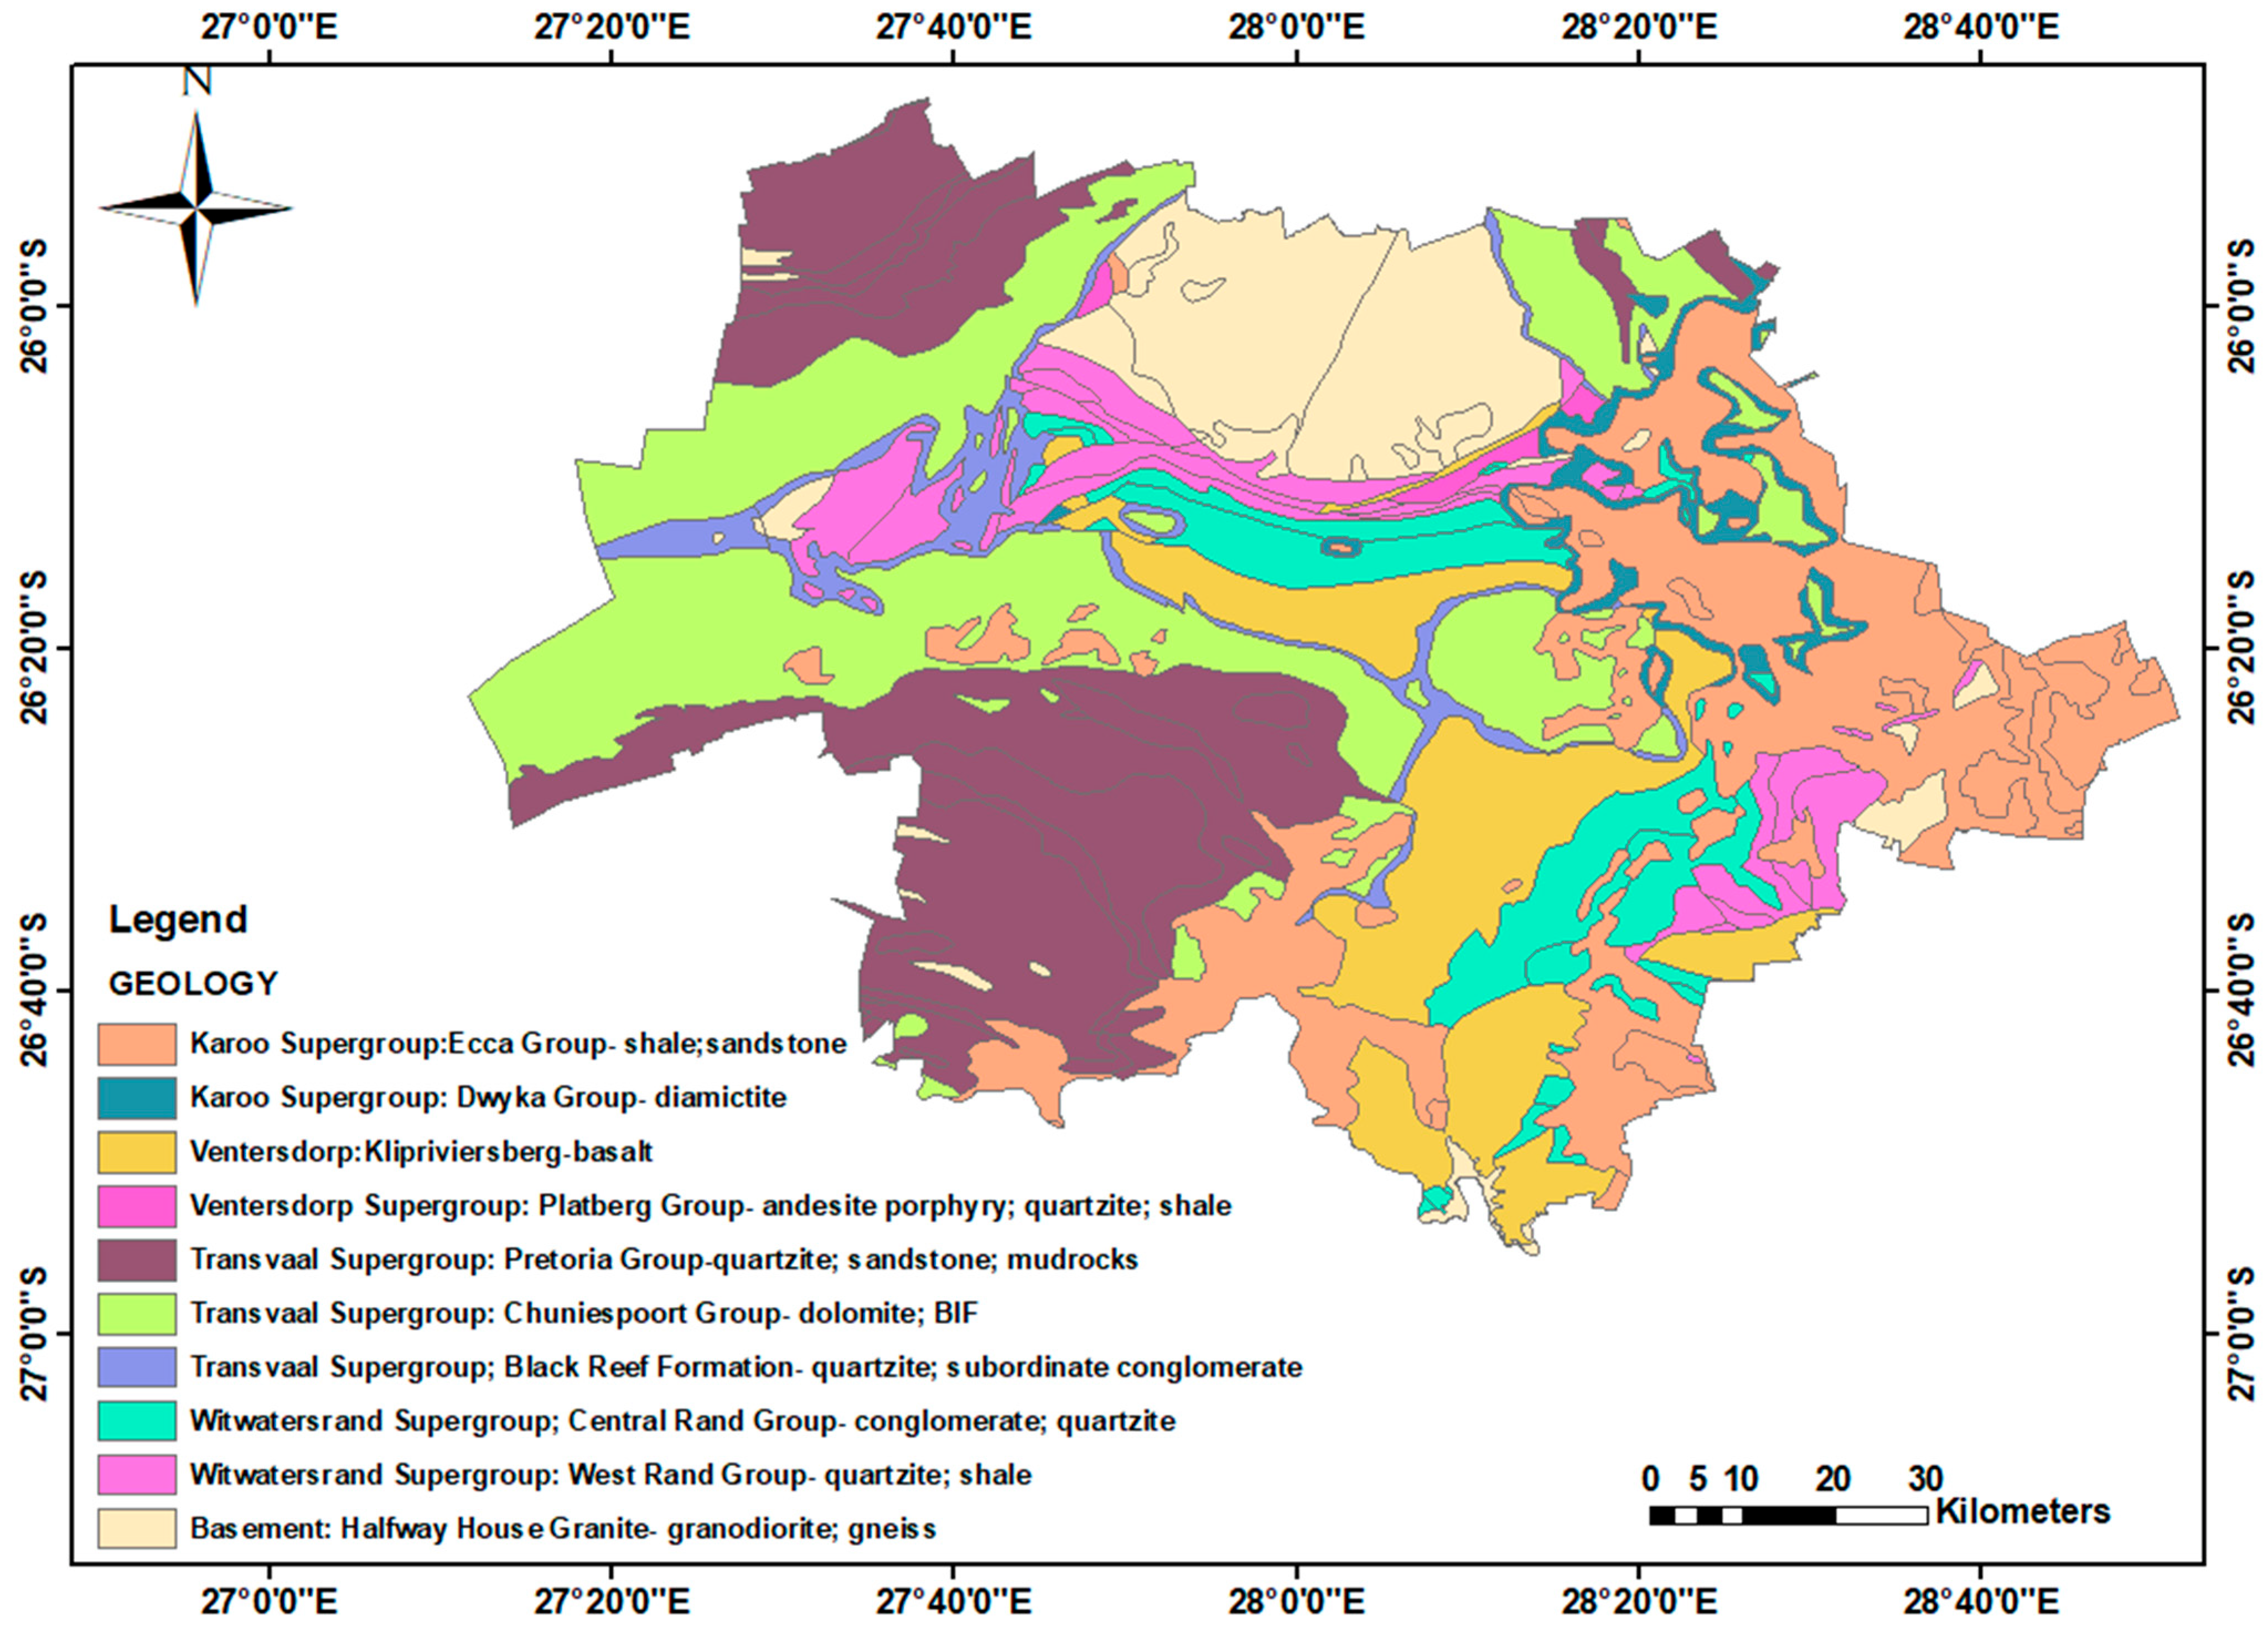
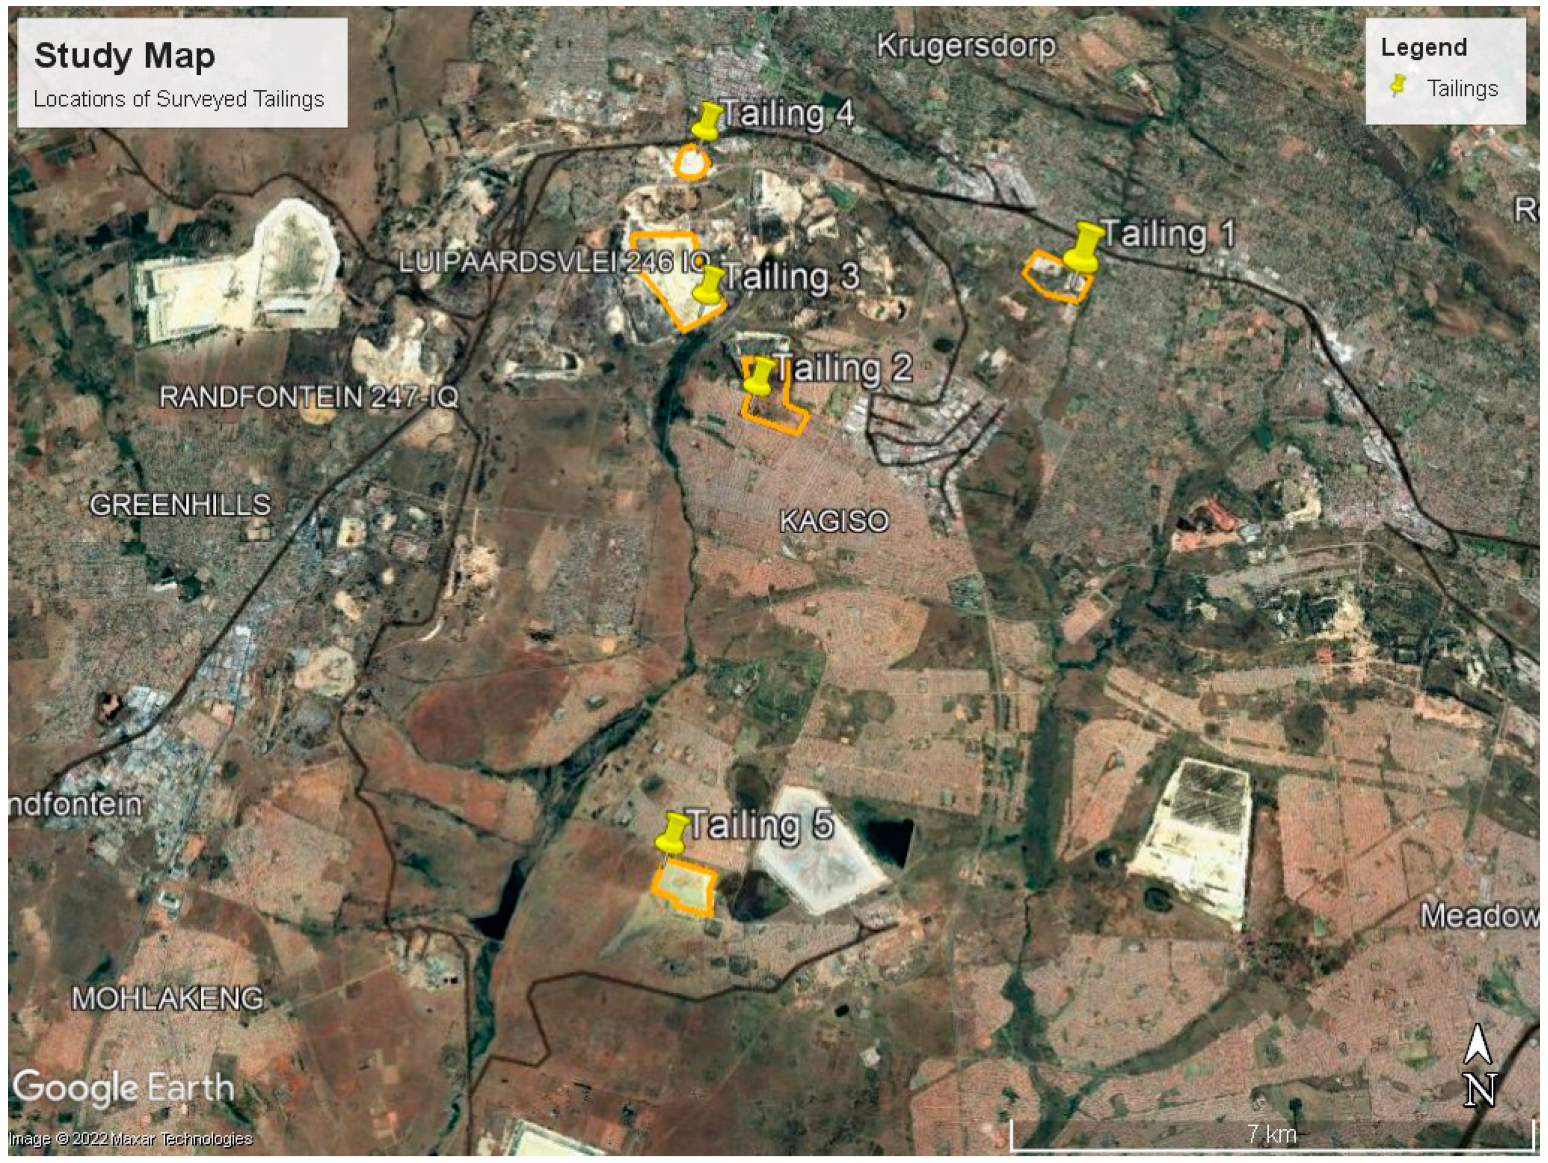
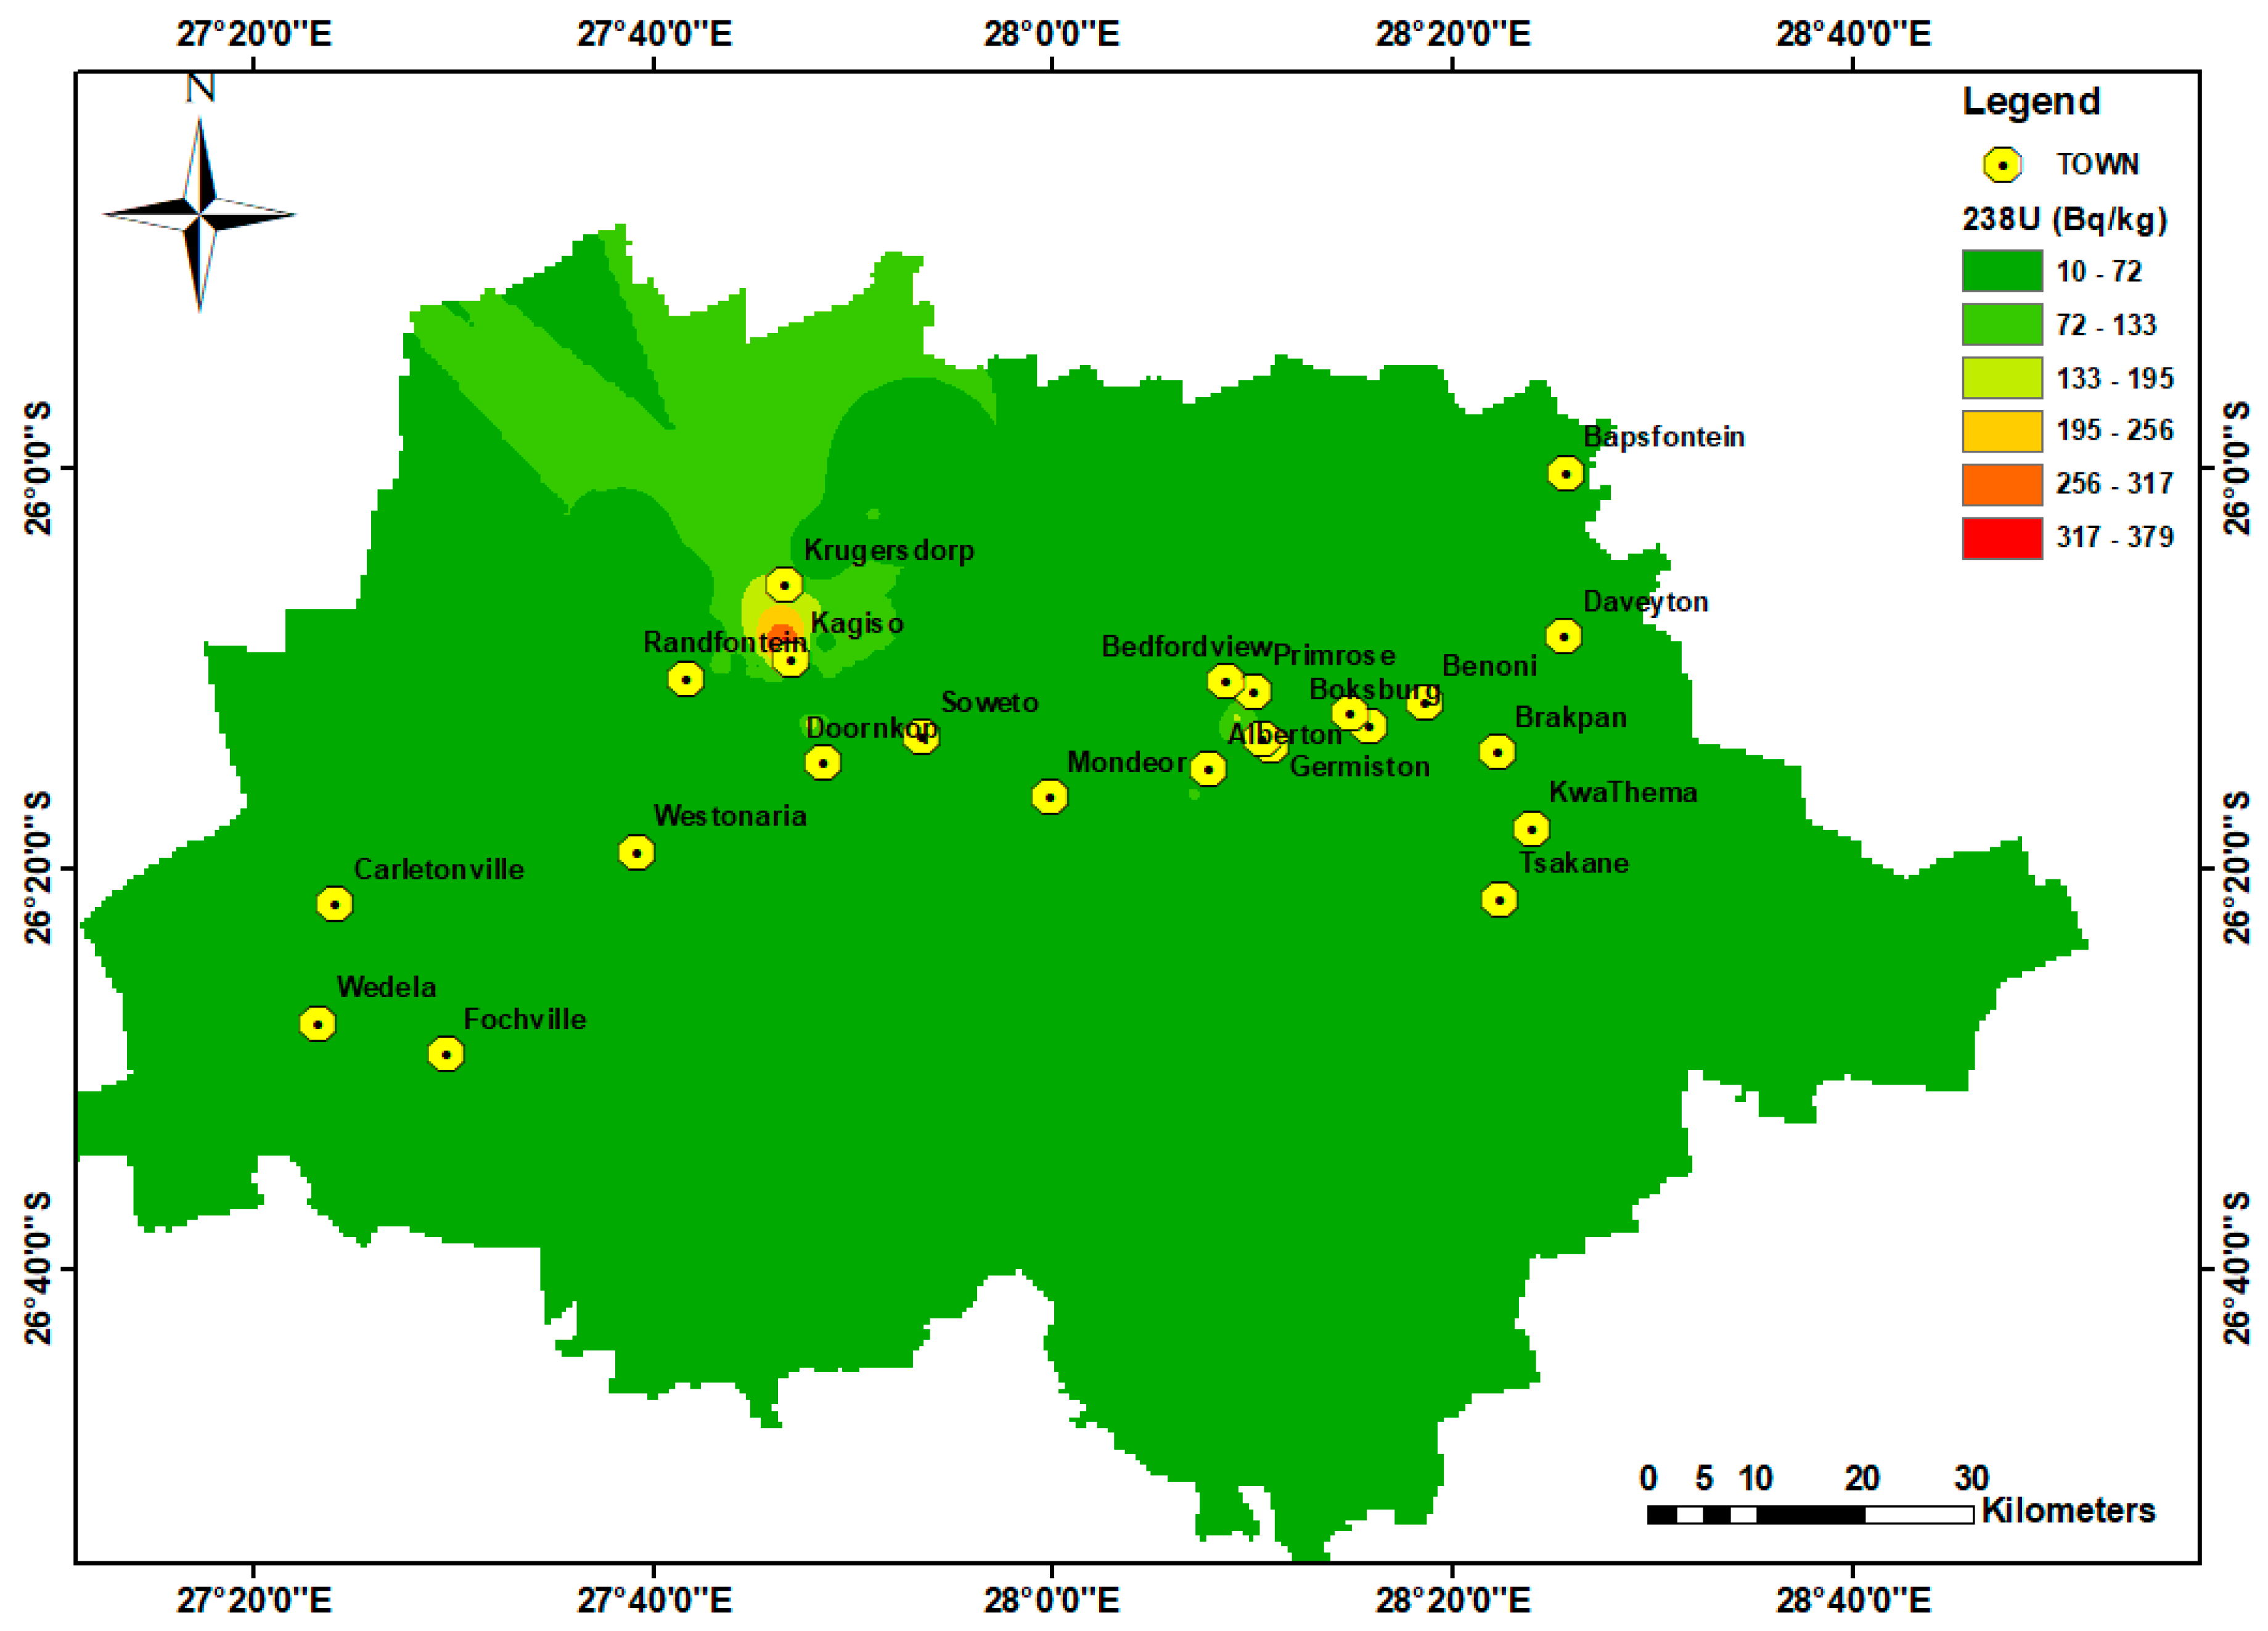
Study Area
2. Materials and Methods
2.1. In Situ Gamma Survey
2.2. Calculation of Radiological Doses
3. Results
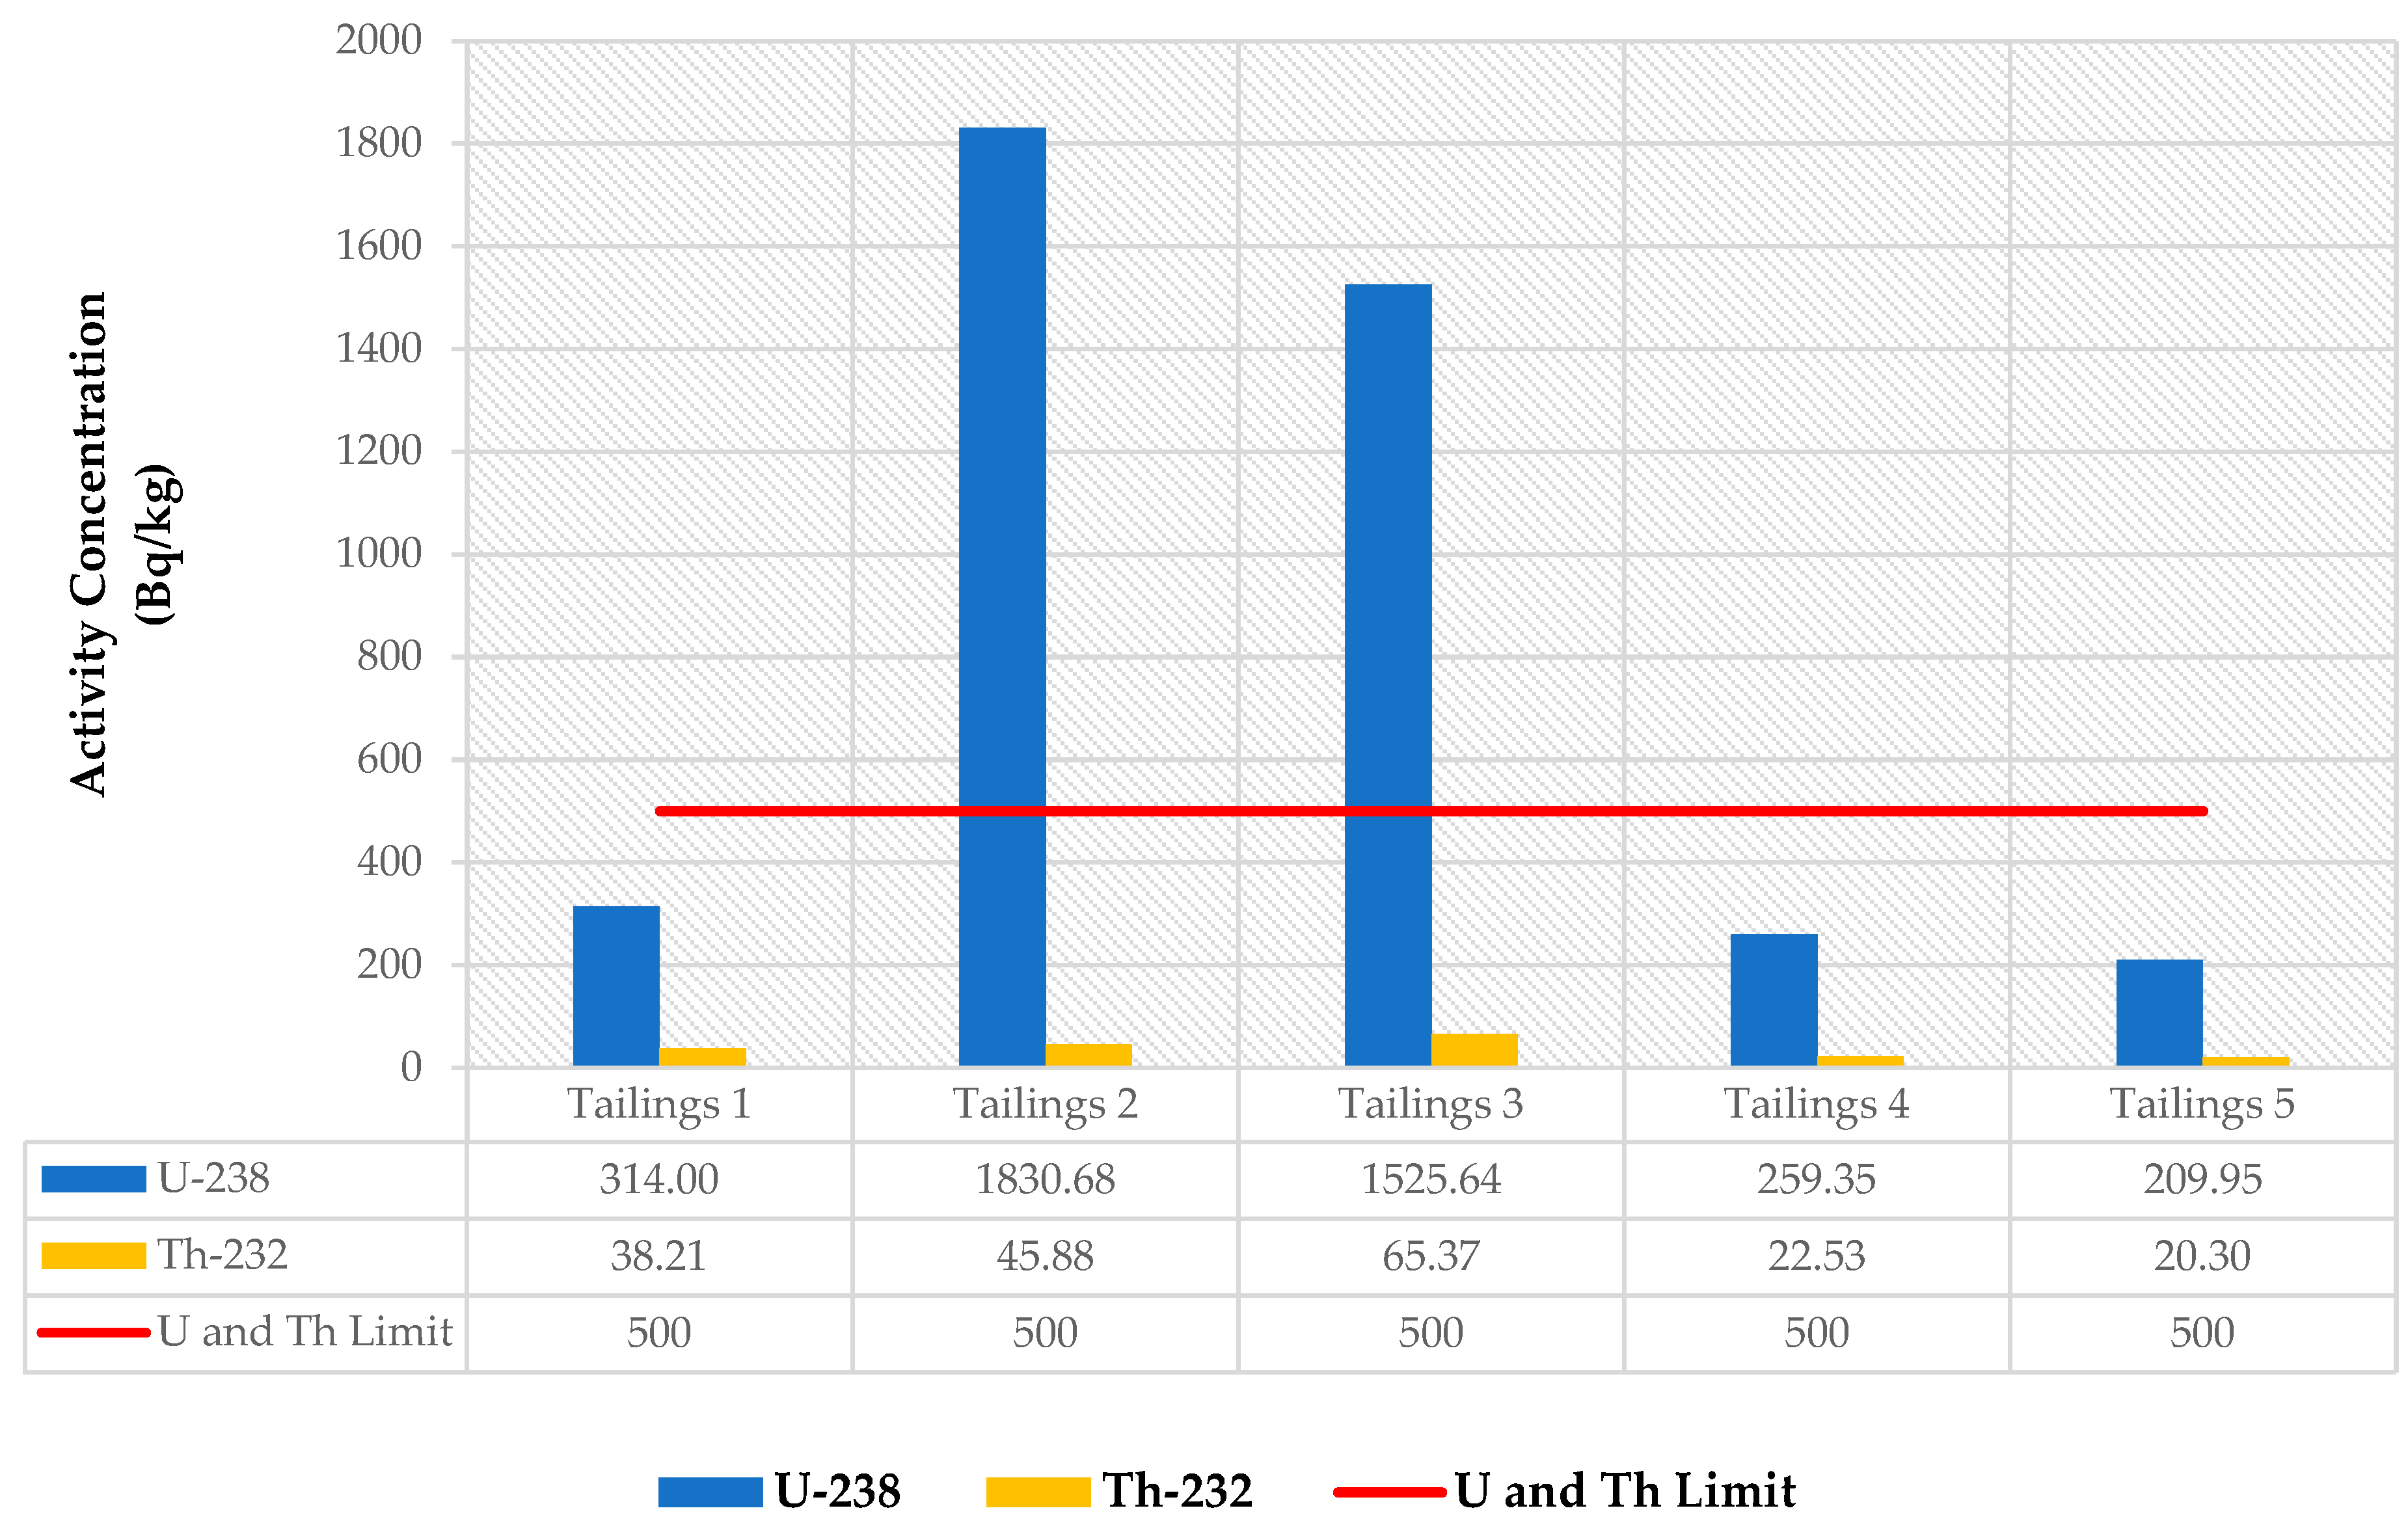
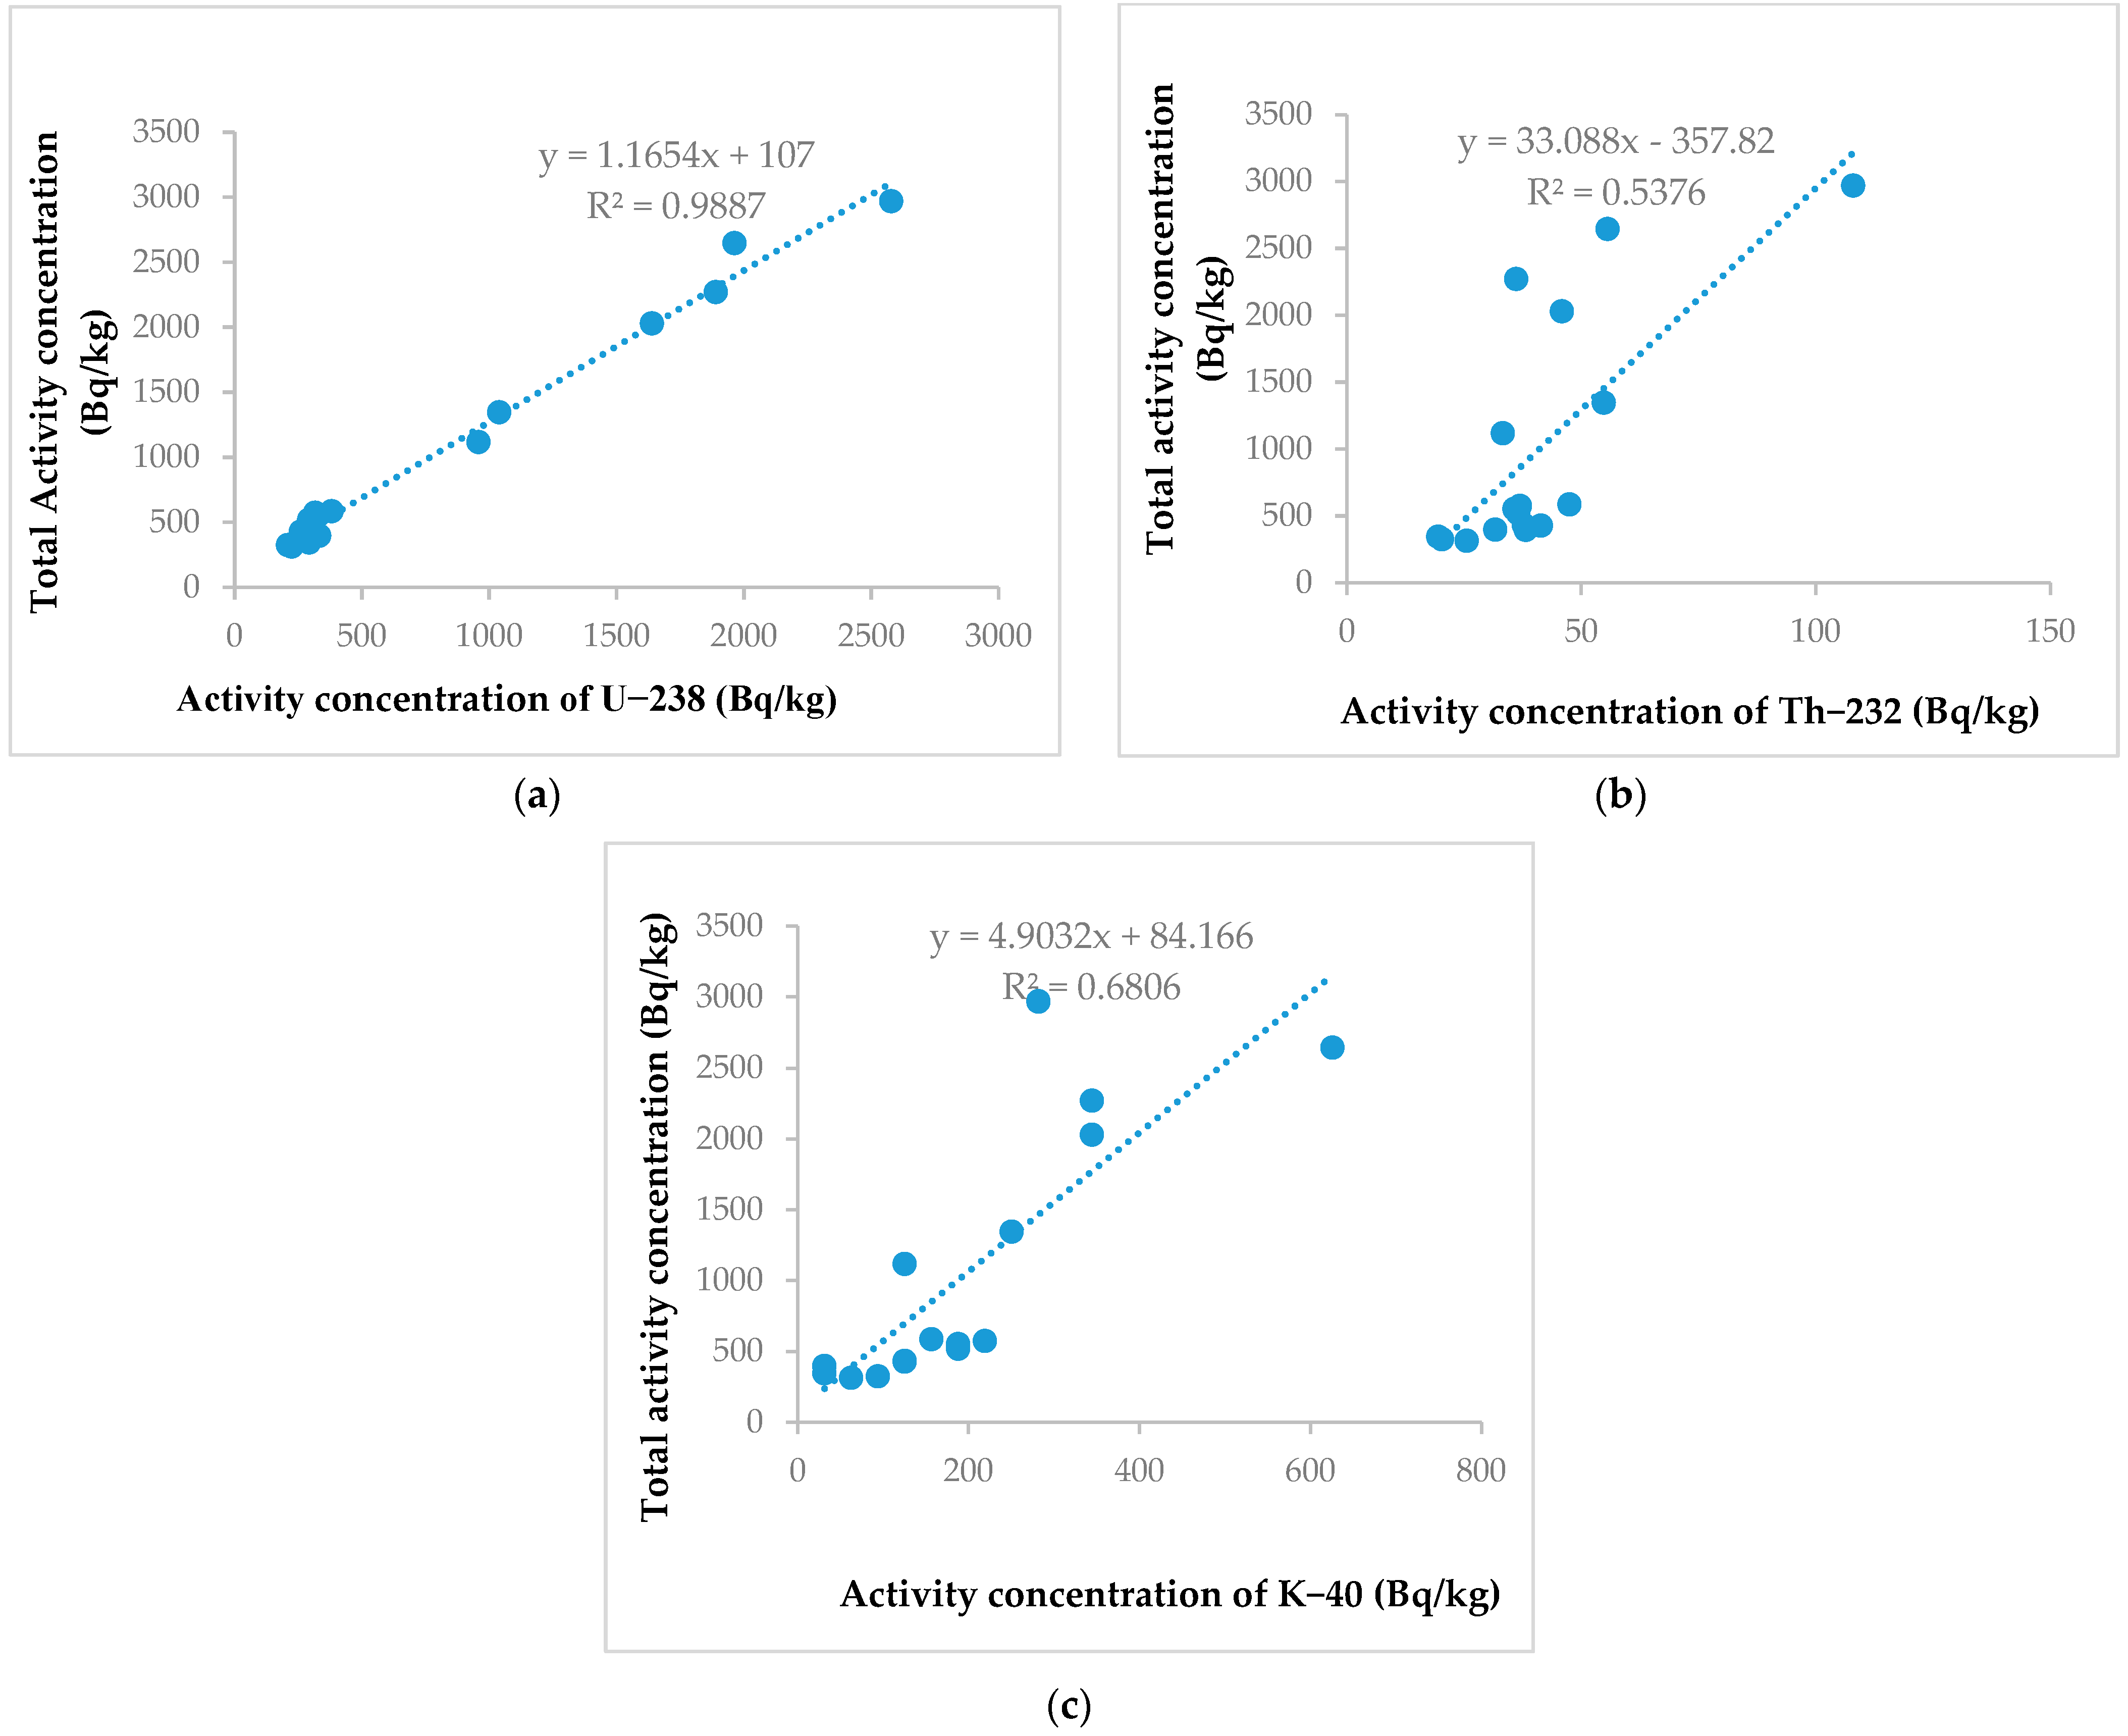
3.1. Activity Concentration of Natural Radionuclides in the Tailing Dams
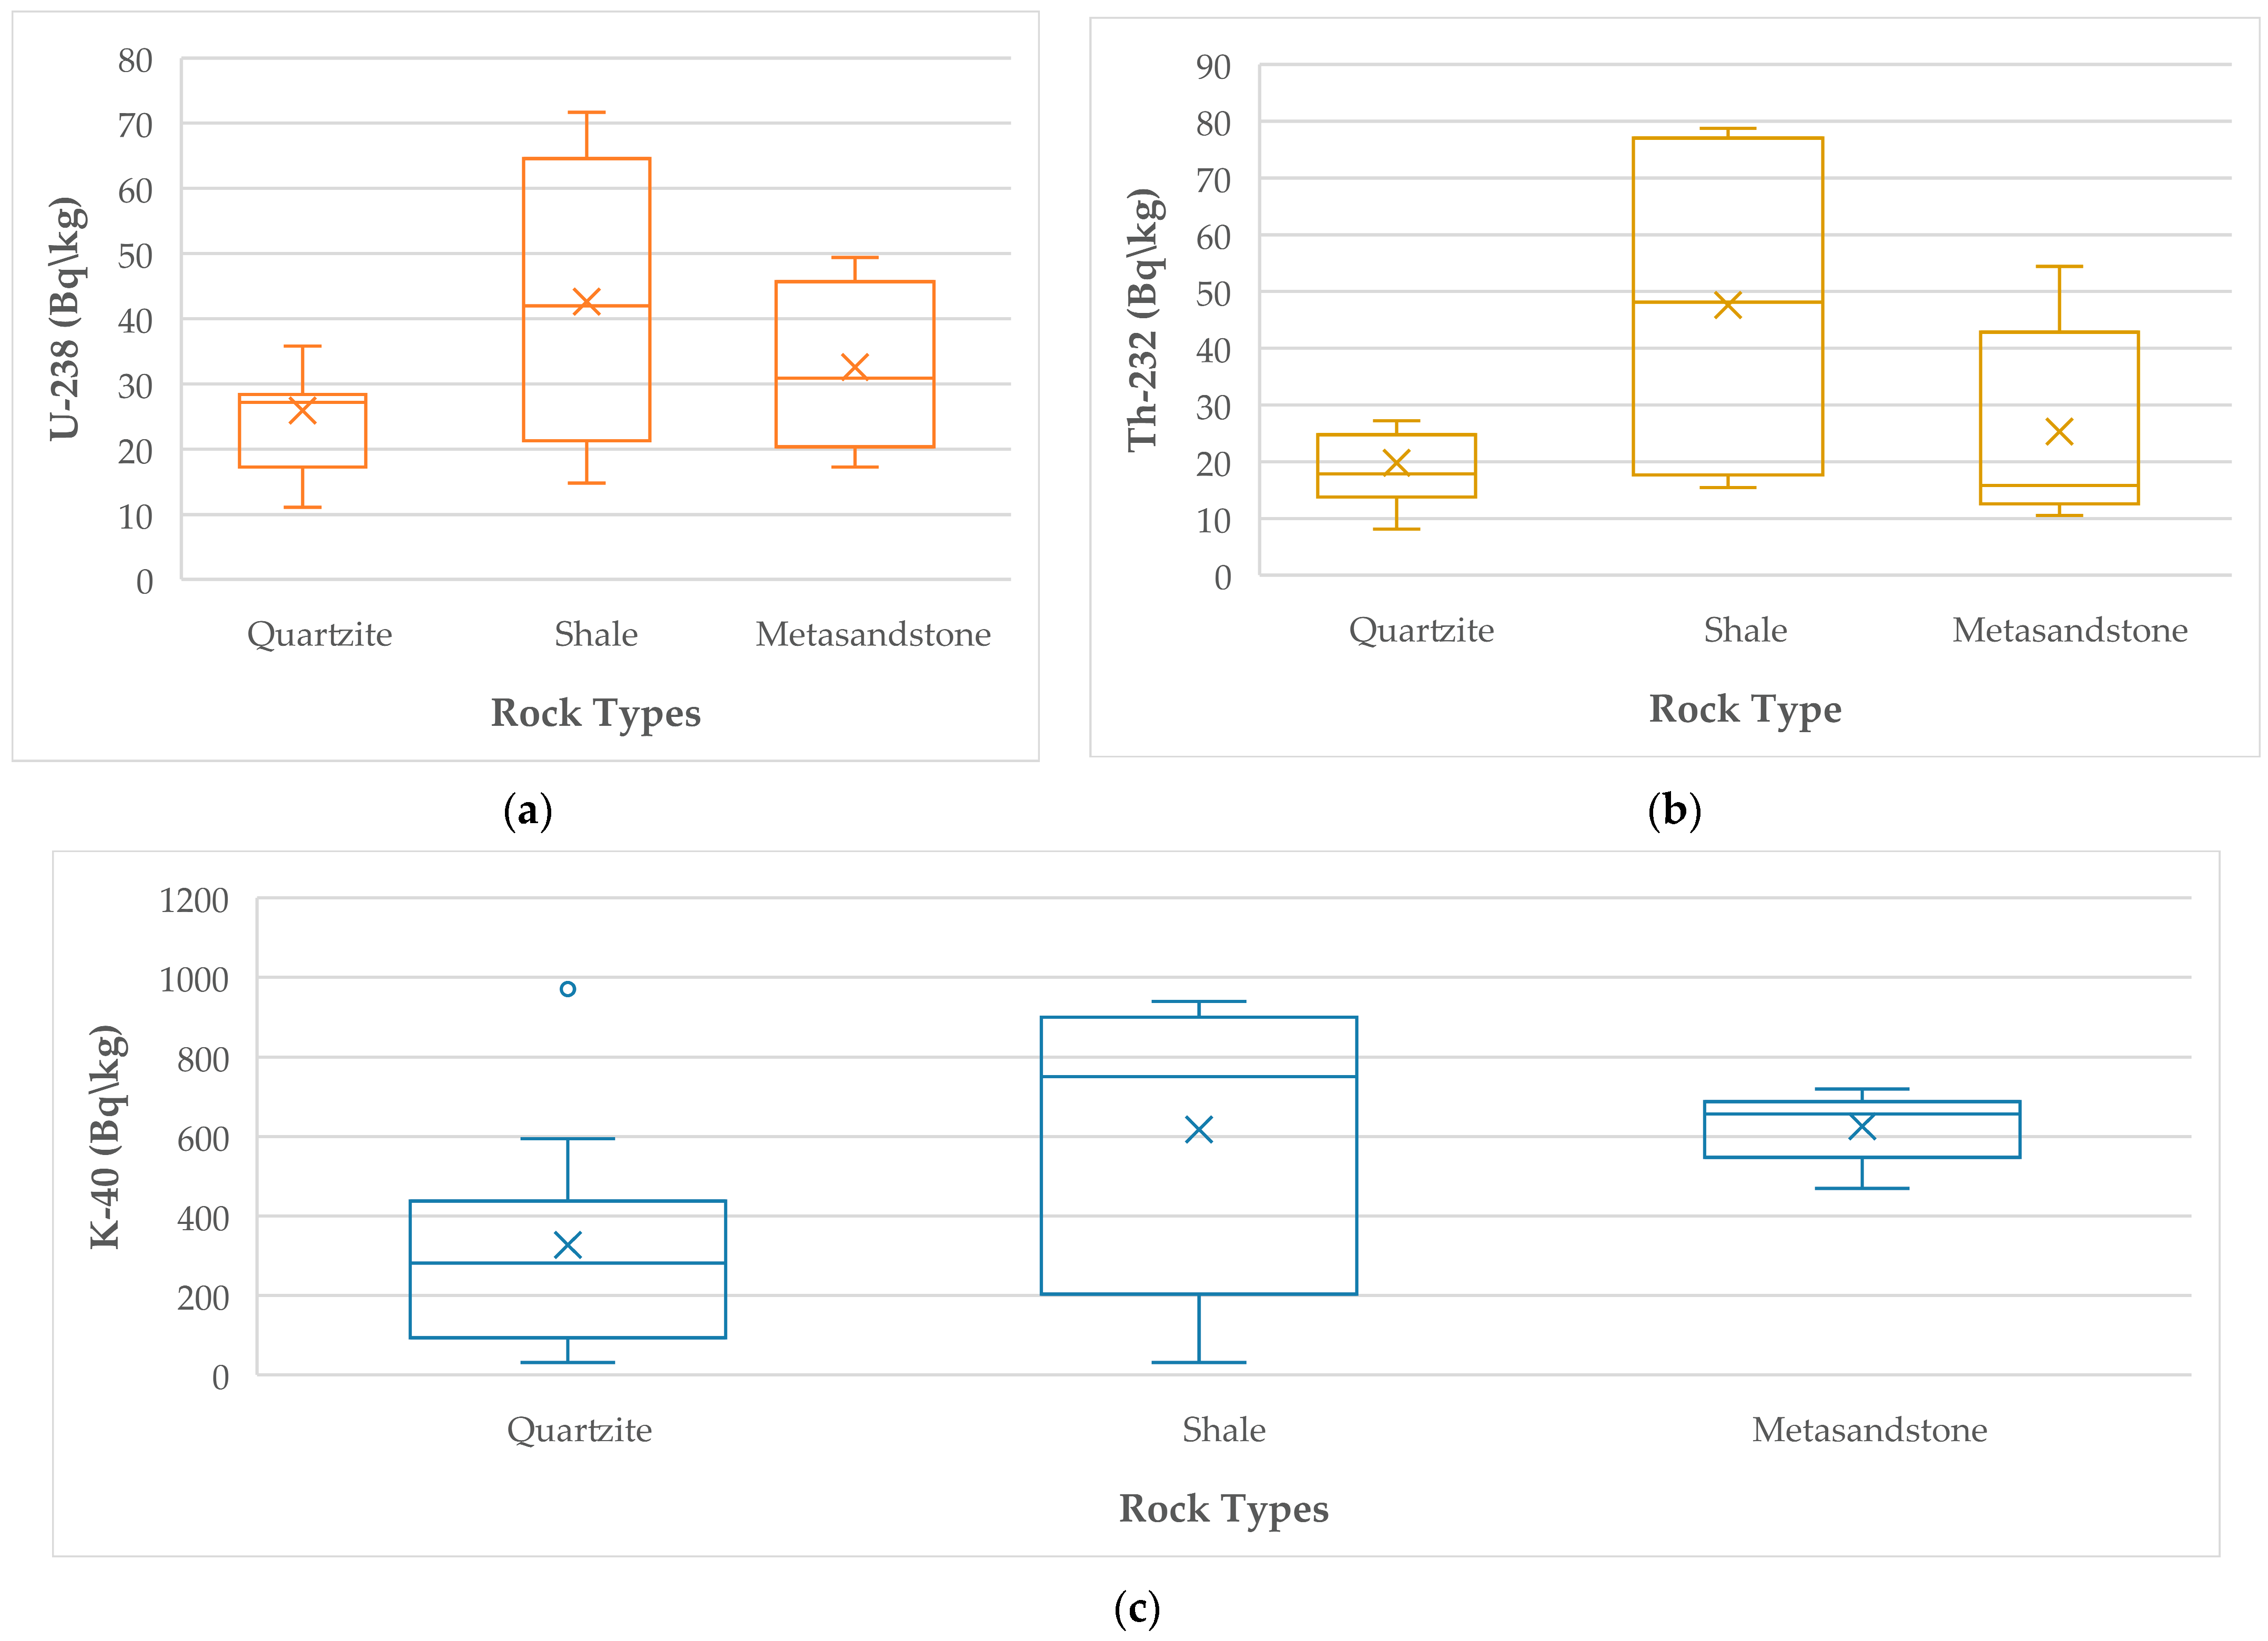
3.2. Activity Concentrations of Natural Radionuclides in Rocks
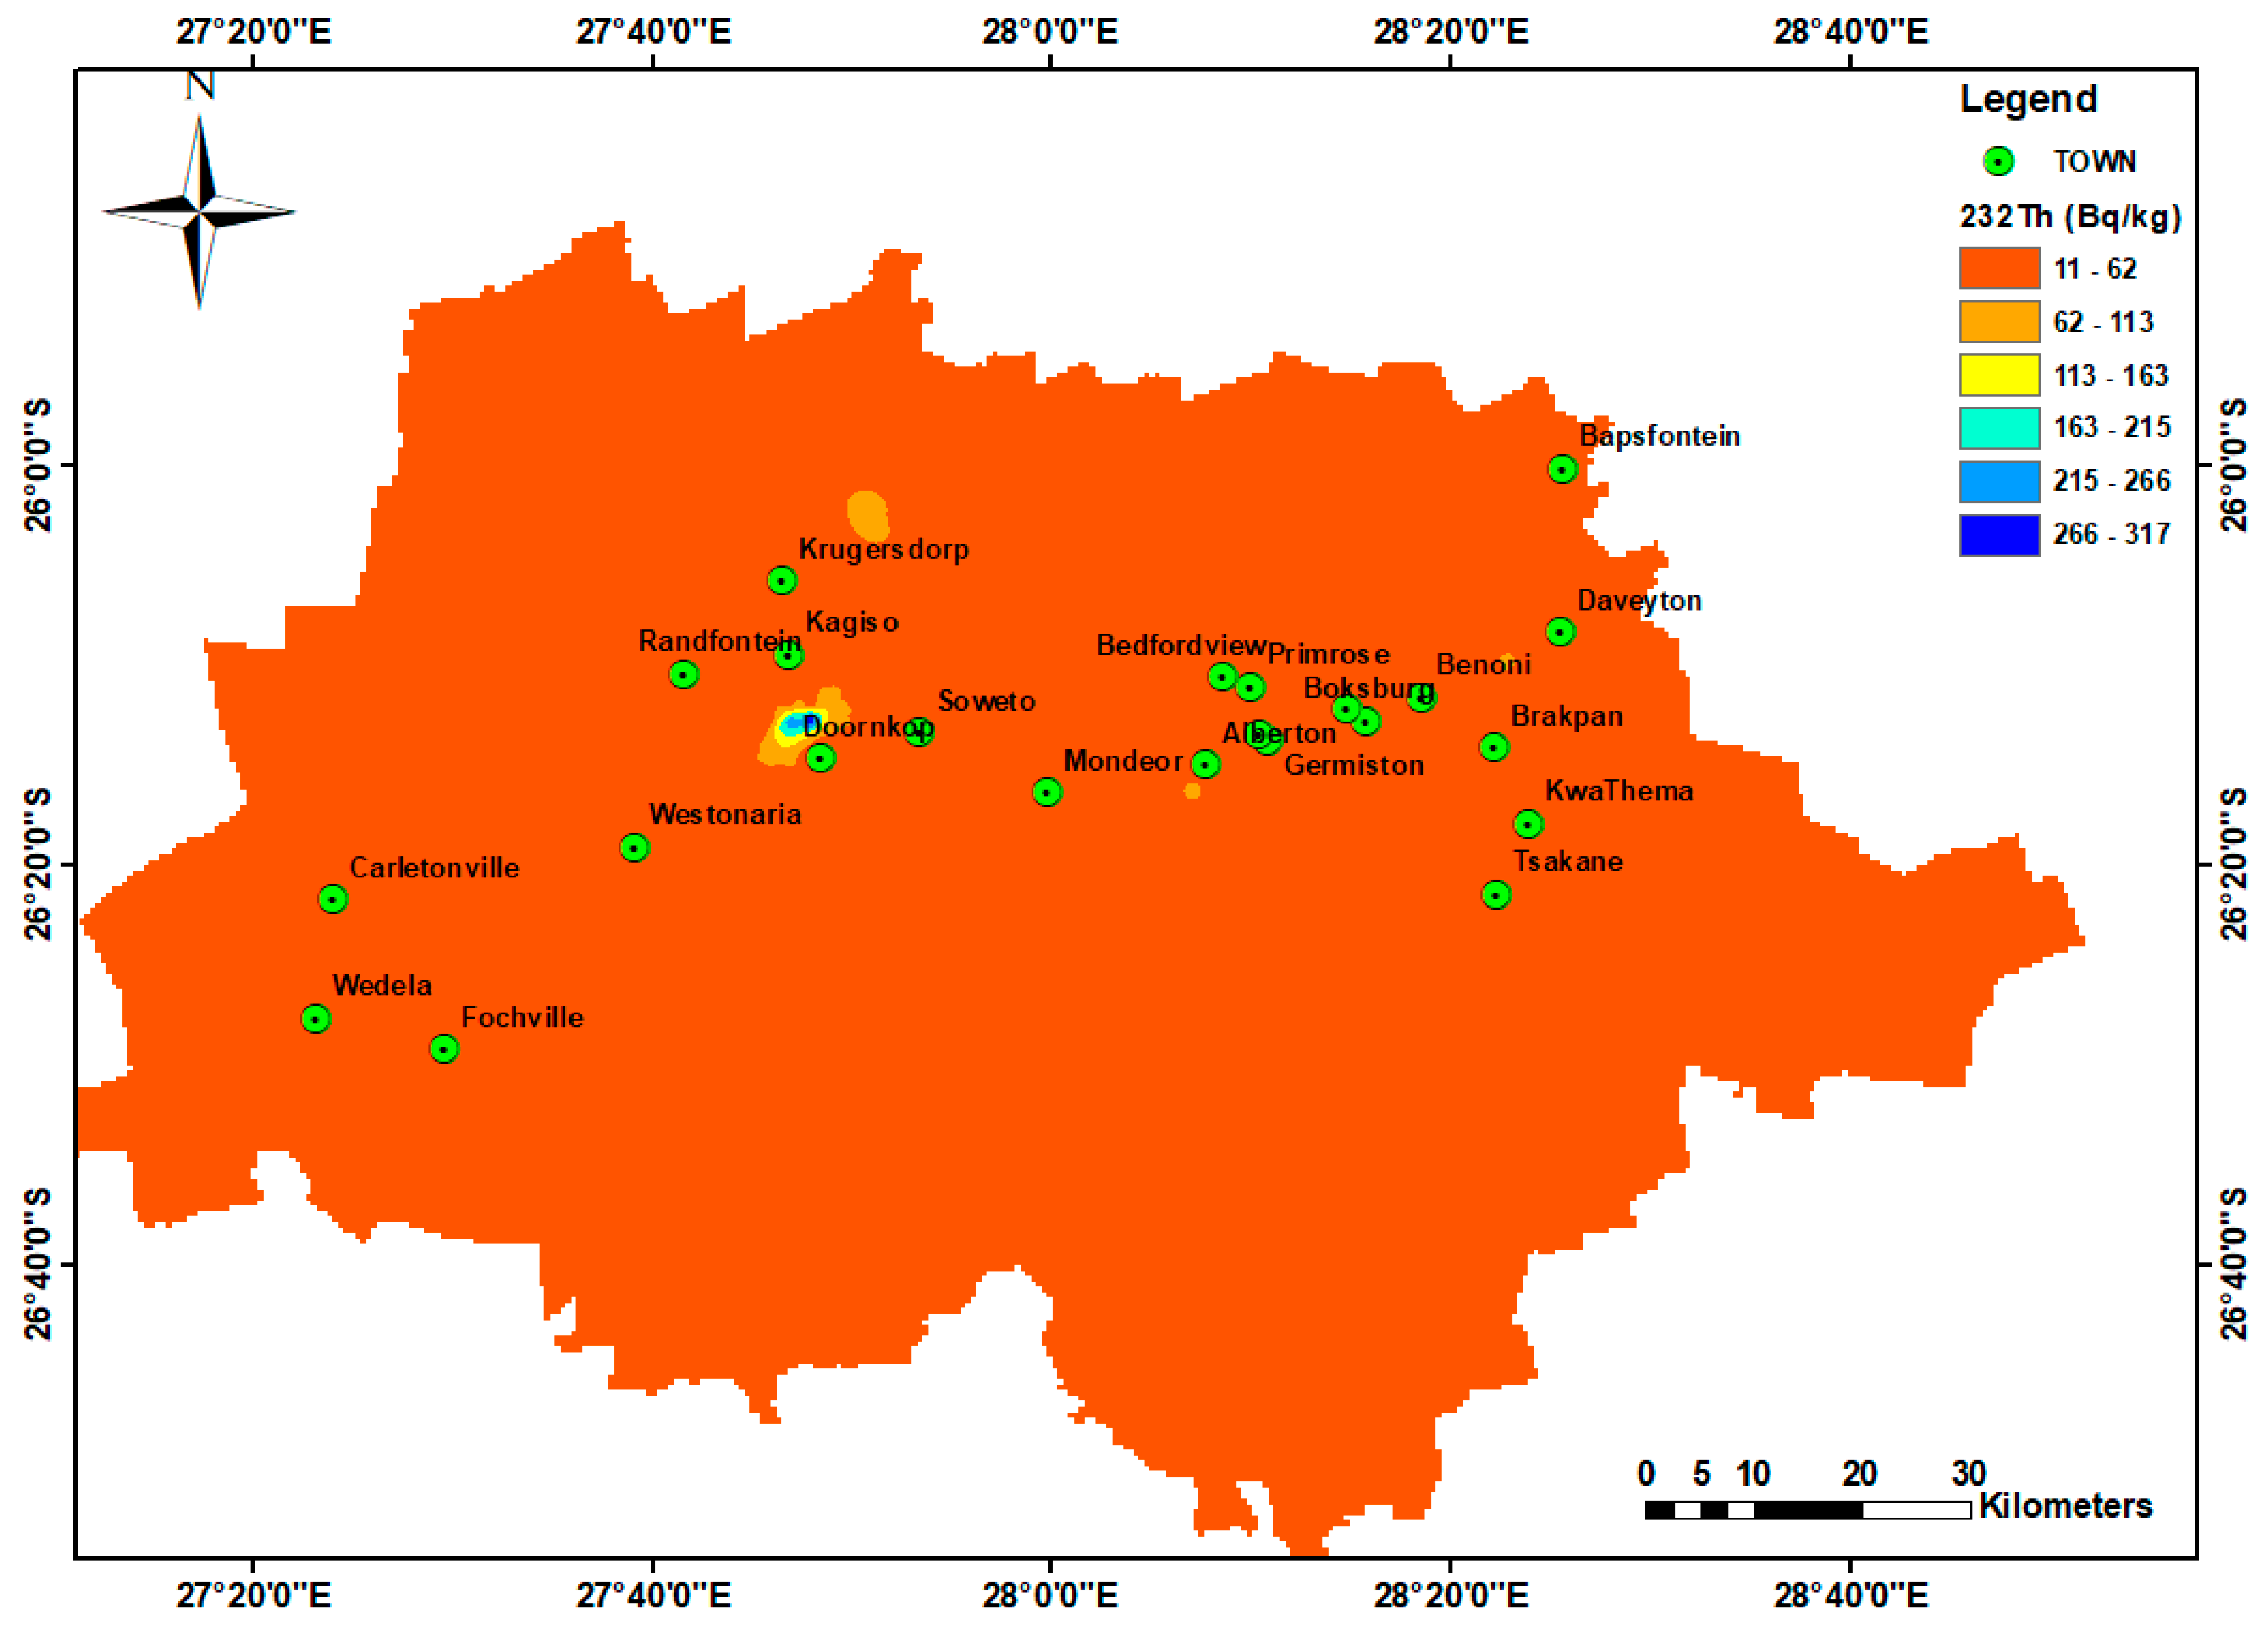
3.3. Activity Concentrations of Natural Radionuclides in Soil
3.4. Absorbed Dose Rate in Air
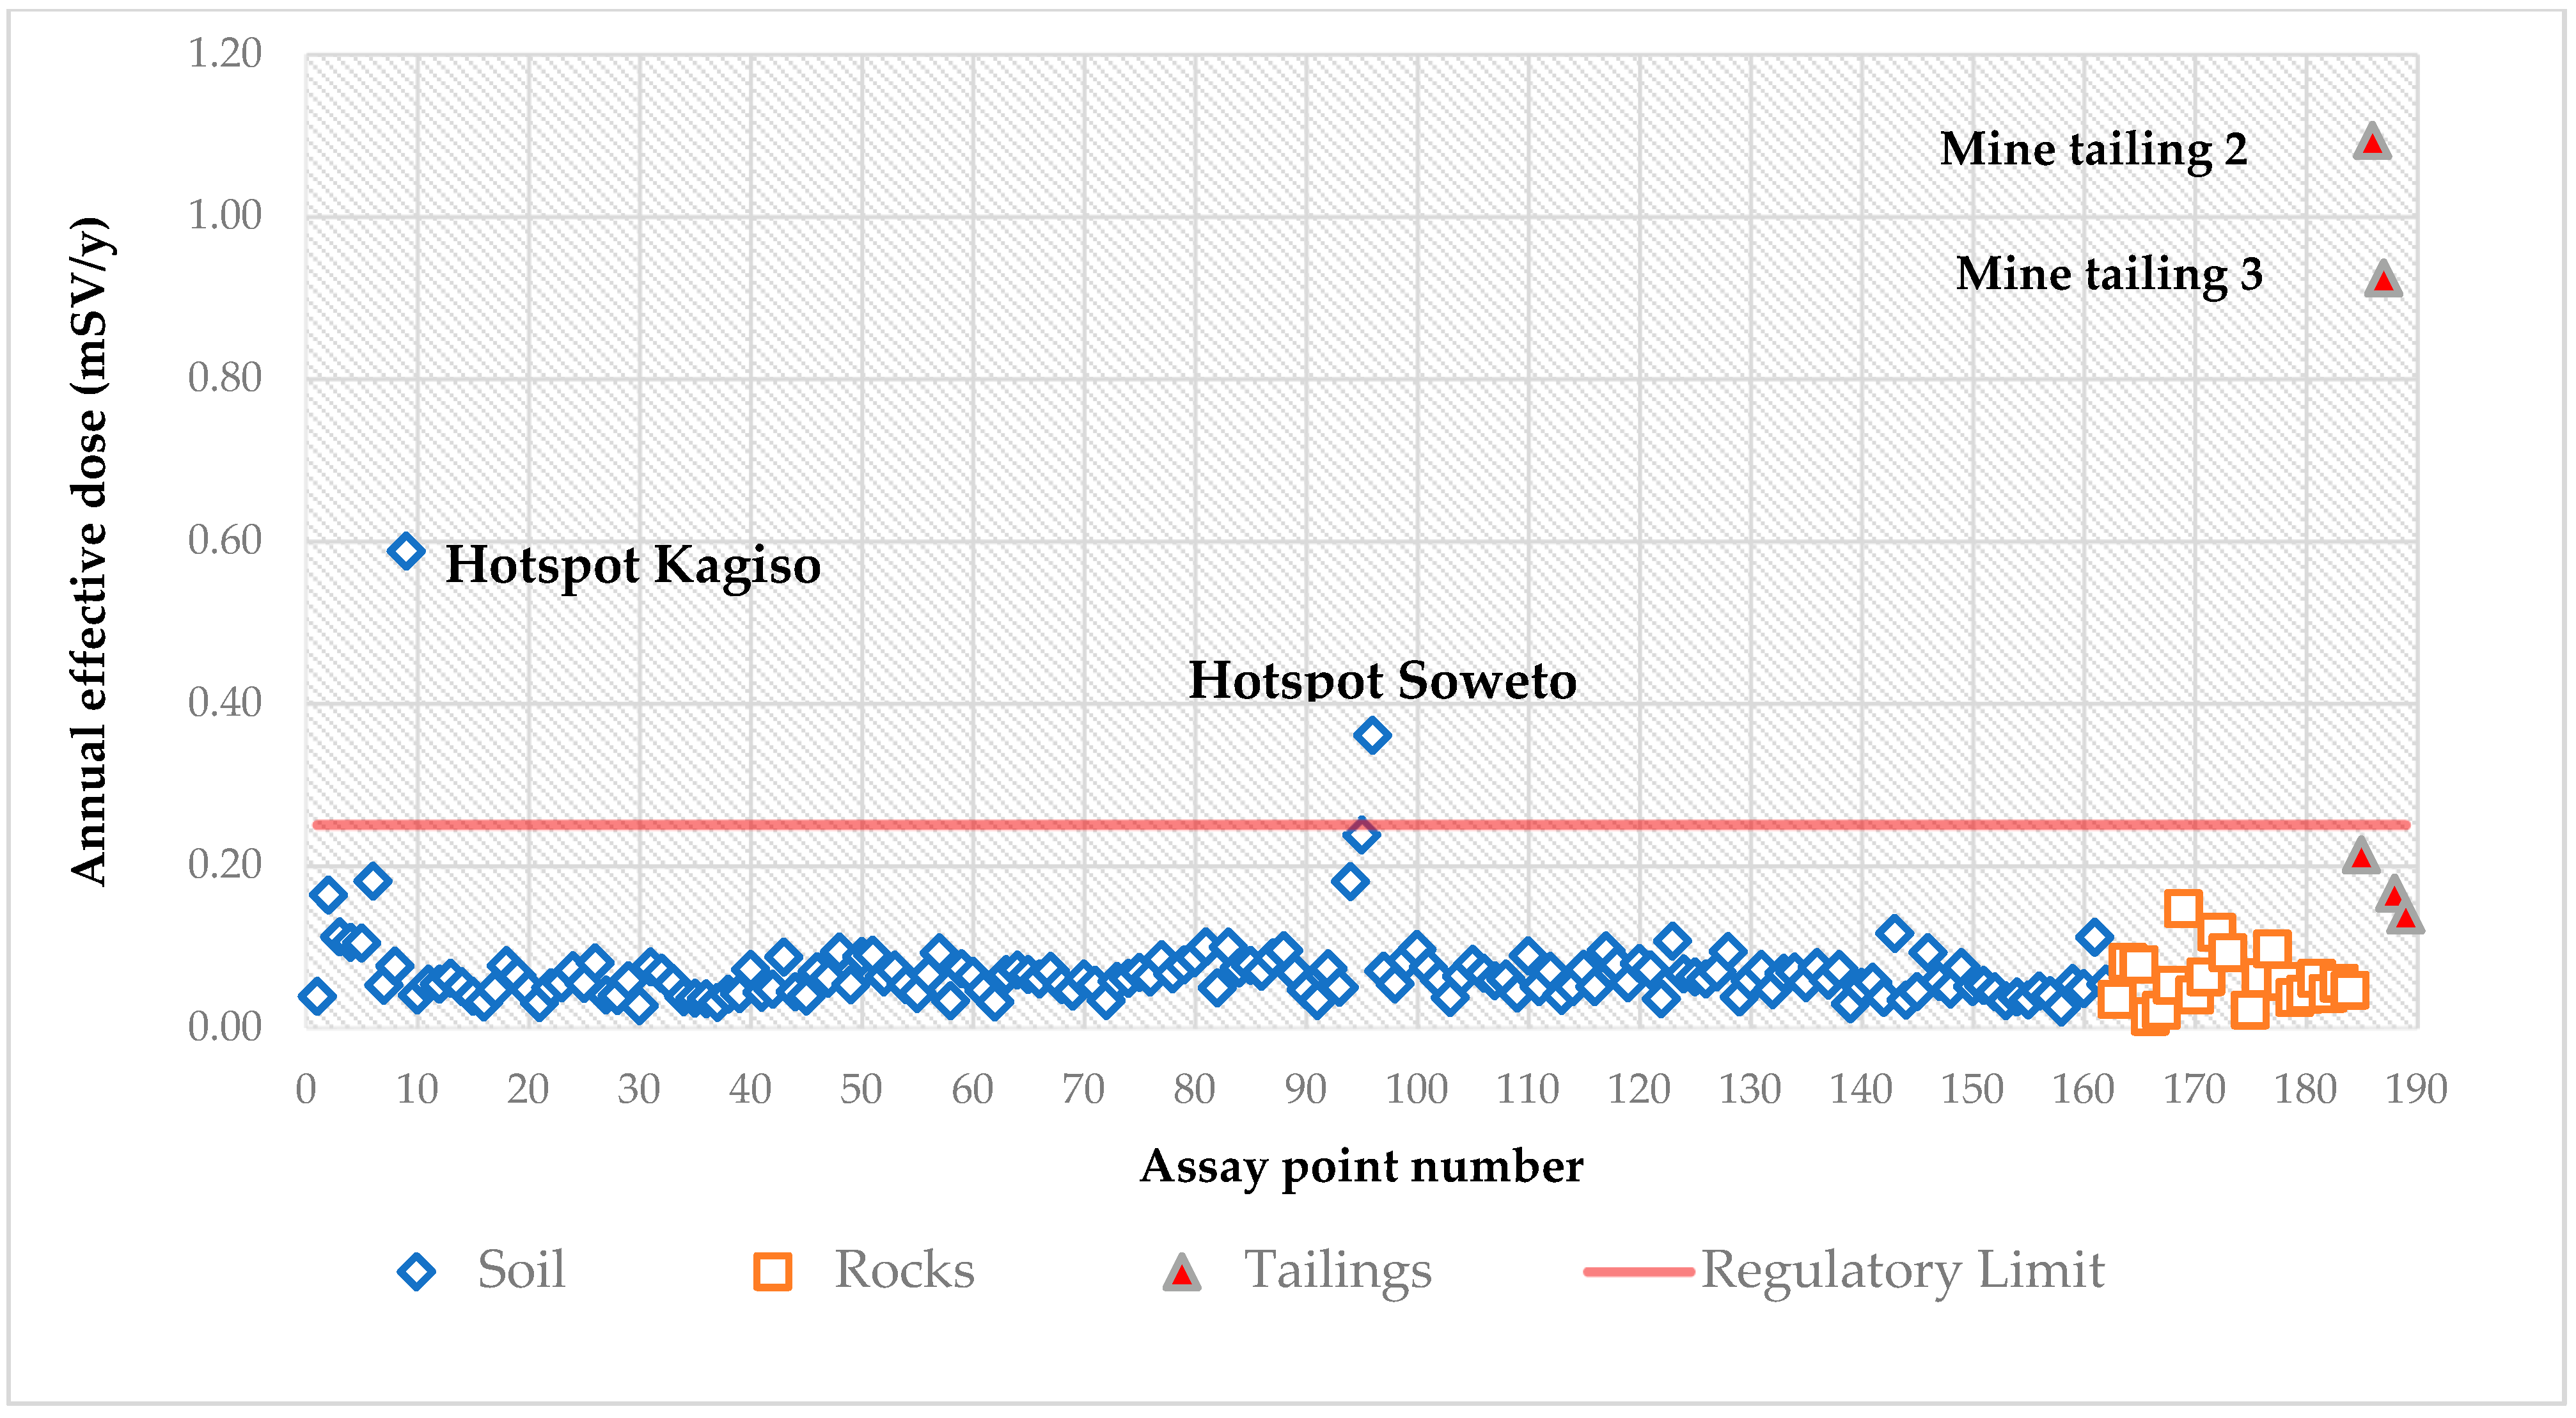
3.5. Annual Effective Dose
4. Discussion
5. Conclusions
Author Contributions
Funding
Data Availability Statement
Acknowledgments
Conflicts of Interest
References
- Ojovan, M.I.; Lee, W.E. Naturally Occurring Radionuclides. In An Introduction to Nuclear Waste Immobilisation, 2nd ed.; Elsevier Scientific Publishing Company: Amsterdam, The Netherlands, 2014; pp. 31–39. [Google Scholar]
- National Research Council. Evaluation of Guidelines for Exposures to Technologically Enhanced Naturally Occuring Radioactive Materials; National Academies Press: Washington, DC, USA, 1999. [Google Scholar]
- Bezuidenhout, J. In situ gamma ray measurements of radionuclides at a disused phosphate mine on the West Coast of South Africa. J. Environ. Radioact. 2015, 150, 1–8. [Google Scholar] [CrossRef] [PubMed]
- United Nations Scientific Committee on the Effects of Atomic Radiation. Sources and Effects of Ionizing Radiation; UNSCEAR 2000 Report to the General Assembly, with Scientific Annexes; United Nations: New York, NY, USA, 2000; Volume I. [Google Scholar]
- IAEA (International Atomic Energy Agency). Radiation Protection and Safety of Radiation Sources: International Basic Safety Standards: General Safety Requirements; IAEA: Vienna, Austria, 2011. [Google Scholar]
- Winde, F.; Sandham, L.A. Uranium pollution of South African streams–An overview of the situation in gold mining areas of the Witwatersrand. GeoJournal 2004, 61, 131–149. [Google Scholar] [CrossRef]
- Blight, G.E. Wind erosion of tailings dams and mitigation of the dust nuisance. J. South. Afr. Inst. Min. Metall. 2007, 107, 99–107. [Google Scholar]
- Winde, F.; Geipel, G.; Espina, C.; Schüz, J. Human exposure to uranium in South African gold mining areas using barber-based hair sampling. PLoS ONE 2019, 14, e0219059. [Google Scholar] [CrossRef] [PubMed]
- Kamunda, C.; Mathuthu, M.; Madhuku, M. An assessment of radiological hazards from gold mine tailings in the province of Gauteng in South Africa. Int. J. Environ. Res. Public Health 2016, 13, 138. [Google Scholar] [CrossRef] [PubMed] [Green Version]
- Njinga, R.L.; Tshivhase, V.M. Lifetime cancer risk due to gamma radioactivity in soils from Tudor Shaft mine environs, South Africa. J. Radiat. Res. Appl. Sci. 2016, 9, 310–315. [Google Scholar] [CrossRef] [Green Version]
- Abiye, T.A.; Mengistu, H.; Demlie, M.B. Groundwater resource in the crystalline rocks of the Johannesburg area, South Africa. J. Water Resour. Prot. 2011, 3, 199–212. [Google Scholar] [CrossRef] [Green Version]
- Barton, J.M., Jr.; Barton, E.S.; Kröner, A. Age and isotopic evidence for the origin of the Archaean granitoid intrusives of the Johannesburg Dome, South Africa. J. Afr. Earth Sci. 1999, 28, 693–702. [Google Scholar] [CrossRef]
- Poujol, M.; Anhaeusser, C.R. The Johannesburg Dome, South Africa: New Single Zircon U-Pb Isotopic Evidence for Early Archaean Granite-Greenstone Development within the Central Kaapvaal Craton. Precambrian Res. 2001, 108, 139–157. [Google Scholar] [CrossRef]
- Anhaeusser, C.R. Ultramafic and Mafic Intrusions of the Kaapvaal Craton. In The Geology of South Africa; Johnson, M.R., Anhaeusser, C.R., Thomas, R.J., Eds.; Council for Geosciences: Pretoria, South Africa, 2006; pp. 95–134. [Google Scholar]
- Robb, L.J.; Charlesworth, E.G.; Drennan, G.R.; Gibson, R.L.; Tongu, E.L. Tectono-metamorphic setting and paragenetic sequence of Au-U mineralisation in the Archaean Witwatersrand Basin, South Africa. Aust. J. Earth Sci. 1997, 44, 353–371. [Google Scholar] [CrossRef]
- Tucker, R.F.; Viljoen, R.P.; Viljoen, M.J. A review of the Witwatersrand Bbasin—The world’s greatest goldfield. Episodes 2016, 39, 105–133. [Google Scholar] [CrossRef]
- Robb, L.J.; Meyer, F.M. The Witwatersrand Basin, South Africa: Geological framework and mineralization processes. Ore Geol. Rev. 1995, 10, 67–94. [Google Scholar] [CrossRef]
- Eriksson, P.G.; Altermann, W.W.; Hartzer, F.J. The Transvaal Supergroup and its precursors. In The Geology of South Africa; Johnson, M.R., Anhaeusser, C.R., Thomas, R.J., Eds.; Council for Geosciences: Pretoria, South Africa, 2006; pp. 237–260. [Google Scholar]
- Eriksson, P.G.; Clendenin, C.W. A Review of the Transvaal Sequence, South Africa. J. Afr. Earth Sci. 1990, 10, 101–116. [Google Scholar] [CrossRef]
- Johnson, M.R.; Van Vuuren, C.J.; Hegenberger, W.F.; Key, R.; Show, U. Stratigraphy of the Karoo Supergroup in southern Africa: An overview. J. Afr. Earth Sci. 1996, 23, 3–15. [Google Scholar] [CrossRef]
- IAEA (International Atomic Energy Agency). Guidelines for Radioelement Mapping Using Gamma Ray Spectrometry Data; IAEA-TECDOC-1363; IAEA: Vienna, Austria, 2003. [Google Scholar]
- Radiation Solutions Inc. RS-125/230 User Manual; Radiation Solutions Inc.: Mississauga, ON, Canada, 2018. [Google Scholar]
- ICRP (International Commission on Radiological Protection). The 2007 Recommendations of the International Commission on Radiological Protection; Ann. International Commission on Radiological Protection: Ottawa, ON, Canada, 2007; p. 103. [Google Scholar]
- National Nuclear Regulator (NNR). Regulations in Terms of Section 36, Read with Section 47 of the National Nuclear Regulator Act, 1999 (ACT NO. 47 OF 1999), on Safety Standards and Regulatory Practices; Government Gazette No. 28755; National Nuclear Regulator: Centurion, South Africa, 2006; Volume R 338, pp. 1–40. [Google Scholar]
- Cole, D.I. Uranium. In The Mineral Resources of South Africa: Handbook; Wilson, M.G.C., Anhaeusser, C.R., Eds.; Council for Geoscience: Pretoria, South Africa, 1998; pp. 642–652. [Google Scholar]
- Abdelouas, A. Uranium mill tailings: Geochemistry, mineralogy, and environmental impact. Elements 2006, 2, 335–341. [Google Scholar] [CrossRef]
- Pretorius, D.A. The nature of the Witwatersrand gold-uranium deposits. In Handbook of Stratabound and Stratiform Ore Deposits; Wolf, K.H., Ed.; Elsevier Scientific Publishing Company: Amsterdam, The Netherlands, 1976; pp. 29–88. [Google Scholar]
- Huang, T.; Hao, Y.; Pang, Z.; Li, Z.; Yang, S. Radioactivity of soil, rock and water in a shale gas exploitation area, SW China. Water 2017, 9, 299. [Google Scholar] [CrossRef] [Green Version]
- Levinthal, J.D.; Richards, B.; Snow, M.S.; Watrous, M.G.; McDonald, L.W., IV. Correlating NORM with the mineralogical composition of shale at the microstructural and bulk scale. Appl. Geochem. 2017, 76, 210–217. [Google Scholar] [CrossRef]


| Source (No. of Measurements) | Statistical Parameters | Activity Concentration (Bq/kg) | Absorbed Dose | Annual Effective Dose | ||
|---|---|---|---|---|---|---|
| 238U | 232Th | 40K | ||||
| Mine tailing 1 (n = 8) | Min Max Median Average SD | 260.59 381.62 321.72 314.00 38.67 | 31.67 47.50 37.35 38.21 4.63 | 31.30 219.10 140.85 133.03 70.49 | 173.70 | 0.21 |
| Mine tailing 2 (n = 3) | Min Max Median Average SD | 1638.85 1963.65 1889.55 1830.68 170.22 | 36.13 55.62 45.88 45.88 9.74 | 344.30 626.00 344.30 438.20 162.64 | 891.76 | 1.09 |
| Mine tailing 3 (n = 3) | Min Max Median Average SD | 958.36 2578.68 1039.87 1525.64 912.87 | 33.29 108.00 54.81 65.37 38.45 | 125.20 281.70 250.40 219.10 82.81 | 753.46 | 0.92 |
| Mine tailing 4 (n = 2) | Min Max Median Average SD | 224.77 293.93 259.35 259.35 48.90 | 19.49 25.58 22.53 22.53 4.31 | 31.30 62.60 46.95 46.95 22.13 | 135.39 | 0.17 |
| Mine tailing 5 (n = 1) | Average | 209.95 | 20.30 | 93.90 | 113.17 | 0.14 |
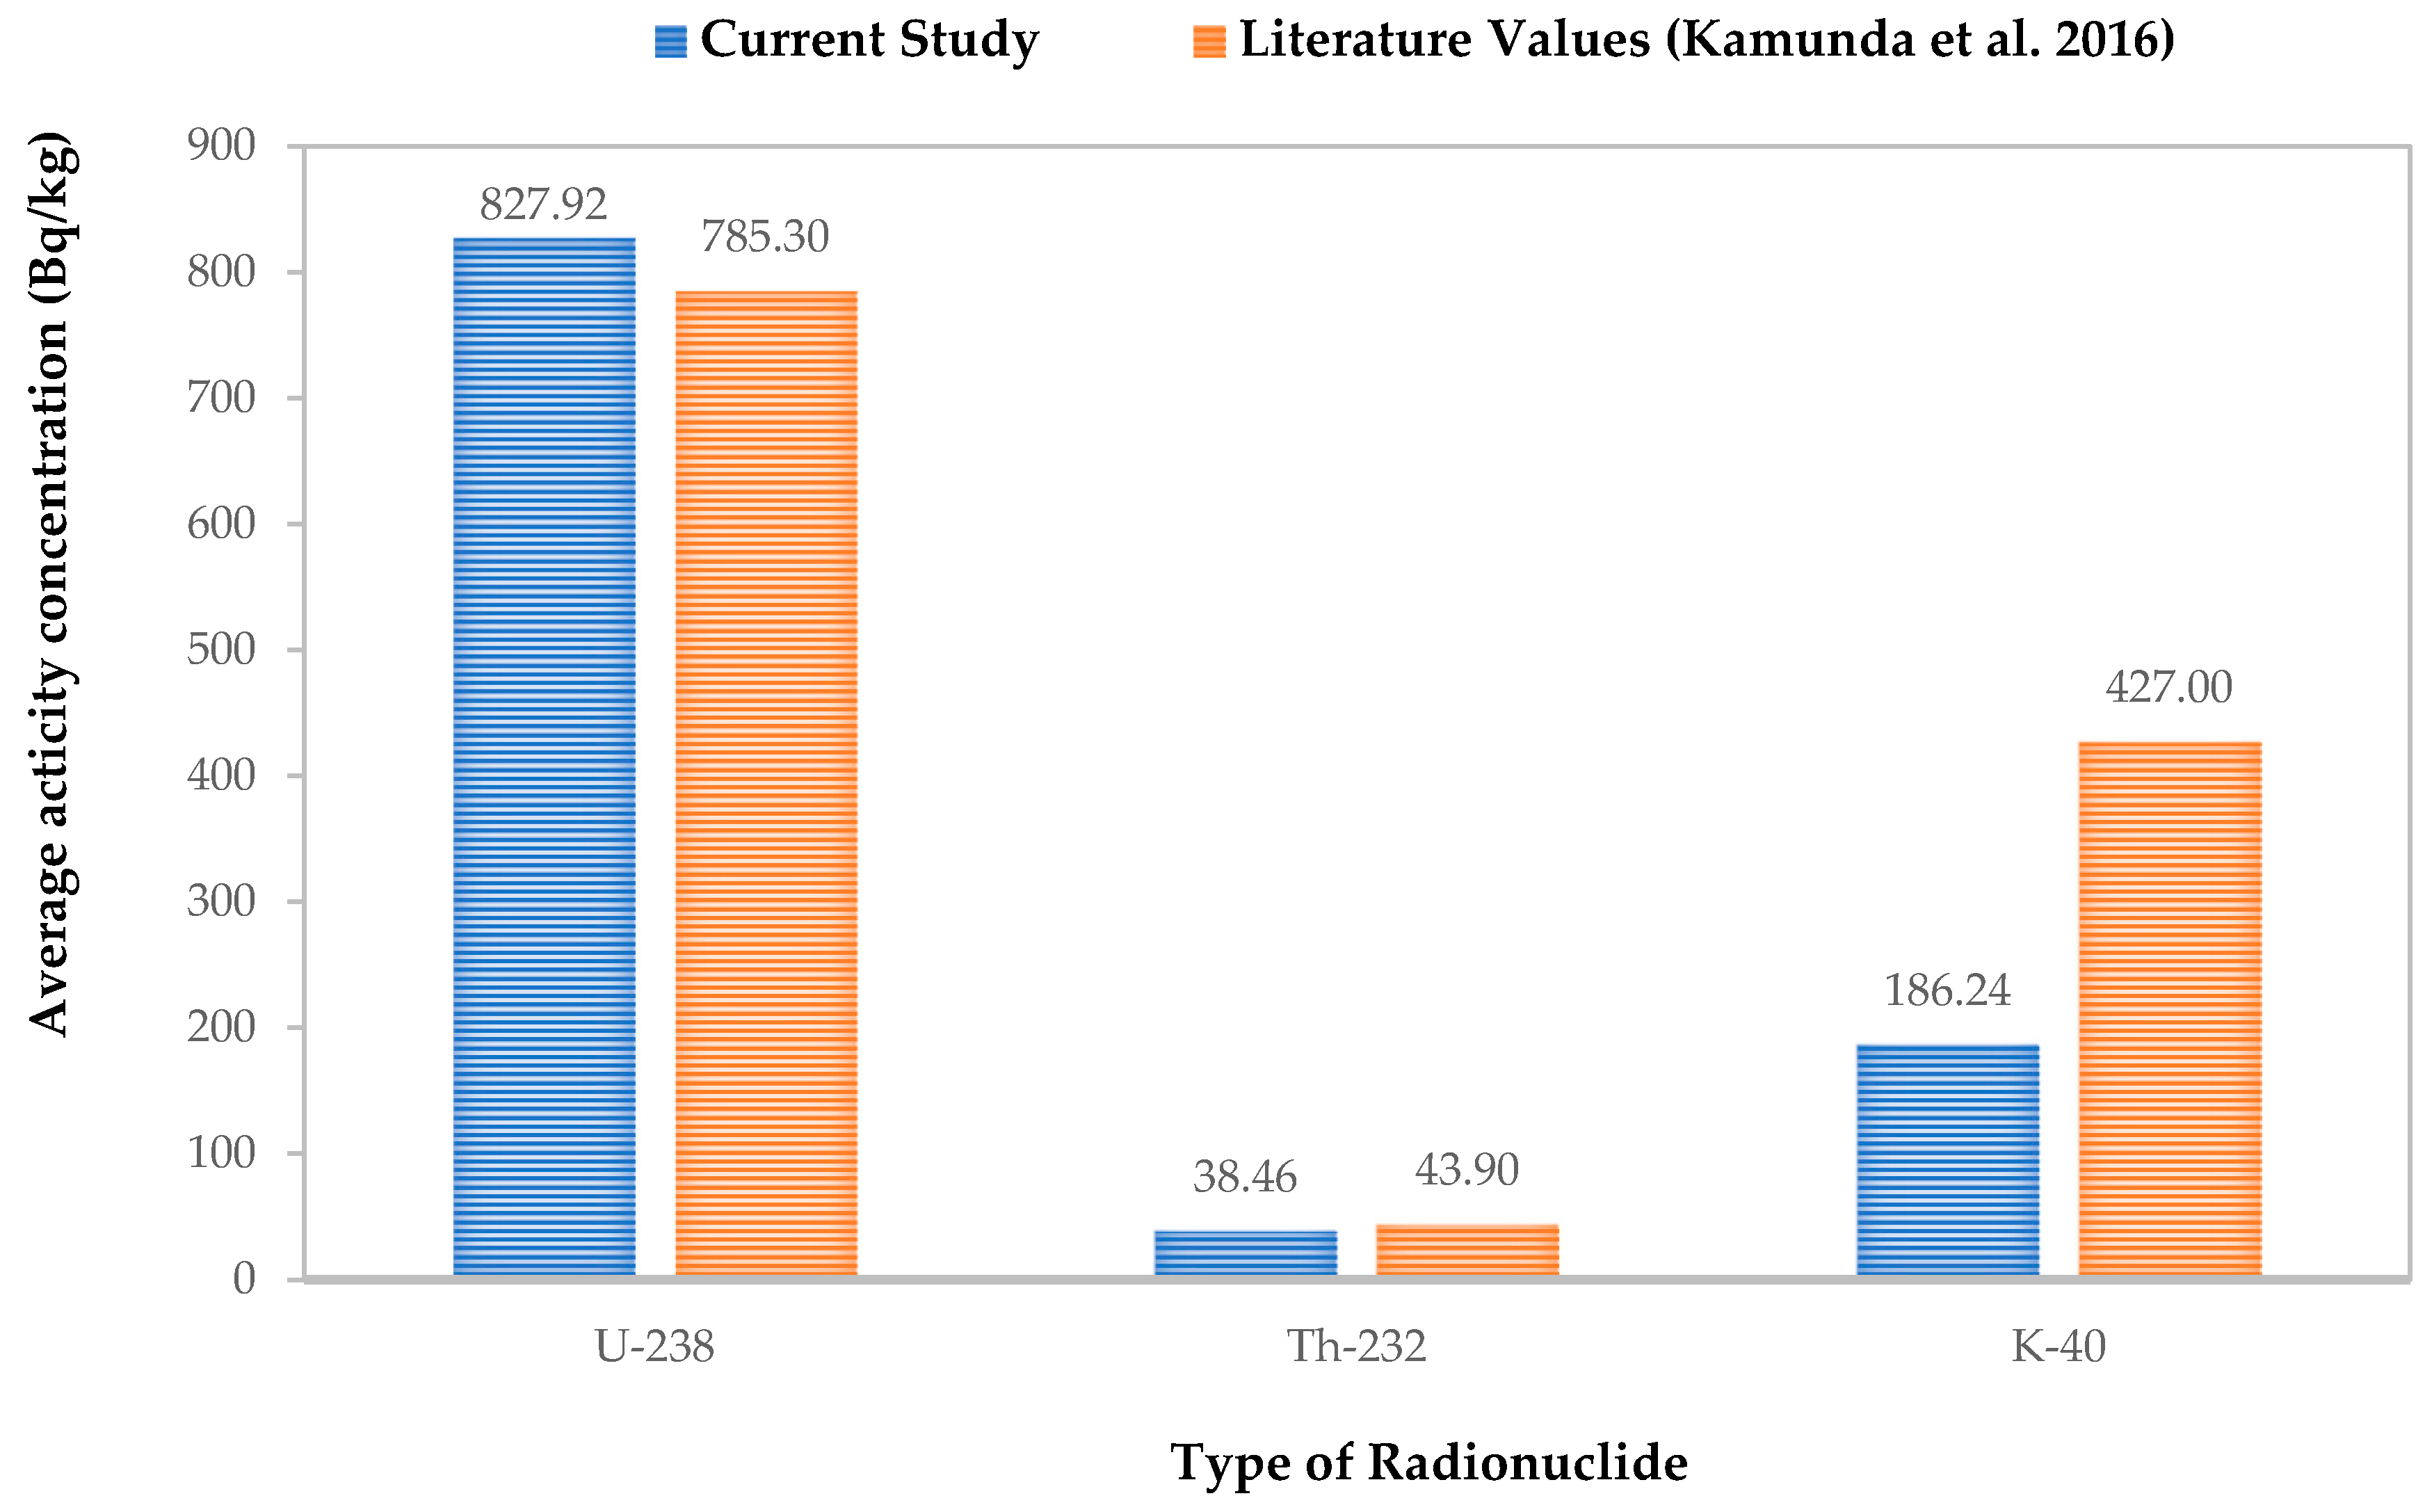
| Average for all tailings | Min Max Average | 209.95 2578.68 827.92 | 19.49 108.00 38.46 | 31.30 626.00 186.24 | 113.17 891.76 413.50 | 0.14 1.09 0.51 |
| Wonderfonteinspruit Catchment Area Mine tailings [9] | Min Max Average | 87.2 2668.9 785.3 | 20.5 89.7 43.9 | 226.5 781.0 427.0 | ||
| Rock Type | Radionuclides | Statistical Parameters | |||||
|---|---|---|---|---|---|---|---|
| No. of Samples | Minimum | Maximum | Mean | Median | SD | ||
| Quartzite | 238U 232Th 40K | 11 | 11.12 8.12 31.30 | 51.87 44.66 970.30 | 25.94 19.82 327.23 | 27.17 17.86 281.70 | 11.35 10.10 281.83 |
| Shale | 238U 232Th 40K | 4 | 14.82 15.43 31.30 | 71.63 78.76 939.00 | 42.61 47.60 618.18 | 41.99 48.11 751.20 | 23.23 32.33 401.95 |
| Metasandstone | 238U 232Th 40K | 5 | 17.29 10.56 469.50 | 49.40 54.40 719.90 | 32.60 25.33 626.00 | 30.88 15.83 657.30 | 13.15 18.05 93.90 |
| All Rock Types | 238U 232Th 40K | 20 | 11.12 8.12 31.30 | 71.63 78.76 970.30 | 30.94 26.76 460.11 | 27.79 19.29 453.85 | 15.27 19.29 303.14 |
| Region | Area | No. of Measurements | 238U (Bq/kg) | 232Th (Bq/kg) | 40K (Bq/kg) | |||
|---|---|---|---|---|---|---|---|---|
| Mean | Range | Mean | Range | Mean | Range | |||
| West Rand | Muldersdrift | 6 | 45.88 | 12.35–77.70 | 52.85 | 30.04–83.23 | 1027.68 | 187.80–1471.10 |
| Krugersdorp | 20 | 88.12 | 19.76–941.07 | 31.79 | 12.59–64.55 | 150.24 | 62.60–344.30 | |
| Randfontein | 15 | 36.80 | 16.06–100.04 | 28.91 | 15.83–51.97 | 91.81 | 31.30–187.80 | |
| Westonaria | 10 | 44.21 | 23.47–72.87 | 45.07 | 25.98–61.31 | 175.28 | 62.60–594.70 | |
| Fochville | 4 | 29.02 | 17.29–44.46 | 45.37 | 37.76–60.09 | 305.18 | 219.10–438.20 | |
| Wedela | 2 | 35.20 | 32.11–38.29 | 40.80 | 35.73–45.88 | 234.75 | 187.80–281.70 | |
| Carletonville | 11 | 35.59 | 12.35–61.75 | 39.23 | 24.36–62.52 | 167.88 | 62.60–313.00 | |
| All measurements | 68 | 53.09 | 12.35–941.07 | 37.26 | 12.59–83.23 | 232.91 | 31.30–1471.10 | |
| Soweto | All measurements | 30 | 47.79 | 14.82–191.43 | 64.34 | 18.27–333.73 | 220.14 | 62.60–594.70 |
| East Rand | Benoni | 7 | 44.28 | 18.53–64.22 | 10.71 | 6.5–15.8 | 187.80 | 62.60–313.00 |
| Kwathema | 7 | 39.70 | 22.23–60.52 | 42.80 | 32.07–58.46 | 187.80 | 93.90–344.30 | |
| Brakpan | 10 | 52.22 | 39.52–67.93 | 41.06 | 28.83–60.90 | 228.04 | 125.20–406.90 | |
| Daveyton | 6 | 42.61 | 23.47–60.52 | 43.85 | 23.55–81.20 | 203.45 | 93.90–250.40 | |
| Germiston | 9 | 39.52 | 13.59–144.5 | 30.13 | 14.62–54.00 | 222.23 | 125.20–438.20 | |
| Boksburg | 6 | 58.46 | 22.23–100.04 | 31.19 | 23.95–40.60 | 198.23 | 125.20–313.00 | |
| Bapsfontein | 5 | 35.07 | 25.94–50.64 | 37.51 | 22.74–54.00 | 306.74 | 93.90–469.50 | |
| Mondeor | 5 | 21.00 | 9.88–25.94 | 20.57 | 10.56–30.45 | 245.18 | 125.20–438.20 | |
| Bedfordview | 5 | 25.44 | 18.53–35.82 | 25.82 | 22.33–31.67 | 344.30 | 125.2–594.70 | |
| Alberton | 5 | 40.76 | 23.47–75.34 | 40.46 | 21.92–67.40 | 333.87 | 156.50–469.50 | |
| All measurements | 65 | 40.52 | 9.88–144.50 | 35.48 | 10.56–81.20 | 229.86 | 62.60–594.70 | |
| UNSCEAR (2000) | 35 | 30 | 400 | |||||
| Region | Parameters | Statistical Parameters | Type of Material (Number of Samples) | ||
|---|---|---|---|---|---|
| Mine Tailings (n = 5) | Soil (n = 68) | Rocks (n = 12) | |||
| West Rand | Calculated Absorbed Dose (nGy/h) Calculated Effective Dose (mSv/y) | Range Mean Range Mean | 113.17–891.76 413.50 0.14–1.09 0.51 | 22.44–478.99 56.73 0.03–0.59 0.07 | 11.35–119.82 51.92 –0.15 0.06 |
| Soweto | Soil (n = 30) | ||||
| Calculated Absorbed Dose (nGy/h) Calculated Effective Dose (mSv/y) | Range Mean Range Mean | 27.50–293.93 70.12 0.03–0.36 0.09 | |||
| East Rand | Soil (n = 64) | Rocks (n = 9) | |||
| Calculated Absorbed Dose (nGy/h) Calculated Effective Dose (mSv/y) | Range Mean Range Mean | 20.73–95.09 49.09 0.03–0.12 0.06 | 30.28–79.38 45.30 0.04–0.10 0.06 | ||
Publisher’s Note: MDPI stays neutral with regard to jurisdictional claims in published maps and institutional affiliations. |
© 2022 by the authors. Licensee MDPI, Basel, Switzerland. This article is an open access article distributed under the terms and conditions of the Creative Commons Attribution (CC BY) license (https://creativecommons.org/licenses/by/4.0/).
Share and Cite
Moshupya, P.M.; Mohuba, S.C.; Abiye, T.A.; Korir, I.; Nhleko, S.; Mkhosi, M. In Situ Determination of Radioactivity Levels and Radiological Doses in and around the Gold Mine Tailing Dams, Gauteng Province, South Africa. Minerals 2022, 12, 1295. https://0-doi-org.brum.beds.ac.uk/10.3390/min12101295
Moshupya PM, Mohuba SC, Abiye TA, Korir I, Nhleko S, Mkhosi M. In Situ Determination of Radioactivity Levels and Radiological Doses in and around the Gold Mine Tailing Dams, Gauteng Province, South Africa. Minerals. 2022; 12(10):1295. https://0-doi-org.brum.beds.ac.uk/10.3390/min12101295
Chicago/Turabian StyleMoshupya, Paballo M., Seeke C. Mohuba, Tamiru A. Abiye, Ian Korir, Sifiso Nhleko, and Margaret Mkhosi. 2022. "In Situ Determination of Radioactivity Levels and Radiological Doses in and around the Gold Mine Tailing Dams, Gauteng Province, South Africa" Minerals 12, no. 10: 1295. https://0-doi-org.brum.beds.ac.uk/10.3390/min12101295