Article

Assessment of Potentially Toxic Element Contamination in the Philippi Peatland, Eastern Macedonia, Greece

by
Ioannis Zafeiriou
1,
Dionisios Gasparatos
1,
Ifigeneia Megremi
2,*,
Dafni Ioannou
1,
Ioannis Massas
1,* and
Maria Economou-Eliopoulos
2
1
Laboratory of Soil Science and Agricultural Chemistry, Agricultural University of Athens, GR-11855 Athens, Greece
2
Department of Geology and Geoenvironment, National and Kapodistrian University of Athens, GR-15784 Athens, Greece
*
Authors to whom correspondence should be addressed.
Submission received: 21 October 2022 / Revised: 18 November 2022 / Accepted: 19 November 2022 / Published: 21 November 2022
(This article belongs to the Special Issue Bio-Geochemistry of Heavy Metals/Metalloids)

Abstract

:
The Philippi peatland is considered the biggest peat deposit in the Balkan Peninsula and one of the deepest in the world. The purpose of this study was to access the impact of eight potentially toxic elements (PTEs), i.e., As, Se, Pb, Cr, Ni, Zn, Mn and Cu, on the local environment. PTE content was determined in corn grains and surface soil samples collected from 16 sites in the peatland, and pollution indices were calculated to evaluate the environmental risks. Soil organic matter ranged between 93 and 557 g kg−1 soil, whereas the soil pH was >7, classifying the soils as neutral to slightly alkaline. Mean PTE contents in soil samples were 24.6 mg kg−1 soil for As, 1.68 mg kg−1 soil for Se, 113 mg kg−1 soil for Pb, 32 mg kg−1 soil for Cr, 36.3 mg kg−1 soil for Ni, 141.4 mg kg−1 soil for Zn, 35.5 mg kg−1 soil for Cu and 845 mg kg−1 soil for Mn. In corn grain samples, 0.06 mg kg−1 grain for As, 0.14 mg kg−1 grain for Se, 1.34 mg kg−1 grain for Cr, 0.69 mg kg−1 grain for Ni, 27 for Zn, 8.4 mg kg−1 grain for Cu and 3.2 mg kg−1 grain for Mn were recorded. No Pb was detected in the corn grains. The bioaccumulation factor (BF) was high for Cu, Zn and Se, indicating increased mobility of these elements in the soils and preferential plant uptake. For most soil samples, the geoaccumulation index (Igeo) and single pollution index (PI) showed low to moderate contamination. However, Igeo and PI values of Se in many sampling sites and of Pb and Zn in few were substantially increased, pointing to heavily contaminated soils. According to potential ecological risk (RI), the PTE content in the peat soils of Philippi imposes low to moderate risk on the environment.

1. Introduction

One of the most severe threats to natural and environmental resources around the world is the contamination of soils with potentially toxic elements (PTEs) [1,2]. As a more acceptable phrase to include all metals, metalloids, non-metals and other inorganic elements in the soil–plant–animal system with the potential for toxicity depending on their content, the term “PTEs” is now used instead of the often-used term “heavy metals” [1,3]. Although the source of PTEs in soils can be either lithogenic (occurring naturally in the soil environment as a result of parent material weathering) or anthropogenic, high PTE contents are typically linked to human activities [2]. The primary sources of PTE inputs into soils regarding anthropogenic activities are atmospheric deposition (coal and gasoline combustion, smelting, metal mining, industrial activities, and tire wear dust), the land application of organic wastes (sewage sludge, livestock manure), the use of agrochemicals (fungicides, fertilizers) and the careless land disposal of industrial waste [4,5]. Understanding the origin, content and chemical forms of PTEs in soils is a key prerequisite for their rational management, either in cases of planning phytoremediation strategies or shifting to the exploitation of contaminated zones with the cultivation of non-edible plant species [4,5,6]. This has led the scientific community to conduct numerous studies on the presence of PTEs in different soil types and the application of various indices to understand their impact on the environment and human health [4,7]. However, there is a paucity of studies in the literature dealing with the presence and geochemical behavior of PTEs in agricultural peatland soils.
Peatlands serve crucial hydrological, ecological, and biogeochemical functions as transitional habitats between terrestrial and aquatic ecosystems [8,9,10]. Peatlands store between 10% and 30% of all freshwater and land-based organic carbon worldwide [11], despite only making up around 3% of the world’s continents [11]. Understanding and predicting how peatland soil processes will react to anthropogenic pressures such as resource extraction, changing land use and global climate change are becoming more and more important [11,12].
Currently, two major lignite-mining districts are in operation: Ptolemais–Amynteon (N. Greece) and Megalopolis (S. Greece) [13,14]. The mineralogical and geochemical data on fly and bottom ash from lignite combustion have shown that many trace elements, including Se, Cr, Cu, Pb, Zn, Cd, Mo, Ag, As, Au, Te, U and W, are associated with minerals in the peat and the organic matter [15,16]. Previous research has found high levels of various PTEs, including arsenic and selenium, in the surrounding area of Kavala’s Philippi peatland, where the current study was conducted [15,17]. The Philippi peat basin is part of a tectonic graben which formed due to Miocene tectonic activity. It has been suggested that the peat accumulated in a sub-basin around 700,000 years ago. The Philippi peatland is considered to be among the thickest known peatland in the world and the largest fossil fuel deposit in the Balkan Peninsula, and since 1931, the mainland has been used for agricultural activities [15]. According to these authors, a salient feature of the Philippi peat is the elevated content of Cr, Cu, Mo, Pb, Sc, Sn, T, V, Y and Zn in comparison with typical fen peats, as well as in Se, As, Cr, Mo and U in comparison with typical coals [18].
Nickel (Ni) is the 24th most abundant element in Earth’s crust and recently has been recognized as an essential microelement to plants [19]. Elevated concentrations of Ni have a negative effect on physiological functions such as photosynthesis and respiration, decreasing plant growth [20]. Chromium (Cr) may be present in several oxidation states, from −2 to +6. The most toxic form of Cr for living organisms is the Cr(VI) form due to its high solubility and mobility and strong oxidation ability [19,20].
Lead (Pb) is a widespread pollutant on a global scale with a long residence time [21]. It is not sensitive to soil redox reactions, and its geochemistry is dominated by the divalent cation Pb2+. Lead is a priority pollutant with emerging concerns due to adverse health effects caused by different exposure pathways such as Pb-contaminated soils [21,22].
Arsenic (As) is a hazardous metalloid that possesses both metallic and nonmetallic characteristics that may be found in the following oxidation states: elemental arsenic (0), arsine (-III), arsenite (III) and arsenate (V) [3,23]. It is typically ranked as the 12th most abundant element in the human body, the 20th most abundant element on the surface of the earth and the 14th most abundant element in seawater [3,23]. A tentative maximum daily consumption of inorganic arsenic has been set by the World Health Organization at 2 μg As/kg body weight [3,23].
Selenium (Se), at low concentrations, is an essential element for the healthy growth and development of living organisms because of its crucial participation in several metabolic processes [24,25]. It regulates a variety of bodily functions in both humans and animals, such as antioxidant activity, thyroid gland health and the prevention of carcinogenesis [24,25]. However, both Se excess and deficiency, due to the consumption of Se-rich or Se-deficient food, can cause various health risks [26]. Generally, in Europe, including Greece and other countries in the Balkan Peninsula, soils are deficient in Se [27,28]. In the Philippi peat depositions, E. Macedonia, Greece, high contents of PTEs were found, and the Se content is much higher than the high-baseline value for soils in Greece [15].
Although copper (Cu), zinc (Zn) and manganese (Mn) are essential micronutrients for plants, high concentrations in soil can be toxic to most plant species and consequently may have detrimental effects, including reducing crop yield and affecting soil microbial biomass [29,30].
Considering that available data regarding the pollution status in peat soils are limited and that much of the peat basin of Philippi is agricultural land, the aims of the present study were to (a) determine the physicochemical properties of the soils and Ni, Cr, Pb, As, Se, Cu, Zn and Mn total content in topsoil samples; (b) record the same PTEs in corn grains collected from plants grown on these peat soils in order to calculate the bioconcentration factor and discuss possible toxicity hazards; and (c) apply pollution indices to assess soil enrichment in the studied PTEs and evaluate environmental risk.

2. Materials and Methods
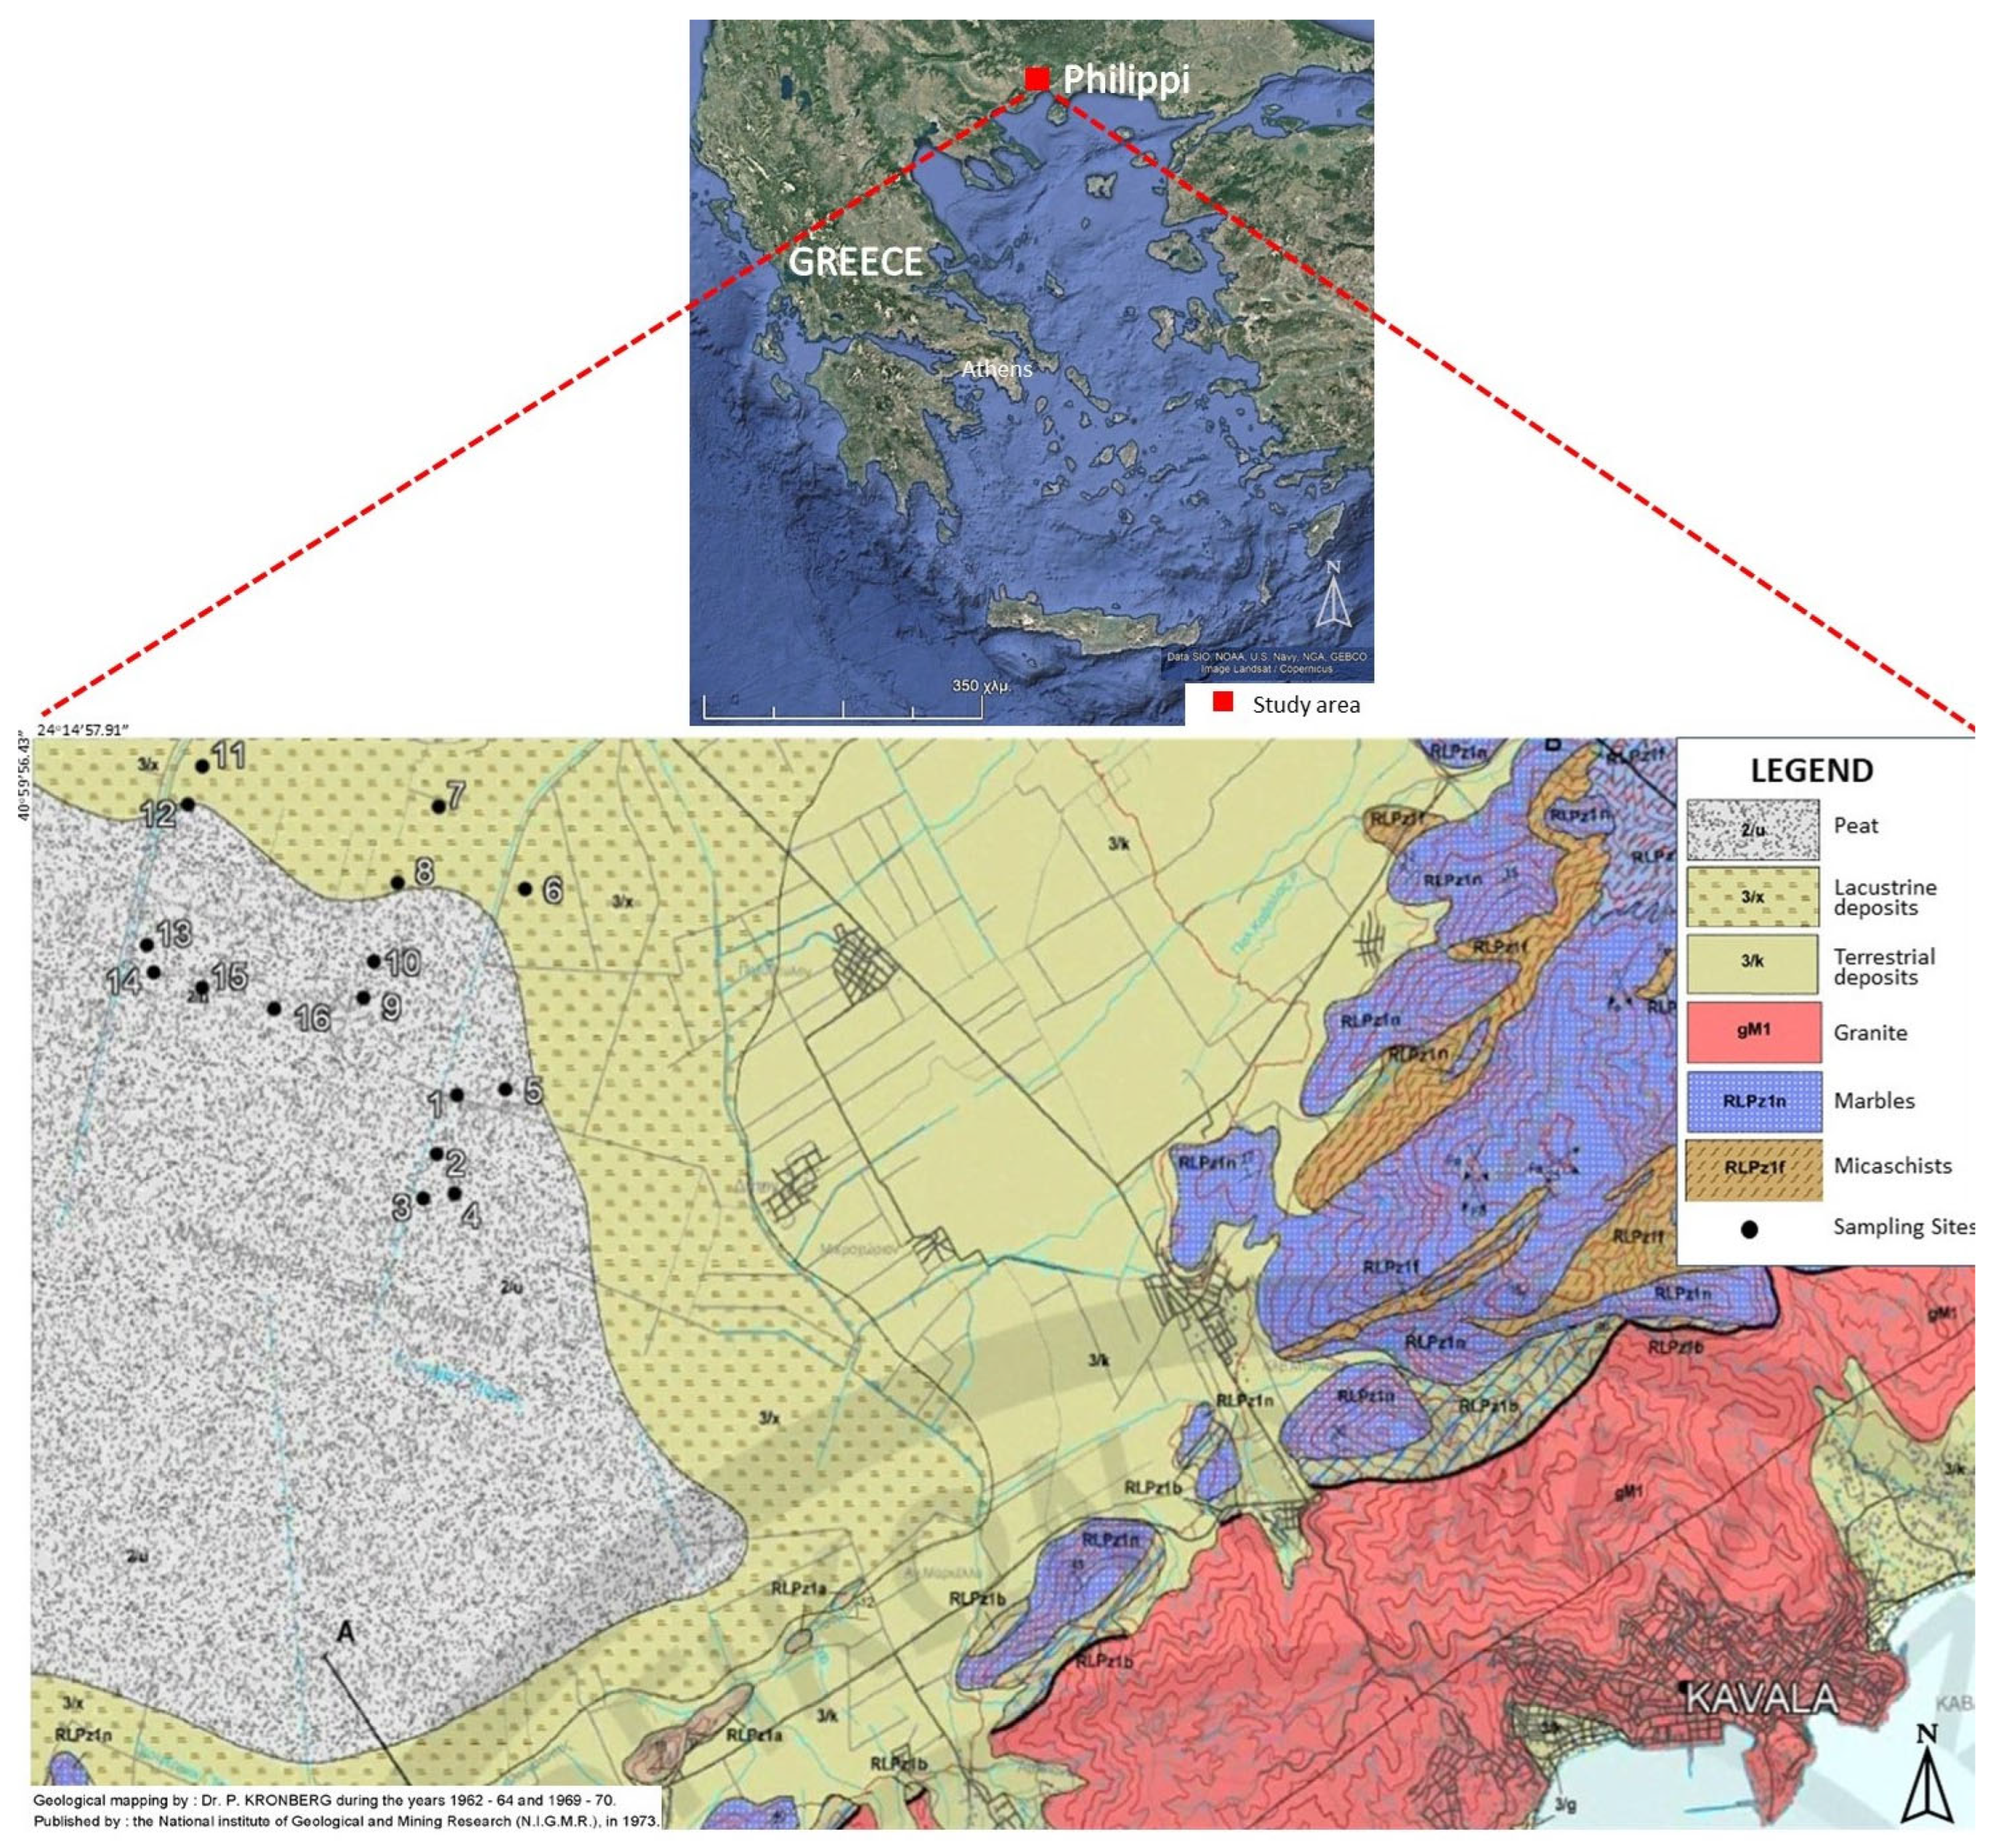
2.1. Study Area

The research was carried out within the agricultural region of the Philippi peatland basin (41°10′ N, 24°20′ E; 40 m above sea level) located in the interior plain of Drama, Eastern Macedonia, Greece (Figure 1). The main part of this area is covered with peat deposits alternating with other limnic and limnotelmatic sediments that reach a thickness of nearly 190 m [31]. The Philippi peatland is among the thickest known peat-dominated succession in the world with an estimated dry weight of nearly 1 Gt. Peatland management started at the beginning of 20th century, and artificial drainage and land reclamation projects were constructed in the 1930s to facilitate the agricultural use of the peatland [15]. This project affected the hydrological conditions in the site, leading to subsidence of more than 7m in the central part of the peatland [31].
The mean annual air temperature and mean annual precipitation in this region are 14.4 °C and 459 mm, respectively. According to the US Soil Taxonomy classification [32], the study soils belonged to the soil orders of Histosols (sites 1, 2, 3, 4, 5, 9, 10, 13, 14, 15, 16) and Entisols (sites 6, 7, 8, 11, 12).

2.2. Collection of Soil Samples and Corn Grains

The collection of soil samples for laboratory analyses took place on October 2021 from the surface horizons (0–20 cm) consisting of well-developed mursh material as a result of a drained histic horizon [33] (Figure 1). At every sampling site, using a soil auger, three subsamples from 100 × 100 cm surface area were obtained and mixed to make a composite soil sample. The soil samples were transferred to the laboratory in polyethylene bags. The main crops are maize (Zea mays L.), sugar beets (Beta vulgaris L.), tomatoes (Lycopersicon esculentum Mill.) and wheat (Triticum turgidum L.) covering about 7000 ha of the area. Corn grain samples were collected from the same soil sampling sites in the respective agricultural zones after harvest.

2.3. Soil and Corn Grain Analysis

The soil samples were air-dried, crushed, sieved through a 2 mm mesh and analyzed for the following parameters: equivalent calcium carbonate percentage was estimated using a digital calcimeter [34]; pH was measured in a suspension with a 1:1 ratio of soil to distilled water with a pH meter; electrical conductivity (EC) was determined in the soil paste extract [35], soil organic matter (SOM) was determined by the loss on ignition method (LOI) [36]; exchangeable cations K+, Na+, Ca2+, and Mg2+ were extracted using CH3COONH4 1M, pH = 7 [35]; available P was determined using the 0.5 N NaHCO3 extraction method [37]; the total contents of the potentially toxic elements extracted with aqua regia were determined in an atomic absorption spectrophotometer (Varian—spectra A300 system), except for the Se and As contents, which were determined by inductively coupled plasma mass spectroscopy (ICP–MS; Thermo iCAPQc, Thermofisher SCIENTIFIC).
Plant samples were dried in an oven at 60 °C until a constant weight was obtained and ground to <0.5 mm in a stainless-steel mill (Retsch, ZM 1000). To extract potentially toxic elements from corn grains, samples of 1 g were digested on a hot plate (80 °C) by adding ultrapure concentrated HNO3 and drops of 30% (v/w) H2O2 until the digestion solution became colorless or white, indicating the end of the digestion process [38]. Then, the digest was diluted to 25 mL with deionized water and analyzed for the PTE content as described for soil samples.

2.4. Quality Control and Assurance

At all stages of sample preparation and analysis, stringent precautions were taken to minimize contamination issues. Quality control methods including replication, use of standards for each potentially toxic element investigated and determination of instrument accuracy were implemented. All measurements were conducted in duplicate. A control sample was analyzed for every 10 samples, and reproducibility was tested by re-analyzing 30% of the samples.
All reagents used in this study were of analytical grade and supplied by Merck Millipore (Darmstadt, Germany). With the 1000 mg L−1 standard for potentially toxic elements, a mean standard of 100 mg L−1 concentration was made, and then the working standards were prepared with 1% nitric acid.

2.5. Pollution Indices

To assess soil pollution degree, several pollution indices that have different scopes were applied.

Geoaccumulation Index (Igeo)

Muller [39] first established the geoaccumulation index, which has been used to measure soil heavy metal contamination in contemporary pollution studies [40]. The following equation was applied for the computation of Igeo:
Igeo = log2 (Cn/1.5Bn)
Cn is the total content of an element in the tested soil, and Bn is the corresponding element content in the Earth’s crust, according to Loska et al. [41]. In this study, the Bn values from GEMAS [42] and Kabata Pendias and Pendias [43] (mean content in organic soils) were applied. The 1.5 constant accounts for both tiny anthropogenic effects and a given metal’s natural oscillations. According to Muller [39], there are seven categories for the geoaccumulation index. They are as follows:
  • Igeo ≤ 0, uncontaminated;
  • 0 < Igeo < 1, uncontaminated or moderately contaminated;
  • 1 < Igeo < 2, moderately contaminated;
  • 2 < Igeo < 3, moderately to heavily contaminated;
  • 3 < Igeo < 4, heavily contaminated;
  • 4 < Igeo < 5, heavily to extremely contaminated;
  • 5 ≤ Igeo, extremely contaminated.

Single Pollution Index (PI)

The metals’ single pollution index (PI) values were calculated using the formula shown below [40,44]:
PI = Cit/Cref
PI values >1 may be considered as possible soil enrichment.
In this study, Cref values were obtained from GEMAS [42] and Kabata Pendias and Pendias [43] (mean content in organic soils).

Bioaccumulation Factor (BF)

The bioaccumulation factor (BF) is defined as the content of an element in a plant divided by the element’s content in the soil [45]:
BF = (Metal content) plant/(Metal content) soil
and it depends on the element’s content in the soil and the factors that affect its mobility. It is indicative of the accumulation of potential metals/metalloids in plants in relation to the corresponding content in soils, and it can be used to assess the possibility of potentially toxic elements entering the food chain through the consumption of plants either by humans or by animals on site.

Potential Ecological Risk (RI)

By evaluating each metal’s potential risk and representing the biota’s sensitivity to the polluting metals, the potential ecological risk index (RI) [40,44] is used to depict the cumulative environmental impact of the researched metals. Based on the total risk index (RI) computation published by Hakanson [46] and used by numerous researchers, RI was evaluated as follows:
RI = E r i
E r i is the ecological risk factor for single metal pollution, and RI is the sum of all the ecological risk factors for all analyzed metals. The formula used to calculate E r i was as follows:
E r i = T r i   × PI
where PI is the single pollution index for the particular metal and T r i   is the toxic response factor for single metal poisoning. The classification of the ecological risk factor ( E r i ) for single metal pollution and the potential ecological risk are shown in Table 1 along with the toxic response factors for the analyzed metals that were adopted from Kusin et al. [47]. No T r i   value is found in the literature for Se.

2.6. Statistical Analysis

Descriptive statistics, coefficient of variation, Pearson’s correlation and comparisons using sample t-test were performed using STATISTICA (StatSoft, lnc. 2011, v.10, Tulsa, 74104 OK, USA).

3. Results and Discussion

3.1. Soil Properties

Soil characteristics showed that, with the exception of pH, the variability was medium to large based on calculated CV levels. Significant differences between the properties among sampling points that can affect PTE dynamics such as CaCO3 and organic matter content were observed (Table 2). Soil pH ranges from levels close to neutrality to slight alkalinity. The alkaline soil environment can affect PTE sorption capacity since these elements’ mobility and availability decrease as the pH approaches neutrality. Based on the calculated CV, the variation in CaCO3 content in soil samples is large. A much higher CaCO3 content was recorded in the samples from the northeast compared to those from the northwest. Organic matter contents in all the soils (except for soils 11 and 12) are over 250 g kg−1 and range from 280 g kg−1 to 550 g kg−1 (Table 2). Organic matter governs PTE availability because, depending on its molecular composition, it tends to form soluble or insoluble complexes with the PTEs. In the pH values of the studied soils, the carboxylic groups of humus ionize and form more stable metal complexes [50,51]. The basic cations of the soil samples varied substantially. The Na+ content was low to medium for all soils and ranged from 0.3 cmol kg−1 to 1.37 cmol kg−1. Due to the cultivation, the soils preserved high soil K+ levels as a result of the fertilizer inputs in the maize crop. High levels of Ca2+ content were observed as supported by the presence of carbonates in the studied soils. Our results are in line with the observation of Karyotis et al. [52], who report that the exchangeable cations in the organic soils of Philippi follow the order Ca2+ > Mg2+ > K+ > Na+. The content of available P varied widely due to the agronomic practices from 9.9 to 83.2 g kg−1, having an important effect on PTE bioavailability due to the formation of sparingly soluble salts [53] (Table 2).

3.2. PTE Content in the Studied Soils

Among the studied PTEs, Pb and Zn showed the highest content, while the lowest content was recorded for Se. The observed variability was different for each of the PTEs studied. Based on the calculated CV values, variation was medium to large for the Pb, Cr, Ni, Cu and Zn contents and relatively low for As and Se contents with CV values < 40% (Table 3).
Comparing our results with the mean content for the studied elements in organic soils globally [43], 2.5 to 3 times higher values in the peat soils of Philippi were observed for Pb, Cr, Ni, Zn, Cu, Mn and As, while the mean content of Se was almost 6 times higher. The chemical composition of peat results from the combination of many factors such as the type of peat, the geomorphology, the environmental conditions and the anthropogenic impact [54]. Considering that for decades the organic soils of Philippi have received appreciable quantities of pesticides, insecticides and fertilizers and that agricultural machinery and other vehicles operate in the area, it is expected that the soils of Philippi peat would at least partially be enriched in the studied PTEs. This is also supported by the lower Pb, Ni, Zn and Cr contents found by Christanis et al. [15] in core samples from approximately 2 to 7 m depth, indicating that the surface soils of the area are enriched in these elements, most probably due to agricultural activities. Recently, Giuri et al. [17], in riverbed sediments of the Kavala–Philippi area, measured mean Zn and Cu contents of 171.1 and 51.9 mg kg−1, values higher than but close to the respective mean Zn and Cu contents of Philippi peat soils (Table 3).
The evaluation of data for peat soils from other areas of Europe supports that the surface soils of Philippi peat are highly enriched in the studied PTEs even when compared to organic soils close to industrial activities [55,56,57].

3.3. PTE Content in the Corn Grains

Table 4 presents data on the content of PTEs in corn grains of the study area. Since it is difficult to find data on element content in corn plants grown in organic soils in the literature, our findings were compared to mean values of PTE content in corn grains from plants grown in mineral soils. Content values of As, Se, Mn, Cr and Zn seem to be consistent with those in comparative studies of corn grains by other authors [58,59,60,61]. However, Antoniades et al. [58] recorded much higher median content for As and Se (0.21 and 0.26 mg kg−1, respectively) in maize grains from plants grown in an industrial area, while Liu et al. [62] reported a 0.17 mg kg−1 As median content in corn grains. In the review conducted by Rosas-Castor et al. [63], median As content values up to 0.32 mg kg−1 are presented. Considering the content of As in Philippi corn grains, all values, except sample 1, and median content were below the threshold limit (0.15 mg kg−1) proposed by the EPA [64] for corn grains. Regarding Se, an element that in the greater part of the world is provided as a supplement in human and animal diets, the median Se content (0.03 mg kg−1) is elevated compared to those presented by other authors for corn grains [65]. Given the fact that Se translocation factor values for the different parts of corn are in the order of stem > leaf > grain [65], it could be reasonably assumed that stems and leaves, consumed mainly as silage by animals such as cattle, pigs and poultry [66], would be more enriched in Se than grains. The high Cu content in corn grain samples from Philippi, which are all higher than the upper limit proposed by the FAO/WHO [67], can be attributed to high application rates of Cu substances for plant protection, and measures should be applied to protect the health of both animals and land workers.
According to the study of Kabata Pendias and Pendias [43] and references therein, the content ranges and/or the mean contents of the studied elements in sweet corn grains are 30–400 and 30 μg kg−1 for As, 11 μg kg−1 for Se, <0.3–3 mg kg−1 for Pb, 0.15 mg kg−1 for Cr, 0.22–0.34 mg kg−1 for Ni, 25–31 mg kg−1 for Zn, 3.6 mg kg−1 for Mn and 1.4–2.1 mg kg−1 for Cu. As, Zn, Mn and Ni median contents in Philippi peat soils are more or less like these values, whereas the respective values for Se, Cr and Cu are higher by approximately x3, x5 and x5, respectively. The decreasing order of the mean element contents (Zn > Cu > Mn > Cr > Ni > P > As > Se) in corn grains almost coincides with the order of these element contents in the soil samples (Mn > Zn > Pb > Cu > P>Ni > As > Se).

3.4. Relationships between Soil/Corn Grain PTE Contents and the Soil Characteristics

The significant correlations between PTE content in soils and corn grains and soil characteristics are shown in Table 5. Organic matter was correlated positively with As soil content but negatively with Se content in corn grains, indicating that As in the studied soils mainly forms organo-metal compounds and at the same time suggesting that Se availability for plant uptake is limited, possibly due to the predominance of soil Se in colloidal-sized organic Se [68]. Available P is negatively and weakly associated with As in soils but negatively and strongly relates with Se, probably as a result of antagonism between these elements for sorption sites, indicating that these elements share similar sorption sites in the studied soils [3,69]. Pokhrel et al. (2020) [70] report significant suppression of As uptake by rice plants due to the presence of Se in the studied paddy soil. Inter-element relationships between PTEs provide information on their sources and pathways. According to Table 5, the positive correlation between As and Se in soils suggests a common origin of both elements. As content in soils significantly and negatively correlates to Se content in corn grains, implying that increased As soil content either restricts Se uptake by maize and/or suppresses Se translocation to corn grains or both. Ali et al. [71] emphasize the similar chemical behavior of As and Se as well as the complex antagonistic interactions between the two elements. Se is positively but not strongly related to Pb, Cr, Ni and Cu contents. This might be an indication of common origin or association with common soil constituents. The recorded correlations between Se and those elements may reflect the effect of pH, Eh, organic matter and metals on the adsorption of Se or its bioaccumulation. Se mobility can be expected to be high in neutral and alkaline soils and low in acidic soils since the predominant species are selenate (SeO42-) and selenite (SeO32-), respectively. Nevertheless, this is valid for inorganic soils, whereas the conditions in organic soils that are periodically flooded may alter Se speciation and behavior [26]. The positive correlations, strong in many cases, between Pb, Ni, Cr, Zn and Cu contents in soils suggest a common origin, in accordance with the results reported by Giouri et al. [17] for Cu and Zn in sediments from an area close to the Philippi peatland.

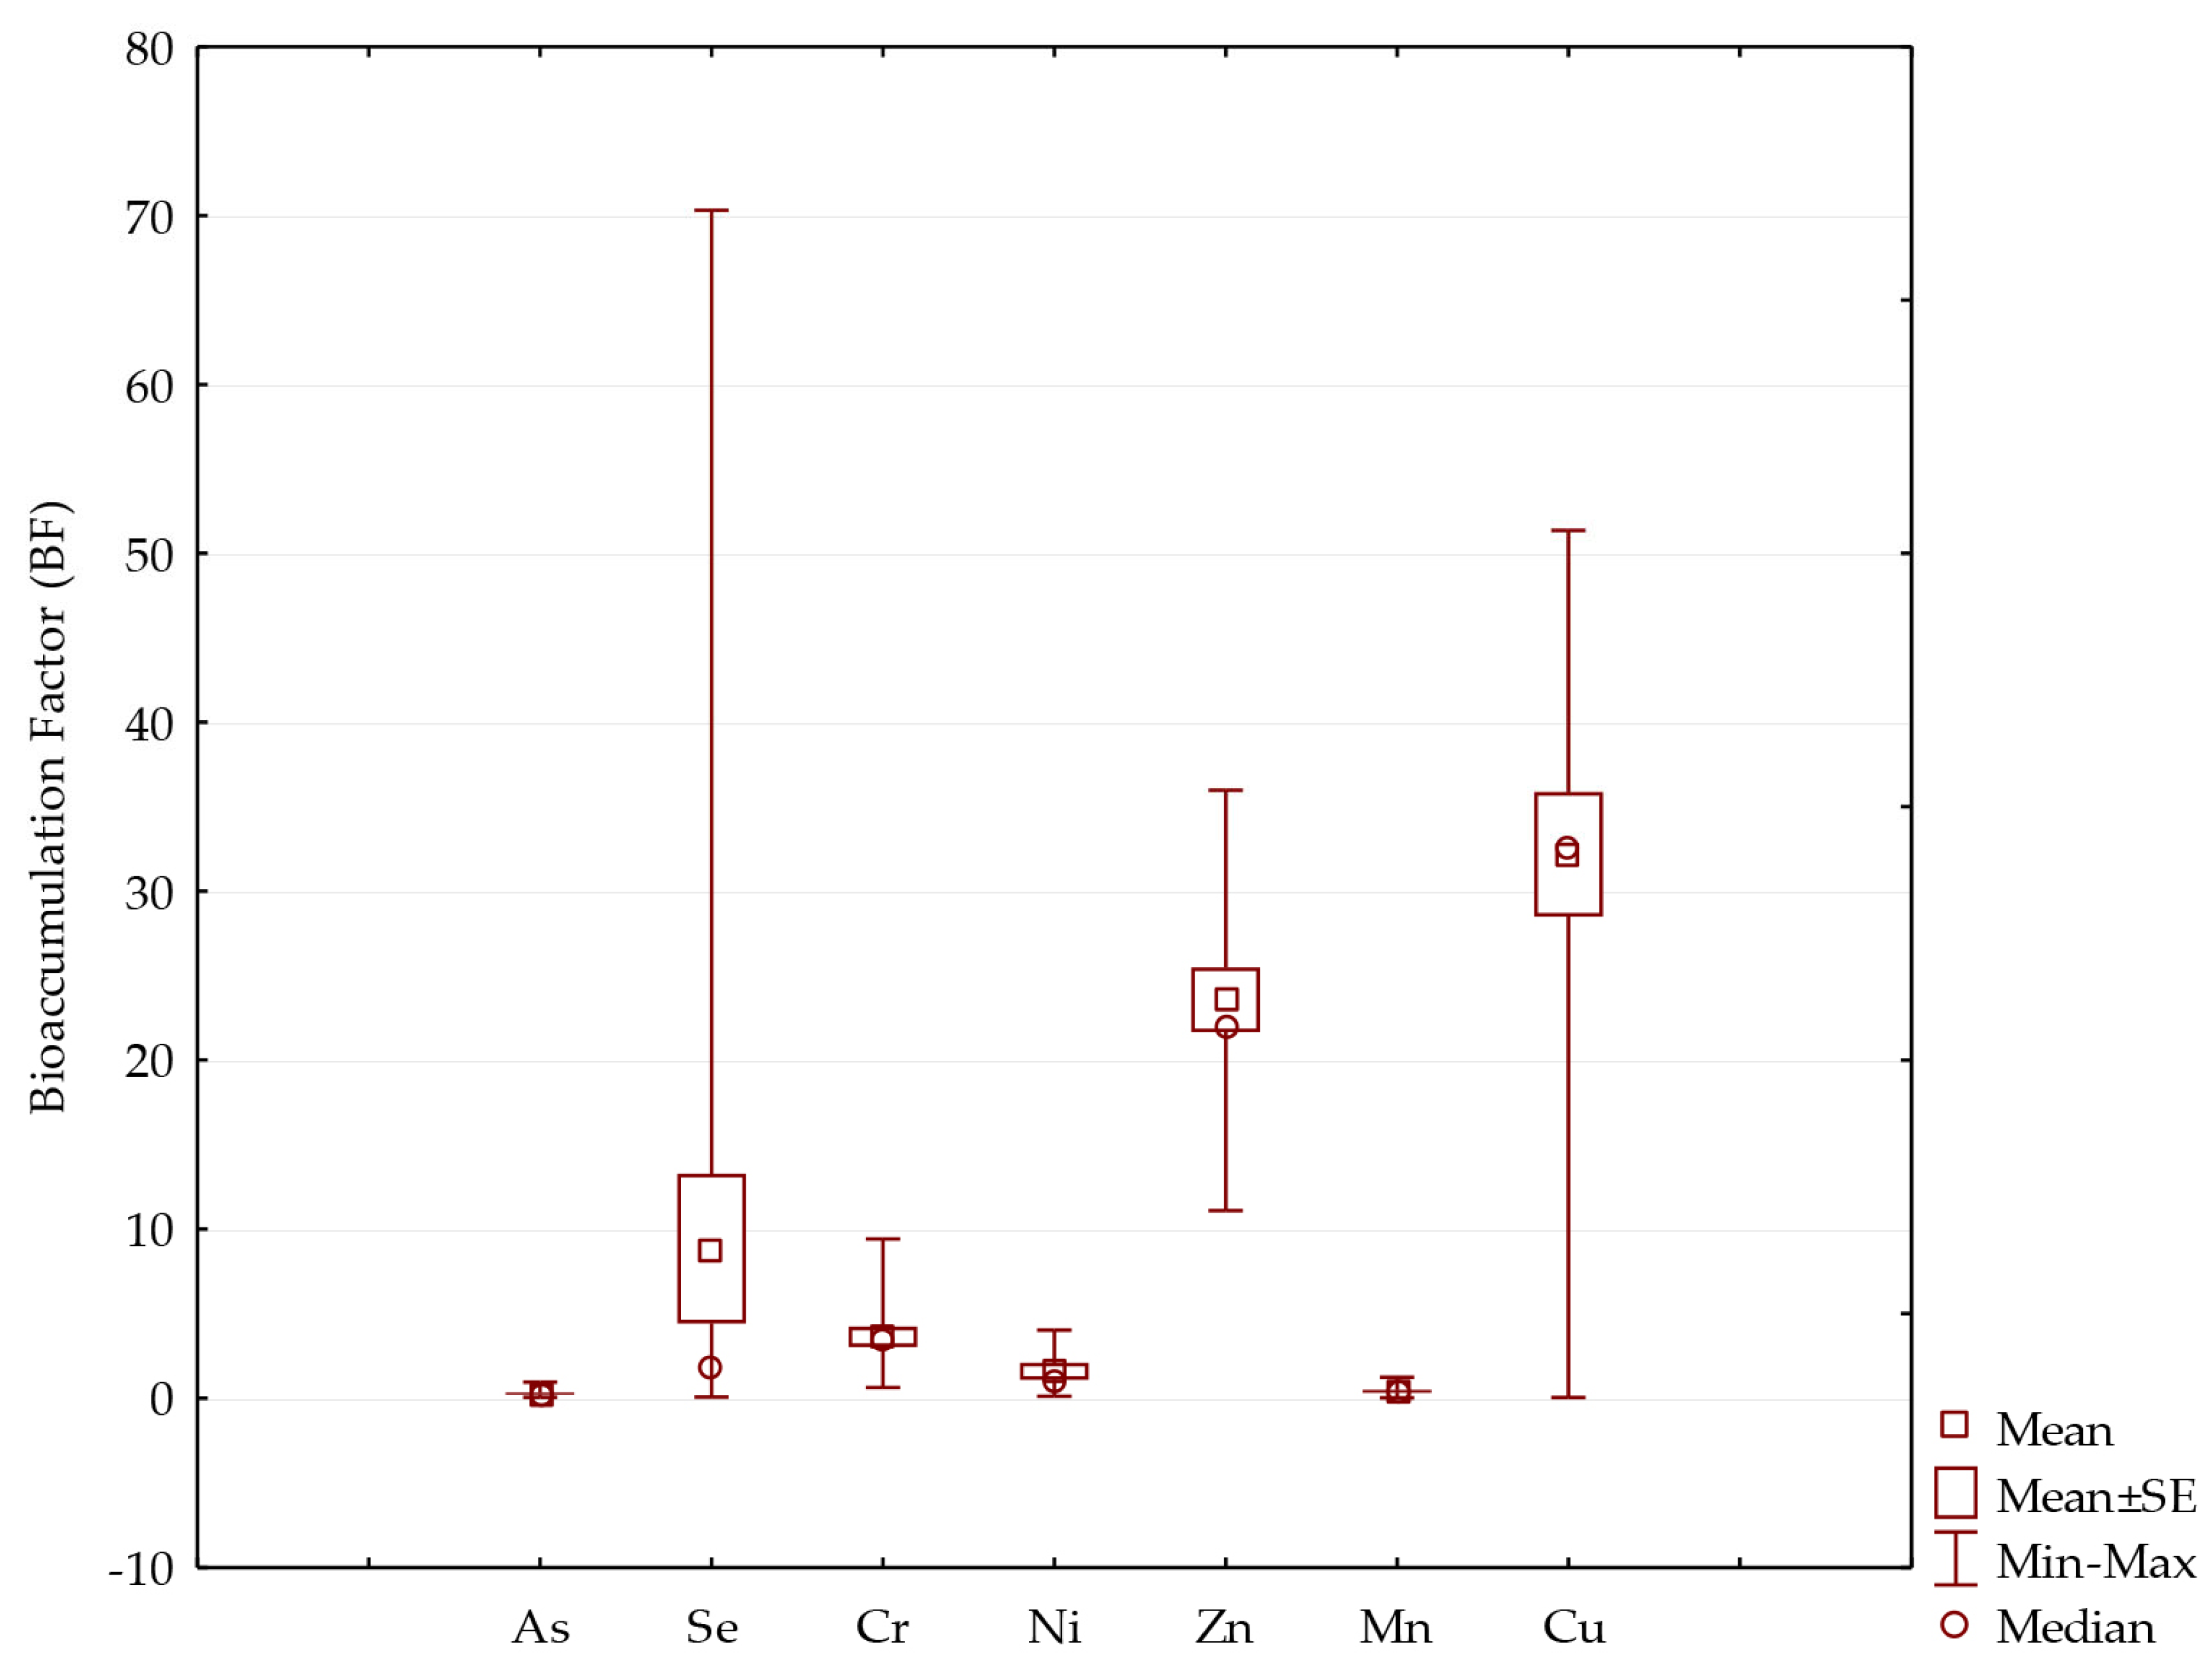
3.5. Bioaccumulation Factor (BF)

The calculated ratio of the element content in corn grains to the total element content in the related soil (rhizosphere) is presented in Figure 2. According to mean BF values, the order of reduced accumulation of the elements studied was Cu > Zn > Se > > Cr > Ni > Mn = As, with Cu exhibiting the highest bioaccumulation factor in most corn grain samples. Nevertheless, in most corn grain samples, Cu and Zn showed the highest BFs (Figure 2). Samples 11 and 12, on the other hand, showed different orders of element accumulation (Se > Cu > Zn > Cr > As > Mn > Ni and Se > Cu > Zn > Cr > Mn > As > Ni, respectively), with Se exhibiting a medium to extremely high degree of BF, greater than those of copper and zinc. Clearly, the transfer and accumulation of Cu, Zn and Se in most corn grain samples was easier compared to that of As, Mn, Cr and Ni. It is known from the literature that Zn and Cu can also easily accumulate in other crops, such as rice and rapeseed [45,62]. The observed order of BF values was very different from those observed for corn grain and soil samples, which, as already mentioned, were almost identical. This, along with the lack of significant correlations between the elemental contents in corn grains and those in soil (except for Zn), suggests that As, Se, Cr, Ni, Mn and Cu contents in corn grains are more related to soil properties that regulate the mobility and availability of the elements in the soil ecosystem than to their total content in soil. Noticeably, Se and Cu BFs showed a very strong negative correlation (p < 0.001), possibly due to antagonism between the two elements for plant uptake or during their translocation between the plant compartments as previously suggested by Yusuf et al. [72].

3.6. Pollution Indices and Potential Ecological Risk (RI)

To assess the level of pollution and the origin of PTEs in soils, the geo-accumulation index (Igeo) and single pollution index (PI) are frequently used [73]. To further evaluate the health of the soil ecosystem and the related risk for toxic effects in the environment, the potential ecological risk (RI) may provide useful information. However, the application of pollution indices to distinguish sources of pollution in peatland soils is very scarce, and thus any conclusion based on their assessment should be utilized with skepticism. The main drawback of this process is that, in most cases, the background levels of the elements under consideration are missing and the corresponding values for the mineral soils must be used [57]. Attempting to overcome the above limitations, the reference values of the studied elements for the agricultural soils of southeastern Europe obtained from GEMAS [42] and from Kabata-Pendias and Pendias [43] for the organic soils of the world were used. This dual approach enabled comparisons of pollution indices and RI values calculated using different background contents of the metal(loid)s studied.

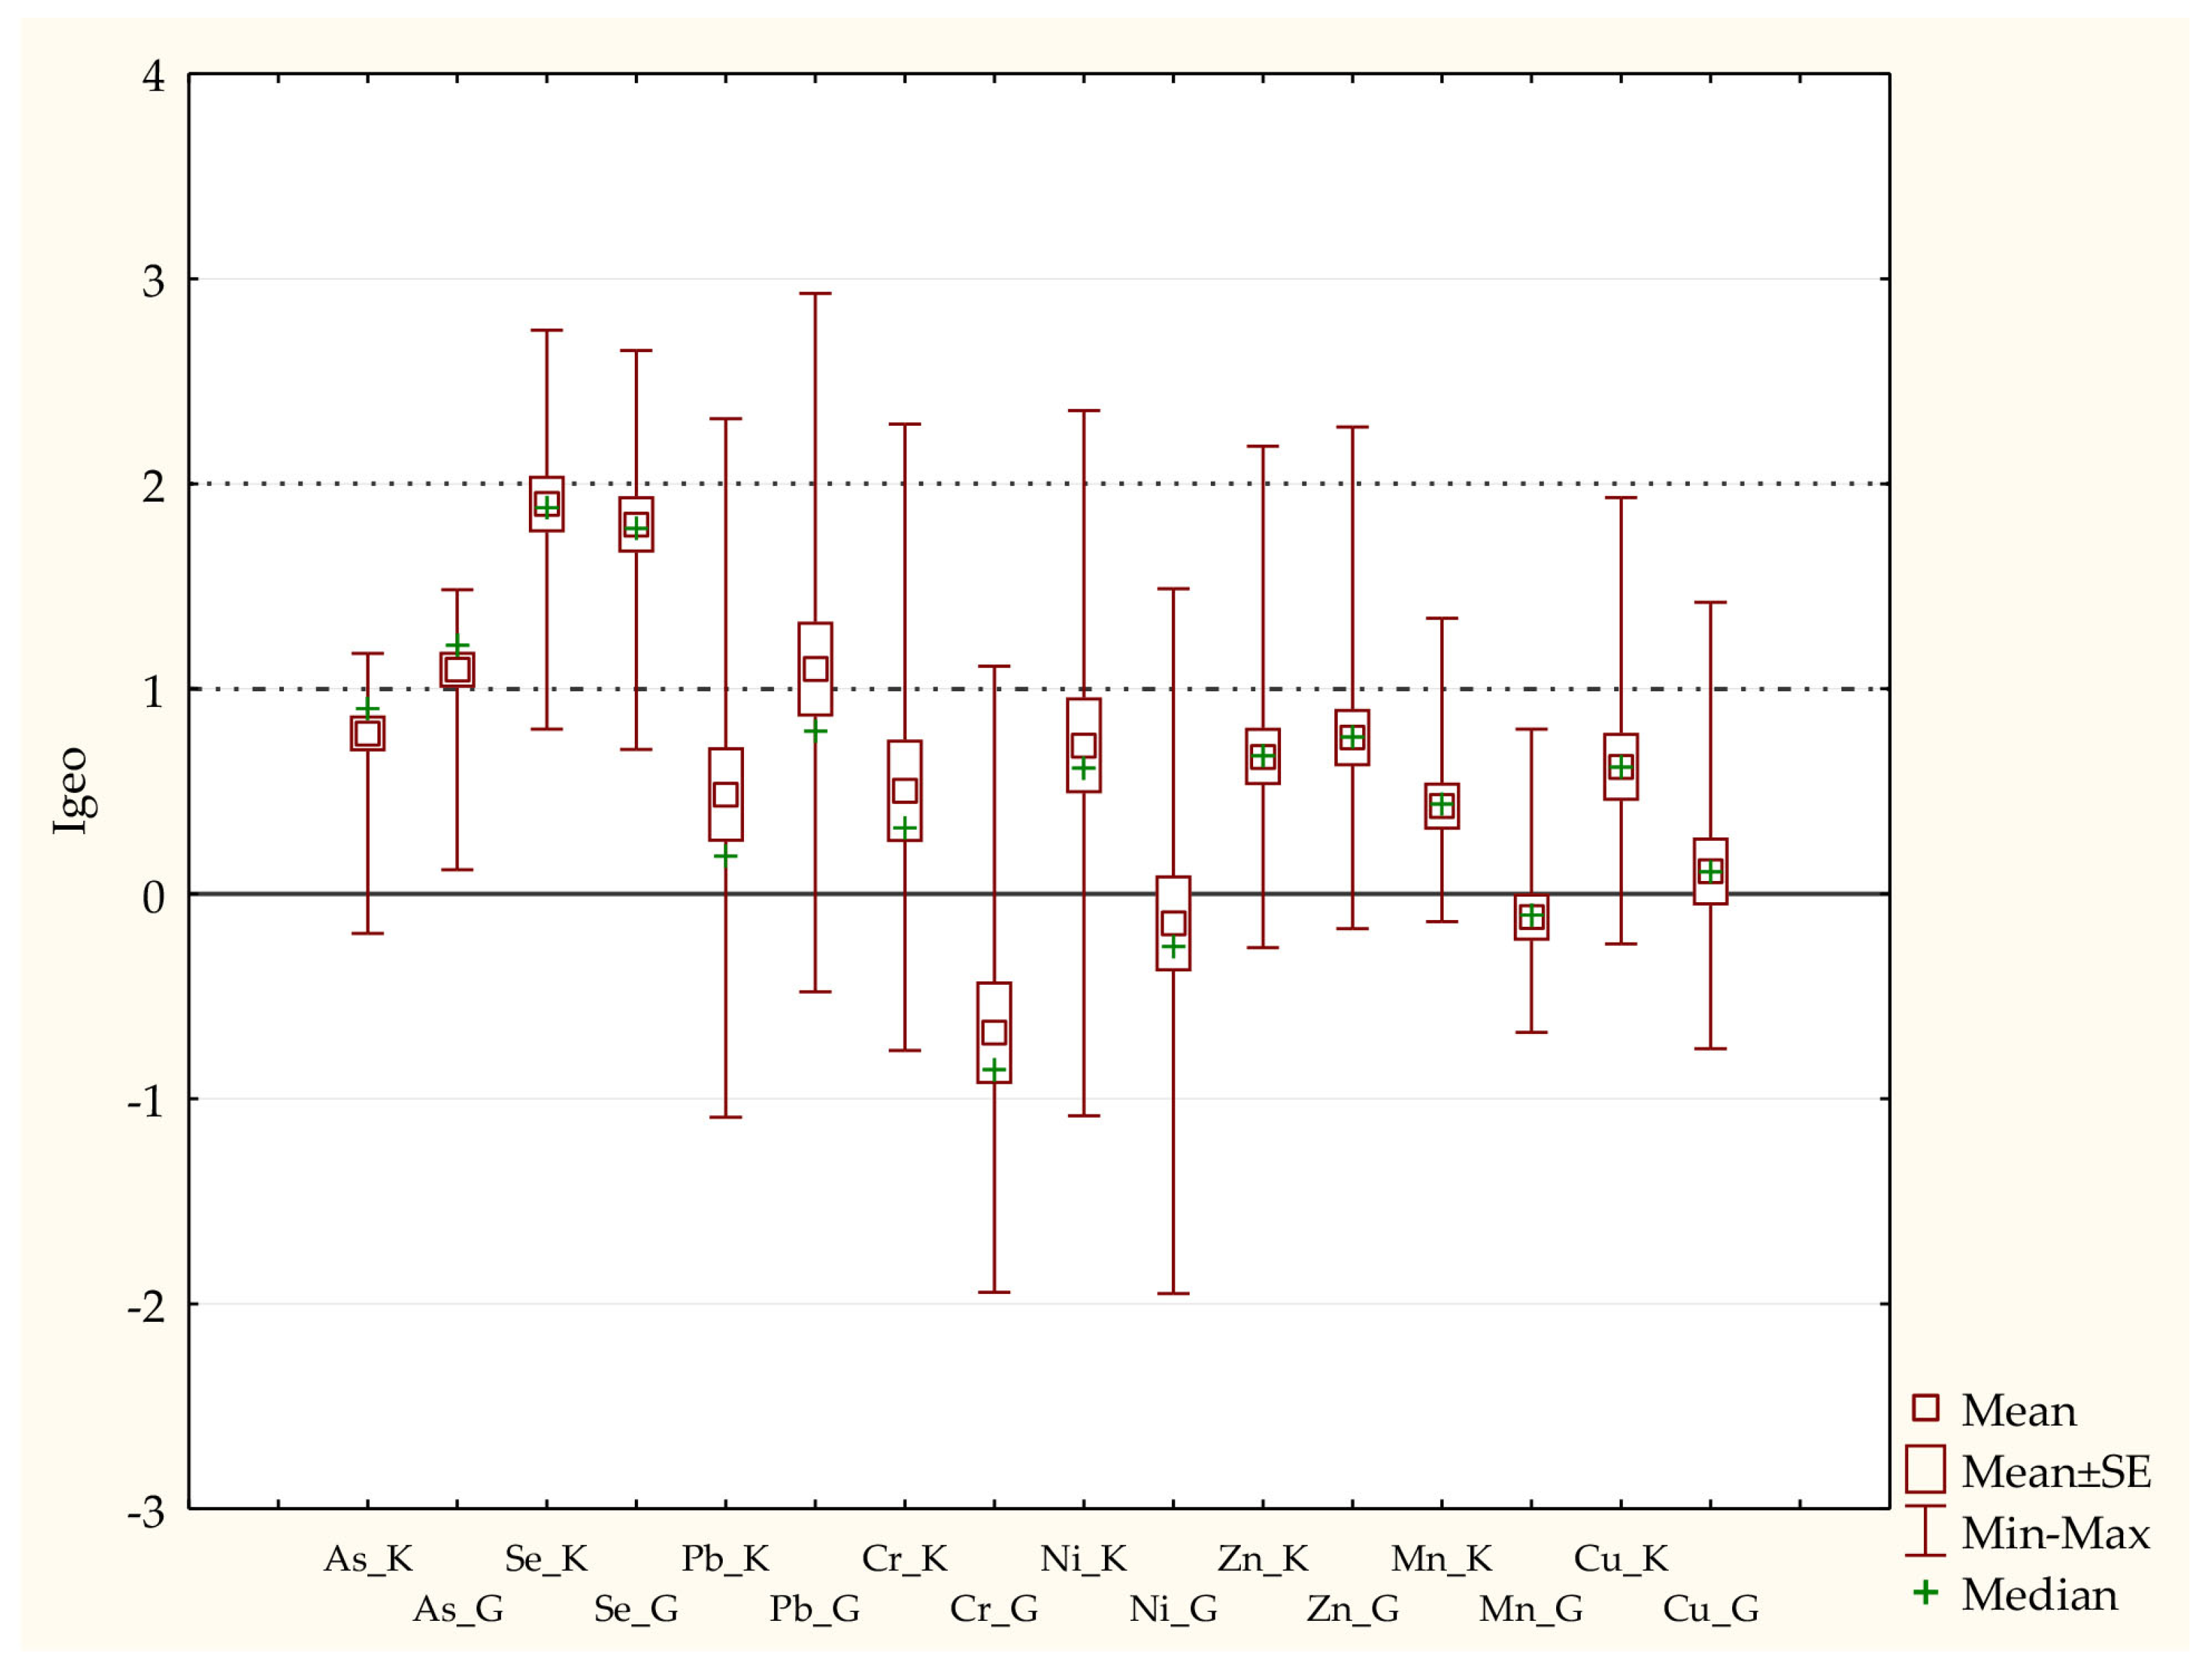
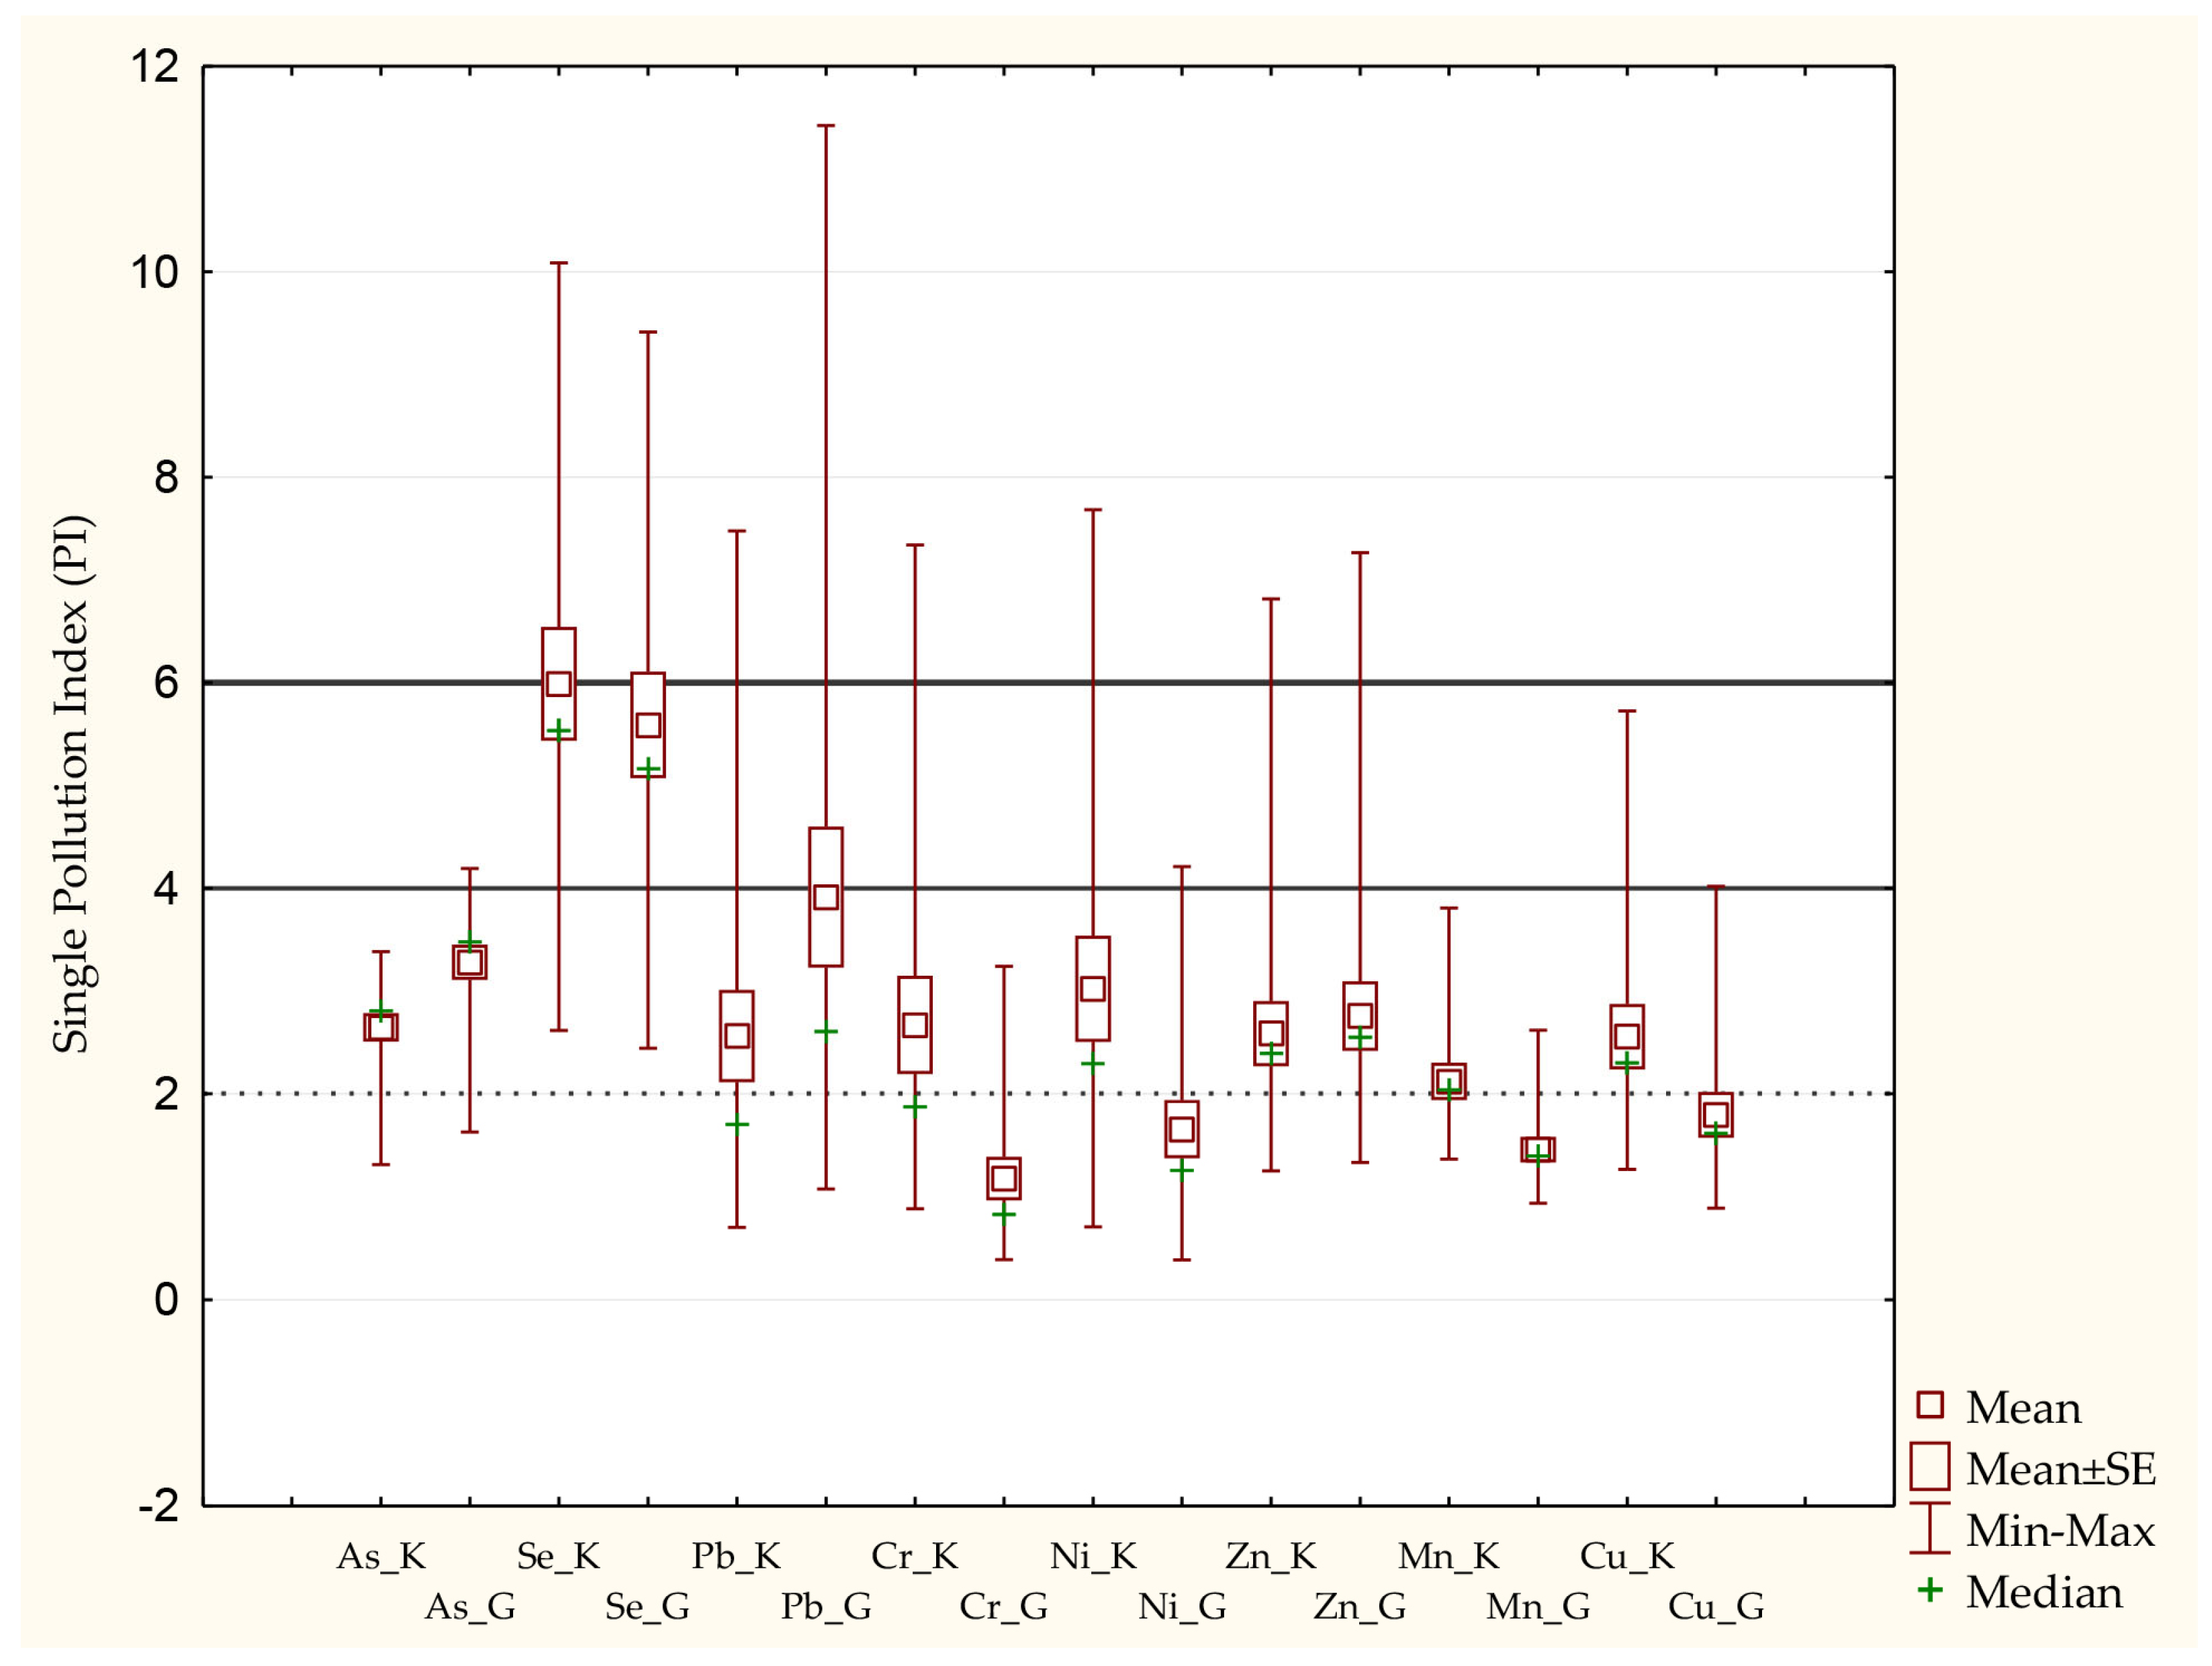
3.6.1. Geoaccumulation Index (Igeo) and Single Pollution Index (PI)

Mean, median, minimum and maximum Igeo and PI values, denoted by letters K and G when reference content for organic soils of the world and GEMAS background for agricultural soils were used, are presented in Figure 3 and Figure 4. In general, both pollution indices provide a similar picture and show that the surface soils of Philippi peat are moderately to moderately heavily contaminated with Se and As. As discussed in Section 3.2, Se and As contents in the soils of the study area are considerably higher compared to those in peat soils of Europe, and this is mirrored by the pollution indices. Considering Se, this high soil enrichment is reflected by the relatively high Se content in corn grains (Table 4) and the high BF values obtained for Se (Figure 2). The optimistic approach of these results supports the hypothesis that the maize crop parts from plants grown in Philippi soils used to produce silage for animal feeding might be highly enriched in Se and thus the administration of Se supplements can be substantially reduced. Because As content in corn grains is below the WHO/FAO threshold [67] and the transfer of the element from soil to plant is limited, soil enrichment in As cannot be considered capable of causing alarming toxicity problems. However, our results should be treated with caution because As is an element that can be highly toxic and the conducted study was focused only on corn grains. Depending on the set of background values utilized for the calculation of pollution indices, soils’ enrichment in the other metals, with few exceptions, is generally low to moderate (Figure 4 and Figure 5). Compared to the Igeo values of our study, Gouri et al. [17] report considerably lower Cu and similar Zn Igeo values for sediments collected from sites in the vicinity of Philippi peatland.
To further evaluate the results, soil samples were grouped according to the level of contamination (Table 6 and Table 7). In the following text, numbers in parentheses are the respective sums of soil samples grouped based on Igeo_G and PI_G values. Igeo_K values were found to be <1 for 13 (6), 1 (1), 12 (9), 10 (15), 10 (14), 14 (11), 14 (16) and 11 (14) soil samples for As, Se, Pb, Cr, Ni, Zn, Mn and Cu, respectively, suggesting uncontaminated to moderately contaminated soils. Igeo_K values showed that only 1 (4), 1, 2 and 1 (1) soil samples are moderately to heavily contaminated by Pb, Cr, Ni and Zn. For Se, Igeo_K values between 2 and 3 were obtained for 7 (7) soil samples, indicating high enrichment (Table 6). According to PI_K 16 (14), 4 (4), 12 (9), 12 (16), 12 (14), 15 (15), 16 (16) and 14 (15) soil samples showed values <4 indicating soils uncontaminated to moderately contaminated by As, Se, Pb, Cr, Ni, Zn, Mn and Cu, respectively. Again, few soil samples can be classified as heavily contaminated by Pb, Cr, Ni and Zn (Table 7).
Following on from the preceding results, both pollution indices (i.e., organic and mineral) show that most soil samples are either uncontaminated or only moderately contaminated by the studied PTEs. Nevertheless, the high to extremely high Igeo and PI values for some of the elements and in some soils suggest enrichment in Pb and Zn and to a lesser extent in Cr and Ni. Few references can be found regarding Igeo and PI values for PTEs in organic soils. Glina et al. [57] estimated both the organic and the mineral geological background levels for Cd, Cr, Cu, Ni, Pb and Zn for fen peatland soils in Poland and then calculated the organic and mineral Igeo and PI values. For Pb, Cr, Ni, Cu and Zn, our results are comparable to the results of those authors only in the case of organic Igeo and PI but differ considerably from the respective mineral values. Koziol et al. [56] report much lower Igeo and EF values than those found in the present study for Pb, Cr and Ni in surface peat soils.
When GEMAS reference values were used for the calculation of Igeo and PI, significantly higher values emerged for Cr, Ni, Mn and Cu (Igeo) and Cr, Ni and Mn (PI) compared to the respective Igeo and PI values produced with the use of mean element contents in the organic soils of the world (t-test, p < 0.05). The opposite was observed for As, while no difference occurred for Se, Pb and Zn (Igeo) and Se, Pb, Zn and Cu (PI). Hence, for the peat soils of Philippi, both sets of background content can be applied to assess the degree of soil enrichment in Se, Pb, Zn and Cu and to estimate the original source of these elements.

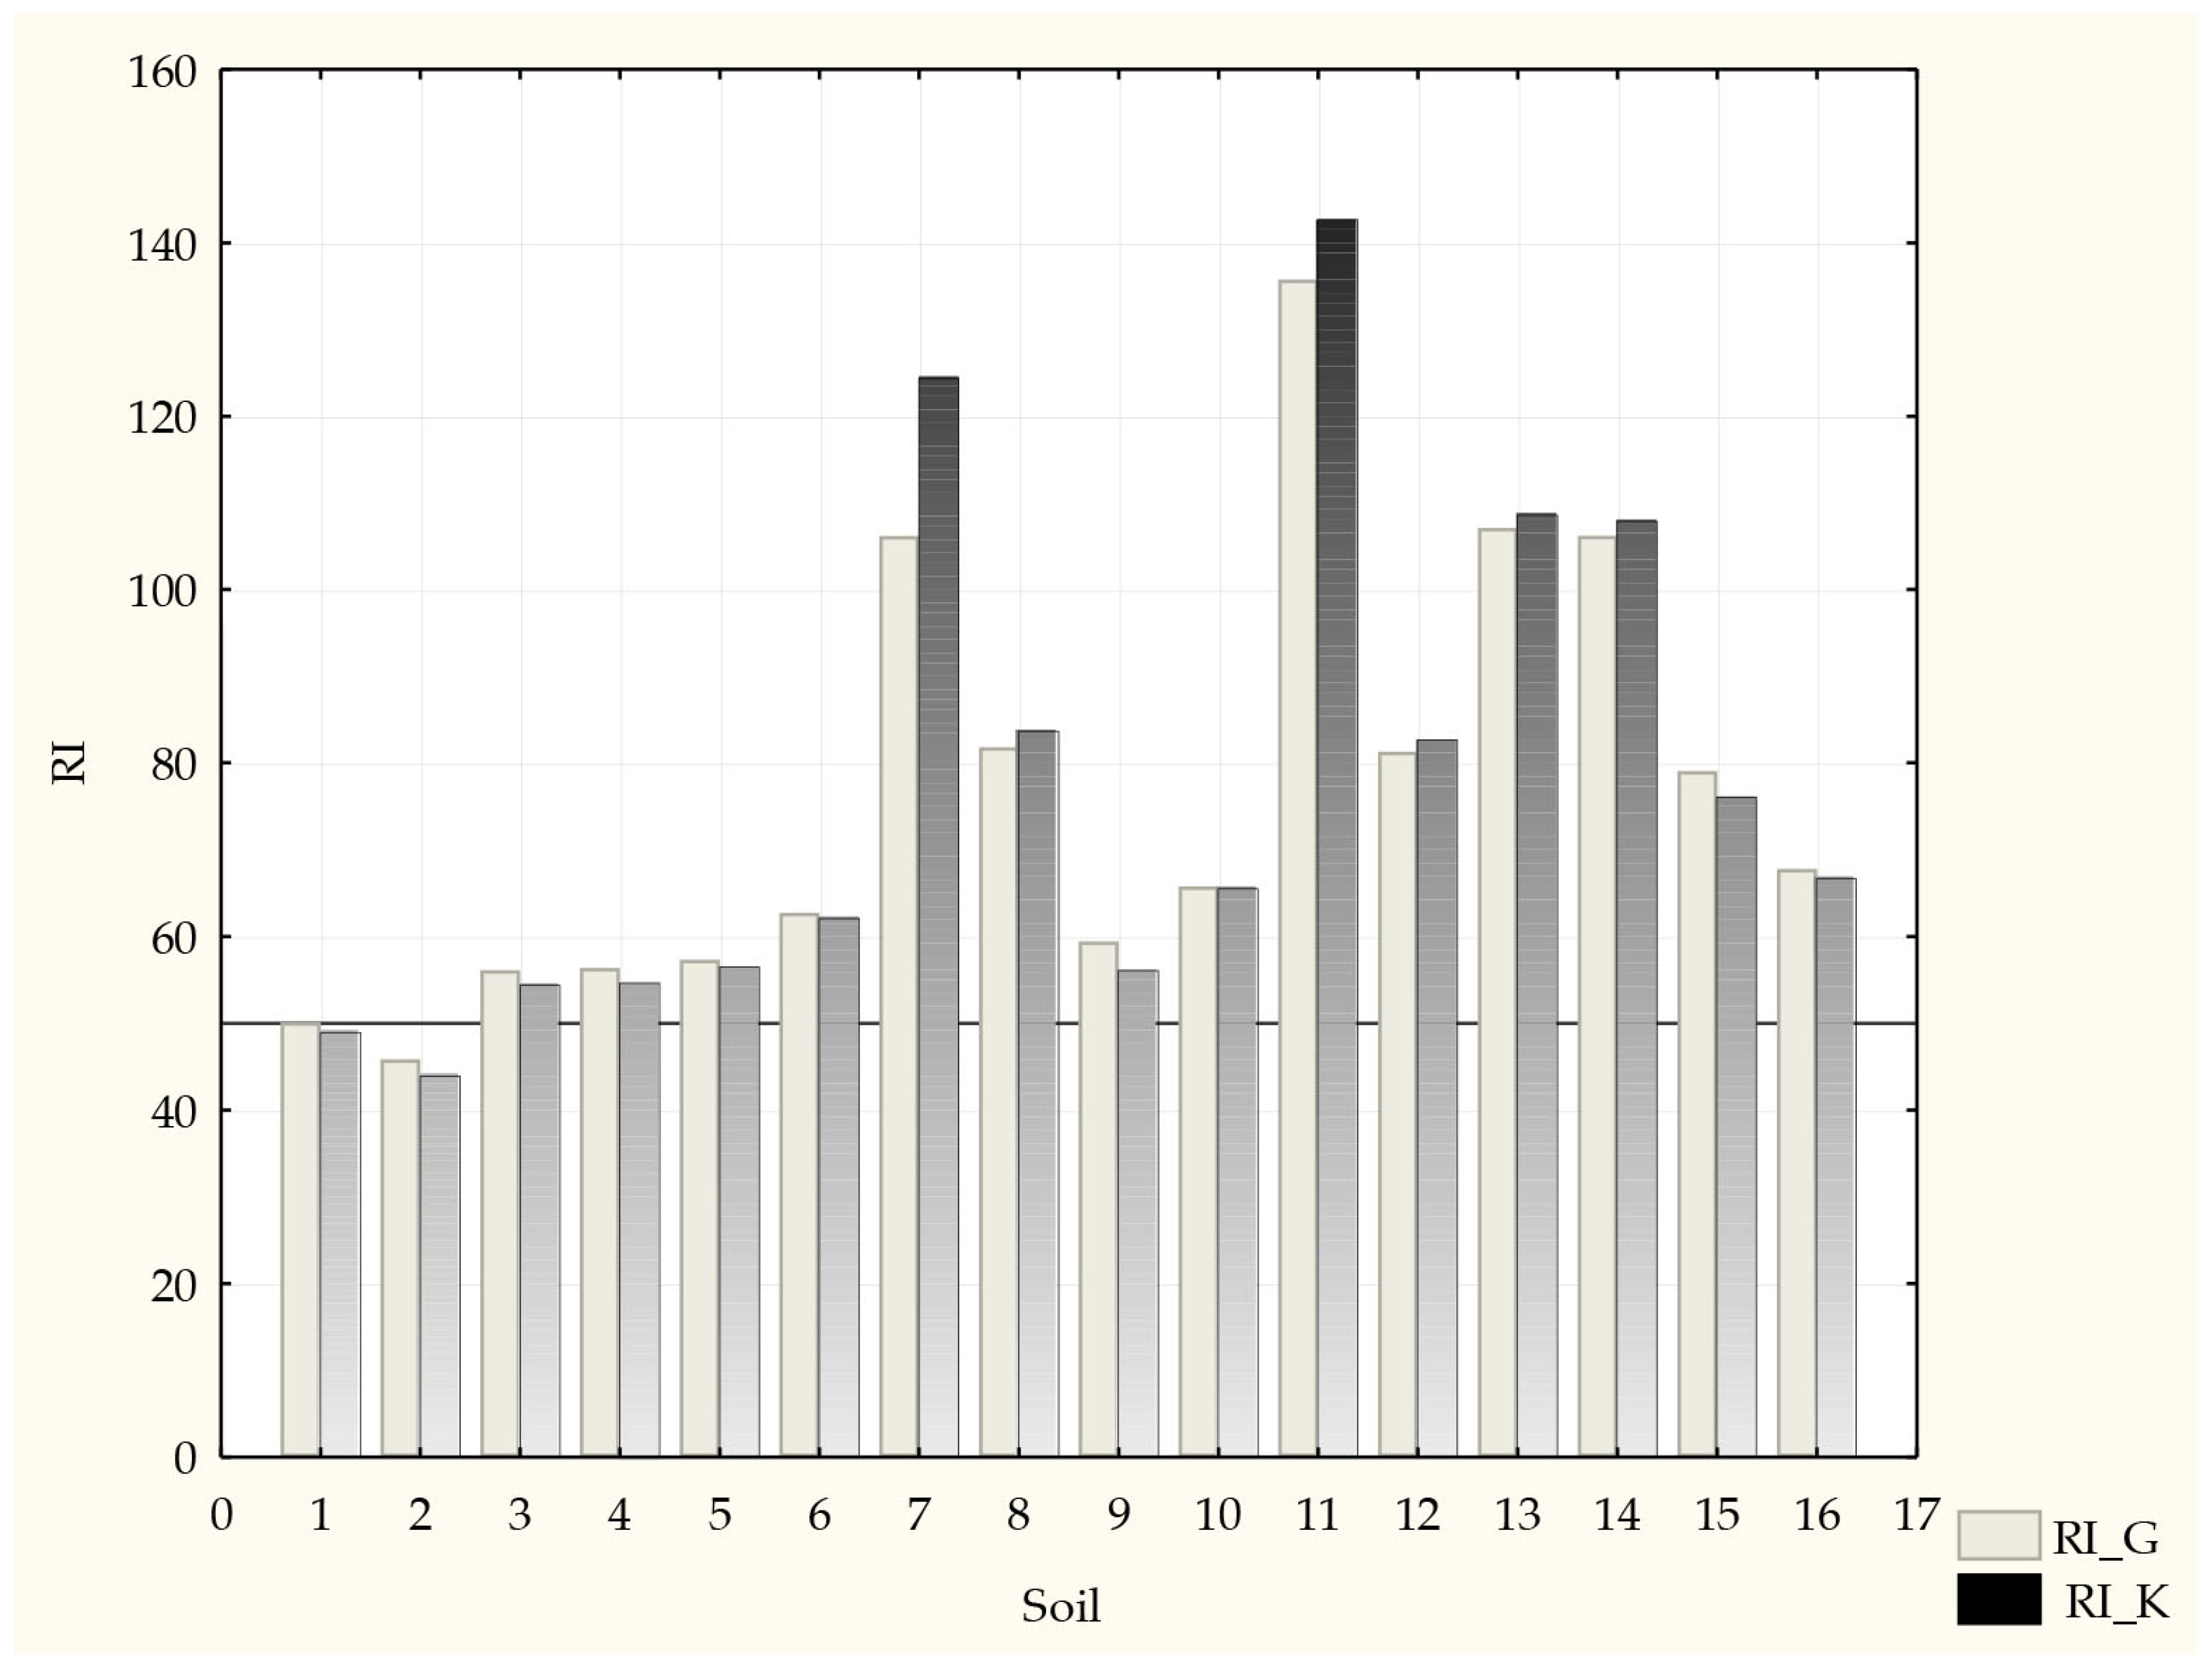
3.6.2. Potential Ecological Risk (RI)

The calculated RI values for the surface soils of the Philippi peat basin are presented in Figure 5. No significant difference between the RI values produced by using the two sets of background content, denoted as RI_K and RI_G, was observed. This outcome suggests that both mineral and organic reference values can be applied to determine RI and assess the environmental risk for the area.
Only two soil samples and one soil sample, respectively, exhibited RI_K and RI_G below 50, indicating low environmental risk. Hence, for most of the soils, the risk for the environment was moderate as the RI values ranged between 50 and 150. The percentage contribution of the studied PTEs in the RI_K values was from 13.98 to 52.69 (average of 37.79) for As, 6.23 to 28.86 (average of 15.40) for Pb, 3.23 to 11.80 (average of 6.20) for Cr, 8.07 to 30.88 (average of 17.87) for Ni, 2.23 to 6 (average 3.40) for Zn, 1.37 to 8.09 (average of 3.22) for Mn and 12.30 to 21.52 (average of 16.07) for Cu. The corresponding ranges and averages for RI_G were from 18.22 to 64.43 (average of 46.45) for As, 9.38 to 44.85 (average of 23.64) for Pb, 1.38 to 6.1 (average of 2.81) for Cr, 4.24 to 19.82 (average of 9.94) for Ni, 2.24 to 6.3 (average 3.62) for Zn, 1.1 to 5.32 (average of 2.18) for Mn and 8.37 to 15 (average of 11.34) for Cu. Thus, the average contributions of the studied elements to the RI_K and RI_G values of Philippi peat soils decrease in the orders of As > Ni > Cu > Pb > Cr > Zn > Mn and As > Pb > Cu > Ni > Zn > Cr > Mn, respectively. It is apparent that in either case, the main contributor is As followed by Pb, Ni and Cu. Nevertheless, the low BF values of As for corn grains suggest low As availability for plant uptake despite the high As contribution to RI values. To avoid further degradation of the peatland ecosystem and considering that the surface soils of Philippi peatland are found to impose a moderate risk to the environment, precautionary measures regarding the agricultural practices followed by the local farmers should be deployed. Glina et al. (2021) [57], studying the contents of Cr, Ni, Pb, Ni, Zn and Cd in peat soils of Poland, reported low and moderate to strong potential ecological risk when the organic and mineral background contents, respectively, were used.

4. Conclusions

This study provides information regarding PTE content in peat soils and in corn grains from maize plants grown on these soils, adding to the relatively limited literature on the pollution indices for these soils. By assessing various parameters, an attempt was made to determine the level of soil contamination by eight PTEs in the Philippi peatland, evaluate the environmental risk, distinguish between the potential sources of the elements and produce data regarding the accumulation of the studied elements in the grains of corn plants grown on these soils. In most soil samples, As, Se, Pb, Cr, Ni, Zn, Mn and Cu contents were higher than the respective values reported in the literature for organic soils. With some exceptions, pollution indices showed that the soils were uncontaminated to moderately contaminated. However, high soil enrichment in Se was observed, classifying the soils as moderately to heavily contaminated by this element. Potential ecological risk (RI) suggests a moderate risk for the environment. The bioaccumulation factor was high for Cu, Zn and Se, pointing to the high availability of these elements in the peat soils of Philippi, whereas the As BF was very low and in line with low As content in corn grains, providing signs of no toxicity effects via the food chain. Nevertheless, As distribution within the maize plants should be of future consideration. Since Se concentration in corn grains was high, future work should also focus on Se allocation within maize to clarify if the produced fodder is enriched in Se.

Author Contributions

Conceptualization, M.E.-E., D.G. and I.M. (Ifigeneia Megremi); methodology, I.Z., D.G., I.M. (Ifigeneia Megremi), D.I. and I.M. (Ioannis Massas); validation, I.Z., D.G., D.I. and I.M. (Ioannis Massas); investigation, I.Z. and D.I.; data curation, I.Z., D.G. and I.M. (Ioannis Masssa); writing—original draft preparation, I.Z., D.G., I.M. (Ifigeneia Megremi) and I.M. (Ioannis Massas); writing—review and editing, I.Z., D.G., I.M. (Ifigeneia Megremi), D.I., I.M. (Ioannis Massas) and M.E.-E. All authors have read and agreed to the published version of the manuscript.

Funding

This research received no external funding.

Data Availability Statement

Not applicable.

Conflicts of Interest

The authors declare no conflict of interest.

References

  1. Bilias, F.; Nikoli, T.; Kalderis, D.; Gasparatos, D. Towards a Soil Remediation Strategy Using Biochar: Effects on Soil Chemical Properties and Bioavailability of Potentially Toxic Elements. Toxics 2021, 9, 184. [Google Scholar] [CrossRef] [PubMed]
  2. Alloway, B.J. Sources of heavy metals and metalloids in soils. In Heavy Metals in Soils. Environmental Pollution; Alloway, B., Ed.; Springer: Dordrecht, The Netherlands, 2013; Volume 22, pp. 11–50. [Google Scholar] [CrossRef]
  3. Zafeiriou, I.; Gasparatos, D.; Kalyvas, G.; Ioannou, D.; Massas, I. Desorption of Arsenic from Calcareous Mine Affected Soils by Phosphate Fertilizers Application in Relation to Soil Properties and As Partitioning. Soil Syst. 2019, 3, 54. [Google Scholar] [CrossRef] [Green Version]
  4. Kumar, A.; Tripti; Raj, D.; Maiti, S.K.; Maleva, M.; Borisova, G. Soil Pollution and Plant Efficiency Indices for Phytoremediation of Heavy Metal(loid)s: Two-Decade Study (2002–2021). Metals 2022, 12, 1330. [Google Scholar] [CrossRef]
  5. González Henao, S.; Ghneim-Herrera, T. Heavy Metals in Soils and the Remediation Potential of Bacteria Associated With the Plant Microbiome. Frontiers in Environmental Science 2021, 9, 15. [Google Scholar] [CrossRef]
  6. Zafeiriou, I.; Gasparatos, D.; Ioannou, D.; Massas, I. Selenium Uptake by Lettuce Plants and Se Distribution in Soil Chemical Phases Affected by the Application Rate and the Presence of a Seaweed Extract-Based Biostimulant. Soil Syst. 2022, 6, 56. [Google Scholar] [CrossRef]
  7. Khan, S.; Naushad, M.; Lima, E.C.; Zhang, S.; Shaheen, S.M.; Rinklebe, J. Global soil pollution by toxic elements: Current status and future perspectives on the risk assessment and remediation strategies—A review. J. Hazard. Mater. 2021, 417, 126039. [Google Scholar] [CrossRef]
  8. Fraser, C.J.D.; Roulet, N.T.; Moore, T.R. Hydrology and dissolved organic carbon biogeochemistry in an ombrotrophic bog. Hydrol. Process. 2001, 15, 3151–3166. [Google Scholar] [CrossRef]
  9. Fraser, C.; Roulet, N.; Lafleur, M. Groundwater flow patterns in a large peatland. J. Hydrol. 2001, 246, 142–154. [Google Scholar] [CrossRef]
  10. Rezanezhad, F.; Price, J.S.; Quinton, W.L.; Lennartz, B.; Milojevic, T.; Van Cappellen, P. Structure of peat soils and implications for water storage, flow and solute transport: A review update for geochemists. Chem. Geol. 2016, 429, 75–84. [Google Scholar] [CrossRef]
  11. Kløve, B.; Berglund, K.; Berglund, Ö.; Weldon, S.; Maljanen, M. Future options for cultivated Nordic peat soils: Can land management and rewetting control greenhouse gas emissions? Environ. Sci. Policy 2017, 69, 85–93. [Google Scholar] [CrossRef]
  12. Monteverde, S.; Healy, M.; O’Leary, D.; Daly, E.; Callery, O. Management and rehabilitation of peatlands: The role of water chemistry, hydrology, policy, and emerging monitoring methods to ensure informed decision making. Ecol. Inf. 2022, 69, 101638. [Google Scholar] [CrossRef]
  13. Tsioptsias, C.; Samiotis, G.; Lefteri, L.; Amanatidou, E. Cr(VI) Leached from Lignite Fly Ash—Assessment of Groundwater Contamination Risk. Water Air Soil Pollut. 2020, 231, 373. [Google Scholar] [CrossRef]
  14. Pavloudakis, F.; Roumpos, C.; Karlopoulos, E.; Koukouzas, N. Sustainable Rehabilitation of Surface Coal Mining Areas: The Case of Greek Lignite Mines. Energies 2020, 13, 3995. [Google Scholar] [CrossRef]
  15. Christanis, K.; Georgakopoulos, A.; Fernández-Turiel, J.; Bouzinos, A. Geological factors influencing the concentration of trace elements in the Philippi peatland, eastern Macedonia, Greece. Int. J. Coal Geol. 1998, 36, 295–313. [Google Scholar] [CrossRef]
  16. Georgakopoulos, A.; Filippidis, A.; Kassoli-Fournaraki, A.; Fernandez-Turiel, J.-L.; Llorens, J.-F.; Mousty, F. Leachability of Major and Trace Elements of Fly Ash from Ptolemais Power Station, Northern Greece. Energy Sources 2002, 24, 103–113. [Google Scholar] [CrossRef]
  17. Giouri, K.; Melfos, V.; Papadopoulou, L.; Vavelidis, M.; Alifragkis, D. Selected Metal Content and Binding Behaviour in Riverbed Sediments of the Kavala–Philippi Area (Northern Greece). Geosciences 2018, 8, 187. [Google Scholar] [CrossRef] [Green Version]
  18. Finkelman, R.B. Trace elements in coal: Environmental and health significance. Biol. Trace Elem. Res. 1999, 67, 197–204. [Google Scholar] [CrossRef]
  19. Ahmad, M.S.A.; Ashraf, M. Essential Roles and Hazardous Effects of Nickel in Plants. In Reviews of Environmental Contamination and Toxicology; Whitacre, D.M., Ed.; Springer: New York, NY, USA, 2012; Volume 214, pp. 125–167. [Google Scholar]
  20. Shahzad, B.; Tanveer, M.; Rehman, A.; Alam Cheema, S.; Fahad, S.; Rehman, S.; Sharma, A.N. Whether toxic or essential for plants and environment—A review. Plant Physiol. Biochem. 2018, 132, 641–651. [Google Scholar] [CrossRef]
  21. Markus, J.; McBratney, A.B. A Review of the Contamination of Soil with Lead. Environ. Int. 2001, 27, 399–411. [Google Scholar] [CrossRef]
  22. Collin, S.; Baskar, A.; Geevarghese, D.M.; Ali, M.N.V.S.; Bahubali, P.; Choudhary, R.; Lvov, V.; Tovar, G.I.; Senatov, F.; Koppala, S.; et al. Bioaccumulation of lead (Pb) and its effects in plants: A review. J. Hazard. Mater. Lett. 2022, 3, 100064. [Google Scholar] [CrossRef]
  23. Zhang, L.; Qin, X.; Tang, J.; Liu, W.; Yang, H. Review of arsenic geochemical characteristics and its significance on arsenic pollution studies in karst groundwater, Southwest China. Appl. Geochem. 2017, 77, 80–88. [Google Scholar] [CrossRef]
  24. Zafeiriou, I.; Gasparatos, D.; Ioannou, D.; Kalderis, D.; Massas, I. Selenium Biofortification of Lettuce Plants (Lactuca sativa L.) as Affected by Se Species, Se Rate, and a Biochar Co-Application in a Calcareous Soil. Agronomy 2022, 12, 131. [Google Scholar] [CrossRef]
  25. Zafeiriou, I.; Gasparatos, D.; Ioannou, D.; Massas, I. Selenium uptake by rocket plants (Eruca sativa) grown in a calcareous soil as affected by Se species, Se rate and a seaweed extract-based biostimulant application. Crop Pasture Sci. 2022. [Google Scholar] [CrossRef]
  26. Shahid, M.; Niazi, N.K.; Khalid, S.; Murtaza, B.; Bibi, I.; Rashid, M.I. A critical review of selenium biogeochemical behavior in soil-plant system with an inference to human health. Environ. Pollut. 2018, 234, 915–934. [Google Scholar] [CrossRef]
  27. Zafeiriou, I.; Gasparatos, D.; Massas, I. Adsorption/Desorption Patterns of Selenium for Acid and Alkaline Soils of Xerothermic Environments. Environments 2020, 7, 72. [Google Scholar] [CrossRef]
  28. Gupta, M.; Gupta, S. An Overview of Selenium Uptake, Metabolism, and Toxicity in Plants. Front. Plant Sci. 2017, 7, 2074. [Google Scholar] [CrossRef] [Green Version]
  29. Genova, G.; Della Chiesa, S.; Mimmo, T.; Borruso, L.; Cesco, S.; Tasser, E.; Matteazzi, A.; Niedrist, G. Copper and zinc as a window to past agricultural land-use. J. Hazard. Mater. 2021, 424, 126631. [Google Scholar] [CrossRef] [PubMed]
  30. Mir, A.R.; Pichtel, J.; Hayat, S. Copper: Uptake, toxicity and tolerance in plants and management of Cu-contaminated soil. BioMetals 2021, 34, 737–759. [Google Scholar] [CrossRef]
  31. Wulf, S.; Hardiman, M.J.; Staff, R.; Koutsodendris, A.; Appelt, O.; Blockley, S.P.; Lowe, J.J.; Manning, C.J.; Ottolini, L.; Schmitt, A.K.; et al. The marine isotope stage 1–5 cryptotephra record of Tenaghi Philippon, Greece: Towards a detailed tephrostratigraphic framework for the Eastern Mediterranean region. Quat. Sci. Rev. 2018, 186, 236–262. [Google Scholar] [CrossRef]
  32. Nachtergaele, F. Soil Taxonomy—A Basic System of Soil Classification for Making and Interpreting Soil Surveys. Geoderma 2001, 99, 336–337. [Google Scholar] [CrossRef]
  33. World Reference Base for Soil Resources Organization (FAO-WRB). International Soil Classification System for Naming Soils and Creating Legends for Soil Maps; World Reference Base for Soil Resources Organization (FAO-WRB): Rome, Italy, 2014. [Google Scholar]
  34. NF ISO 10693; Détermination de la Teneuren Carbonate—MéthodeVolumétrique. Qualité des Sols AFNOR: Paris, France, 1995; pp. 177–186.
  35. Page, A.L. (Ed.) Methods of Soil Analysis, Part 2, 2nd ed.; American Society of Agronomy: Madison, WI, USA, 1982. [Google Scholar]
  36. Davies, B.E. Loss-on-Ignition as an Estimate of Soil Organic Matter. Soil Sci. Soc. Am. J. 1974, 38, 150–151. [Google Scholar] [CrossRef]
  37. Olsen, S.R.; Cole, C.V.; Watanabe, F.S.; Dean, L.A. Estimation of Available Phosphorus in Soils by Extraction with Sodium Bicarbonate; US Department of Agriculture: Washington, DC, USA, 1954; Volume 939, pp. 1–19. [Google Scholar]
  38. Jones, J.B.; Case, V.W. Sampling, Handling and Analysing Plant Tissue Samples. In Soil Testing and Plant Analysis, 3rd ed.; Westerman, R.L., Ed.; Book Series No. 3; Soil Science Society of America: Madison, WI, USA, 1990; pp. 389–427. [Google Scholar]
  39. Muller, G. Index of Geoaccumulation in Sediments of the Rhine River. GeoJournal 1969, 2, 108–118. [Google Scholar]
  40. Kowalska, J.B.; Mazurek, R.; Gąsiorek, M.; Zaleski, T. Pollution indices as useful tools for the comprehensive evaluation of the degree of soil contamination—A review. Environ. Geochem. Health 2018, 40, 2395–2420. [Google Scholar] [CrossRef] [Green Version]
  41. Loska, K.; Wiechuła, D.; Korus, I. Metal contamination of farming soils affected by industry. Environ. Int. 2004, 30, 159–165. [Google Scholar] [CrossRef]
  42. De Vivo, B.; Albanese, S.; Lima, A.; Cicchella, D.; Dinelli, E.; Valera, P.; Reimann, C.; Birke, M.; Demetriades, A.; The GEMAS Project Team. GEMAS: The geochemical mapping of agricultural and grazing land soils of Europe. E3S Web Conf. 2013, 1, 38004. [Google Scholar] [CrossRef] [Green Version]
  43. Kabata-Pendias, H.A.; Mukherjee, A.B. Trace Elements from Soil to Human; Springer: Berlin/Heidelberg, Germany, 2007; ISBN 978-3-540-32714-1. [Google Scholar] [CrossRef]
  44. Mamat, Z.; Haximu, S.; Zhang, Z.Y.; Aji, R. An ecological risk assessment of heavy metal contamination in the surface sediments of Bosten Lake, northwest China. Environ. Sci. Pollut. Res. 2016, 23, 7255–7265. [Google Scholar] [CrossRef]
  45. Wang, S.; Wu, W.; Liu, F.; Liao, R.; Hu, Y. Accumulation of heavy metals in soil-crop systems: A review for wheat and corn. Environ. Sci. Pollut. Res. 2017, 24, 15209–15225. [Google Scholar] [CrossRef]
  46. Håkanson, L. An ecological risk index for aquatic pollution control. A sedimentological approach. Water Res. 1980, 14, 975–1001. [Google Scholar] [CrossRef]
  47. Kusin, F.M.; Azani, N.N.M.; Hasan, S.N.M.S.; Sulong, N.A. Distribution of heavy metals and metalloid in surface sediments of heavily-mined area for bauxite ore in Pengerang, Malaysia and associated risk assessment. CATENA 2018, 165, 454–464. [Google Scholar] [CrossRef]
  48. Wei, Z.; Van Le, Q.; Peng, W.; Yang, Y.; Yang, H.; Gu, H.; Lam, S.S.; Sonne, C. A review on phytoremediation of contaminants in air, water and soil. J. Hazard. Mater. 2020, 403, 123658. [Google Scholar] [CrossRef] [PubMed]
  49. Okonkwo, S.; Idakwo, S.; Ameh, E. Heavy metal contamination and ecological risk assessment of soils around the pegmatite mining sites at Olode area, Ibadan southwestern Nigeria. Environ. Nanotechnol. Monit. Manag. 2021, 15, 100424. [Google Scholar] [CrossRef]
  50. Palansooriya, K.N.; Shaheen, S.M.; Chen, S.S.; Tsang, D.C.W.; Hashimoto, Y.; Hou, D.; Bolan, N.S.; Rinklebe, J.; Ok, Y.S. Soil amendments for immobilization of potentially toxic elements in contaminated soils: A critical review. Environ. Int. 2020, 134, 105046. [Google Scholar] [CrossRef] [PubMed]
  51. Li, Q.; Wang, Y.; Li, Y.; Li, L.; Tang, M.; Hu, W.; Chen, L.; Ai, S. Speciation of heavy metals in soils and their immobilization at micro-scale interfaces among diverse soil components. Sci. Total Environ. 2022, 825, 153862. [Google Scholar] [CrossRef] [PubMed]
  52. Karyotis, T.; Charoulis, A.; Mitsimponas, T.; Vavoulidou, E. Nutrients and Trace Elements of Arable Soils Rich in Organic Matter. Commun. Soil Sci. Plant Anal. 2005, 36, 403–414. [Google Scholar] [CrossRef]
  53. Finzgar, N.; Tlustoš, P.; Leštan, D. Relationship of soil properties to fractionation, bioavailability and mobility of lead and zinc in soil. Plant Soil Environ. 2008, 53, 225–238. [Google Scholar] [CrossRef] [Green Version]
  54. Lappalainen, E. (Ed.) Global Peat Resources; The International Peat Society: Jyväskylä, Finland, 1996. [Google Scholar]
  55. Orru, H.; Orru, M. Sources and distribution of trace elements in Estonian peat. Glob. Planet. Chang. 2006, 53, 249–258. [Google Scholar] [CrossRef]
  56. Kozioł, K.; Korzeniowska, J.; Okupny, D.; Bezak-Mazur, E.; Żurek, S. Trace elements content of surface peat deposits in the Solovetsky Islands (White Sea). Mires Peat 2020, 26, 1–13. [Google Scholar] [CrossRef]
  57. Glina, B.; Kowalska, J.B.; Łuczak, K.; Mazurek, R.; Spychalski, W.; Mendyk, Ł. Potentially toxic elements in fen peatland soils located near lignite-fired power plants in Central Poland. Geoderma Reg. 2021, 25, e00370. [Google Scholar] [CrossRef]
  58. Antoniadis, V.; Golia, E.E.; Liu, Y.-T.; Wang, S.-L.; Shaheen, S.M.; Rinklebe, J. Soil and maize contamination by trace elements and associated health risk assessment in the industrial area of Volos, Greece. Environ. Int. 2019, 124, 79–88. [Google Scholar] [CrossRef]
  59. Custodio, M.; Peñaloza, R.; Orellana, E.; Aguilar-Cáceres, M.A.; Maldonado-Oré, E.M. Heavy Metals and Arsenic in Soil and Cereal Grains and Potential Human Risk in the Central Region of Peru. J. Ecol. Eng. 2021, 22, 206–220. [Google Scholar] [CrossRef]
  60. Cao, X.; Bai, L.; Zeng, X.; Zhang, J.; Wang, Y.; Wu, C.; Su, S.; Li, J. Is maize suitable for substitution planting in arsenic-contaminated farmlands? Plant Soil Environ. 2019, 65, 425–434. [Google Scholar] [CrossRef] [Green Version]
  61. Heckman, J.R.; Sims, J.T.; Beegle, D.B.; Coale, F.J.; Herbert, S.J.; Bruulsema, T.W.; Bamka, W.J. Nutrient Removal by Corn Grain Harvest. Agron. J. 2003, 95, 587–591. [Google Scholar] [CrossRef]
  62. Liu, P.; Zhang, Y.; Feng, N.; Zhu, M.; Tian, J. Potentially toxic element (PTE) levels in maize, soil, and irrigation water and health risks through maize consumption in northern Ningxia, China. BMC Public Health 2020, 20, 1729. [Google Scholar] [CrossRef] [PubMed]
  63. Rosas-Castor, J.; Guzmán-Mar, J.; Hernández-Ramírez, A.; Garza-González, M.; Hinojosa-Reyes, L. Arsenic accumulation in maize crop (Zea mays): A review. Sci. Total Environ. 2014, 488–489, 176–187. [Google Scholar] [CrossRef]
  64. EPA. Risk Assessment Guidance for Superfund (RAGS). Volume I. Human Health Evaluation Manual (HHEM). Part E. Supplemental Guidance for Dermal Risk Assessment; EPA: Washington, DC, USA, 2004; p. 20460, EPA/540/1-89/002.
  65. Song, T.; Su, X.; He, J.; Liang, Y.; Zhou, T.; Liu, C. Selenium (Se) uptake and dynamic changes of Se content in soil–plant systems. Environ. Sci. Pollut. Res. 2018, 25, 34343–34350. [Google Scholar] [CrossRef] [PubMed]
  66. Mombo, S.; Schreck, E.; Dumat, C.; Laplanche, C.; Pierart, A.; Longchamp, M.; Besson, P.; Castrec-Rouelle, M. Bioaccessibility of selenium after human ingestion in relation to its chemical species and compartmentalization in maize. Environ. Geochem. Health 2015, 38, 869–883. [Google Scholar] [CrossRef] [PubMed] [Green Version]
  67. World Health Organization (WHO). Global Health Risks: Mortality and Burden of Disease Attributable to Selected Major Risks; WHO: Geneva, Switzerland, 2009. [Google Scholar]
  68. Supriatin, S.; Weng, L.; Comans, R.N.J. Selenium-rich dissolved organic matter determines selenium uptake in wheat grown on Low-selenium arable land soils. Plant Soil 2016, 408, 73–94. [Google Scholar] [CrossRef] [Green Version]
  69. Strawn, D.G. Review of interactions between phosphorus and arsenic in soils from four case studies. Geochem. Trans. 2018, 19, 10. [Google Scholar] [CrossRef] [Green Version]
  70. Pokhrel, G.R.; Wang, K.T.; Zhuang, H.; Wu, Y.; Chen, W.; Lan, Y.; Zhu, X.; Li, Z.; Fu, F.; Yang, G. Effect of selenium in soil on the toxicity and uptake of arsenic in riceplant. Chemosphere 2020, 239, 124712. [Google Scholar] [CrossRef]
  71. Ali, W.; Zhang, H.; Junaid, M.; Mao, K.; Xu, N.; Chang, C.; Rasool, A.; Aslam, M.W.; Ali, J.; Yang, Z. Insights into the mechanisms of arsenic-selenium interactions and the associated toxicity in plants, animals, and humans: A critical review. Crit. Rev. Environ. Sci. Technol. 2020, 51, 704–750. [Google Scholar] [CrossRef]
  72. Yusuf, M.; Khan, T.A.; Fariduddin, Q. Interaction of epibrassinolide and selenium ameliorates the excess copper in Brassica juncea through altered proline metabolism and antioxidants. Ecotoxicol. Environ. Saf. 2016, 129, 25–34. [Google Scholar] [CrossRef] [PubMed]
  73. Abdullah, M.I.C.; Sah, A.S.R.; Haris, H. Geoaccumulation Index and Enrichment Factor of Arsenic in Surface Sediment of Bukit Merah Reservoir, Malaysia. Trop. Life Sci. Res. 2020, 31, 109–125. [Google Scholar] [CrossRef] [PubMed]
Figure 1. Location map of the study area and sample collection sites.
Minerals 12 01475 g001
Figure 2. Bioaccumulation factor of As, Se, Cr, Ni, Zn, Mn and Cu for corn grains from maize plants grown in Philippi peat soils (N = 16).
Minerals 12 01475 g002
Figure 3. Geoaccumulation index (Igeo) values; K: background values for world organic soils [43]; G: background values from GEMAS [42]. Horizontal lines, from bottom to top, indicate the limits for uncontaminated to moderately contaminated (0–1), moderately contaminated (1–2) and moderately to heavily contaminated (2–3) soils. N = 16.
Minerals 12 01475 g003
Figure 4. Single pollution index (PI) values; K: background values for world organic soils [43]; G: background values from GEMAS [42]. Horizontal lines, from bottom to top, indicate the limits for uncontaminated (0–2), uncontaminated to moderately contaminated (2–4), moderately contaminated (4–6) and moderately to heavily contaminated (4–6) soils. N = 16.
Minerals 12 01475 g004
Figure 5. RI values for the soils of the Philippi peat. K: background values for world organic soils [43]; G: background values from GEMAS [42]. Horizontal line indicates the border between low and moderate risk.
Minerals 12 01475 g005
Table 1. Classification of environmental risk factor ( E r i ), potential ecological risk index (RI) and toxic response factors ( T r i ) for the studied metals. E r i   and RI risk evaluation adopted from Kusin et al. [47] and T r i   values from Wei et al. [48] and Okonkwo et al. [49].
E r i Risk ClassificationRIRisk Classification T r i
E r i   < 40LowRI < 50LowNi: 5
40 ≤ E r i   < 80Moderate50 ≤ RI < 200ModerateCr: 2
80 ≤  E r i   < 160Considerable200 ≤ RI < 300ConsiderableAs: 10
160 ≤  E r i   < 320HighRI ≥ 300HighZn: 1
E r   i ≥ 320Very high Cu: 5
Pb: 5
Mn: 1
Table 2. Basic properties of the studied soils.
Soil SampleCaCO3
(%)
pHOrganic Matter (g kg−1)Exchangeable CationsAvailable P
(mg kg−1)
Na+K+Ca2+Mg2+
(cmolc kg−1)
133.27.124010.360.5765.14.4843.6
235.77.503630.491.7362.54.7883.2
331.67.483830.510.3763.24.7642.3
428.37.613871.370.61106.214.8029.7
530.37.513100.490.6094.18.6226.5
636.17.612900.430.3264.32.8035.4
78.67.512800.370.7259.32.419.9
816.47.513100.560.7261.72.3929.5
920.57.384630.790.4983.14.0840.3
1023.87.613931.301.5676.25.6921.5
111.47.611500.571.2646.72.7529.9
122.17.46930.322.0427.92.2330.0
130.27.204231.101.0060.22.9511.9
140.17.104100.551.1275.12.9617.8
151.77.354730.391.03125.213.7012.7
163.77.475570.501.461178.3618.8
CV8323305353347259
Table 3. Potentially toxic elements’ mean contents (mg kg−1).
Soil SamplePbCrNiZnCuMnAsSe
14910.619.510617.6102021.11.09
24612.88.514418.3141518.80.73
37218.421.410118.684221.91.20
46210.614.414132.777921.91.09
53114.218.38322.0151727.71.11
66519.727.99423.562826.11.22
712188.192.218263.168127.72.38
812544.839.313237.676525.82.11
96511.417.36821.995726.11.50
106622.225.612831.754426.51.60
1132964.588.537279.692618.61.81
1221040.943.415846.054412.21.35
1318550.354.116349.192631.32.82
1418155.752.616247.986131.42.66
1511822.830.111632.356229.02.10
167825.727.110726.554827.32.04
Mean11332.036.314135.584524.61.68
Median7522.527.513132.081126.11.55
Min3110.68.56817.654412.21.09
Max32988.192.237379.6151731.51.82
CV7072684950342137
Table 4. PTE content in corn grains of the study area (mg kg−1). BDL: below detection limit.
Corn Grain SampleAsSe PbCrNiZnMnCu
C_10.200.17BDL0.51BDL332.28.4
C_20.090.03BDL0.59BDL28BDL9.4
C_30.070.08BDL0.580.22212.69.2
C_40.060.08BDL0.43BDL310.411.0
C_50.040.08BDL0.820.74292.411.3
C_60.060.03BDL1.310.27312.29.4
C_70.080.37BDL0.960.51478.413.0
C_80.040.07BDL1.55BDL390.412.1
C_90.080.04BDL1.07BDL253.28.8
C_100.040.02BDLBDLBDL223.011.2
C_110.060.39BDL1.280.10422.611.0
C_120.030.95BDL0.69BDL314.69.4
C_130.060.05BDLBDLBDL314.09.4
C_140.020.04BDL0.50BDL182.212.2
C_150.020.03BDL0.820.54254.213.0
C_160.010.03BDL1.340.69273.28.4
Mean0.060.14 0.830.44302.910.4
Med0.060.32 0.750.51302.610.1
Std0.040.25 0.400.2482.01.6
Min0.010.02 0.430.10180.48.4
Max0.200.95 1.550.74478.413.0
CV74181 5056256815
Table 5. Pearson’s correlation matrix for the PTE contents in soil and corn samples.
CaCO3O.M. 1PAsSePbCrNiMnZnCu
Soil
CaCO3
O.M.
P+/**
As +/**−/*
Se−/*** −/***+/**
Pb−/***−/* +/*
Cr−/** −/* +/**+/**
Ni−/** −/* +/**+/***+/***
Mn −/*
Zn −/*−/* +/***+/**+/***
Cu−/**−/*−/* +/*+/***+/***+/*** +/***
Corn
P
As+/*
Se −/*** −/** +/* +/*
Cr
Mn −/* +/*+/*
Cu −/* +/*
Zn −/* +/*+/* +/*
1 O.M.: organic matter; −: negative correlation; +: positive correlation; *: p < 0.05; **: p < 0.01; ***: p < 0.001.
Table 6. Numbers of soil samples grouped in levels of contamination according to the Igeo values. K: background values for world organic soils [43]; G: background values from GEMAS [42].
AsSePbCrNiZnMnCu
Igeo_KNo of samples
<01 653143
0–112165713108
1–238354125
>2 71121
Igeo_G
<0 110101107
0–1618541067
1–21083124 2
>2 74 1
Table 7. Numbers of soil samples grouped in levels of contamination according to the PI values. K: background values for world organic soils [43]; G: background values from GEMAS [42].
AsSePbCrNiZnMnCu
PI_KNo of samples
0–22 996687
2–4144336987
4–6 53321 2
>6 7112
PI_G
0–21 3131241411
2–41346321124
4–6253 2 1
>6 74 1
Publisher’s Note: MDPI stays neutral with regard to jurisdictional claims in published maps and institutional affiliations.

