Article

Imaging of Ancient Microbial Biomarkers within Miocene Dolomite (Kuwait) Using Time-of-Flight Secondary Ion Mass Spectrometry

1
Department of Physical and Environmental Sciences, University of Toronto Scarborough, 1265 Military Trail, Toronto, ON M1C 1A4, Canada
2
Ontario Centre for the Characterization of Advanced Materials, University of Toronto, 200 College Street, Toronto, ON M5S 3E5, Canada
3
Department of Earth and Environmental Sciences, Kuwait University, P.O. Box 5969, Safat 13060, Kuwait
*
Authors to whom correspondence should be addressed.
Submission received: 15 April 2023 / Revised: 26 June 2023 / Accepted: 14 July 2023 / Published: 21 July 2023

Abstract

:
Time-of-Flight–Secondary Ion Mass Spectrometry (ToF-SIMS) using a bismuth liquid metal ion source was utilized to characterize and image microbial biomarkers within dolomite from early-middle Miocene coastal mud volcano outcrops in Kuwait. ToF-SIMS analysis revealed biomarkers of ancient microbial consortia of sulfate reducers and methane oxidizers participating in the anaerobic oxidation of methane. The identified lipid biomarkers comprised 17α(H),21β(H)-Norhopane, Hop-17(21)-ene or Hop-22(29)-ene (diploptene), non-isoprenoidal dialkyl glycerol diethers (DAGEs), and Diacylglycerol esters (DGs). The ion µ-scale images of carbonate rocks showed two characteristic styles: (1) high signal intensity of dolomite, halite, and biomarkers, where the biomarkers demonstrate a distinctive co-localization pattern with both dolomite and halite; and (2) a lack of dolomite, halite low signal intensity, and an absence of biomarker co-localization patterns. Our results highlight three remarkable observations. Firstly, the concomitance of dolomite and halite suggests a common source of magnesium and sodium supply, likely from the hypersaline Al-Subiya sabkha. This emphasizes the importance of hypersaline seawater for dolomite formation. Secondly, microbial biomarkers correspond to methane- and sulfate-rich conditions under which dolomite was formed. Lastly, the high intensity of biomarker signals and their association with dolomite and halite indicate that the consortia involved in dolomite formation have preferences for high-salinity conditions. The three observations align with previous studies that have highlighted the importance of methane-sulfate redox, high salinity, and halophilic microbes for dolomite formation. This work is the first to acknowledge ancient microbial biomarkers within Miocene dolomite in Kuwait, which aims to broaden the understanding of the biogeochemical processes triggering dolomite formation in similar environments and ancient geologic settings.

1. Introduction

Mud volcanoes and methane seep systems are global geologic phenomena where hydrocarbons naturally seep onshore and offshore [1,2,3]. In anoxic marine sediments, methane oxidizing archaea (ANME) consume the seeped methane anaerobically in syntrophy with sulfate-reducing bacteria (SRB) [4,5] with consequent bicarbonate accumulation, alkalinity increase, and often the precipitation of calcium carbonate [6,7]. Dolomite, the perplexing carbonate mineral, has been reported in different mud volcanoes around the globe [8,9,10,11,12,13] and the long-held claim about its mystifying origin remains debatable [14,15,16].
Since the late-1990s, the research on dolomite formation from a geobiological perspective has provided versatile findings on the importance of microbes in this process. The microbial ability to nucleate dolomite was largely associated with negatively charged microbial surfaces and extracellular polymeric substances (EPSs) [17,18,19,20,21]. A laboratory-based enrichment experiment of halophilic consortia showed the formation of proto-dolomite at the expense of microbial organic biofilm, which proves the role of microbial-derived organic substances as nucleation sites for dolomite formation [22]. In a hypersaline sabkha, the in situ investigation of cyanobacterial EPSs using high-resolution 2D Raman spectroscopy has shown the close association of dolomite clusters with the EPS and organic carbon [23]. Moreover, the potentiometric titration of microbial EPSs from a sabkha indicates the association of dolomite with the carboxylic functional group ligands [24].
The association of halophilic microbes with dolomite in hypersaline environments [25,26,27] can be linked to the status of microbial physiological adaptation to resist the high osmotic pressure resulting from the high salinity. This adaptation entails increasing the concentration of free negatively charged carboxylic groups on microbe surfaces that results in the equal loading of Ca2+ and Mg2+, which leads to dolomite nucleation [18]. The fossils of microbial organic matter within ancient Precambrian dolomite [28] might support the concept of perceiving dolomite as a “biomineral” [29] where microbes can be entombed throughout the biomineralization process [30]. It is therefore a compelling approach to investigate microbial involvement in ancient dolomite formation by investigating the close affinity of microbial biomarkers within dolomite.
Various studies have analyzed microbial biomarkers in methane seep environments via extraction and conventional mass spectrometry methods such as gas chromatography–mass spectrometry (GC-MS) [31,32,33,34], high-performance liquid chromatography–mass spectrometry (HPLC-MS) [35,36], and liquid chromatography–tandem mass spectrometry (LC–MS2) [37]. The identified biomarkers were anticipated to indicate the corresponding microbial activities, and hence the biogeochemical conditions. Nonetheless, these techniques have a limited scope of being destructive for the rock integrity and are unable to produce images of the biomarkers to be localized with inorganic constituents.
In this work, however, we aimed to analyze and localize microbial lipid biomarkers within dolomite at the microscale. We used the powerful surface-sensitive technique known as Time-of-Flight Secondary–Ion Mass Spectrometry (ToF-SIMS), which provides high mass resolution and generates surface ion images with a lateral resolution of <0.1 µm [38]. In ToF-SIMS, a pulsed primary ion beam is used to generate secondary species from a surface, some of which are ionized. The advantage of using a time-of-flight system is the parallel detection of all ions, great sensitivity with low ion doses, high mass range, excellent mass resolution, high spatial resolution, and effective charge compensation due to the pulsed operation of the primary ion source [39]. Thus, the unique capability of ToF-SIMS to identify and map inorganic and organic compounds in a microscopic area has been successfully applied to the analysis and imaging of lipid biomarkers from environmental samples [40,41,42,43,44].
In north Kuwait, many efforts have been made to comprehend the process of dolomite formation in Al-Subiya area. The formation of spherulitic selectively dolomitized fabric was described as perplexing in an early study. It was postulated that the presence of bacterial organic matter could possibly induce the formation of the spherulitic dolomite [45]. In another study, it was indicated that the spheroidal dolomite within the surface lithology was attributed to the collective events of hydrocarbon seepage and microbial metabolism of the seeped hydrocarbon [46]. In a recent investigation, the geochemical signatures of dolomite were characterized, indicating strictly anoxic conditions that imply methane seepage during the Miocene period. Under such conditions, dolomite formation was suggested to be prompted by microbial consortia associated with the anaerobic oxidation of methane [47]. Despite the significance of these findings, the involvement of microbes in dolomite formation in Al-Subiya area was postulated but not verified. In this study, our results demonstrate the preferential microscale affinity of microbial biomarkers within dolomite formed during the Miocene period. We aimed to comprehend the ancient microbial contribution toward the genesis of dolomite within Al-Subiya area in northern Kuwait, and to extrapolate our findings to understand dolomite formation in analogous environments.

2. Materials and Methods

2.1. Sample Materials

The investigated site of the early-middle Miocene coastal mud volcano outcrops is located in Al-Subiya area northeast shoreline arch of Kuwait Bay and is within the basal part of the post-Eocene Kuwait Formation (Figure 1). The area is about 4.6 km × 0.5 km2, exhibiting different geomorphological features and sedimentary structures including laminar bedding, pockmarks, injectites, seismites, evaporites, and fractures [48]. These features indicate surface manifestations of expelled fluids from the Bahrah oilfield, which are associated with seismically injected clastic pipes that act as pathways for hydrothermal fluids and hydrocarbon seepage [49]. The observed pockmarks indicate intense venting of hydrocarbon-charged fluids where the authigenic carbonates are consequences of the microbial anaerobic oxidation of seeped hydrocarbon. The geochemical signatures of positive cerium and europium anomalies of dolomite at the site provide strong evidence of strictly anoxic conditions and sulfate reduction events during the dolomite formation process [47]. Prior to rock sampling for our research, the site was divided into 3 zones based on apparent lithological and geomorphological characteristics (Figure 1). Zone 1 is characterized by the extensive venting of small craters ranging from 1 to 29 cm in diameter with the abundance of gypsum and bioclasts consisting of skeletal marine fossils. Zone 2 is distinguished by dome- and mound-shaped formations, large seismites, soft sediment deformations, and medium-sized craters that reach 1 m in diameter. The distinctive features of Zone 3 include large craters reaching 2.3 m in diameter, giant seismites, and extensive polygonal fractures [48]. Figure 2 shows some main features of the studied mud volcano outcrops.
In this study, one carbonate rock was sampled from each respective zone and labeled accordingly. Sample MV1 was from zone 1, sample MV2 was from zone 2, and sample MV3 was from zone 3 (Figure 3). The color of MV1 and MV3 rocks showed a degree of uniformity throughout the sample while the MV2 rock showed a heterogeneity of colors including unidentified dark lines of 2 cm in diameter within the light brown matrix. Thus, in order to perform a comprehensive investigation of the MV2 rock, its components were first analyzed collectively and then separately, whereby the interface between the dark lines and the brown matrix was labeled as MV2, the dark line sample was labeled as MV2_d, and the light brown matrix was labeled as MV2_br. A small fragment of each rock was first polished manually in two steps using 600- and 1200-grit-size sandpaper, each for 2 min, and then ground to a dime size using the grinder to fit the back-mount plater of the ToF-SIMS instrument.

2.2. Time-of-Flight–Secondary Ion Mass Spectrometry (ToF-SIMS) Analysis

ToF-SIMS analysis was performed using an IONTOF TOFSIMS V mass spectrometer (IONTOF GmbH, Münster, Germany) equipped with a Bi LMIG primary ion source. Prior to analysis, the sample surfaces were cleaned with an argon cluster ion source (cluster size: 1500, 10 keV, current 1.1 nA) rastered over a 450 × 450 µm2 area for 5 min. This resulted in a clean surface and minimal, if any, damage to the rock surface. A Bi3++ pulsed primary ion beam (60 keV, 0.3 pA) was used to generate positive spectra in both high-mass and high-spatial-resolution modes. The secondary ions were extracted into an analyzer by a high-voltage potential and masses were analyzed by measuring their time-of-flight from sample to detector. By rastering the primary ion beam, mass spectra and secondary ion images can be obtained to yield molecular information of the surface constituents [49]. Sample areas of 150 × 150 µm2 were obtained from the center of the cluster-cleaned area. Charged compensation was achieved with the instrument’s electron flood gun operating between the primary ion pulses in an intercalated mode. Mass calibration was performed using H+, Li+, CH3+, K+, and CaOH+ for the spectra collected in high-mass-resolution mode, and H+, Li+, CH3+, and Na+ for those collected in high-spatial-resolution mode. The identified fragments of microbial biomarkers were compared to reference biomarker spectra of AOM consortia [50]. ToF-SIMS imaging allows for the localization of biomarkers within the regions of interest in two-dimensional maps of the analyzed surface. The distribution of microbial biomarkers had to be ascertained from spectral images obtained in the high-mass-resolution mode. The images of microbial biomarkers were displayed using a log scale and binned to 4 pixels in order to increase the contrast. Additional complementary analyses were utilized using thin sections and an Electron Probe Micro-Analyzer (EPMA) to support the discussion of ToF-SIMS findings (Methodology in Supplementary Materials).

3. Results

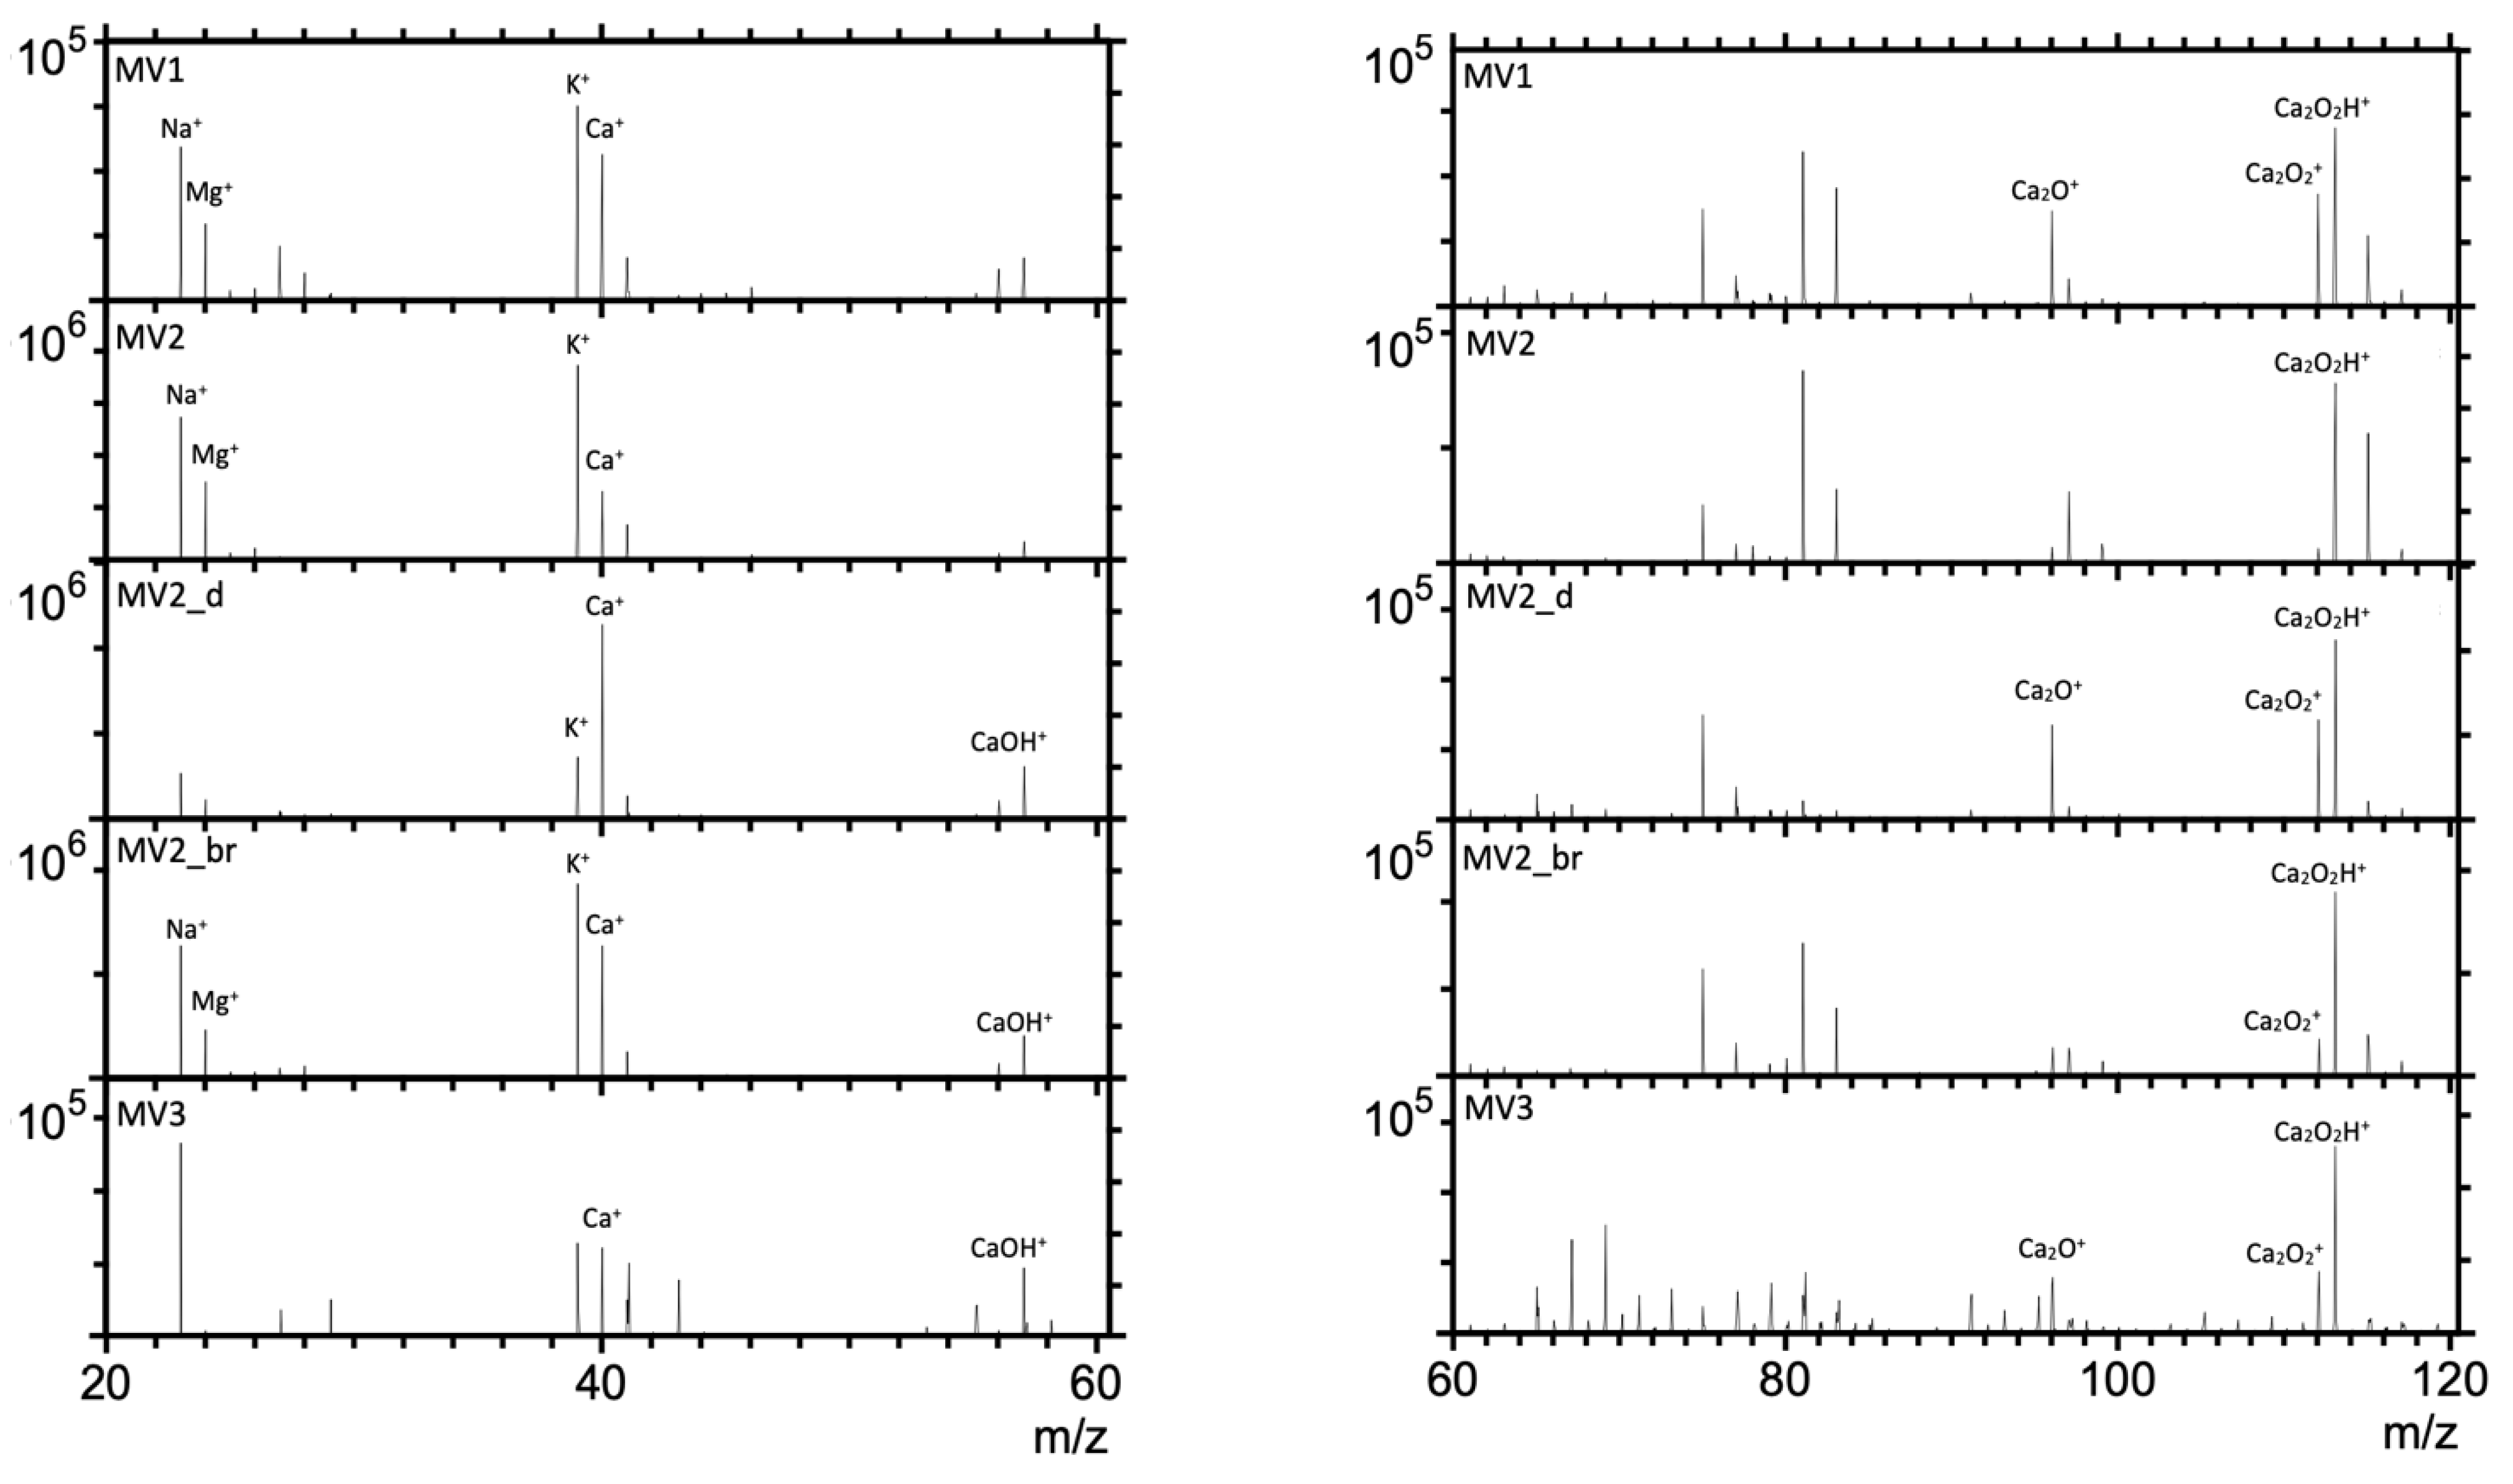
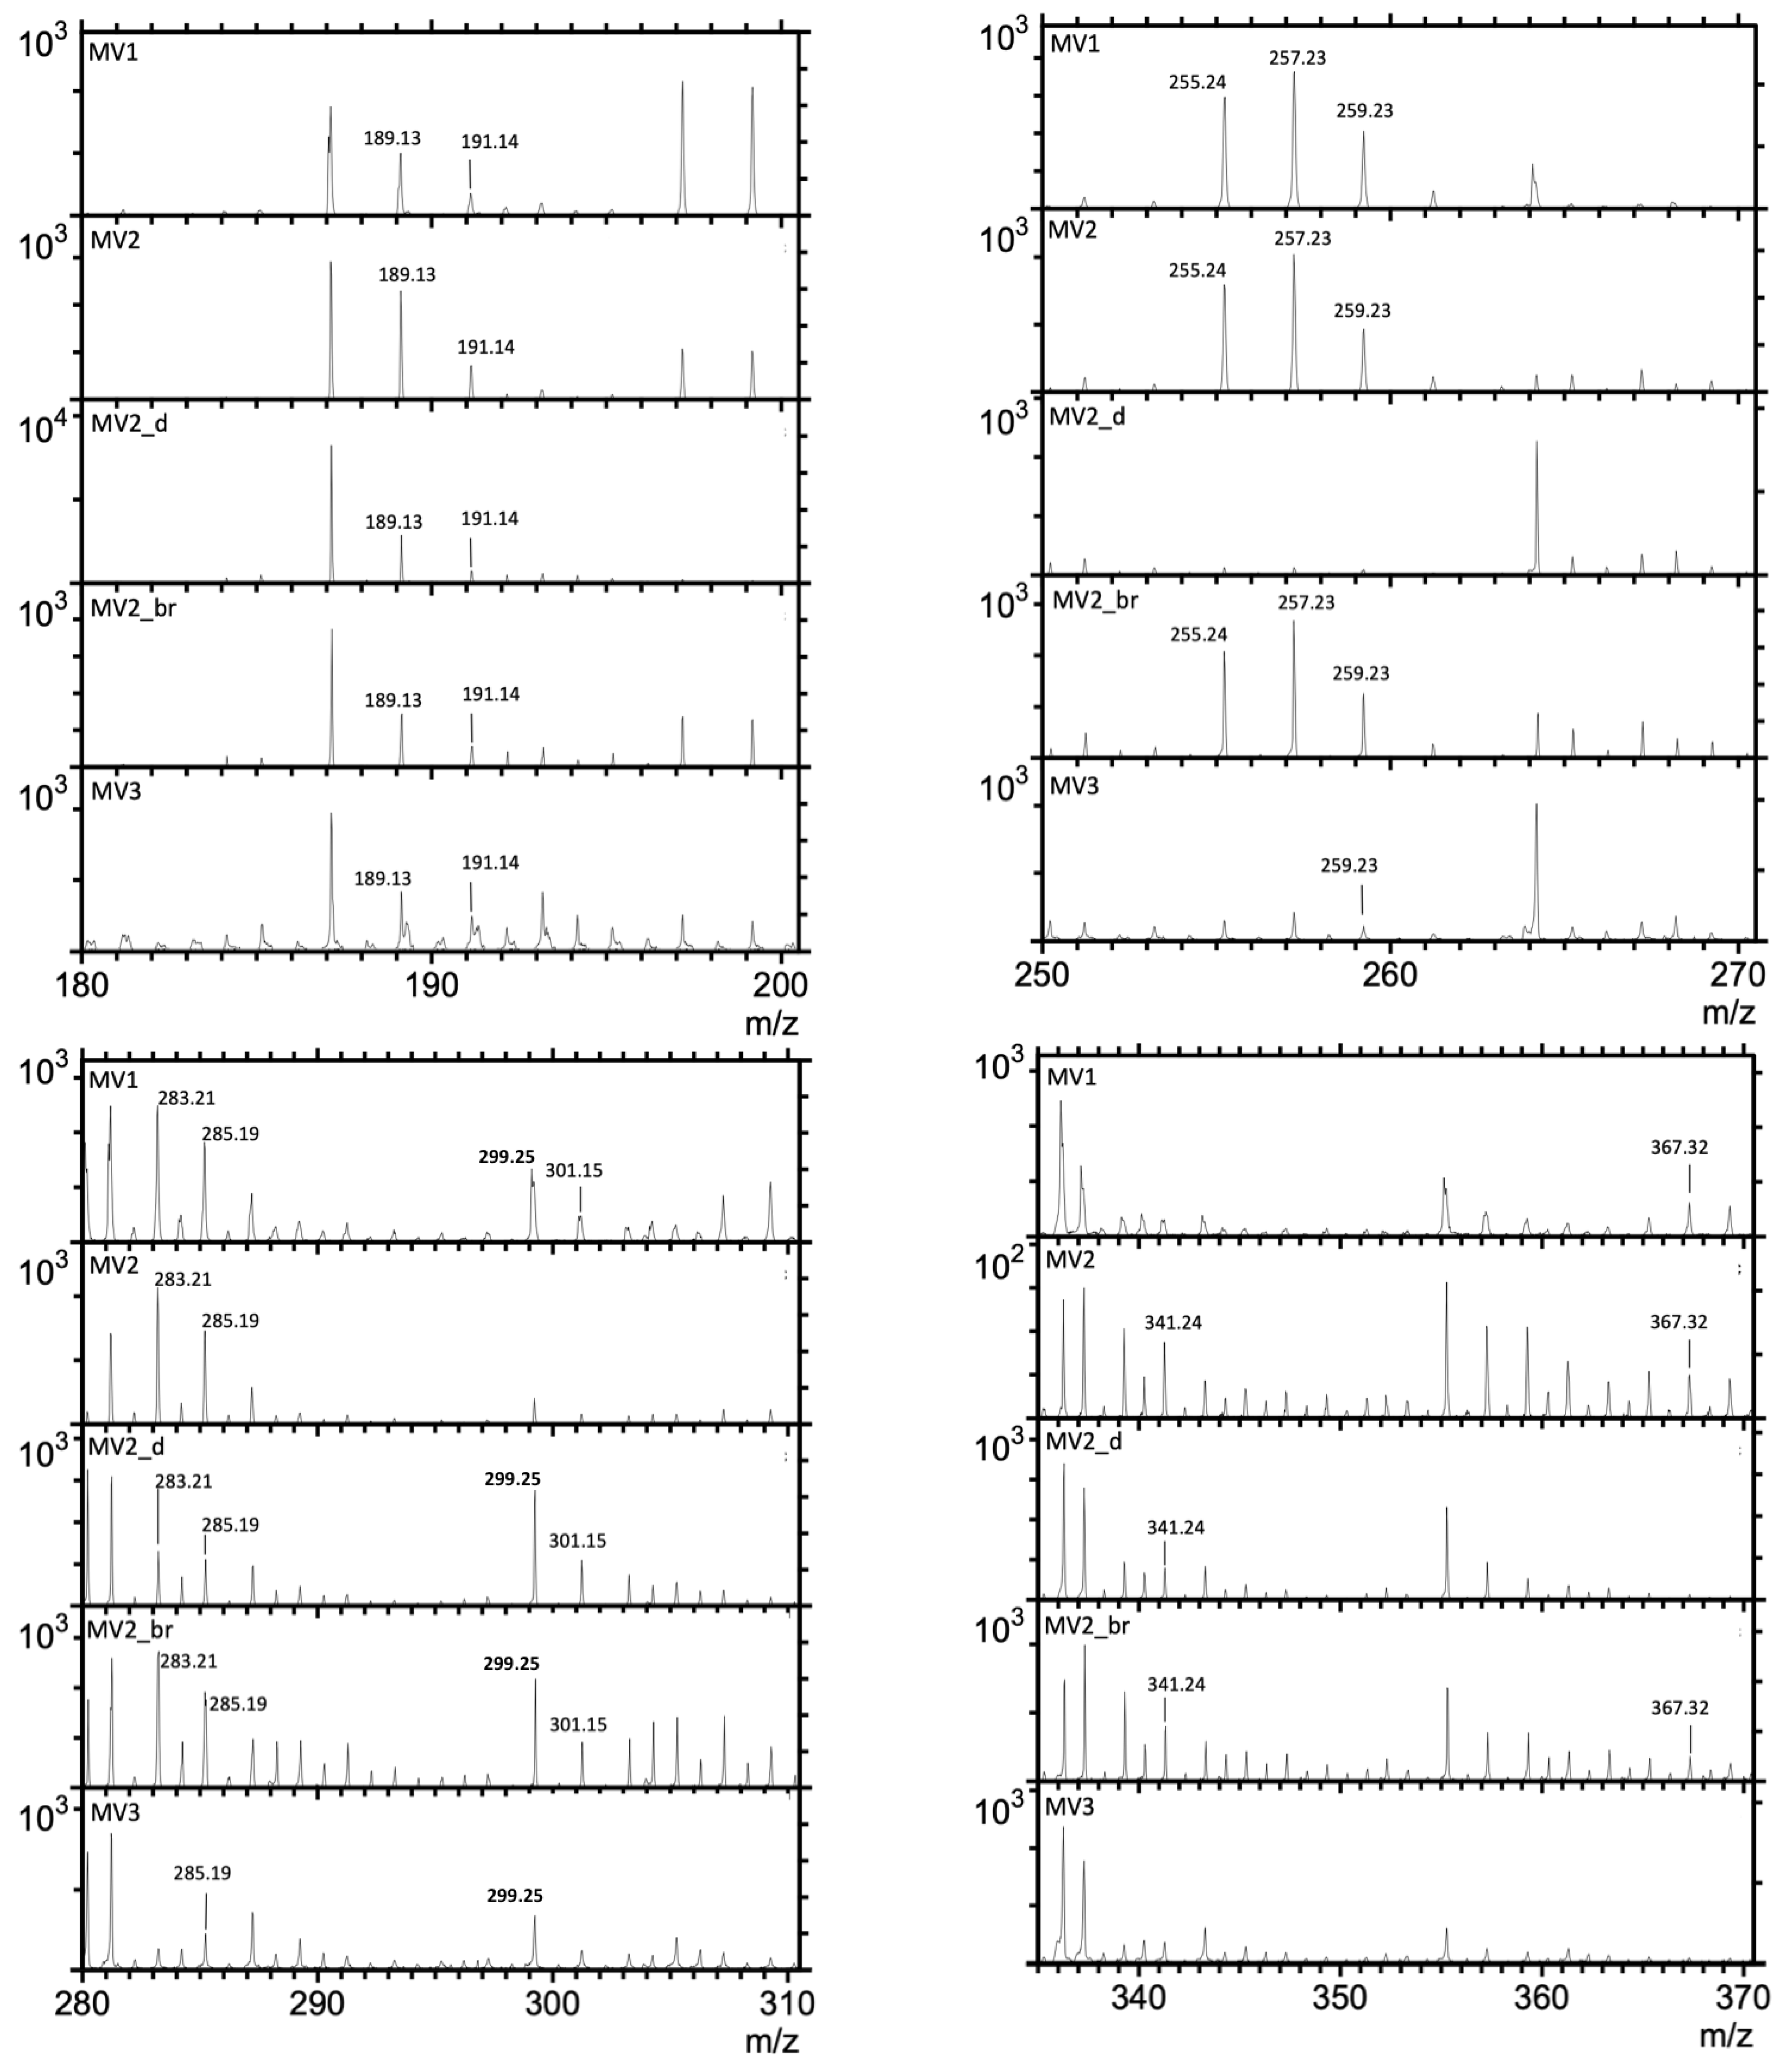
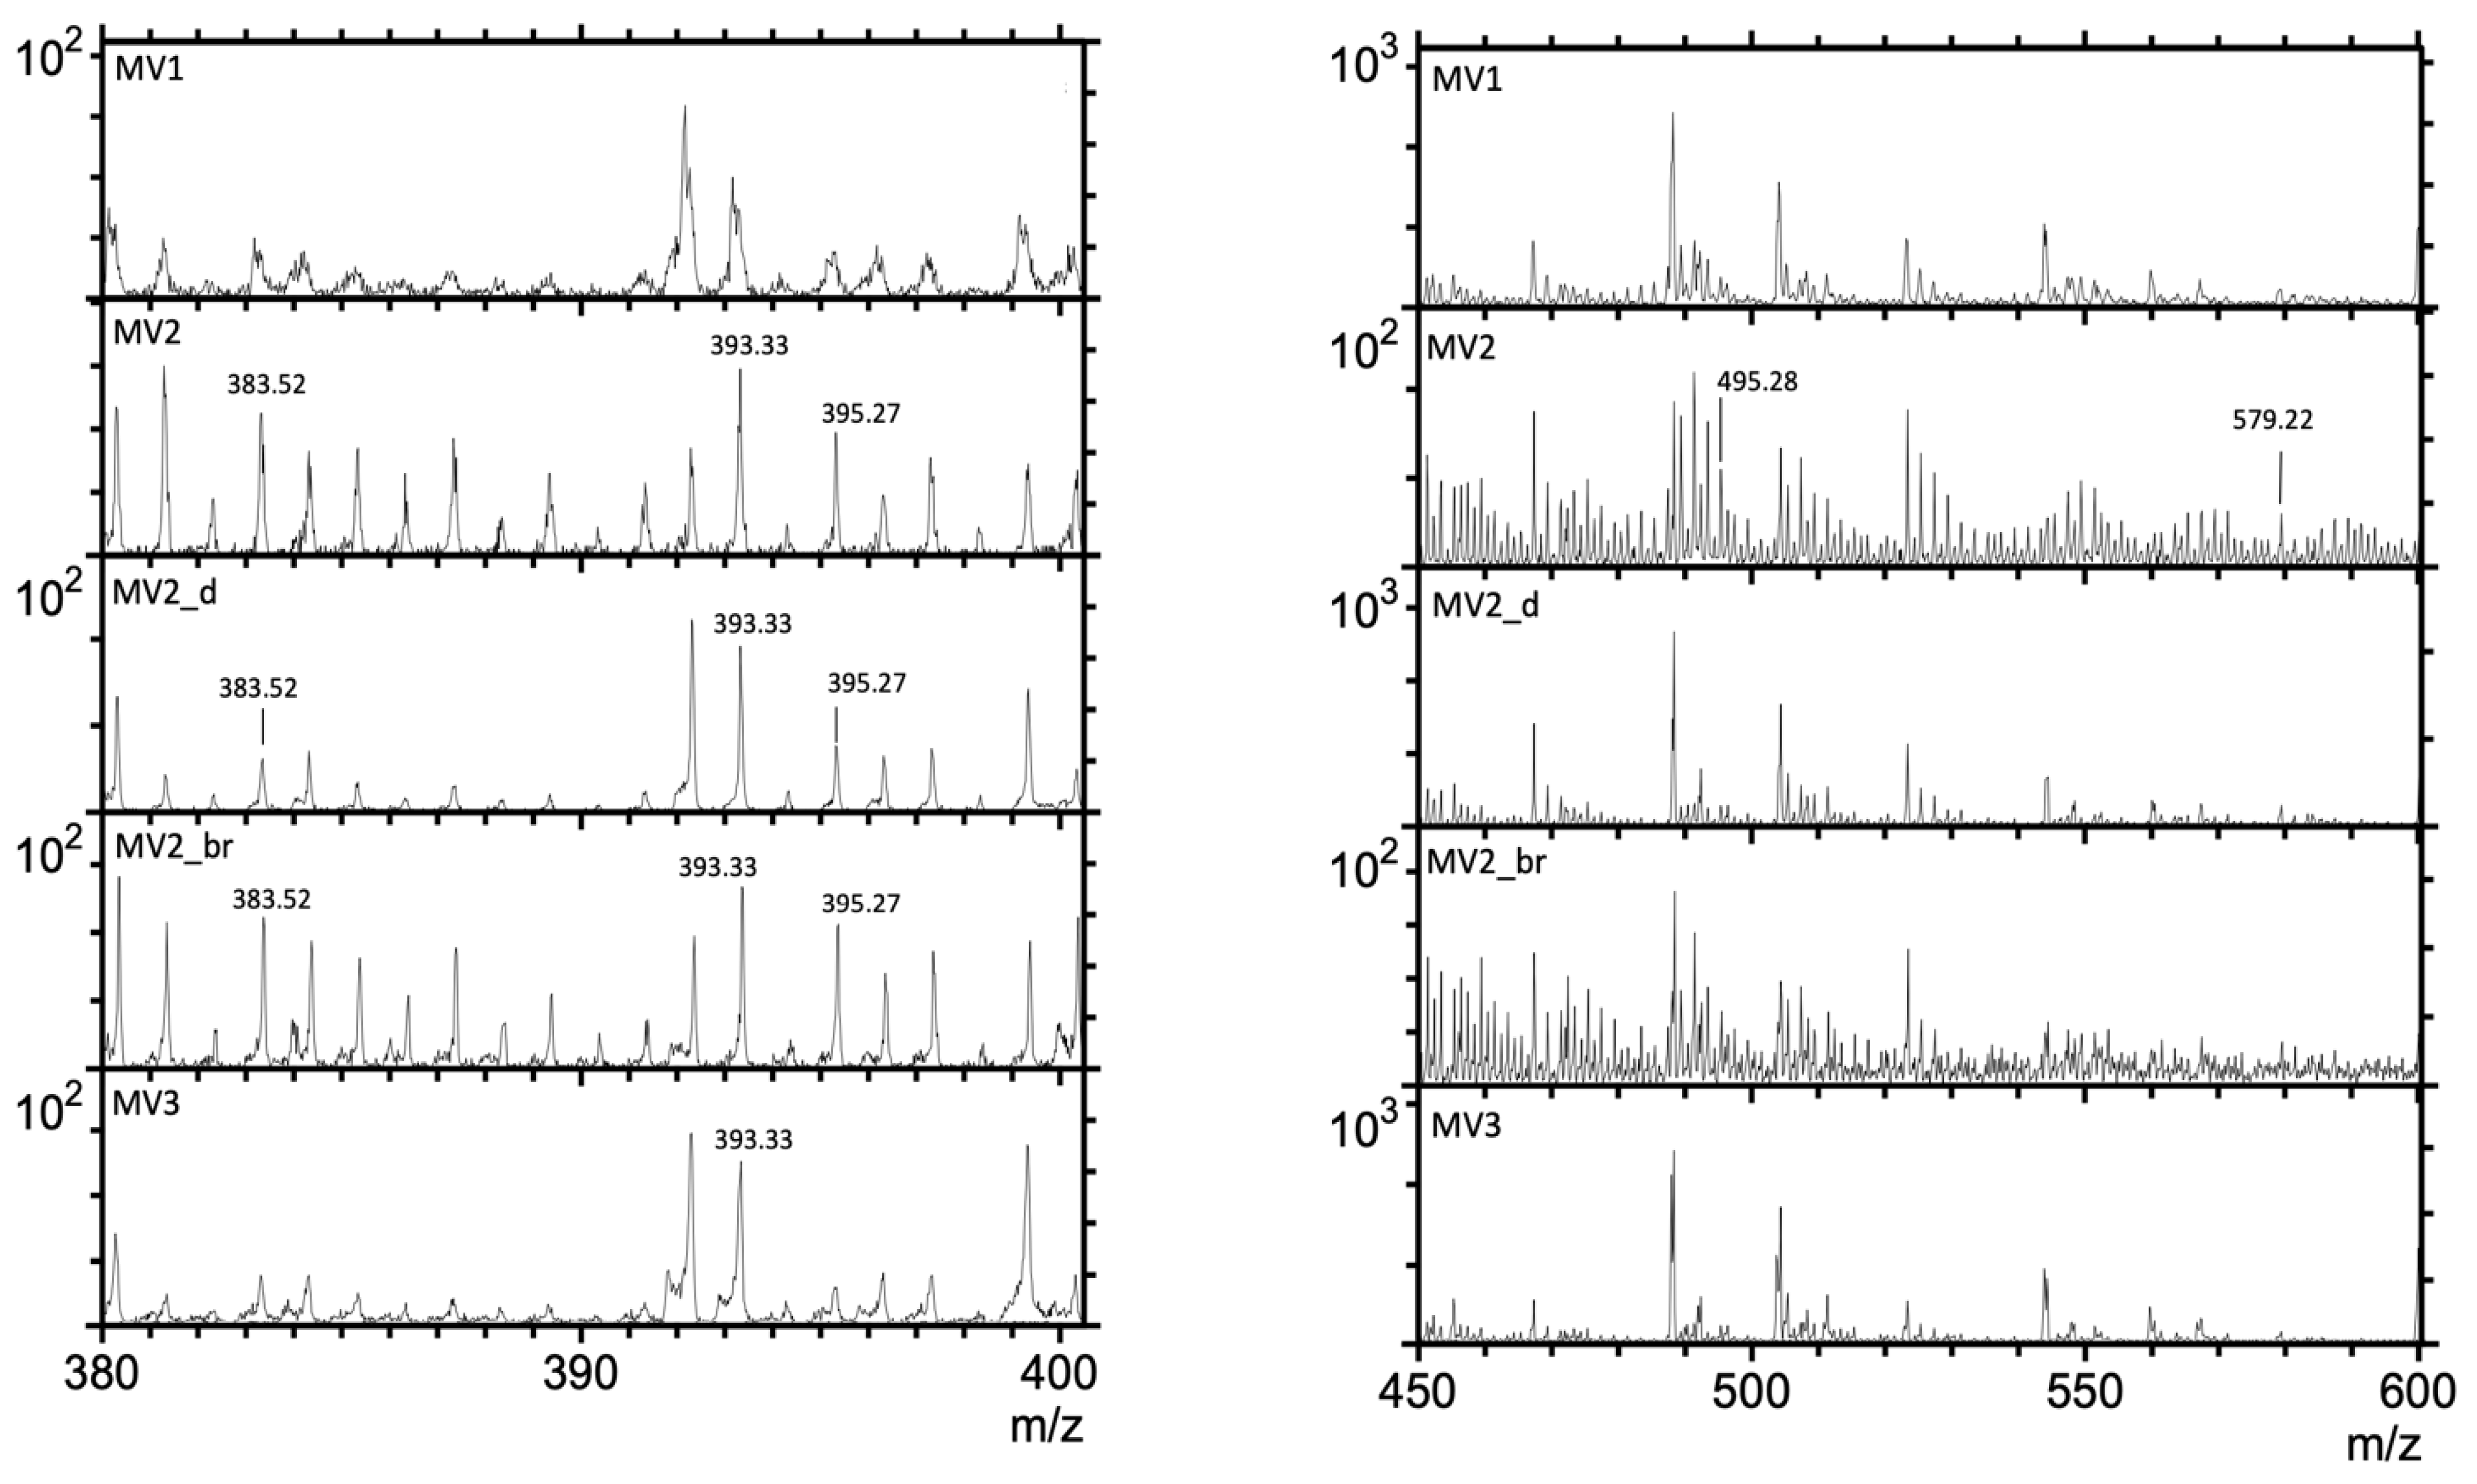
3.1. Time-of-Flight–Secondary Ion Mass Spectrometry (ToF-SIMS) Spectra

The positive secondary ions mass spectra were recorded for MV1, MV2, MV2_d, MV2_br, and MV3 in the range of mass-to-charge ratios (m/z) from 0 to 600. Figure 4 shows eight partial positive spectra in ranges of m/z 20–120, 180–200, 250–270, 280–310, 335–370, 380–400, and 450–600. The characterized inorganic chemical species constituting the carbonate rocks included Mg+, Ca+, CaOH+, Ca2O+, Ca2O2+, and Ca2O2H+. However, no Mg+ was detected in the MV3 sample. The Na+ and K+ ions were found in all samples but with varying intensities. The main microbial biomarker characteristic peaks are listed in Table 1, which shows the average measured masses in comparison to standard biomarker fragment masses of 17α(H),21β(H)-Norhopane, Hop-17(21)-ene or Hop-22(29)-ene (diploptene), non-isoprenoidal dialkyl glycerol diethers (DAGEs), and Diacylglycerol esters (DGs).

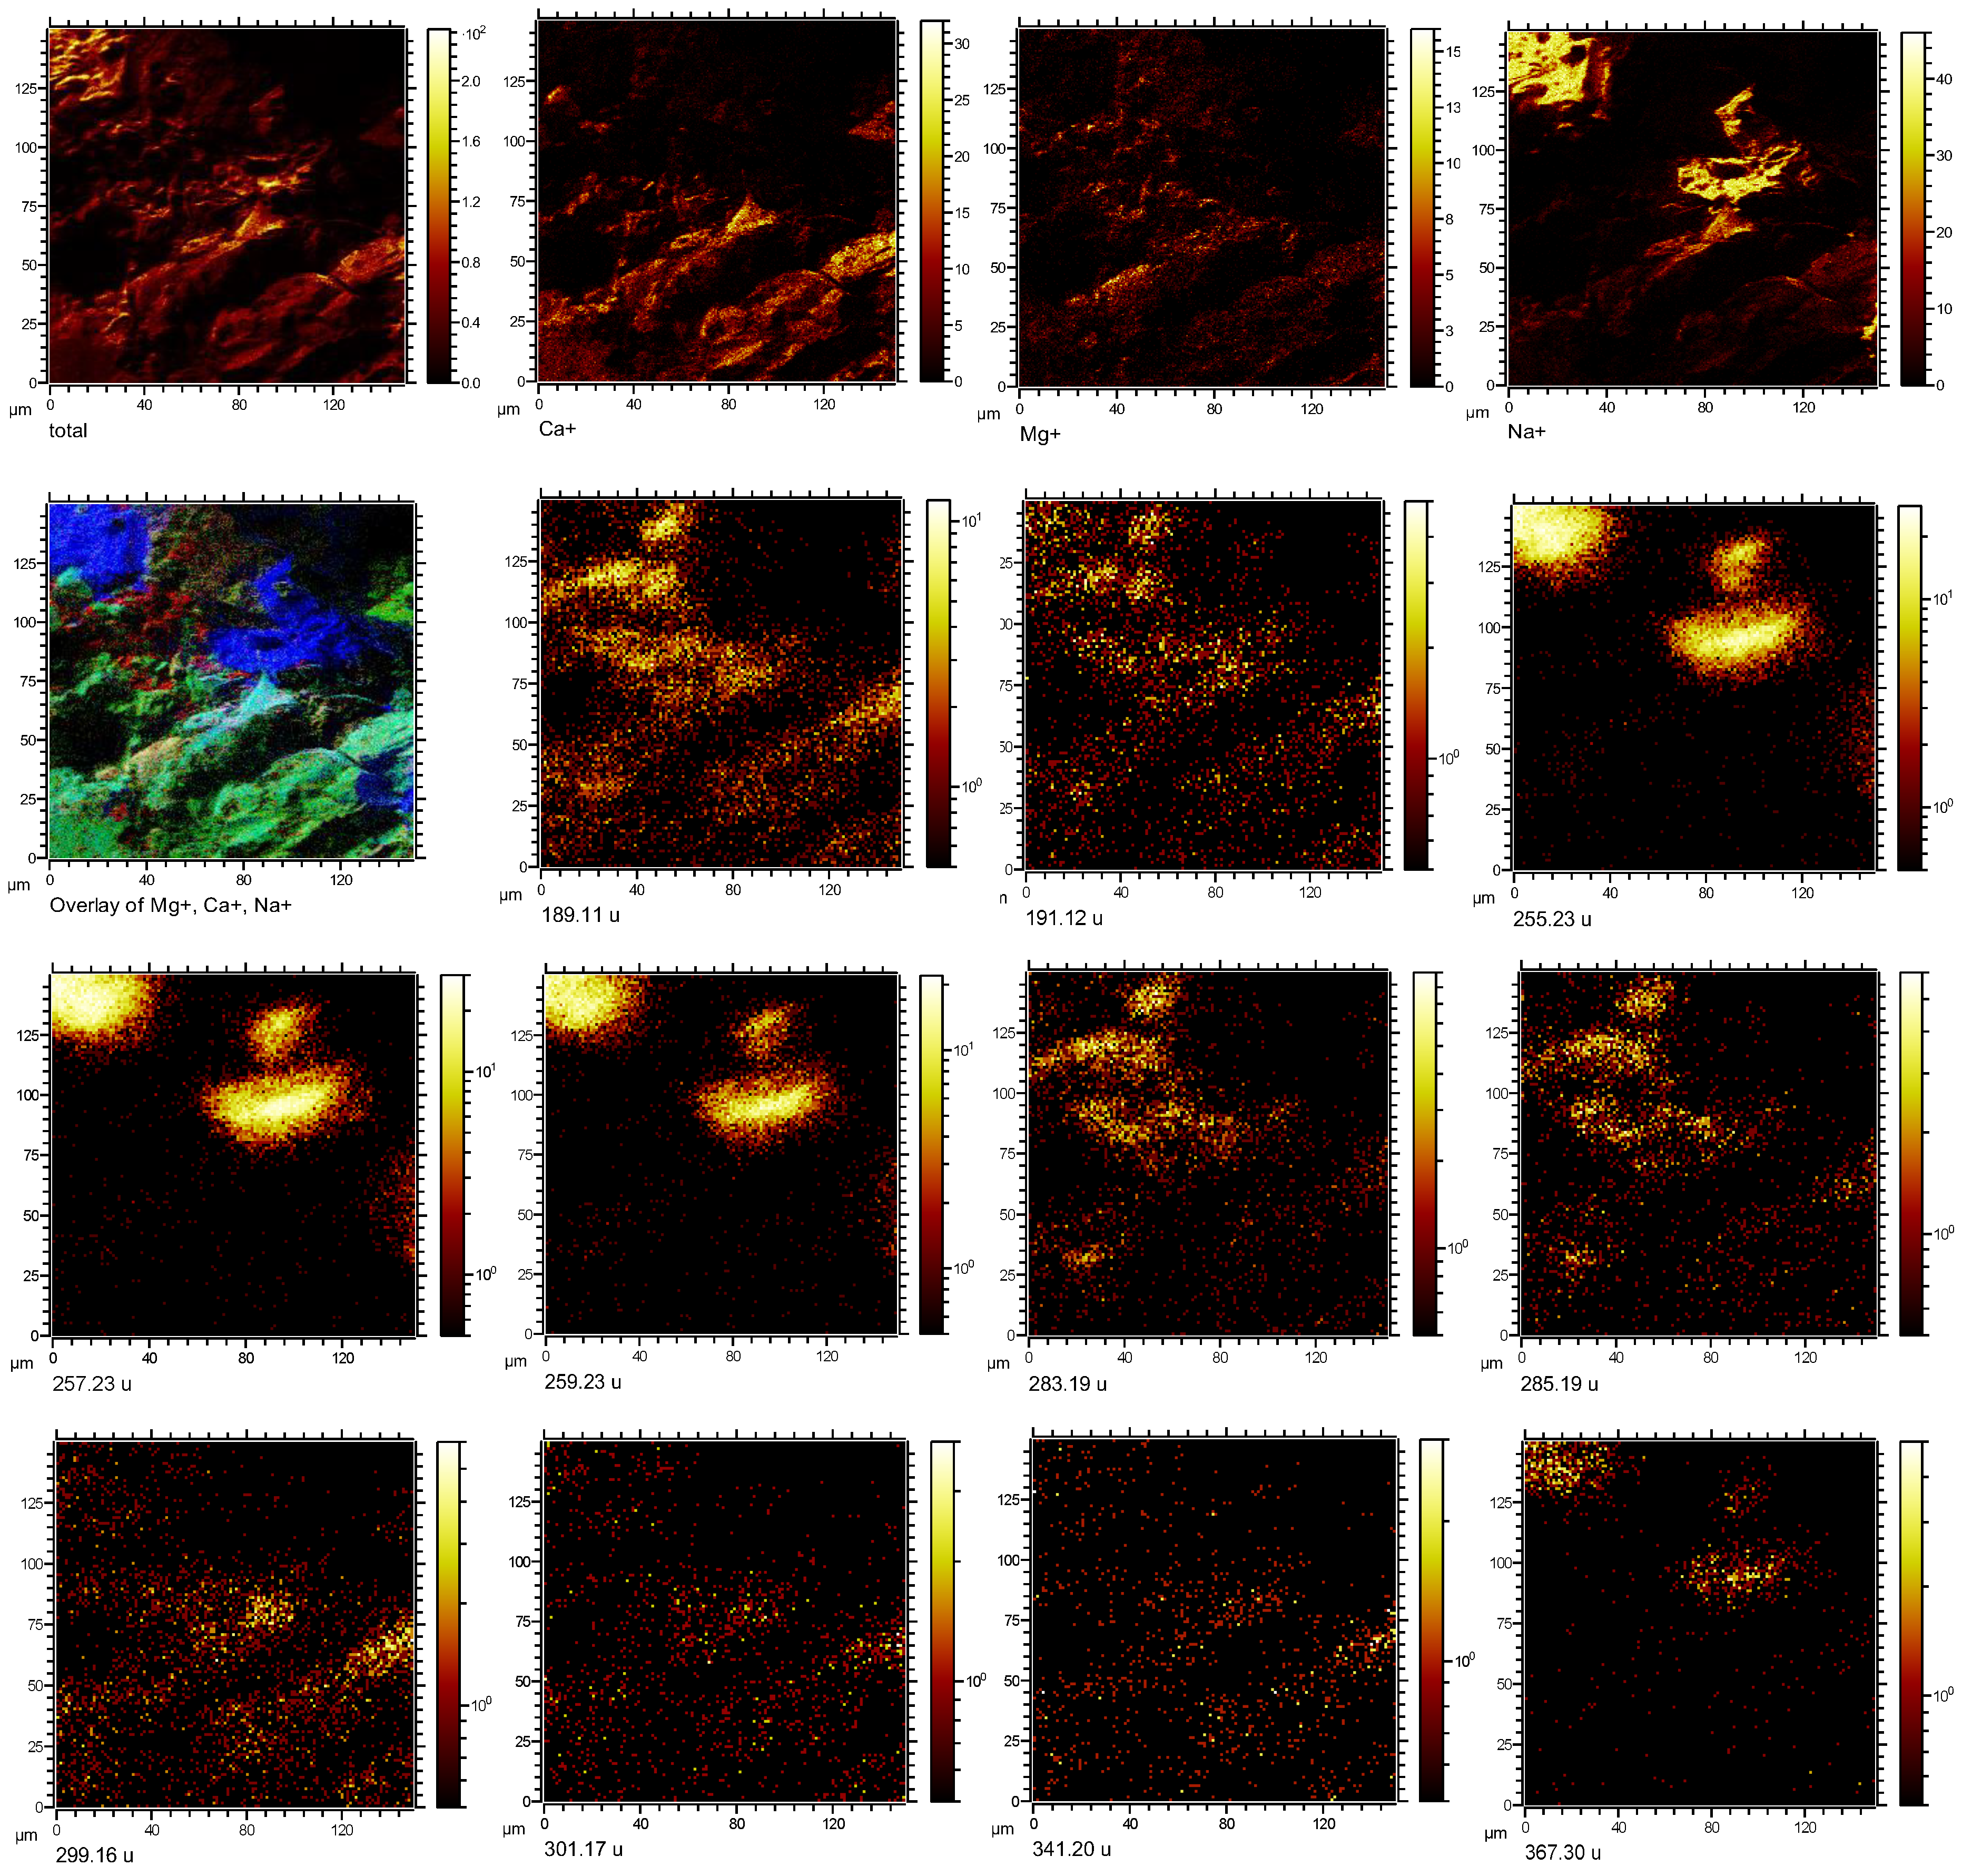
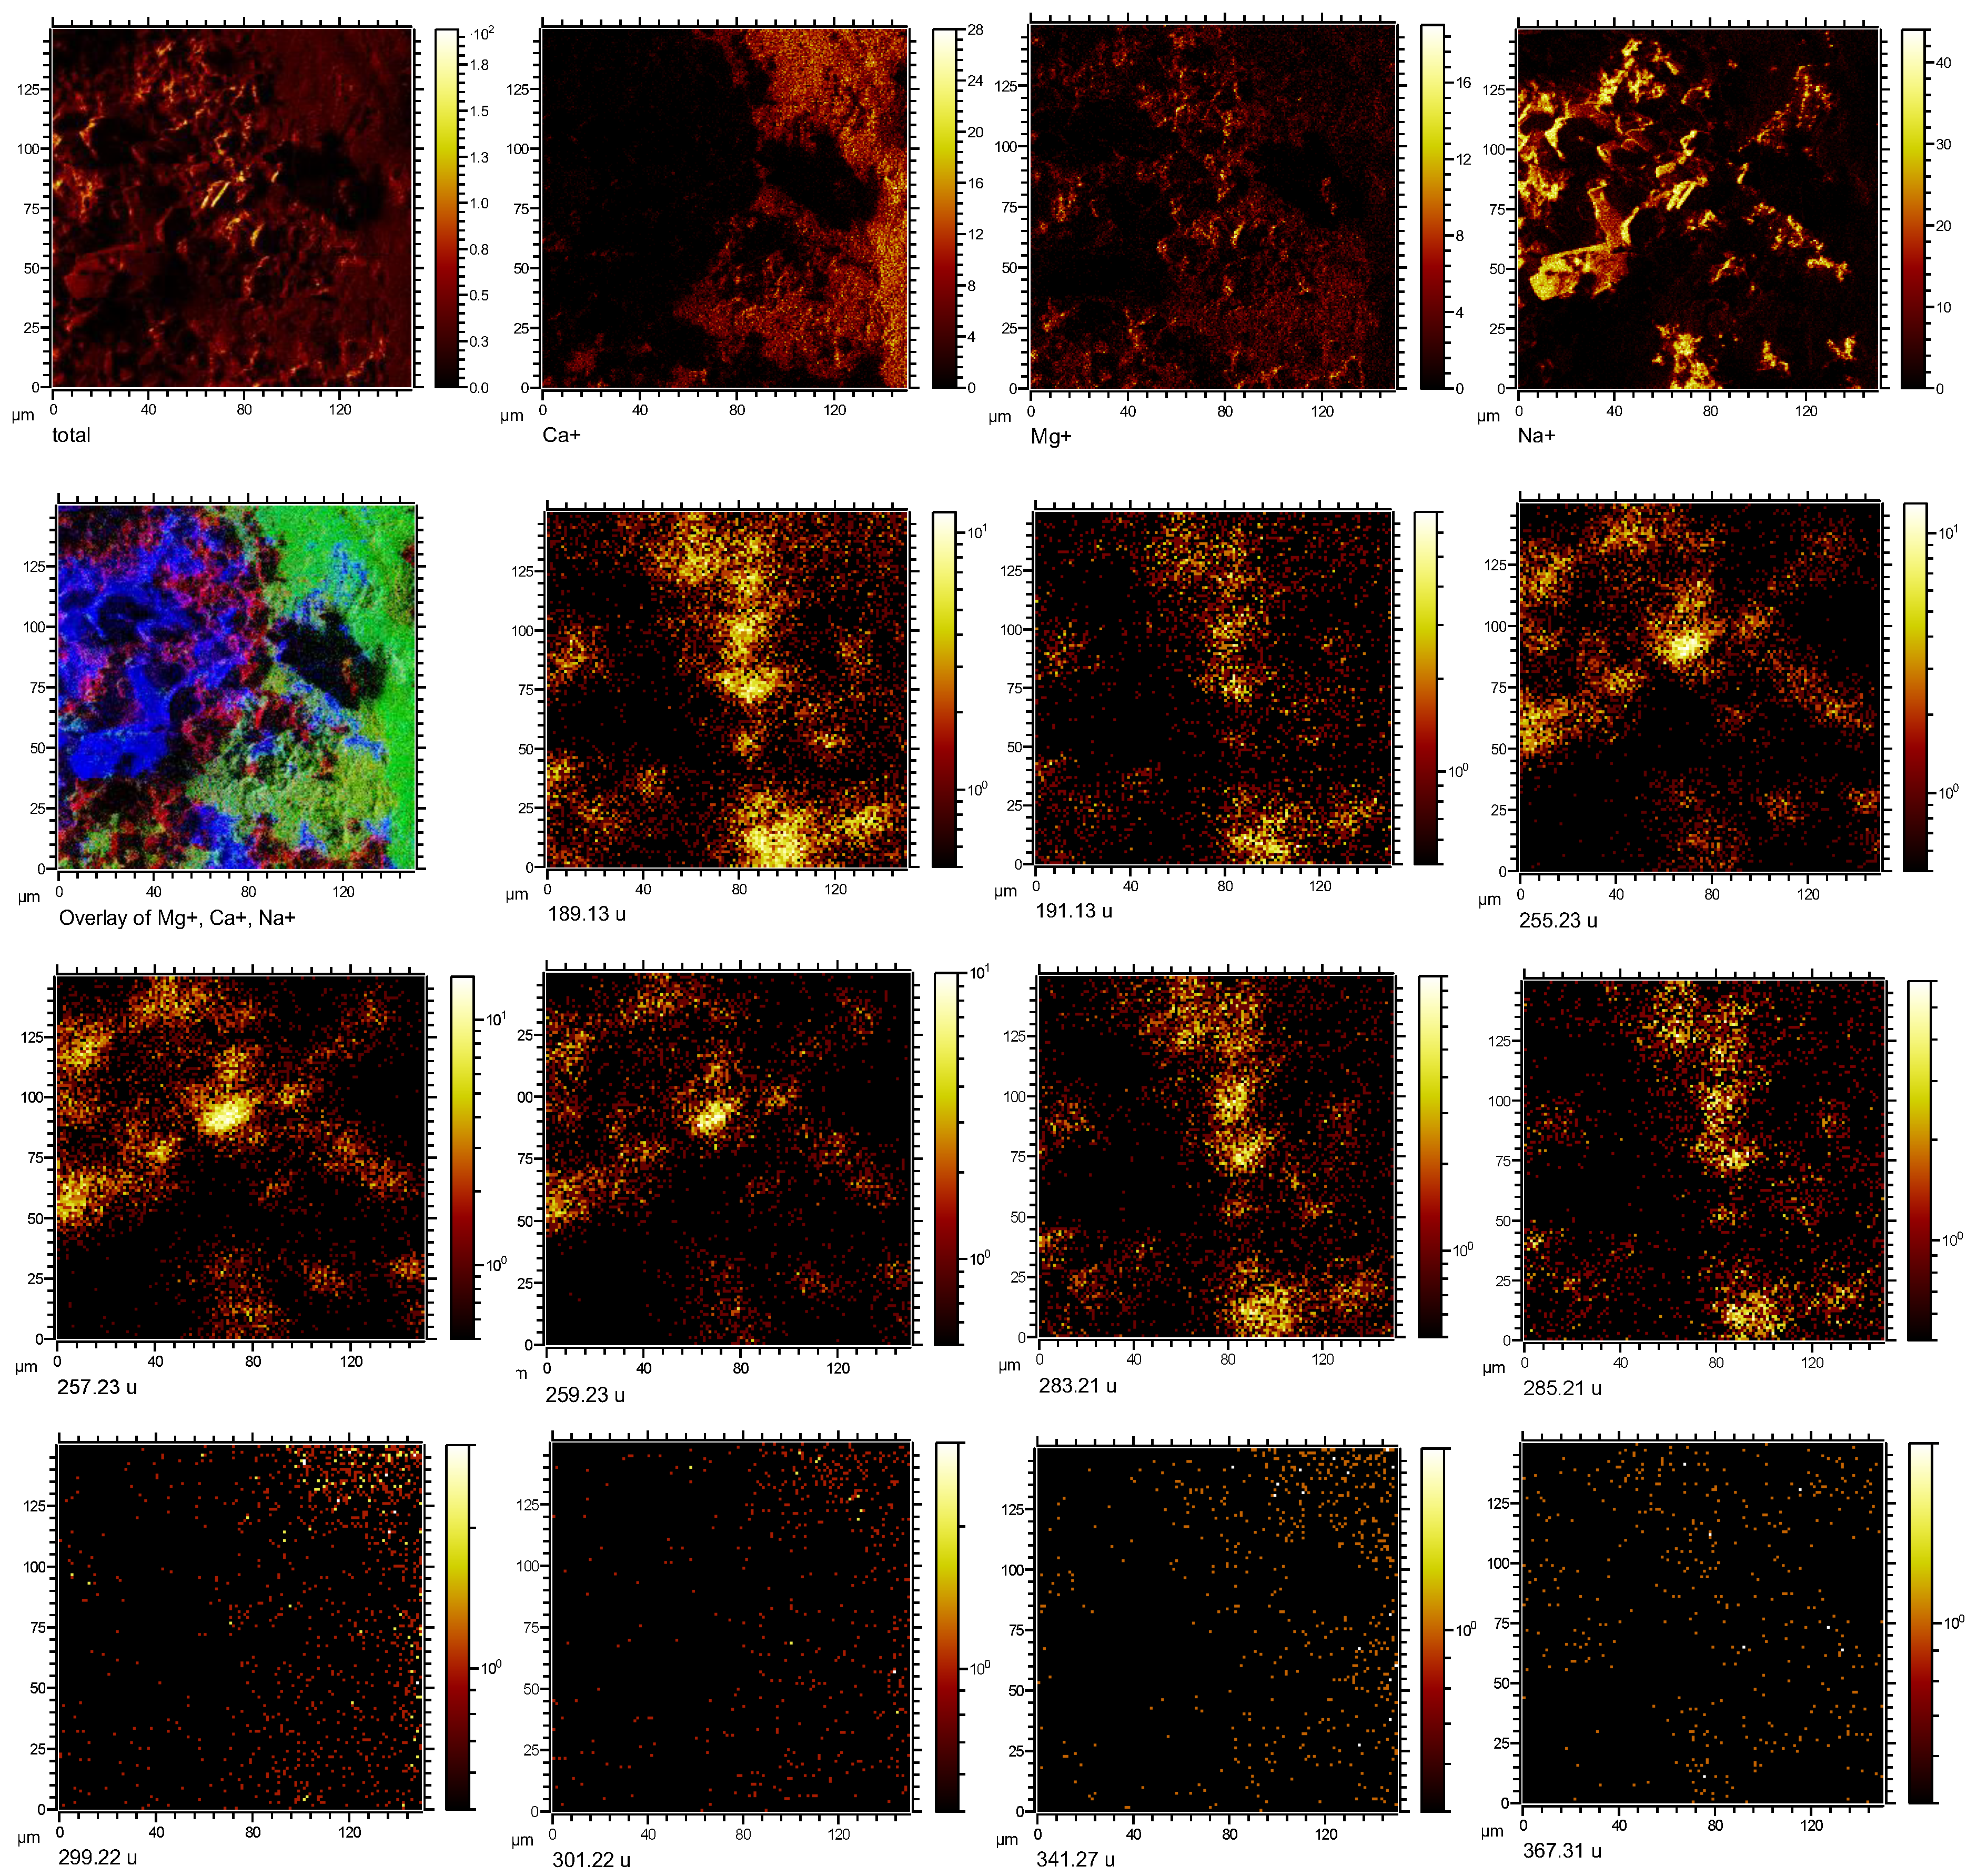
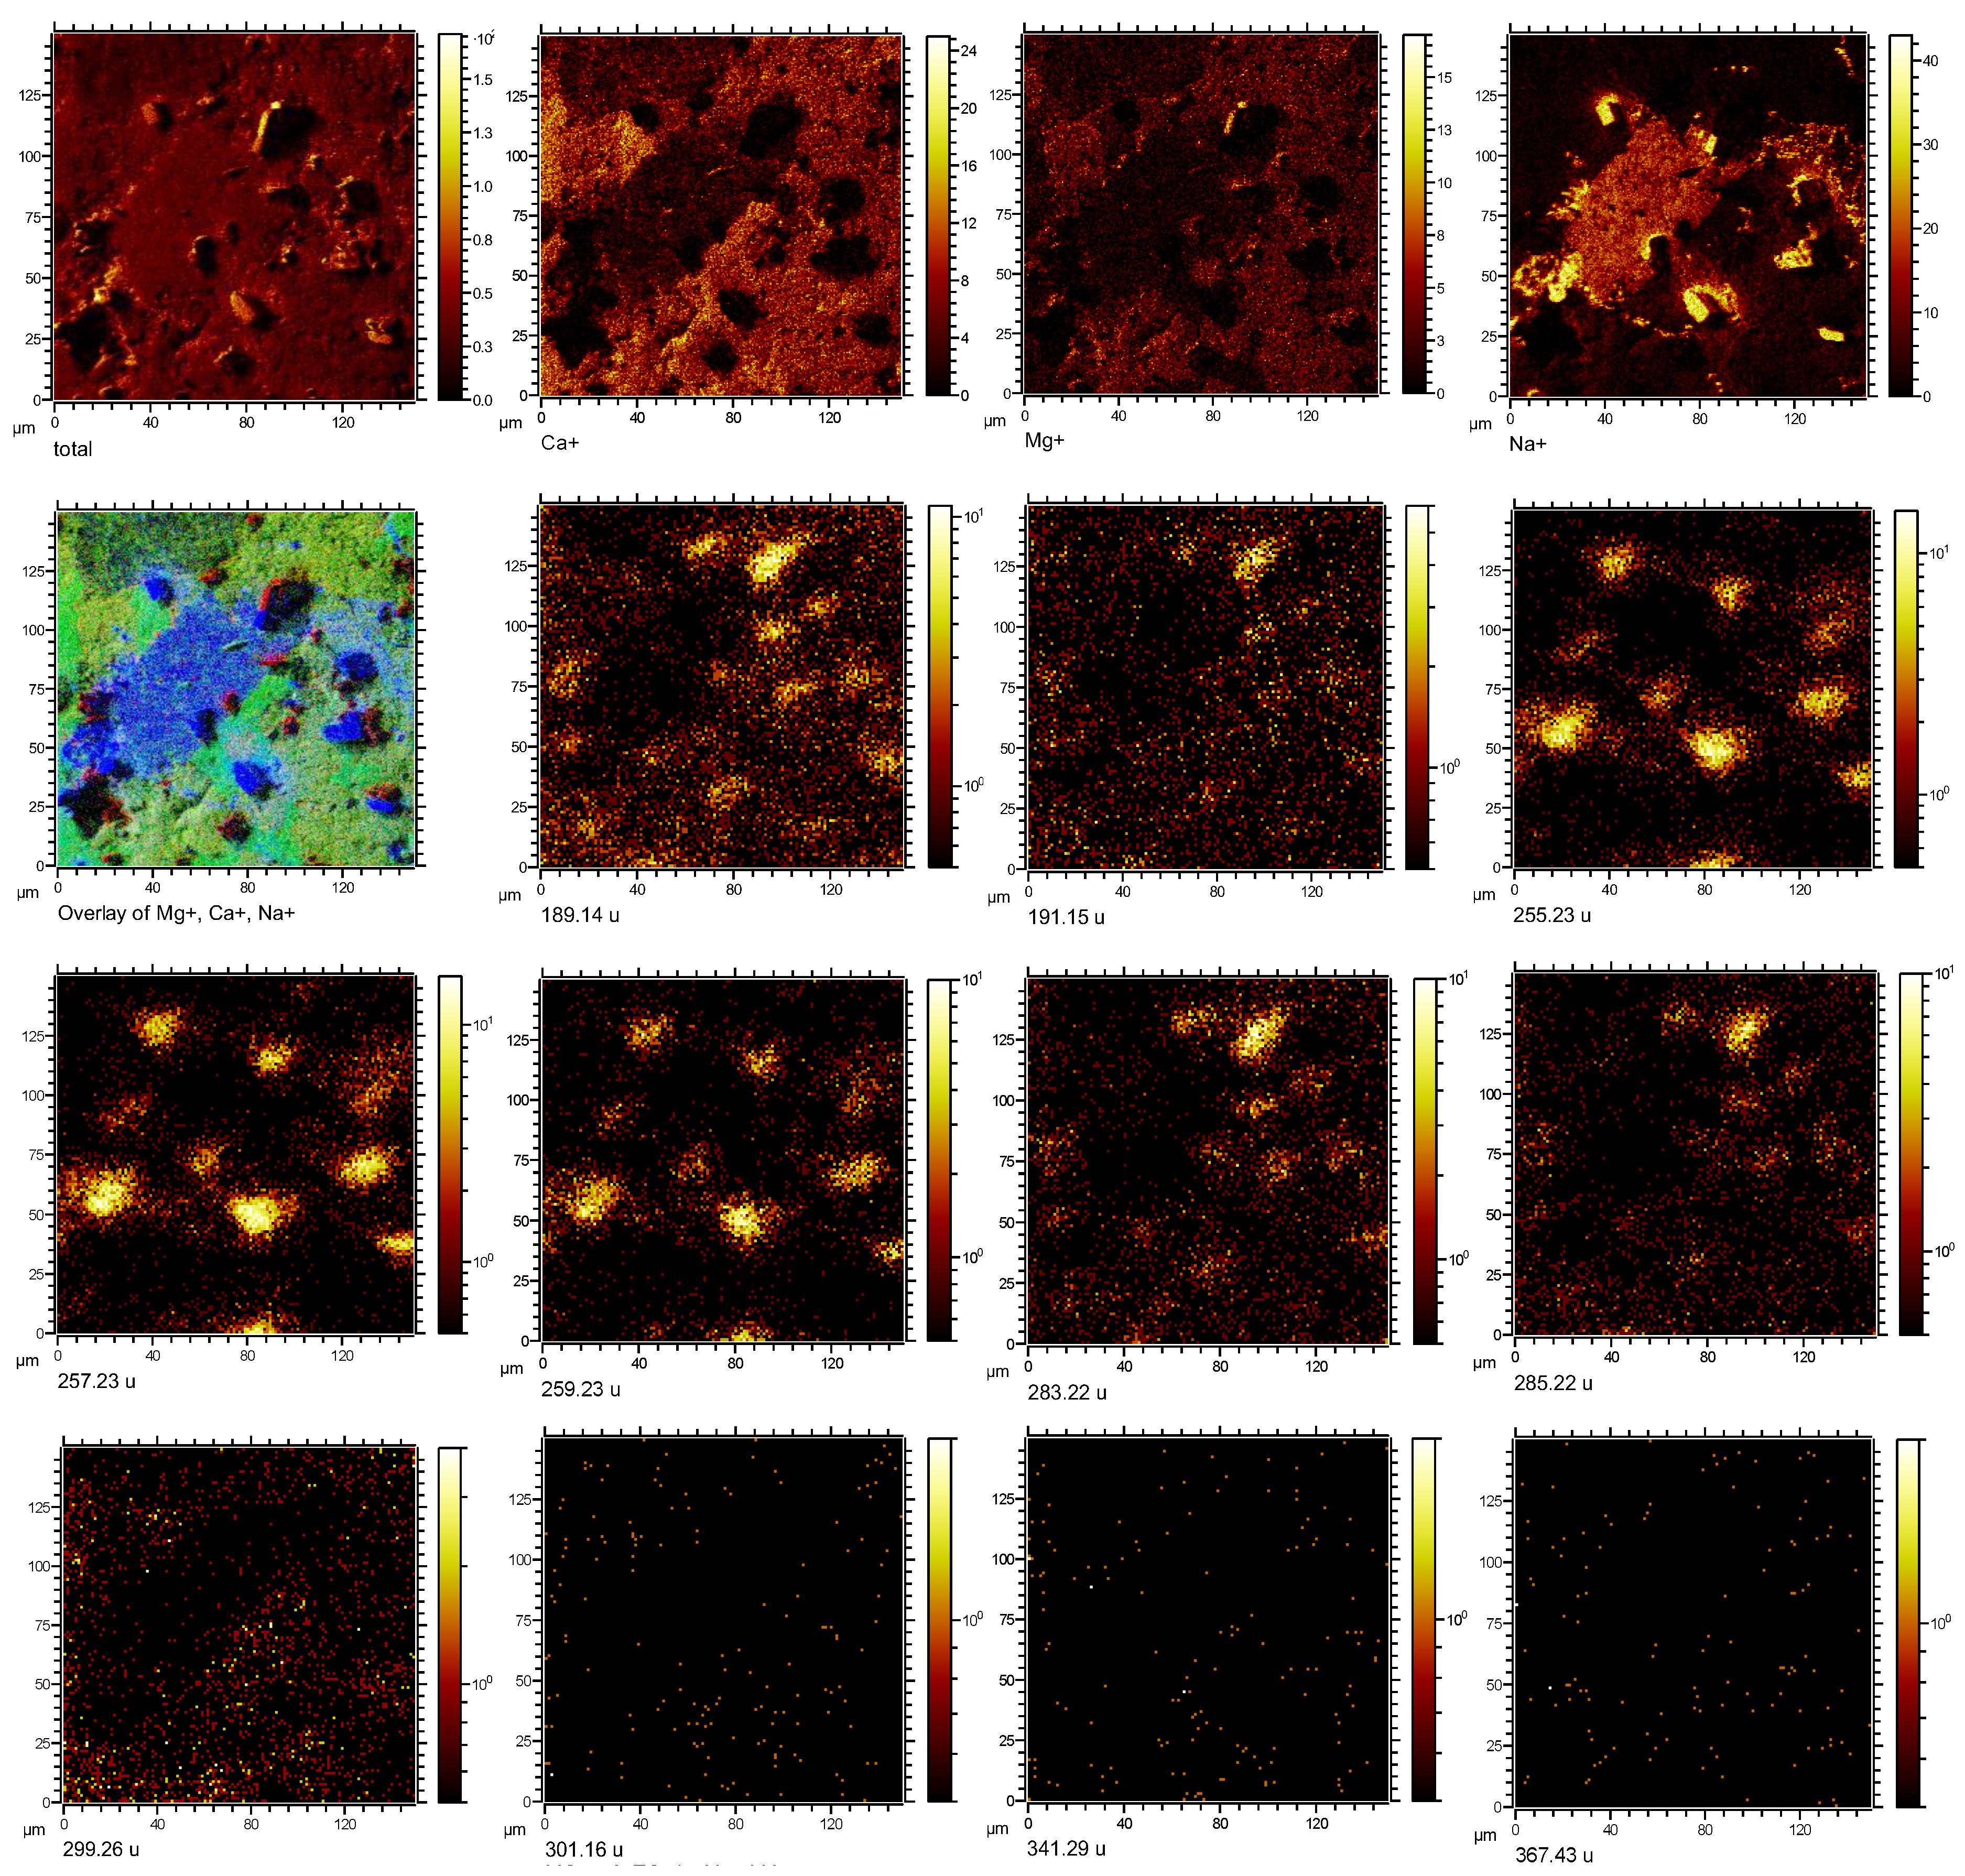
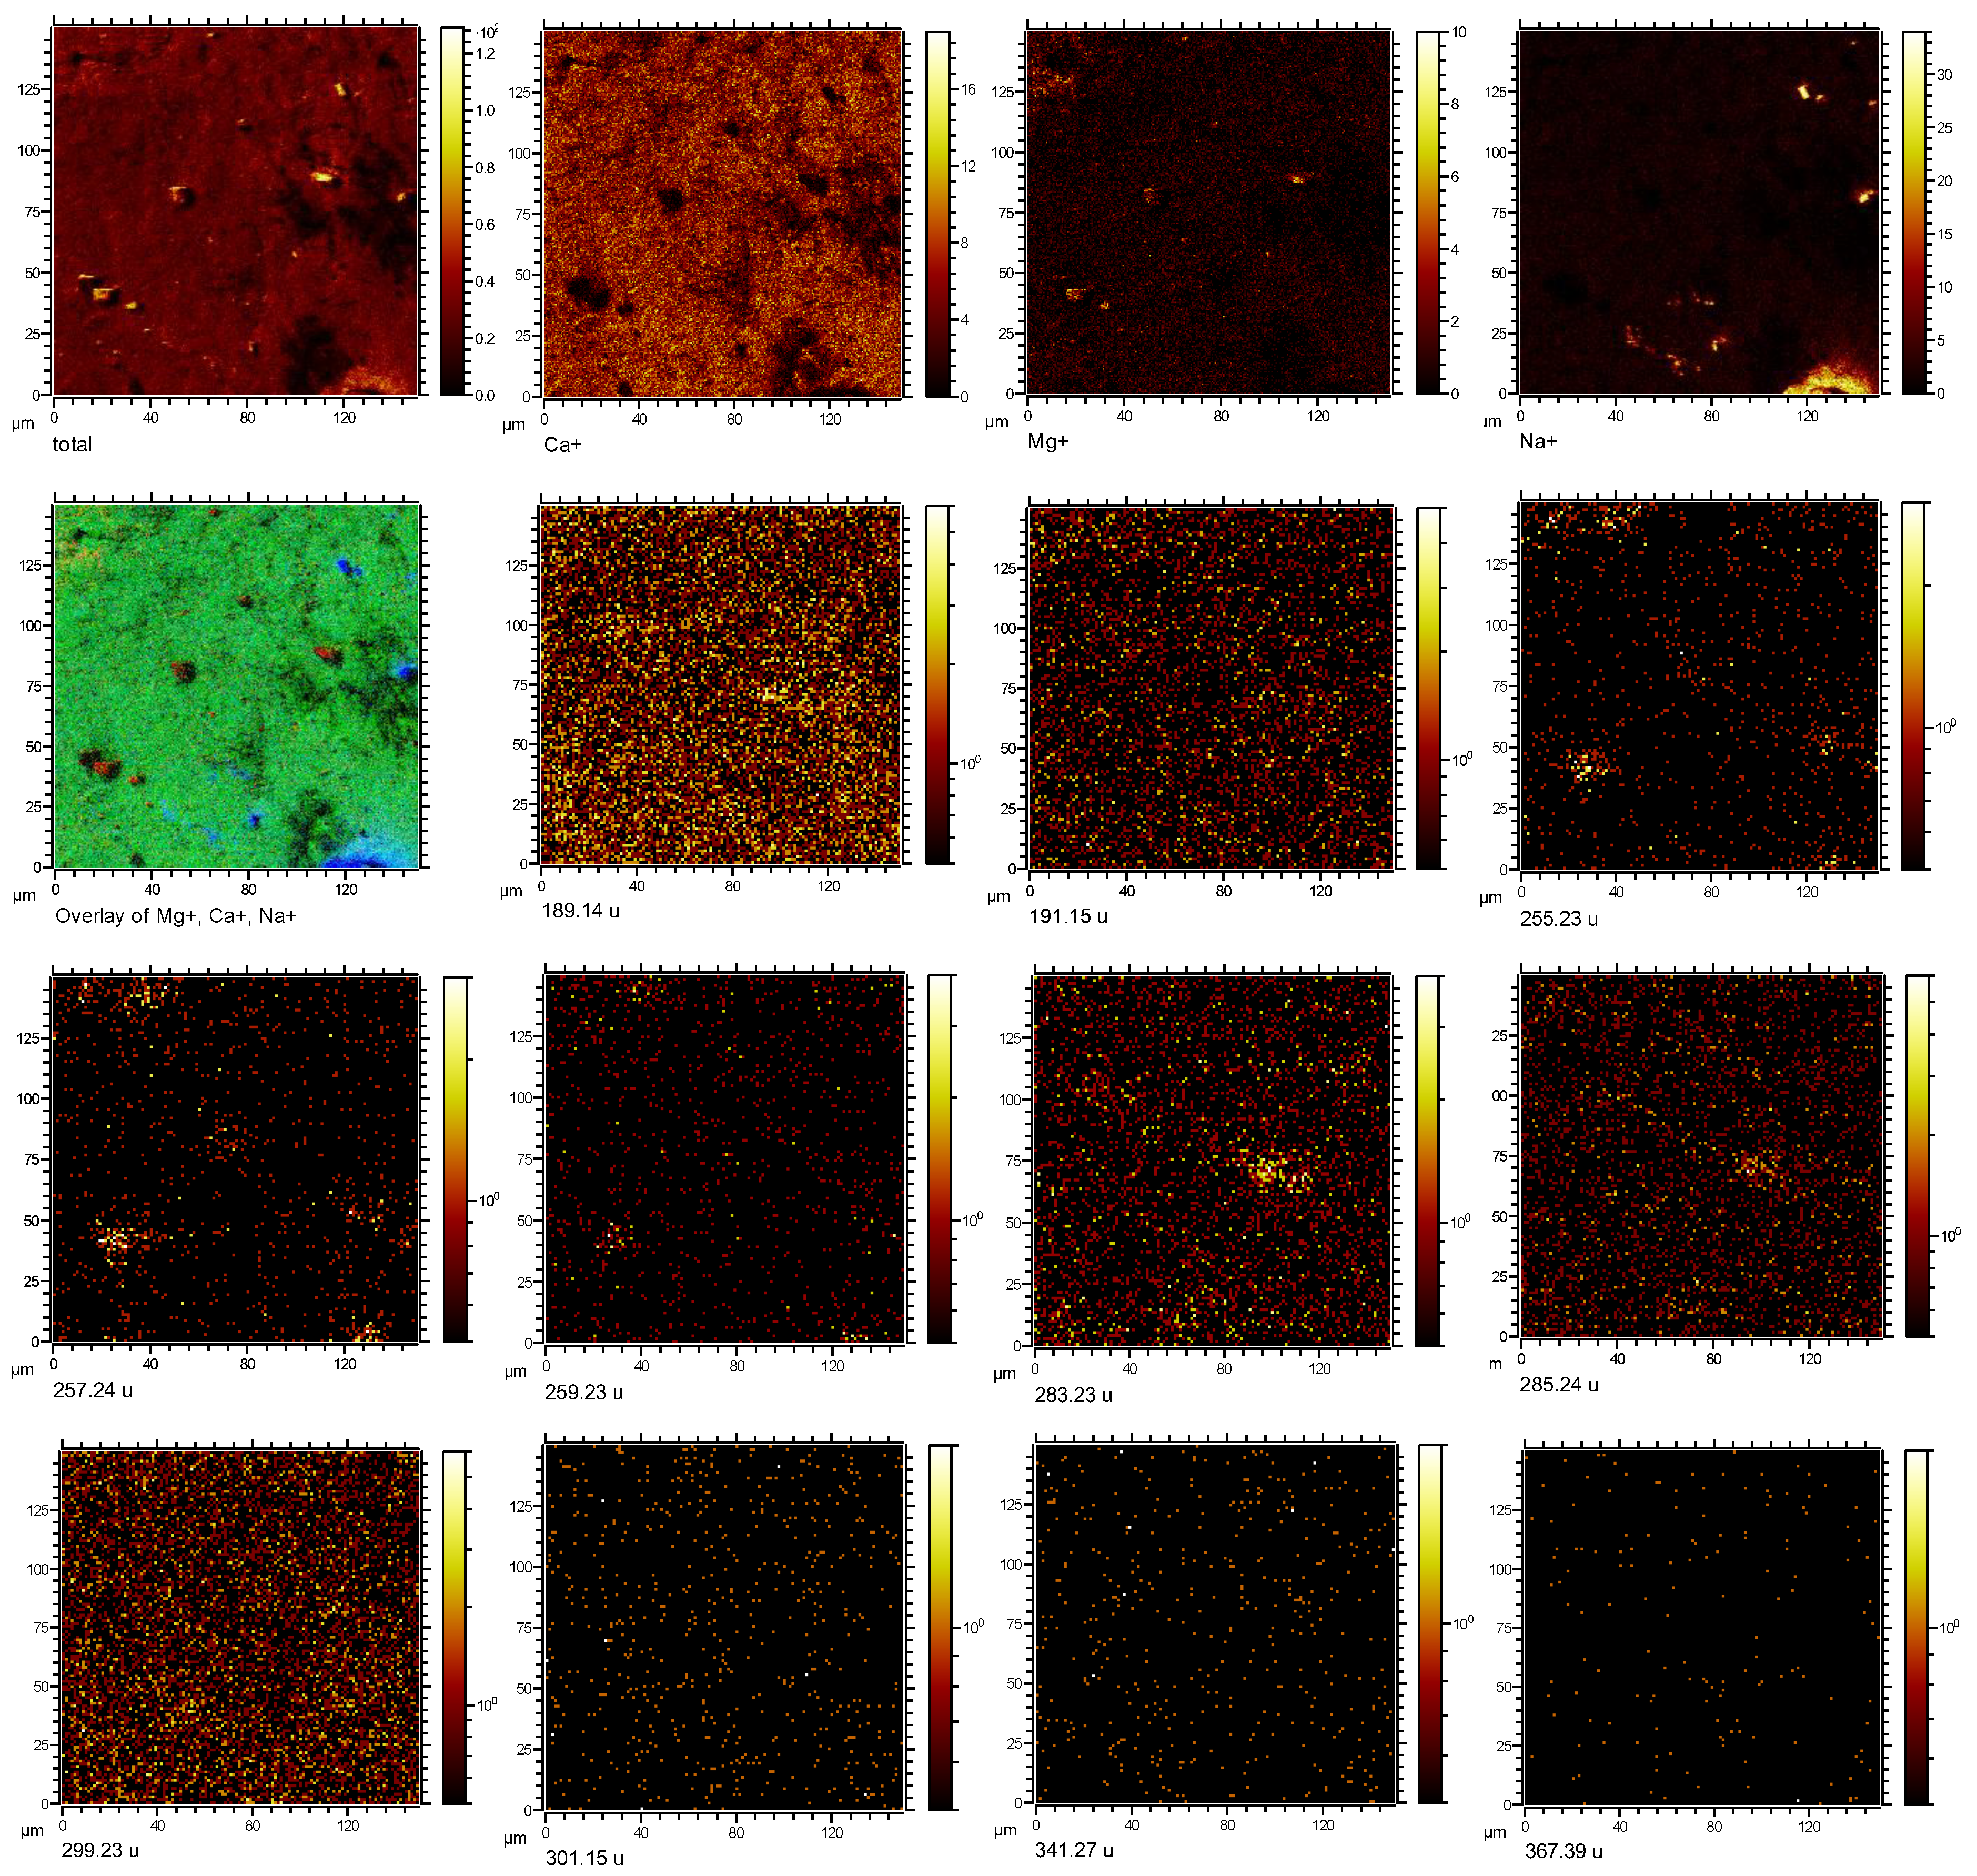
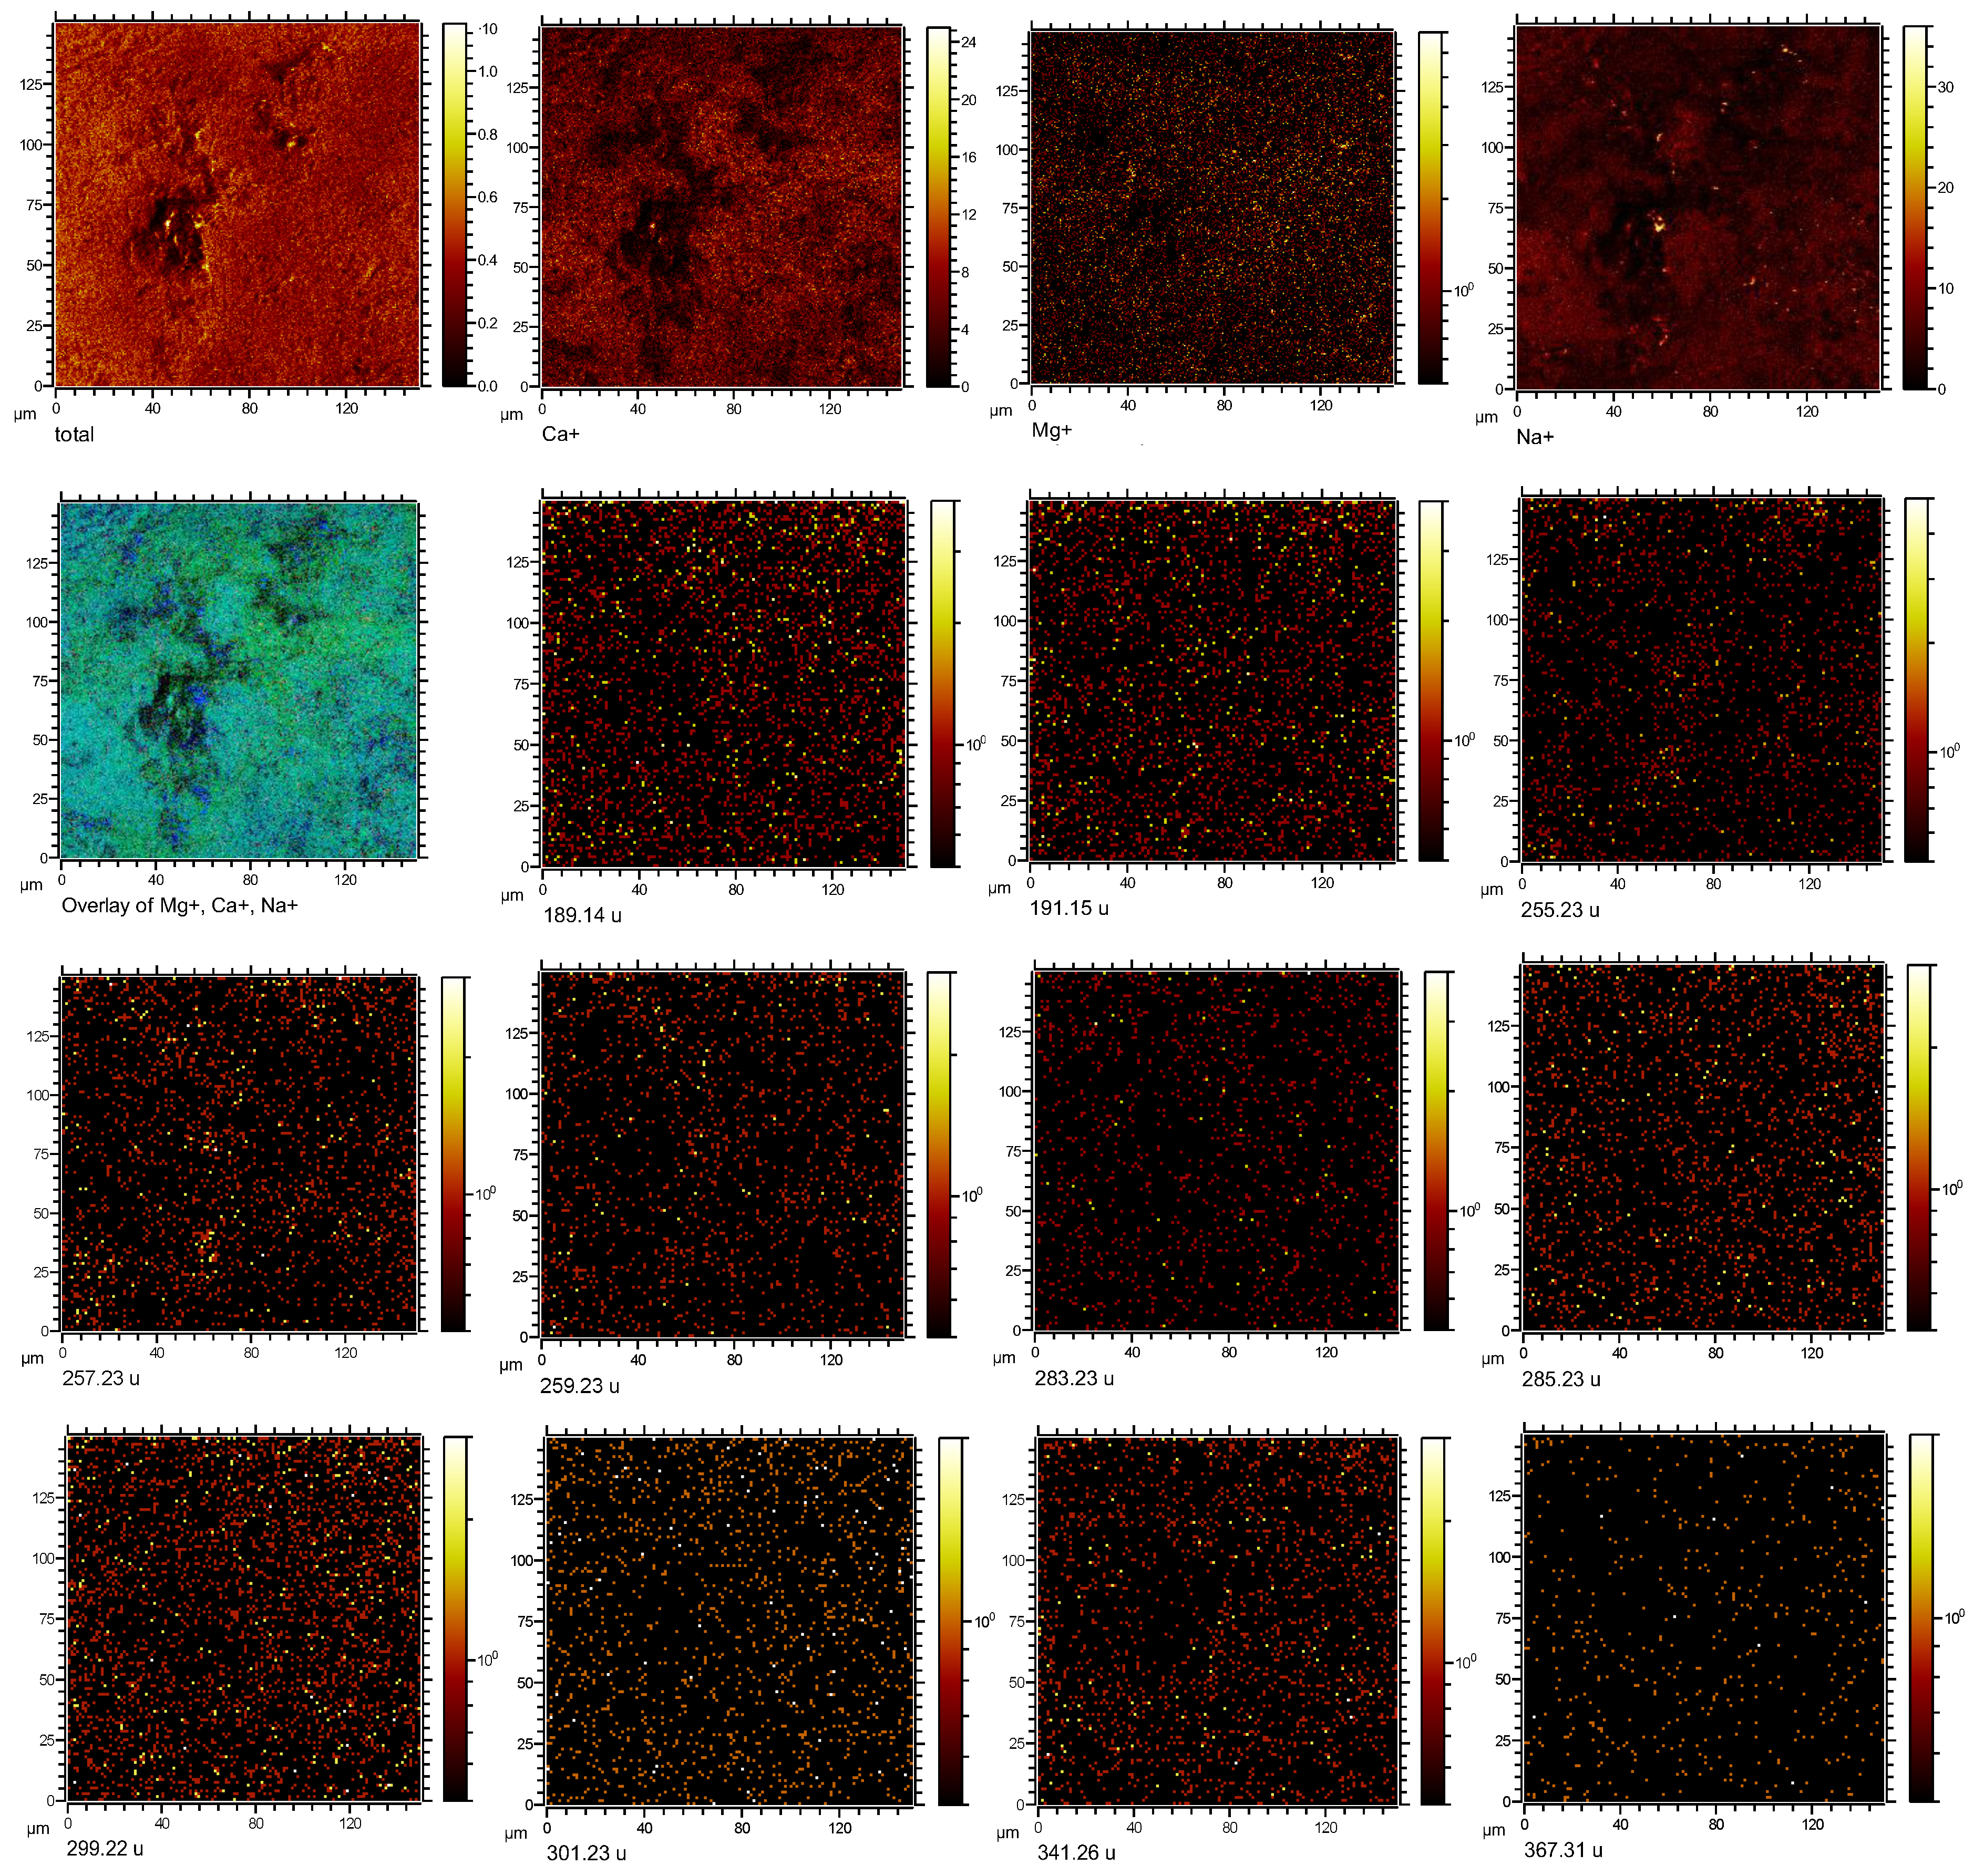
3.2. Imaging Microbial Biomarkers

The high-lateral-resolution images of total ions indicate the surface topography, and microscale regions of calcite/dolomite, dolomite, and halite are represented by the spatial distribution of Ca+, Mg+, and Na+, respectively. The overlay images of Mg+ (red), Ca+ (green), and Na+ (blue) demonstrate the association of dolomite with halite. Interestingly, the co-occurrence of dolomite and halite is evident through the analyzed samples as the high-spatial-resolution ion images of Mg+ and Na+ show intense signals in MV1 (Figure 5), MV2 (Figure 6), and MV2_br (Figure 7) but minor signal intensity in MV2_d (Figure 8) and MV3 (Figure 9).
The fragmentations of microbial biomarkers m/z = 255.23, 257.23, and 259.23 are co-localized with Na+ regions and display high signal intensity in MV1 (Figure 5), MV2 (Figure 6), and MV2_br (Figure 7). However, these fragments are absent in MV2_d (Figure 8) and MV3 (Figure 9), where we found a low signal intensity of Na+ in the corresponding ion images. The low signal intensity of m/z = 367.30 is co-localized with Na+ but it is only observed in MV1 (Figure 5). Other fragments of microbial biomarkers are co-localized with Mg+ regions including m/z = 189.11, 191.12, 283.19, and 285.19, and they are clearly depicted in MV1 (Figure 5), MV2 (Figure 6), and MV2_br (Figure 7). The fragments m/z = 299.16, 301.17, and 341.20 are co-localized with Mg+ in MV1, but with Ca+ in MV2 and MV2_br. The co-localization of m/z = 301.17 and 341.20 in both MV2_d and MV2_br is challenging due to their low signal intensity.
Remarkably, ion images of MV3 (Figure 9) show no contrast of microbial biomarkers and their signal is practically absent with a concomitant absence of Mg+ in the line mass spectra with very low Na+ signal intensity. Other microbial fragment masses detected in the mass line spectra (Figure 2) are m/z 383.74, 393.23, 395.28, 455.54, 495.38, and 597.30 which show very low signal intensity, and their co-localization with inorganic species is practically impossible. Thus, ion images of these fragments are not presented.

4. Discussion

4.1. Microbial Biomarkers Related to Hydrocarbon Seepage

Dolomite formation on the top lithologies in Kuwait was earlier proposed to be related to microbial oxidation of the seeped hydrocarbons [46], but evidence of microbial involvement was absent. Later work on the Miocene mud volcano inferred the role of AOM consortia on surface dolomite from the geochemical signatures of cerium (Ce/Ce *) and europium (Eu/Eu *) anomalies that imply strictly anoxic conditions and sulfate reduction to sulfide, respectively [47]. This present study probes the relationship between microbes of the Miocene age and authigenic dolomite by investigating microbial lipid biomarkers. These biomarkers were anticipated to be related to hydrocarbon/methane metabolism based on lithological structures, pockmarks, and geochemical signatures [47].
ToF-SIMS analysis was performed at the positive polarity as the formerly described minerals of calcite, dolomite, and halite (evaporite) were prevailing in the study area [13,47,51] and are conceivably implied from the positive metal cations of Ca+, Mg+, and Na+, respectively. Also, standard references of biomarker diagnostic fragments of the expected AOM consortia are dominant in the positive mode spectra [50]. Fragmentation of large molecules is common in mass spectrometry where weak bonds tend to break and stable fragments tend to form. In the aliphatic carbon skeleton (DAGEs and DGs), the fragmentation at a branch point is favored in order to give a more stable carbocation, while in aromatic rings (hopanes), the benzylic cleavage gives resonance-stabilized carbocations [52]. Thus, ToF-SIMS biomarker results represent masses of lipid fragments instead of the large lipid molecules (Table 1). The fragmentation of organic compounds commonly occurs during ToF-SIMS primary ion bombardment, generating multiple fragmental peaks within the corresponding mass spectrum. Notably, every organic molecule exhibits a distinguished fragmentation pattern, allowing the identification of entire molecules [53]. The diagnostic fragment peaks can provide insights into the original organic molecules [54].
The revealed major fragments of biomarkers from this study were cross-referenced with standard documented molecules in the literature. Interestingly, the same biomarker fragments were found in similar environments and are indicative of microbes engaged in the anaerobic oxidation of methane [50]. According to the literature, hopanes (norhopane and diploptene) were detected in fluid inclusions of Ordovician source rocks in an oil seep environment [54] and their fraction was representative of the portion of the original oil remaining in the rocks [55]. The presence of hopanes in fluid inclusions may suggest an association of hydrocarbons with AOM consortia since these microbes can utilize hydrocarbon as a source of energy [56]. The Miocene mud volcano in Kuwait has shown evidence for both findings of oil seepage and AOM consortia utilizing hydrocarbon [45,47], which corresponds to hopanes presence. Moreover, the detection of diploptene provides evidence for methanotrophs [57], further supporting the methanotrophy process that led to dolomite formation in the study site [47].
Regarding the DAGEs ether lipids, early work has shown their exclusive biological source to be the thermophilic-sulfate-reducing bacterium Thermodesulfobacterium commune [58]. In general, the abundance of DAGE biomarkers in seep-related carbonates indicates the involvement of SRB in methane oxidation [59,60] and they can be found in carbonate crusts within mud volcanoes [61]. The detected DAGE ether lipids in deposited carbonate and mud rocks of the Early and Middle Triassic (250–240 Ma) imply the paleo-redox conditions related to simultaneous bacterial sulfate reduction and methane oxidation [62]. Similarly, the inference of DAGE biomarkers within Miocene dolomite in Kuwait shows correspondence with previous geochemical signatures, indicating the input of hydrothermal fluids, methane oxidation, and sulfate reduction at the time of dolomite formation [47]. The identification of DAGE biomarkers holds the potential to expand the characterization of the ancient microbial community that existed in the Miocene mud volcano in Kuwait during the formation of dolomite, indicating that sulfate-reducing bacteria were not only halophilic, but also thermophilic. Collectively, the identified biomarkers align with the implications of previous geochemical signatures of the study site and agree with the characterization of comparable biomarkers from analogous environments.

4.2. Co-Localization of Microbial Biomarkers within Dolomite

Ion images of biomarker fragments show a co-localization pattern of hopanes (m/z 189.11, 191.12, and 259.25) and DAGEs (m/z 255.23, 257.23, 283.19, and 285.19) with dolomite and halite in MV1, MV2, and MV2_br. Since the biomarker fragments m/z 255.23, 257.23, and 259.25 have shown consistent signal intensities over all samples with Na+ ion images, we suggest that these fragments belong to the same molecule; however, the reference spectra show that m/z 255.23 and 257.23 are fragments of DAGE C29H58O3 but m/z 259.25 is a fragment of norhopane C29H50. Remarkably, bacterial glycerol ether lipids have shown their potential in supporting cell resistance to extreme environmental conditions in mesophilic-marine-sulfate-reducing proteobacteria where dialkylglycerols were the dominant cellular lipids [63]. This fact can be evident for DAGEs to be relevant to halophilic SRB whereby halophiles exhibit a tolerance of different extreme conditions of sabkha including lethal radiation, high temperatures, shortage in oxygen, and exposure to heavy metal [64].
The collateral anaerobic oxidation of methane and sulfate reduction can occur in hypersaline environments, such as Mercator mud volcanoes, where the salinity of the sediments reaches 29% [65]. This is relevant to our case as the studied mud volcano is not typical but rather an evaporitic where features of hydrocarbon seepage and evaporite coexist [48]. A compelling case highlighting the potency of microbial biomarkers to identify ancient hybrid geologic events is the characterization of AOM biomarkers within authigenic carbonates deposited during the Messinian salinity crisis in Sicily and the northern Apennines [66]. As dolomite is associated with evaporites [67], the co-occurrence of dolomite with halite and the co-localization of AOM consortia with both dolomite and halite at µ-scale regions are suggestive of the formation of the Miocene dolomite as the result of the interaction between the hypersaline sabkha and the marine mud volcano [47]. The high salinity contributes to the increase in fluid ionic strength with the consequent dehydration of the magnesium hydration shell (Mg-H2O) and subsequently the release of available magnesium ions for dolomite nucleation [68]. Microbes can adapt to high-salinity environments by modifying the chemistry of their surfaces, leading to the subsequent binding of Mg2+ ions and the nucleation of dolomite [18,24].
The co-occurrence of dolomite, halite, and AOM biomarkers suggests a link between the preferential dolomitization process and the interaction of the high Mg/Ca flooding sabkha with the authigenic carbonates of the mud volcano. The high signal intensity of the microbial biomarker pattern within dolomite and its absence in the dolomite-lacking sample suggest the close proximity of microbes to dolomite rather than calcite. The intense biomarker signals within dolomite microscale regions may support the hypothesis of laboratory-based experiments on the microbial involvement in dolomite formation [27,69,70]. The microbial role includes (1) increasing pH and alkalinity, resulting in an increase in dolomite saturation state [69]; (2) overcoming the dolomite kinetic barrier [71], and (3) dolomite nucleation on microbial cell walls [72]. In natural hydrocarbon seeping environments, dolomite formation is prompted by the syntrophy between microbes capable of anerobic methane oxidation and sulfate reduction [46,73] that oxidize methane [8,60] with the accompanying rise in carbonate alkalinity [74]. A similar discovery to our findings is Marmarito dolomite from Marmarito limestone in Italy, which was associated with organic-rich microbial overgrowths and microbial organic matter, resulting in dolomite in situ lithification [75].

4.3. Beyond ToF-SIMS Microscale View

In addition to ToF-SIMS analysis, a complementary investigation was performed using thin sections and an Electron Probe Micro-Analyzer (EPMA) to support our findings beyond the ToF-SIMS microscale view. Figure 10 reveals a thin-section micrograph image of MV2 showing some foraminiferal structures and isopachous micro-dolomite grains consisting of a combination of a dark core and external cement. A comparable observation of dolomite morphology was reported from a seep-related shallow gas hydrate from the eastern margin of the Japan sea. The form of dolomite suggests a mineralization process mediated by microbial EPS, which nucleates on the surface of spherical oil films [76] and further emphasizes the significance of microbial EPS for dolomite formation [21,23,24]. Figure 11 reveals a backscattered electron image of MV2 that shows the remarkable co-occurrence of dolomite and halite. Dolomite forms around voids created by methane channels, while hypersaline seawater percolates throughout the fractures. The interaction among high salinity, methane seepage, and halophilic-microbe-conducting AOM has led to the formation of dolomite at the expense of calcite [47]. Overall, the results of the thin sections and EPMA align with implications of ToF-SIMS results where the dolomite formation process was governed by the microbial anaerobic oxidation of methane and high salinity.

4.4. Significance and Implication

The significance of this work lies in the capability to use ToF-SIMS to unravel the formation mechanism of Precambrian dolomite. An early discussion suggests a link between dolomite formation in a massive Precambrian sedimentary province and the putrefaction of dead marine animal carcasses on the seafloor that increased alkalinity. In conjunction with magnesium abundance from seawater, this alkaline environment facilitated the chemical formation of dolomite [77]. The limitation of this marine process is its inability to explain Precambrian dolomitization in localities of alternating dolomite and limestone bedding where metamorphism cannot be selective [78]. However, selective metamorphism is possible when fissures are present in the limestone, allowing the circulation of magnesium-rich fluids [79]. The discovery of microbial organic matter fossils in Precambrian dolomite [28] sheds light on the possibility for conducting ToF-SIMS in the identification and imaging of these microbial fossils. The application of ToF-SIMS in Precambrian samples could greatly expand our understanding of the formation mechanisms of dolomite.
Finally, the implication of this work contributes to the field of astrobiology where the search for life on Mars is ongoing. The fact that mud volcanoes occur on Mars [80] and AOM biomarkers are known from ancient seeps make carbonates in shallow-water hypersaline Earth environments targets for Mars analog environments. The hypothesis of finding any lifeform on Mars should be associated with terrestrial halophilic microorganisms [64] as it is assumed that microbial cells and molecules could have been entombed in evaporitic minerals on Mars for billions of years [81]. Therefore, the early-middle Miocene coastal mud volcano outcrops in Kuwait could become an open-air laboratory for Martian analog studies where our results reinforce the correlation between hypersalinity and AOM signatures.

5. Conclusions

The capability of ToF-SIMS to produce high-spatial-resolution ion images of inorganic and organic species enabled us to capture a snapshot of the paleobiogeochemical processes that governed dolomite formation at a microscale. The co-occurrence of dolomite, halite, and AOM microbial biomarkers indicates the simultaneous process of methane anaerobic oxidation with sulfate reduction. The co-localization pattern of AOM biomarkers with dolomite and halite indicates dolomite nucleation on the surfaces of halophilic AOM. On the other hand, the absence of dolomite and biomarkers, coupled with low halite signal intensity, supports the argument that hypersaline fluids are required for dolomite precipitation during shallow marine diagenesis. The results propose a Miocene event that led to a seal breach of the Bahrah oilfield, triggering hydrocarbon seepage into the shallow sabkha of Al-Subiya area. Within the mixing zone of seeped fluids and shallow sabkha, the coupled microbial redox processes of methane oxidation and sulfate reduction prevailed in the environment, which played a substantial role in the dolomite formation process. Our findings verify Gunatilaka’s early hypothesis regarding the potential of microbial activity in dolomite formation in Al-Subiya area. The application of ToF-SIMS can reveal the perplexing origin of ancient dolomite while also expanding astrobiological attempts to seek evidence of ancient life in the Martian analog environment.

Supplementary Materials

The following supporting information can be downloaded at: https://0-www-mdpi-com.brum.beds.ac.uk/article/10.3390/min13070968/s1.

Author Contributions

Conceptualization, A.S.A., M.J.D. and M.D.; formal analysis, A.S.A. and R.N.S.S.; funding acquisition, M.D.; investigation, A.S.A., M.J.D. and M.D.; methodology, A.S.A., R.N.S.S. and M.D.; project administration, M.D.; software, R.N.S.S.; supervision, M.D.; validation, A.S.A., R.N.S.S. and M.D.; writing—original draft, A.S.A.; writing—review and editing, R.N.S.S., M.J.D. and M.D. All authors have read and agreed to the published version of the manuscript.

Funding

This research was funded by the National Sciences and Engineering Research Council of Canada (NSERC Discovery, Grant Number 354741 to Maria Dittrich) and the Canada Foundation for Innovation and Ontario Research Fund (Leaders Opportunity Fund, Grant Number 22404 to Maria Dittrich).

Data Availability Statement

No new data were created or analyzed in this study. Data sharing is not applicable to this article.

Acknowledgments

We would like to express our appreciation to the National Sciences and Engineering Research Council of Canada (NSERC), the Canada Foundation for Innovation, and the Ontario Research Fund for their support in funding this research project. The authors extend their gratitude to Ian Nicklin from the Royal Ontario Museum for his support in rock cutting, Yanan Liu from the Department of Earth Sciences, University of Toronto for her assistance in thin section preparation and EPMA analyses, and Veronica Di Cecco from the Royal Ontario Museum for her contribution in obtaining thin-section micrograph images.

Conflicts of Interest

The authors declare that they have no conflict of interest.

References

  1. Milkov, A.V. Worldwide distribution of submarine mud volcanoes and associated gas hydrates. Mar. Geol. 2000, 167, 29–42. [Google Scholar] [CrossRef]
  2. Mellors, R.; Kilb, D.; Aliyev, A.; Gasanov, A.; Yetirmishli, G. Correlations between earthquakes and large mud volcano eruptions. J. Geophys. Res. Solid Earth 2007, 112, 1–11. [Google Scholar] [CrossRef]
  3. Kopf, A.J. Significance of mud volcanism. Rev. Geophys. 2002, 40, 1–52. [Google Scholar] [CrossRef] [Green Version]
  4. Elvert, M.; Suess, E.; Greinert, J.; Whiticar, M.J. Archaea mediating anaerobic methane oxidation in deep-sea sediments at cold seeps of the eastern Aleutian subduction zone. Org. Geochem. 2000, 31, 1175–1187. [Google Scholar] [CrossRef]
  5. Boetius, A.; Ravenschlag, K.; Schubert, C.J.; Rickert, D.; Widdel, F.; Gieseke, A.; Amann, R.; Jùrgensen, B.B.; Witte, U.; Pfannkuche, O. A marine microbial consortium apparently mediating anaerobic oxidation of methane. Nature 2000, 407, 623–626. [Google Scholar] [CrossRef]
  6. Reeburgh, W.S. Oceanic Methane Biogeochemistry. Chem. Rev. 2007, 107, 486–513. [Google Scholar] [CrossRef] [Green Version]
  7. Ussler, W.; Paull, C.K. Rates of anaerobic oxidation of methane and authigenic carbonate mineralization in methane-rich deep-sea sediments inferred from models and geochemical profiles. Earth Planet. Sci. Lett. 2008, 266, 271–287. [Google Scholar] [CrossRef]
  8. Aloisi, G.; Pierrea, C.; Rouchyb, J.-M.; Faugeres, J.-C. Isotopic evidence of methane-related diagenesis in the mud volcanic sediments of the Barbados Accretionary Prism. Cont. Shelf Res. 2002, 22, 2355–2372. [Google Scholar] [CrossRef]
  9. Chen, H.; Wang, S.; Chen, Z.; Yan, W.; Li, G. Geochemical and magnetic signals for the mud volcano-induced methane seepage in the core sediments of Shenhu area, northern South China Sea. Environ. Earth Sci. 2014, 73, 6365–6378. [Google Scholar] [CrossRef]
  10. Hu, Y.; Feng, D.; Peckmann, J.; Roberts, H.H.; Chen, D. New insights into cerium anomalies and mechanisms of trace metal enrichment in authigenic carbonate from hydrocarbon seeps. Chem. Geol. 2014, 381, 55–66. [Google Scholar] [CrossRef]
  11. Kioka, A.; Tsuji, T.; Otsuka, H.; Ashi, J. Methane Concentration in Mud Conduits of Submarine Mud Volcanoes: A Coupled Geochemical and Geophysical Approach. Geochem. Geophys. Geosyst. 2019, 20, 792–813. [Google Scholar] [CrossRef] [Green Version]
  12. Omrani, H.; Raghimi, M. Origin of the mud volcanoes in the south east Caspian Basin, Iran. Mar. Pet. Geol. 2018, 96, 615–626. [Google Scholar] [CrossRef]
  13. Duane, M.J.; Reinink-Smith, L.; Eastoe, C.; Al-Mishwat, A.T. Mud volcanoes and evaporite seismites in a tidal flat of northern Kuwait—Implications for fluid flow in sabkhas of the Persian (Arabian) Gulf. Geo-Mar. Lett. 2015, 35, 237–246. [Google Scholar] [CrossRef]
  14. Warren, J. Dolomite: Occurrence, evolution and economically important associations. Earth-Sci. Rev. 2000, 52, 1–81. [Google Scholar] [CrossRef]
  15. Al-Awadi, M.; Clark, W.J.; Moore, W.R.; Herron, M.; Zhang, T.; Zhao, W.; Hurley, N.; Kho, D.; Montaron, B.; Sadooni, F. Dolomite: Perspectives on a Perplexing Mineral. Oilfield Rev. 2009, 21, 32–45. [Google Scholar]
  16. Kaczmarek, S.E.; Gregg, J.M.; Bish, D.L.; Machel, H.G.; Fouke, B.W. Dolomite, very high-magnesium calcite, and microbes- implications for the microbial model of dolomitization. In Characterization and Modeling of Carbonates–Mountjoy Symposium 1; Macneil, A.J., Lonnee, J., Wood, R., Eds.; SEPM Special Publication No. 109; SEPM Society for Sedimentary Geology: Broken Arrow, OK, USA, 2017; pp. 7–20. [Google Scholar]
  17. van Lith, Y.; Warthmann, R.; Vasconcelos, C.; Mckenzie, J.A. Microbial fossilization in carbonate sediments: A result of the bacterial surface involvement in dolomite precipitation. Sedimentology 2003, 50, 237–245. [Google Scholar] [CrossRef]
  18. Qiu, X.; Wang, H.; Yao, Y.; Duan, Y. High salinity facilitates dolomite precipitation mediated by Haloferax volcanii DS52. Earth Planet. Sci. Lett. 2017, 472, 197–205. [Google Scholar] [CrossRef]
  19. Kenward, P.A.; Fowle, D.A.; Goldstein, R.H.; Ueshima, M.; González, L.A.; Roberts, J.A. Ordered low-temperature dolomite mediated by carboxyl-group density of microbial cell walls. AAPG Bull. 2013, 97, 2113–2125. [Google Scholar] [CrossRef]
  20. Sánchez-Román, M.; Vasconcelos, C.; Schmid, T.; Dittrich, M.; McKenzie, J.A.; Zenobi, R.; Rivadeneyra, M.A. Aerobic microbial dolomite at the nanometer scale: Implications for the geologic record. Geology 2008, 36, 879–882. [Google Scholar] [CrossRef]
  21. Bontognali, T.R.R.; McKenzie, J.A.; Warthmann, R.J.; Vasconcelos, C. Microbially influenced formation of Mg-calcite and Ca-dolomite in the presence of exopolymeric substances produced by sulphate-reducing bacteria. Terra Nova 2014, 26, 72–77. [Google Scholar] [CrossRef]
  22. Alibrahim, A.; Al-Gharabally, D.; Mahmoud, H.; Dittrich, M. Proto-dolomite formation in microbial consortia dominated by Halomonas strains. Extremophiles 2019, 23, 765–781. [Google Scholar] [CrossRef] [PubMed]
  23. Paulo, C.; Dittrich, M. 2D Raman spectroscopy study of dolomite and cyanobacterial extracellular polymeric substances from Khor Al-Adaid sabkha (Qatar). J. Raman Spectrosc. 2013, 44, 1563–1569. [Google Scholar] [CrossRef]
  24. Diloreto, Z.A.; Garg, S.; Bontognali, T.R.R.; Dittrich, M. Modern dolomite formation caused by seasonal cycling of oxygenic phototrophs and anoxygenic phototrophs in a hypersaline sabkha. Sci. Rep. 2021, 11, 4170. [Google Scholar] [CrossRef]
  25. Gunatilaka, A. Dolomite formation in coastal Al-Khiran, Kuwait Arabian Gulf—A re-examination of the sabkha model. Sediment. Geol. 1991, 72, 35–53. [Google Scholar] [CrossRef]
  26. Mauger, C.L.; Compton, J.S. Formation of modern dolomite in hypersaline pans of the Western Cape, South Africa. Sedimentology 2011, 58, 1678–1692. [Google Scholar] [CrossRef]
  27. Sánchez-Román, M.; Vasconcelos, C.; Warthmann, R.; Rivadeneyra, M.; McKenzie, J.A. Microbial Dolomite Precipitation under Aerobic Conditions: Results from Brejo do Espinho Lagoon (Brazil) and Culture Experiments; International Association of Sedimentologists Special Publications; Blackwell Publishing Ltd.: Oxford, UK, 2009; Volume 41, pp. 167–178. [Google Scholar]
  28. Diver, W.L. Precambrian microfossils of Carpentarian age from Bungle Bungle dolomite of western Australia. Nature 1974, 247, 361–363. [Google Scholar] [CrossRef]
  29. Vasconcelos, C.; McKenzie, J.A. Dolomite as a Biomineral and Possible Implications. Rev. Soc. Españ. Mineral. 2008, 9, 21–22. [Google Scholar]
  30. Li, J.; Benzerara, K.; Bernard, S.; Beyssac, O. The link between biomineralization and fossilization of bacteria: Insights from field and experimental studies. Chem. Geol. 2013, 359, 49–69. [Google Scholar] [CrossRef]
  31. Aquilina, A.; Knab, N.J.; Knittel, K.; Kaur, G.; Geissler, A.; Kelly, S.P.; Fossing, H.; Boot, C.S.; Parkes, R.J.; Mills, R.A.; et al. Biomarker indicators for anaerobic oxidizers of methane in brackish-marine sediments with diffusive methane fluxes. Org. Geochem. 2010, 41, 414–426. [Google Scholar] [CrossRef]
  32. Bouloubassi, I.; Nabais, E.; Pancost, R.D.; Lorre, A.; Taphanel, M.-H. First biomarker evidence for methane oxidation at cold seeps in the Southeast Atlantic (REGAB pockmark). Deep. Sea Res. Part II Top. Stud. Oceanogr. 2009, 56, 2239–2247. [Google Scholar] [CrossRef]
  33. Chevalier, N.; Bouloubassi, I.; Birgel, D.; Crémière, A.; Taphanel, M.-H.; Pierre, C. Authigenic carbonates at cold seeps in the Marmara Sea (Turkey): A lipid biomarker and stable carbon and oxygen isotope investigation. Mar. Geol. 2011, 288, 112–121. [Google Scholar] [CrossRef]
  34. Gontharet, S.; Stadnitskaia, A.; Bouloubassi, I.; Pierre, C.; Damsté, J.S.S. Palaeo methane-seepage history traced by biomarker patterns in a carbonate crust, Nile deep-sea fan (Eastern Mediterranean Sea). Mar. Geol. 2009, 261, 105–113. [Google Scholar] [CrossRef]
  35. Pancost, R.D.; Hopmans, E.C.; Damsté, J.S.S. Archaeal lipids in Mediterranean Cold Seeps- Molecular proxies for anaerobic methane oxidation. Geochim. Cosmochim. Acta. 2001, 65, 1611–1627. [Google Scholar] [CrossRef] [Green Version]
  36. Stadnitskaia, A.; Nadezhkin, D.; Abbas, B.; Blinova, V.; Ivanov, M.K.; Sinninghe Damsté, J.S. Carbonate formation by anaerobic oxidation of methane: Evidence from lipid biomarker and fossil 16S rDNA. Geochim. Et Cosmochim. Acta 2008, 72, 1824–1836. [Google Scholar] [CrossRef]
  37. Zhang, Z.-X.; Li, J.; Chen, Z.; Sun, Z.; Yang, H.; Fu, M.; Peng, X. The effect of methane seeps on the bacterial tetraether lipid distributions at the Okinawa Trough. Mar. Chem. 2020, 225, 103845. [Google Scholar] [CrossRef]
  38. Benninghoven, A. Chemical analysis of inorganic and organic surfaces and thin films by static time-of-flight secondary ion mass spectrometry (TOF-SIMS). Angew. Chem. Int. Ed. 1994, 33, 1023–1043. [Google Scholar] [CrossRef]
  39. Sodhi, R.N. Time-of-flight secondary ion mass spectrometry (TOF-SIMS):—Versatility in chemical and imaging surface analysis. Analyst 2004, 129, 483–487. [Google Scholar] [CrossRef]
  40. Thiel, V.; Heim, C.; Arp, G.; Hahmann, U.; SjÖVall, P.; Lausmaa, J. Biomarkers at the microscopic range: ToF-SIMS molecular imaging of Archaea-derived lipids in a microbial mat. Geobiology 2007, 5, 413–421. [Google Scholar] [CrossRef]
  41. Leefmann, T.; Heim, C.; Kryvenda, A.; Siljeström, S.; Sjövall, P.; Thiel, V. Biomarker imaging of single diatom cells in a microbial mat using time-of-flight secondary ion mass spectrometry (ToF-SIMS). Org. Geochem. 2013, 57, 23–33. [Google Scholar] [CrossRef]
  42. Steelea, A.; Toporskia, J.K.W.; Avcic, R.; Guidryd, S.; McKayb, D.S. Time of flight secondary ion mass spectrometry (ToFSIMS) of a number of hopanoids. Org. Geochem. 2001, 32, 905–911. [Google Scholar] [CrossRef]
  43. Leefmann, T.; Heim, C.; Siljestrom, S.; Blumenberg, M.; Sjovall, P.; Thiel, V. Spectral characterization of ten cyclic lipids using time-of-flight secondary ion mass spectrometry. Rapid Commun. Mass Spectrom. 2013, 27, 565–581. [Google Scholar] [CrossRef]
  44. Sjövall, P.; Thiel, V.; Siljeström, S.; Heim, C.; Hode, T.; Lausmaa, J. Organic Geochemical Microanalysis by Time-of-FlightSecondary Ion Mass Spectrometry (ToF-SIMS). Geostand. Geoanal. Res. 2008, 32, 267–277. [Google Scholar] [CrossRef]
  45. Gunatilaka, A.; Al-Zamel, A.; Shearman, D.J.; Reda, A. A Spherulitic Fabric in Selectively Dolomitized Siliciclastic Crustacean Burrows, Northern Kuwait. J. Sediment. Petrol. 1987, 57, 922–927. [Google Scholar]
  46. Gunatilaka, A. Spheroidal dolomites—Origin by hydrocarbon seepage? Sedimentology 1989, 36, 701–710. [Google Scholar] [CrossRef]
  47. Alibrahim, A.; Duane, M.J.; Dittrich, M. Dolomite genesis in bioturbated marine zones of an early-middle Miocene coastal mud volcano outcrop (Kuwait). Sci. Rep. 2021, 11, 6636. [Google Scholar] [CrossRef]
  48. Alrashidi, A.F. Field Map and Geochemistry of Miocene Mud Volcanoes (North of Kuwait). Kuwait, Kuwait. 2023. [Google Scholar]
  49. Behbehani, S.; Hollis, C.; Holland, G.; Singh, P.; Edwards, K. A seismically controlled seal breach in a major hydrocarbon province: A study from the Mauddud Formation in the Bahrah field, Kuwait. Mar. Pet. Geol. 2019, 107, 255–277. [Google Scholar] [CrossRef]
  50. Drake, H.; Astrom, M.E.; Heim, C.; Broman, C.; Astrom, J.; Whitehouse, M.; Ivarsson, M.; Siljestrom, S.; Sjovall, P. Extreme 13C depletion of carbonates formed during oxidation of biogenic methane in fractured granite. Nat. Commun. 2015, 6, 7020. [Google Scholar] [CrossRef] [Green Version]
  51. Al-Hajeri, M.M.; Amer, A.; Djawair, D.; Green, D.; Al-Naqi, M. Origin of enigmatic sand injectite outcrops associated with non-tectonic forced-folding structure in Bahrah area, northern Kuwait Bay. Mar. Pet. Geol. 2020, 115, 104268. [Google Scholar] [CrossRef]
  52. Yadav, L.D.S. Mass Spectroscopy (MS). In Organic Spectroscopy; Springer Science + Business Media, B.V.: Berlin/Heidelberg, Germany, 2005; pp. 250–294. [Google Scholar]
  53. Stephan, T. TOF-SIMS in cosmochemistry. Planet. Space Sci. 2001, 49, 859–906. [Google Scholar] [CrossRef]
  54. Siljestrom, S.; Lausmaa, J.; Sjovall, P.; Broman, C.; Thiel, V.; Hode, T. Analysis of hopanes and steranes in single oil-bearing fluid inclusions using time-of-flight secondary ion mass spectrometry (ToF-SIMS). Geobiology 2010, 8, 37–44. [Google Scholar] [CrossRef]
  55. Venosa, A.; Suidan, M.; King, D.; Wrenn, B. Use of hopane as a conservative biomarker for monitoring the bioremediation effectiveness of crude oil contaminating a sandy beach. J. Ind. Microbiol. Biotechnol. 1997, 18, 131–139. [Google Scholar] [CrossRef]
  56. Hinrichs, K.-U.; Hayes, J.M.; Sylva, S.P.; Brewer, P.G.; DeLong, E.F. Methane-consuming archaebacteria in marine sediments. Nature 1999, 398, 802–805. [Google Scholar] [CrossRef] [PubMed]
  57. Peckmann, J.; Thiel, V. Carbon cycling at ancient methane–seeps. Chem. Geol. 2004, 205, 443–467. [Google Scholar] [CrossRef]
  58. Langworthy, T.A.; Holzer, G.; Zeikus, J.G.; Tornabene, T.G. Iso- and Anteiso-Branched Glycerol Diethers of the Thermophilic Anaerobe Thermodesulfotobacterium commune. Syst. Appl. Microbiol. 1983, 4, 1–17. [Google Scholar] [CrossRef]
  59. Niemann, H.; Elvert, M. Diagnostic lipid biomarker and stable carbon isotope signatures of microbial communities mediating the anaerobic oxidation of methane with sulphate. Org. Geochem. 2008, 39, 1668–1677. [Google Scholar] [CrossRef]
  60. Pape, T.; Blumenberg, M.; Seifert, R.; Egorov, V.N.; Gulin, S.B.; Michaelis, W. Lipid geochemistry of methane-seep-related Black Sea carbonates. Palaeogeogr. Palaeoclimatol. Palaeoecol. 2005, 227, 31–47. [Google Scholar] [CrossRef]
  61. Pancost, R.D.; Bouloubassi, I.; Aloisi, G.; Damsté, J.S.S.; Party, T.M.S.S. Three series of non-isoprenoidal dialkyl glycerol diethers in cold-seep carbonate crusts. Org. Geochem. 2001, 32, 695–707. [Google Scholar] [CrossRef]
  62. Saito, R.; Oba, M.; Kaiho, K.; Maruo, C.; Fujibayashi, M.; Chen, J.; Chen, Z.-Q.; Tong, J. Ether lipids from the Lower and Middle Triassic at Qingyan, Guizhou Province, Southern China. Org. Geochem. 2013, 58, 27–42. [Google Scholar] [CrossRef]
  63. Grossi, V.; Mollex, D.; Vincon-Laugier, A.; Hakil, F.; Pacton, M.; Cravo-Laureau, C. Mono- and dialkyl glycerol ether lipids in anaerobic bacteria: Biosynthetic insights from the mesophilic sulfate reducer Desulfatibacillum alkenivorans PF2803T. Appl. Environ. Microbiol. 2015, 81, 3157–3168. [Google Scholar] [CrossRef] [Green Version]
  64. DasSarma, S. Extreme Halophiles Are Models for Astrobiology. Microbe 2006, 1, 120–126. [Google Scholar] [CrossRef] [Green Version]
  65. Maignien, L.; Parkes, R.J.; Cragg, B.; Niemann, H.; Knittel, K.; Coulon, S.; Akhmetzhanov, A.; Boon, N. Anaerobic oxidation of methane in hypersaline cold seep sediments. FEMS Microbiol. Ecol. 2013, 83, 214–231. [Google Scholar] [CrossRef] [PubMed] [Green Version]
  66. Ziegenbalg, S.B.; Birgel, D.; Hoffmann-Sell, L.; Pierre, C.; Rouchy, J.M.; Peckmann, J. Anaerobic oxidation of methane in hypersaline Messinian environments revealed by 13C-depleted molecular fossils. Chem. Geol. 2012, 292–293, 140–148. [Google Scholar] [CrossRef]
  67. Sanz-Montero, M.E.; Rodriguez-Aranda, J.P.; Calvo, J.P. Mediation of Endoevaporitic Microbial Communities in Early Replacement of Gypsum by Dolomite: A Case Study from Miocene Lake Deposits of the Madrid Basin, Spain. J. Sediment. Res. 2006, 76, 1257–1266. [Google Scholar] [CrossRef]
  68. Vandeginste, V.; Snell, O.; Hall, M.R.; Steer, E.; Vandeginste, A. Acceleration of dolomitization by zinc in saline waters. Nat. Commun. 2019, 10, 1851. [Google Scholar] [CrossRef] [Green Version]
  69. Deng, S.; Dong, H.; Lv, G.; Jiang, H.; Yu, B.; Bishop, M.E. Microbial dolomite precipitation using sulfate reducing and halophilic bacteria: Results from Qinghai Lake, Tibetan Plateau, NW China. Chem. Geol. 2010, 278, 151–159. [Google Scholar] [CrossRef]
  70. Vasconcelos, C.; McKenzie, J.A. Microbial mediation of modern dolomite precipitation and diagenesis under anoxic conditions (Lagoa Vermelha, Rio de Janeiro, Brazil). J. Sediment. Res. 1997, 67, 378–390. [Google Scholar]
  71. Vasconcelos, C.; McKenzie, J.A.; Bernasconi, S.; Grujic, D.; Tien, A.J. Microbial mediation as a possible mechanism for natural dolomite formation at low temperatures. Nature 1995, 377, 220–222. [Google Scholar] [CrossRef]
  72. Roberts, J.A.; Bennett, P.C.; González, L.A.; MacPherson, G.L.; Miliken, K.L. Microbial precipitation of dolomite in methanogenic groundwater. Geology 2004, 32, 277–280. [Google Scholar] [CrossRef]
  73. Ritger, S.; Carson, B.; Suess, E. Methane-derived authigenic carbonates formed by subduction-induced pore-water expulsion along the Oregon:Washington margin. Geol. Soc. Am. Bull. 1987, 98, 147–156. [Google Scholar] [CrossRef]
  74. Feenstra, E.J.; Birgel, D.; Heindel, K.; Wehrmann, L.M.; Jaramillo-Vogel, D.; Grobety, B.; Frank, N.; Hancock, L.G.; Van Rooij, D.; Peckmann, J.; et al. Constraining the formation of authigenic carbonates in a seepage-affected cold-water coral mound by lipid biomarkers. Geobiology 2020, 18, 185–206. [Google Scholar] [CrossRef]
  75. Peckmann, J.; Thiel, V.; Michaelis, W.; Clari, P.; Gaillard, C.; Martire, L.; Reitner, J. Cold seep deposits of Beauvoisin (Oxfordian; southeastern France) and Marmorito (Miocene; northern Italy): Microbially induced authigenic carbonates. Int. J. Earth Sci. 1999, 88, 60–75. [Google Scholar] [CrossRef] [Green Version]
  76. Shiraishi, F.; Akimoto, T.; Tomioka, N.; Takahashi, Y.; Matsumoto, R.; Snyder, G.T. Microbial traces found in microdolomite associated with seep-related shallow gas hydrate. Front. Earth Sci. 2023, 11, 1188142. [Google Scholar] [CrossRef]
  77. Daly, R.A. The limeless ocean of Pre-cambrian time. Am. J. Sci. 1907, 23, 93–115. [Google Scholar] [CrossRef]
  78. Steidtmann, E. The evolution of limestone and dolomite. J. Geol. 1911, 19, 323–345. [Google Scholar] [CrossRef]
  79. Van Tuyl, F.M. The Origin of Dolomite. Iowa Geol. Surv. Annu. Rep. 1916, 25, 251–422. [Google Scholar] [CrossRef] [Green Version]
  80. Oehler, D.Z.; Allen, C.C. Evidence for pervasive mud volcanism in Acidalia Planitia, Mars. Icarus 2010, 208, 636–657. [Google Scholar] [CrossRef]
  81. Perl, S.; Baxter, B. Great Salt Lake as an Astrobiology Analogue for Ancient Martian Hypersaline Aqueous Systems. In Great Salt Lake Biology; Baxter, B., Butler, J., Eds.; Springer Nature Switzerland AG: Basel, Switzerland, 2020. [Google Scholar]
Figure 1. Geological map of the main units in Al-Subiya area. The mud volcano outcrops are bound to the south by a large fault of unknown age. To the north, the complex is bound by younger marine terraces that are Quaternary in age. The mud volcano unit has an internal structure such as beds dipping at low to high angles, polygonal fractures of vertical extent, and mounds where the dip angles are steeper. The study site was divided into three zones, Z1, Z2, and Z3, to account for the distinctive lithological features of each zone, and for the nature of the dissected complex by remnant tidal channels.
Minerals 13 00968 g001
Figure 2. Geomorphological features of the Miocene mud volcano. (A) Preserved depositional sedimentary features such as laminar bedding. (B) Top view of pockmarks with different sizes. Pockmarks are indicative of gas venting and the upward migration of carbon-rich fluids. (C) An example of polygonal fractures with pockmarks. The fractures are discontinuous, display arcuate vertical dips, and reveal gas escape structures centered on the fractures. The soft-sediment deformation features are indicative of seismic influence. (D) Close-up view of sequential carbonate and evaporite minerals (white), in sealed, deformed seismic fractures in sandstone (red). The small craters are concentrically zoned with carbonates (calcite and dolomite). Camera lens cap for approximate size. (E) Larger-scale polygonal fractures showing organized cell-like characteristics in fine-grained red, dolomitic-calcitic cemented sandstones.
Minerals 13 00968 g002
Figure 3. Carbonate rocks sampled for the study: (A) Pipe-like gas feature with clasts of country rock from Z1 labeled as MV1. (B) Bioturbated vent from Z2 labeled as MV2. (C) Concentrically zoned truncated gas vent with brecciated matrix from Z3 labeled as MV3. Scale bar = 20 cm.
Minerals 13 00968 g003
Figure 4. High mass resolution of ion ToF-SIMS spectra (m/z 20–120, 180–200, 250–270, 280–310, 335–270, 380–400, and 450–600) collected in positive mode from a 150 × 150 µm2 area of carbonate rocks from Miocene mud volcano. See text for a detailed description of samples MV1, MV2, MV2_d, MV2_br, and MV3.
Minerals 13 00968 g004aMinerals 13 00968 g004bMinerals 13 00968 g004c
Figure 5. Positive ion distribution for selected inorganic and organic species in sample MV1. The image color scale bar is shown to the right of each image indicating the intensity of the ions. Field of view is 150 × 150 µm2. The top row shows the total ion distribution along with that for the metals Ca+, Mg+, and Na+. The color overlay image represents the collective distribution of the metals Mg+ (red), Ca+ (green), and Na+ (blue). The rest of the panels show the distribution of the biomarker fragments. Fragments m/z 255.23, 257.23, 259.23, and 367.30 are co-localized with Na+ in 3 clusters. The lateral distribution of Ca+ and Mg+ is identical, suggesting a dolomite region. Biomarker fragments with clear contrast and co-localized with dolomite are m/z 189.11, 191.12, 283.19, 285.19, 299.16, and, with less contrast, 301.17 and 341.20.
Minerals 13 00968 g005
Figure 6. Positive ion distribution for selected inorganic and organic species in sample MV2. The image color scale bar is shown to the right of each image indicating the intensity of the ions. Field of view is 150 × 150 µm2. The first row displays the total ion distribution along with that for the metals Ca+, Mg+, and Na+. The color overlay represents the collective distribution of the metals Mg+ (red), Ca+ (green), and Na+ (blue). The rest of the panels show the distribution of the biomarker fragments. The biomarker fragments m/z 255.23, 257.23, 259.23 are co-localized with Na+ and reveal a chain of clusters. The intense biomarker fragments m/z 189.11, 191.12, 283.19, 285.19 are co-localized with dolomite. However, the ion images of the fragments m/z 299.22, 301.22, 341.27, 367.31 are difficult to localize due to their weak contrast.
Minerals 13 00968 g006
Figure 7. Positive ion distribution for selected inorganic and organic species in MV2_br sub-sample, revealing the light matrix in MV2. The image color scale bar is shown to the right of each image, indicating the intensity of the ions. Field of view is 150 × 150 µm2. The first row displays the total ion distribution along with that for the metals Ca+, Mg+, and Na+. The color overlay represents the collective distribution of the metals Mg+ (red), Ca+ (green), and Na+ (blue). The rest of the panels show the distribution of the biomarker fragments. Halite cubes are noticeable in the topography (total) and match with the Na+ image. The lateral distribution of Ca+ and Mg+ are matching, suggesting a dolomite region. The pattern of biomarker co-localization is similar to MV2 in Figure 6.
Minerals 13 00968 g007
Figure 8. Positive ion distribution for selected inorganic and organic species in MV2_d sub-sample, which represent the black spots in dolomite-bearing carbonate MV2. The image color scale bar is shown to the right of each image indicating the intensity of the ions. Field of view is 150 × 150 µm2. The first row displays the total ion distribution along with that for the metals Ca+, Mg+, and Na+. The color overlay represents the collective distribution of the metals Mg+ (red), Ca+ (green), and Na+ (blue). The rest of the panels show the distribution of the biomarker fragments. The ion images clearly show a strong intensity of Ca+, a minimal intensity for both Mg+ and Na+, and low-contrast images of biomarker fragments m/z 255.23, 257.23, 259.23, 301.15, 341.27, 367.39. Biomarker localization with Na+ and Mg+ is absent. The observable biomarker fragments m/z 189.14, 191.15, 283.23, 285.24, 299.23 are localized with Ca+.
Minerals 13 00968 g008
Figure 9. Positive ion distribution for selected inorganic and organic species in MV3 sample. The image color scale bar is shown to the right of each image, indicating the intensity of the ions. Field of view is 150 × 150 µm2. The first row demonstrates the total ion distribution along with that for the metals Ca+, Mg+, and Na+. The color overlay represents the collective distribution of the metals Ca+ (green) and Na+ (blue), where Mg+ (red) is clearly lacking, indicating the absence of dolomite. The rest of the panels show the absence of biomarker co-localization with weak biomarker intensity. The weak intensity of biomarker fragments could be noise from being binned to 4 pixels to increase the contrast. This figure shows simultaneous dolomite absence, minimal halite, and the lack of biomarker co-localization patterns.
Minerals 13 00968 g009
Figure 10. Thin-section micrograph image showing foraminiferal structures and isopachous micro-dolomite grains. The dolomite grains exhibit an internal core and external cement that are products of microbial EPS and oil films.
Minerals 13 00968 g010
Figure 11. Backscattered electron image obtained by EPMA. The EDS chemical analysis indicates that the matrix is calcite, the darker regions are dolomite, and white cubes are halite. The image suggests dolomite formation around voids of methane channels and the hypersaline seawater percolated throughout the fractures.
Minerals 13 00968 g011
Table 1. Characteristic ions in positive ion ToF-SIMS spectra of biomarker compounds.
Putative Fragmentation of Biomarker Compounds, Formula, and Exact Mass (u)Standard m/z (+)Average Measured m/z (+)Tentative Formula
17α(H),21β(H)-Norhopane (norhopane; C29H50; 398.39)
Minerals 13 00968 i001
191.18191.14 (σ = 0.02)[C14H23] +
259.25259.23 (σ = 0.008)[C19H31] +
367.35367.32 (σ = 0.03)[C27H43] +
383.39383.52 (σ = 0.02)[C28H47] +
Hop-17(21)-ene or Hop-22(29)-ene (diploptene) (C30H50; 410.39)
Minerals 13 00968 i002
189.17189.13 (σ = 0.008)[C14H21] +
393.36393.33 (σ = 0.06)[C29H45] +
395.37395.27 (σ = 0.04)[C29 H47] +
Dialkyl glycerol diether (DAGE, C35H68O3; 536.52)
Minerals 13 00968 i003
283.26283.21 (σ = 0.01)[C18H35O2] +
Dialkyl glycerol diether (DAGE, C33H68O3; 512.52)
Minerals 13 00968 i004
285.27285.19 (σ = 0.04)[C18H37O2] +
301.26301.15 (σ = 0.04)[C18H37O3] +
495.51495.28 (σ = 0.04)[M-H2O] +
Dialkyl glycerol diether (DAGE, C29H58O3; 454.44)
Minerals 13 00968 i005
255.23255.24 (σ = 0.04)[C16H31O2] +
257.24257.23 (σ = 0.02)[C16H33O2] +
455.43455.5 (σ = 0.2)[M+H] +
Diacylglycerolester (DG 16:0/18:0; C37H72O5; 596.54)
Minerals 13 00968 i006
341.32341.24 (σ = 0.03)[C21H41O3] +
579.54579.22 (σ = 0.1)[M-H2O] +
Diacylglycerolester (DG; 15:0/17:0 C35H68O5; 568.51)
Minerals 13 00968 i007
299.26299.25 (σ = 0.01)[C18H35O3] +
Disclaimer/Publisher’s Note: The statements, opinions and data contained in all publications are solely those of the individual author(s) and contributor(s) and not of MDPI and/or the editor(s). MDPI and/or the editor(s) disclaim responsibility for any injury to people or property resulting from any ideas, methods, instructions or products referred to in the content.

