Article

China’s Rare Earths Supply Forecast in 2025: A Dynamic Computable General Equilibrium Analysis

1
School of Humanities and Economic Management, China University of Geosciences (Beijing), Beijing 100083, China
2
Key Laboratory of Carrying Capacity Assessment for Resource and Environment, Ministry of Land and Resources, Beijing 100083, China
*
Authors to whom correspondence should be addressed.
Submission received: 17 July 2016 / Revised: 20 August 2016 / Accepted: 14 September 2016 / Published: 21 September 2016

Abstract

:
The supply of rare earths in China has been the focus of significant attention in recent years. Due to changes in regulatory policies and the development of strategic emerging industries, it is critical to investigate the scenario of rare earth supplies in 2025. To address this question, this paper constructed a dynamic computable equilibrium (DCGE) model to forecast the production, domestic supply, and export of China’s rare earths in 2025. Based on our analysis, production will increase by 10.8%–12.6% and achieve 116,335–118,260 tons of rare-earth oxide (REO) in 2025, based on recent extraction control during 2011–2016. Moreover, domestic supply and export will be 75,081–76,800 tons REO and 38,797–39,400 tons REO, respectively. The technological improvements on substitution and recycling will significantly decrease the supply and mining activities of rare earths. From a policy perspective, we found that the elimination of export regulations, including export quotas and export taxes, does have a negative impact on China’s future domestic supply of rare earths. The policy conflicts between the increase in investment in strategic emerging industries, and the increase in resource and environmental taxes on rare earths will also affect China’s rare earths supply in the future.

1. Introduction

Rare earths have a unique place among mineral resources. They have special chemical, catalytic, electrical, magnetic, and optical properties and are, therefore, widely used in traditional sectors, including agriculture, petrochemicals, metallurgy, and textiles, as well as in strategic emerging industries such as hybrid cars and wind turbines [1,2,3]. Due to their role in domestic industrial development and economic growth, there is a growing demand for rare earths in many countries. Although, geographically, rare earths are widely distributed over the whole world, they are mainly mined, concentrated, and separated in China and, hence, many countries need to import them. Due to the large state-owned resource requirement, countries that have an enormous wealth of rare earths have reduced their production and export of rare earths to the international market [4].
Rare earths mainly exist in China, Brazil, Australia, India, and the United States (US). China’s rare earths reserve, as estimated by the U.S. Geological Survey (USGS), was 55 million tons of rare-earth oxide (REO) equivalent, accounting for 42.31% of the world’s total reserves in 2015 [5]. Accordingly, China’s mining production quota for 2015 was 105 thousand tons REO, which was unchanged from 2014 and accounted for 84.7% of the world’s total [5]. Therefore, China’s rare earths supply to the international market is extremely important for importers. Although China ended its export quotas and removed export tariffs on rare earths in 2015, more stringent regulations on the domestic exploration and production of rare earths have been considered [6]. Moreover, the Chinese government introduced a series of support policies to accelerate the development of strategic emerging industries. According to the Decision of the State Council on Accelerating the Fostering and Development of Strategic Emerging Industries (No. 32 [2010] of the State Council), the gross domestic product (GDP) of strategic emerging industries will account for 15.0% of the total national GDP by 2020. The development of strategic emerging industries will stimulate the domestic demand for rare earths. Due to increasingly stringent regulations on the supply of rare earths, and increasing domestic demand for them, China’s rare earths supply distribution—between the domestic and foreign markets—will be changing in the future. However, under the influence of regulation and the demand fueled by the development of strategic emerging industries, it is essential to study the future supply scenario of rare earths.
Due to the important role of rare earths in the international market, China’s rare earth policies, and their effects on geo-political and economic relations between countries, are attracting attention. Wübbeke argues that China’s export policies and regulations are shaped by the geopolitical narrative, as well as by domestic concerns for resource conservation and environmental protection [7]. Zhang et al. [8] confirmed that China’s export policies have had a significantly positive effect by increasing the market power and price sensitivity of China’s rare earth products in the international market. However, Zhang et al. [8] also suggest that the government should shift from controlling exports to controlling production to improve the pricing power of China’s rare earths. Han et al. [6] endorsed this recommendation to shift from controlling exports to regulating production, and, furthermore, provided specific and reasonable rates for both domestic resource and environmental taxes to improve the sustainable development of rare earths. Moreover, the effects of China’s export restrictions on rare earths on the geo-political and economic relations among countries were analyzed in other studies [9,10,11,12,13].
Since rare earth exports are closely related to production, the volume of production analyses has been increasing [4]. Most studies have predicted that China’s share of the world’s rare earths supply will be reduced [14,15], while production will either increase [7,16,17] or remain at current levels [14]. These production analyses and forecasts are mainly based on the current and predicted production capacities of rare earth mines or projects worldwide. Therefore, it is difficult to estimate long-term production. Wang et al. [4] provide a peak model to forecast China’s rare earth production that forecasts production by 2020 and 2050. However, the production predicted by Wang et al. [4] is based only on nonrenewable characteristics, reserves, and the historical production of rare earths; it ignores the demands of industrial development and the effects of the regulatory policies formulated by the Chinese government.
China’s rare earth supplies largely depend on regulatory policies, balance between demand and supply, and the technologies on substitution and recycling of rare earths. We construct a dynamic computable general equilibrium (DCGE) model to forecast China’s production, domestic supply, and export of rare earths in 2025, which considers the regulatory changes, the development of strategic emerging industries, and the potential of rare earths substitution and recycling. A computable general equilibrium (CGE) model is widely used for economic, social, resource, and environmental planning and policy evaluation because it can effectively capture inter-sectoral linkages [18,19]. CGE models have been used to investigate the effects of environmental and resource taxes on the macro economy and the sustainable development of natural resources [20,21,22,23,24,25,26,27]. Moreover, a CGE model with a dynamic framework can also be adopted in forecasting analysis [28,29]. Most traditional forecasting models cannot account for changes in policies or for information that was not available in the past, but this problem can be addressed by DCGE models [29].
The rest of this paper is organized as follows. Section 2 describes our DCGE model for China, including specification of our model calibration and parameters. Section 3 reports and discusses the forecast results under the scenarios of strategic emerging industries and changing regulatory policies. Section 4 concludes the study and provides policy implications.

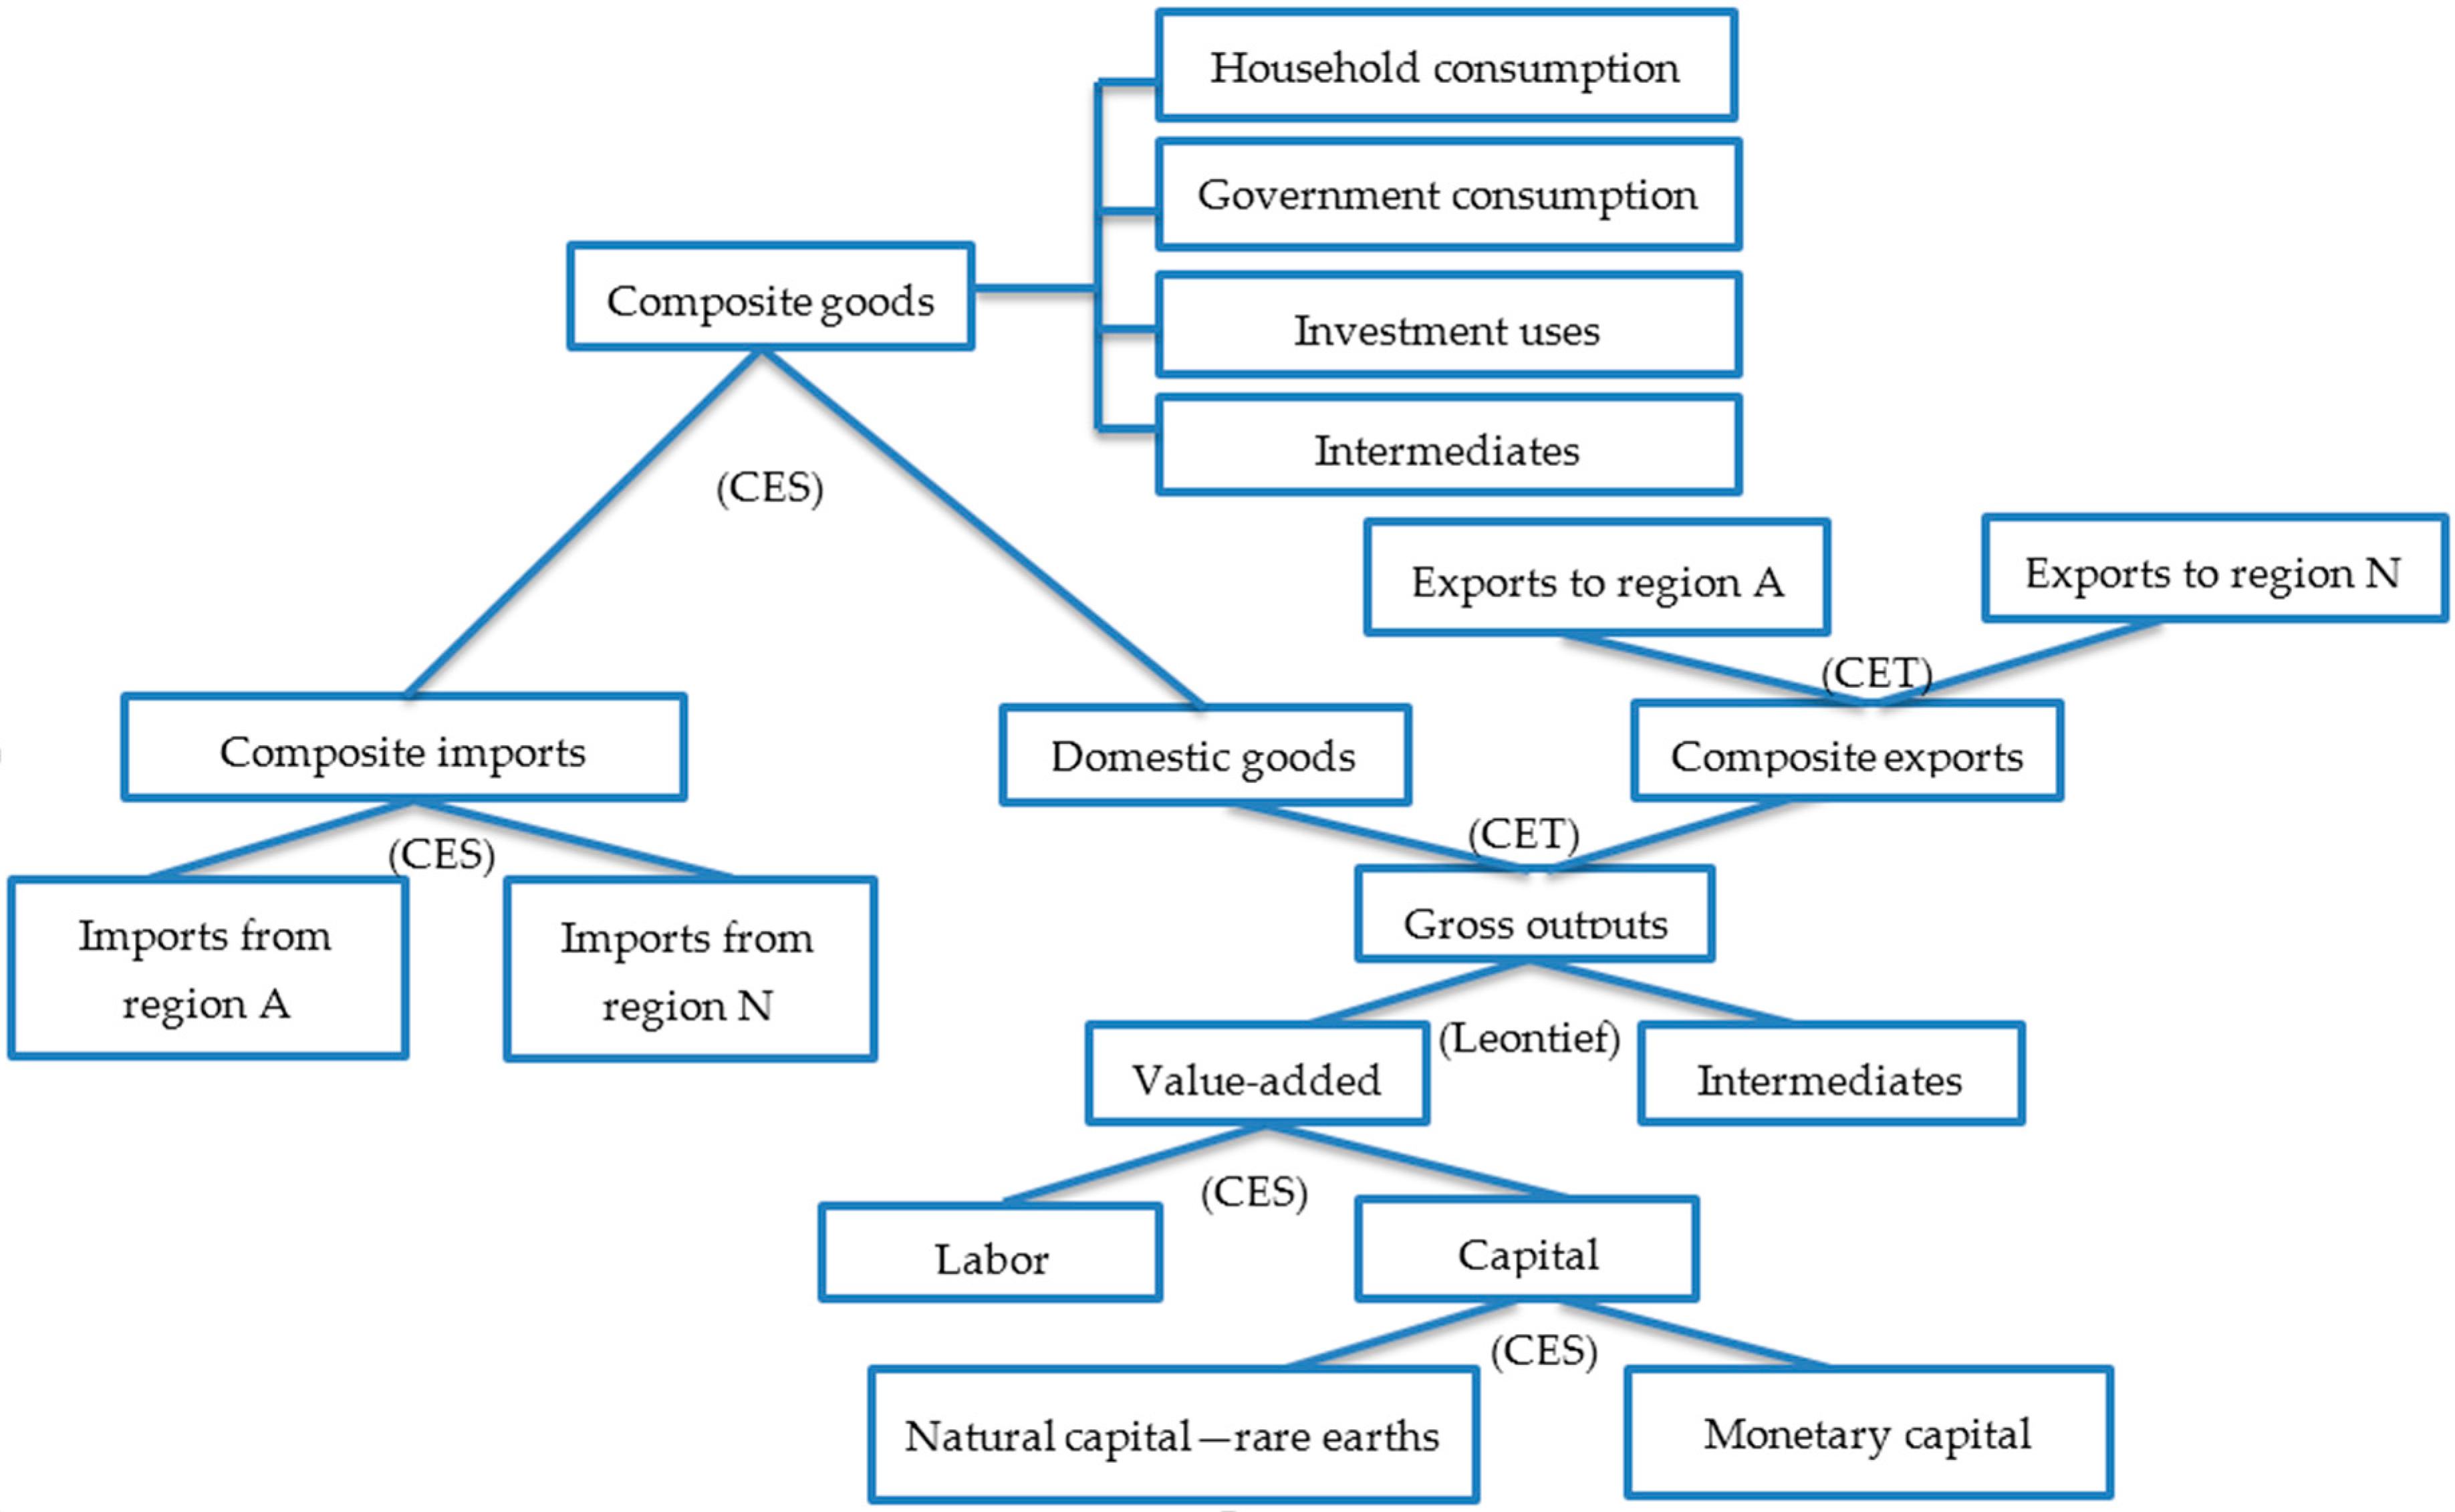
2. China’s DCGE Model for Rare Earths Supply Forecast

The theoretical basis of the CGE model uses the principles of macroeconomics and microeconomics. The model is suitable for predicting quantity variations in commodities or services in the medium-short term under the external shocks or policy interventions of a competitive market because it features a price mechanism that is powerful enough to solve complicated trade-off problems and that plays an important role in the economy. Economic agents make their decisions about production or consumption according to changes in market prices under given resource and technology constraints. Finally, market equilibrium can be obtained by adjusting prices. The forecasting process can be described as follows: first, a base case is constructed to determine market variations in the future medium-short term based on the observed path of economic development during a past period of the same length without any external shocks or policy interventions; second, scenarios are then built by altering some exogenous variables or parameters of the model to reflect the intended changes; and third, post-shock equilibrium is computed for the future medium-short term, making it possible to quantify future variations in commodities or services under the introduced modifications.
The DCGE model is constructed according to the purpose of this study; it is focused on forecasting the production, domestic supply, and export of China’s rare earths under the scenarios of developing strategic emerging industries and changing export and domestic regulations. Figure 1 displays the general structure of the CGE model in this study. The model assembles or disaggregates all sectors in China into 26 sectors (including the rare earths mining sector), as listed in Table 1. The model is a system of equations describing the behavior of economic agents (including enterprises, households, and government) and the equilibrium conditions and constraints of the economy for factors, commodities, savings and investment, and the rest of the world. There are three modules in our model: the supply module, the demand module, and the closure, equilibrium, and dynamic module.

2.1. Supply Module

The supply module describes the composite goods that supply the domestic market. Composite goods are composed of domestic and imported goods from region A to region N . The Armington assumption [30] is adopted to decide between imported and domestically produced goods by imperfect substitution using the constant elasticity of substitution (CES) production function.
For domestic goods, producers maximize profits subject to technological constraints. The production process can be expressed by a two-level nested CES and Leontief production function. At the top level, a choice is made by the Leontief function between two composite goods: a value-added composite and an intermediate composite. This means there is a fixed proportion between the value-added composite and the intermediate composite for producing a commodity or service. The Leontief production function is expressed as the following equation [31]:
Y ¯ = m i n ( B 1 a b 1 , , B n a b n )
where Y ¯ is the aggregate output of the firm, B 1 , …, B n are the aggregates of various inputs, and a b 1 , …, a b n are the input requirement coefficients. At the second level, the value-added composite is obtained by capital composite and labor with a CES production function. At the third level, the capital composite is decided by natural capital, which in this study refers to ores of rare earths, and monetary capital with a CES function.
For the composite imports, the import principle for the commodity or service is derived by cost minimization with a CES function. The CES production function can be expressed as follows [31]:
Y = A ( i = 1 n δ i X i ρ ) 1 ρ
where Y is the output of production, X i is the i -th input factor, and A , δ , and ρ are the parameters. For simplicity, the small country assumption is adopted, namely that the import price is determined exogenously by world prices [26,32].

2.2. Demand Module

The demand module shows the total demand of the market, including domestic consumption (including household consumption, government consumption, investment and intermediates) and exports.
For domestic consumption, households—including both rural and urban households—obtain their income from labor wages, returns of capital, and transfers from the government and enterprises. The disposable incomes of rural and urban households, which exclude income taxes from total income, are divided into consumption of commodities or services and savings based on the marginal propensity to consume (MPC). The government raises fiscal revenue by collecting direct and indirect taxes from domestic agents and transfers from foreign agents. After paying for transfers to households and enterprises and export rebates, the government’s fiscal revenue is expended on savings and on various commodities and services. The government’s saving is set at a fixed rate. For both households and the government, the extended linear expenditure system (ELES) function is used to determine consumption of commodities and services. The ELES function is expressed as follows [31]:
C i = P i X i + b i ( Y i n P i X i )
where C i is the expenditure on the i -th commodity or service, P i is the price of the i -th commodity or service, X i is the basic demand for the i -th commodity or service, b i is the parameter that denotes MPC, and Y is disposal income. For investments, the neoclassical closure assumption is adopted. Investment is endogenous and equal to total savings from households, government, enterprises, and foreign agents. For the intermediates, the demand for domestic input and foreign input is decided by a CES technology as described in the supply module.
For the exports, a constant elasticity of transformation (CET) aggregation function between domestic and foreign sales is used. The CET function can be expressed as follows [31]:
Q = B ( i = 1 n γ i Y i ρ ) 1 ρ
where Q is the supply-side output, Y i are the output levels of products, and B , γ , and ρ are the parameters.

2.3. Closure, Equilibrium, and Dynamic Module

Three assumptions are adopted in the closure module. First, the government savings are assumed to be endogenous; second, the exchange rate is assumed to be endogenous, while foreign savings is assumed to be exogenous; third, the total investment equals the total savings, as mentioned above.
The equilibrium exists in commodity or service markets and factor markets. The total supply of each commodity or service equals the total demand for the commodity or service market. The total supply of labor and the capital stock for each sector are exogenous for the factor market.
The recursive dynamic structure is adopted in the dynamic module. This structure is composed of a sequence of several static equilibria. The equilibria are connected to each other through capital accumulation. Moreover, the model dynamics are also driven by labor force growth. The growth rate of the labor force is exogenously determined by the average annual growth rate from 1996 to 2010, which is 0.006 [33]. Capital is accumulated by previous capital minus depreciation and current total investment and can be expressed by [33,34]:
K i , t = ( 1 d i ) K i , t 1 + I i , t
where K i , t is the capital stock by sector i in the period t , I t represents the investment carried out in sector i in the year t , and d i denotes the depreciation rate of capital in sector i , which is 0.05 in this study [26].

2.4. Data and Model Calibration

The model is calibrated based on the social accounting matrix (SAM) of the year 2010. The data of the SAM mainly comes from the 2010 input-output extension table of China. Additionally, other statistical materials were used, including the China Statistical Yearbook 2011, published by the National Bureau of Statistics of China, and the Almanac of China’s Finance and Banking 2011, compiled by the People’s Bank of China. The Finance Year Book of China 2011, completed by the ministry of Finance, People’s Republic of China, was also used to construct the SAM for this study. However, we have a data limitation on the analysis for each rare earth element because there is no published input-output for each element’s production and demand.
Since there is no independent sector for rare earths mining and processing in the 2010 input-output extension table of China, the sector named mining and processing of metal ores was divided into two sectors: mining and processing of rare earths (sector 4) and mining and processing of other metal ores (sector 5). The compilation of rare earth production costs and income data for 2010 is based on the 2010 report of the Inner Mongolia Baotou Steel Rare-earth (Group) Hi-tech Co., Ltd (Baotou, China). Estimates of intermediate supply and final consumption are calculated using the consumption data from Ye and Wu [35].
Based on the SAM, a calibration process is conducted to obtain the parameters in the model, including scale parameters and share parameters. Moreover, the substitution elasticity among different factors and commodities, and the income elasticity of rural and urban households, were obtained from Ge et al. [19] and Zhong et al. [36], as shown in Table 2. The dynamic model is run up to the year 2025 from the base year of 2010.
Specially, the substitution elasticity between rare earths and capital is a key factor in the forecast because it represents the technological improvements on rare earths substitution and recycling. Considering the substitution elasticity between natural resources and capital in other studies, the value of this substitution elasticity in our study is obtained based on the following analysis on the current and future situation of rare earths substitution and recycling.
First, the baseline substitution elasticity between rare earths and capital is assumed to be 0.5. In most studies, the substitution elasticity between natural resources and capital was 0.5–1.2 [37,38,39,40,41]. What we know is that a high degree of substitution between natural resources and capital implies low criticalities of the natural resources because of the strong substitutability of capital, whereas a low degree of substitution implies higher criticalities of the natural resources. Due to the development of renewable energy such as biofuels, the substitution elasticity between fossil fuel and capital is relatively larger than other natural resources, which is mostly between 0.8 and 1.2. According to the currently weak substitutability of rare earths, the baseline substitution elasticity between rare earths and capital in this study is set to the minimum value in the range of 0.5–1.2, which is 0.5.
Second, the substitution elasticity between rare earths and capital under the scenarios of technological improvement is assumed to be 0.8 for most sectors. Regarding the alternatives, some research projects have been funded to find artificial substitutes of rare earths [42]. For instance, the U.S. Department of Energy (DOE) supports the research on nano-composites to make alternative magnets to substitute for rare earths through the Advanced Research Projects Agency-Energy (ARPA-E) program [42]. However, there are very few effective alternatives for rare earths currently. For example, although the German government has funded the research on reluctance motors and asynchronous motors to substitute the pure Nd-containing permanent motors for electric vehicles, these motors are less compact and less efficient in some operational conditions [43,44]. Recycling is a common issue on the agenda worldwide because of the production restriction by China and the price volatility, such as the sharp increase of the rare earths prices in 2010 [43]. However, rare earths still remain at a low commercial recycling rate. Although there is some research on rare earths recycling, less than 1.0% of the rare earths were recycled in 2011 [45,46]. The main reasons are as follows, inefficient collection, technological difficulties and absent incentives (e.g., R and D investment) [47]. Although European countries and Japan have few mineral resources, they are intensifying the efforts to increase the share of rare earths recycling of hi-tech wastes due to the potential of the rare earths recycling [42]. European countries started up “urban mining” projects. Japanese enterprises, such as Dowa Holdings (Tokyo, Japan) and Sumitomo Corporation (Tokyo, Japan), established plants to recover rare earths from old electronics and uranium ore residues [48,49]. However, recycling rare earths from these fields is uneconomical [50]. Toyota, Honda, Hitachi, and Mitsubishi have also announced rare earths recycling initiatives [51]. If the recycling technologies continue to improve, the recycle efficiency can achieve 40% in fluorescent lights, car batteries, and industrial scrap in the long term [52]. In the new future, the average of recycling will reach 10% under optimistic estimate [52]. Compared to the substitution between energy and capital, the substitution between rare earths and capital will still be at a low level in the new future. However, with the funding from governments and enterprises, the alternatives and recycling will meet a small proportion of the total rare earths demand. Therefore, the substitution elasticity between rare earths and capital under the scenarios of technological improvements is set to 0.8 for most sectors in 2025 which is lower than substitution elasticity between energy and capital in most studies. However, according to the criticality assessments by the DOE [53], the substitution elasticity between rare earths and the capital for manufacture of non-metallic products (sector 12) and manufacture of general and special purpose machinery (sector 13) is set to 0.5 due to the ‘critical’ situation in the medium term (2015–2025) of dysprosium, europium, neodymium, terbium, and yttrium.

2.5. Forecast Scenarios

Our construction of scenarios is based on the following four factors. First, because the export regulations—including export quotas and export taxes—were abolished in 2015, rare earth exports will be more sensitive to international price changes. Second, according to the previous study of Han et al. [6], regulations on rare earths in China will be tighter than they were previously, and they will shift from controlling the export process to domestic control, such as by increasing resource taxes or enforcing environmental taxes. Third, according to the ‘Decision of the State Council on Accelerating the Fostering and Development of Strategic Emerging Industries’, the development of industries including energy conservation, environmental protection, new generation information technology, biology, high-end equipment manufacturing, electric vehicles, new energy resources, and new materials will be prioritized until 2030. Fourth, the technological improvements on alternatives and recycling of rare earths will decrease the demands for them in 2025.
Therefore, we created three scenarios for rare earths supply forecasting: a baseline scenario (S0), an easing supply scenario (S1) and a tight supply scenario (S2). The scenarios are described in Table 3. Moreover, in order to reflect the technological improvements, S1 and S2 were further divided into S11 and S12 for S1 and S21 and S22 for S2.
(S0)
Baseline scenario: under current policies, the growth rates of total investment and labor from 2010 to 2025 are assumed to have had an average growth rate over the past ten years; the substitution elasticity of the CET function for the mining and processing of the rare earths sector is assumed to be the same as other minerals without export controls.
(S1)
Easing supply scenario: in addition to S0, the growth rate of total investment in strategic emerging industry (the growth in total investment can improve the production capacities, which has an effect on the production volume. In our DCGE model, total production capacity of China’s economy is determined by the constraint of total capital and labor endowments at a given technology level. For every sector, we adopt a common assumption in DCGE that there has no excess demand or supply of goods and factors in the competitive markets. This means under the constraints of total capital and labor endowments, the production capacity is totally used for production for every sector. Therefore, if capital and labor have an increase from 2010 to 2025, the production capacity will also be enhanced. The CES production function in our model implies that the production volume is determined by the relationship between product price and factor (e.g., capital and labor) price. In our simulation, the growth in the investment is used to increase the capital for sectors and expand production capacity. In addition, the labor increase can also expand production capacity for sectors. Therefore, in our study, the improvement of production capacities is represented by the exogenous growth of investment and labor.) from 2010 to 2025 is assumed to be two times the average growth rate of the past ten years. Under S11, the technologies on substitution and recycling are assumed to be unchanged. Under S12, the technologies are assumed to improve for all the sectors except sectors 12 and 13.
(S2)
Tight supply scenario: in addition to S1, because the Chinese government is focusing on the domestic regulation of rare earths by increasing the resources tax or enforcing environmental taxes, the resource and environmental taxes from 2010 to 2025 are assumed to be two times the current weighted average resource tax, which is 12.0%. Under S21, the technologies on substitution and recycling are assumed to be unchanged. Under S22, the technologies are assumed to improve for all the sectors except sectors 12 and 13.

3. Results

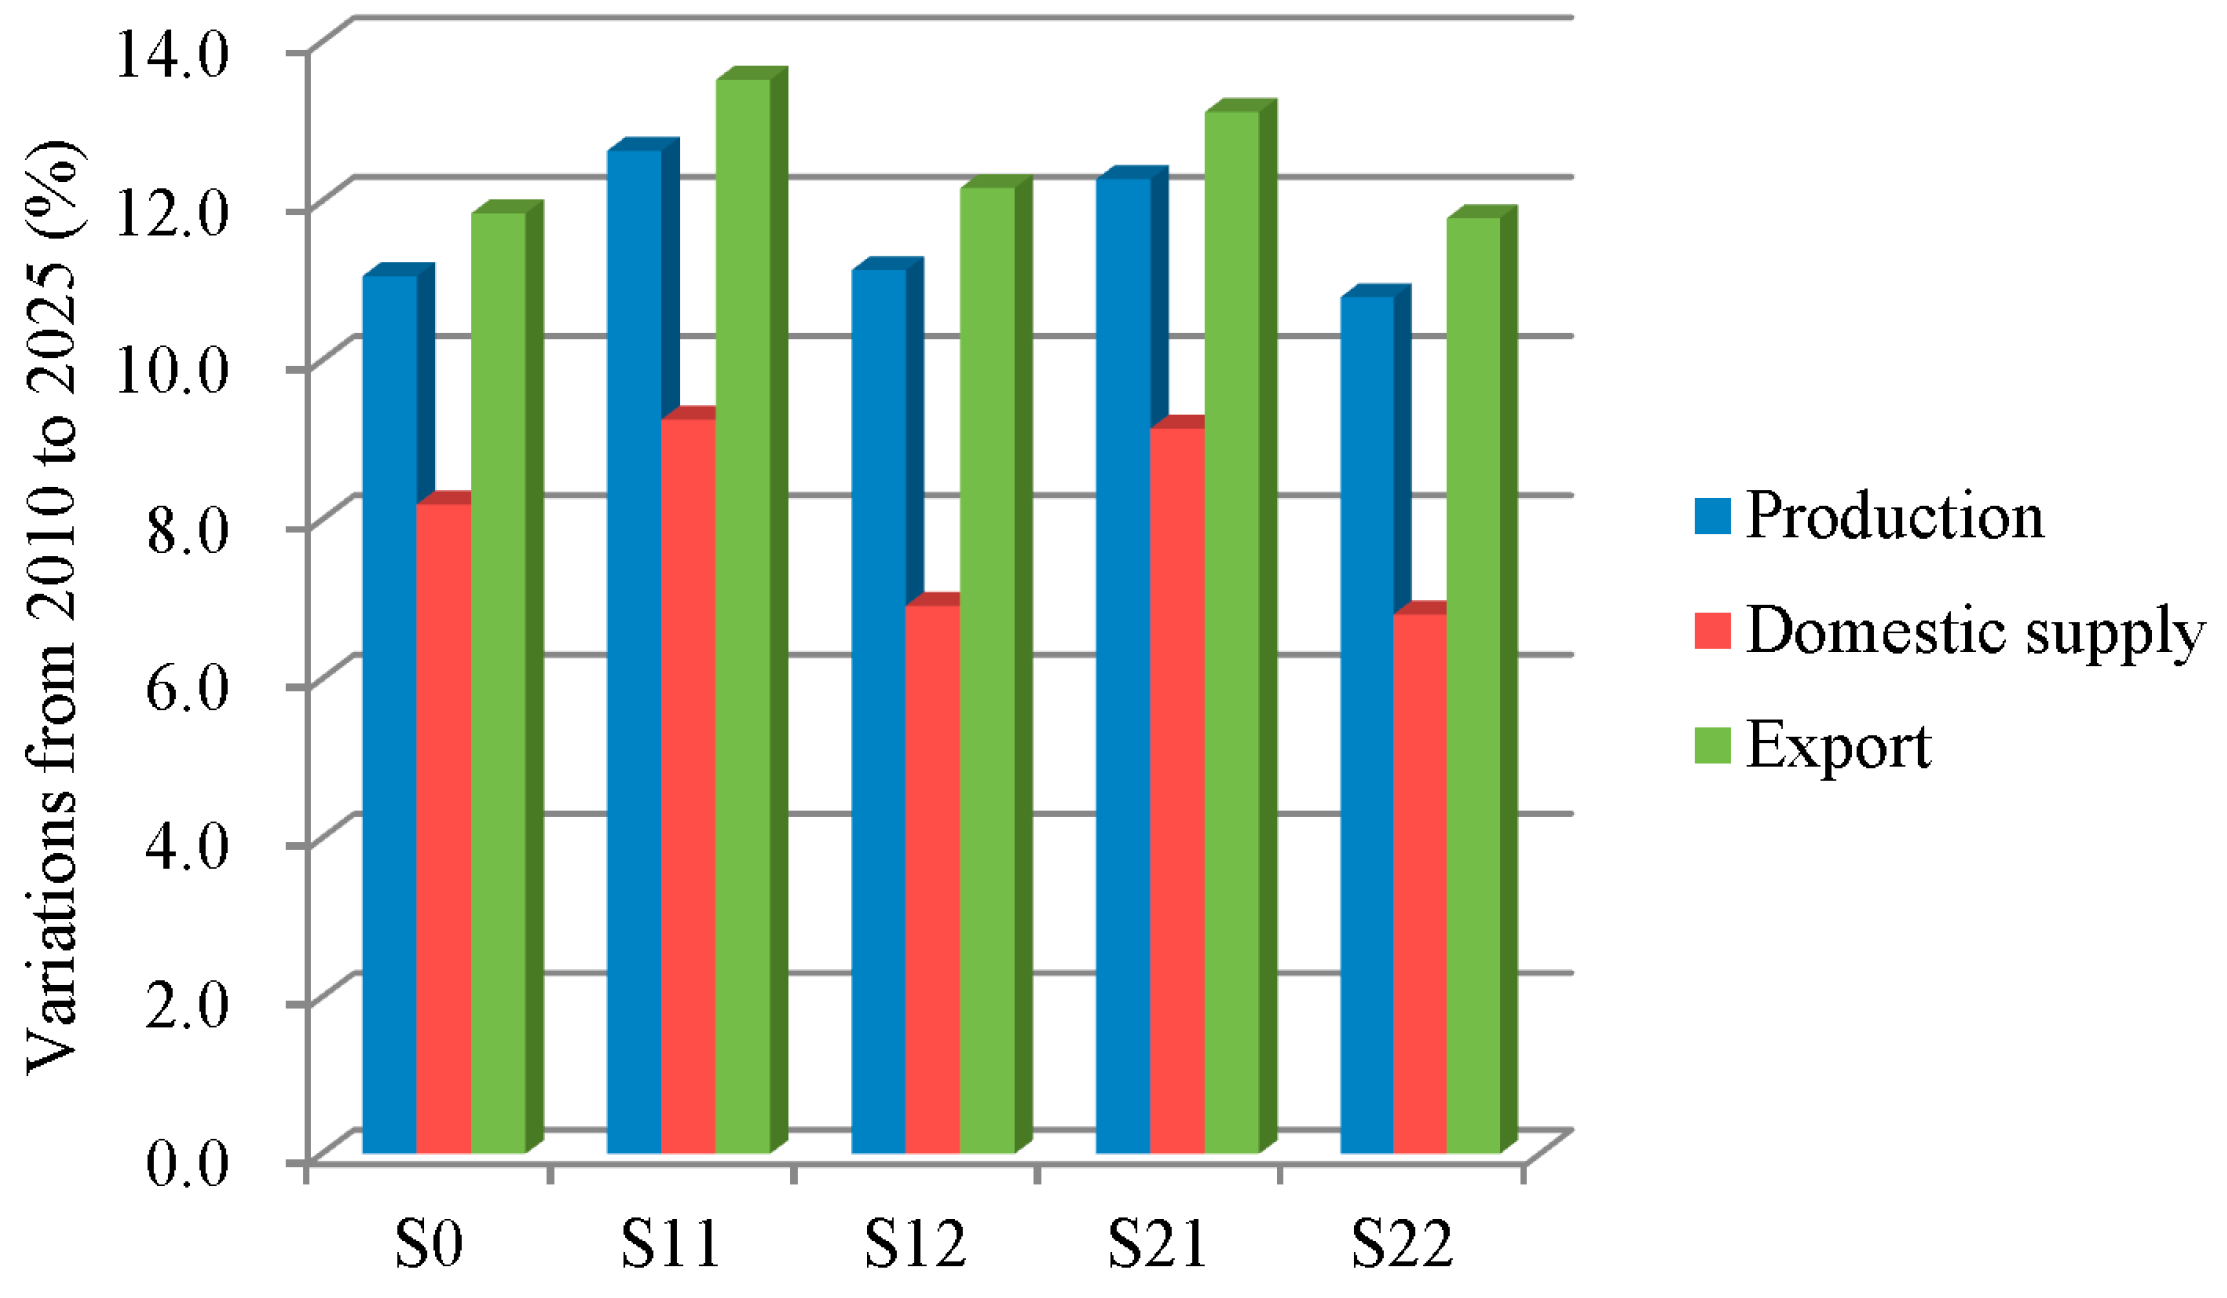
3.1. Total Supply Forecast

Figure 2 shows China’s rare earth production, domestic supply and export variations from 2010 to 2025 in percentages.
Generally, the largest increase is found in production, domestic supply and export under S11. Production, domestic supply, and exports in 2025 would increase by 12.6%, 9.3%, and 13.5% compared to their levels in 2010, respectively. The variations under S21 indicate that tight supply (induced by the domestic regulations of resource and environmental taxes) would be eased by promoting strategic emerging industries. Production, domestic supply and exports under S21 increase by 12.3%, 9.1% and 13.1%, respectively, which are lower than under S11 but higher than under S0. This also sends a message to the Chinese government about policy conflicts in rare earth regulations. Under S0, due to continuous and steady investment in the relevant sectors and the cessation of export regulations on rare earths, production, domestic supply, and exports in 2025 would still increase by 11.1%, 8.2%, and 11.9% compared to 2010 levels, respectively, with no other new policies.
Moreover, considering the technological improvements on substitution and recycling, the production, domestic supply and exports under S12 only increase by 11.1%, 6.9%, and 12.2% compared to 2010 levels. The growth rate under S12 is significantly lower than that under S11 due to the replacement of other materials for rare earths and the recycling of the used rare earths in the downstream products manufacturing. A more pessimistic forecast appears under S22. Due to the increase in the resource and environmental tax rate and the improvement in the technologies, the production, domestic supply, and exports under S22 increase by 10.8%, 6.8%, and 11.8%, which are even lower than the increases under S0.
In 2010, the production of rare earths in China was 130,000 tons REO, out of which the output sale to home markets was 87,025 tons REO, while the export was 42,975 tons REO [54]. Due to extraction control, the production of rare earths fluctuated, with an output of 95,000–105,000 tons REO from 2011 to 2015 [5]. To make future projections more representative of the Chinese government’s plan, we use 105,000 tons REO as the basis of our forecast. Therefore, production, domestic supply, and exports in 2025 will be adjusted to 116,335–118,260 tons REO, 75,081–76,800 tons REO, and 38,797–39,400 tons REO, respectively.

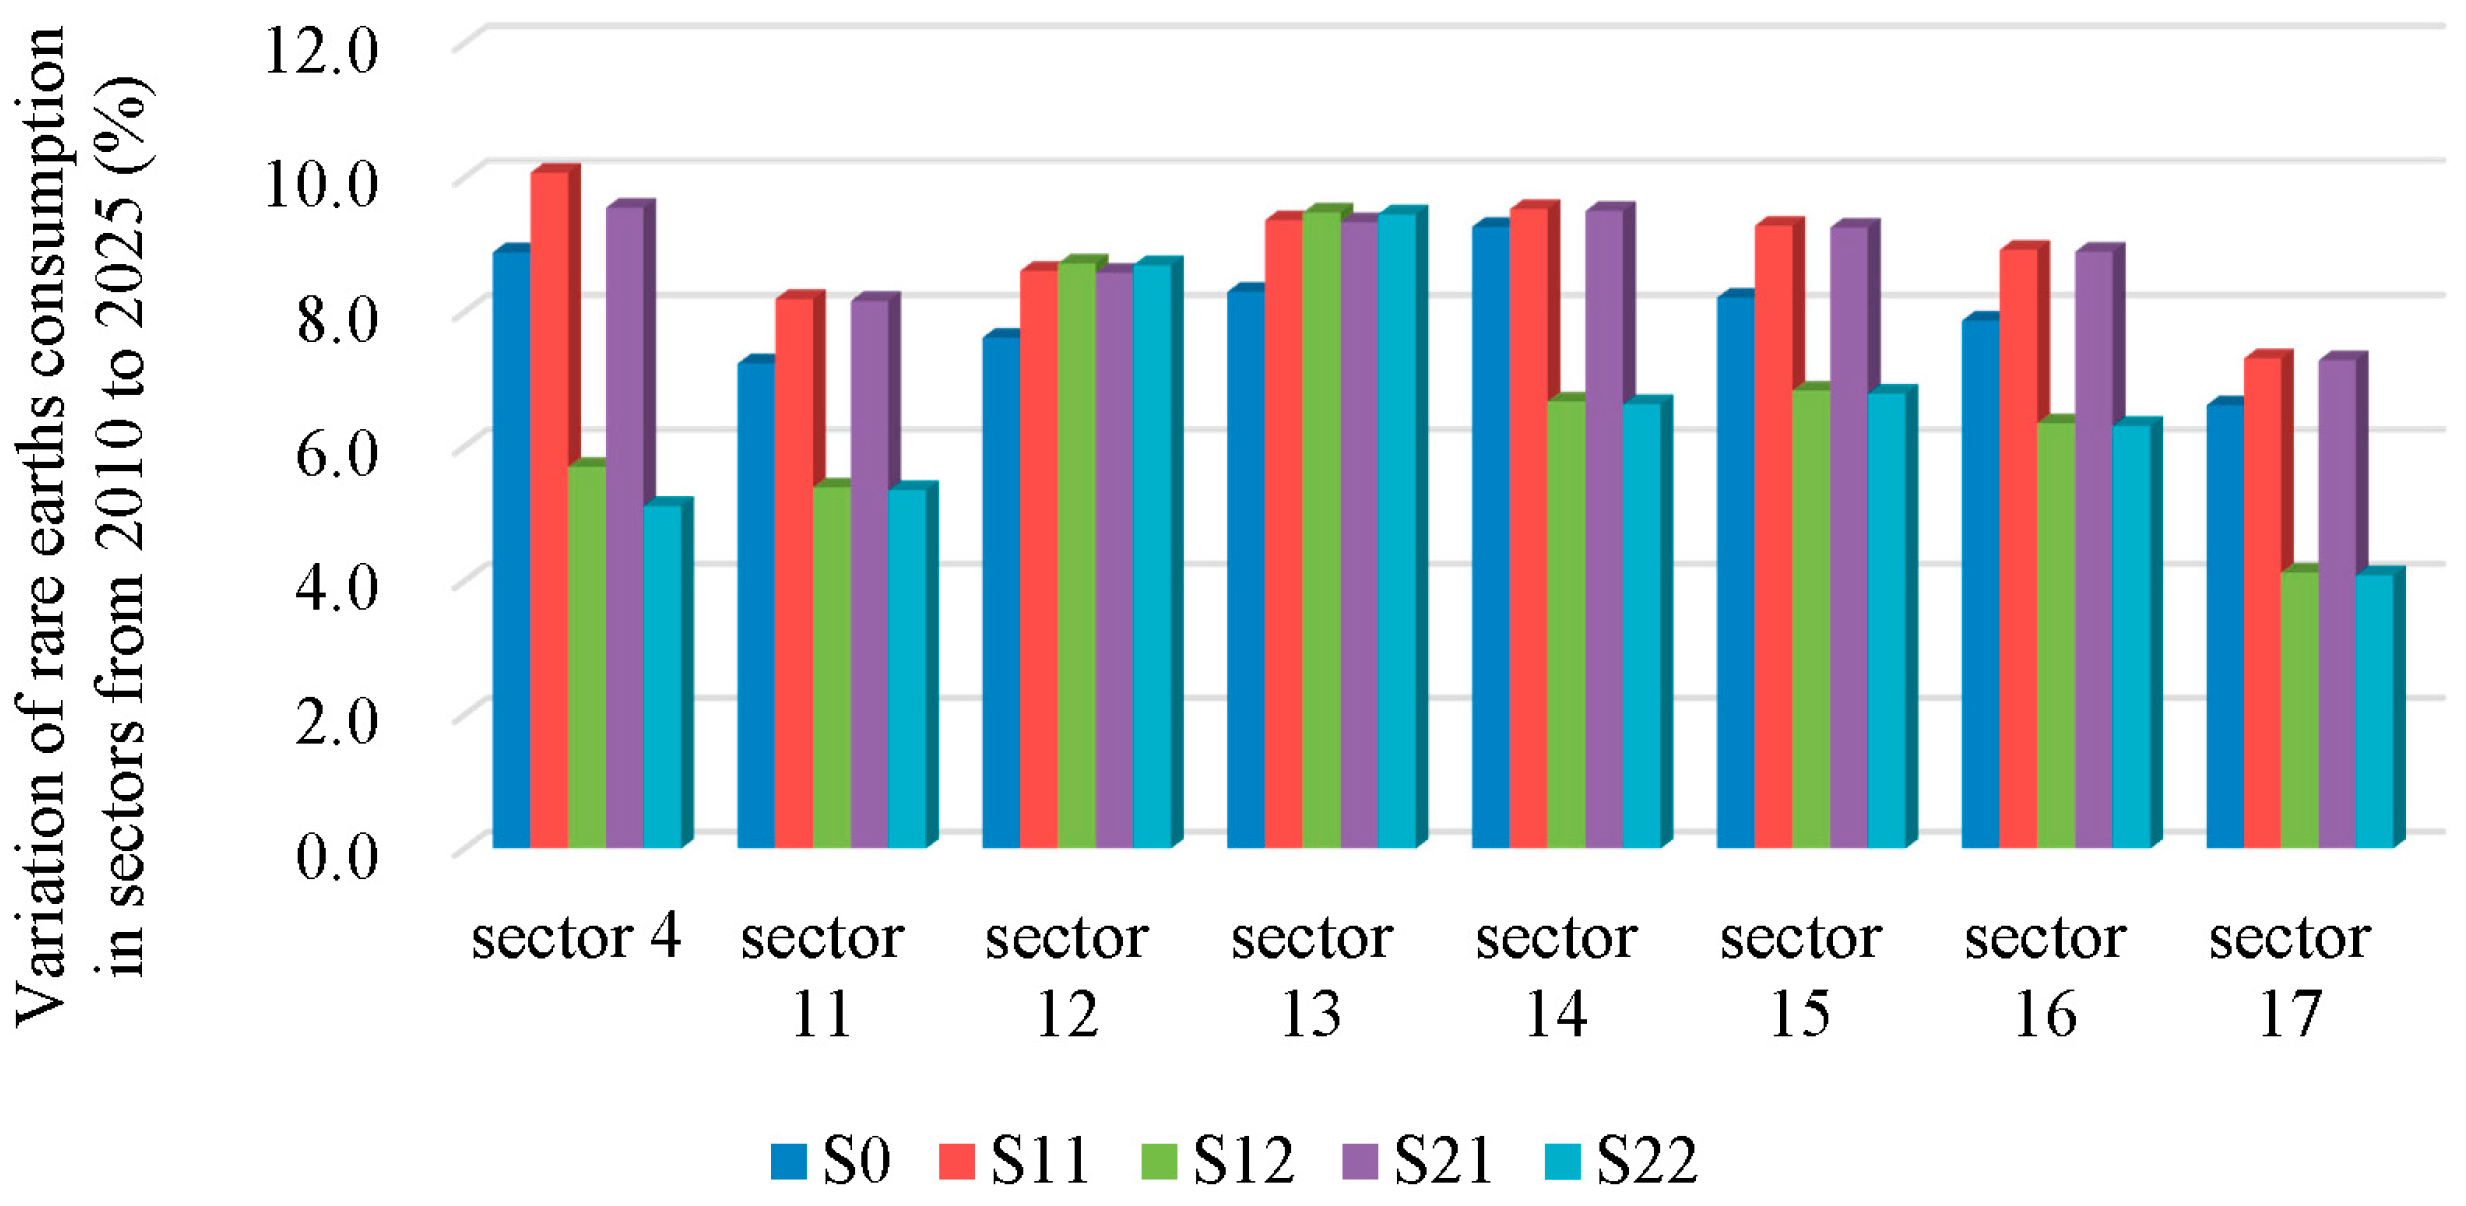
3.2. Sectoral Supply Forecast

Figure 3 illustrates the variations in rare earths supply in relevant sectors from 2010 to 2025.
The largest increase occurs under S11 in all sectors except sectors 12 and 13. Due to the scarcity of alternatives and low recycling efficiency, the largest increase exists under S12 in sectors 12 and 13. If the expected technological improvement happens, the increase in rare earths consumption in other sectors would decrease significantly.
Among the sectors in Figure 3, the increased investment in strategic emerging industries under S11 will make the rare earths demand in these four sectors increase by more than 9%, including the mining and processing of rare earths (sector 4), the manufacture of transport equipment (sector 14), the manufacture of general and special purpose machinery (sector 13), and the manufacture of electrical machinery and equipment (sector 15). However, the increase is held back under the intervention of resource and environmental tax. Especially, the increase in the mining and processing of rare earths (sector 4) decrease by 0.5% compared S21 to S11.
Regarding the effect of technological improvement, the alternatives and recycling decrease the growth rate by 4.4% for the mining and processing of rare earths (sector 4), 3.2% for the other manufactures (sector 17), and 2.9% for the manufacture of transport equipment (sector 14) compared S12 to S11. Therefore, due to the technological improvement or regulatory policy intervention, the rare earths mining will be curbed. This implies that the number of mining projects of rare earths will decrease in the short and medium term.

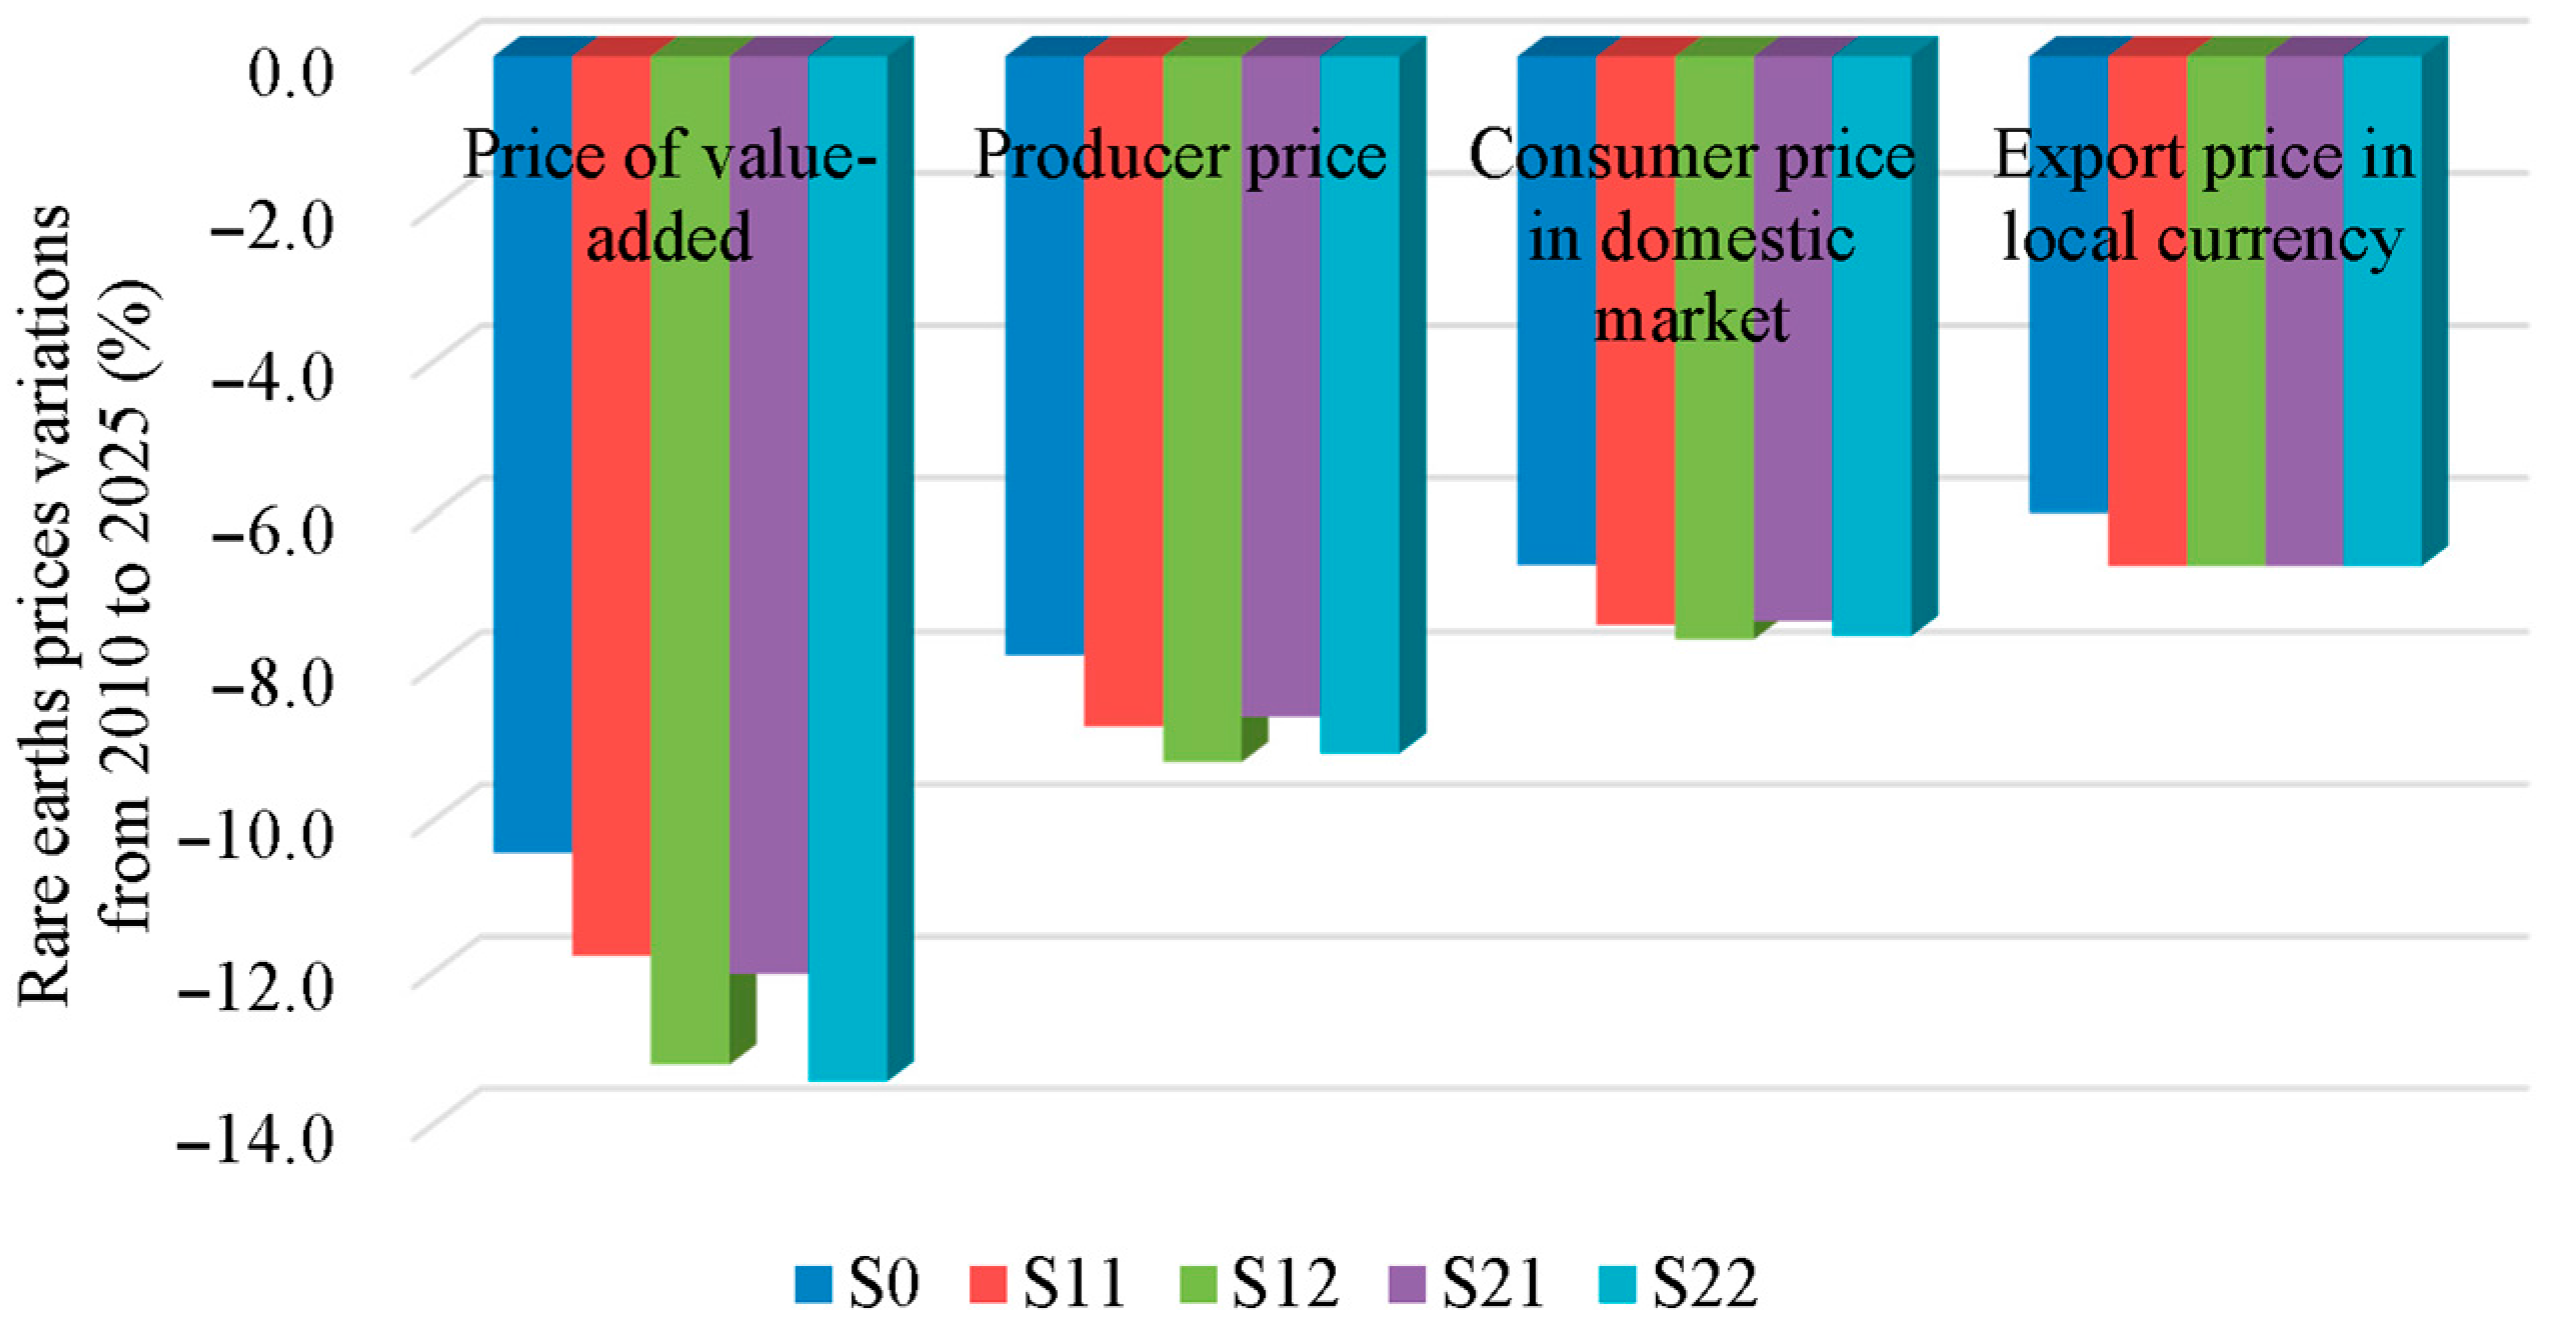
3.3. Price Change Forecast

Figure 4 shows the rare earths prices variations from 2010 to 2025. The prices include price of value-added, producer price, consumer price in domestic market, and export price in local currency.
As shown from Figure 4, the rare earths prices all decrease from 2010 to 2025 due to the investment-driven economy of China [55,56]. China is facing a huge overcapacity problem in the rare earths industry because it is one of the least-regulated industries by most standards, especially by environmental ones [57]. With the slowdown in population growth and urbanization, consumption, especially on household appliances, will show a declining growth. However, the investment still goes on the production side, which will lead to overcapacity and the increase in the prices on rare earths as the intermediate input [58]. The annual capacity of rare earths separation in China is estimated to exceed 450,000 tons and actual output is between 200,000 and 300,000 tons, while actual global demand is only 120,000–150,000 tons [57,59]. This unbalanced supply and demand relationship is the major reason for the decreasing prices from 2010 to 2025.
From the left side of value-added price to the right side of export price, the prices variations are diminishing, which are caused by the following action process. First, the investment is acting on the production side that increases the capital supply and, furthermore, leads to the decrease in the value-added price. Second, the producer price is formed by the Leontief relationship between value-added price and intermediate price, which weakens the impact of the decrease in the value-added price. Third, the consumer price in the domestic home market is decided by the Armington relationship between imports and domestic supply, which reduces the impact of the decrease in the producer price. Finally, export price is determined by the CET relationship between export and domestic consumption, which also weakens the impact of the decrease in the consumer price. Meanwhile, this action process also leads to the differences in each price among the scenarios from left side to right side.
The investment firstly acts on the price of value-added. From 2010 to 2025, the price of value-added decreases by 10.4%–13.4%. Specifically, the investment on the strategic emerging industries (S11) would extra decrease the price by 1.4% compared to S0 and further strengthen the trend of falling price. If coupled with the impact of technological improvement (S12), the price would extra drop by 2.8% compared to S0. The variation pattern in the price of value-added also occurs in the producer price, consumer price in domestic market, and export price.

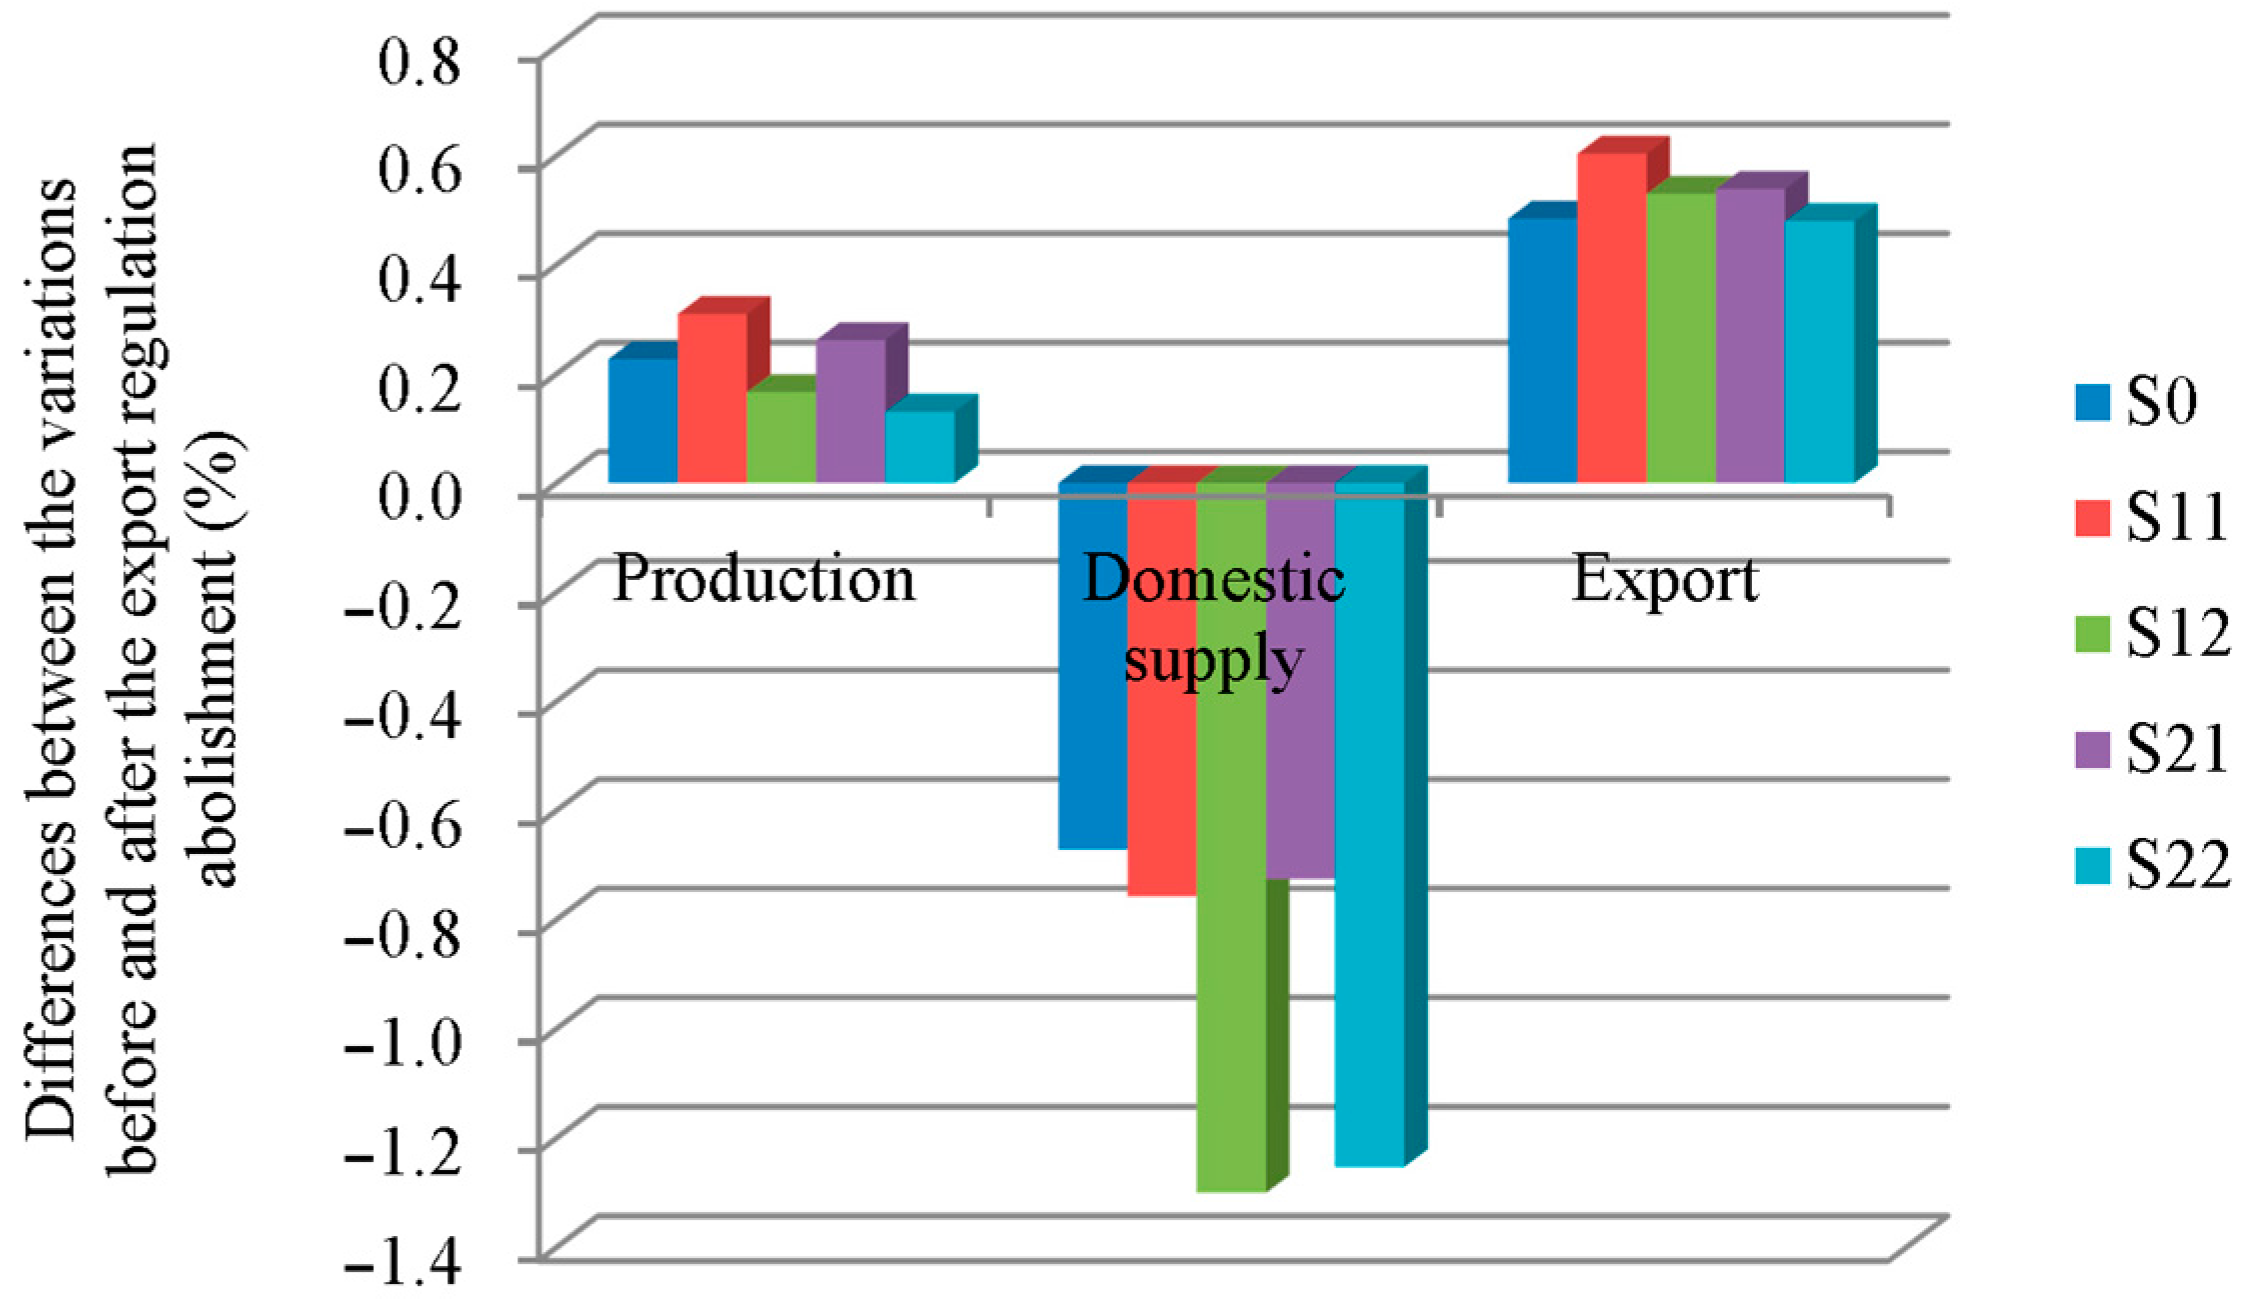
3.4. Comparisons of the Variations before and after the Abolition of Export Regulations

Export regulation, particularly export quotas, plays an important role in China’s rare earth supply. One reason is that export regulation decreases the real international market demand for rare earths. Another reason is that export regulation also reduces the sensitivity of the rare earth supply to the international market price. Therefore, we also compare the future rare earth supply before and after the end of export regulations. To simulate export regulation, the substitution elasticity of the CET function for sector 4 is assumed to be 1.15.
Figure 5 and Figure 6 show the comparisons of supply variations before and after the abolition of export regulations. According to these two figures, the abolition of export regulations releases the demand, especially the international demand, for rare earths and makes the exports sensitive to international market prices, which leads to an increase in future production and exports. However, domestic rare earths supply, about which the Chinese government has been concerned, will decrease by 0.7%–1.3%. Moreover, for all relevant sectors, the rare earths supply will also decrease. The decreases in domestic rare earths supply under the scenarios of technological improvement (S12 and S22) are larger than that without technological improvement. Moreover, the alternatives and recycling also cause a smaller increase in rare earths production and export.

4. Conclusions and Policy Implications

Rare earths are important strategic minerals, and forecasting their supply is an essential issue for national economic development and security. China has a large amount of rare earths deposits and, thus, is one of the major rare earth producing and exporting countries in the world. This paper forecasts China’s rare earths production, domestic supply and exports in 2025 using a dynamic computable general equilibrium model. From the demand and production sides, we designed two scenarios: (1) an increase in investment in China’s strategic emerging industries; (2) an increase in the domestic resources tax and environmental tax on rare earths. In each scenario, a technological improvement on substitution and recycling is also taken into account. Based on the results of the analyzed scenarios, we reached four main conclusions and policy recommendations:
(1)
China’s rare earths supply will resume its growth trend in the future. The production of rare earths in China will reach 116,335–118,260 tons REO in 2025 based on recent extraction control from 2011 to 2015. In 2016, the Ministry of Land and Resources of the People’s Republic of China released its extraction control on rare earths, which was 105,000 tons REO (the same as the 2015 amount). However, production will increase for the following reasons: first, an increase in foreign demand will lead to a decrease in domestic supply, which will prompt the loosening of extraction control and intensify recycling. According to Figure 2, the increase in exports is larger than that in domestic supply; second, domestic demand for rare earths will grow in strategic emerging industries such as clean energy and electric vehicles.
(2)
Due to the investment on strategies emerging industries, the mining and processing of rare earths (sector 4), the manufacture of transport equipment (sector 14), the manufacture of general and special purpose machinery (sector 13), and the manufacture of electrical machinery and equipment (sector 15) will be the most important targets of the future supply of rare earths in China. However, because of few alternatives and low recycling efficiency, the domestic supply will focus on the manufacture of non-metallic mineral and metal products (sector 12) and the manufacture of general and special purpose machinery (sector 13).
(3)
The number of mining projects of rare earths will decrease in the short and medium term due to technological improvement on substitution and recycling and regulatory policies intervention.
(4)
The elimination of export regulations, including export quotas and export taxes, will have a negative impact on China’s future domestic supply of rare earths. Compared to the situation with export regulations, production would increase by 0.1%–0.3% while domestic supply would decrease by 0.7%–1.3%. The same is true in the sectoral supply of rare earths.
(5)
Policy conflicts will affect China’s future rare earths supply. In addition to the executive order type of policy instruments such as extraction control, the Chinese government also adopts economic policy instruments, such as resource taxes, to regulate rare earths supply. However, when the government increases investment or gives subsidies to strategic emerging industries, the regulatory effects of these tax policy instruments will be greatly reduced.

Acknowledgments

This research was financial supported by the Natural Sciences Foundation of China (NSFC) (71203203), the MOE project of Humanities and Social Sciences (12YJCZH057), and the Beijing Higher Education Young Elite Teacher Project (YETP0667).

Author Contributions

Jianping Ge, Yalin Lei and Lianrong Zhao conceived and designed the experiments; Jianping Ge performed the experiments; Jianping Ge analyzed the data; Jianping Ge and Lianrong Zhao provided policy recommodations; Jianping Ge wrote the paper.

Conflicts of Interest

The authors declare no conflict of interest.

References

  1. McLellan, B.C.; Corder, G.D.; Ali, S.H. Sustainability of rare earths—An overview of the state of knowledge. Minerals 2013, 3, 304–317. [Google Scholar] [CrossRef]
  2. Xie, F.; Zhang, T.A.; Dreisinger, D.; Doyle, F. A critical review on solvent extraction of rare earths from aqueous solutions. Miner. Eng. 2014, 56, 10–28. [Google Scholar] [CrossRef]
  3. Hower, J.C.; Granite, E.J.; Mayfield, D.B.; Lewis, A.S.; Finkelman, R.B. Notes on contributions to the science of rare earth element enrichment in coal and coal combustion byproducts. Minerals 2016, 6, 32. [Google Scholar] [CrossRef]
  4. Wang, X.B.; Lei, Y.L.; Ge, J.P.; Wu, S.M. Production forecast of China’s rare earths based on the Generalized Weng model and policy recommendations. Resour. Policy 2015, 43, 11–18. [Google Scholar] [CrossRef]
  5. U.S. Geological Survey (USGS). Mineral Commodity Summaries—Rare Earths. 2016. Available online: http://minerals.usgs.gov/minerals/pubs/commodity/rare_earths/mcs-2016-raree.pdf (accessed on 23 July 2016). [Google Scholar]
  6. Han, A.P.; Ge, J.P.; Lei, Y.L. An adjustment in regulation policies and its effect on market supply: Game analysis for China’s rare earths. Resour. Policy 2015, 46, 30–42. [Google Scholar] [CrossRef]
  7. Wübbeke, J. Rare earth elements in China: Policies and narratives of reinventing an industry. Resour. Policy 2013, 38, 384–394. [Google Scholar] [CrossRef]
  8. Zhang, L.; Guo, Q.; Zhang, J.B.; Huang, Y.; Xiong, T. Did China’s rare earth export policies work?—Empirical evidence from USA and Japan. Resour. Policy 2015, 43, 82–90. [Google Scholar] [CrossRef]
  9. Dadwal, S.R. The Sino-Japanese rare earths row: Will China’s loss be India’s gain? Strateg. Anal. 2011, 35, 181–185. [Google Scholar] [CrossRef]
  10. Liu, H.W.; Maughan, J. China’s rare earths export quotas: Out of the China-raw materials gate, but past the WTO’s finish line? J. Int. Econ. Law 2012, 15, 971–1005. [Google Scholar] [CrossRef]
  11. Ting, M.H.; Seaman, J. Rare earths: Future elements of conflict in Asia? Asian Stud. Rev. 2013, 37, 234–252. [Google Scholar] [CrossRef]
  12. Qin, J.Y. Judicial authority in WTO law: A commentary on the Appellate Body’s decision in China-rare earths. Chin. J. Int. Law 2014, 13, 639–651. [Google Scholar] [CrossRef]
  13. Bond, E.W.; Trachtman, J. China-rare earths: Export restrictions and the limits of textual interpretation. World Trade Rev. 2016, 15, 189–209. [Google Scholar] [CrossRef]
  14. Chen, Z.H. Global rare earth resources and scenarios of future rare earth industry. J. Rare Earths 2011, 29, 1–6. [Google Scholar] [CrossRef]
  15. Zhang, M.G.; Chen, Y.H. Supply and demand of global rare earth resources and China’s rare earth industry policy. Nonferr. Met. Sci. Eng. 2012, 4, 70–74. [Google Scholar] [CrossRef]
  16. Hurst, C. China’s Rare Earth Elements Industry: What Can the West Learn? Institute for the Analysis of Global Security: Washington, DC, USA, 2010. [Google Scholar]
  17. Kingsnorth, D.J. An Overview of the Rare Earths Market; IMCOA: Kingaroy, Australia, 2010. [Google Scholar]
  18. Waschik, R.; Fraser, I. A computable general equilibrium analysis of export taxes in the Australian wool industry. Econ. Model. 2007, 24, 712–736. [Google Scholar] [CrossRef]
  19. Ge, J.P.; Lei, Y.L.; Suminori, T. Non-grain fuel ethanol expansion and its effects on food security: A computable general equilibrium analysis for China. Energy 2014, 65, 346–356. [Google Scholar] [CrossRef]
  20. Devarajan, S. Natural resources and taxation in computable general equilibrium models of developing countries. J. Policy Model. 1988, 10, 505–528. [Google Scholar] [CrossRef]
  21. Xie, J.; Saltzman, S. Environmental policy analysis: An environmental computable general-equilibrium approach for developing countries. J. Policy Model. 2000, 22, 453–489. [Google Scholar] [CrossRef]
  22. Böhringer, C.; Conrad, K.; Löschel, A. Carbon taxes and joint implementation. An applied general equilibrium analysis for Germany and India. Environ. Resour. Econ. 2003, 24, 49–76. [Google Scholar] [CrossRef]
  23. Rose, A.; Liao, S.Y. Modeling regional economic resilience to disasters: A computable general equilibrium analysis of water service disruptions. J. Reg. Sci. 2005, 45, 75–112. [Google Scholar] [CrossRef]
  24. Zhang, Z.K.; Guo, J.E.; Qian, D.; Xue, Y.; Cai, L.P. Effects and mechanism of influence of China’s resource tax reform: A regional perspective. Energy Econ. 2013, 36, 676–685. [Google Scholar] [CrossRef]
  25. Silviu, D.A. Simulating the economic impact of resources depletion using a computable general equilibrium model for Romania. Procrdia Econ. Financ. 2015, 22, 618–626. [Google Scholar] [CrossRef]
  26. Tang, L.; Shi, J.R.; Yu, L.; Bao, Q. Economic and environmental influences of coal resource tax in China: A dynamic computable general equilibrium approach. Resour. Conserv. Recycl. 2015. [Google Scholar] [CrossRef]
  27. Xu, X.L.; Xu, X.F.; Chen, Q.; Che, Y. The impact on regional “resource curse” by coal resource tax reform in China—A dynamic CGE appraisal. Resour. Policy 2015, 45, 277–289. [Google Scholar] [CrossRef]
  28. Polo, C.; Sancho, F. Insights or forecasts? An evaluation of a computable general equilibrium model of Spain. J. Forecast. 1993, 12, 437–448. [Google Scholar] [CrossRef]
  29. Blake, A.; Durbarry, R.; Eugenio-Martin, J.L.; Gooroochurn, N.; Hay, B.; Lennon, J.; Scinclari, M.T.; Sugiyarto, G.; Yeoman, I. Integrating forecasting and CGE models: The case of tourism in Scotland. Tour. Manag. 2006, 27, 292–305. [Google Scholar] [CrossRef]
  30. Armington, P.S. A theory of demand for products distinguished by place of production. Staff Pap. (IMF Econ. Rev.) 1969, 16, 159–178. [Google Scholar] [CrossRef]
  31. Hosoe, N.; Gasawa, K.; Hashimoto, H. Textbook of Computable General Equilibrium Modeling: Programming and Simulations; Palgrave Macmillan: Basingstoke, UK, 2010. [Google Scholar]
  32. Krinsky, I. The small country assumption: A note on Canadian exports. Appl. Econ. 1983, 15, 73–79. [Google Scholar] [CrossRef]
  33. Bao, Q.; Tang, L.; Zhang, Z.X.; Wang, S.Y. Impacts of border carbon adjustments on China’s sectoral emissions: Simulations with a dynamic computable general equilibrium model. China Econ. Rev. 2013, 24, 77–94. [Google Scholar] [CrossRef]
  34. Tang, L.; Shi, J.R.; Bao, Q. Designing an emissions trading scheme for China with a dynamic computable general equilibrium model. Energy Policy 2016, 97, 507–520. [Google Scholar] [CrossRef]
  35. Ye, R.S.; Wu, Y.D. Study on the Strategic Development and Export Regulation Policy of China’s Rare Earths; Science Press: Beijing, China, 2014. [Google Scholar]
  36. Zhong, S.; Shen, L.; Sha, J.H.; Okiyama, M.; Tokunaga, S.; Liu, L.T.; Yan, J.J. Assessing the water parallel pricing system against drought in China: A study based on a CGE model with multi-provincial irrigation water. Water 2015, 7, 3431–3465. [Google Scholar] [CrossRef]
  37. Moroney, J.R.; Trapani, J.M. Factor demand and substitution in mineral-intensive industries. Bell J. Econ. 1981, 12, 272–284. [Google Scholar] [CrossRef]
  38. Markandya, A.; Pedroso-Galinato, S. How substitutable is natural capital? Environ. Resour. Econ. 2007, 37, 297–312. [Google Scholar] [CrossRef]
  39. Wesseh, P.K., Jr.; Lin, B.Q.; Appiah, M.O. Delving into Liberia’s energy economy: Technical change, inter-factor and inter-fuel substitution. Renew. Sustain. Energy Rev. 2013, 24, 122–130. [Google Scholar] [CrossRef]
  40. Saunders, H.D. Toward a neoclassical theory of sustainable consumption: Eight golden age propositions. Ecol. Econ. 2014, 105, 220–232. [Google Scholar] [CrossRef]
  41. Zha, D.L.; Ding, N. Elasticities of substitution between energy and non-energy inputs in China power sector. Econ. Model. 2014, 38, 564–571. [Google Scholar] [CrossRef]
  42. Massari, S.; Ruberti, M. Rare earths elements as critical raw materials: Focus on international markets and future strategies. Resour. Policy 2013, 38, 36–43. [Google Scholar] [CrossRef]
  43. Schüler, D.; Buchert, M.; Liu, R.; Dittrich, S.; Merz, C. Study on Rare Earths and Their Recycling; Öko-Institut e.V.: Darmstadt, Germany, 2011. [Google Scholar]
  44. Aston, A. China’s Rare-Earth Monopoly. MIT Technology Review. 15 October 2010. Available online: http://www.arafuraresources.com.au/about_re.html (accessed on 16 August 2011).
  45. Binnemans, K.; Jones, P.T.; Blanpain, B.; Gerven, T.V.; Yang, Y.X.; Walton, A.; Buchert, M. Recycling of rare earths: A critical review. J. Clean. Prod. 2013, 51, 1–22. [Google Scholar] [CrossRef]
  46. Tanaka, M.; Oki, T.; Koyama, K.; Narita, H.; Oishi, T. Recycling of rare earths from scrap. In Handbook on the Physics and Chemistry of Rare Earths; Bunzli, J.C.G., Pecharsky, V.K., Eds.; Elsevier: Amsterdam, The Netherlands, 2013; Volume 43, pp. 159–212. [Google Scholar]
  47. Reck, B.K.; Graedel, T.E. Challenges in metal recycling. Science 2012, 337, 690–695. [Google Scholar] [CrossRef] [PubMed]
  48. Sumitomo Corp. Sumitomo Corporation Embarks on a Rare-Earth Recovery Project in the Republic of Kazakhstan. SC News. 12 August 2009. Available online: http://www.sumitomocorp.co.jp/english/news/detail/id=26218 (accessed on 15 August 2016).
  49. Tabuchi, H. Japan Recycles Minerals From Used Electronics. New York Times. 4 October 2010. Available online: http://www.nytimes.com/2010/10/05/business/global/05recycle.html?_r=0 (accessed on 15 August 2016).
  50. Marshall, J. Why Rare Earths Recycling Is Rare. Ensia. 7 April 2014. Available online: http://ensia.com/features/why-rare-earth-recycling-is-rare-and-what-we-can-do-about-it/ (accessed on 15 August 2016).
  51. Golev, A.; Scott, M.; Erskine, P.D.; Ali, S.H.; Ballantyne, G.R. Rare earths supply chains: Current status, constraints and opportunities. Resour. Policy 2014, 41, 52–59. [Google Scholar] [CrossRef]
  52. Free, K. The Future of Rare Earth Recycling. Scienceline, 3 March 2014. Available online: http://scienceline.org/2014/03/the-future-of-rare-earth-recycling/ (accessed on 15 August 2016).
  53. U.S. Department of Energy (DOE). Critical Materials Strategy. 2011. Available online: http://energy.gov/sites/prod/files/DOE_CMS2011_FINAL_Full.pdf (accessed on 15 August 2016). [Google Scholar]
  54. U.S. Geological Survey (USGS). Mineral Commodity Summaries—Rare Earths. 2011. Available online: http://minerals.usgs.gov/minerals/pubs/commodity/rare_earths/index.html (accessed on 23 July 2016). [Google Scholar]
  55. Liu, M.X.; Tao, R.; Yuan, F.; Cao, G.Z. Instrumental land use investment-driven growth in China. J. Asia Pac. Econ. 2008, 13, 313–331. [Google Scholar] [CrossRef]
  56. Fu, F.; Ma, L.W.; Li, Z.; Polenske, K.R. The implications of China’s investment-driven economy on its energy consumption and carbon emissions. Energy Convers. Manag. 2014, 85, 573–580. [Google Scholar] [CrossRef]
  57. Mancheri, N.A. World trade in rare earths, Chinese export restrictions, and implications. Resour. Policy 2015, 46, 262–271. [Google Scholar] [CrossRef]
  58. Overholt, W.H. China in the global financial crisis: Rising influence, rising challenges. Wash. Q. 2010, 33, 21–34. [Google Scholar] [CrossRef]
  59. Chen, Z.H. Rare earth market overview in 2014 and market prospect for 2015. In Proceedings of the China Rare Earth Market Conference, Haikou, China, 25–27 March 2015.
Figure 1. Structure of China’s DCGE model for forecasting rare earths (within a period).
Minerals 06 00095 g001
Figure 2. Production, domestic supply, and export variations from 2010 to 2025 (%).
Minerals 06 00095 g002
Figure 3. Rare earths consumption variation in relevant sectors from 2010 to 2025 (%).
Minerals 06 00095 g003
Figure 4. Rare earths prices variations from 2010 to 2025 (%).
Minerals 06 00095 g004
Figure 5. Differences among the variations in production, domestic supply and exports before and after the abolition of export regulations (%).
Minerals 06 00095 g005
Figure 6. Differences among the variations in rare earths supply in different sectors before and after the abolition of export regulations (%).
Minerals 06 00095 g006
Table 1. Sectors and commodities in the China’s DCGE model.
Sector CodeSector/CommoditySector CodeSector/Commodity
1Agriculture14Manufacture of transport equipment
2Mining and washing of coal15Manufacture of electrical machinery and equipment
3Extraction of petroleum and natural gas16Manufacture of electronic equipment
4Mining and processing of rare earths17Other manufactures
5Mining and processing of other metal ores18Production and supply of electric power and heat power
6Mining and processing of nonmetal ores19Production and supply of gas
7Manufacture of food20Production and supply of water
8Manufacture of textiles21Construction
9Manufacture of wood products22Transportation services
10Processing of petroleum and coke23Wholesale, retail trade, hotel and restaurant
11Manufacture of chemical products24Financial services
12Manufacture of non-metallic mineral and metal products25Education, health, culture and sports
13Manufacture of general and special purpose machinery26Other services
Table 2. Value of elasticity parameters of the model.
Sector CodeSubstitution Elasticities of CET FunctionSubstitution Elasticities of Armington FunctionSubstitution Elasticities between Capital Composite and LaborSubstitution Elasticities between Natural Capital and Monetary CapitalIncome Elasticities of Rural HouseholdIncome Elasticities of Urban Household
13.603.000.800.500.850.37
24.603.700.800.500.250.86
34.603.700.800.500.250.86
44.603.700.800.500.250.86
54.603.700.800.500.250.86
64.603.700.800.500.250.86
74.603.800.800.500.940.81
84.603.800.800.500.940.81
94.603.800.800.500.940.81
104.603.700.800.500.250.86
114.603.800.800.500.940.81
124.603.800.800.500.940.81
134.603.800.800.500.940.81
144.603.800.800.500.940.81
154.603.800.800.500.940.81
164.603.800.800.500.940.81
174.603.800.800.500.940.81
184.604.400.800.500.990.86
194.604.400.800.500.990.86
204.604.400.800.500.990.86
213.801.900.800.501.231.23
222.801.900.800.500.990.86
232.801.900.800.501.080.82
242.801.900.800.501.270.86
252.801.900.800.501.080.82
262.801.900.800.501.080.82
Table 3. Forecast scenarios.
Items for Forecast ScenariosSubdivision of Items for Forecast ScenariosS0S1S2
-S11S12S21S22
Growth rate of total investment (%)Primary industry14.314.314.314.314.3
Secondary industry19.538.9 for SEI38.9 for SEI38.9 for SEI38.9 for SEI
19.5 for others19.5 for others19.5 for others19.5 for others
Tertiary industry20.020.020.020.020.0
Growth rate of total labor (%)-0.60.60.60.60.6
Substitution elasticity between rare earths and capital-0.50.50.5 for sector 12 and 130.50.5 for sector 12 and 13
-0.8 for others0.8 for others
Substitution elasticity of CET function for sector 4-4.64.64.64.64.6
Resource and environmental tax (%)-12.012.012.023.923.9
Note: SEI is strategic emerging industry, which includes sectors 11, 12, 13, 14, 15, 16, 17, 18, 20.

