Tracing Mineral Reactions Using Confocal Raman Spectroscopy


1
Department of Earth Sciences, Universiteit Utrecht, 3584 CB Utrecht, The Netherlands
2
Steinmann Institute, Rheinische Friedrich-Wilhelms Universität Bonn, 53115 Bonn, Germany
*
Author to whom correspondence should be addressed.
Minerals 2018, 8(4), 158; https://0-doi-org.brum.beds.ac.uk/10.3390/min8040158
Submission received: 7 March 2018
/
Revised: 6 April 2018
/
Accepted: 9 April 2018
/
Published: 13 April 2018
(This article belongs to the Special Issue Mineral Surface Reactions at the Nanoscale)
Abstract
:Raman spectroscopy is a powerful tool used to identify mineral phases, study aqueous solutions and gas inclusions as well as providing crystallinity, crystallographic orientation and chemistry of mineral phases. When united with isotopic tracers, the information gained from Raman spectroscopy can be expanded and includes kinetic information on isotope substitution and replacement mechanisms. This review will examine the research to date that utilizes Raman spectroscopy and isotopic tracers. Beginning with the Raman effect and its use in mineralogy, the review will show how the kinetics of isotope exchange between an oxyanion and isotopically enriched water can be determined in situ. Moreover, we show how isotope tracers can help to unravel the mechanisms of mineral replacement that occur at the nanoscale and how they lead to the formation of pseudomorphs. Finally, the use of isotopic tracers as an in situ clock for mineral replacement processes will be discussed as well as where this area of research can potentially be applied in the future.
1. Introduction
Some of the first materials in which the Raman effect was documented were minerals [1]. Now, modern data compilations, such as The RRUFFTM Project database [2], contain Raman spectra for over 3000 different minerals making Raman spectroscopy a key mineral identification tool for geoscientists. Raman spectroscopy has the additional benefits that, unlike X-ray diffraction, it is well-suited to study amorphous solids such as glasses [3]. One of the main advantages, however, is that minerals as small as a few nanometers can be analyzed non-destructively by modern confocal Raman spectrometer systems. In addition, Raman spectroscopic analysis can be conducted on liquid and gas samples making it an interesting tool for studying inclusions in minerals [4,5]. This means that Raman spectroscopy can provide information about the factors controlling mineral nucleation [6,7] as well as be used to find cryptic clues for mineral formation. Critically, Raman spectroscopy is also sensitive to isotopic substitution, particularly of light isotopes such as oxygen or hydrogen isotopes. This sensitivity has been used previously in the chemical sciences to assign spectral bands to specific vibrational modes [8,9] or to follow reactions [10]. However, it is only in the past couple of decades that geoscientists have begun to use the combination of light, stable isotopic tracers and Raman spectroscopy to probe mineral reactions. This article will review the different information that can be gained from coupling stable isotopic tracers with Raman spectroscopy and where we could go in the future with this kind of Raman mass spectroscopy in mineralogy.
2. Background to Raman Spectroscopy
In descriptive terms, Raman bands arise due to energy gain or loss from a monochromatic incoming light source as it is scattered by the electron field of vibrating molecular groups. Therefore, in Raman spectroscopy we examine the wavelength shift of the scattered light compared to that of the incident light (set at 0 in a Raman spectrum). Typically, Raman spectroscopy focuses on the energy lost by the incoming light due to inelastic scattering, called Stokes scattering, because these bands are more intense at room temperature than anti-Stokes bands that reflect a gain in energy from the molecule. As the spectral bands directly reflect vibration within the material, the energy shift of the scattered light is dependent on the energy required for the atoms to oscillate around their equilibrium position as they vibrate. Therefore, the amount of energy loss, and hence, the Raman spectrum, depend on bond strength, mass of the vibrating atoms, site symmetry within a structure (point groups), as well as short- and long-range symmetry. Specific vibrations will only be present in the Raman spectra if the polarization ellipsoid is modified during a vibration; in other words the electron cloud around a group of atoms changes its shape. Given that Raman spectroscopy is dependent on atomic structure, it is probably no surprise that the selection rules for Raman activity are based on quantum mechanics. We will not cover this level of detail in this review; for an in-depth description of the quantum mechanics behind Raman spectroscopy the reader is referred to [11].
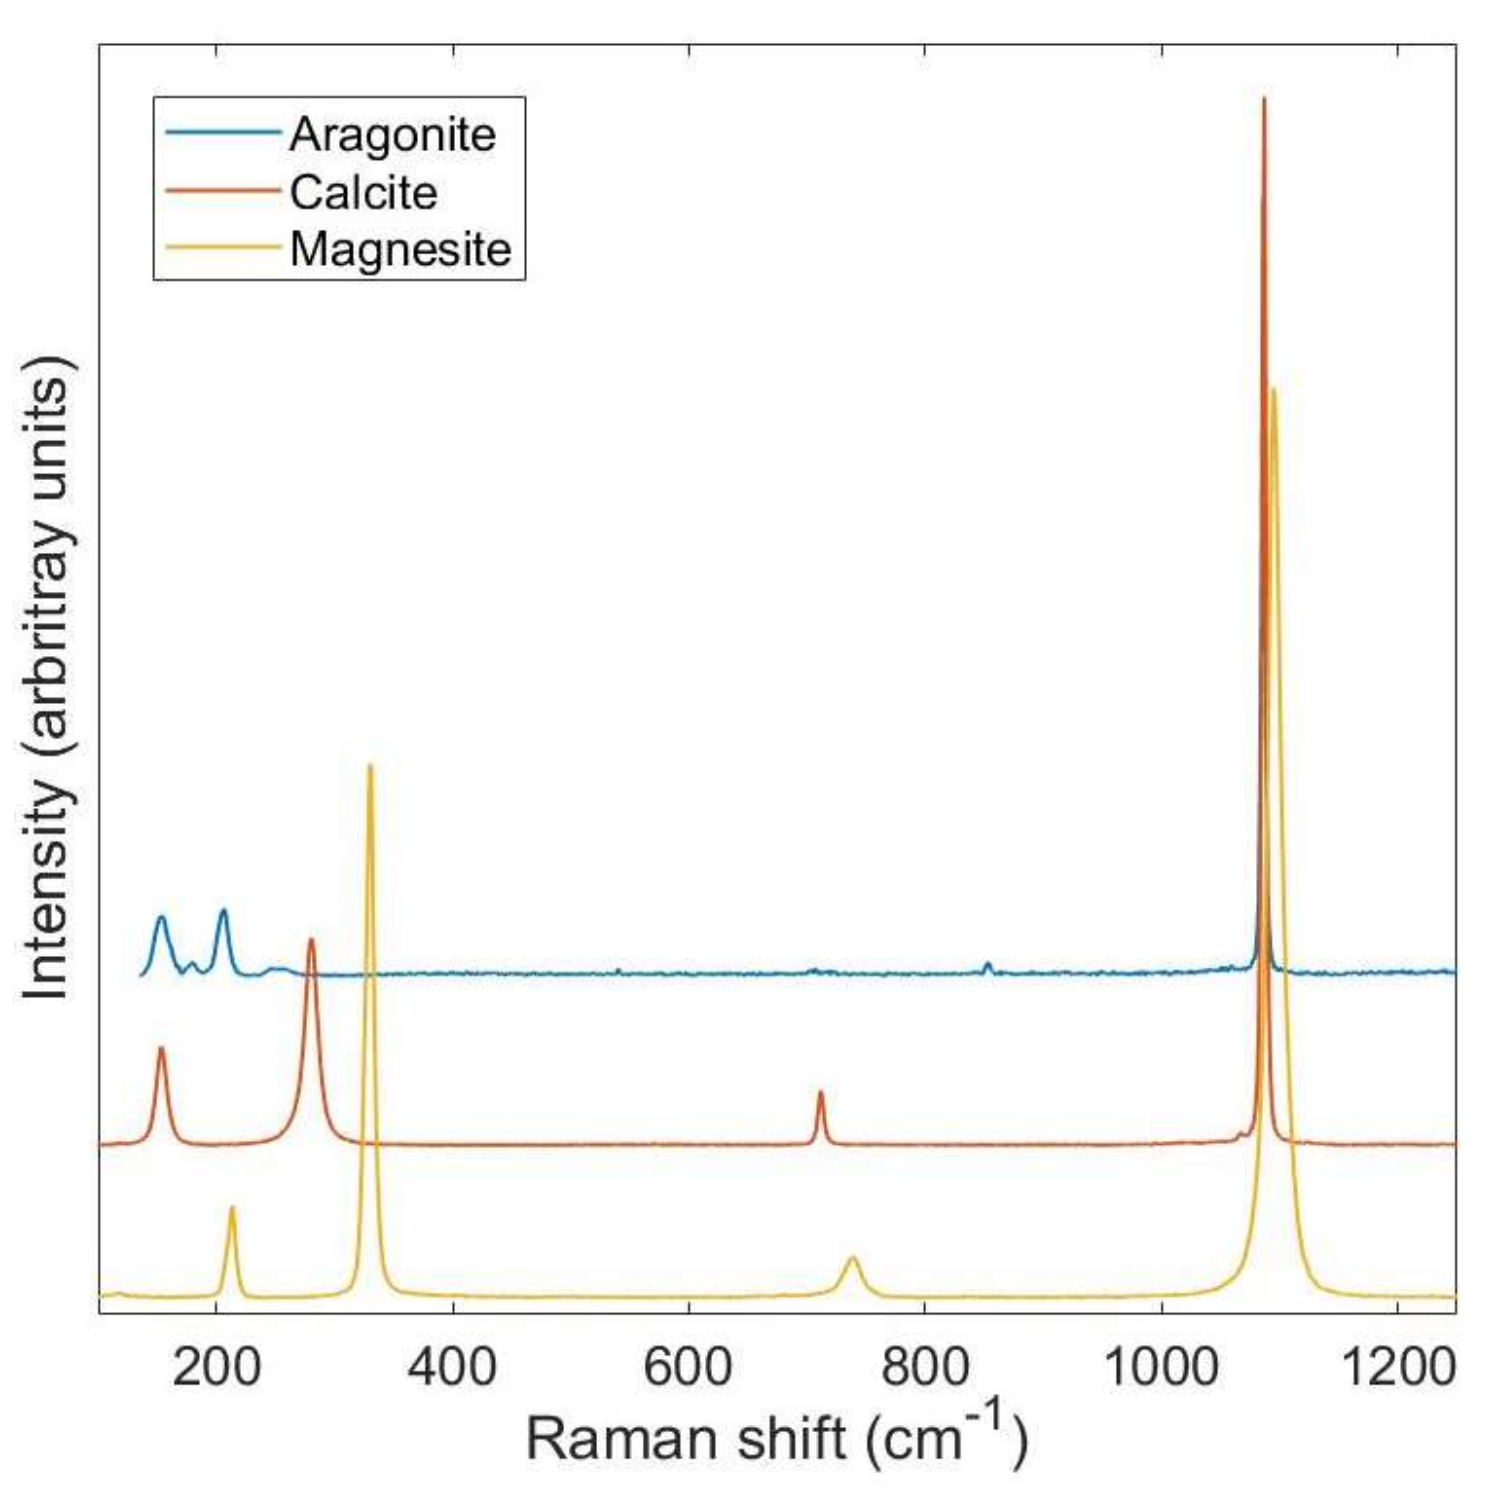
An example of the sensitivity of Raman spectroscopy to different mineral phases is shown in Figure 1. The spectra can be split into two different regions: below ~400–500 cm−1 where bands called external lattice modes occur and internal lattice mode bands at wavenumbers >~500 cm−1. The external modes arise due to long-range translational symmetry within the example mineral structure, whereas the internal modes reflect the coupling of vibrations within molecular groups. There are multiple internal modes for a molecular group: stretching, twisting and bending, all of which can occur either symmetrically or antisymmetrically around the central axis of the vibration. Each of these motions requires a different amount of energy and, therefore, multiple bands within a spectrum are related to a specific molecular group. For example, the spectra shown in Figure 1 are all from carbonate minerals. In these examples, the high energy bands between 1075 and 1150 cm−1 reflect the symmetrical stretching of the carbonate (CO32−) molecular group [12]. Similarly, the band close to 700 cm−1 is also related to the carbonate molecular group, but in this case, it reflects the antisymmetric bending mode. Both calcite (CaCO3) and magnesite (MgCO3) show the same number of bands in their spectra due to their identical structure (space group Rc), thus, exhibiting same site symmetries. However, the bands in magnesite are shifted to higher wavenumbers, reflecting the ability of Mg to more strongly bind to oxygen while at the same time Mg is lighter than Ca, both of which increase the energy of the molecular vibration. In contrast, changing the structure of the calcite to its polymorph aragonite (CaCO3, space group Pmcn) produces additional bands in comparison to calcite. Therefore, the overall Raman spectrum is characteristic of a mineral phase, i.e., can be considered as a fingerprint.
The height difference that can be observed between the bands within a single Raman spectrum is related to the modulation of the polarizability associated with the vibrating atoms. This varies between different vibrational modes of the same molecular group producing different band heights. In addition, in crystalline solids, such as those in Figure 1, the position of the atoms is fixed with respect to the incoming, polarized laser light. As the polarizability related to a specific vibration is directly related to the symmetry of the molecular group, the polarized laser light interacts differently along different crystal axes. This causes the relative intensities of different vibrational modes to vary with crystal orientation to the laser light and, if the polarization of the laser is known, can be used to evaluate crystallographic orientation. We already use the phenomenon of changes in the interaction of light with crystal structures when we examine minerals in thin section under crossed polarizers in the light microscope. The Raman effect was documented for the highly birefringent mineral calcite in 1940 [13] and has since been shown for a variety of mineral phases [14,15]. However, unlike light microscopy, this effect can also be observed in structurally isotropic minerals such as magnetite [16]. In contrast to solid phases, for freely moving molecules, e.g., molecules in a gas, the Raman spectrometer probes the molecular group in a range of different orientations with respect to the incoming laser light. Therefore, the intensity of a specific band is proportional to the concentration of the species of interest in the medium examined. This effect has been used to estimate concentrations of different ions within a solid structure with the same orientation [17]. Systematic variations of spectral bands are also particularly useful in the analysis of minerals, as band shifts can be linked to solid solution composition [18].
3. Isotopes in Raman Spectroscopy
As for changes in the elemental composition shown in Figure 1, Raman spectroscopy is also sensitive to the isotopic composition of the material examined. This arises due to the dependence of the vibrational frequency on the mass of the atoms involved [19]. Therefore, isotopic substitution is reflected in the Raman spectra as a shift in the spectral bands upon incorporation of different isotopes into a vibrating group. For example, 100 at.% enrichment of 30Si or 18O into the mineral phase alpha-quartz produces shifts in the Raman bands of up to 20 cm−1 and 50 cm−1, respectively [9]. Raman spectroscopy is not as sensitive to isotopic composition as more traditional methods for examining isotope incorporation such as mass spectrometry. Typically, band positions can be determined with an error down to ± 0.05 cm−1, when the system is well-calibrated [20]. Therefore, per mill changes in isotope composition associated with small fractionation effects cannot be determined by Raman spectroscopy at present. Nevertheless, even if this precision is reached, the uncertainties associated with compositional or structural effects on the vibrational frequency are too large in solid and liquid phases. However, isotopic shifts can be used to determine which bands are affiliated to specific motions within a material by isotopically doping the material of interest. Critically, unlike mass spectrometry, the bands in Raman spectroscopy are site-specific. This means that isotope substitution into the crystal structure and the presence of isotopically enriched water that may become entrapped in pores or adsorbed during experiments can be clearly discriminated in the Raman spectra. In addition, the incorporation of different isotopes can be measured in situ and ex situ at µm spatial resolution in a non-destructive manner providing an unparalleled picture into the processes occurring during mineral reactions.
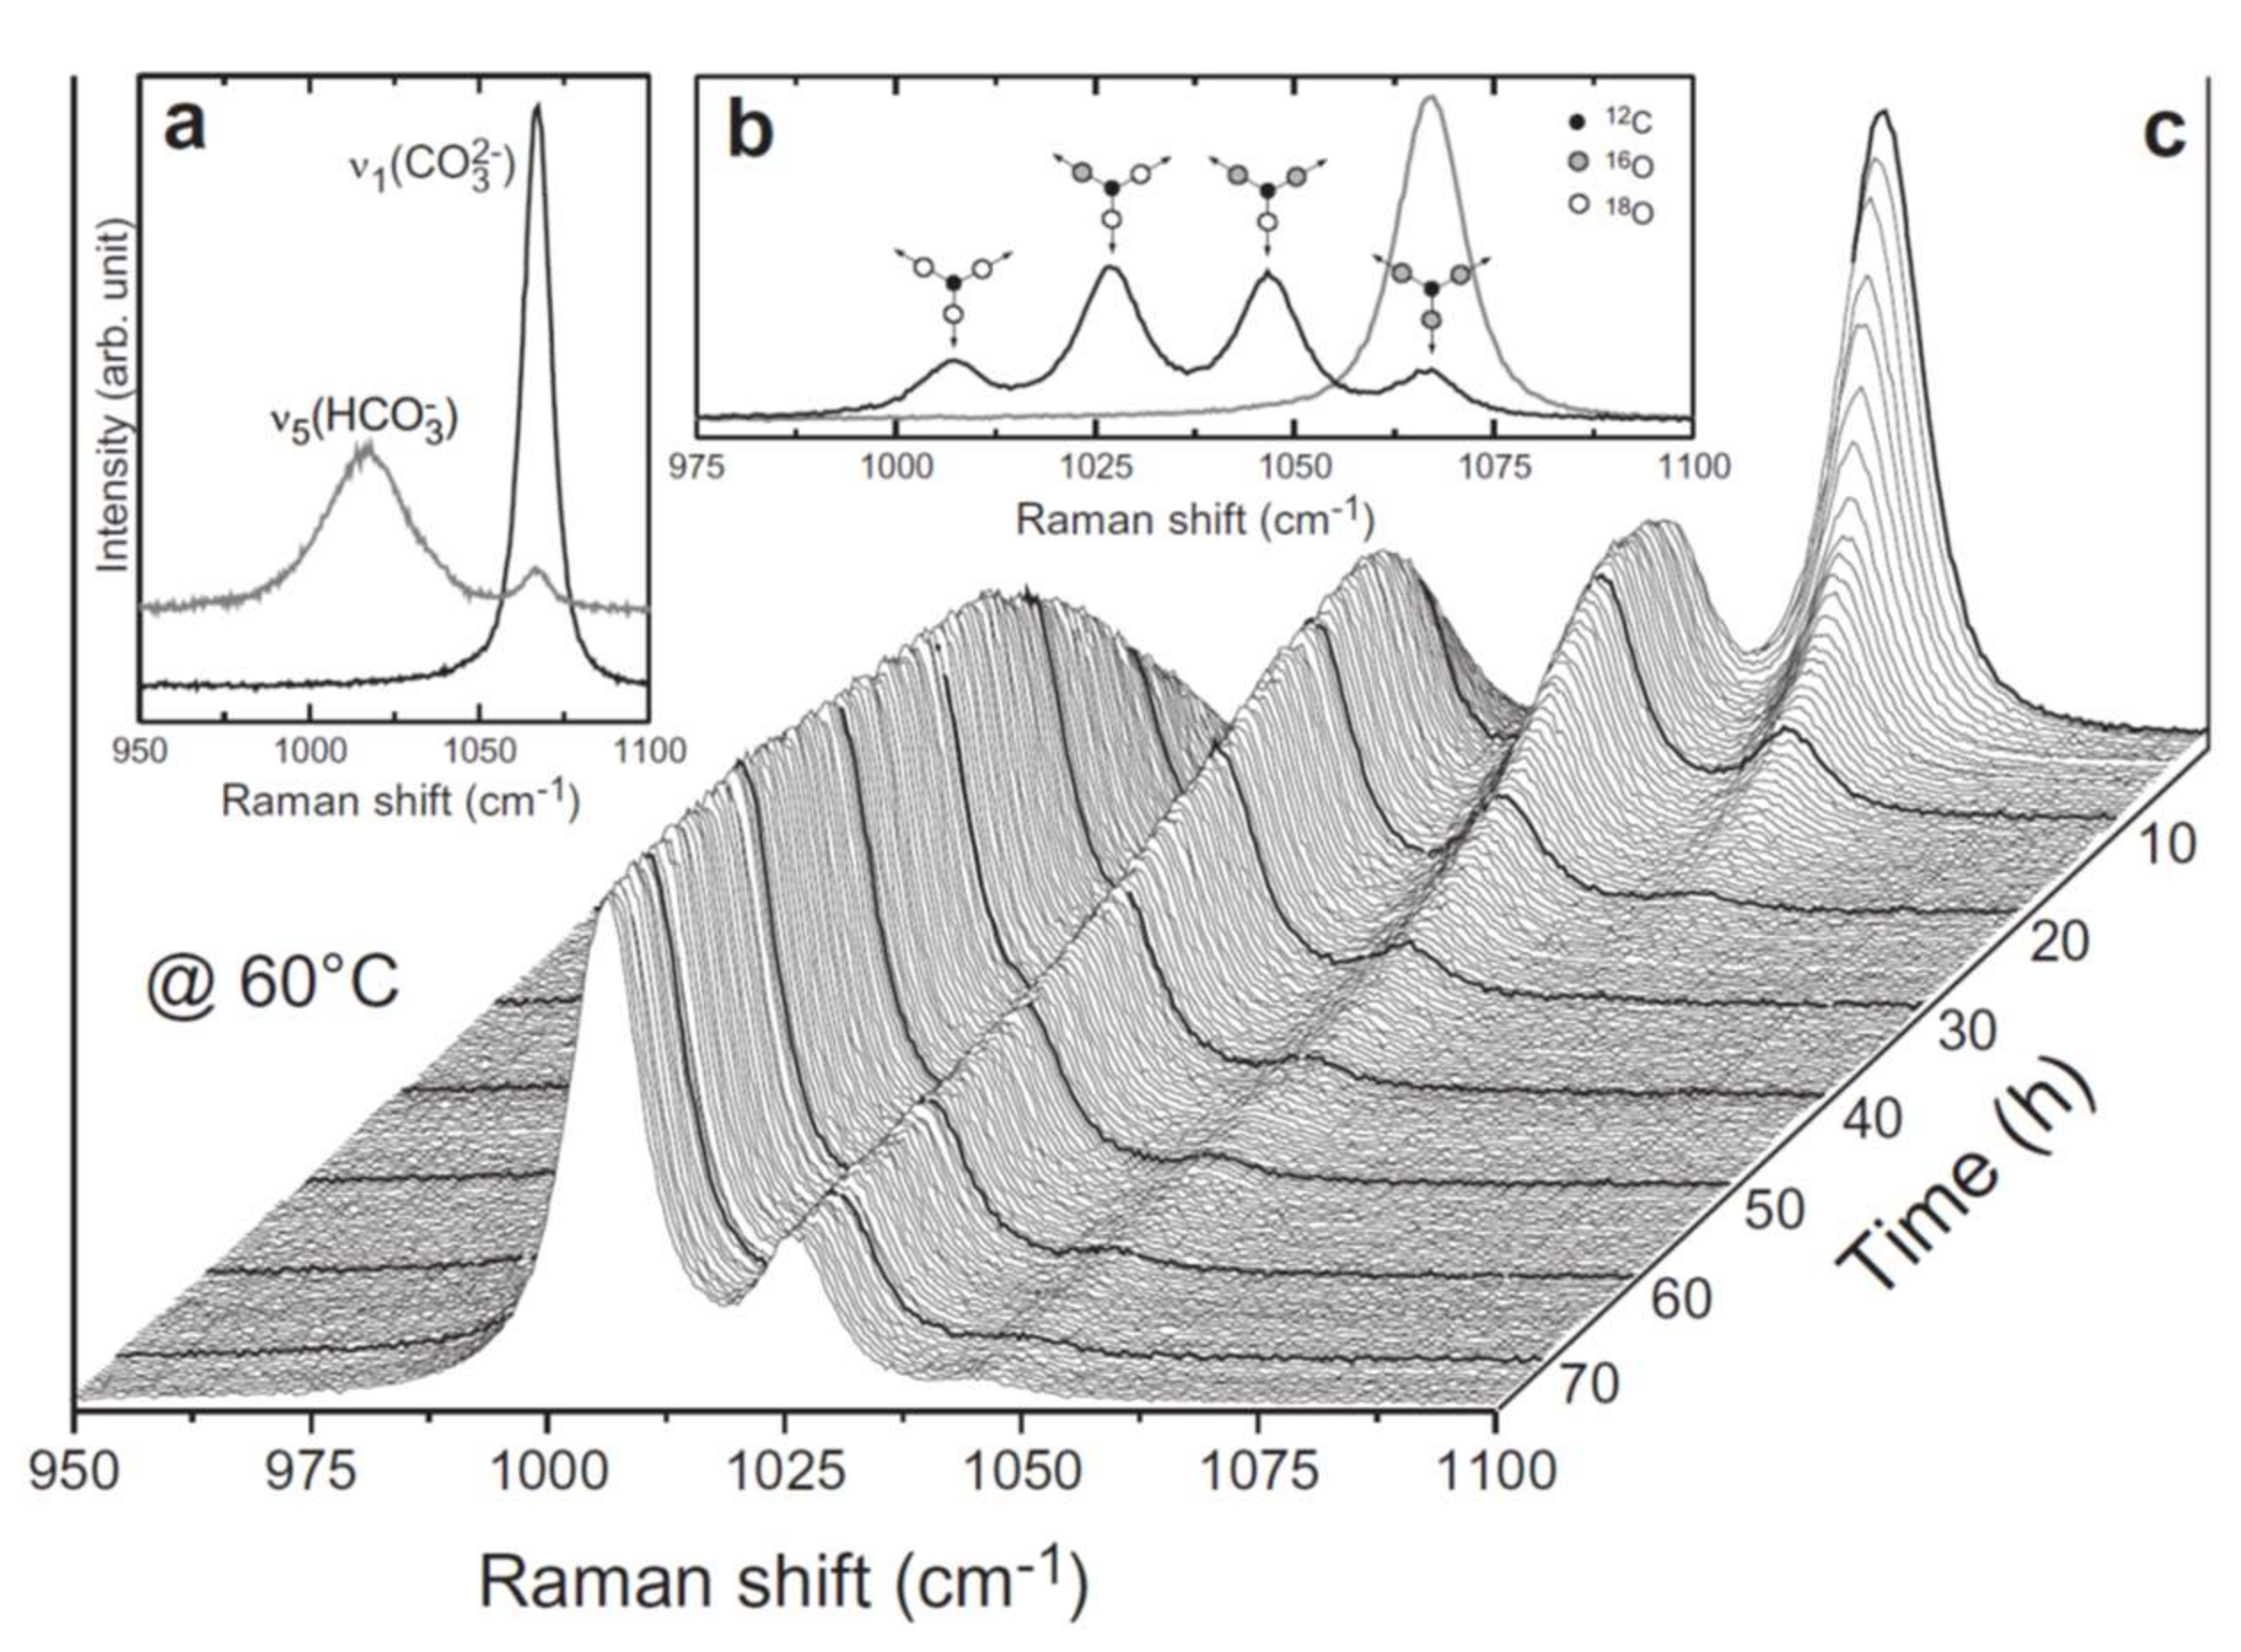
The response of spectral bands to isotope incorporation can be separated into two different forms. O-isotope incorporation into silicate phases that have Si–O–Si linkages, including the quartz example above as well as zeolites [21] and amorphous silica [22], has been shown to produce a gradual mass-related shift in the Si–O related bands. Assuming, as an approximation, a linear frequency shift with isotope composition, the amount of the isotope incorporated into a material can be determined [23]. In contrast, isolated molecular groups within a mineral structure, e.g., carbonates, produce new bands upon isotope substitution. These can be assigned to molecular groups with specific isotopic compositions, called isotopologues. For example, the carbonate symmetrical stretching band in calcite at 1086 cm−1 is split into four bands upon 18O substitution into the carbonate group [24]. Each of these bands corresponds to the different isotopologue of the carbonate group, namely C16O3, C16O218O, C16O18O2, and C18O3 as shown in Figure 2. We assume that the Raman scattering cross sections of the isotopologues are similar; hence, the incorporation of an isotope into an isolated molecular group can be calculated from each spectrum by measuring the intensity of the different isotopologue bands. However, the observed Raman intensities are not expected to correspond exactly to relative concentrations, but should obey the isotope intensity sum rule. This rule states for Raman intensities that Ai/νi is a constant, where Ai is the integrated intensity of each isotopologue band (i) and νi its frequency [25]. A similar band splitting upon O-isotope substitution has been found for other oxyanions including phosphate [25,26,27], sulfate [28], and vanadate [29]. Moreover, the 13C16O2 isotopologue of gaseous or liquid CO2 generates its own Raman band at the lower frequency side of both 12C16O2 Fermi diad bands. This allows the 12C/13C isotope composition of CO2 gas inclusions in minerals to be determined by Raman spectroscopy as first shown by Arakawa and coworkers [30]. However, ratios determined from band area for CO2 gas samples were found to be associated with an error of 20‰, which is by far not precise enough for Raman spectroscopy to become a valuable tool in isotope geosciences. On the other hand, reports have been made that with modern Raman spectroscopic systems it should be possible to reach a precision in the order of ±2‰ if a standard gas is measured with identical instrumental settings and, importantly, at the same density as the inclusion [31,32]. Therefore, by analyzing isotopic tracers with Raman spectroscopy we have an in situ probe that can be tracked throughout the mineral material to evaluate mineral reactions or formation conditions. In addition, we can probe isotopic exchange as it occurs in solution, which is important for both mechanistic studies as well as probing rate-limiting steps in lower concentration solutions applicable for fractionation effects.
4. Examining the Properties of Ions in Solution Using Raman Spectroscopy
Probing reactions in aqueous solution is critical for many different aspects of mineralogy from ore geology to biomineralisation. For these reactions, the properties of the mineral constituent ions in solution will be controlling factors in how mineral reactions progress. Raman spectroscopy is a particularly powerful tool in this respect, as it can provide a unique image of ions in solution. Liquid water shows distinct bands in Raman spectra, a medium intensity band near 1630 cm−1 related to ν2(H2O) bending motions and an intense band that shows a maximum near 3600 cm−1. This Raman band profile is composed of contributions from the symmetric ν1(H2O), the antisymmetric ν3(H2O) stretching vibration, as well as from a 2ν2 combination mode [33]. There are many examples of Raman spectroscopy being used to identify hydrated ions [34,35], oxyanions [36,37], and ion complex formation [38,39,40], including oligomers of the same ions [41,42]. Formation of ion complexes is particularly interesting as this can aid precipitation if the different components of a mineral phase interact in solution. Alternatively, if ion pairs form between one component of a mineral and another solution component precipitation may be inhibited. An example of such behavior can be seen with the growth of magnesite. Addition of sulfate to a solution that would otherwise be highly oversaturated with respect to magnesite slows down the growth of the mineral phase dramatically. Thermodynamic calculations indicate that this is related to a lowering of the solution saturation with respect to magnesite through the formation of Mg-sulfate ion pairs [43]. This is supported by Raman spectroscopy, which shows the development of a new spectral band associated with Mg-sulfate ion pair formation in solution [38]. Similarly, the formation of immiscible, dense liquid phases at high temperatures has been identified in situ using the ratios of sulfate and OH Raman spectral band areas and the formation of new bands that correspond to polymeric mixtures [44,45]. These dense fluid phases play an important role in mineral nucleation [7] when it occurs via a non-classical route [46] as well as element transport [45].
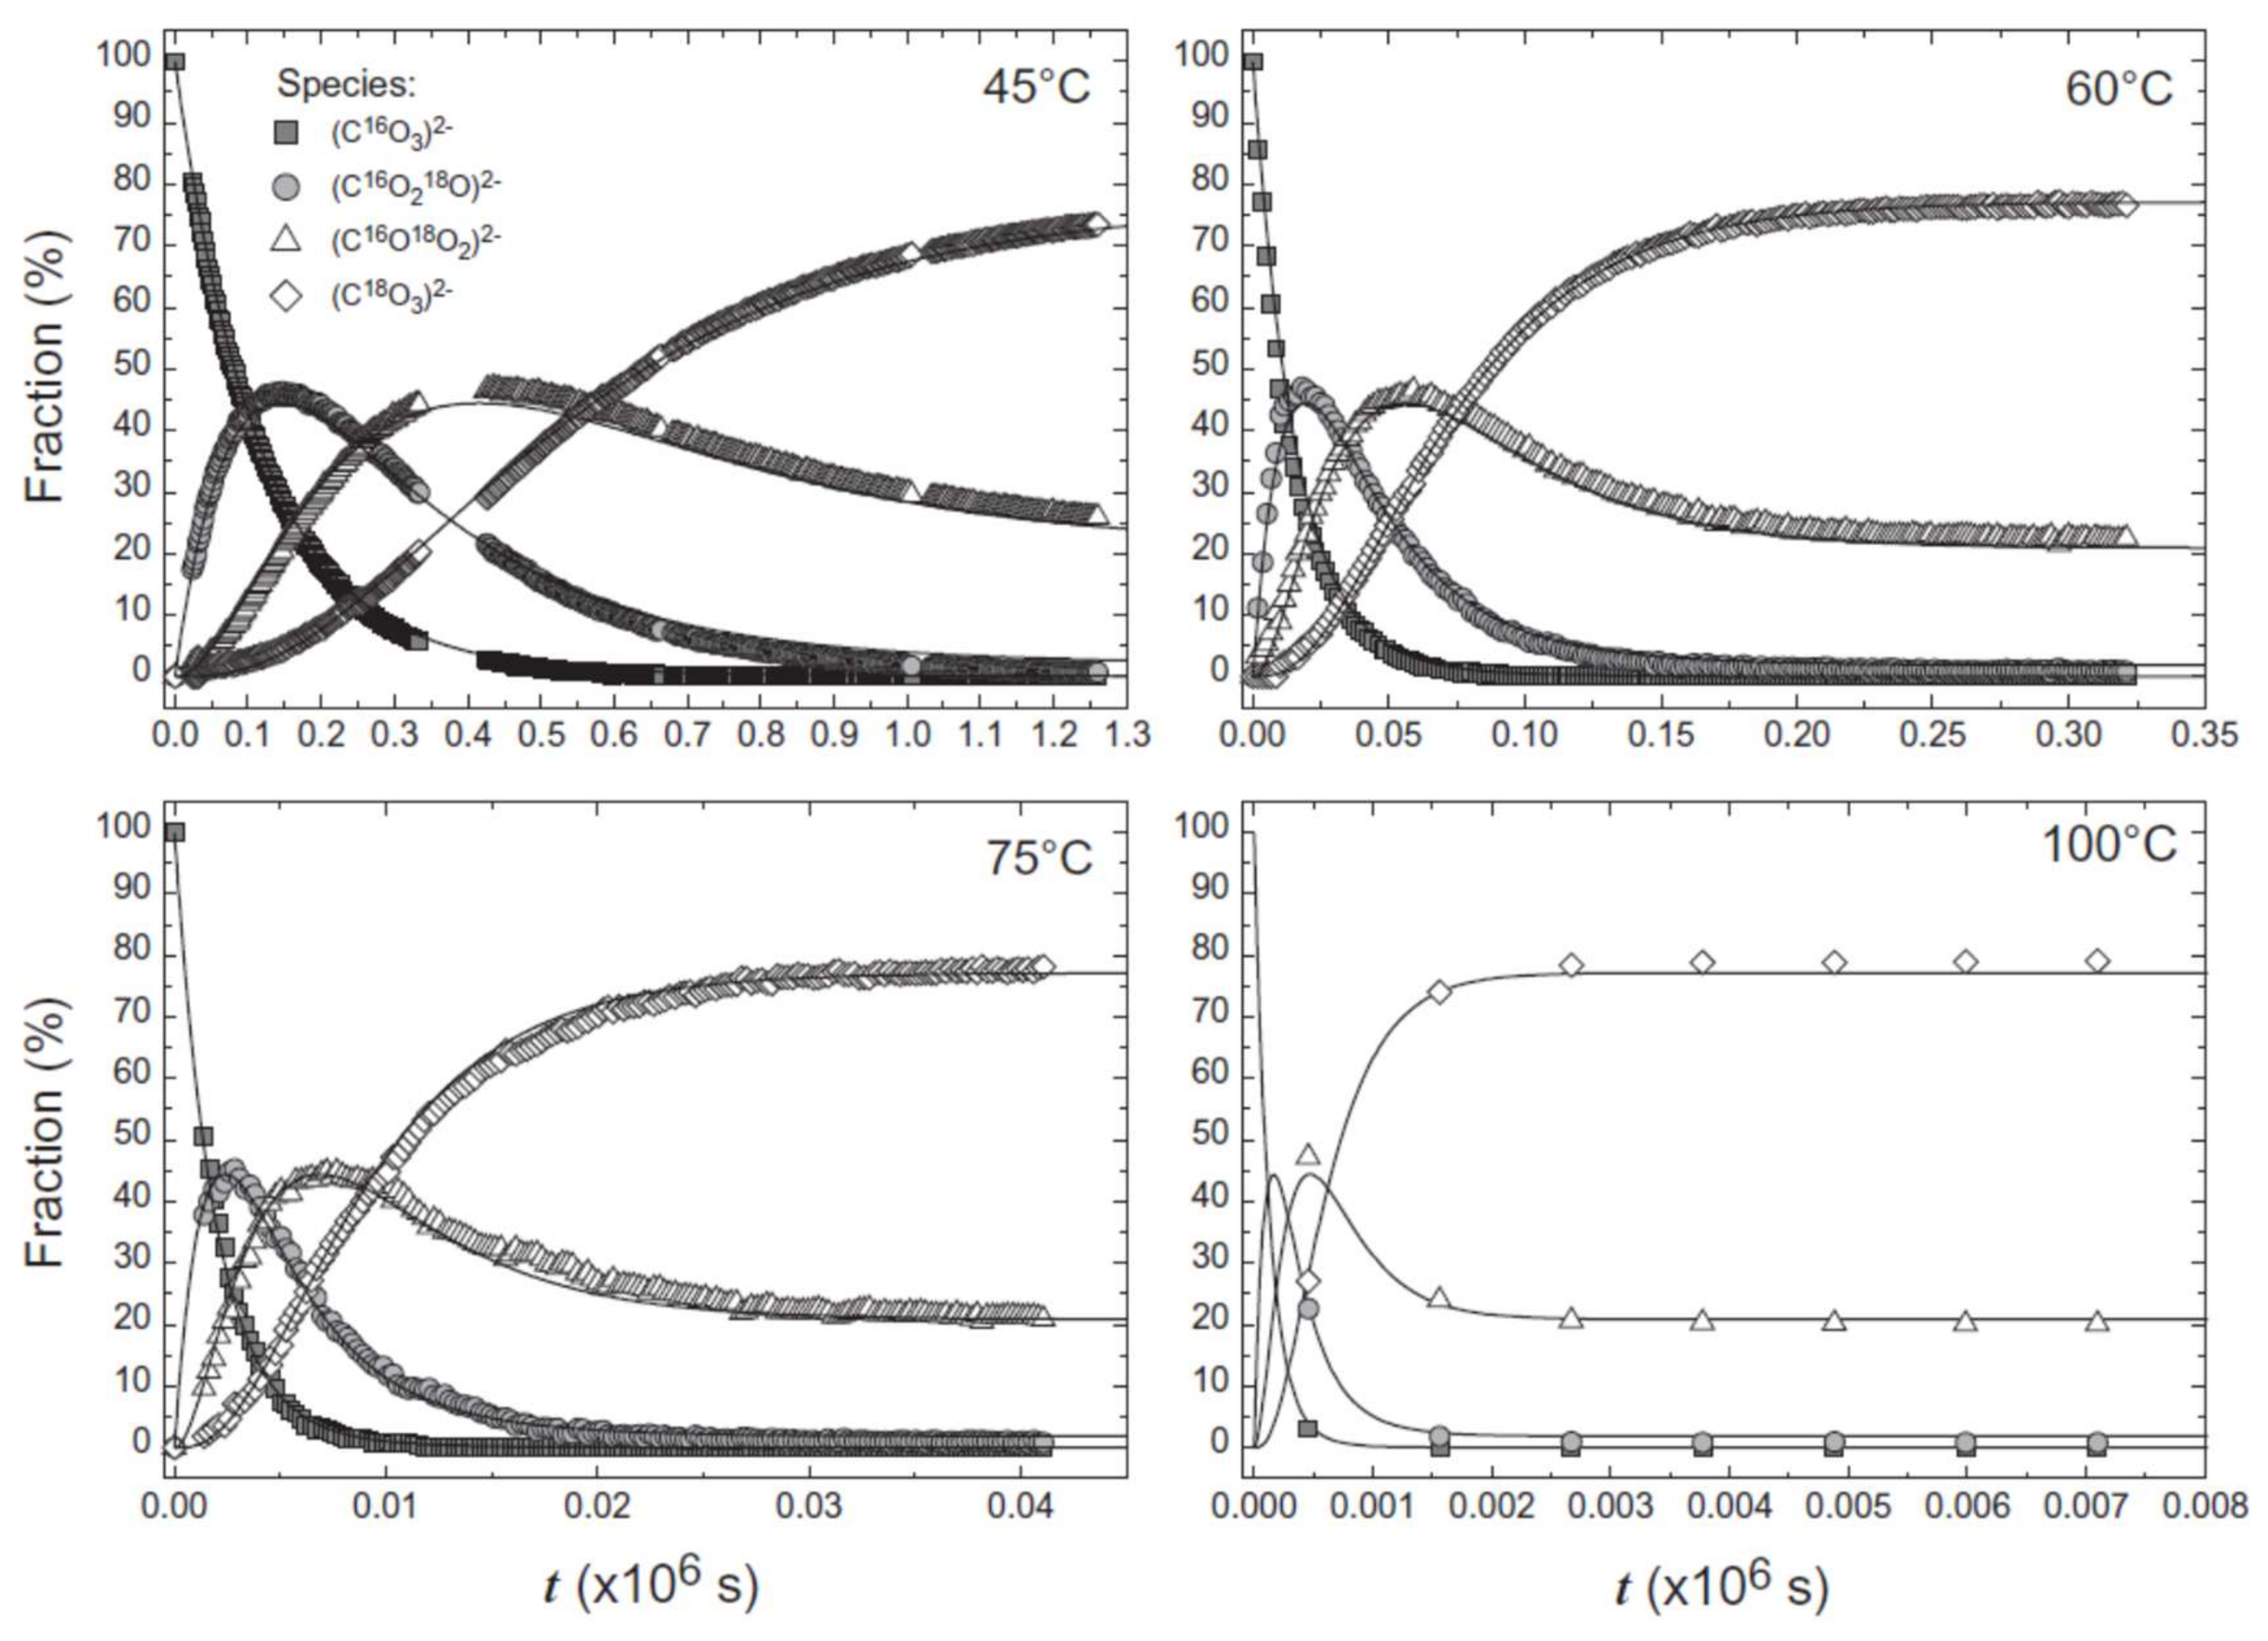
We can also trace isotope incorporation in the dissolved components, for example 18O incorporation into oxyanions. Experiments show that substitution of 18O into aqueous phosphate ions produce distinct new bands at lower wavenumbers that reflect the presence of new isotopologue species [47], as observed for phosphate-bearing crystals [26]. By using heated fluid cells, we are now able to study the isotopic exchange in situ. For example, Geisler et al. [20] has examined the substitution of 18O from enriched water into carbonate oxyanions at temperatures from 45 to 100 °C, shown in Figure 3. This has provided key information on the exchange rate, allowing the authors to extract the activation energy of the process. Therefore, the kinetics of isotopic exchange can be elucidated using a combination of Raman spectroscopy and isotopic enrichment. Raman spectroscopy has the additional benefit for these types of reactions, because it can clearly distinguish between different ion speciation in solution. The symmetrical stretching mode of aqueous CO32−, for example, occurs at ~1060 cm−1 whereas the equivalent vibrational mode for HCO3− is found at ~1015 cm−1 [48], as can be seen in Figure 2a. The lower frequency of the stretching mode in solution compared to that of calcite, shown in Figure 1, arises due to the difference in the site symmetry of the molecular group in solution (D3h) and the solid phase (D3) as well as due to a different chemical environment [49]. In initial isotope substitution experiments the presence of different ion speciations in solution led to the erroneous prediction of shifts of 18O bands to higher wavenumbers, contradictory to what is expected from theory [50,51]. Therefore, care must be taken when conducting such experiments to ensure minimal amount of the ion with different speciation is present in the solution. However, when conducted carefully, these experiments can provide key information to unravel isotopic signatures in more complicated systems, such as those produced during mineral replacement.
5. Isotopes and Raman Spectroscopy as a Probe for Mineral Replacement Reaction Mechanisms
Replacement of one mineral by another whilst retaining the habit of the original mineral, pseudomorphic replacement, is common in geological systems. Examples of natural pseudomorphic mineral replacement span from hydrothermal systems [52] to surface weathering [53] as well as biologically controlled processes [54]. Deciphering the nanoscale mechanism for these reactions helps geoscientists to predict reaction rates as well as the concomitant changes in system chemistry. Thus far, two different mechanisms have been proposed. In the first mechanism, it is assumed that specific ions are extracted through an exchange mechanism whilst the surrounding mineral structure remains intact. These ions then diffuse away from the reacting area and the remaining crystal structure can undergo rearrangement in the solid state to form a new material. This mechanism has been observed to form “leached layers” in high temperature experiments of feldspar ion exchange in a dry environment [55]. However, contradictory to the solid-state mechanism above, replacement of feldspar in an aqueous solution shows sharp chemical and isotopic signatures that cannot be explained by a diffusional exchange process [56]. Experiments of albite replacement by K-feldspar at 600 °C in 18O-doped solutions followed by analysis using nanoscale secondary ion mass spectrometry show 18O enrichment within the K-feldspar and µm sharp interfaces in cation and isotope chemistry [57]. Later work using similar experiments coupled with Raman spectroscopic analysis demonstrated that 18O was incorporated into the aluminosilicate network itself [58]. Furthermore, the same textural and isotopic signatures have also been observed with oligoclase and labradorite replacement by albite [59]. The sharp change in isotopic and elemental composition across the reaction interface along with the incorporation of 18O into the network structure both indicate that the reacting mineral is actually dissolving to release its cations, silica, and alumina into solution before a new feldspar can form.
“Leached” layers have also been observed in low temperature weathering environments where fluids are clearly active [60]. In the low-temperature solid-state scenario the pseudomorph is proposed to form via the attachment of active solution species, such as H+ in acidic solutions, to surface atoms. These interactions break the underlying bonds to the structure releasing specific ions. For example, for silicate minerals such as olivine and pyroxene diffusion of H+ to the unreacted mineral results in hydrolysis of the cation-O bond releasing the cation [61,62]. Exchange of the cation for an H+ is proposed to be followed by condensation of the silica groups exposed at the mineral surface to produce a “leached” amorphous silica pseudomorphic layer [63,64]. The reaction is propagated by diffusion of the released cation through the layer to the solution and the counter diffusion of H+ to the unreacted crystal. However, experiments on amorphous silica production during wollastonite [65] and olivine replacement [66] also show the enrichment of 18O in the amorphous silica using Raman spectroscopy. This information in conjunction with a sharp reaction interface between the amorphous silica rim and initial mineral as well as lack of cation diffusion profiles indicates a fluid-mediated reaction is also active in low temperature systems.
Coupled dissolution-precipitation was originally proposed as a mechanism for mineral replacement by Cardew and Davey [67] and has been applied to natural and analogue mineralogical systems extensively by Putnis [68,69], Merino [53,70], and Glikin [71]. In this mechanism, dissolution occurs due to chemical [69] or physiochemical [53] driving forces. Release of the mineral components into the solution at the interface leads to supersaturation of the interfacial solution with respect to a new, more stable mineral that precipitates. This has resulted in this process also being referred to as an interface-coupled dissolution reprecipitation (ICDP) mechanism as it is the close spatial coupling that allows the system to produce a pseudomorph [71,72]. Isotope incorporation thus occurs during precipitation of the new mineral from the interfacial solution. For example, isotopically labelled K in solution is incorporated into the newly precipitated phase during the replacement of KBr by KCl [73]. Similarly, 18O has been used to label phosphate that was incorporated into apatite during calcite replacement [74]. Critically, oxyanions that have been released from a dissolving phase can exchange O-atoms with the surrounding interfacial solution in situ, as described in Section 4. This means that isotope incorporation into the crystal structure can be used to demonstrate that isochemical reactions, such as the transformation of aragonite to calcite, are fluid mediated [75]. The incorporation of isotopic tracers has been demonstrated for many different mineral and amorphous systems (Table 1) across a range of temperatures and this list is likely to get longer in the future.
6. An In Situ Stop Clock for Mineral Replacement Reactions
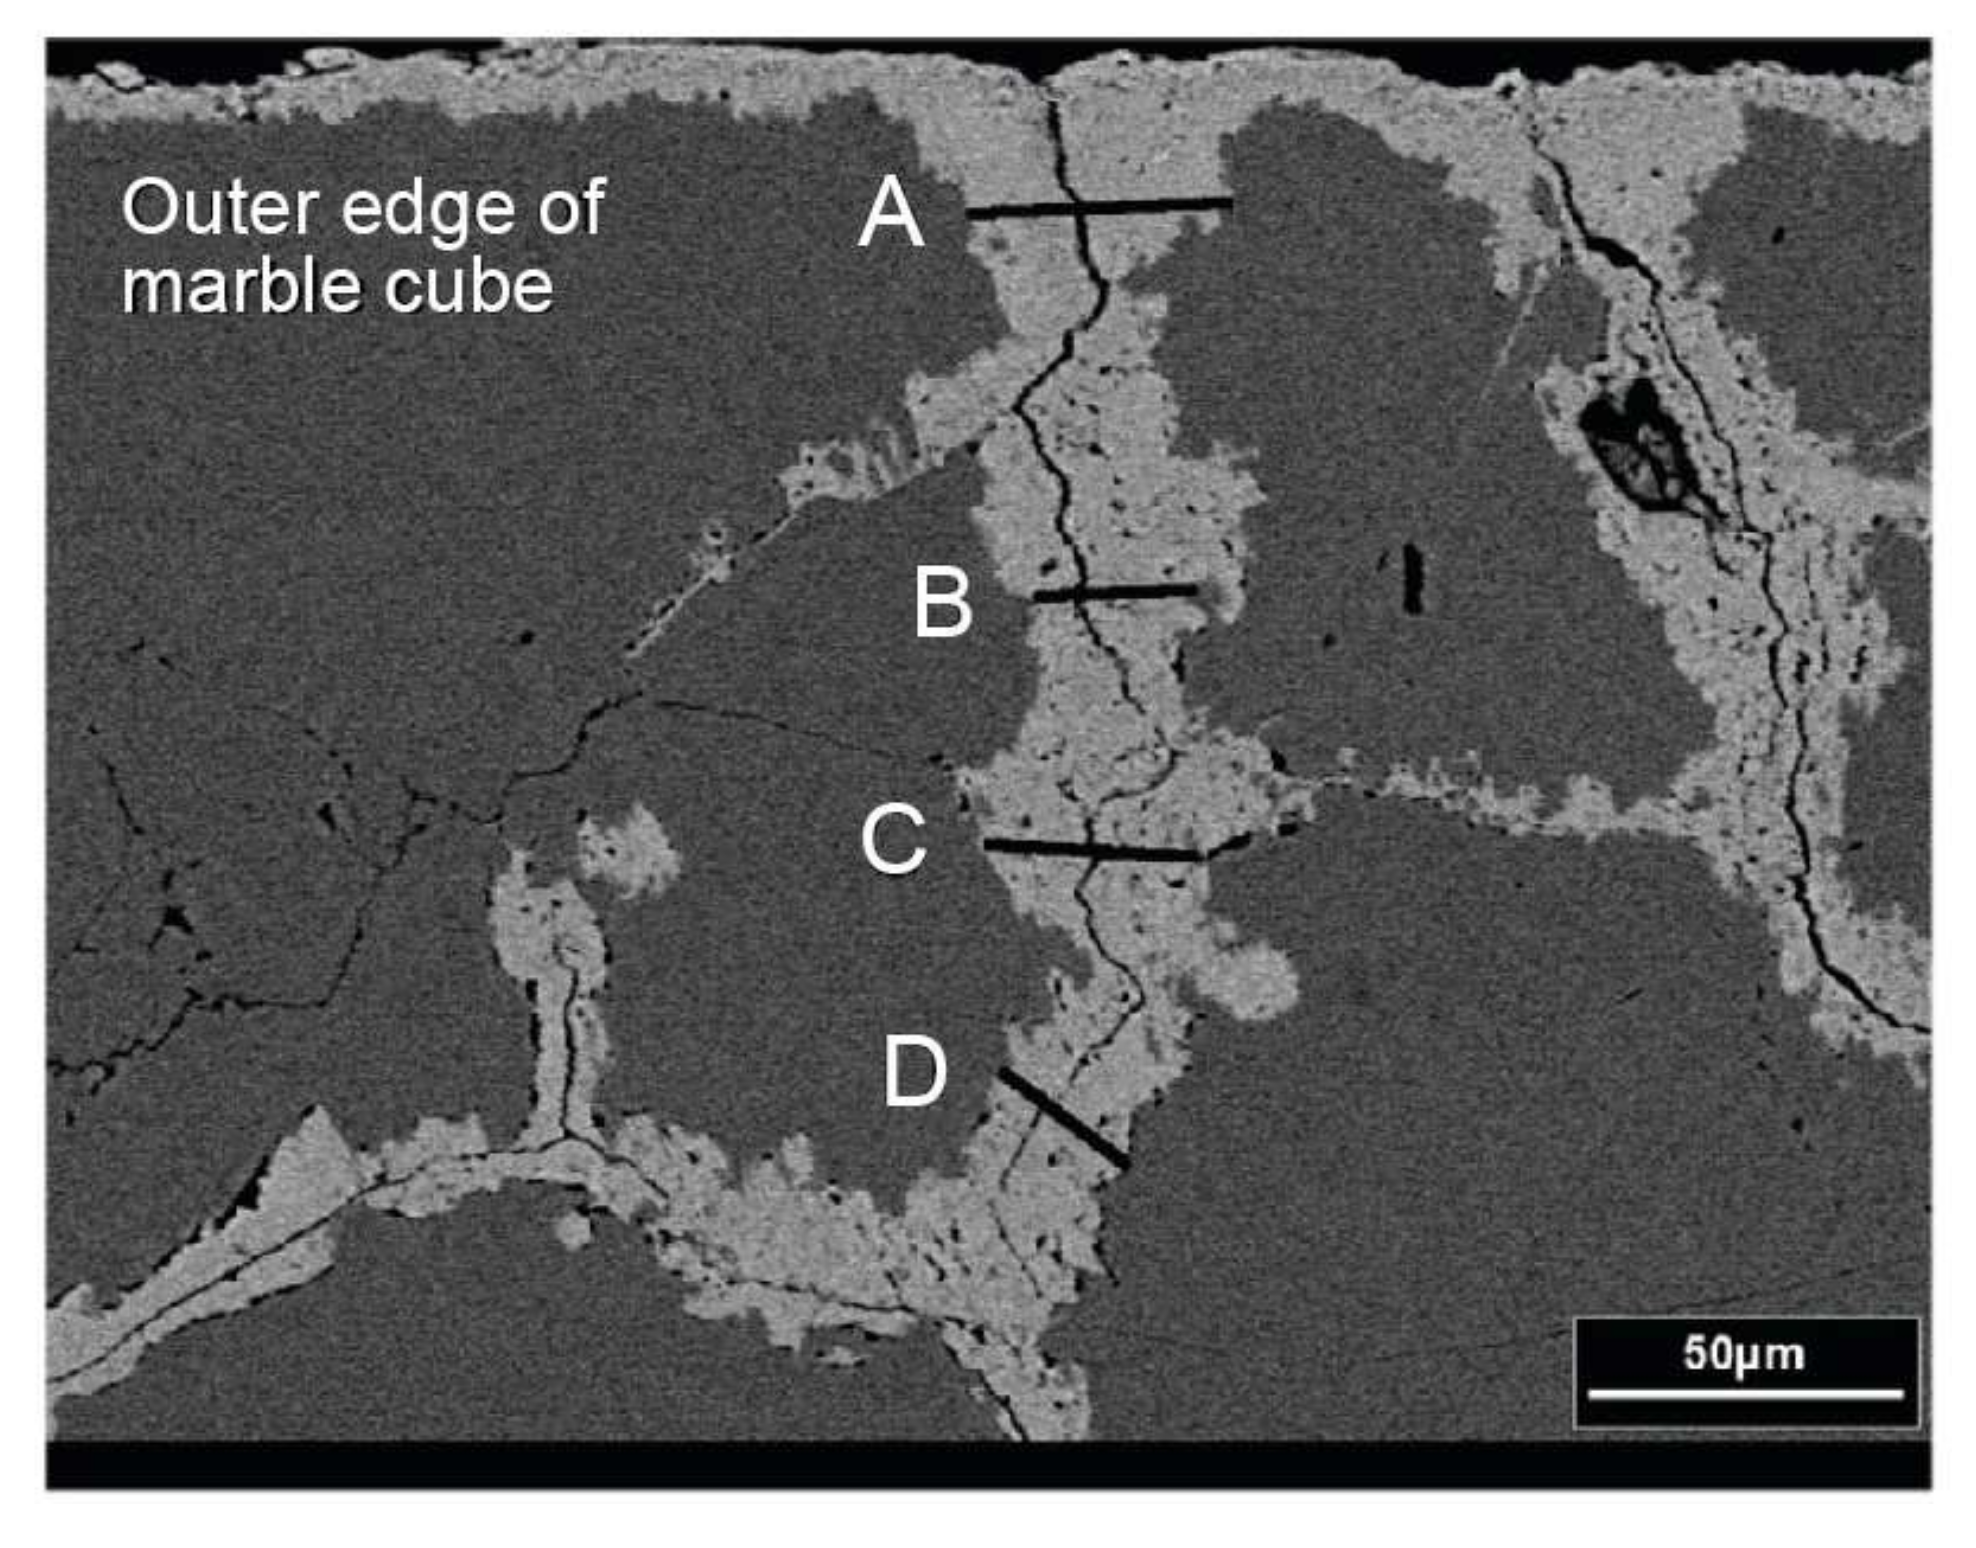
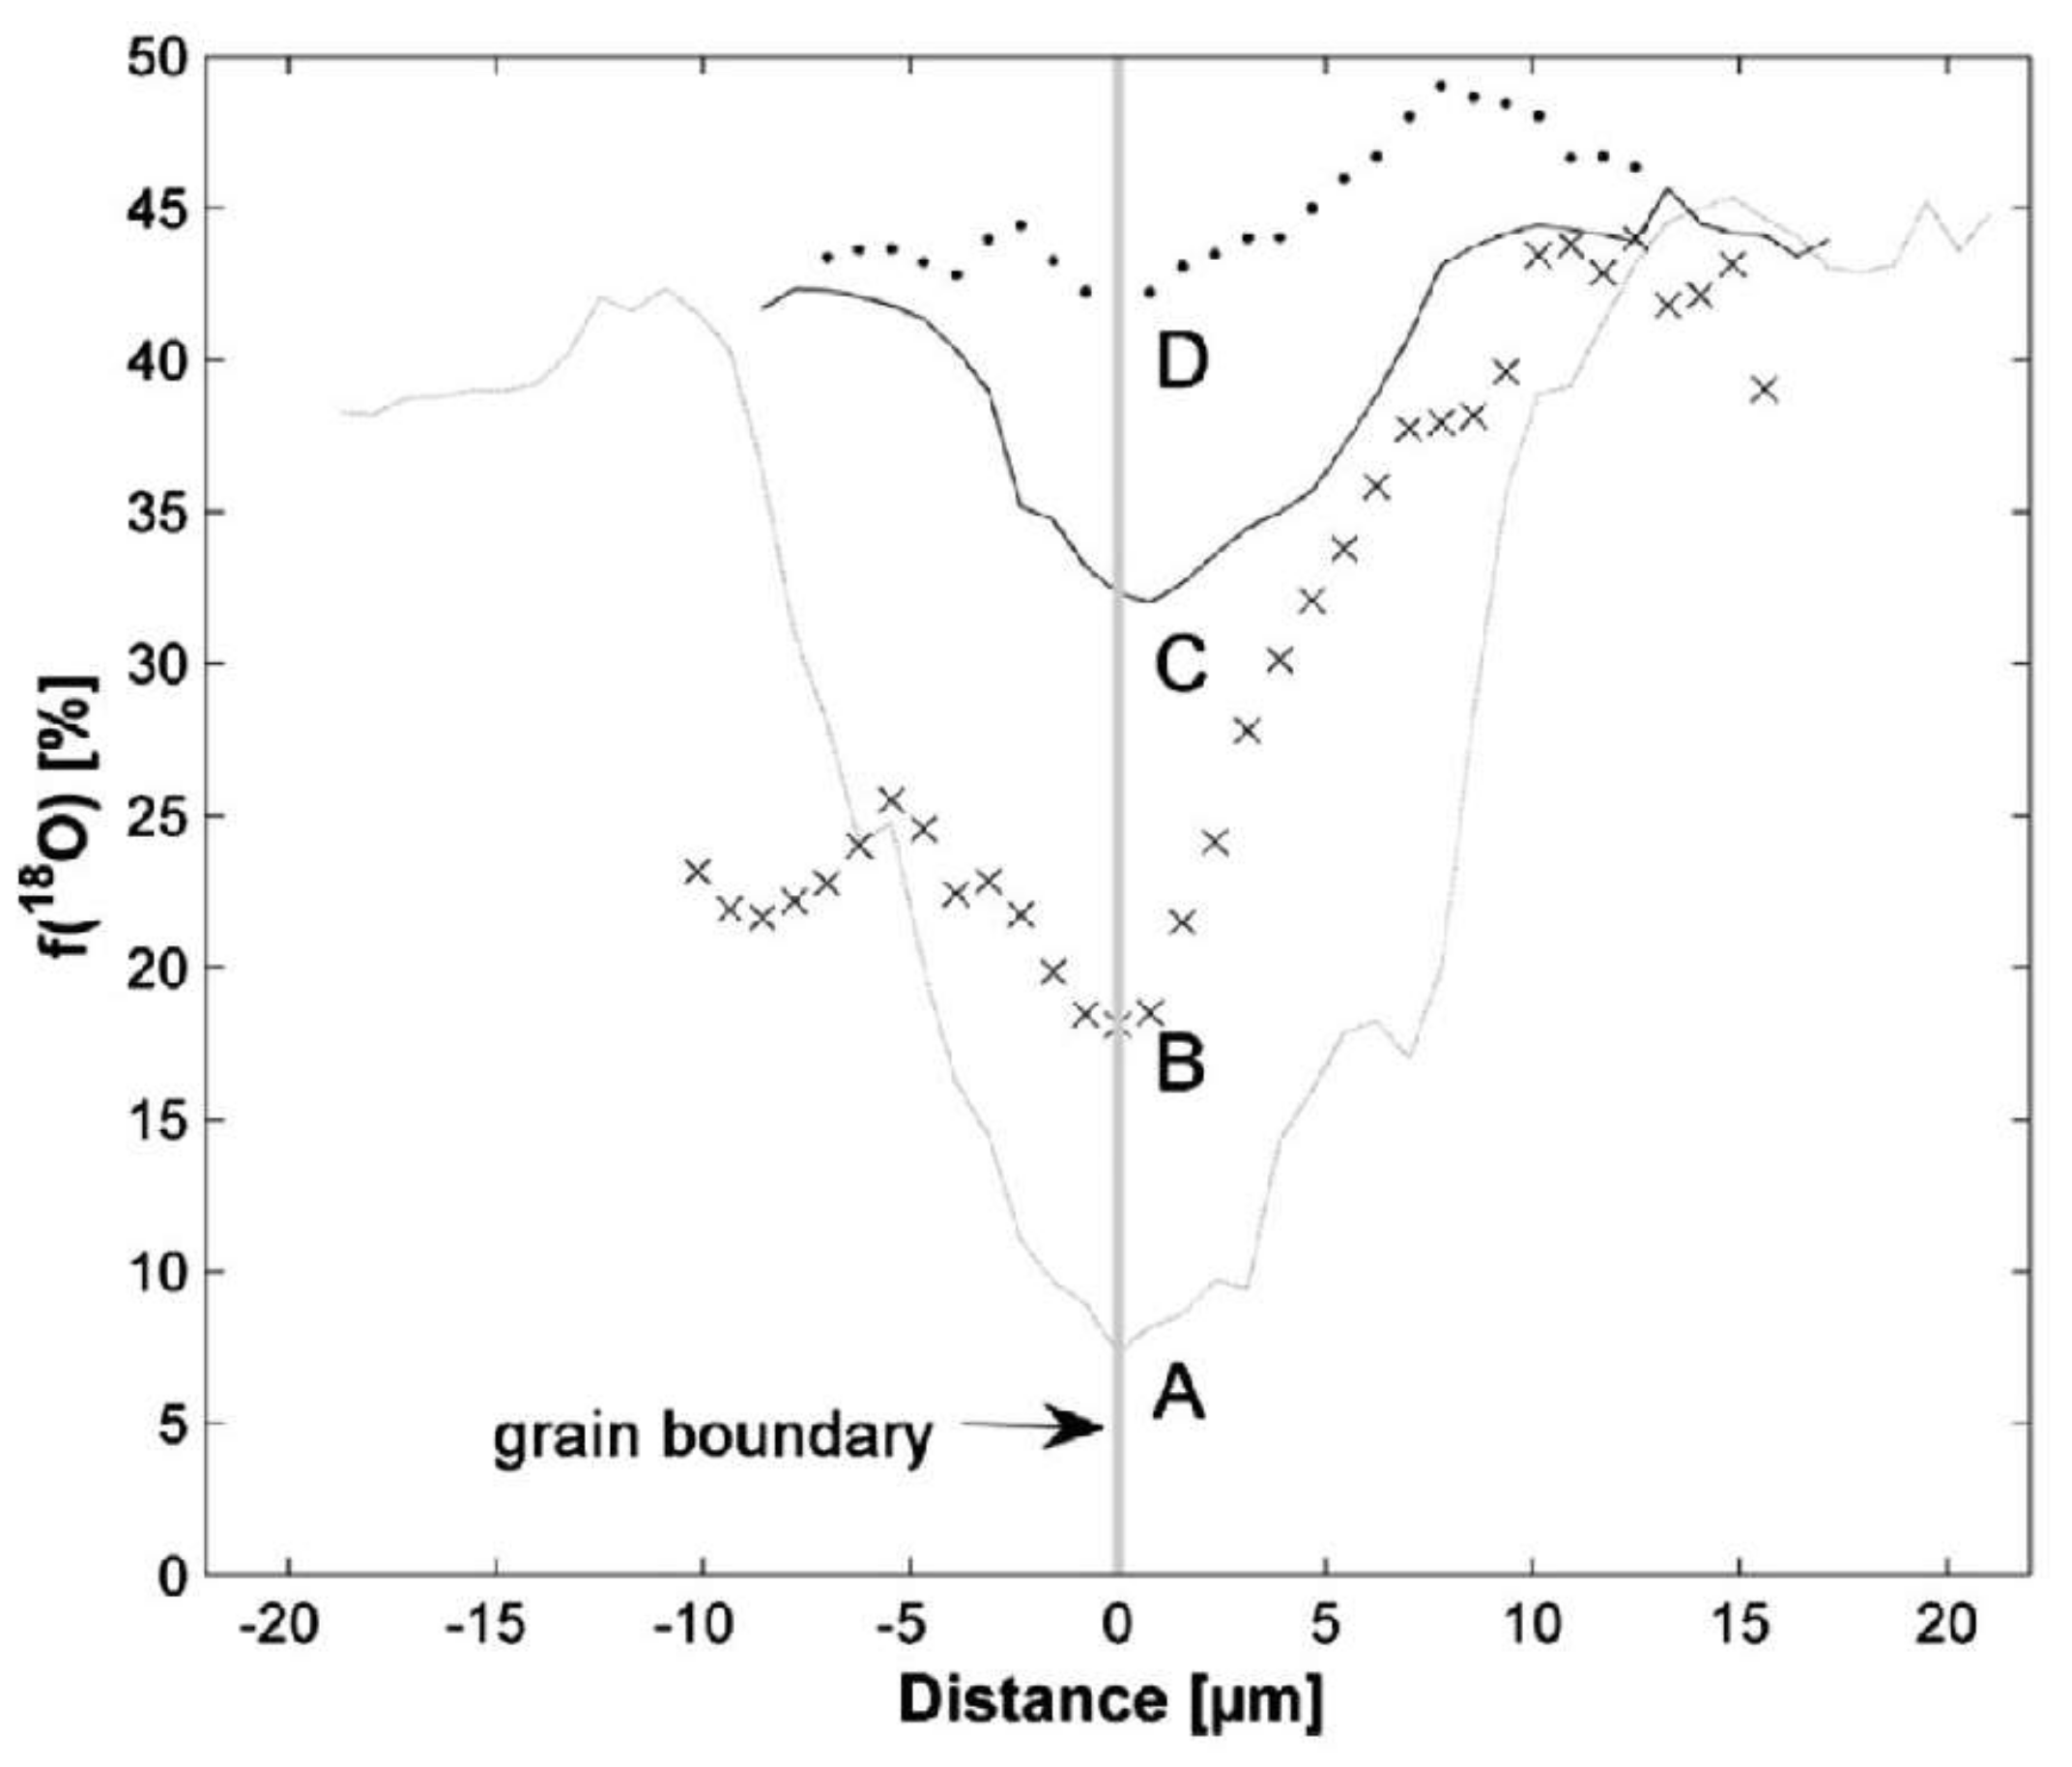
If in situ analyses can be performed, then we can examine the formation or removal of different system components, such as crystals, ion species or gases, using Raman spectroscopy to obtain rates and determine reaction kinetics [82,83,84]. First reports about successful space- and time-resolved in situ Raman spectroscopic experiments designed to investigate the aqueous fluoridation of tooth material at 21 °C, corrosion of borosilicate glass at 70 °C, and the replacement of celestine by strontianite at 21 °C [85,86] have yielded new insights into solid–fluid reactions. However, in situ analyses are not always possible requiring samples to be studied ex situ after the reaction has been stopped. Thus, whilst we can probe reaction mechanisms using experiments, examining the kinetic controls of replacement reactions is challenging. Yet, this is a critical parameter for understanding geological system reactivity. Recent work has demonstrated that the kinetic inhibition of isotopic exchange into oxyanions, such as carbonate [20] and phosphate [74], can fill this void and be used as a timer of the reaction progress [76,79]. For example, fluid infiltration along different reactive pathways into a mineral system can be traced using O-isotope enrichment and Raman spectroscopy. This has been demonstrated using marble blocks in which individual calcite crystals are replaced by apatite using a 2 M (NH4)2HPO4 solution at 200 °C [79]. In these experiments, 18O-enriched water was prepared with a phosphate source with a natural abundance 18O/16O ratio, i.e., the experiment begins with a dominantly 16O isotopologue signature in the dissolved phosphate. However, over the course of the five-day experiment, isotopic exchange between the dissolved phosphate and water produces an increasingly mature phosphate O-isotope signature. Upon precipitation of apatite, this signature becomes locked into the precipitated mineral phase (Figure 4). This produces an isotopic tracer of the solution within the newly precipitated apatite phase. Enrichment can be laterally resolved down to ~1 µm with a typical confocal Raman spectrometer set up, where the lateral resolution dl is limited by the diffraction limit given by dl = 1.22λ/N.A., where λ and N.A. represent the excitation wavelength and the numerical aperture of the objective lens, respectively. Comparison of line profiles across reaction rims at different points along a grain contact is shown in Figure 4. As can be seen from the graph, profile A to D become increasingly flattened, indicating that at profile D the solution had reached isotopic equilibrium with the enriched water. We can use this signature as a stop clock for a period of time in the experiment and derive that in the time taken for the fluid to penetrate ~100 µm along the grain contact (length to D profile) the ICDP reaction proceeded 10 µm into the calcite crystal (point at which A profile reaches same value as in profile D).
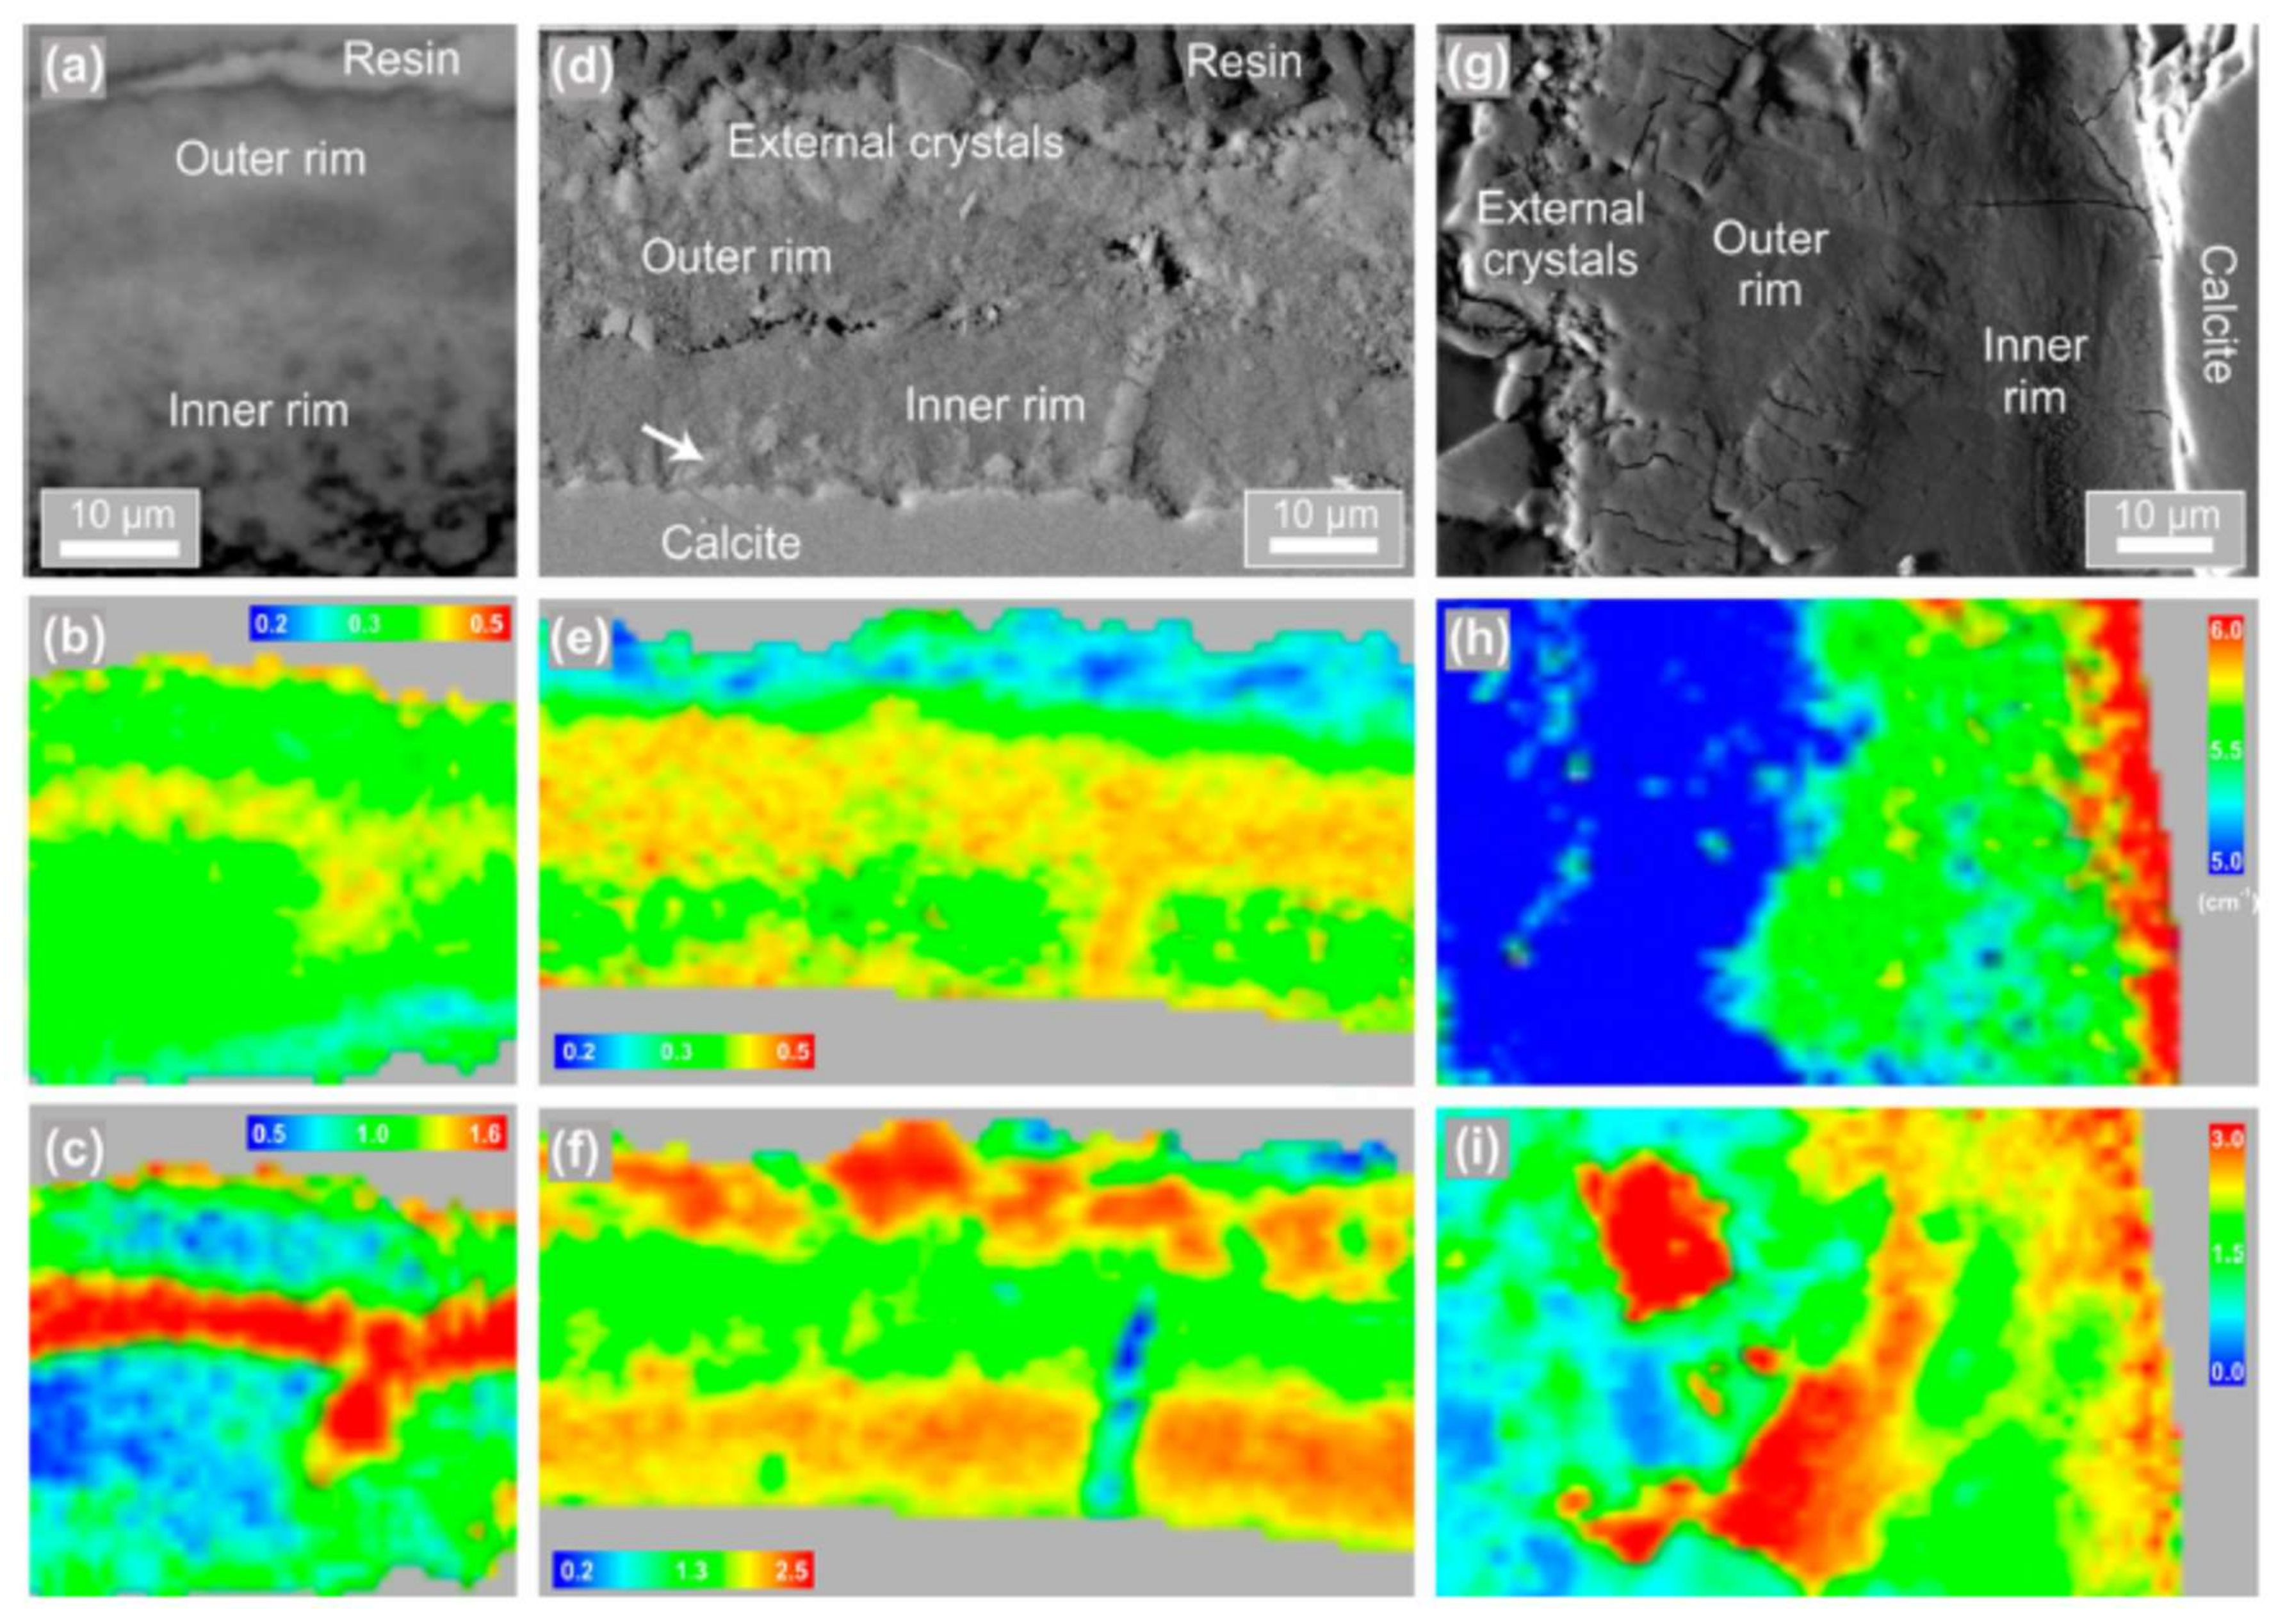
Information about relative timings can be united with the more traditional information gained from Raman spectroscopy (mineral identification, crystallinity, and crystal orientation) to produce an unparalleled view of the processes occurring during mineral replacement. This has been demonstrated by King et al. [76], who studied the formation of a new phase upon reaction of marble with an oxalate (C2O42−) bearing solution. In these experiments a complex replacement rim was produced showing three separate generations of rim material, labelled external crystals, outer and inner rim in Figure 5a,d,g. Despite the clear textural differences of the three replacement layer sections Raman spectroscopy identified them all as the monohydrate Ca-oxalate phase, whewellite. In addition, isotope incorporation into the oxalate oxyanion was retained in the rim. Figure 5b,e, demonstrates that the external crystals had the lowest amount of 18O, followed by the inner rim with the highest amount of 18O incorporation in the outer rim material. This allowed the authors to propose that the reaction was initially not coupled at the interface of the calcite, producing the external crystals. This was followed by dissolution and precipitation coupled at the reacting interface resulting in the formation of the inner rim. These crystals subsequently underwent a fluid-mediated transformation to produce the outer rim material, allowing the 18O signature in the whewellite to be reset. Critically, crystallinity measurements [87] using the width of the main whewellite oxalate symmetrical stretching band at 1454 cm−1 showed that the inner rim had a much lower crystallinity than the outer rim material. This in turn allowed the authors to suggest that the rim underwent a textural re-equilibration driven by increasing crystallinity through the growth of larger crystals. These crystals were not templated on one another nor are they related to the original calcite structure as no preferred orientation could be deduced from the Raman spectra (Figure 5c,f,i), measured using the relative intensities of the 1454 and 1483 cm−1 bands of whewellite. Thus, Raman spectroscopy coupled to isotopic tracers is a powerful tool for probing mineral reactivity in different systems.
7. The Future for Isotopes and Raman Spectroscopy
The work described in this review has laid the foundations for the use of isotopic tracers and Raman spectroscopy in many different mineralogical systems in the future. It has also provided the possibility to extend isotopic tracers and Raman spectroscopy to probe mechanisms of critical processes that control the reactivity of minerals and geological systems. For example, experiments with 18O-enriched water examining amorphous silica formation after olivine [66] and wollastonite [65] show a different extent of 18O-enrichment. Olivine and wollastonite have different silicate structures, where wollastonite contains chains of silica, whereas olivine is composed of individual silica tetrahedra that are joined together by cations. If we calculate the uptake of 18O through hydrolysis of the wollastonite chain, we would expect a maximum of 17 at.% 18O in the amorphous silica. Yet, amorphous silica after wollastonite had an enrichment of 33 at.%, indicating that the silica had been hydrolyzed and released into solution where it could undergo isotope exchange. This is still lower than the enrichment observed in amorphous silica that replaced olivine (54 at.%). Therefore, this signature could be evidence for longer chain sections that are released into solution, as suggested by Weissbart and Rimstidt [88].
Until now, many mineral replacement reactions have been identified that are governed by a coupled dissolution-reprecipitation process at mineral surfaces. This includes dissolution-reprecipitation due to physicochemical processes such as pressure solution creep, a key mechanism by which geological materials deform that is present from diagenetic to greenschist facies metamorphism [89]. These systems are often monomineralic, making differentiation of newly precipitated material challenging. Therefore, use of isotopic tracers in experimental systems that can incorporate information about the time in solution after dissolution and precipitation site have the potential to provide critical data for models of deforming systems. However, to truly probe mechanisms and rates of dissolution-reprecipitation reactions, we need a more fundamental understanding of the different processes that can lead to isotopic enrichment. This includes how condensation of silica potentially changes the isotopic signature. In addition, although computational simulations have demonstrated that oxygen exchange between water and the silica oxyanion is an energetically favorable and efficient process [90], we do not yet know how silica oligomers may affect isotope exchange in solution. Similarly, competition between different oxyanions in solution for O-isotopes may also affect the final signature observed. All these subjects can potentially be examined with Raman spectroscopy in situ, providing critical information that will not only enhance the use of isotopes as tracers at high concentrations, but also the controls of isotopic signatures that are important for paleoclimate and paleohabitat investigations.
Acknowledgments
The authors thank C.V. Putnis for the invitation to submit this paper to the special issue of Minerals on which she is a guest editor. The two reviewers are also thanked for their constructive comments that helped to improve the paper. Publication of this paper was made possible through internal funding at the Department of Earth Sciences, Utrecht University.
Author Contributions
H.E.K. and T.G. both wrote and edited the paper.
Conflicts of Interest
The authors declare no conflict of interest.
References
- Landsberg, G. Eine neue Erscheinung bei der Lichtzerstreuung in Krystallen. Naturwissenschaften 1928, 16, 557–558. [Google Scholar]
- Lafuente, B.; Downs, R.T.; Yang, H.; Stone, N. The power of databases: The RRUFF project. In Highlights in Mineralogical Crystallography; Walter de Gruyter GmbH: Berlin, Germany, 2016. [Google Scholar]
- McMillan, P. Structural studies of silicate glasses and melts-applications and limitations of Raman spectroscopy. Am. Miner. 1984, 69, 622–644. [Google Scholar]
- Frezzotti, M.L.; Tecce, F.; Casagli, A. Raman spectroscopy for fluid inclusion analysis. J. Geochem. Explor. 2012, 112, 1–20. [Google Scholar] [CrossRef]
- Rosso, K.; Bodnar, R. Microthermometric and Raman spectroscopic detection limits of CO2 in fluid inclusions and the Raman spectroscopic characterization of CO2. Geochim. Cosmochim. Acta 1995, 59, 3961–3975. [Google Scholar] [CrossRef]
- Prigiobbe, V. Estimation of nucleation and growth parameters from in situ Raman spectroscopy in carbonate systems. J. Environ. Chem. Eng. 2018, 6, 930–936. [Google Scholar] [CrossRef]
- Wan, Y.; Wang, X.; Hu, W.; Chou, I.; Wang, X.; Chen, Y.; Xu, Z. In situ optical and Raman spectroscopic observations of the effects of pressure and fluid composition on liquid–liquid phase separation in aqueous cadmium sulfate solutions (≤400 °C, 50 MPa) with geological and geochemical implications. Geochim. Cosmochim. Acta 2017, 211, 133–152. [Google Scholar] [CrossRef]
- McMillan, P.F.; Poe, B.T.; Stanton, T.R.; Remmele, R.L. A Raman spectroscopic study of H/D isotopically substituted hydrous aluminosilicate glasses. Phys. Chem. Miner. 1993, 19, 454–459. [Google Scholar] [CrossRef]
- Sato, R.K.; McMillan, P.F. An infrared and Raman study of the isotopic species of alpha-quartz. J. Phys. Chem. 1987, 91, 3494–3498. [Google Scholar] [CrossRef]
- Weckhuysen, B.M.; Jehng, J.; Wachs, I.E. In situ Raman spectroscopy of supported transition metal oxide catalysts: 18O2−16O2 Isotopic Labeling Studies. J. Phys. Chem. B 2000, 104, 7382–7387. [Google Scholar] [CrossRef]
- Wilson, E.B.; Decius, J.C.; Cross, P.C. Molecular Vibrations: The Theory of Infrared and Raman Vibrational Spectra; Courier Corporation: New York, NY, USA, 1980. [Google Scholar]
- Edwards, H.G.M.; Villar, S.E.J.; Jehlicka, J.; Munshi, T. FT–Raman spectroscopic study of calcium-rich and magnesium-rich carbonate minerals. Spectrochim. Acta A 2005, 61, 2273–2280. [Google Scholar] [CrossRef] [PubMed]
- Bhagavantam, S. Effect of crystal orientation on the Raman spectrum of calcite. Proc. Math. Sci. 1940, 11, 62–71. [Google Scholar]
- Farmer, V. Transverse and longitudinal crystal modes associated with OH stretching vibrations in single crystals of kaolinite and dickite. Spectrochim. Acta. A 2000, 56, 927–930. [Google Scholar] [CrossRef]
- Ishibashi, H.; Arakawa, M.; Ohi, S.; Yamamoto, J.; Miyake, A.; Kagi, H. Relationship between Raman spectral pattern and crystallographic orientation of a rock-forming mineral: A case study of Fo89Fa11 olivine. J. Raman Spectrosc. 2008, 39, 1653–1659. [Google Scholar] [CrossRef]
- Shebanova, O.N.; Lazor, P. Raman spectroscopic study of magnetite (FeFe2O4): A new assignment for the vibrational spectrum. J. Solid State Chem. 2003, 174, 424–430. [Google Scholar] [CrossRef]
- Awonusi, A.; Morris, M.D.; Tecklenburg, M.M.J. Carbonate assignment and calibration in the Raman spectrum of apatite. Calcif. Tissue Int. 2007, 81, 46–52. [Google Scholar] [CrossRef] [PubMed]
- Alia, J.; de Mera, Y.D.; Edwards, H.G.M.; Martín, P.G.; Andres, S.L. FT-Raman and infrared spectroscopic study of aragonite-strontianite (CaxSr1− xCO3) solid solution. Spectrochim. Acta A 1997, 53, 2347–2362. [Google Scholar] [CrossRef] [Green Version]
- Herzberg, G. Molecular Spectra and Molecular Structure; D. Van Nostrand Company, Inc.: Princeton, NJ, USA, 1945. [Google Scholar]
- Geisler, T.; Perdikouri, C.; Kasioptas, A.; Dietzel, M. Real-time monitoring of the overall exchange of oxygen isotopes between aqueous CO32− and H2O by Raman spectroscopy. Geochim. Cosmochim. Acta 2012, 90, 1–11. [Google Scholar] [CrossRef]
- Geidel, E.; Krause, K.; Förster, H.; Bauer, F. Vibrational spectra and computer simulations of 18O-labelled NaY zeolites. J. Chem. Soc. Faraday Trans. 1997, 93, 1439–1443. [Google Scholar] [CrossRef]
- Galeener, F.L.; Mikkelsen, J., Jr. Vibrational dynamics in 18O-substituted vitreous SiO2. Phys. Rev. B 1981, 23, 5527. [Google Scholar] [CrossRef]
- Putnis, C.V.; Geisler, T.; Schmid-Beurmann, P.; Stephan, T.; Giampaolo, C. An experimental study of the replacement of leucite by analcime. Am. Miner. 2007, 92, 19–26. [Google Scholar] [CrossRef]
- Gillet, P.; McMillan, P.; Schott, J.; Badro, J.; Grzechnik, A. Thermodynamic properties and isotopic fractionation of calcite from vibrational spectroscopy of 18O-substituted calcite. Geochim. Cosmochim. Acta 1996, 60, 3471–3485. [Google Scholar] [CrossRef]
- Crawford, B., Jr. Vibrational intensities. II. The use of isotopes. J. Chem. Phys. 1952, 20, 977–981. [Google Scholar] [CrossRef]
- Petreanu, E.; Pinchas, S.; Samuel, D. The infra-red absorption of 75% 18O-barium phosphate. J. Inorg. Nucl. Chem. 1965, 27, 2519–2523. [Google Scholar] [CrossRef]
- Corno, M.; Busco, C.; Civalleri, B.; Ugliengo, P. Periodic ab initio study of structural and vibrational features of hexagonal hydroxyapatite Ca10(PO4)6(OH)2. Phys. Chem. Chem. Phys. 2006, 8, 2464–2472. [Google Scholar] [CrossRef] [PubMed]
- Montero, S.; Schmölz, R.; Haussühl, S. Raman spectra of orthorhombic sulfate single crystals I: K2SO4, Rb2SO4, Cs2SO4 and Tl2SO4. J. Raman Spectrosc. 1974, 2, 101–113. [Google Scholar] [CrossRef]
- Pinchas, S.; Shamir, J. The anomalous behaviour of 18O-labelled compounds. Part IV. Vibrational spectra of isotopic vanadate ions. Isr. J. Chem. 1969, 7, 805–811. [Google Scholar] [CrossRef]
- Arakawa, M.; Yamamoto, J.; Kagi, H. Developing micro-Raman mass spectrometry for measuring carbon isotopic composition of carbon dioxide. Appl. Spectrosc. 2007, 61, 701–705. [Google Scholar] [CrossRef] [PubMed]
- Menneken, M.; Geisler, T. An evaluation of the potential of using Raman spectroscopy to determine the carbon isotope composition of CO2 inclusions. J. Geochem. Explor. 2009, 101, 70. [Google Scholar] [CrossRef]
- Menneken, M.; Geisler, T.; Nemchin, A.A.; Strauss, H. Raman spectroscopic determination of the isotope composition of CO2 inclusions. Geochim. Cosmochim. Acta Suppl. 2009, 73, A869. [Google Scholar]
- Carey, D.M.; Korenowski, G.M. Measurement of the Raman spectrum of liquid water. J. Chem. Phys. 1998, 108, 2669–2675. [Google Scholar] [CrossRef]
- Pye, C.C.; Rudolph, W.W. An ab initio and Raman investigation of magnesium (II) hydration. J. Phys. Chem. A 1998, 102, 9933–9943. [Google Scholar] [CrossRef]
- Bulmer, J.T.; Irish, D.E.; Ödberg, L. The temperature dependence of Raman band parameters for aquated Mg(II) and Zn(II). Can. J. Chem. 1975, 53, 3806–3811. [Google Scholar] [CrossRef]
- Martinez, I.; Sanchez-Valle, C.; Daniel, I.; Reynard, B. High-pressure and high-temperature Raman spectroscopy of carbonate ions in aqueous solution. Chem. Geol. 2004, 207, 47–58. [Google Scholar] [CrossRef]
- Pye, C.C.; Rudolph, W.W. An ab initio, infrared, and Raman investigation of phosphate ion hydration. J. Phys. Chem. A 2003, 107, 8746–8755. [Google Scholar] [CrossRef]
- Rudolph, W.W.; Irmer, G.; Hefter, G.T. Raman spectroscopic investigation of speciation in MgSO4(aq). Phys. Chem. Chem. Phys. 2003, 5, 5253–5261. [Google Scholar] [CrossRef]
- Wang, X.; Wang, X.; Chou, I.; Hu, W.; Wan, Y.; Li, Z. Properties of lithium under hydrothermal conditions revealed by in situ Raman spectroscopic characterization of Li2O-SO3-H2O (D2O) systems at temperatures up to 420 °C. Chem. Geol. 2017, 451, 104–115. [Google Scholar] [CrossRef]
- Rudolph, W.W.; Brooker, M.H.; Tremaine, P.R. Raman spectroscopic investigation of aqueous FeSO4 in neutral and acidic solutions from 25 °C to 303 °C: Inner-and outer-sphere complexes. J. Solut. Chem. 1997, 26, 757–777. [Google Scholar] [CrossRef]
- Preston, C.M.; Adams, W.A. A laser Raman spectroscopic study of aqueous orthophosphate salts. J. Phys. Chem. 1979, 83, 814–821. [Google Scholar] [CrossRef]
- Zotov, N.; Keppler, H. Silica speciation in aqueous fluids at high pressures and high temperatures. Chem. Geol. 2002, 184, 71–82. [Google Scholar] [CrossRef]
- King, H.E.; Satoh, H.; Tsukamoto, K.; Putnis, A. Nanoscale observations of magnesite growth in chloride-and sulfate-rich solutions. Environ. Sci. Technol. 2013, 47, 8684–8691. [Google Scholar] [CrossRef] [PubMed]
- Wang, X.; Chou, I.; Hu, W.; Burruss, R.C. In situ observations of liquid–liquid phase separation in aqueous MgSO4 solutions: Geological and geochemical implications. Geochim. Cosmochim. Acta 2013, 103, 1–10. [Google Scholar] [CrossRef]
- Wang, X.; Wan, Y.; Hu, W.; Chou, I.; Cao, J.; Wang, X.; Wang, M.; Li, Z. In situ observations of liquid–liquid phase separation in aqueous ZnSO4 solutions at temperatures up to 400 °C: Implications for Zn2+–SO42− association and evolution of submarine hydrothermal fluids. Geochim. Cosmochim. Acta 2016, 181, 126–143. [Google Scholar] [CrossRef]
- Gebauer, D.; Cölfen, H. Prenucleation clusters and non-classical nucleation. Nano Today 2011, 6, 564–584. [Google Scholar] [CrossRef]
- Geisler, T.; Kasioptas, A.; Menneken, M.; Perdikouri, C.; Putnis, A. A preliminary in situ Raman spectroscopic study of the oxygen isotope exchange kinetics between H2O and (PO4) aq. J. Geochem. Explor. 2009, 101, 37. [Google Scholar] [CrossRef]
- Rudolph, W.W.; Irmer, G.; Königsberger, E. Speciation studies in aqueous HCO3−–CO32− solutions. A combined Raman spectroscopic and thermodynamic study. Dalton Trans. 2008, 900–908. [Google Scholar] [CrossRef] [PubMed]
- Gunasekaran, S.; Anbalagan, G.; Pandi, S. Raman and infrared spectra of carbonates of calcite structure. J. Raman Spectrosc. 2006, 37, 892–899. [Google Scholar] [CrossRef]
- Pinchas, S.; Sadeh, D. Fundamental vibration frequencies of the main isotopic PO43− ions in aqueous solutions. J. Inorg. Nucl. Chem. 1968, 30, 1785–1789. [Google Scholar] [CrossRef]
- Campbell, N.J.; Flanagan, J.; Griffith, W.P. Vibrational spectra of [B(18OH)4]−, [V18O4]3−, and [P18O4]3−: An anomaly resolved. J. Chem. Phys. 1985, 83, 3712–3713. [Google Scholar] [CrossRef]
- Putnis, A.; John, T. Replacement Processes in the Earth's Crust. Elements 2010, 6, 159–164. [Google Scholar] [CrossRef]
- Nahon, D.; Merino, E. Pseudomorphic replacement in tropical weathering: Evidence, geochemical consequences, and kinetic-rheological origin. Am. J. Sci. 1997, 297, 393–417. [Google Scholar] [CrossRef]
- Henao, D.M.O.; Godoy, M.A.M. Jarosite pseudomorph formation from arsenopyrite oxidation using Acidithiobacillus ferrooxidans. Hydrometallurgy 2010, 104, 162–168. [Google Scholar] [CrossRef]
- Laves, F. Artificial preparation of microcline. J. Geol. 1951, 59, 511–512. [Google Scholar] [CrossRef]
- Fiebig, J.; Hoefs, J. Hydrothermal alteration of biotite and plagioclase as inferred from intragranular oxygen isotope-and cation-distribution patterns. Eur. J. Miner. 2002, 14, 49–60. [Google Scholar] [CrossRef]
- Labotka, T.C.; Cole, D.R.; Fayek, M.; Riciputi, L.R.; Stadermann, F.J. Coupled cation and oxygen-isotope exchange between alkali feldspar and aqueous chloride solution. Am. Miner. 2004, 89, 1822–1825. [Google Scholar] [CrossRef]
- Niedermeier, D.R.D.; Putnis, A.; Geisler, T.; Golla-Schindler, U.; Putnis, C.V. The mechanism of cation and oxygen isotope exchange in alkali feldspars under hydrothermal conditions. Contrib. Miner. Petrol. 2009, 157, 65–76. [Google Scholar] [CrossRef]
- Hövelmann, J.; Putnis, A.; Geisler, T.; Schmidt, B.C.; Golla-Schindler, U. The replacement of plagioclase feldspars by albite: Observations from hydrothermal experiments. Contrib. Miner. Petrol. 2010, 159, 43–59. [Google Scholar] [CrossRef]
- Velbel, M.A. Formation of protective surface layers during silicate-mineral weathering under well-leached, oxidizing conditions. Am. Miner. 1993, 78, 405–414. [Google Scholar]
- Liu, Y.; Olsen, A.A.; Rimstidt, D. Mechanism for the dissolution of olivine series minerals in acidic solutions. Am. Miner. 2006, 91, 455–458. [Google Scholar] [CrossRef]
- Zakaznova-Herzog, V.P.; Nesbitt, H.W.; Bancroft, G.M.; Tse, J.S. Characterization of leached layers on olivine and pyroxenes using high-resolution XPS and density functional calculations. Geochim. Cosmochim. Acta 2008, 72, 69–86. [Google Scholar] [CrossRef]
- Schott, J.; Pokrovsky, O.S.; Spalla, O.; Devreux, F.; Gloter, A.; Mielczarski, J.A. Formation, growth and transformation of leached layers during silicate minerals dissolution: The example of wollastonite. Geochim. Cosmochim. Acta 2012, 98, 259–281. [Google Scholar] [CrossRef]
- Pokrovsky, O.S.; Schott, J. Forsterite surface composition in aqueous solutions: A combined potentiometric, electrokinetic, and spectroscopic approach. Geochim. Cosmochim. Acta 2000, 64, 3299–3312. [Google Scholar] [CrossRef]
- Ruiz-Agudo, E.; King, H.E.; Patiño-López, L.D.; Putnis, C.V.; Geisler, T.; Rodriguez-Navarro, C.; Putnis, A. Control of silicate weathering by interface-coupled dissolution-precipitation processes at the mineral-solution interface. Geology 2016, 44, 567–570. [Google Scholar] [CrossRef]
- King, H.E.; Plümper, O.; Geisler, T.; Putnis, A. Experimental investigations into the silicification of olivine: Implications for the reaction mechanism and acid neutralization. Am. Miner. 2011, 96, 1503–1511. [Google Scholar] [CrossRef]
- Cardew, P.T.; Davey, R.J. The kinetics of solvent-mediated phase transformations. Proc. R. Soc. A Math. Phys. 1985, 398, 415–428. [Google Scholar] [CrossRef]
- Putnis, A. Mineral replacement reactions: From macroscopic observations to microscopic mechanisms. Miner. Mag. 2002, 66, 689–708. [Google Scholar] [CrossRef]
- Putnis, A.; Putnis, C.V. The mechanism of reequilibration of solids in the presence of a fluid phase. J. Solid State Chem. 2007, 180, 1783–1786. [Google Scholar] [CrossRef]
- Wang, Y.; Wang, Y.; Merino, E. Dynamic weathering model: Constraints required by coupled dissolution and pseudomorphic replacement. Geochim. Cosmochim. Acta 1995, 59, 1559–1570. [Google Scholar] [CrossRef]
- Glikin, A.E. Polymineral-Metasomatic Crystallogenesis; Springer: Dordrecht, The Netherlands, 2009. [Google Scholar]
- Xia, F.; Brugger, J.; Chen, G.; Ngothai, Y.; O’Neill, B.; Putnis, A.; Pring, A. Mechanism and kinetics of pseudomorphic mineral replacement reactions: A case study of the replacement of pentlandite by violarite. Geochim. Cosmochim. Acta 2009, 73, 1945–1969. [Google Scholar] [CrossRef]
- Putnis, C.V.; Mezger, K. A mechanism of mineral replacement: Isotope tracing in the model system KCl-KBr-H2O. Geochim. Cosmochim. Acta 2004, 68, 2839–2848. [Google Scholar] [CrossRef]
- Kasioptas, A.; Geisler, T.; Perdikouri, C.; Trepmann, C.; Gussone, N.; Putnis, A. Polycrystalline apatite synthesized by hydrothermal replacement of calcium carbonates. Geochim. Cosmochim. Acta 2011, 75, 3486–3500. [Google Scholar] [CrossRef]
- Perdikouri, C.; Kasioptas, A.; Geisler, T.; Schmidt, B.C.; Putnis, A. Experimental study of the aragonite to calcite transition in aqueous solution. Geochim. Cosmochim. Acta 2011, 75, 6211–6224. [Google Scholar] [CrossRef]
- King, H.E.; Mattner, D.C.; Plümper, O.; Geisler, T.; Putnis, A. Forming cohesive calcium oxalate layers on marble surfaces for stone conservation. Cryst. Growth Des. 2014, 14, 3910–3917. [Google Scholar] [CrossRef]
- Geisler, T.; Janssen, A.; Scheiter, D.; Stephan, T.; Berndt, J.; Putnis, A. Aqueous corrosion of borosilicate glass under acidic conditions: A new corrosion mechanism. J. Non-Cryst. Solids 2010, 356, 1458–1465. [Google Scholar] [CrossRef]
- Janssen, A.; Putnis, A.; Geisler, T. The experimental replacement of ilmenite by rutile in HCl solutions. Miner. Mag. 2010, 74, 633–644. [Google Scholar] [CrossRef]
- Jonas, L.; John, T.; King, H.E.; Geisler, T.; Putnis, A. The role of grain boundaries and transient porosity in rocks as fluid pathways for reaction front propagation. Earth Planet. Sci. Lett. 2014, 386, 64–74. [Google Scholar] [CrossRef]
- Geisler, T.; Pöml, P.; Stephan, T.; Janssen, A.; Putnis, A. Experimental observation of an interface-controlled pseudomorphic replacement reaction in a natural crystalline pyrochlore. Am. Miner. 2005, 90, 1683–1687. [Google Scholar] [CrossRef]
- Pöml, P.; Menneken, M.; Stephan, T.; Niedermeier, D.; Geisler, T.; Putnis, A. Mechanism of hydrothermal alteration of natural self-irradiated and synthetic crystalline titanate-based pyrochlore. Geochim. Cosmochim. Acta 2007, 71, 3311–3322. [Google Scholar] [CrossRef]
- Li, J.; Chou, I.; Yuan, S.; Burruss, R.C. Observations on the crystallization of spodumene from aqueous solutions in a hydrothermal diamond-anvil cell. Geofluids 2013, 13, 467–474. [Google Scholar] [CrossRef]
- Wan, Y.; Wang, X.; Chou, I.; Hu, W.; Zhang, Y.; Wang, X. An experimental study of the formation of talc through CaMg(CO3)2–SiO2–H2O interaction at 100–200 °C and vapor-saturation pressures. Geofluids 2017, 2017, 3942826. [Google Scholar] [CrossRef]
- Hänchen, M.; Prigiobbe, V.; Baciocchi, R.; Mazzotti, M. Precipitation in the Mg-carbonate system—Effects of temperature and CO2 pressure. Chem. Eng. Sci. 2008, 63, 1012–1028. [Google Scholar] [CrossRef]
- Geisler, T.; Lenting, C.; Stamm, F.M.; Sulzbach, M. Real-time, in situ hyperspectral Raman imaging of mineral-fluid reactions. Goldschm. Abstr. 2015, 2015, 1016. [Google Scholar]
- Sulzbach, M.; Geisler, T. The replacement of Celestine (SrSO4) by Strontianite (SrCO3) studied in situ, spatially resolved, and real-time by Raman spectroscopy. In Proceedings of the EGU General Assembly Conference, Vienna, Austria, 12–17 April 2015. [Google Scholar]
- Nasdala, L.; Irmer, G.; Wolf, D. The degree of metamictization in zircons: A Raman spectroscopic study. Eur. J. Miner. 1995, 7, 471–478. [Google Scholar] [CrossRef]
- Weissbart, E.J.; Rimstidt, J.D. Wollastonite: Incongruent dissolution and leached layer formation. Geochim. Cosmochim. Acta 2000, 64, 4007–4016. [Google Scholar] [CrossRef]
- De Meer, S.; Spiers, C.J. On mechanisms and kinetics of creep by intergranular pressure solution. In Growth, Dissolution and Pattern Formation in Geosystems; Springer: Dordrecht, The Netherlands, 1999; pp. 345–366. [Google Scholar]
- Felipe, M.A.; Kubicki, J.D.; Rye, D.M. Oxygen isotope exchange kinetics between H2O and H4SiO4 from ab initio calculations. Geochim. Cosmochim. Acta 2004, 68, 949–958. [Google Scholar] [CrossRef]
Figure 1.
Example Raman spectra from The RRUFFTM Project database of the minerals aragonite (R080142), calcite (R040010), and magnesite (R040114). These spectra illustrate the change of the number, position, and width of the bands that occur in the Raman spectra due to changes in structure (aragonite-calcite) and chemistry (calcite-magnesite).

Figure 2.
Isotopic exchange of aqueous carbonate ion with 18O-enriched water. (a) Raman spectra from a 1 M sodium carbonate (lower spectrum) and bicarbonate (upper spectrum) solution, showing the ν1(CO32−) and the ν5(HCO3−) band near 1065 and 1016 cm−1, respectively. (b) Isotopologue bands of CO32− ion in solution. The dark line shows the enriched carbonate population present in a 1 M NaCO3 solution after 10 h at 60 °C and the grey spectrum represents the initial spectrum of the solution shortly after being heated to 60 °C, showing only the ν1(C16O32−) band. (c) Time-resolved Raman spectra of the ν1(CO32−) band, illustrating the O isotope exchange between aqueous CO32− and water at 60 °C. Reprinted from Geochimica et Cosmochimica Acta, vol. 90, Geisler et al., “Real-time monitoring of the overall exchange of oxygen isotopes between aqueous CO32− and H2O by Raman spectroscopy”, pages 1–11, (2012), with permission from Elsevier [20].

Figure 3.
Fraction (%) of the different isotopologues of aqueous CO32− determined by in situ Raman spectroscopy as a function of reaction time between H218O and C16O32−, shown in Figure 2, at different temperatures. Reprinted from Geochimica et Cosmochimica Acta, vol. 90, Geisler et al., “Real-time monitoring of the overall exchange of oxygen isotopes between aqueous CO32− and H2O by Raman spectroscopy”, pages 1–11, Copyright (2012), with permission from Elsevier [20].

Figure 4.
Backscattered electron image of calcite crystals within a cube of Carrara marble that have been partially replaced by apatite (bright phase). Top image shows the location of four line profiles measured using Raman spectroscopy that are depicted in the bottom graph. Isotopic enrichment increases along line A away from the grain contact (labelled grain boundary). Whereas, the apatite at the grain contact probed by line D shows the same level of isotopic enrichment as ~10 µm into the apatite rim along line A. Reprinted from Earth and Planetary Science Letters, vol. 386, Jonas et al., “The role of grain boundaries and transient porosity in rocks as fluid pathways for reaction front propagation”, pages 64–74, (2014), with permission from Elsevier [79].


Figure 5.
Reaction rims produced on marble cubes reacted with 0.1 M oxalic acid at 60 °C for 7 days. (a) shows a reflected light microscope image of a reaction rim generated in a 50 at.% 18O-enriched solution. (b,c) show the 18O fraction in the solid and the relative crystal orientation, respectively. (d) is an electron backscattered image of another section of the reaction rim, where (e) is a map of the 18O fraction, and (f) is a map of the relative crystal orientation in the area in (d). (g) displays an equivalent area of the rim generated in an experiment with natural abundance water (16O-rich). (h) shows the difference in crystallinity of the reaction rim area shown in (g), reflected by the half width of the most intense oxalate band, whereas (i) shows the relative crystal orientation for the same area. Reprinted with permission from Crystal Growth and Design, vol. 14, “Forming cohesive calcium oxalate layers on marble surfaces for stone conservation”, King et al., pages 3910–3917. (2014) American Chemical Society [76].


Table 1.
Replacement reactions that have shown 18O isotope incorporation into structure during mineral replacement by Raman spectroscopy.
Table 1.
Replacement reactions that have shown 18O isotope incorporation into structure during mineral replacement by Raman spectroscopy.
| Reactant | Product | Temp (°C) | Reference |
|---|---|---|---|
| Calcite | Whewellite | 60 | [76] |
| Wollasonite | Amorphous silica | 90 | [65] |
| Olivine | Amorphous silica | 90 | [66] |
| Borosilicate glass | Amorphous silica | 150 | [77] |
| Ilmenite | Rutile | 150 | [78] |
| Aragonite | Apatite | 150 | [74] |
| Calcite | Apatite | 200 | [79] |
| Aragonite | Calcite | 200 | [75] |
| Leucite | Analcime | 200 | [23] |
| Pyrochlore | Pyrochlore | 200 | [80] |
| Pyrochlore | Rutile | 250 | [81] |
| Oligoclase | Albite | 600 | [59] |
| Labradorite | Albite | 600 | [59] |
| Albite | K-feldspar | 600 | [58] |
© 2018 by the authors. Licensee MDPI, Basel, Switzerland. This article is an open access article distributed under the terms and conditions of the Creative Commons Attribution (CC BY) license (http://creativecommons.org/licenses/by/4.0/).
Share and Cite
MDPI and ACS Style
King, H.E.; Geisler, T. Tracing Mineral Reactions Using Confocal Raman Spectroscopy. Minerals 2018, 8, 158. https://0-doi-org.brum.beds.ac.uk/10.3390/min8040158
AMA Style
King HE, Geisler T. Tracing Mineral Reactions Using Confocal Raman Spectroscopy. Minerals. 2018; 8(4):158. https://0-doi-org.brum.beds.ac.uk/10.3390/min8040158
Chicago/Turabian StyleKing, Helen E., and Thorsten Geisler. 2018. "Tracing Mineral Reactions Using Confocal Raman Spectroscopy" Minerals 8, no. 4: 158. https://0-doi-org.brum.beds.ac.uk/10.3390/min8040158
Note that from the first issue of 2016, this journal uses article numbers instead of page numbers. See further details here.