Response Surface Methodology for Optimization of Copper Leaching from Refractory Flotation Tailings

1
.State Key Laboratory of Complex Nonferrous Metal Resources Clean Utilization, Kunming University of Science and Technology, Kunming 650093, China
2
Faculty of Land Resource Engineering, Kunming University of Science and Technology, Kunming 650093, China
*
Author to whom correspondence should be addressed.
Minerals 2018, 8(4), 165; https://0-doi-org.brum.beds.ac.uk/10.3390/min8040165
Submission received: 5 March 2018
/
Revised: 27 March 2018
/
Accepted: 16 April 2018
/
Published: 18 April 2018
(This article belongs to the Special Issue Sustainable Mineral Processing Technologies)
Abstract
:Response surface methodology is used to optimize the leaching process for refractory flotation copper tailings. The proportion of the refractory combination oxide copper (chrysocolla) is 64.84%. At present, few studies have examined the leaching of chrysocolla. In this study, we examine the effects of several variables, including the amount of concentrated sulfuric acid, leaching temperature, and leaching time, on leaching efficiency. Using a response surface methodology, we develop a quadratic model relanbting all the above experimental variables with leaching efficiency. The resulting model is highly consistent with experimental data. According to the model, the factor with the greatest influence on leaching efficiency is the amount of concentrated sulfuric acid. According to the model, the optimal leaching conditions are 85 kg/t concentrated sulfuric acid, a leaching temperature of 68.51 °C, and a leaching time of 4.36 h. The actual measured leaching efficiency under these conditions is 85.86%, which is close to the value of 86.79% predicted by the model. We study the leaching processes using scanning electron microscopy (SEM) and energy dispersive spectrometry (EDS) surface scan analyses. Both methods allow us to explore the content of the main element and visually observe its distribution, allowing us to develop effective methods for treating low-grade oxide ores.
1. Introduction
Copper is a type of metal that is widely distributed in nature. This element has numerous useful properties and can form an alloy with various elements. Under the current conditions of rapid economic growth, the demand for copper consumption has soared. At the same time, easy-to-recover copper sulfide ores are becoming scarce. This scarcity has led to the development and use of refractory copper oxides. Malachite and azurite are the most common copper oxide minerals, followed by chrysocolla, zigueline, copper sulfate, copper phosphate, copper arsenate, and other copper soluble salts [1].
Copper oxide is more difficult to recover than copper sulfide. Presently, the three main treatment methods of copper oxide are flotation [2,3], leaching [4], and beneficiation-metallurgy combination processes [5]. The flotation method can be divided into the two following types: direct flotation and sulfidation–xanthate flotation. The latter is the most common method. Recent studies have focused on finding the efficient selective collectors and combination use of various collectors [6]. The second method is leaching, which involves a chemical reaction between copper oxide and a leaching medium. Leaching can be divided into two types, namely, acid leaching and ammonia leaching [7,8], named after the leaching agent employed. Acid and ammonia leaching are suitable for treating the copper oxide ores, which have acidic silicate and carbonate alkaline gangues, respectively. The third method, which has been considerably studied in recent years, is to use beneficiation-metallurgy combination processes. This method is very effective in recovering refractory copper oxide.
The response surface methodology requires using a reasonable experimental design method and obtaining data through actual experiments. Multivariate quadratic regression equations are then used to fit the functional relationship between the experimental factors and response values. In addition, a statistical method for analyzing the regression equation is developed to obtain the optimal process parameters. Only a relatively small number of experiments are required in this method, which reduces the time and materials required. Central composite design (CCD) is a common method of response surface analysis and is frequently used in testing the nonlinear effects of factors, obtaining optimal test conditions with minimal consumption, and analyzing the relationships among the factors [9,10,11].
Herein, we use the response surface methodology to study the low grade and high-oxidation rate of flotation tailings. These flotation tailings are difficult to recycle, and contain a proportion of refractory combination oxide copper (chrysocolla) as high as 64.84%. At present, there is not much literature reporting the examination of the leaching of chrysocolla using the response surface methodology. Thus, we use such a method to minimize the amount of concentrated sulfuric acid and heating costs, save energy, and reduce the negative environmental impacts of the technology. The method can also be used to predict leaching efficiency under different conditions, allowing us to develop effective methods for treating low-grade oxide ores.
2. Experimental Section
2.1. Description of Samples and Apparatus
The raw ore used in this study is a copper oxide from Zambia, Africa. It is characterized by high-oxidation rate, and 85% of particles in this ore are smaller than 0.074 mm. Firstly, the easy-to-recover copper sulfide and free oxidation copper in the raw ore were recycled by flotation, but the other refractory copper oxides, mainly the combination copper oxide, were not thoroughly recycled and the majority were lost in the tailings. As is typical for flotation tailings containing silicate gangue minerals, high temperature leaching was used [12].
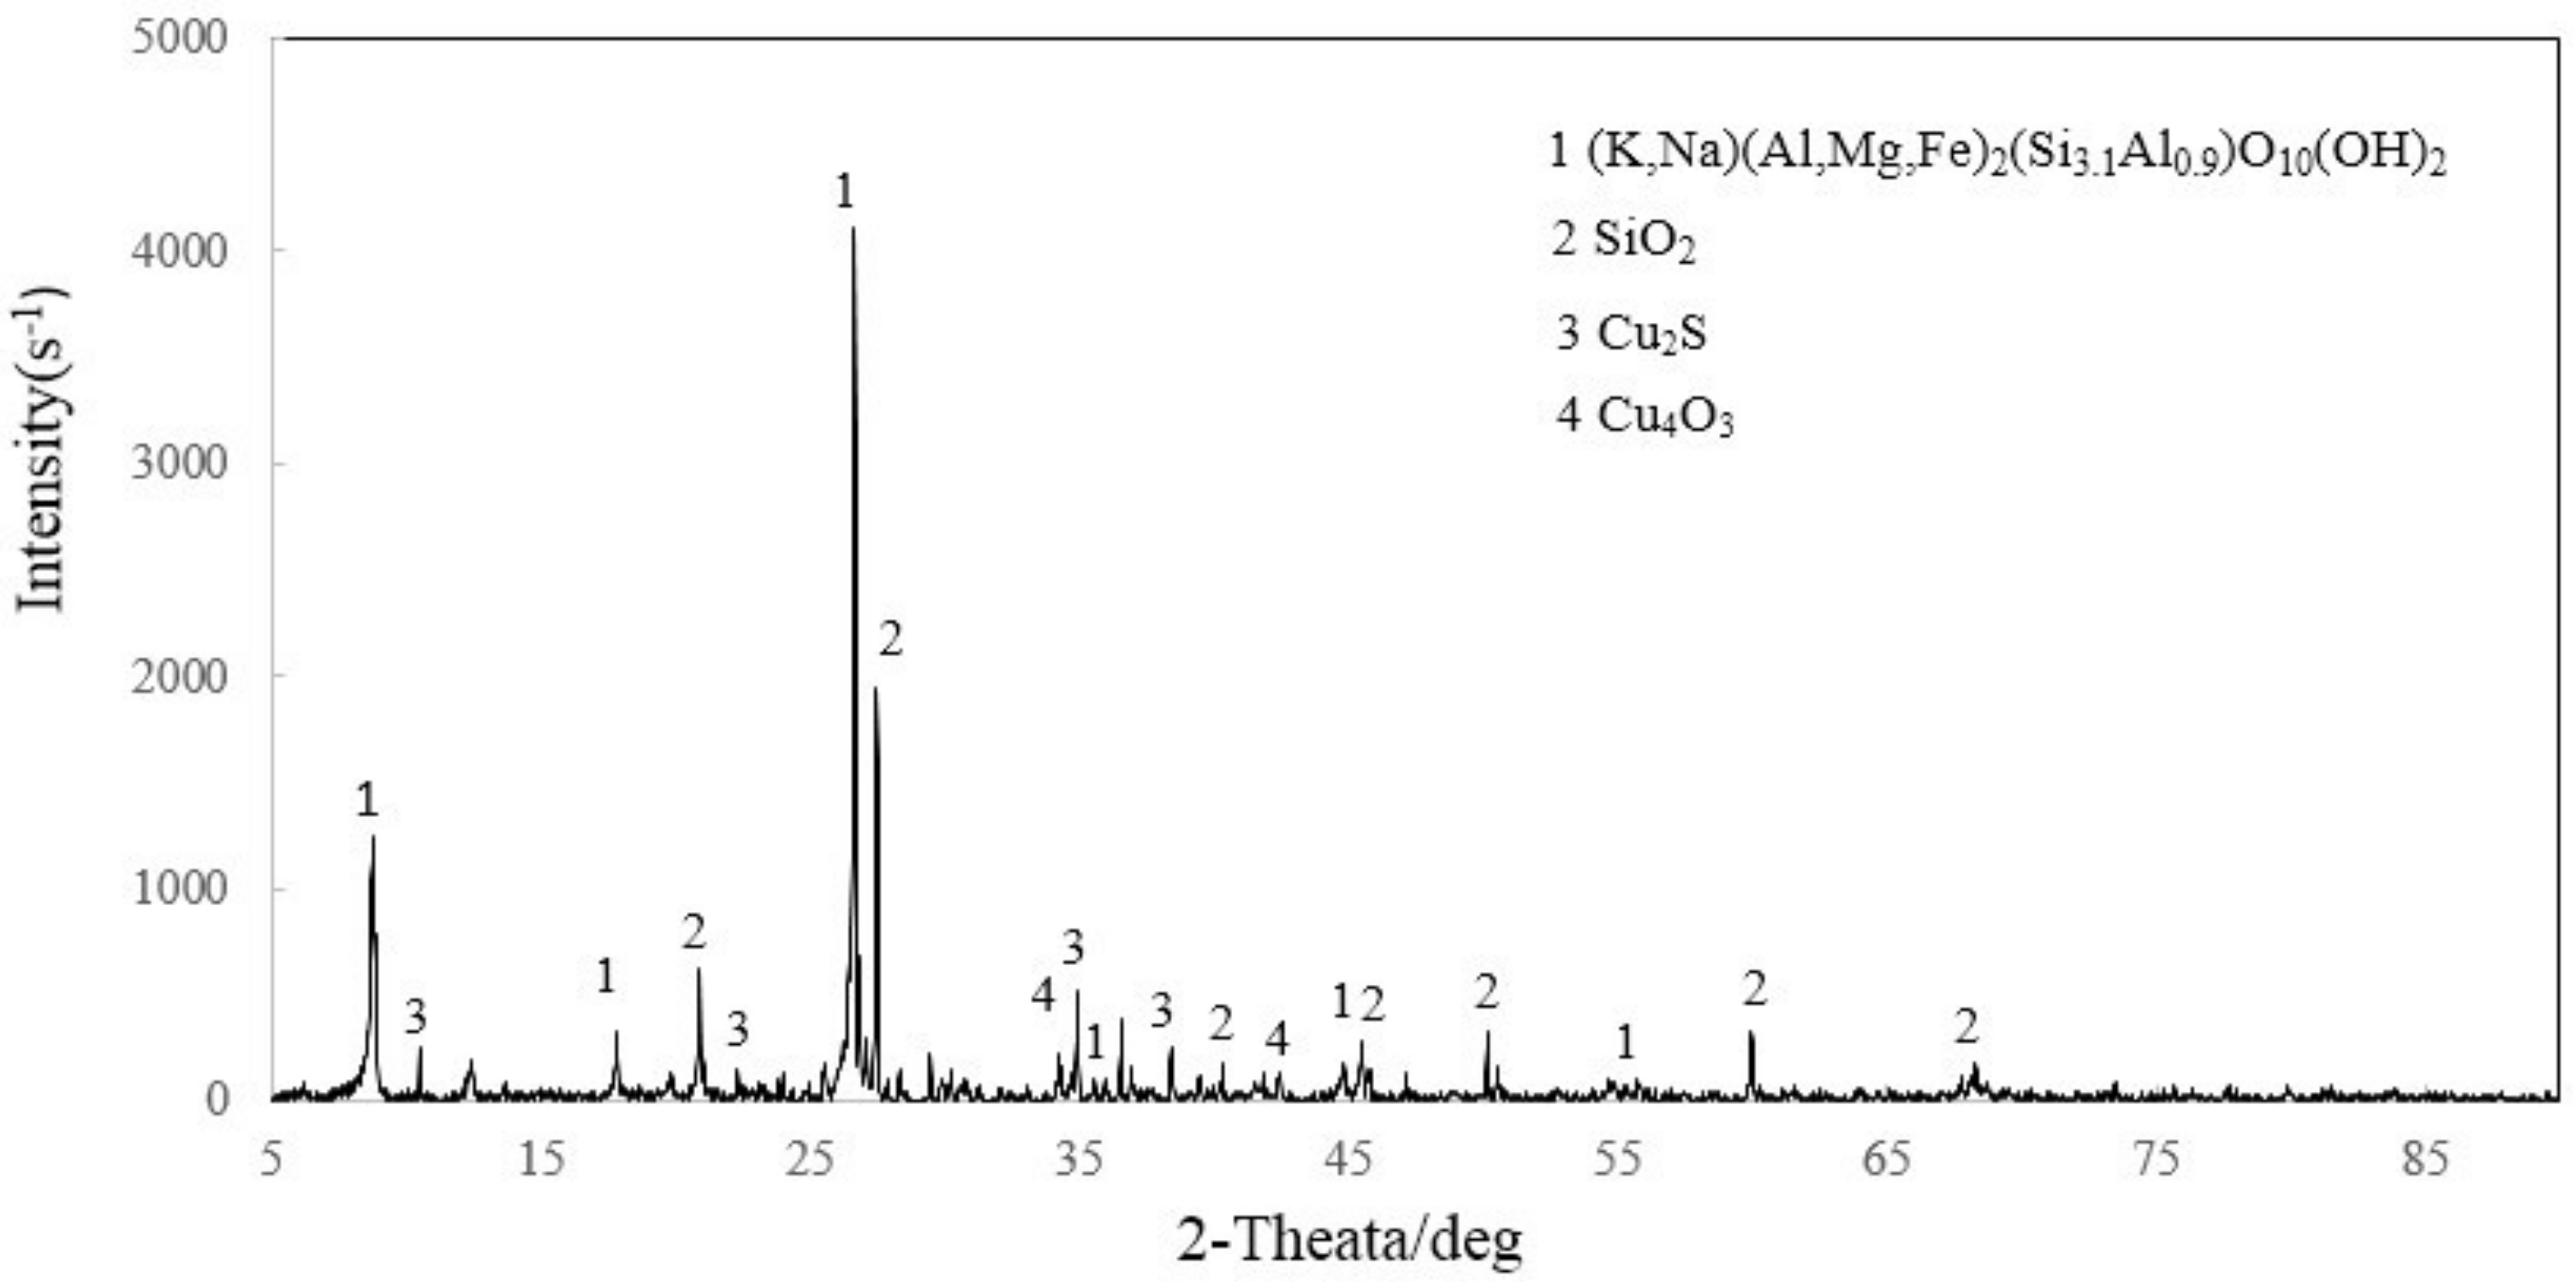
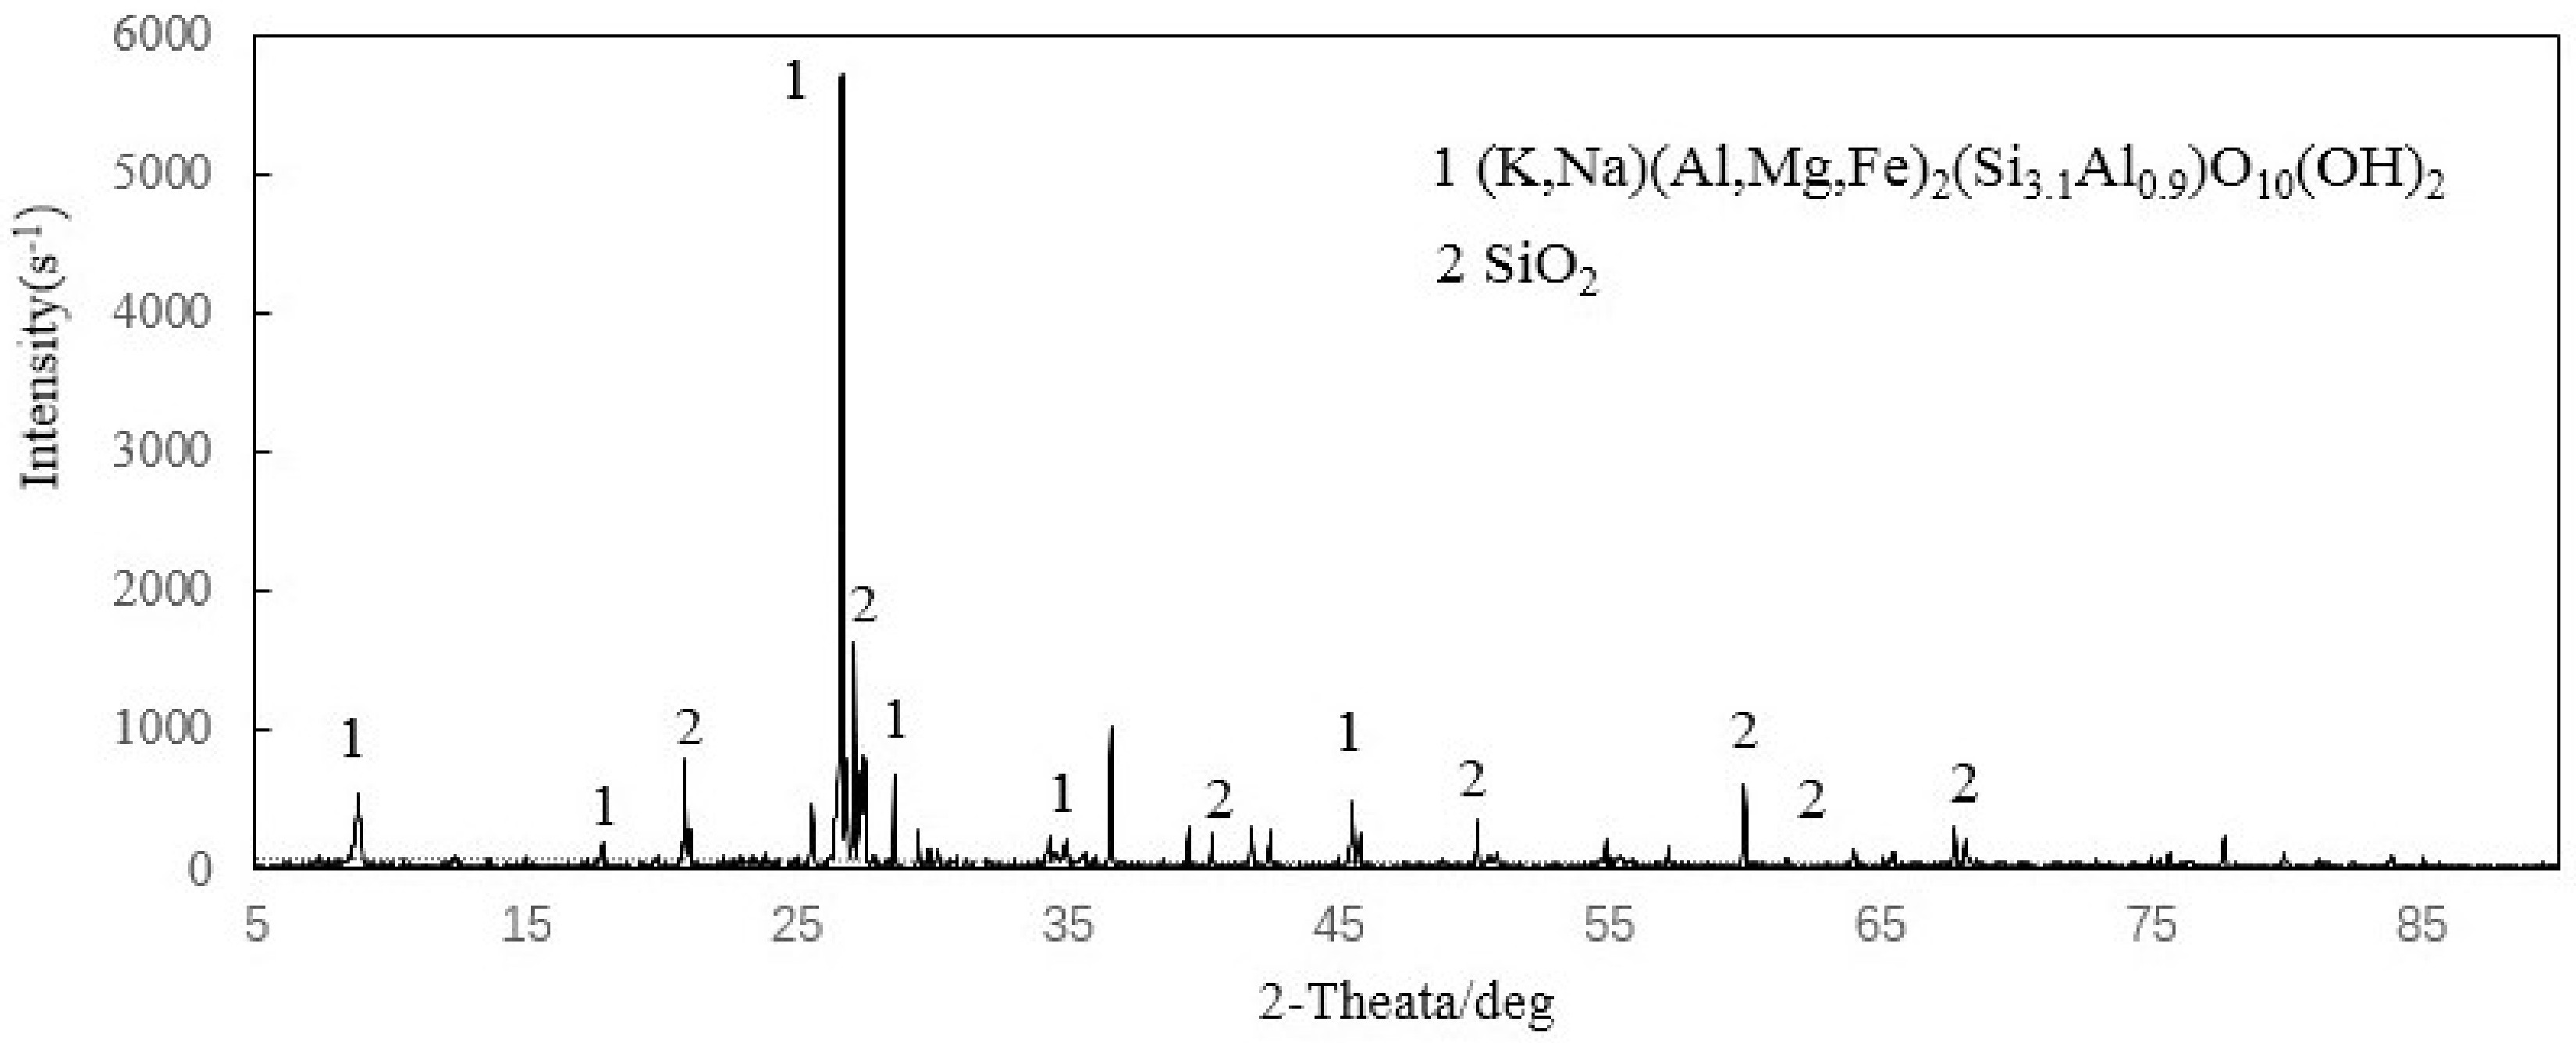
The copper mineral composition and chemical composition of the flotation tailings were analyzed by phase analysis and chemical element analysis techniques, respectively, and the mineral species were analyzed using X-ray powder diffraction (XRD). The XRD patterns were recorded by using a D/max-3B X-ray powder diffractometer (Rigaku, Tokyo, Japan) through Cu Kα radiation (=1.5418 Å). Scanning electron microscopy (SEM) analysis (Nova NanoSEM 450, FEI, Eindhoven, Netherlands) and energy dispersive spectrometry (EDS) (X-MaxN, Oxford, UK) were used. In the leaching test conducted on the flotation tailings, a concentrated sulfuric acid was used as the leaching agent. All agents were of industrial grade (industrial pure).
Process mineralogy analysis showed that the copper mineral species in the flotation tailings were mainly chalcocite (0.05%), malachite (0.22%), and chrysocolla (0.71%). The gangue minerals were mainly quartz (20.18%), biotite (32.33%), and potassium feldspar (30.62%). Chalcocite and malachite were closely symbiotic with chrysocolla, biotite, and quartz. Chrysocolla was closely symbiotic with quartz and potassium feldspar.
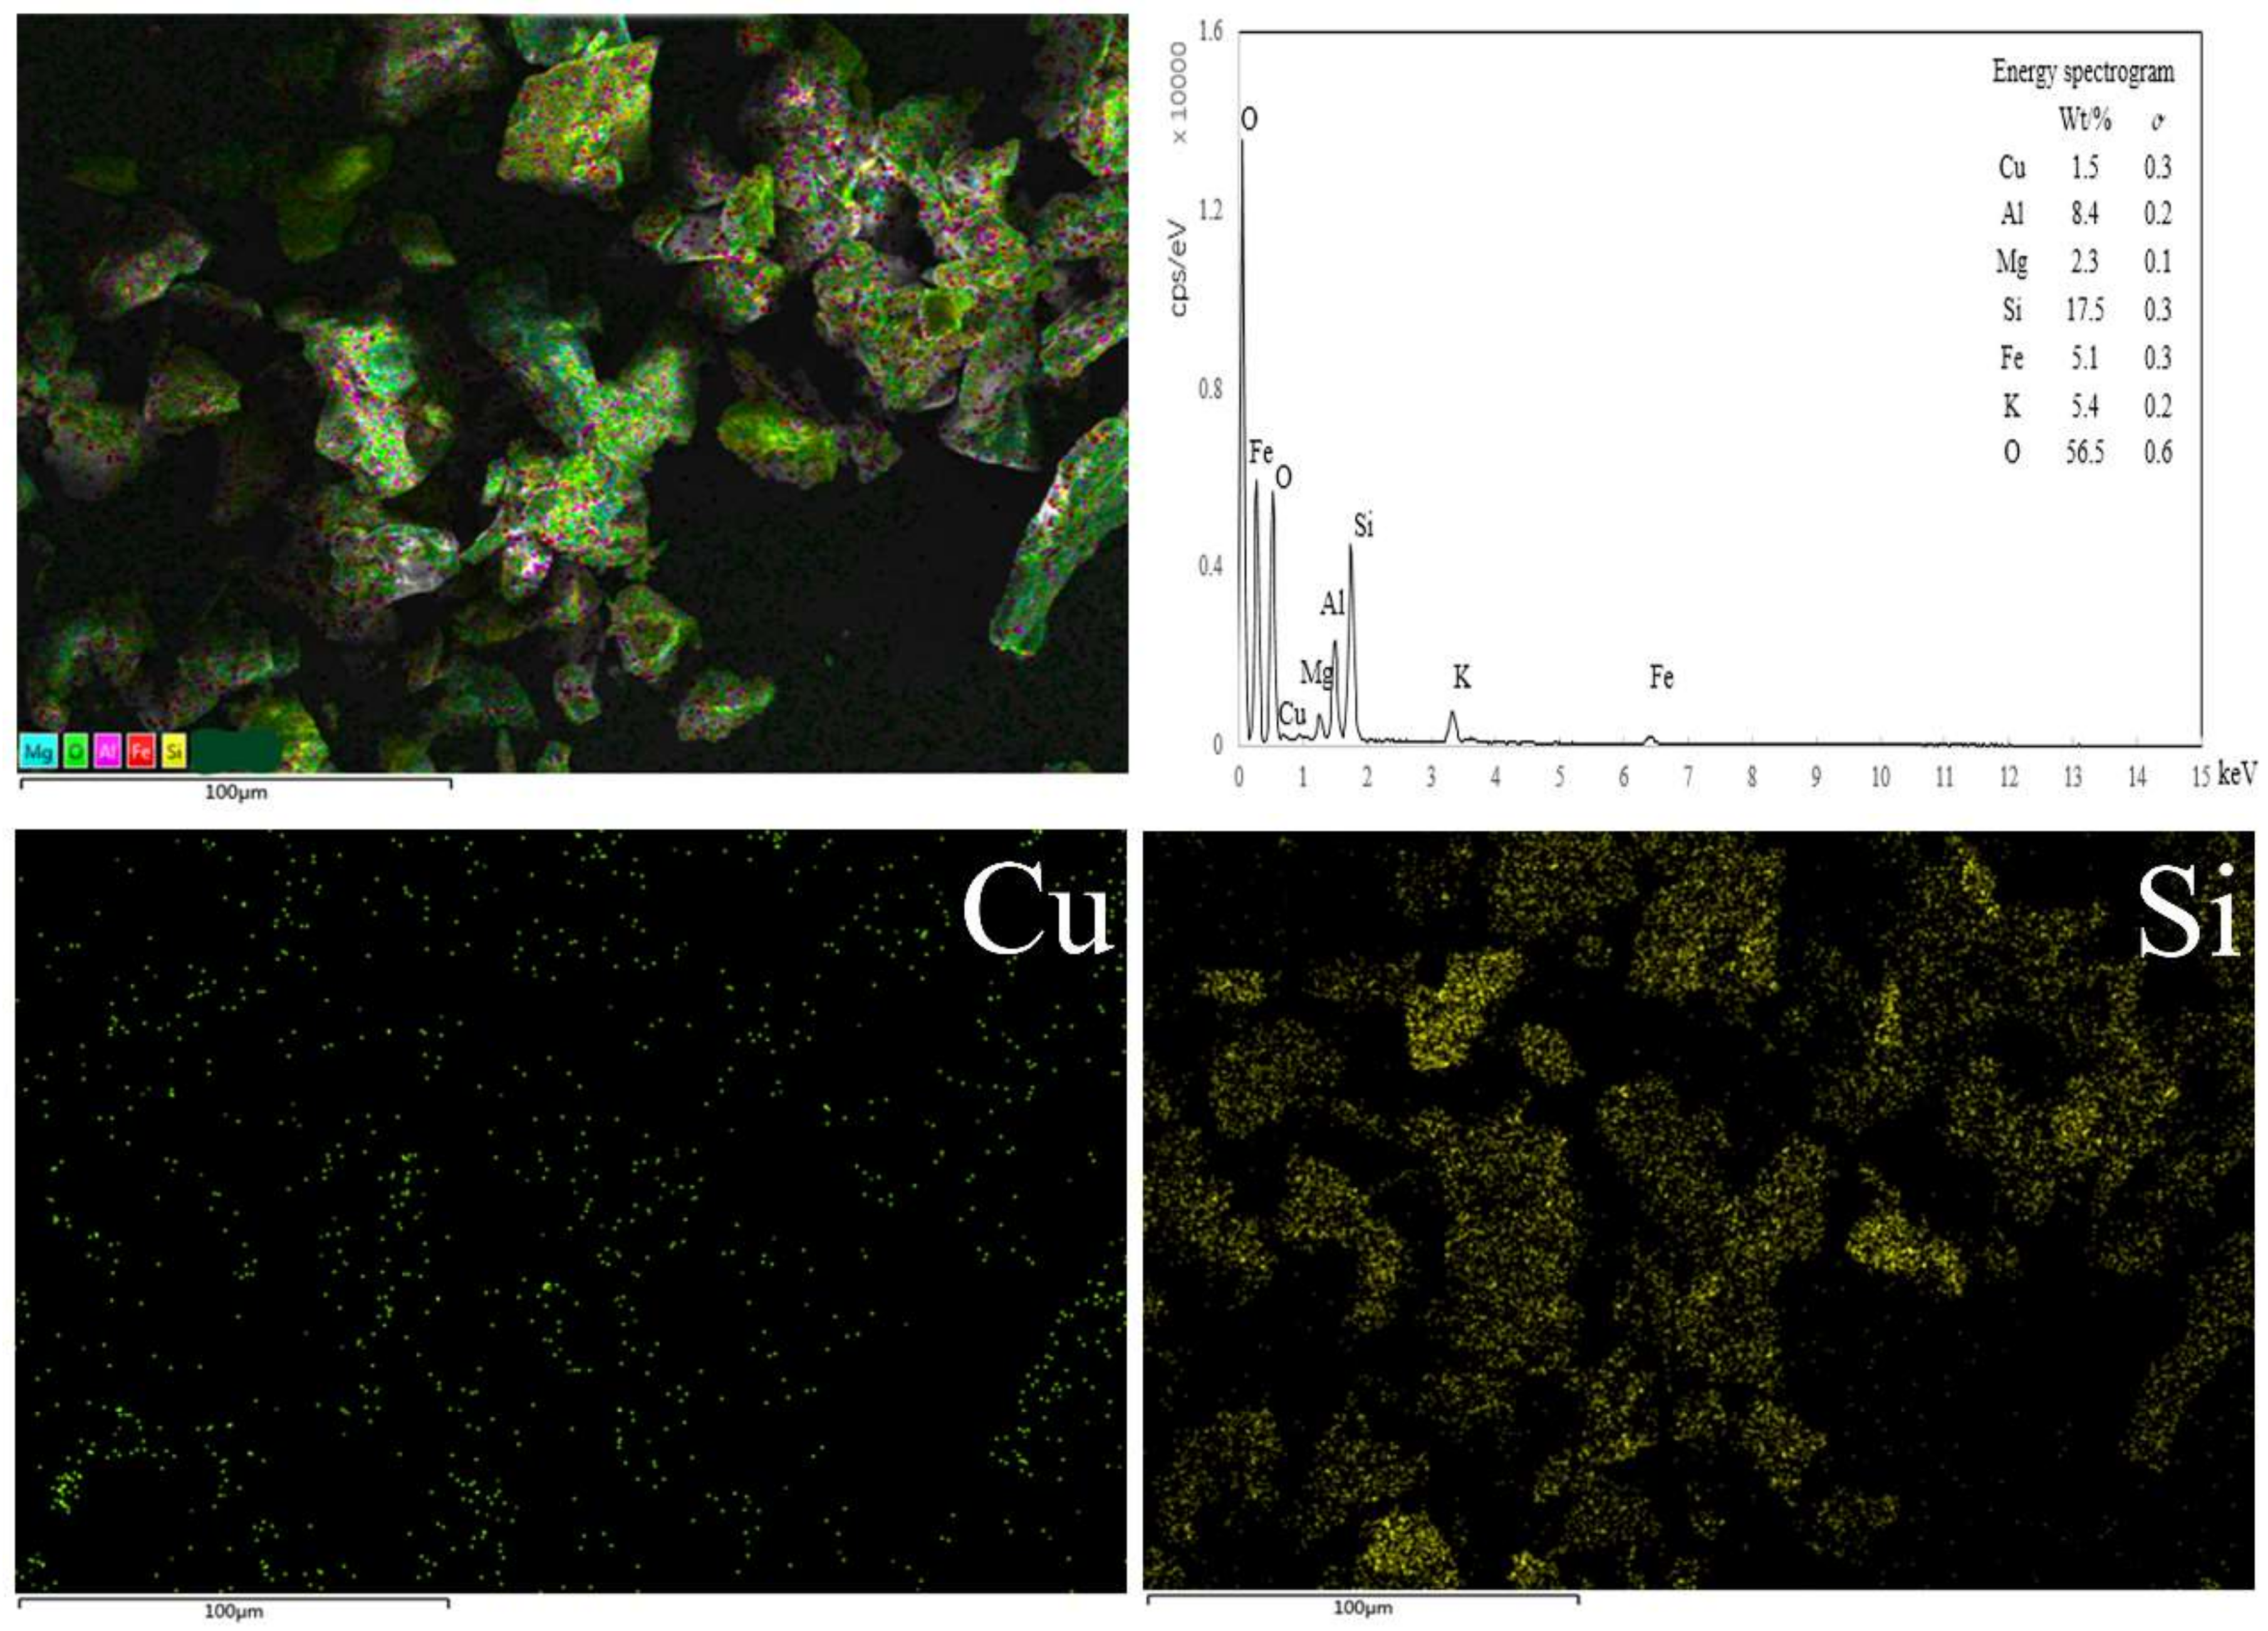
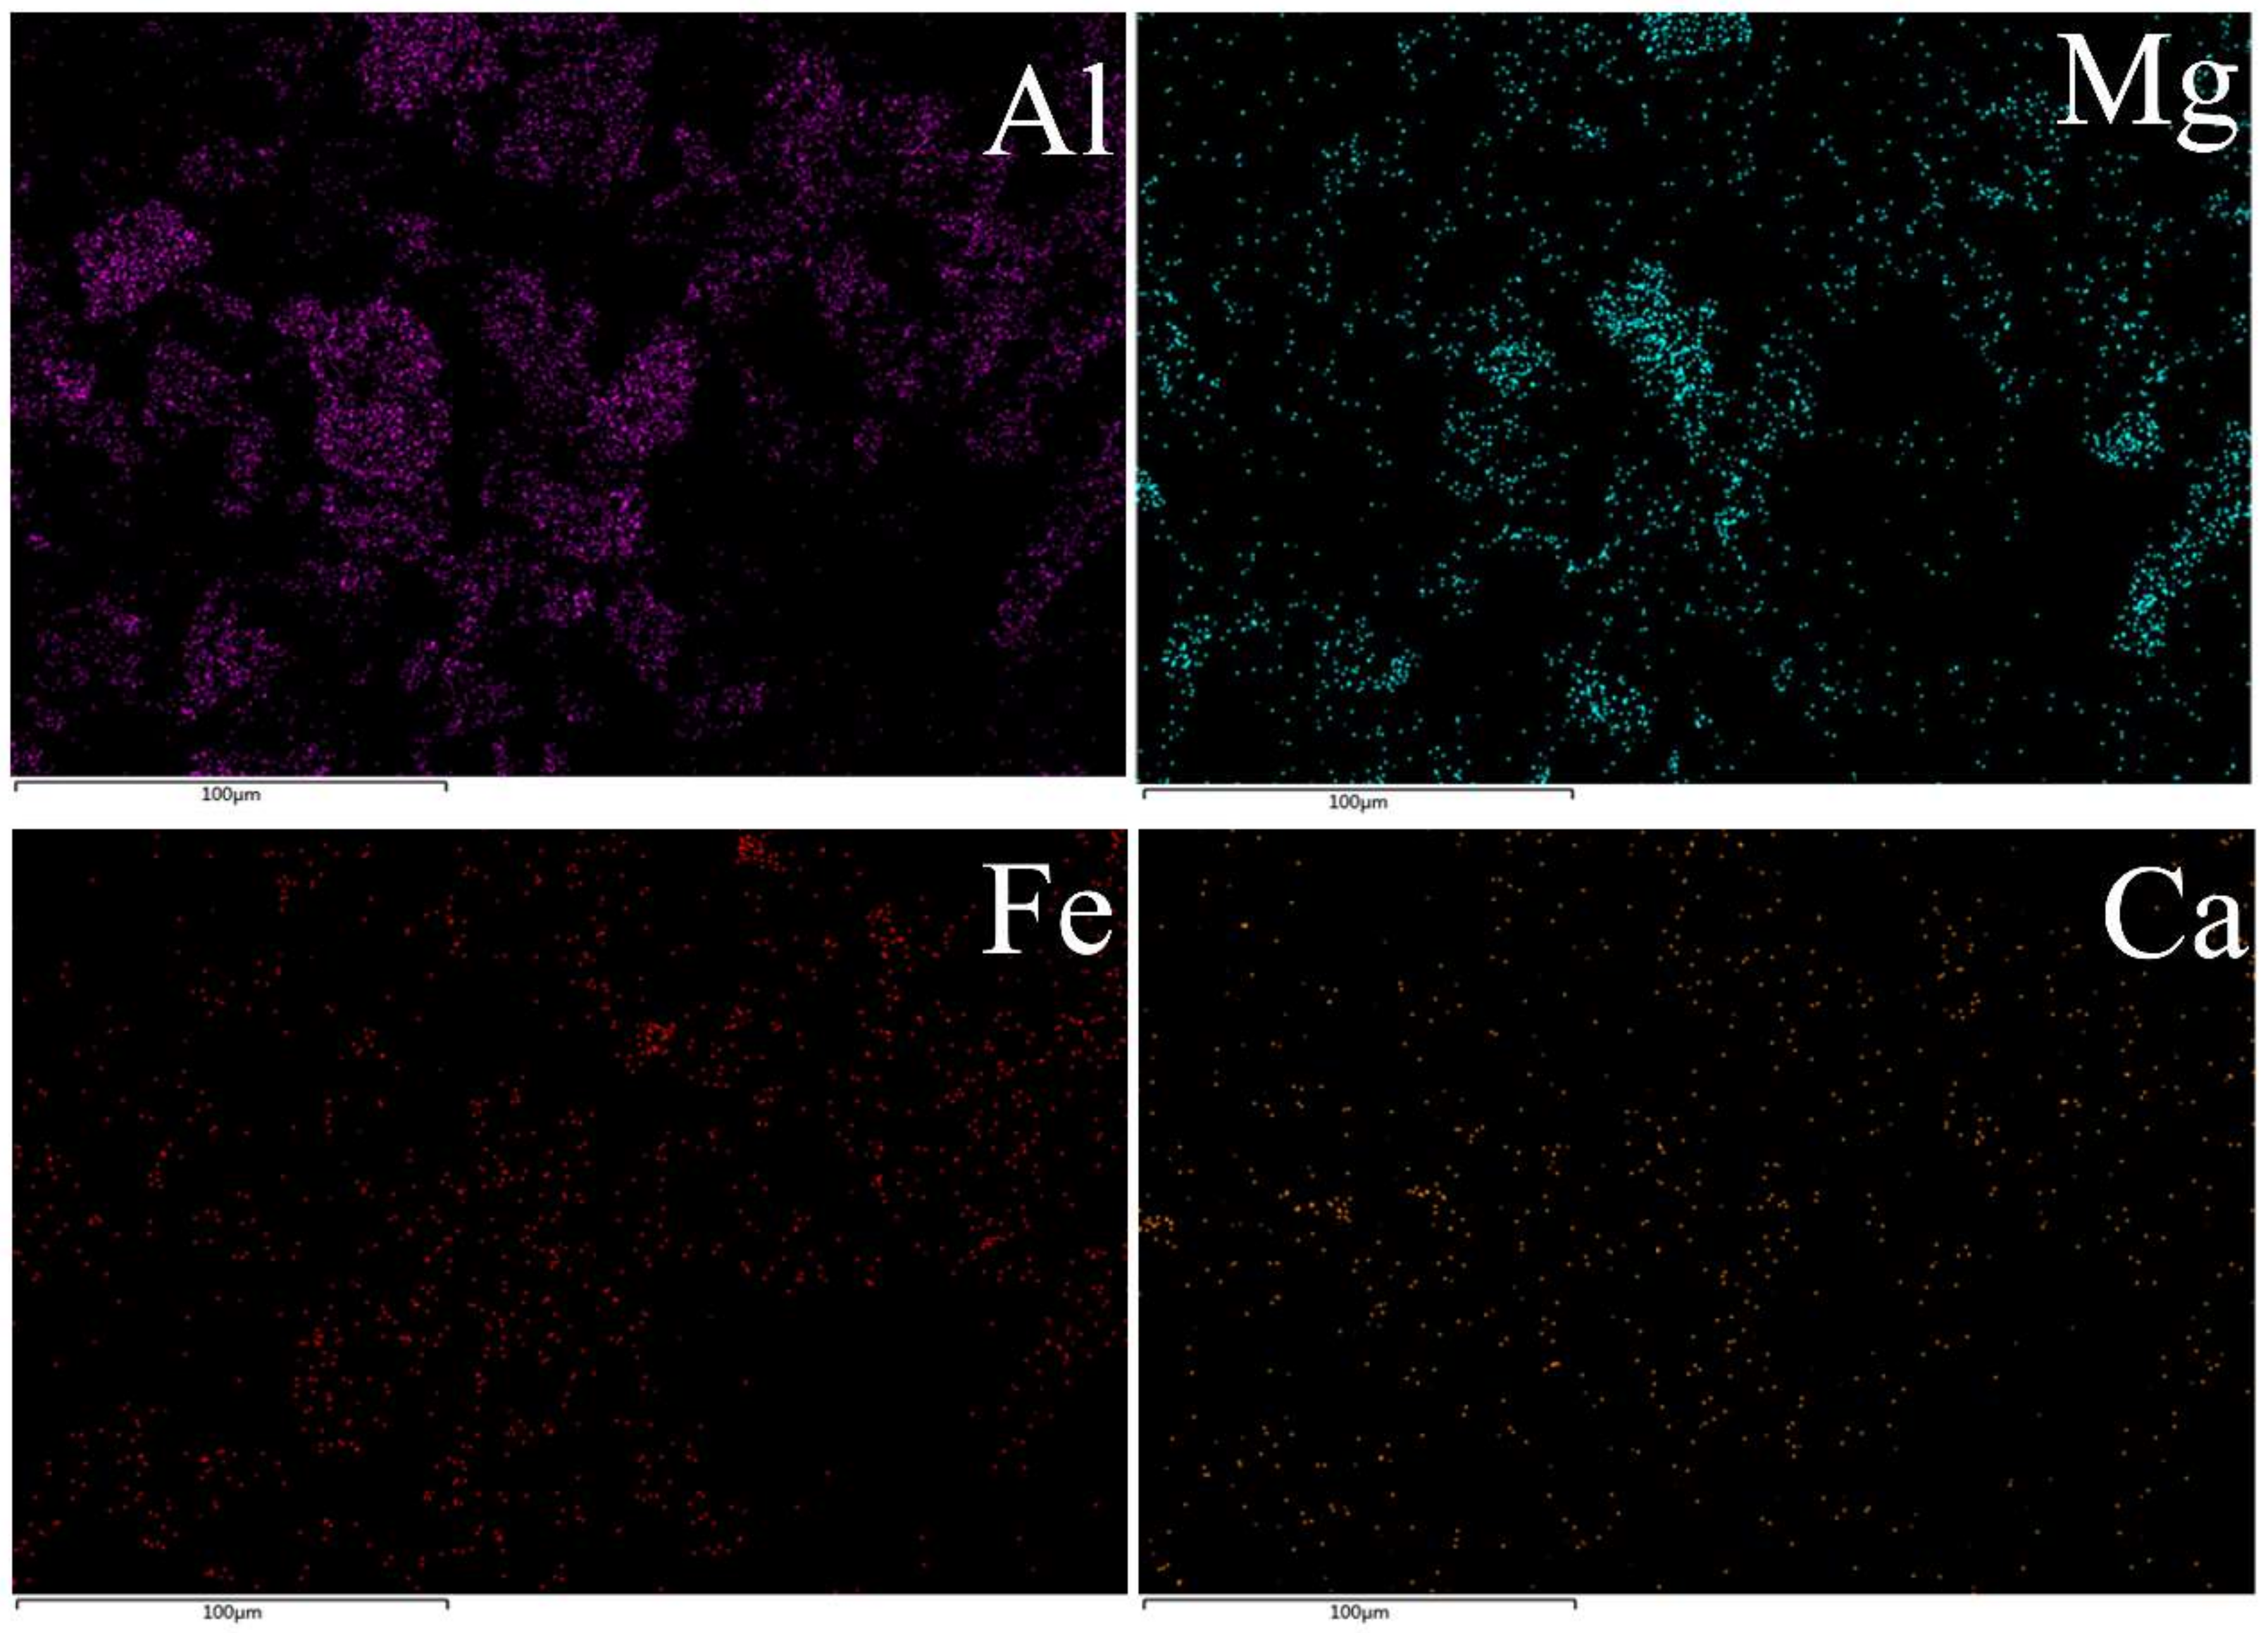
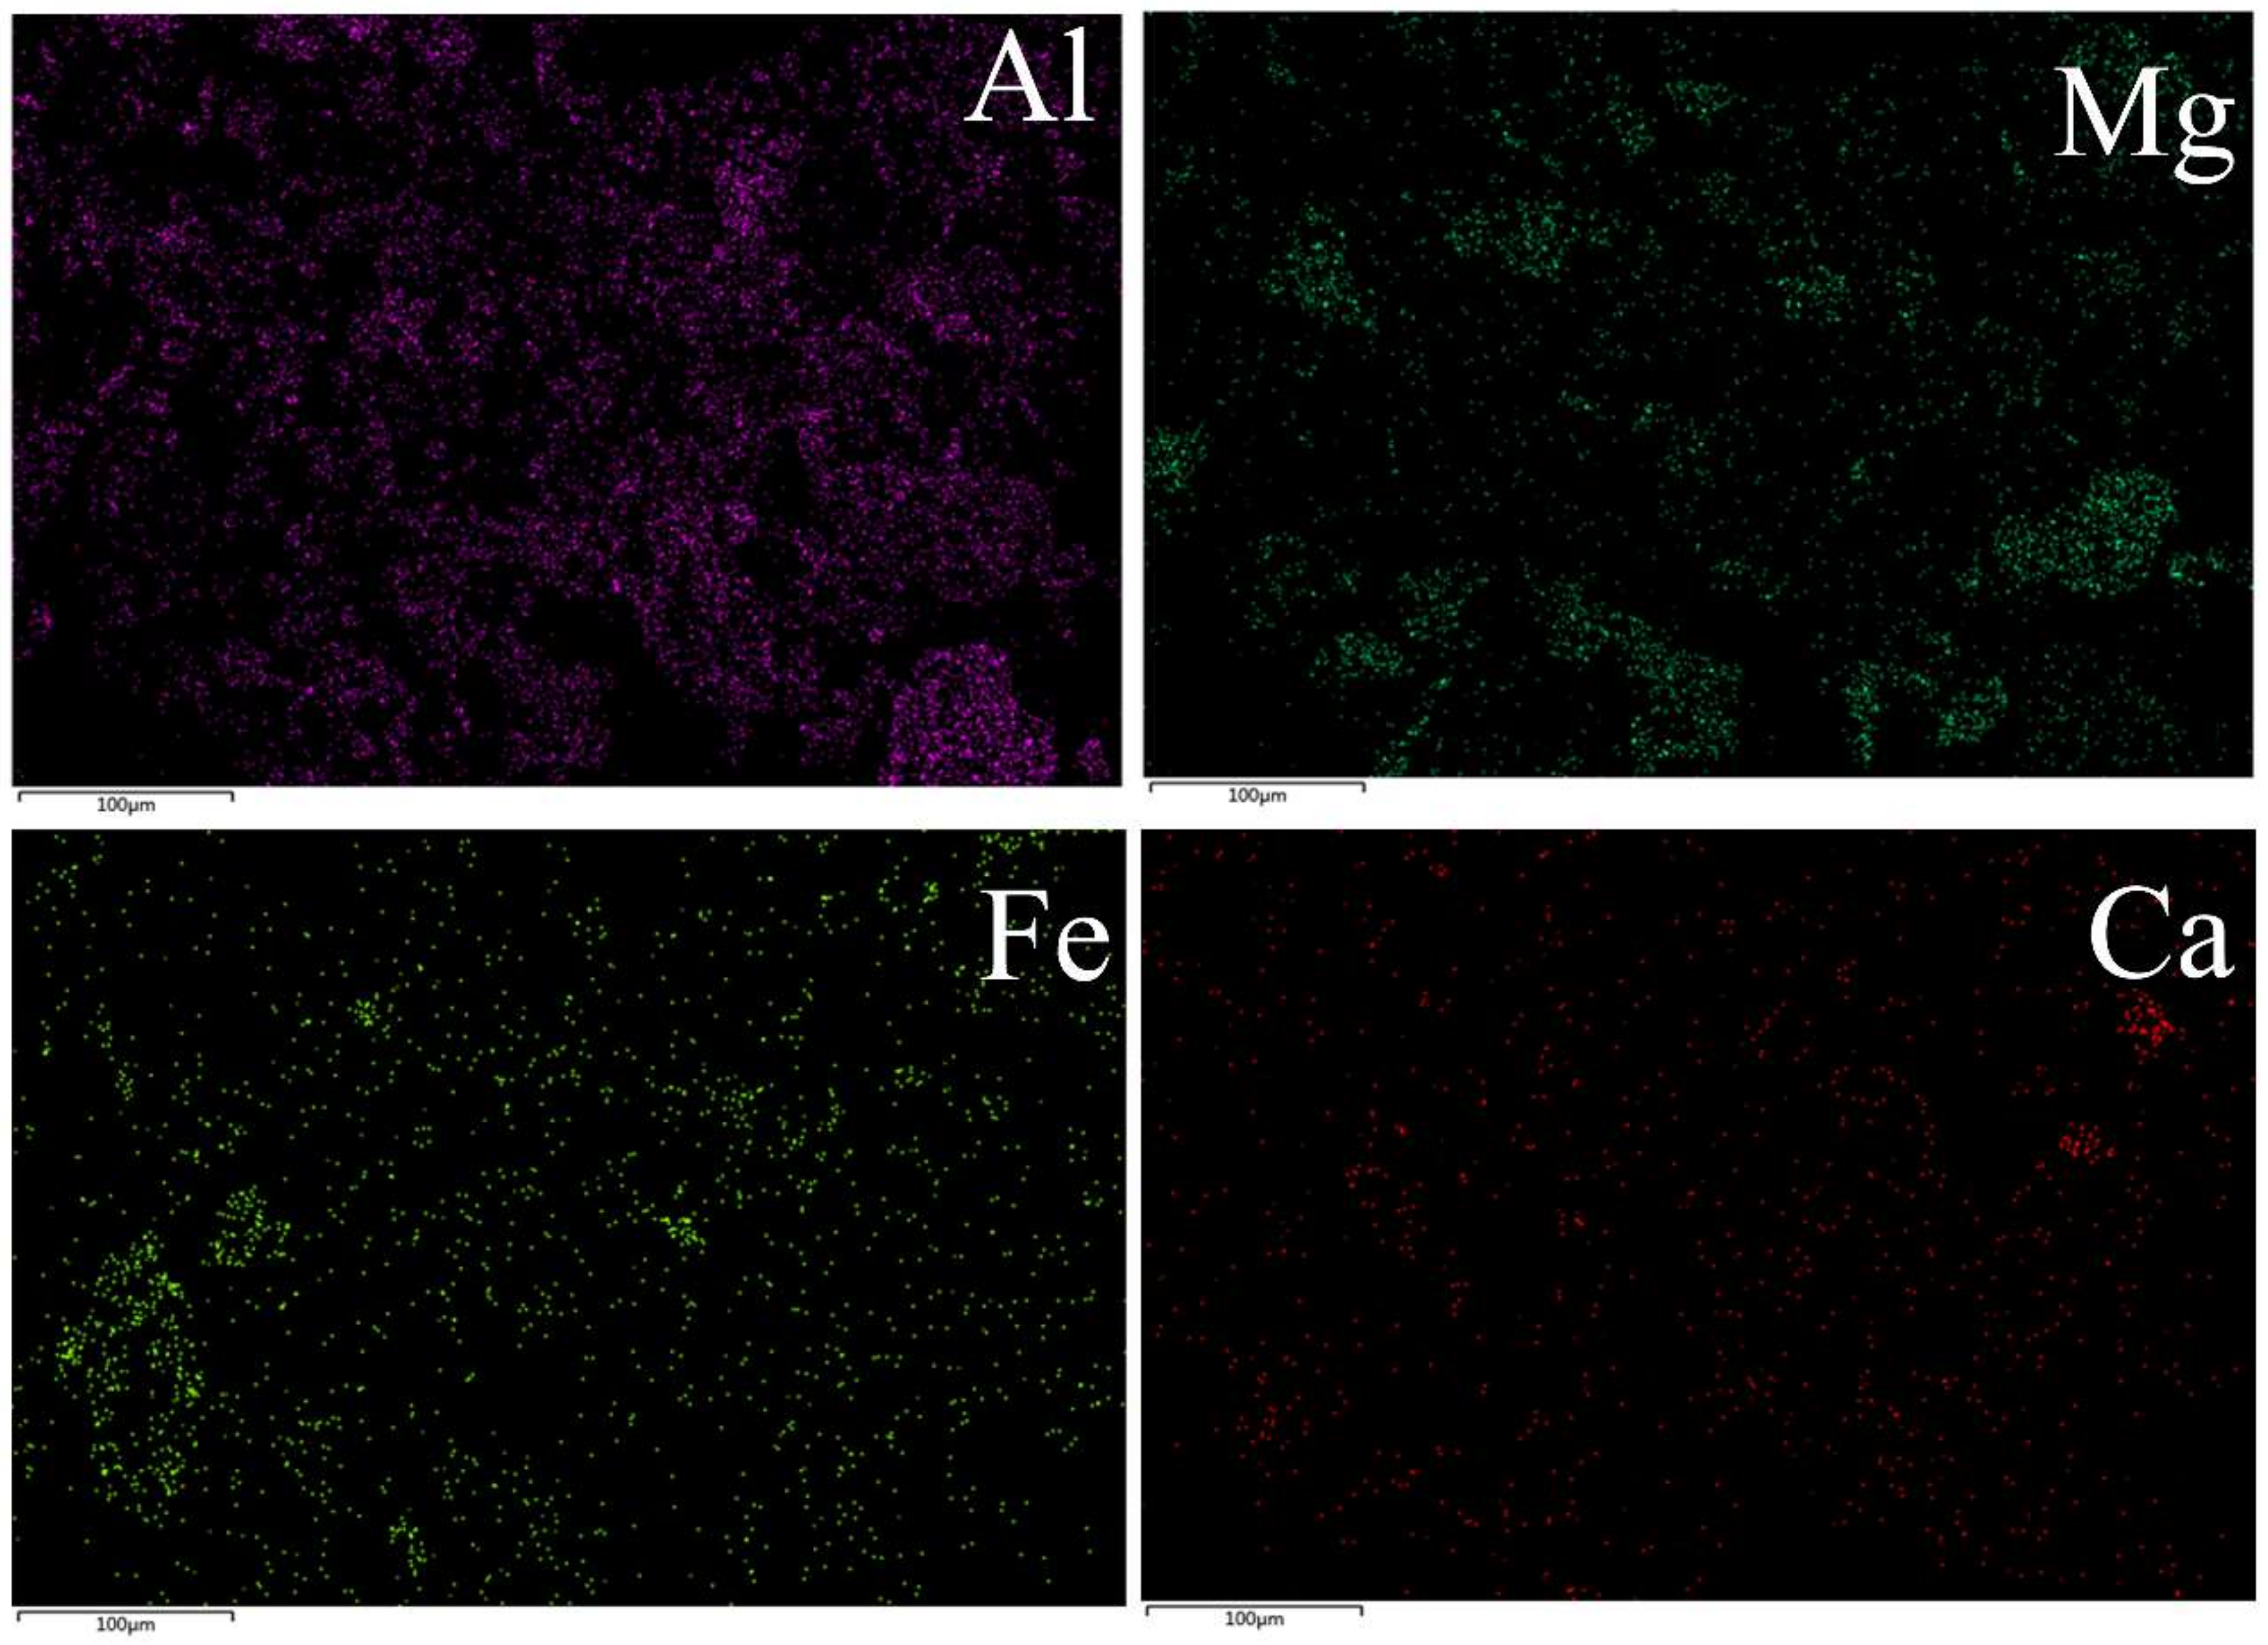
Figure 1, Figure 2 and Figure 3 illustrate the XRD, SEM, and EDS surface scan analyses, respectively. As can be seen from Figure 1, the copper minerals in the flotation tailings, mainly chalcocite, malachite, and chrysocolla, were not detected because the copper grade was too low. However, the gangue minerals quartz and biotite were detected. From Figure 2 and Figure 3, the content and distribution of the main elements of the flotation tailings can be clearly observed, and it can be seen that the copper elements were uniformly distributed.
Table 1 presents the results of the copper phase analysis. The total Cu grade of the flotation tailings, which have a high proportion of copper oxide, was 0.91%. The proportion of copper oxide was 93.41%. However, the proportion of combination oxide copper is 64.84%, resulting in extremely difficult recovery. In summary, the refractory copper oxide proportion of the flotation tailings is high, meaning that conventional flotation cannot recycle copper minerals thoroughly. Instead, the flotation tailings are extracted using concentrated sulfuric acid under high temperature conditions [13,14].
2.2. Methods
Each leaching test was carried out on 30 g of flotation tailings and involved several steps. First, the water bath pan was heated to a predetermined temperature. Then, a slurry with a liquid/solid ratio of 2:1 was poured into the beaker, which was placed in the water bath. Next, a certain amount of concentrated sulfuric acid was added to the leaching mixture beaker and stirred in with a stirring speed of 700 rpm. After a desired length of time, the temperature was decreased to room temperature. Finally, the mixture was filtered, dried, and weighed. The leached residue was collected and its components were obtained through the chemical element method.
In the experiment, the three main condition variables (factors) that affect the leaching process (amount of concentrated sulfuric acid, leaching temperature, and leaching time) were selected based on the CCD module design. The experiments were later analyzed using the response surface methodology [15,16].
2.3. Experimental Design
The three parameters at five levels were considered to be independent variables in the investigation. The central values (zero level) chosen for the design include the following: concentrated sulfuric acid at 60 kg/t, leaching temperature at 70 °C, and leaching time of 4 h. These three key parameters and their level settings are shown in Table 2. Table 3 summarizes the 20 test results that were used to evaluate the response variables (leaching efficiency). The three independent variables that optimize leaching efficiency in Table 2 are expressed by Equation (1):
where Xi is the dimensionless code value of each independent variable, λi is the corresponding actual value, λ0 is the value of λi at the central point, and ∆xi is the step chance value. The test results are based on the CCD module, as defined in Equation (2):
where y is the response-predicted value, β0 is a constant coefficient, βi, βii, and βij are the coefficients of linearity, the quadratic term, and interaction, respectively, and k is the number of factors. The experimental data and response surface were analyzed using Design-Expert software (version 10) (Stat-Ease, Inc, Minneapolis, MN, America). The optimal leaching conditions were predicted using the software data and graphical optimization tools [17].
2.4. Evaluation Methods
3. Results and Discussions
3.1. Response Analysis and Interpretation
Based on the sequential model sum of squares, the highest order polynomial was selected as the experimental model. This model is significant and not aliased. In the experiment, the quadratic model was selected using the software. Table 4 summarizes the analysis of variance (ANOVA) results for this model. The stability of the model is high.
The correlation coefficient R2 was used to evaluate the accuracy and variability of the model. In Table 4, the correlation coefficient R2 is 0.97, indicating that the independent variable has a 97% chance of explaining the change in leaching efficiency. The model F-value is 34.19, which indicated that the model is reliable and only has a 0.01% probability of chance occurrence, which resulted from noise, as listed in Table 4. “Prob > F” has a value of less than 0.0001, indicating that the model terms are significant. The variables that influence leaching efficiency are the linear terms for the amount of concentrated sulfuric acid (λ1), quadratic term of the amount of concentrated sulfuric acid (λ12), and the linear terms for leaching temperature (λ2), followed by the linear terms for leaching time (λ3) [20].
The amount of concentrated sulfuric acid used significantly influences the leaching efficiency. “Adeq precision” measures the signal-to-noise ratio, and a ratio that is greater than four is desirable. In this case, the ratio was 21.205, indicating an adequate signal. The predicted model is described in the following equation in terms of coded values:
y = 82.02 + 7.43X1 + 2.05X2 + 1.78X3 − 1.50X1X2 + 0.18X1X3 + 0.006X2X3 − 3.33X12 − 1.07X22 + 0.19X32
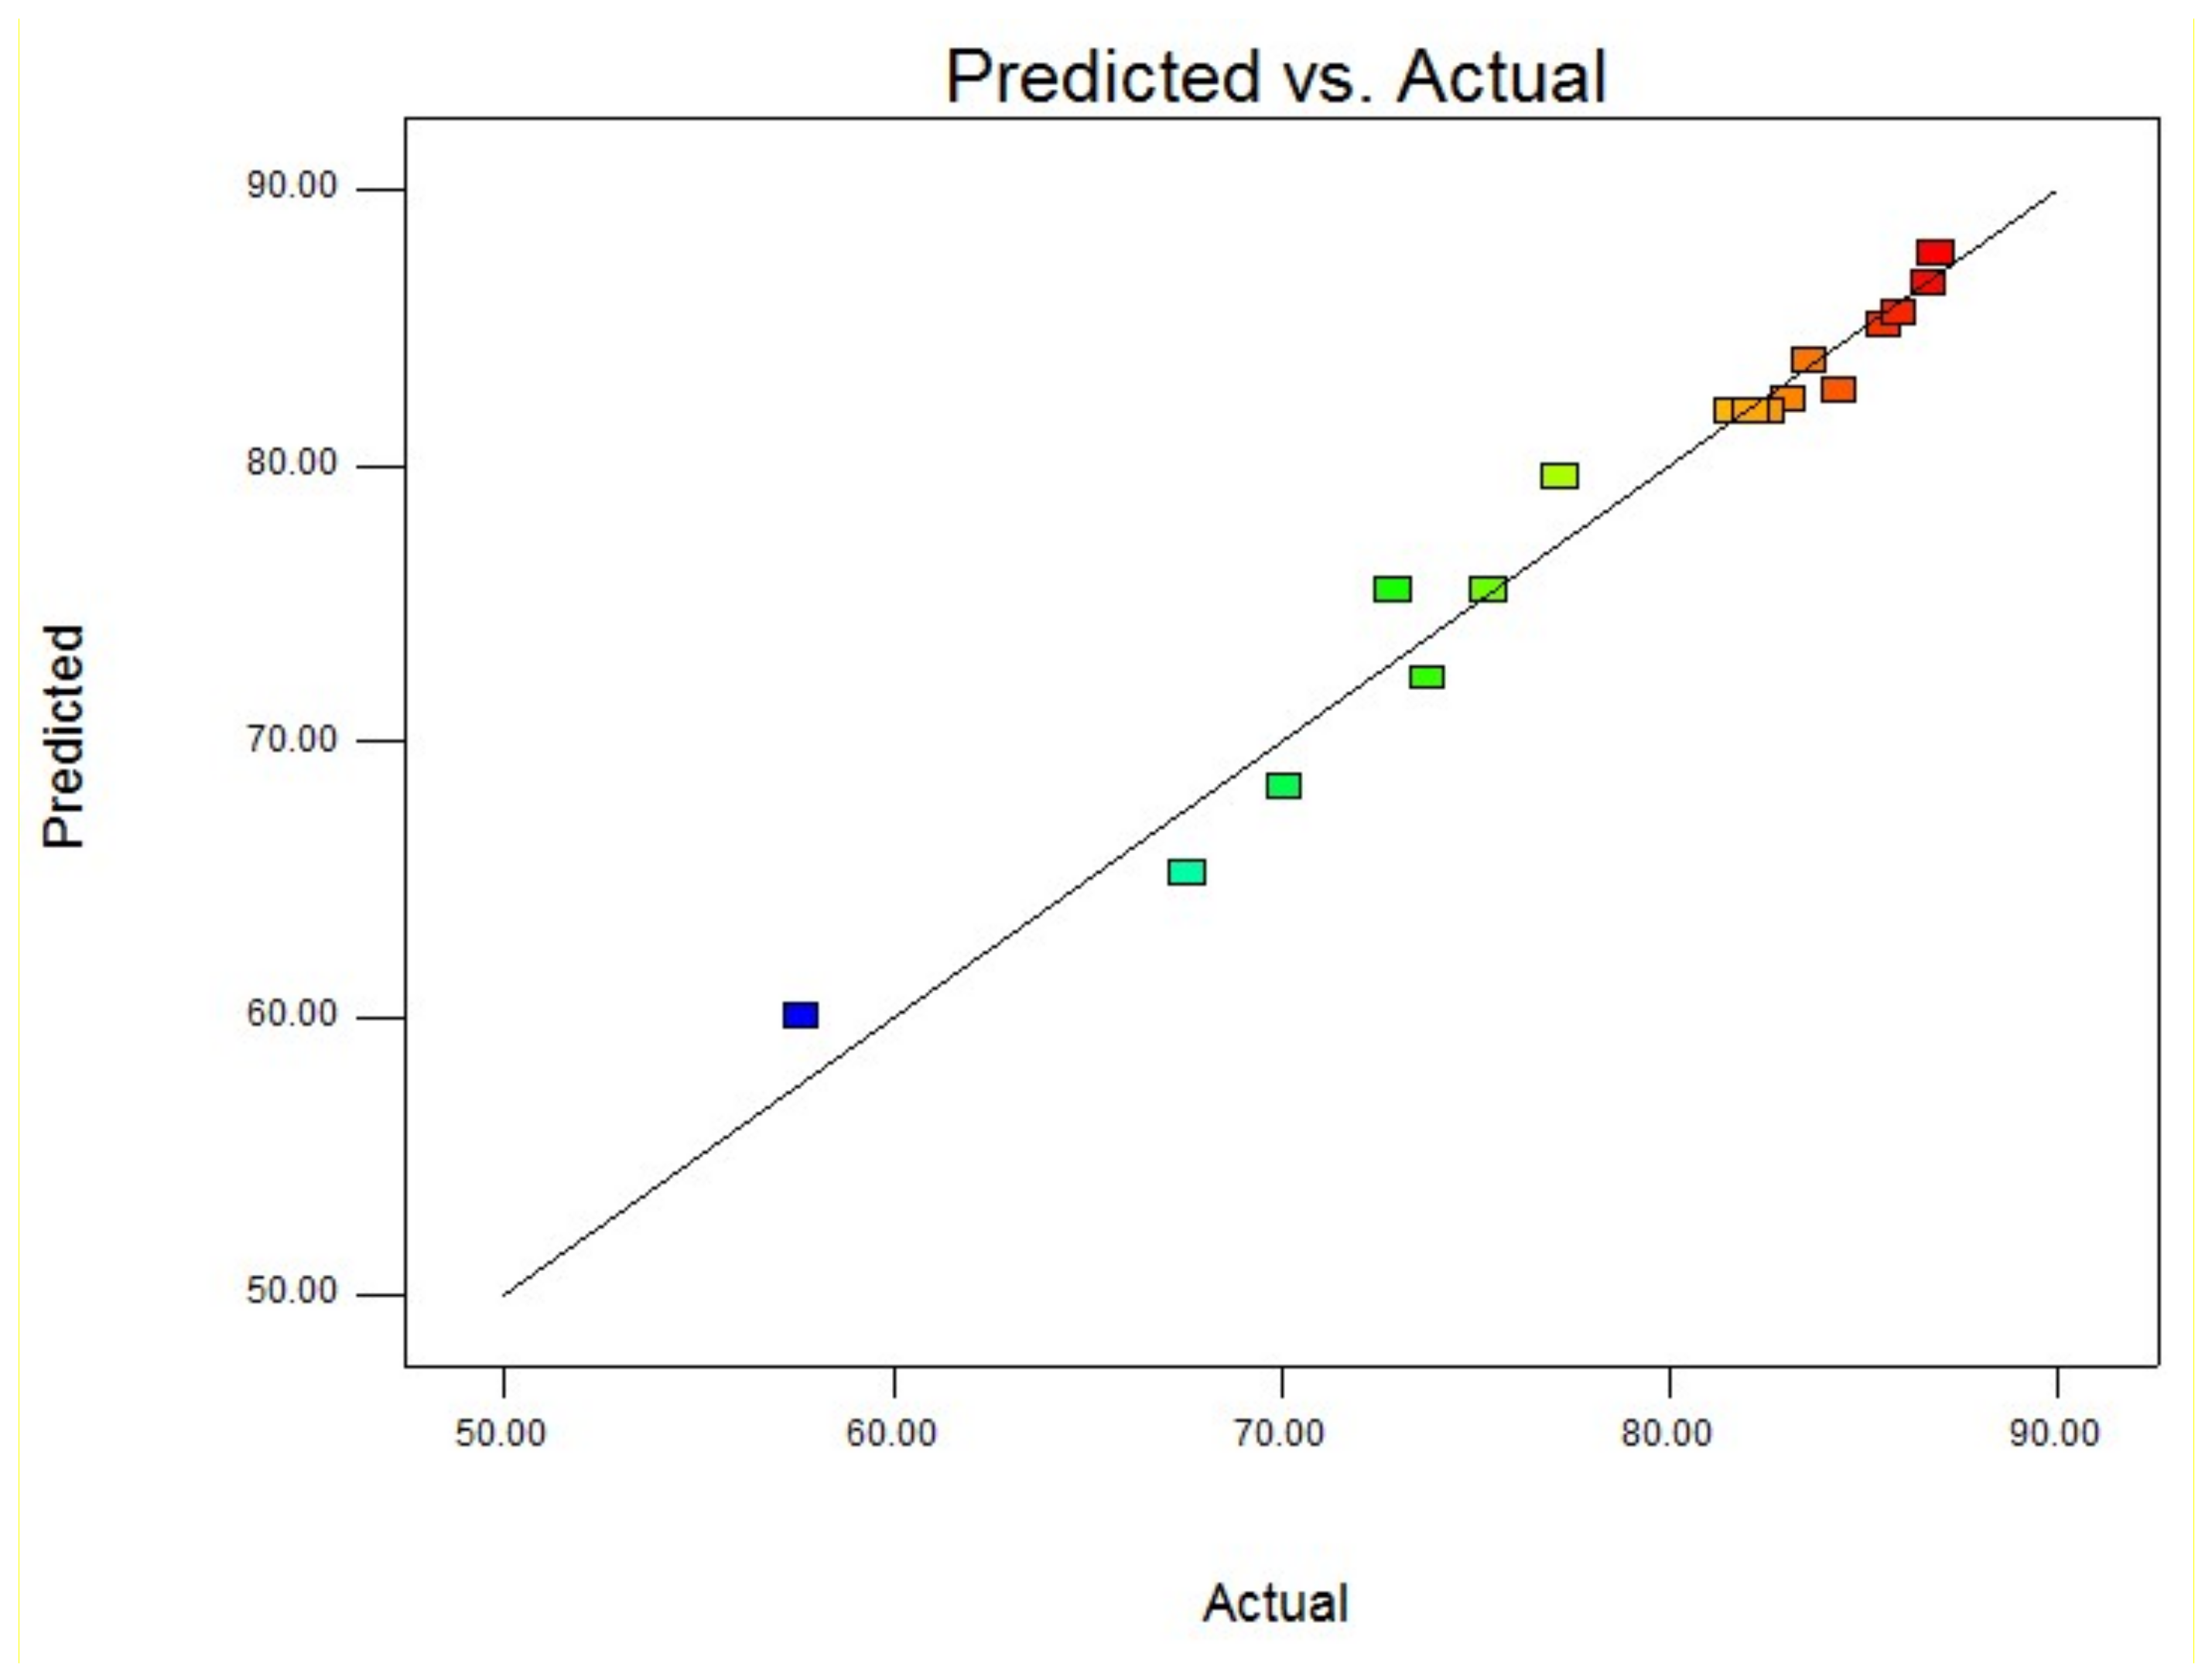
In Equation (4), the R2 value is 0.97, which is close to 1, indicating that the actual leaching efficiency is consistent with the predicted leaching efficiency. Figure 4 demonstrates the relationship between the predicted and actual leaching efficiencies. The fact that the predicted value is closer to the actual value implies that Equation 4 is accurate.
3.2. Relevant Chemical Reactions in the Leaching Process
According to the process mineralogy analysis of flotation tailings, the mineral species in the flotation tailings were mainly chalcocite, malachite, chrysocolla, quartz, biotite, and potassium feldspar. Only malachite and chrysocolla can react with sulfuric acid as follows:
Malachite CuCO3·Cu (OH)2 + 2H2SO4 = 2CuSO4 + CO2↑+ 3H2O
Chrysocolla CuSiO3·2H2O+ H2SO4 = CuSO4 + H2SiO3 + 2 H2O
3.3. Interactions among Key Parameters
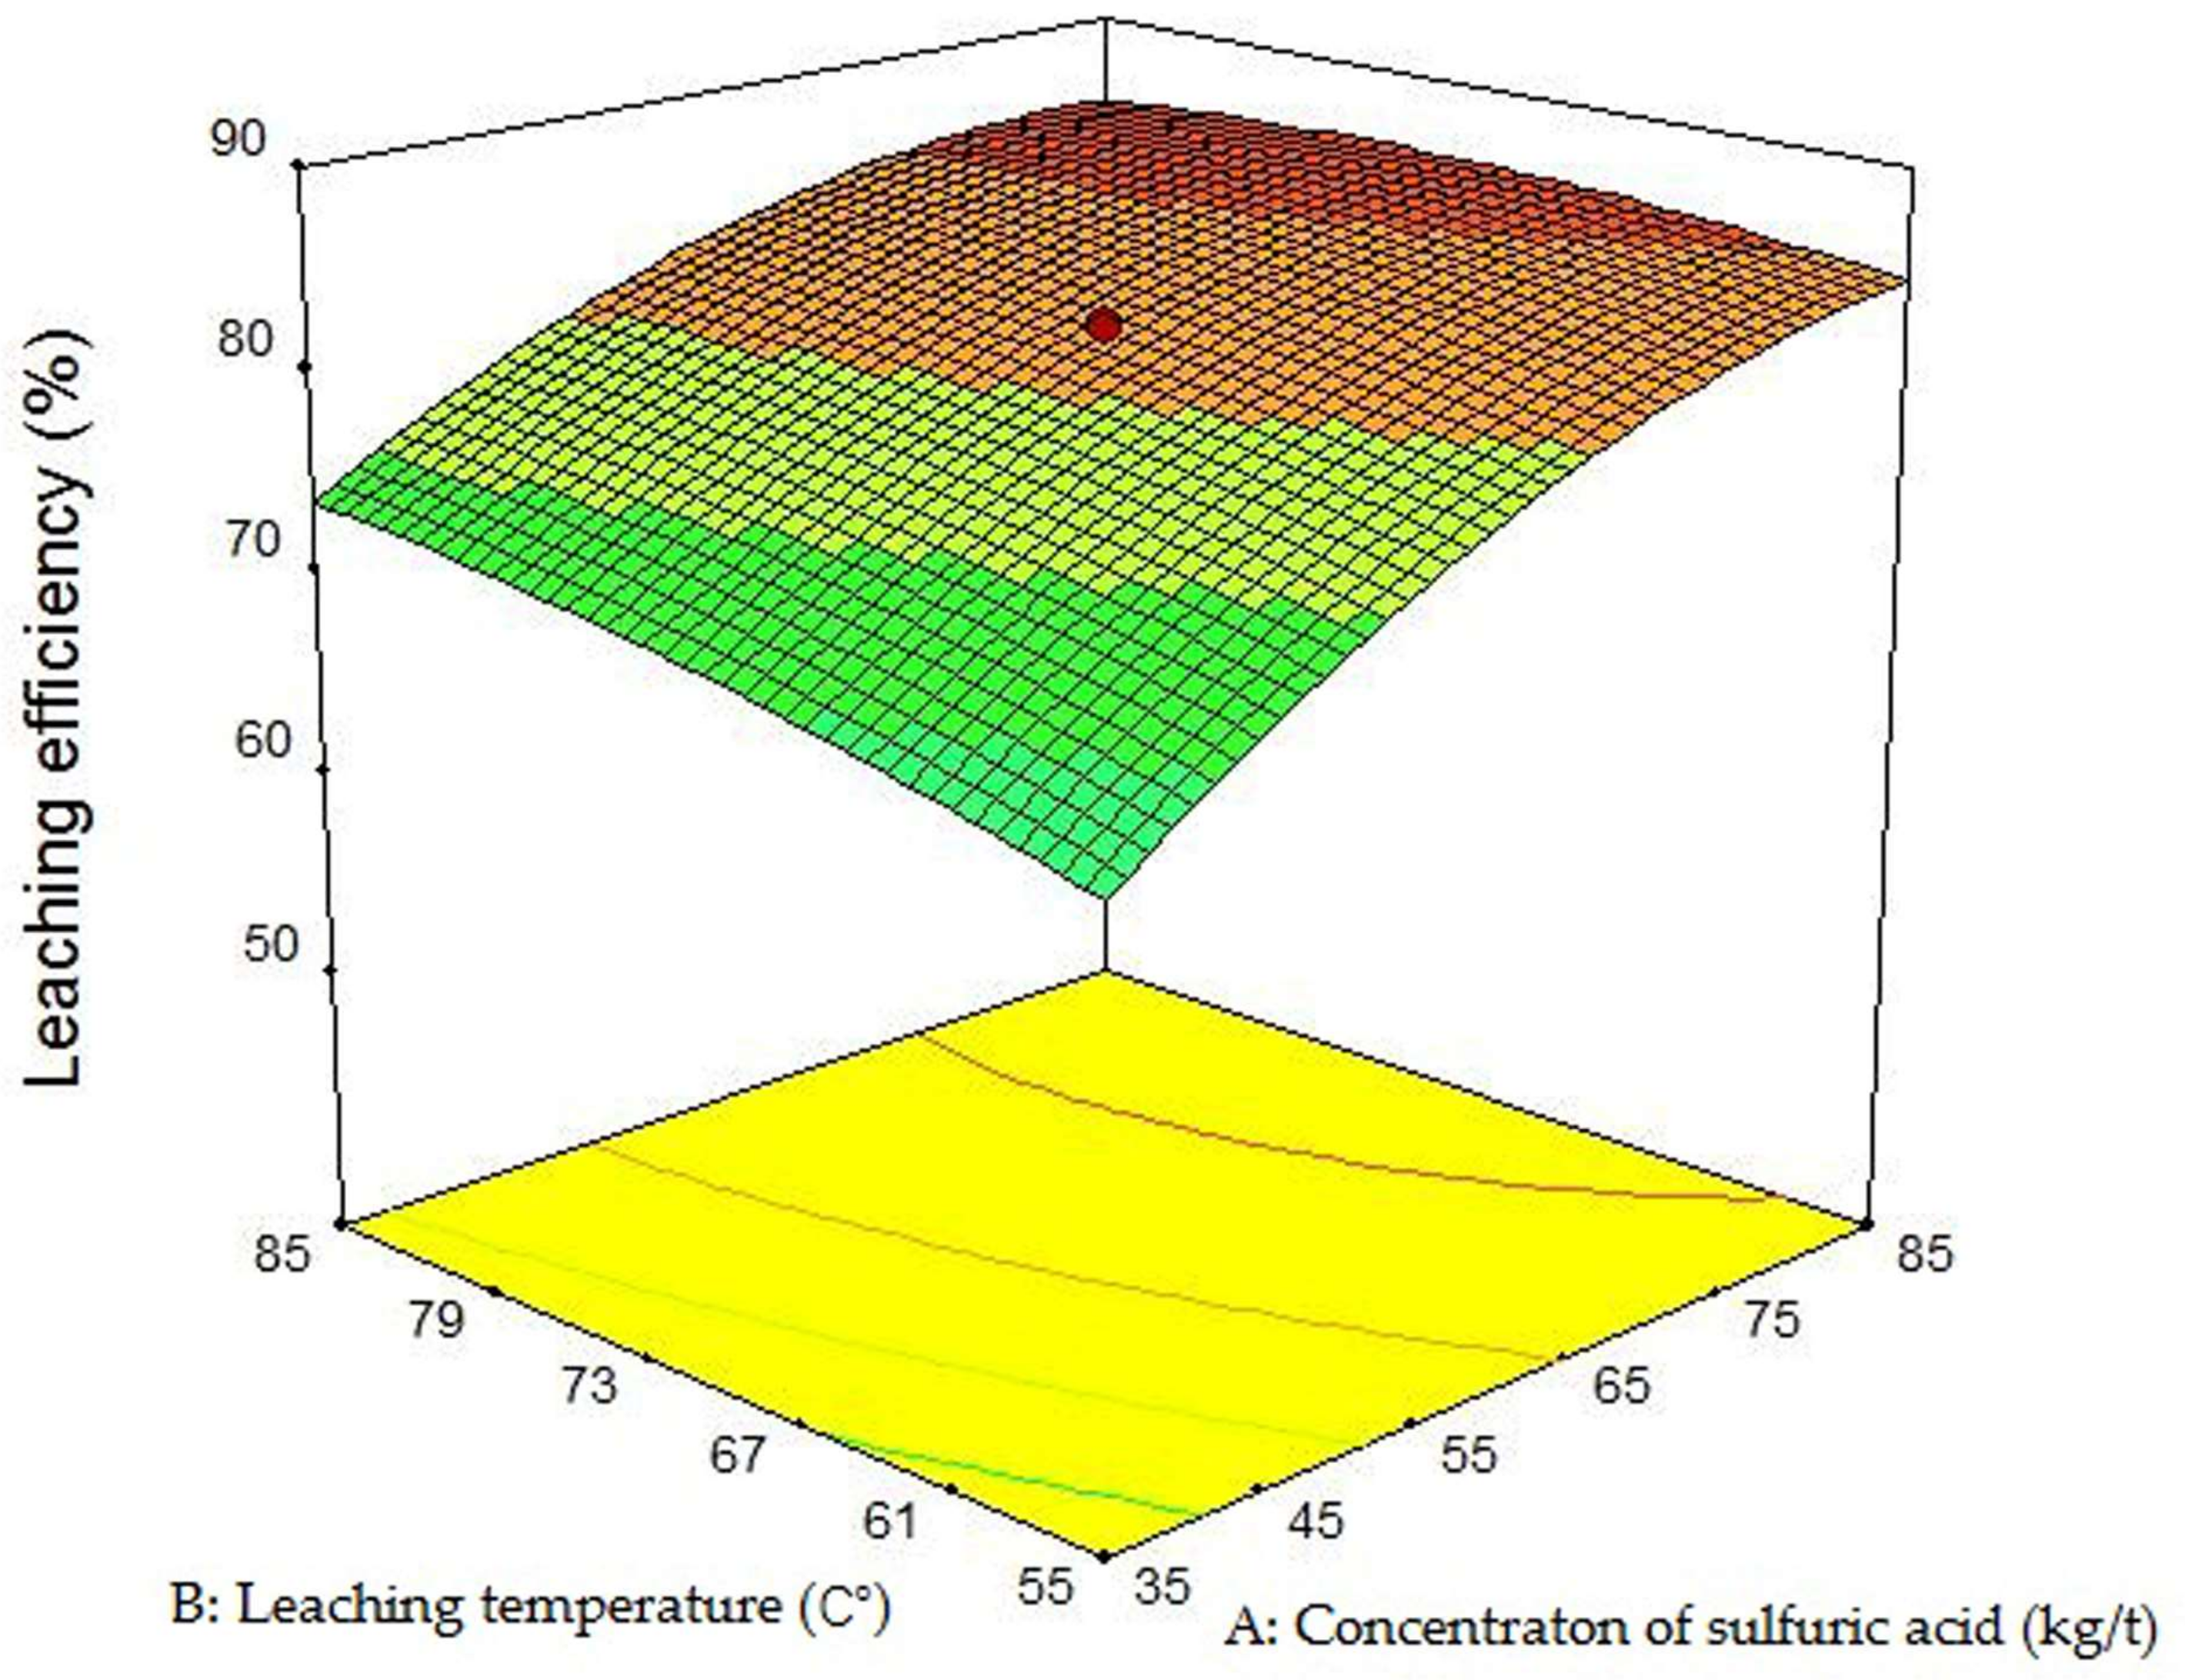
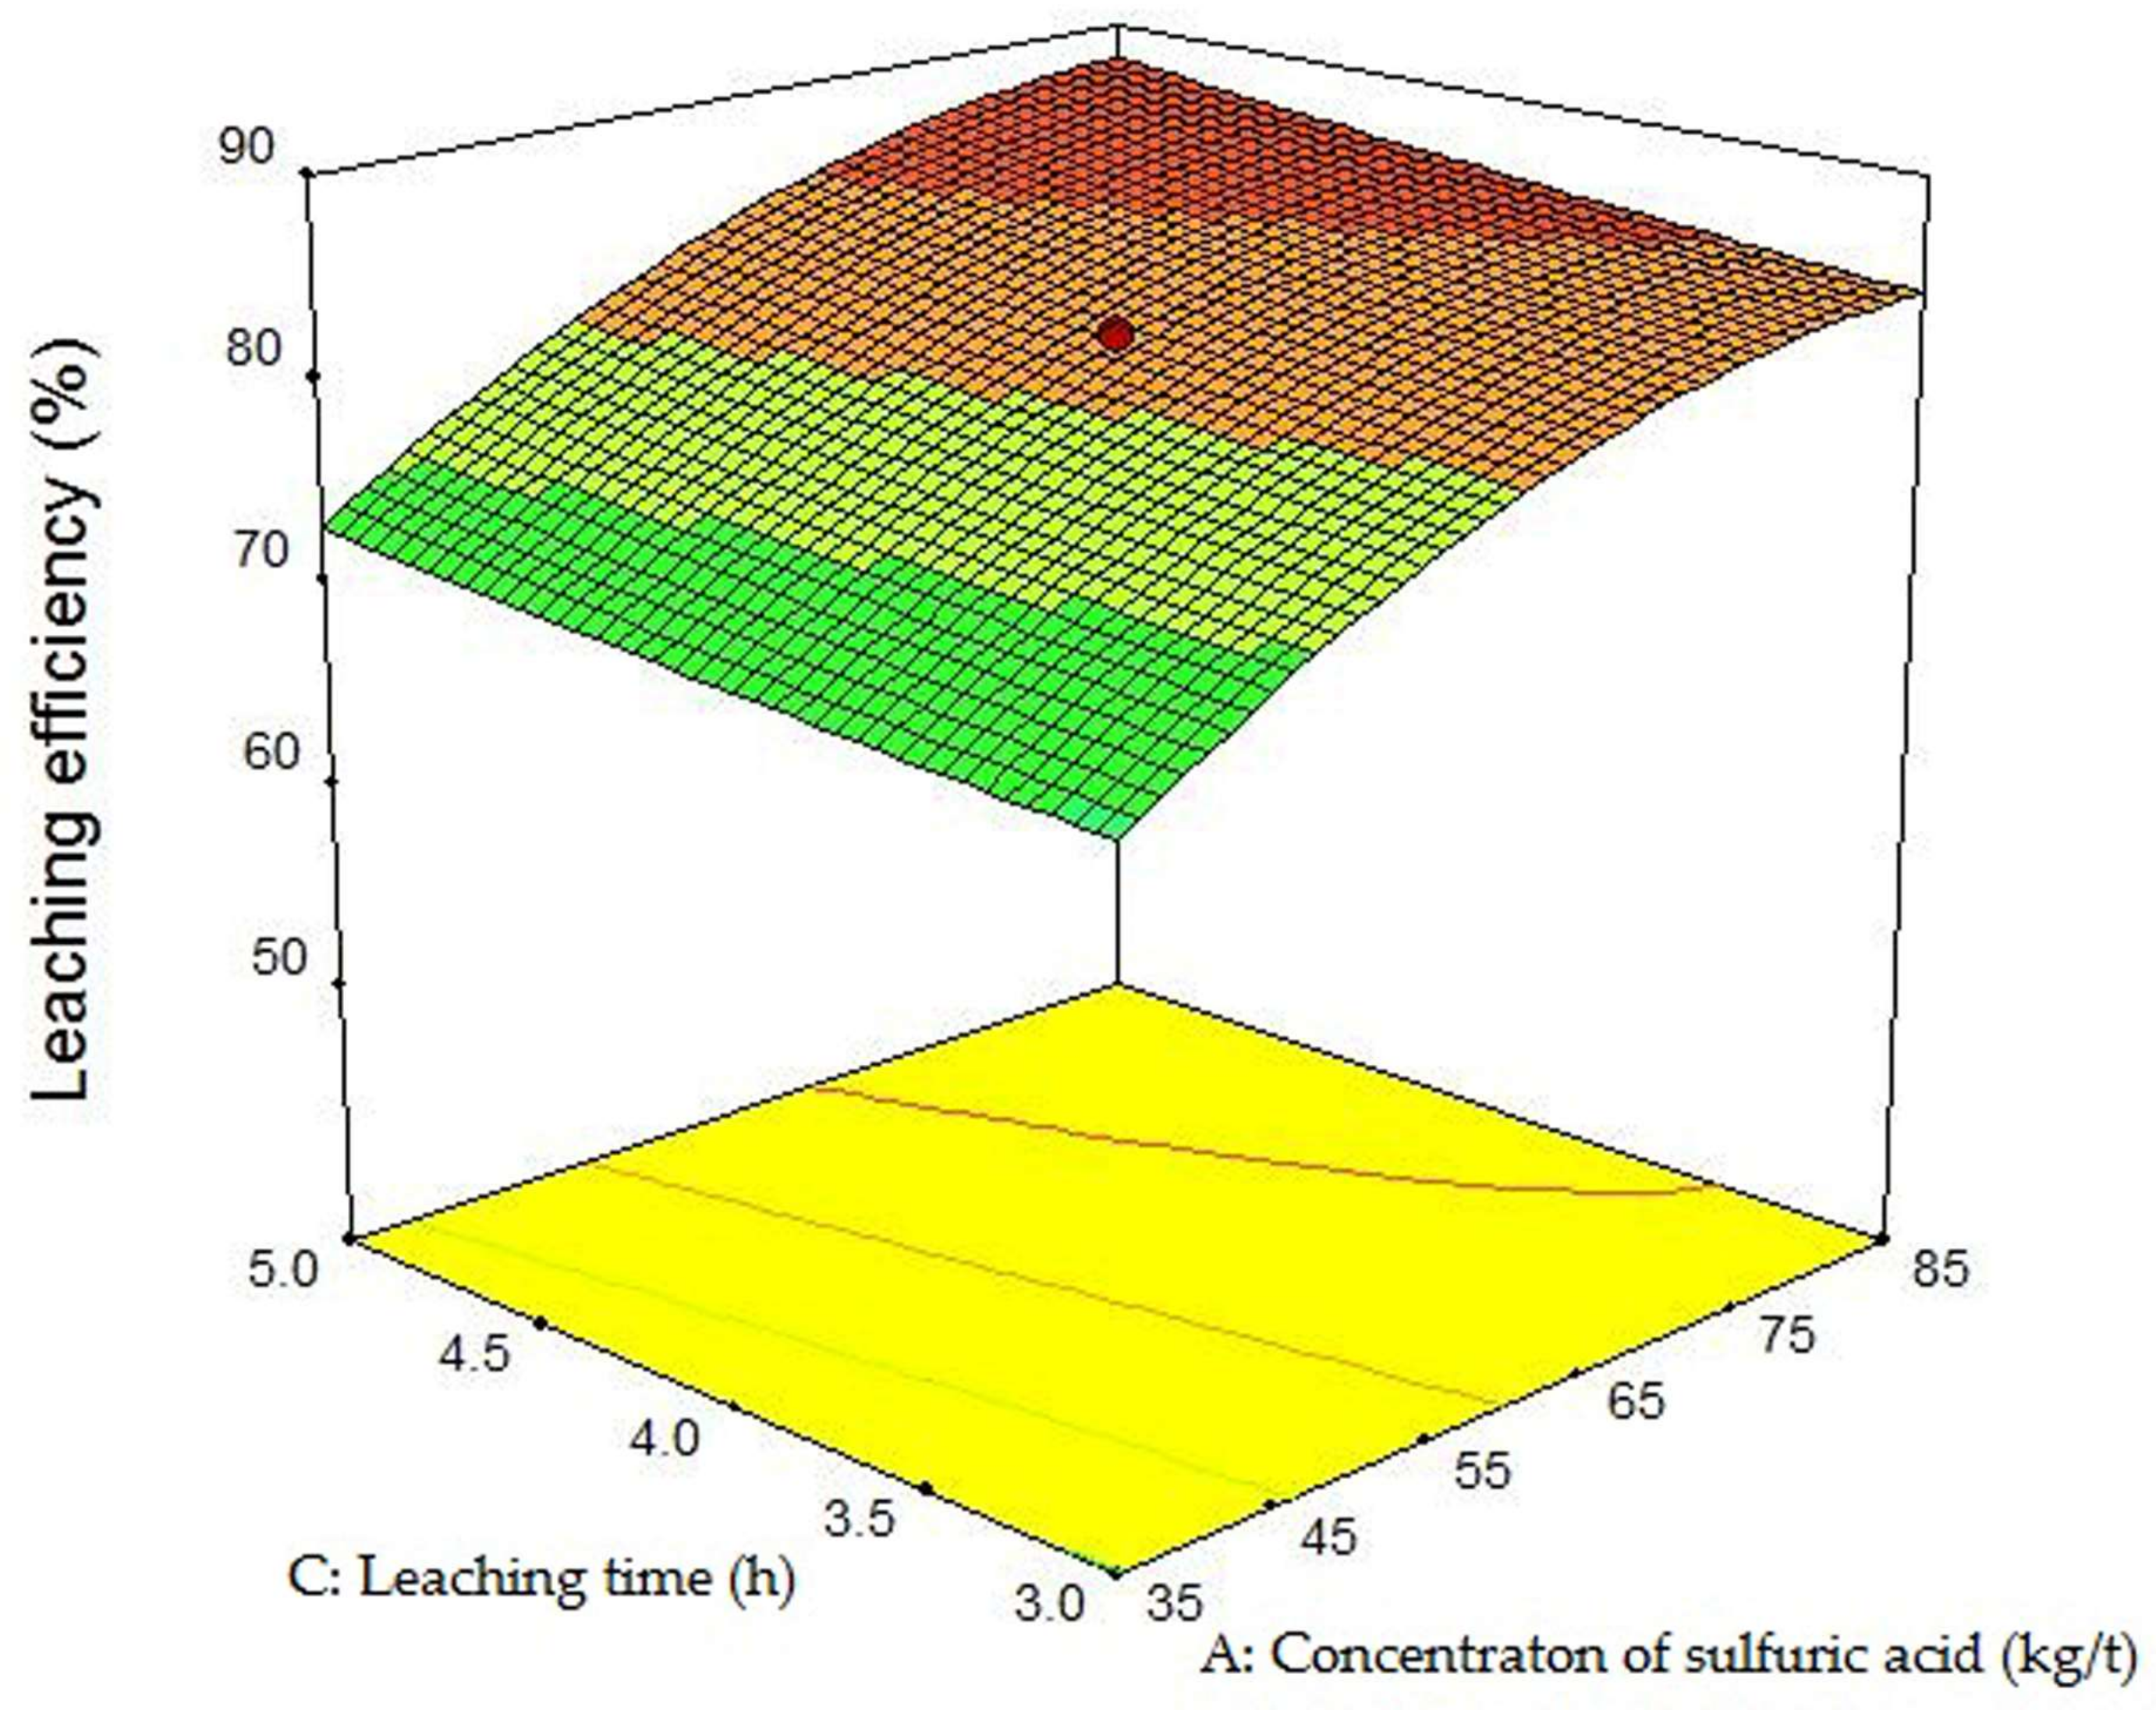
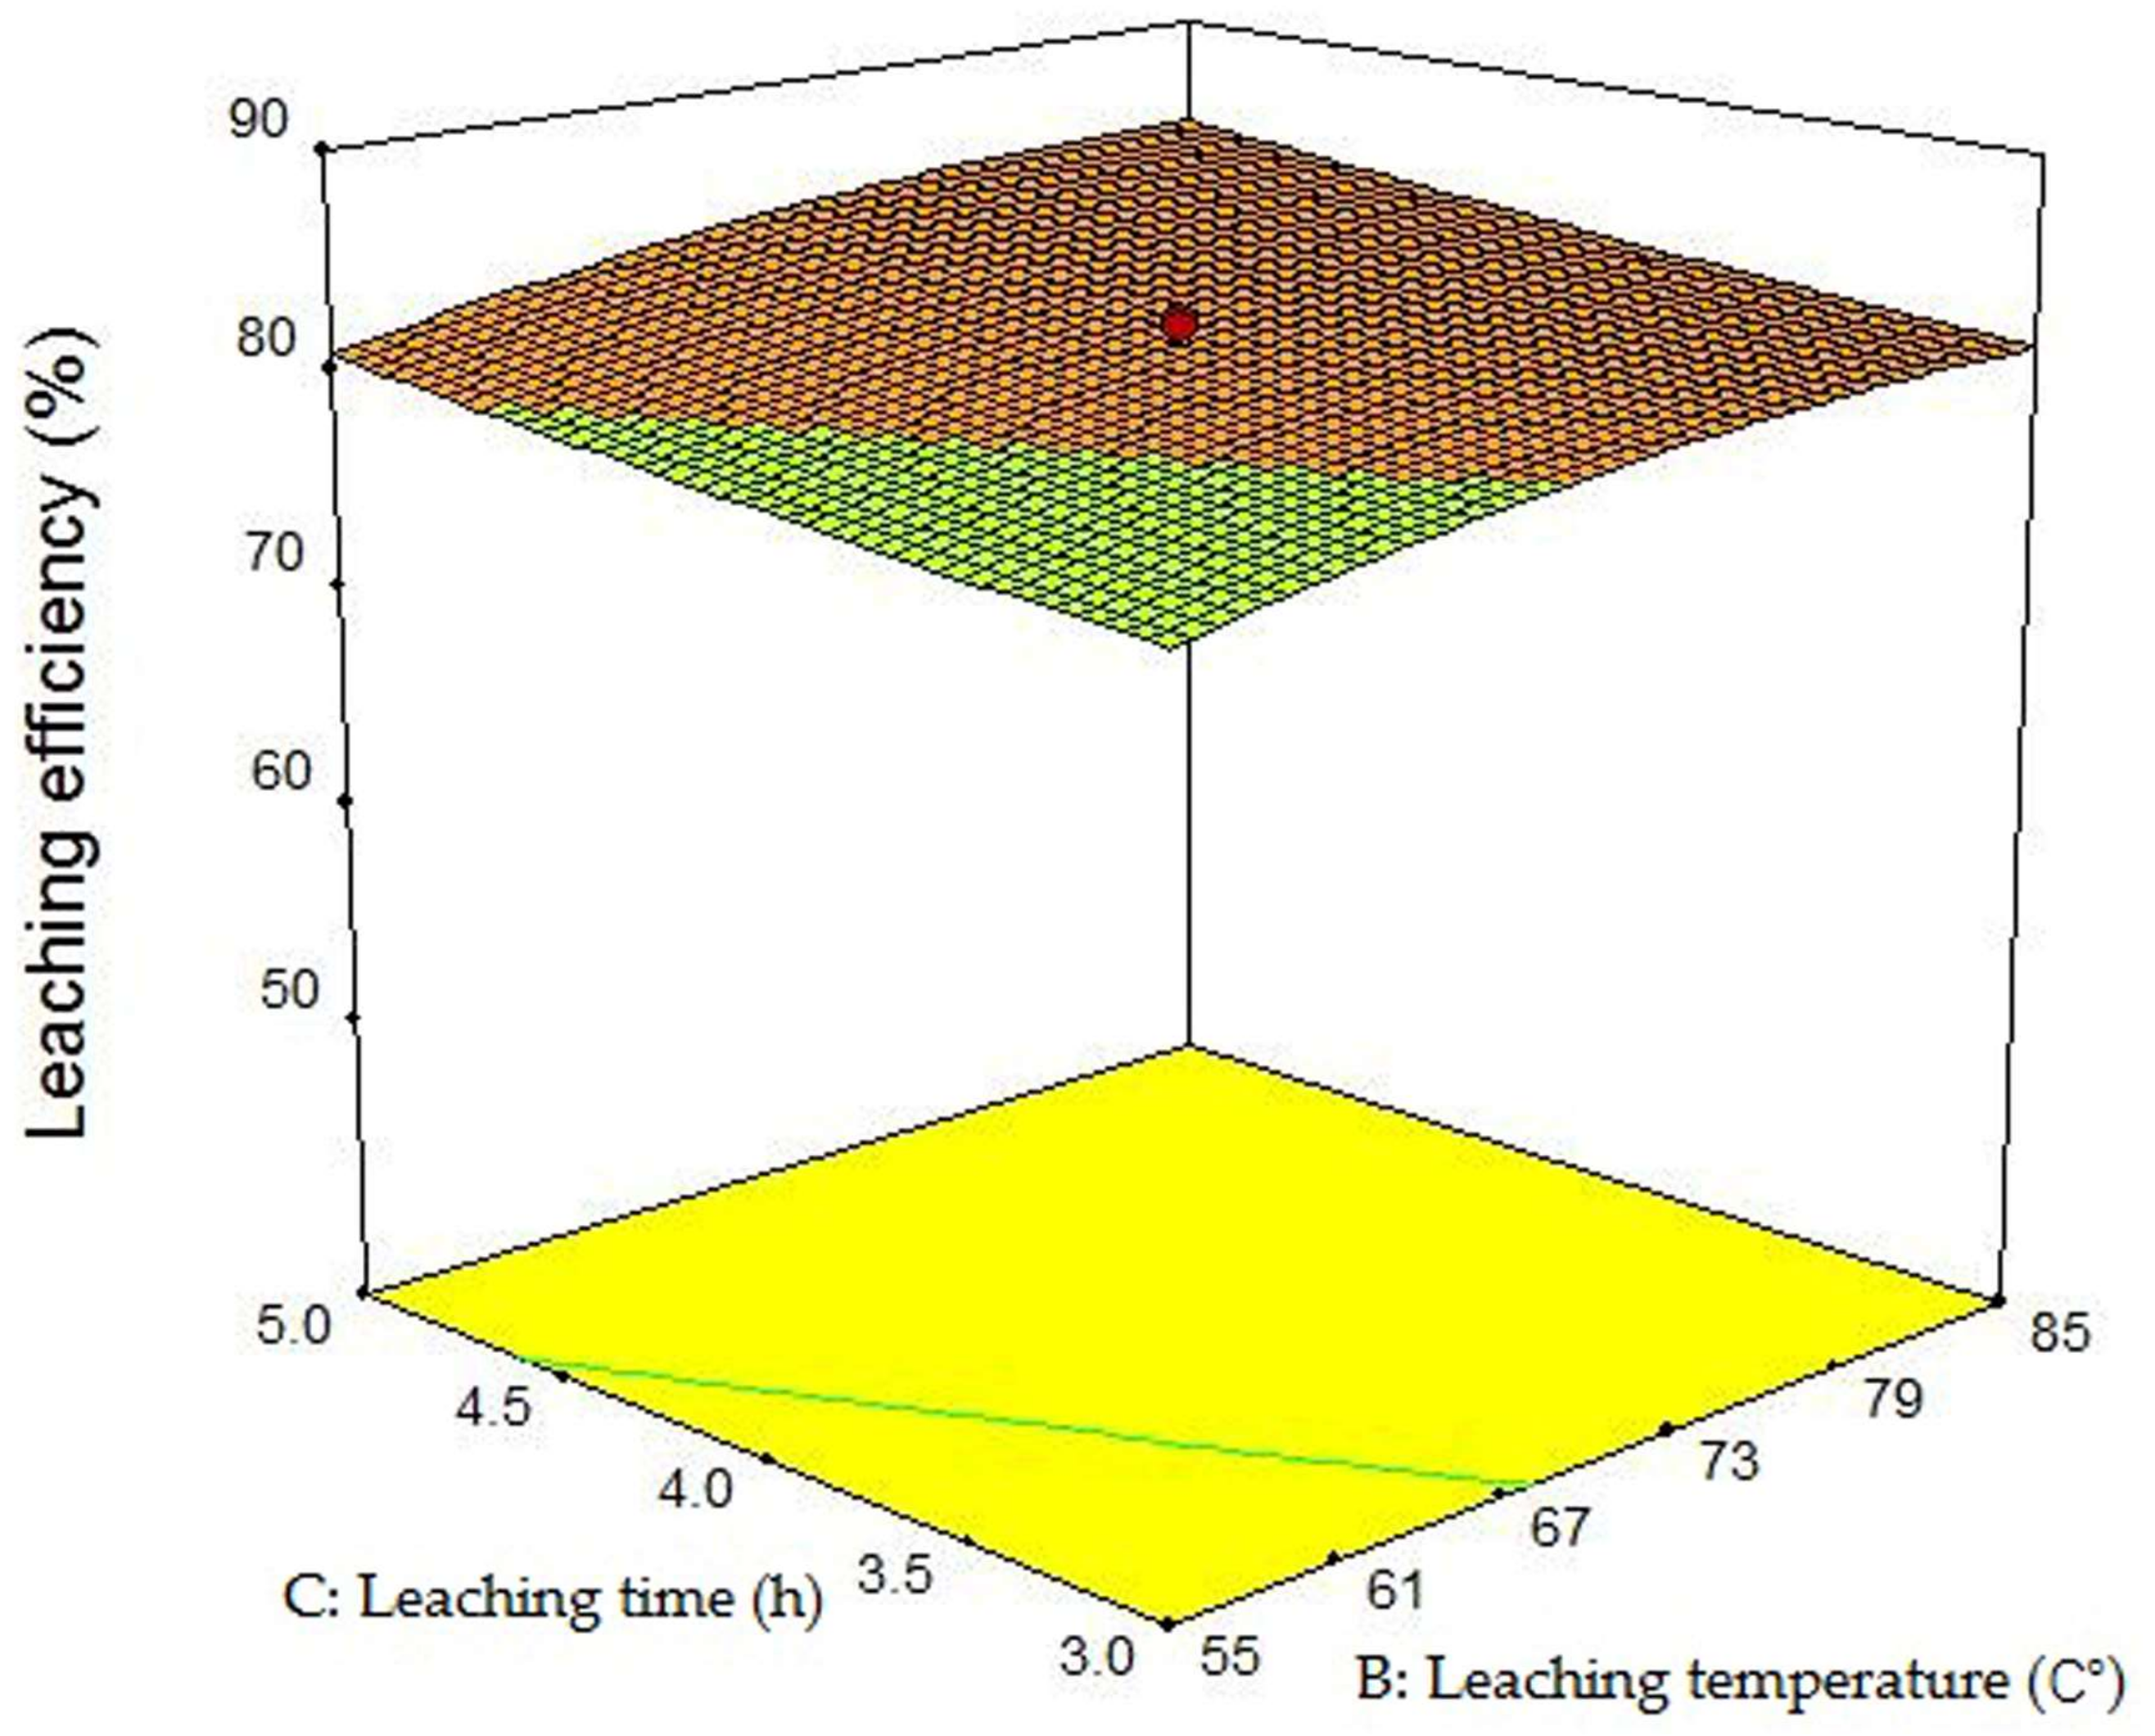
Figure 5, Figure 6 and Figure 7 show the effects of the three variables on leaching efficiency using a 3D response surface methodology under the optimal leaching condition and complex interaction between the two condition variables.
Figure 5 shows that the leaching efficiency increases from 57.66% to 85.50% when the concentrated sulfuric acid is increased from 17.96 kg/t to 102.04 kg/t for a leaching time of 4 h (zero level). Leaching temperature has no significant effect on the leaching efficiency at the concentrations of sulfuric acid considered. If the amount of concentrated sulfuric acid reaches a specific range, then leaching will occur at a favorable rate even if the leaching temperature is not excessively high.
In Figure 6, if the leaching temperature is 70 °C (zero level), as the amount of concentrated sulfuric acid increases, the leaching efficiency grows rapidly before eventually stabilizing. Changes in the leaching time have a minimal effect on leaching efficiency compared to changes in the amount of concentrated sulfuric acid, indicating that the reaction is mainly due to the reaction of sulfuric acid and copper oxide minerals. The high temperature destroys the structure of gangue minerals to induce a chemical reaction between sulfuric acid and copper oxide minerals. The leaching efficiency remains unchanged when the reaction is complete [23].
Figure 7 illustrates that the influences of leaching temperature and time on leaching efficiency are insignificant when the amount of concentrated sulfuric acid is 60 kg/t (zero level). However, the two factors are essential to the reaction because when the temperature is low, the gangue minerals that surround the copper oxide cannot be destroyed, and copper oxide cannot react with sulfuric acid. Reducing the leaching temperature and time can save energy and reduce the negative environmental impacts of the leaching process.
3.4. Process Optimization and Analysis of Leaching Residue
Response surface software gives several different leaching solutions, which can then be compared by their economic costs. If the leaching temperature is higher and the leaching time is longer, the heating cost is greater. The economic cost of heating is greater than the cost of the concentrated sulfuric acid consumed in the reaction. Therefore, the most efficient solution for deceasing the economic costs is to increase the amount of concentrated sulfuric acid and reduce both the leaching temperature and leaching time.
Table 5 summarizes the optimum leaching conditions. In the optimum leaching condition, the actual leaching efficiency reaches 85.86% and the predicted leaching efficiency is 86.79%. Furthermore, the actual measured value is consistent with the model prediction.
Table 6 shows the results of the chemical element analysis conducted after leaching. It found that, after leaching, the Cu grade was reduced from 0.91% to 0.125%, but the grades of Al2O3 and SiO2 were almost unchanged. This indicates that the reaction primarily is between copper and concentrated sulfuric acid.
Figure 1 and Figure 8 show the results of the analysis of flotation tailings and the leaching residue under optimum conditions. The figures show that the copper in the flotation tailings was almost completely dissolved into the leaching solution. Copper was not detected in the leach residue, but gangue minerals, such as quartz and mica, were detected.
The flotation tailings and leaching residue obtained under optimum conditions were analyzed by SEM and EDS surface scanning. In Figure 9 and Figure 10, the flotation tailings and leaching residue copper grades are 1.5% and 0% (actual grade is 0.125%), respectively. A comparison between Cu, Si, and Al, and other close symbioses, indicates an uneven distribution of elements before leaching. The leaching residues are more unconsolidated, the element distribution is further dispersed, and the contents of Si, Al, and other elements are nearly unchanged after leaching, indicating that the quartz and biotite minerals do not react with sulfuric acid. In addition, the Cu grade decreased. This implies that a chemical reaction occurs between sulfuric acid and Cu. Analysis of the elements found in the image suggests that the gangue minerals wrapped around the copper oxide minerals are destroyed, and that sulfuric acid enters the flotation tailings along the cracks and chemically reacts with the copper oxide minerals under high temperature and sulfuric acid conditions. The reaction is complete and the leaching effect is improved, allowing for a more effective utilization of resources. Table 5 shows the predicted and actual leaching efficiencies under optimal conditions.
5. Conclusions
Our analysis results allow us to draw the following conclusions:
- The main copper oxide minerals in flotation tailings are malachite and chrysocolla, and the main gangue minerals, quartz and biotite, are wrapped around the copper oxide minerals. They are symbiotic with each other. The proportion of copper oxide is relatively high (93.41%). Moreover, the proportion of refractory copper oxide is 64.84%, which causes handling difficulties.
- The results of the response surface methodology show that the amount of concentrated sulfuric acid and the leaching temperature are both significant factors affecting the leaching efficiency of flotation tailings. High temperatures can destroy the gangue mineral structure and cause the sulfuric acid to react with copper oxide. Therefore, a large amount of concentrated sulfuric acid is required to obtain a high leaching efficiency.
- Optimal leaching conditions are as follows: the amount of concentrated sulfuric acid is 85 kg/t, the leaching temperature is 68.51 °C, and the leaching time is 4.36 h. This combination leads to an actual leaching efficiency of 85.86% (the predicted leaching efficiency is 86.79%). The actual measured value is consistent with the model prediction. We successfully used the response surface methodology to minimize the sulfuric acid concentration and heating costs, save energy, and reduce the negative environmental impacts of the technology.
- We assessed the leaching processes using SEM and EDS surface scan analyses. These analyses visually observe the content and distribution of the main element, allowing us to develop effective methods for treating low-grade oxide ores.
Acknowledgments
This research project has been supported by National Natural Science Foundation of China (Grant No. 51464029 and 51704135), and Analysis and Testing Foundation of Kunming University of Science and Technology (Grant No. 2017P20161101009).
Author Contributions
Shuming Wen, Jian Liu and Xu Bai conceived the project and designed the experiments; Xu Bai conducted a part of experiments and analyzed the data. Yilin Lin performed a part of experiments. All authors participated in writing the manuscript.
Conflicts of Interest
The authors declare no conflicts of interest.
References
- Feng, Q.C.; Zhao, W.J.; Wen, S.M.; Cao, Q.B. Activation mechanism of lead ions in cassiterite flotation with salicylhydroxamic acid as collector. Sep. Purif. Technol. 2017, 178, 193–199. [Google Scholar] [CrossRef]
- Feng, Q.C.; Zhao, W.J.; Wen, S.M. Surface modification of malachite with ethanediamine and its effect on sulfidization flotation. Appl. Surf. Sci. 2018, 436, 823–831. [Google Scholar] [CrossRef]
- Feng, Q.C.; Wen, S.M.; Deng, J.S.; Zhao, W.J. Combined DFT and XPS investigation of enhanced adsorption of sulfide species onto cerussite by surface modification with chloride. Appl. Surf. Sci. 2017, 425, 8–15. [Google Scholar] [CrossRef]
- Rucker, D.F.; Zaebst, R.J.; Gillis, J.; Cain, C., IV; Teague, B. Drawing down the remaining copper inventory in a leach pad by way of subsurface leaching. Hydrometallurgy 2017, 169, 382–392. [Google Scholar] [CrossRef]
- Han, J.W.; Xiao, J.; Qin, W.Q.; Chen, D.X.; Liu, W. Copper Recovery from Yulong Complex Copper Oxide Ore by Flotation and Magnetic Separation. JOM 2017, 69, 1563–1569. [Google Scholar] [CrossRef]
- Deng, D.; Xu, L.H.; Tian, J.; Hu, Y.H.; Han, Y.X. Flotation and Adsorption of a New Polysaccharide Depressant on Pyrite and Talc in the Presence of a Pre-Adsorbed Xanthate Collector. Minerals 2017, 7, 40. [Google Scholar] [CrossRef]
- Haghighi, H.K.; Moradkhani, D.; Sedaghat, B.; Najafabadi, M.R.; Behnamfard, A. Production of copper cathode from oxidized copper ores by acidic leaching and two-step precipitation followed by electrowinning. Hydrometallurgy 2013, 133, 111–117. [Google Scholar] [CrossRef]
- Turan, M.; Arslanoglu, H.; Altundogan, H.S. Optimization of the leaching conditions of chalcopyrite concentrate using ammonium persulfate in an autoclave system. J. Taiwan Inst. Chem. Eng. 2015, 50, 49–55. [Google Scholar] [CrossRef]
- Mao, Y.B.; Wen, S.M.; Deng, J.S.; Fang, J.J. Response surface modeling and optimization of process parameters for leaching of zinc oxide ore with ammonia and ammonium bicarbonate solutions followed by flotation. Przem. Chem. 2015, 7, 1000–1008. [Google Scholar]
- Awe, S.A.; Khoshkhoo, M.; Kruger, P.; Sandström, Å. Modelling and process optimisation of antimony removal from a complex copper concentrate. Trans. Nonferrous Met. Soc. China 2012, 22, 675–685. [Google Scholar] [CrossRef]
- Kul, M.; Oskay, K.O.; Şimşir, M.; Sübütay, H.; Kirgezen, H. Optimization of selective leaching of Zn from electric arc furnace steelmaking dust using response surface methodology. Trans. Nonferrous Met. Soc. China. 2015, 25, 2753–2762. [Google Scholar] [CrossRef]
- Lambert, A.; Drogui, P.; Daghrir, R.; Zaviska, F.; Benzaazoua, M. Removal of copper in leachate from mining residues using electrochemical technology. J. Environ. Manag. 2014, 133, 78–85. [Google Scholar] [CrossRef] [PubMed]
- Behbahani, M.; Seo, Y. Investigation on haloacetic acid (HAA) degradation by iron powder: Application of response surface methodology. Process Saf. Environ. 2016, 103, 153–162. [Google Scholar] [CrossRef]
- Goh, K.H.; Lim, T.T.; Chui, P.C. Evaluation of the effect of dosage, pH and contact time on high-dose phosphate inhibition for copper corrosion control using response surface methodology (RSM). Corros. Sci. 2008, 50, 918–927. [Google Scholar] [CrossRef]
- Fattahi, A.; Rashchi, F.; Abkhoshk, E. Reductive leaching of zinc, cobalt and manganese from zinc plant residue. Hydrometallurgy 2016, 161, 185–192. [Google Scholar] [CrossRef]
- Helle, S.; Jerez, O.; Kelm, U.; Pincheira, M.; Varela, B. The influence of rock characteristics on acid leach extraction and re-extraction of Cu-oxide and sulfide minerals. Miner. Eng. 2010, 23, 45–50. [Google Scholar] [CrossRef]
- Liu, J.; Wen, S.M.; Liu, D.; Lv, M.Y. Response surface methodology for optimization of copper leaching from a low-grade flotation middling. Miner. Metall. Proc. 2011, 28, 139–145. [Google Scholar]
- Aguirre, C.L.; Toro, N.; Carvajal, N.; Watling, H.; Aguirre, C. Leaching of chalcopyrite (CuFeS2) with an imidazolium-based ionic liquid in the presence of chloride. Miner. Eng. 2016, 99, 60–66. [Google Scholar] [CrossRef]
- Rosales, G.D.; Pinna, E.G.; Suarez, D.S.; Rodriguez, M.H. Recovery Process of Li, Al and Si from Lepidolite by Leaching with HF. Minerals 2017, 7, 36. [Google Scholar] [CrossRef]
- Somasundaram, M.; Saravanathamizhan, R.; Basha, C.A.; Nandakumar, V.; Begum, S.N.; Kannadasan, T. Recovery of copper from scrap printed circuit board: Modelling and optimization using response surface methodology. Powder Technol. 2014, 266, 1–6. [Google Scholar] [CrossRef]
- Shabani, M.A.; Irannajad, M.; Azadmehr, A.R. Investigation on leaching of malachite by citric acid. Int. J. Min. Met. Mater. 2012, 19, 782–786. [Google Scholar] [CrossRef]
- Bingöla, D.; Canbazoğlub, M. Dissolution kinetics of malachite in sulphuric acid. Hydrometallurgy 2004, 72, 159–165. [Google Scholar] [CrossRef]
- Dorfling, C.; Akdogan, G.; Bradshaw, S.M.; Eksteen, J. Modelling of an autoclave used for high pressure sulphuric acid/oxygen leaching of first stage leach residue. Part 1: Model development. Miner. Eng. 2013, 53, 220–227. [Google Scholar] [CrossRef]
Figure 1.
X-ray powder diffraction (XRD) analysis of flotation tailings.

Figure 2.
Scanning electron microscopy (SEM) and energy dispersive spectrometry (EDS) surface scan analyses of flotation tailings.
Figure 2.
Scanning electron microscopy (SEM) and energy dispersive spectrometry (EDS) surface scan analyses of flotation tailings.

Figure 3.
SEM and EDS surface scan analyses of flotation tailings.

Figure 4.
Experimental and predicted leaching efficiency.

Figure 5.
Three-dimensional response surface map of the amount of concentrated sulfuric acid vs. leaching temperature at a leaching time of 4 h.
Figure 5.
Three-dimensional response surface map of the amount of concentrated sulfuric acid vs. leaching temperature at a leaching time of 4 h.

Figure 6.
Three-dimensional response surface map of the amount of concentrated sulfuric acid vs. leaching time at a leaching temperature of 70 °C.
Figure 6.
Three-dimensional response surface map of the amount of concentrated sulfuric acid vs. leaching time at a leaching temperature of 70 °C.

Figure 7.
Three-dimensional response surface map of leaching temperature vs. leaching time at 60 kg/t concentrated sulfuric acid.
Figure 7.
Three-dimensional response surface map of leaching temperature vs. leaching time at 60 kg/t concentrated sulfuric acid.

Figure 8.
XRD analysis of leaching residue under optimal conditions.

Figure 9.
SEM and EDS surface scan analyses of leaching residue under optimal conditions.

Figure 10.
SEM and EDS surface scan analyses of leaching residue under optimal conditions.


Table 1.
Analysis results of copper phase in the flotation tailings (%).
| Name | Free Oxide Copper | Combination Oxide Copper | Sulfides and Others | Total Copper |
|---|---|---|---|---|
| Content | 0.26 | 0.59 | 0.06 | 0.91 |
| Proportion | 28.57 | 64.84 | 6.59 | 100 |
Table 2.
Variables in the experimental design.
| Symbols | Levels and Rangs | ||||||
|---|---|---|---|---|---|---|---|
| Independent variables | Uncoded | Coded | −1.682 | −1 | 0 | 1 | +1.682 |
| Sulfuric concentration, kg/t | λ1 | X1 | 17.96 | 35 | 60 | 85 | 102.04 |
| Leaching temperature, °C | λ2 | X2 | 44.77 | 55 | 70 | 85 | 95.23 |
| Leaching time, h | λ3 | X3 | 2.32 | 3 | 4 | 5 | 5.68 |
Table 3.
Central composite design arrangement and results.
| Variables | ||||
|---|---|---|---|---|
| Experimental Runs | Concentrated Sulfuric Acid, kg/t | Leaching Temperature, °C | Leaching Time, h | Leaching Efficiency, % |
| 1 | 60 | 70 | 4 | 82.20 |
| 2 | 35 | 55 | 5 | 70.09 |
| 3 | 60 | 70 | 5.68 | 85.89 |
| 4 | 60 | 70 | 4 | 81.73 |
| 5 | 60 | 70 | 2.32 | 77.17 |
| 6 | 17.96 | 70 | 4 | 57.66 |
| 7 | 85 | 85 | 5 | 86.85 |
| 8 | 35 | 55 | 3 | 67.58 |
| 9 | 60 | 70 | 4 | 82.53 |
| 10 | 60 | 70 | 4 | 82.26 |
| 11 | 60 | 95.23 | 4 | 83.05 |
| 12 | 35 | 85 | 5 | 75.34 |
| 13 | 60 | 70 | 4 | 82.11 |
| 14 | 35 | 85 | 3 | 73.77 |
| 15 | 102.04 | 70 | 4 | 85.50 |
| 16 | 85 | 85 | 3 | 83.58 |
| 17 | 85 | 55 | 3 | 84.37 |
| 18 | 60 | 44.77 | 4 | 72.88 |
| 19 | 85 | 55 | 5 | 86.65 |
| 20 | 60 | 70 | 4 | 81.65 |
Table 4.
Analysis of Variance (ANOVA) of the response surface quadratic model.
| Source | Sum of Squares | Degree of Freedom | Mean Square | F-Value | p-Values Prob > F |
|---|---|---|---|---|---|
| Model | 1045.91 | 9 | 116.21 | 34.19 | <0.0001 |
| λ1 | 754.23 | 1 | 754.23 | 221.87 | <0.0001 |
| λ2 | 57.22 | 1 | 57.22 | 16.83 | 0.0021 |
| λ3 | 43.22 | 1 | 43.22 | 12.71 | 0.0051 |
| λ1λ2 | 18.09 | 1 | 18.09 | 5.32 | 0.0437 |
| λ1λ3 | 0.27 | 1 | 0.27 | 0.08 | 0.7838 |
| λ2λ3 | 0.00 | 1 | 0.00 | 0.00 | 0.9925 |
| λ12 | 159.83 | 1 | 159.83 | 47.02 | <0.0001 |
| λ22 | 16.59 | 1 | 16.59 | 4.88 | 0.0517 |
| λ32 | 0.51 | 1 | 0.51 | 0.15 | 0.7074 |
| Residual | 33.99 | 10 | 3.40 | - | - |
| Pure Error | 0.56 | 5 | 0.11 | - | - |
R2 = 0.97, Radj2 = 0.94, Adeq Precision = 21.205 > 4.
Table 5.
Comparison of predicted and actual leaching efficiencies under optimal conditions.
| Sulfuric Concentration, λ1, kg/t | Leaching Temperature, λ, °C | Leaching time, λ3, h | Leaching Efficiency, % | |
|---|---|---|---|---|
| Predicted | Experimental | |||
| 85 | 68.51 | 4.36 | 86.79 | 85.86 |
Table 6.
Results of the chemical element analyses of flotation tailings and leach residue under optimal conditions (%).
Table 6.
Results of the chemical element analyses of flotation tailings and leach residue under optimal conditions (%).
| Name | Cu | Fe | CaO | MgO | Al2O3 | S | SiO2 |
|---|---|---|---|---|---|---|---|
| Flotation tailings | 0.91 | 4.34 | 0.62 | 5.62 | 14.62 | 0.035 | 58.46 |
| Leach residue | 0.125 | 3.87 | 0.70 | 5.41 | 14.49 | 0.035 | 61.01 |
© 2018 by the authors. Licensee MDPI, Basel, Switzerland. This article is an open access article distributed under the terms and conditions of the Creative Commons Attribution (CC BY) license (http://creativecommons.org/licenses/by/4.0/).
Share and Cite
MDPI and ACS Style
Bai, X.; Wen, S.; Liu, J.; Lin, Y. Response Surface Methodology for Optimization of Copper Leaching from Refractory Flotation Tailings. Minerals 2018, 8, 165. https://0-doi-org.brum.beds.ac.uk/10.3390/min8040165
AMA Style
Bai X, Wen S, Liu J, Lin Y. Response Surface Methodology for Optimization of Copper Leaching from Refractory Flotation Tailings. Minerals. 2018; 8(4):165. https://0-doi-org.brum.beds.ac.uk/10.3390/min8040165
Chicago/Turabian StyleBai, Xu, Shuming Wen, Jian Liu, and Yilin Lin. 2018. "Response Surface Methodology for Optimization of Copper Leaching from Refractory Flotation Tailings" Minerals 8, no. 4: 165. https://0-doi-org.brum.beds.ac.uk/10.3390/min8040165
Note that from the first issue of 2016, this journal uses article numbers instead of page numbers. See further details here.