Strain-Induced Graphitization Mechanism of Coal-Based Graphite from Lutang, Hunan Province, China


College of Geoscience and Surveying Engineering, China University of Mining and Technology, Beijing 100083, China
*
Author to whom correspondence should be addressed.
Minerals 2019, 9(10), 617; https://0-doi-org.brum.beds.ac.uk/10.3390/min9100617
Submission received: 3 September 2019
/
Revised: 30 September 2019
/
Accepted: 6 October 2019
/
Published: 8 October 2019
(This article belongs to the Section Mineral Deposits)
Abstract
:Anthracite and coal-based graphite (CBG) samples were collected at varying distances from a granite intrusion. Optical microscopy, X-ray diffraction, Raman spectroscopy, and high-resolution transmission electron microscopy (HRTEM) were used to characterize the structural evolution of CBG at different scales. The results indicated differences in the graphitization rates of coal macerals and crystallization degree of different graphite-like particles. Differentiated graphitization of coal was caused by deformation, which led to the discontinuous distribution of CBG. This indicates that samples located at the same distance from the intrusion were graphitized to different degrees or that CBG with a similar graphitization degree occurred at varying distances from the intrusion. A possible mechanism for graphitization is strain-induced graphitization, where the local stress concentration leads to preferred orientations of the basic structure units (BSUs), as well as the motion and rearrangement of structural defects, resulting in the formation of a locally ordered structure. The graphitization degree is enhanced as the local graphite structure spreads.
1. Introduction
Graphite, as a raw material for the production of new carbon materials, has been listed as a strategic resource by countries around the world [1,2,3,4,5]. Coal-based graphite (CBG) is formed by the metamorphism of coal seams under the effects of magmatic intrusion and tectonic stress [3,4,5,6,7]. Owing to the advantages of a high carbon content, the availability of abundant resources, and easy exploration, CBG has become of considerable interest to researchers [3,4,5,6,7,8,9,10].
CBG is the end-member product of the continuous evolution of coal [8,9,10]. With increasing metamorphic degrees, anthracite, semi-graphite, and graphite are progressively formed [11,12,13,14,15]. In recent years, optical analysis, X-ray diffraction, Raman spectroscopy, and high-resolution transmission electron microscopy (HRTEM) have been applied to characterize coal and CBG [11,16,17,18,19,20]. Marques et al. [10] investigated the correlations between optical, chemical, and microstructural properties in anthracite and CBG. Li et al. [11] studied the chemical composition and petrographic characteristics from anthracite to CBG. Rantitsch et al. [17] proposed Raman spectroscopy to discriminate semi-graphite from graphite. Zheng et al. [21] classified CBG into aromatic graphite, microcolumn graphite, corrugated graphite, and stiff graphite based on nanostructure analysis using HRTEM. Deurbergue et al. [14] studied the graphitization of anthracites through HRTEM and X-ray diffraction and concluded that the graphitization of coal is a progressive process. Nyathi et al. [15] assessed the graphitization of different ranks of anthracite using X-ray diffraction and Raman analysis.
Due to the complex composition of coal and the fact that macerals in coal respond differently to temperature and pressure, the degree of graphitization varies greatly under the same temperature and pressure conditions [8,14]. With rising temperature, short, curved, and disoriented basic structure units (BSUs) experience aromatization and condensation, and develop crystalline structure [16,22]. Oberlin [12] noted that non-graphitizing carbon does not transform to a graphite structure, even at a temperature of 3000 °C, because of its microporous structure. Thus, graphitization strongly depends on the type of source carbon material. Coal graphitization is not only a process that requires a carbon-rich environment, but also transforms coal from a disordered structure to an ordered three-dimensional structure [3,11,22,23,24]. At the nanometer scale, Rantitsch et al. [9] identified two types of graphitized microtextures (a microporous phase and an onion-ring like phase) in carbonaceous materials through HRTEM. At the micrometer scale, because of the chemical and physical differences in the maceral macromolecular structures, vitrinite, liptinite, and inertinite undergo various changes, although they tend to form graphite structures [25]. The morphology, chemical and physical structure, and reflectance of macerals change notably during coal metamorphism and graphitization. Suárez-Ruiz and García [20] identified four types of graphite-like particles as dense particles, flakes, microspheres, and crystalline aggregates. In addition, Li et al. [11] found needle-like graphite and pyrolytic carbon in graphitized coal and CBG. Thus, macerals, newly formed graphite particles, and some transitional matter all coexist [9,26,27]. Han et al. [28] and Song et al. [29] demonstrated that deformation influences the evolution of coal. González et al. [8], Wilks et al. [30], and Bustin et al. [31] discussed the effect of minerals (e.g., illite and siderite) and deformation on coal graphitization through laboratory investigations at high temperatures and high pressures. Previous studies have shown that tectonic stress and minerals play a catalytic role in graphitization [14,18,30,31,32,33]. Extremely high activation energies and thermodynamic conditions limit comparisons between experimental graphitization and natural graphitization [16]. Previous studies mainly focused on: (1) the structural and geochemical properties of CBG, (2) different temperature and pressure conditions for graphitization, and (3) the behavior of influencing factors during graphitization from an experimental point of view. However, no attempt has been made to investigate the characteristics of coal graphitization and the distribution of CBG under the effect of an igneous intrusion coupled with tectonic deformation in nature, especially when tectonic deformation has participated in graphitization.
Graphitization is complicated under the effects of multiple factors [4,33,34,35,36]. An igneous intrusion introduces thermal energy; thus, the degree of coal graphitization gradually decreases with increasing distance from the intrusion. Nevertheless, the intrusion activity is often accompanied by tectonic activities, and both temperature and tectonic deformation influence graphitization, resulting in the differentiated evolution and discontinuous distribution of CBG. One of the main reasons for this is the critical role of tectonic stress during graphitization [9,11,14]. It is well known that deformation caused by stress and the elimination of structural defects could take place at the same time; for instance, the dynamic recrystallization mechanism during the deformation of minerals [34,35,36,37,38,39]. Similarly, for the purpose of extinguishing structural defects during graphitization, it is possible that deformation also coincides with coal graphitization, which is graphitization induced by deformation.
The objective of this study is to investigate the characteristics of differentiated coal graphitization under the combined effects of magmatic intrusion and tectonic activity, and to reveal a pathway for the evolution of organic matter (coal) to inorganic minerals (graphite), namely strain-induced graphitization. For this purpose, different deformed anthracite-CBG samples occurring at various distances from the intrusion were collected from CBG mines in Lutang, Hunan Province, China. Microscopy analysis, X-ray diffraction, Raman spectroscopy, and HRTEM were used to characterize the microstructure of samples.
2. Geological Setting and Sample Locations
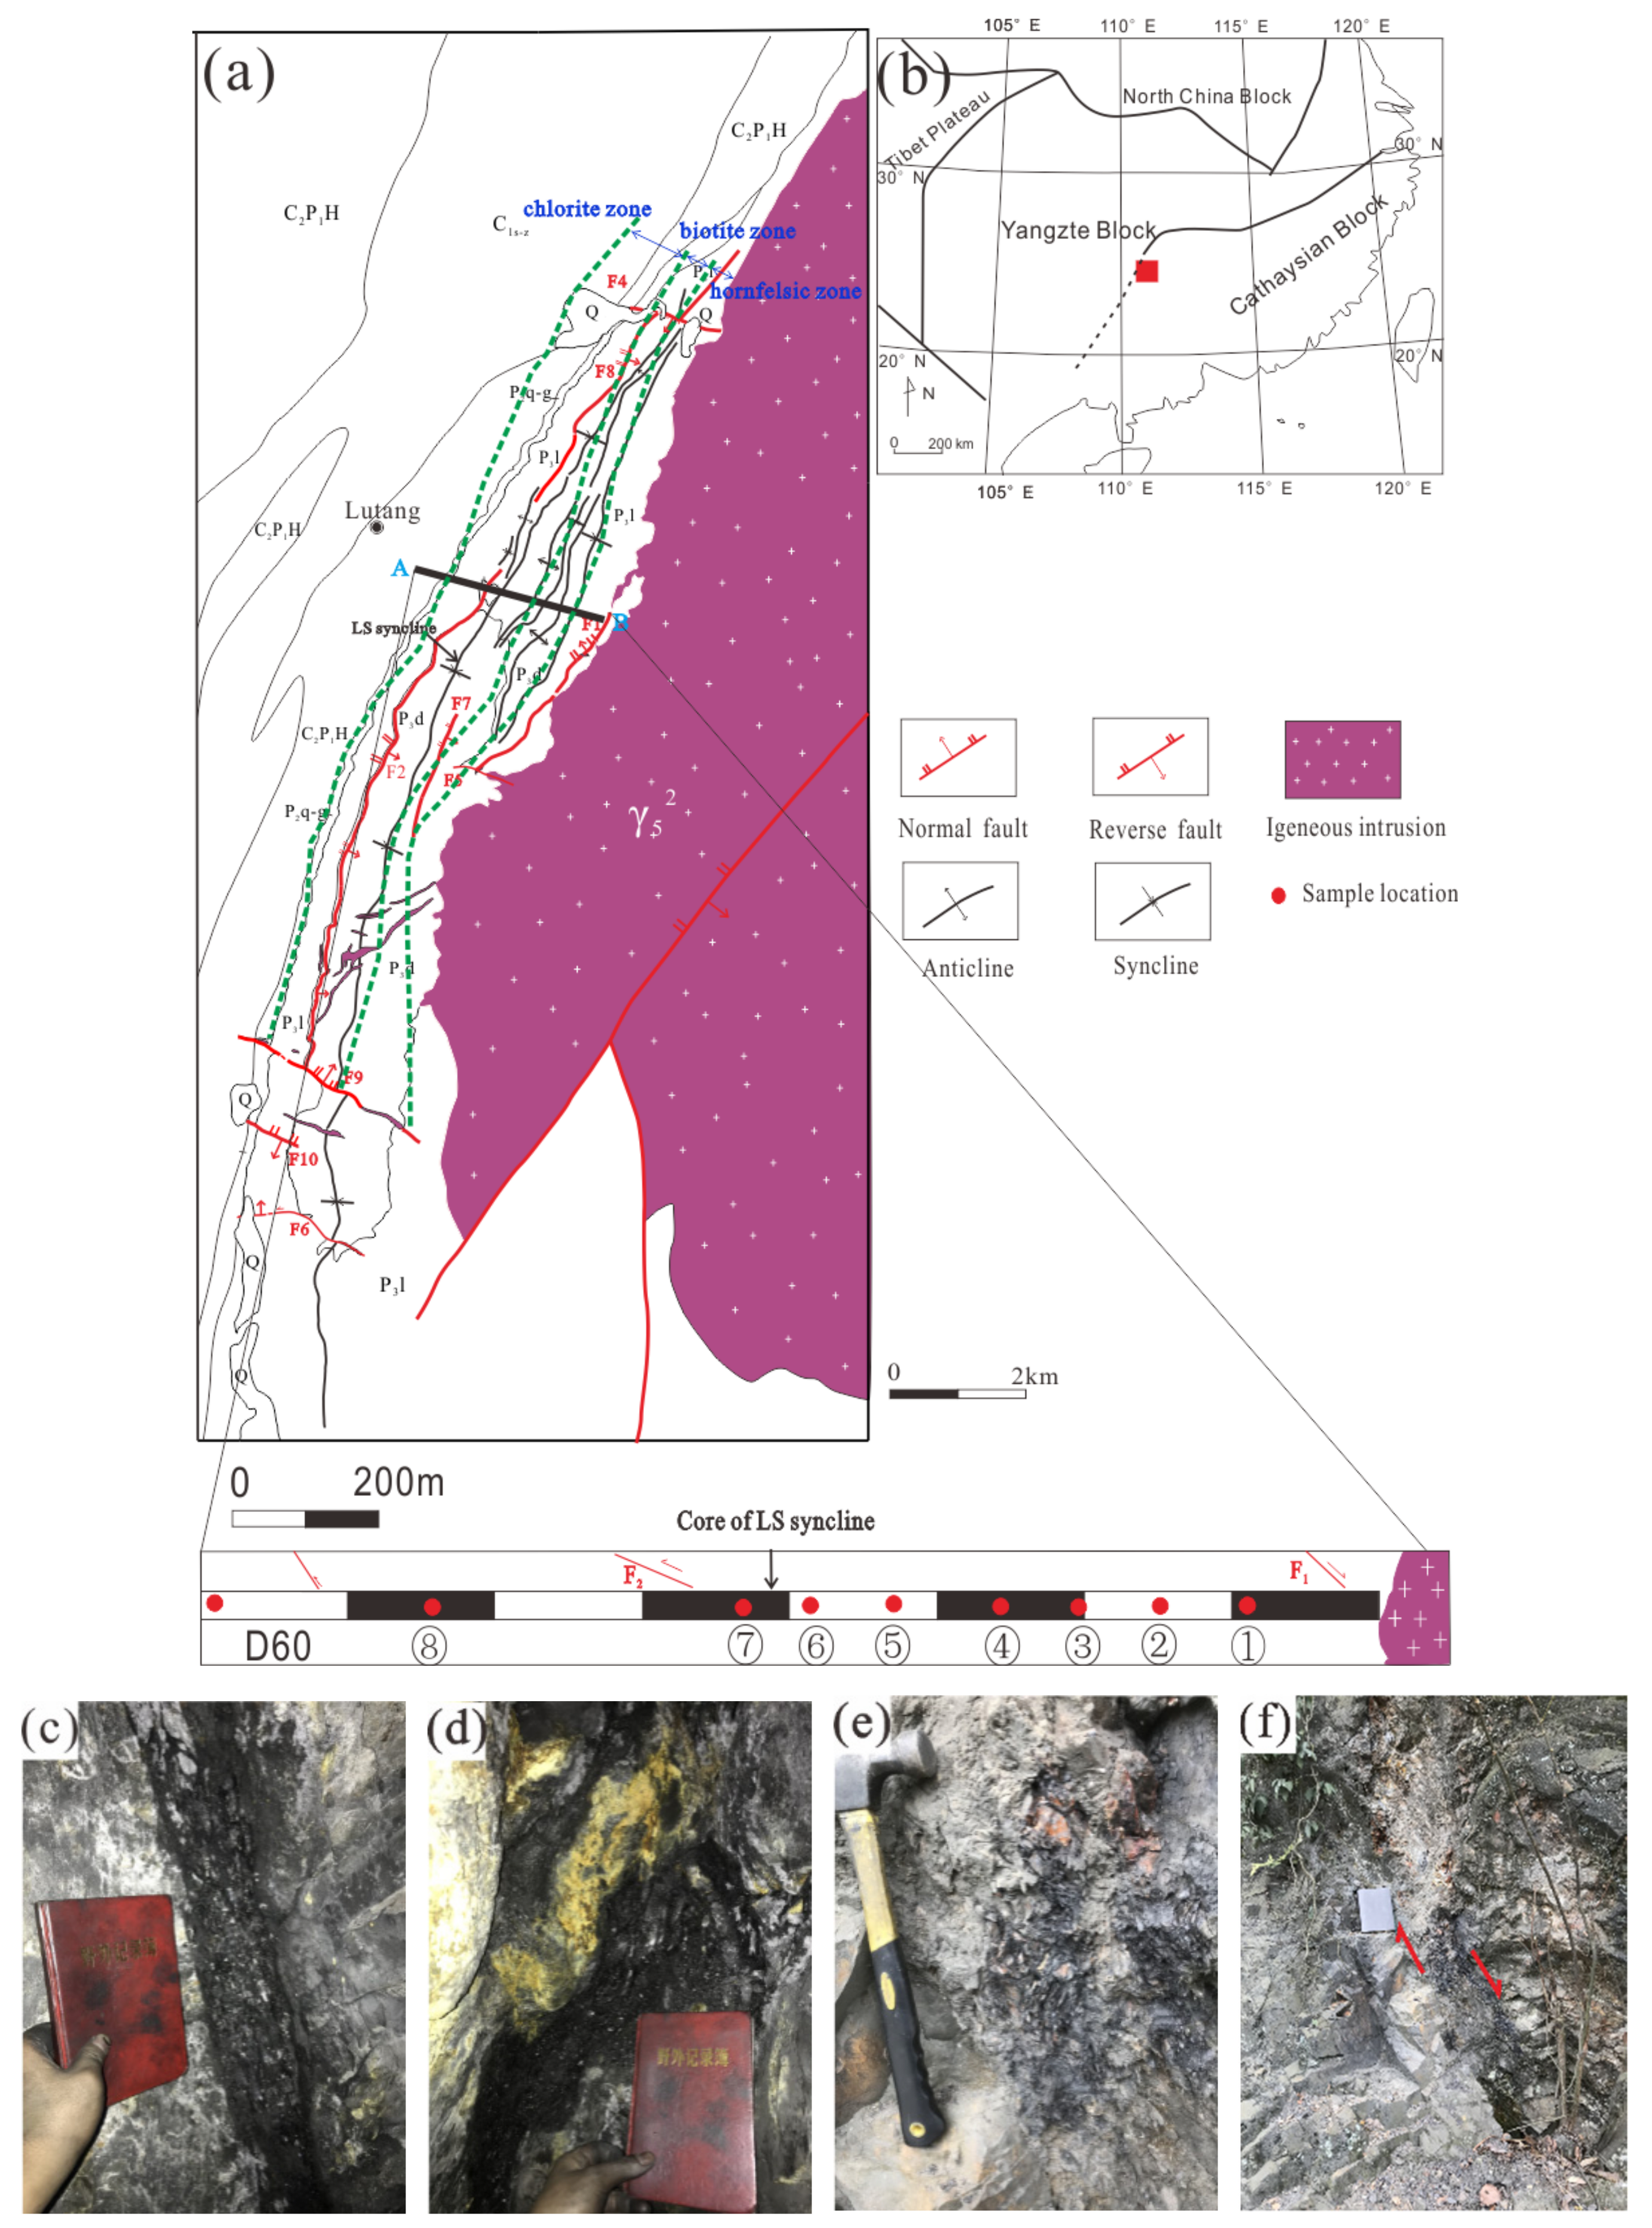
The Lutang mining area is located in the southeast of Hunan Province, China, which lies between the Cathaysia block and the Yangtze block (Figure 1a). The tectonic and magmatic activities were most intense during the Indosinian-Yanshanian period (135–233 Ma) [40]. The Qitianling granitic pluton intruded east of the research area during the Yanshanian period (146–163 Ma) [41], covering an area of 50 km2. The coal-bearing strata occurring in the Upper Permian Longtan formation were highly metamorphosed by the intrusion, while metamorphism gradually decreases with increasing distance from the pluton [42]. According to Shao and Che [43], the study area is divided into three zones near the intrusion: the chlorite zone (700–1300 m, 300–450 °C), the biotite zone (400–700 m, 400–500 °C), and the hornfelsic zone (0–400 m, 450–600 °C). The main tectonic structure in the research area is the NNE striking Lutang–Shatian syncline (LS syncline). The western flank manifests as broad and gentle folds, while structures at the eastern flank are characterized by tight folds. Minerals show dynamic recrystallization of quartz, kinking of feldspar, and the undulatory extinction of quartz, indicative of the decreasing degree of tectonic deformation from east to west. Coal seams were intensely deformed with varying thicknesses, appearing as nest-like or lotus-type structures.
Eight groups of samples were collected with increasing distances from the intrusion (Table 1). Within each group, the distance between two samples was less than 20 m, and samples show different deformation characteristics. In the group 4 samples, sample B4-1 had clearly visible bedding and several fractures (Figure 1c), whereas, sample F4-1 showed irregular bending (Figure 1d). Sample D60 collected furthest from the intrusion in a fault shear zone exhibited scaly flakes (Figure 1e,f). All samples were divided into brittle- and ductile-deformation groups based on Ju et al. [44]. For brittle deformed samples, several sets of fractures in different directions divided the coal body into several different sizes of fragments, and ductile deformed samples were characterized by wrinkle layers and irregular curves. There were minor differences in the chemical composition based on the proximate and ultimate analyses (Table 1).
3. Methods
3.1. X-ray Diffraction
Samples were crushed to 75 μm and demineralized for subsequent experiments. Ten grams of sample were treated with 50 mL HCl (to dissolve carbonates) and then rinsed with distilled water. Next, 50 mL HF was added (to dissolve silicates) and heated in a steamboat for 12 h at 60 °C. Finally, the demineralized samples were washed and dried. X-ray diffraction analysis was performed using a Rigaku D/MAX-2500PC X-ray diffractometer (40 kV, 100 mA) (Rigaku, Tokyo, Japan) with Cu (λ = 1.5478 Å) irradiation, over the interval 2.5–70° at a scanning rate of 2° per min. The interlayer spacing d002 was determined from the position of the (002) peak using Bragg’s equation. The mean crystallite dimensions Lc and La were calculated respectively from the (002) and (100) peaks, using the Scherrer formula with the values of K = 0.9 for Lc and 1.84 for La [45], respectively.
3.2. Optical Microscopy
The measurements were performed on polished particulate blocks in accordance with ISO 7404-3 procedures (Leitz, Berlin, Germany). Maximum reflectance (Rmax) and minimum reflectance (Rmin) were measured on vitrinite or graphite-like particles using an MPV-Combi (Leitz) reflected-light microscope (Leitz, Berlin, Germany). Measurements were carried out with a 50× oil immersion objective under polarized light, rotating the microscope stage through 360°. Bireflectance (Rb) related to the anisotropic property was calculated as Rb = Rmax−Rmin. The microscopic composition content of the samples was estimated via the point-counting of 500 points in polarized light.
3.3. Raman Spectroscopy
Raman spectra were obtained from the acid-treated samples. Raman spectroscopy was performed using a Jobin–Yvon Labram HR Evolution spectrometer (Horiba, Paris, France) with an argon laser wavelength of 532 nm. The laser power at the sample surface was controlled at about 2 mW to reduce thermal damage of the laser power. A 50× objective lens microscope was used to focus the laser beam on the sample to collect the Raman signal. Ten spots were measured for each individual sample. Each spectrum was fitted with the Origin 8.0 software to resolve the curve using the Lorentzian line shapes [46,47,48,49,50]. The parameter R2 = AD1/(AD1 + AD2 + AG) (area ratio of bands) was used to characterize the carbon materials [17,18,51].
3.4. HRTEM
HRTEM was performed on a 300 kV Tecnai G2 F30 transmission electron microscope (Philips, Amsterdam, The Netherlands). Fringe images were acquired for each sample from different spots and processed using Gatan Digital Micrograph software (Version 3.9, Gatan, Pleasanton, CA, USA) to obtain clearer lattice fringes. First, a region of interest (ROI) was processed with a fast Fourier transformation (FFT) to remove the noise without losing fringes. An inverse fast Fourier transform (IFFT) was also applied to obtain the crystal lattice images.
4. Results
4.1. Crystallization Degree as Determined Using XRD
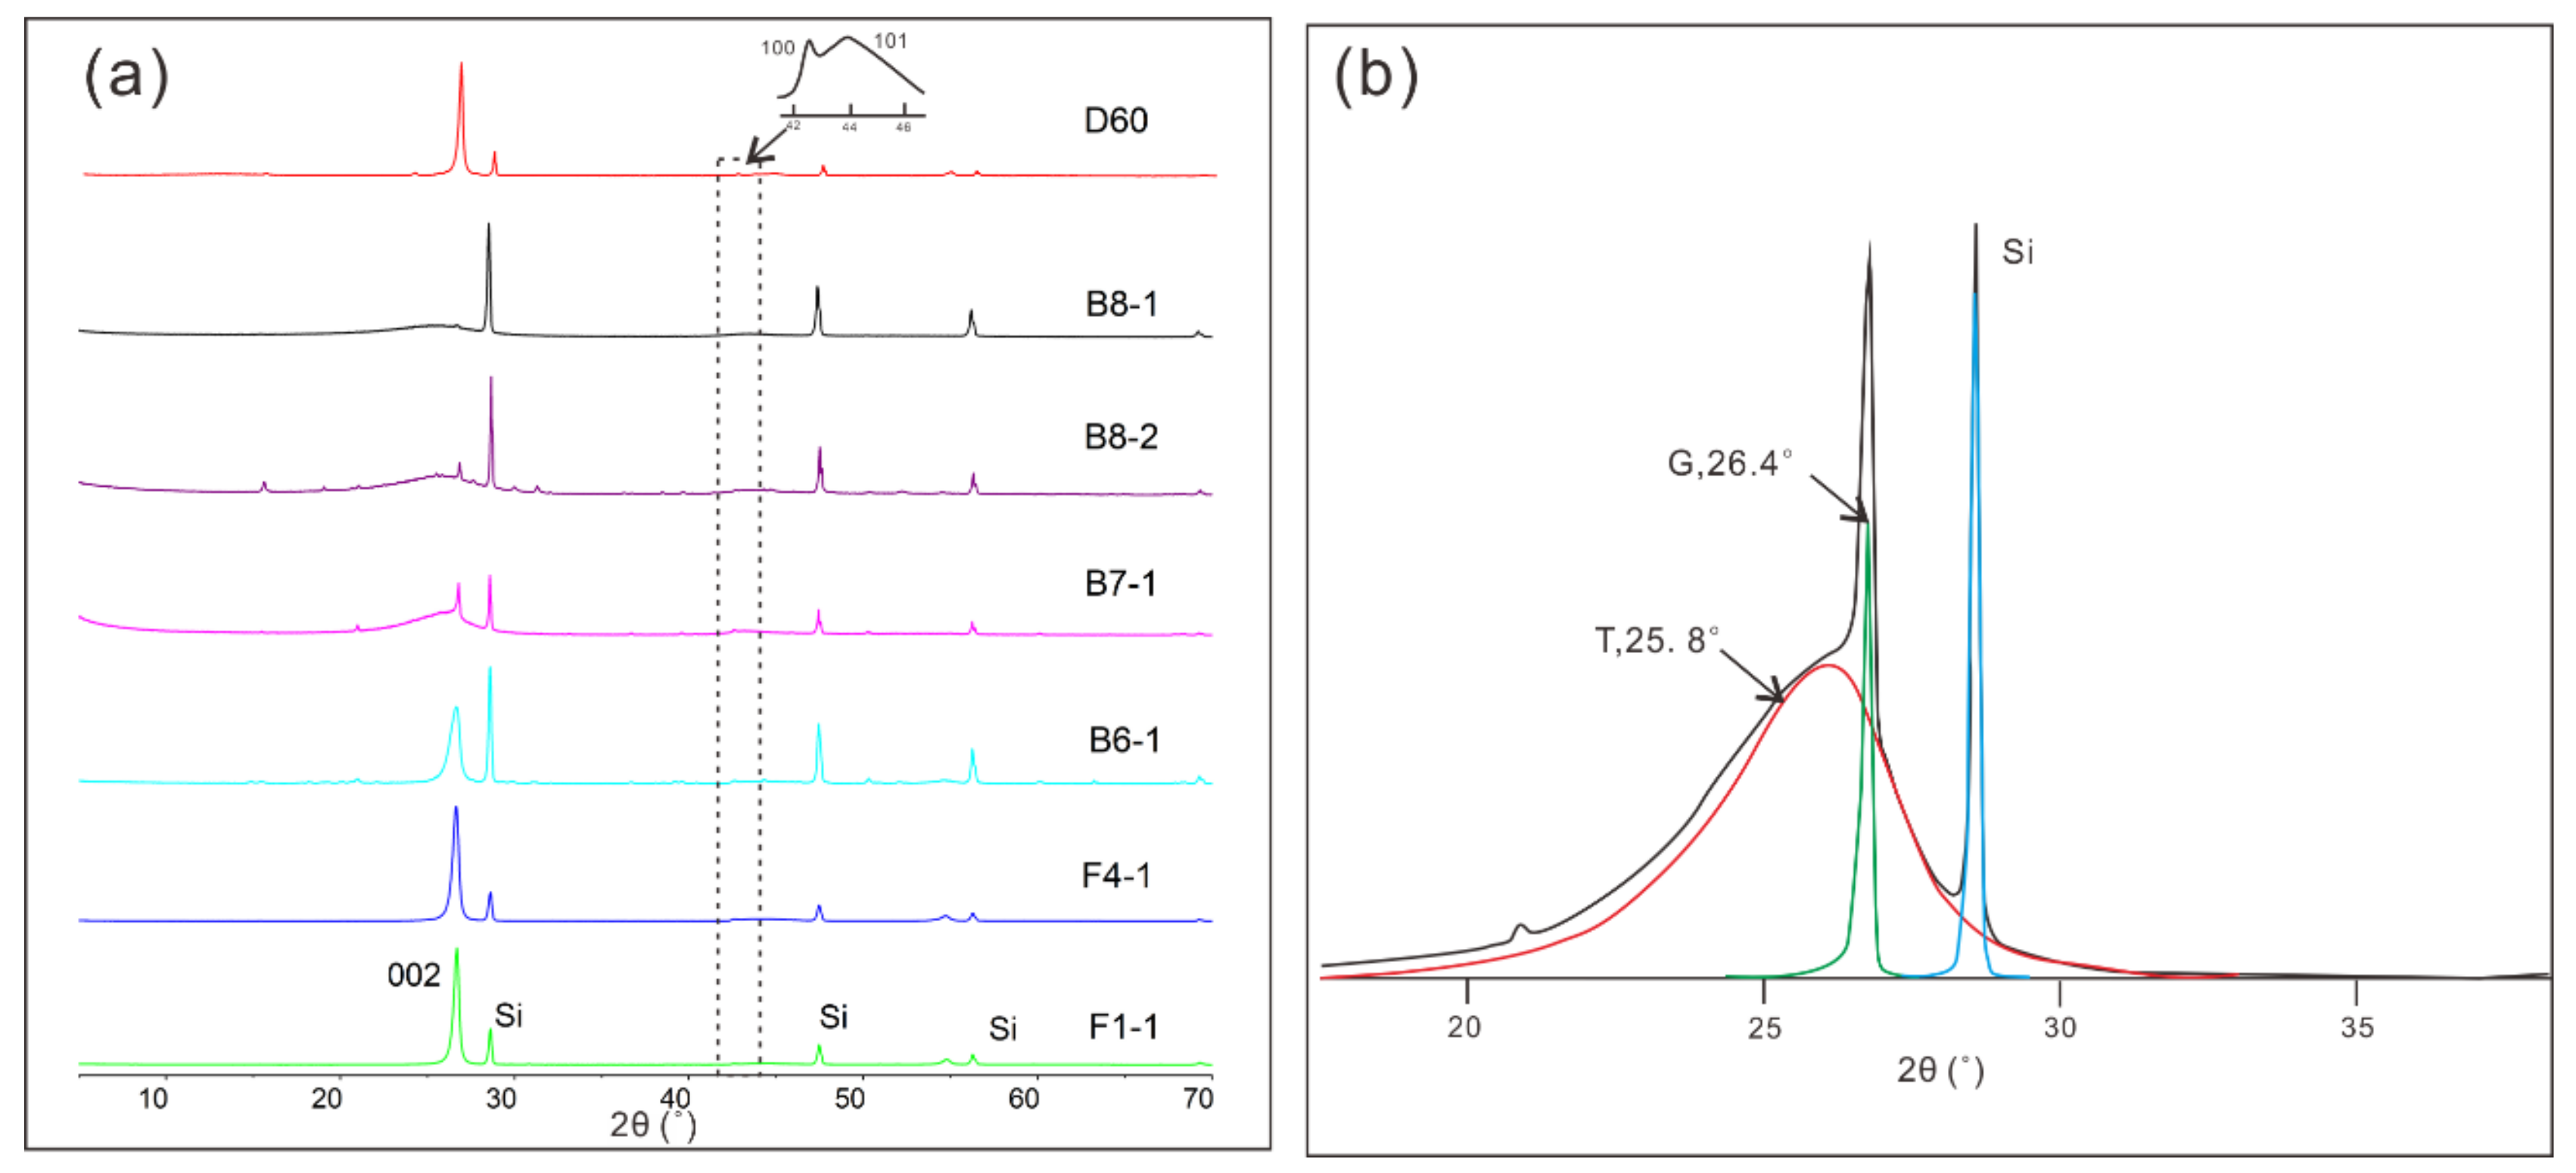
The interlayer spacing d002 values of samples >800 m away from the intrusion (apart from sample D60) were larger than 0.340 nm. X-ray diffraction profiles showed broad and low (002) peaks, indicating poorly crystallized crystallite (La and Lc were <10 nm) (Figure 2a, Table 2). The interlayer spacing d002 values of samples located within about 800 m from the intrusion ranged from 0.3358 nm to 0.3366 nm, indicating graphite according to Kwiecińska and Peterson [52], and the La and Lc dimensions of the crystallite were both larger than several tens of nanometers. Although d002 values changed slightly with decreasing distance from the intrusion, with the full width at half maximum of (002) peak (FWHM (002)) decreasing significantly. Moreover, La and Lc values also changed. In X-ray diffraction profiles, broad (002) peaks gradually became sharp and the (100) and (101) peaks were moderately separated, indicating the formation of a three-dimensional crystalline structure [12,18,19], accompanied by an increase in La and Lc values (Figure 2a). Sample B7-1, occurring about 840 m away from the intrusion and characterized by an asymmetric (002) peak, fit into two separate peaks at 26.4° and 25.8°, suggesting the coexistence of a crystalline structure and a turbostratic structure [53] (Figure 2b). Well-graphitized CBG samples were distributed in the east wing of the LS syncline and poorly graphitized samples (d002 > 0.340 nm) were from the west wing of the syncline. Sample D60, originating furthest away from the intrusion, showed a d002 vapeak was also sharp and high (FWHM (lue of 0.3363 nm and a crystallite size with La = 29.36 nm and Lc = 65.55 nm. The (002) 002) = 0.278°).
4.2. Microscopical Characterization of CBG
Based on the microstructure observations, we summarize the three types of carbonaceous particles we identified in CBG, including coal macerals (mainly vitrinite and inertinite), pyrolytic carbons, and graphite-like particles. Granular particles, flakes, and silk-like graphite were recognized as graphite particles. Furthermore, the proportion of each type of carbonaceous particle varied with the degree of graphitization (Table 3) [11,20].
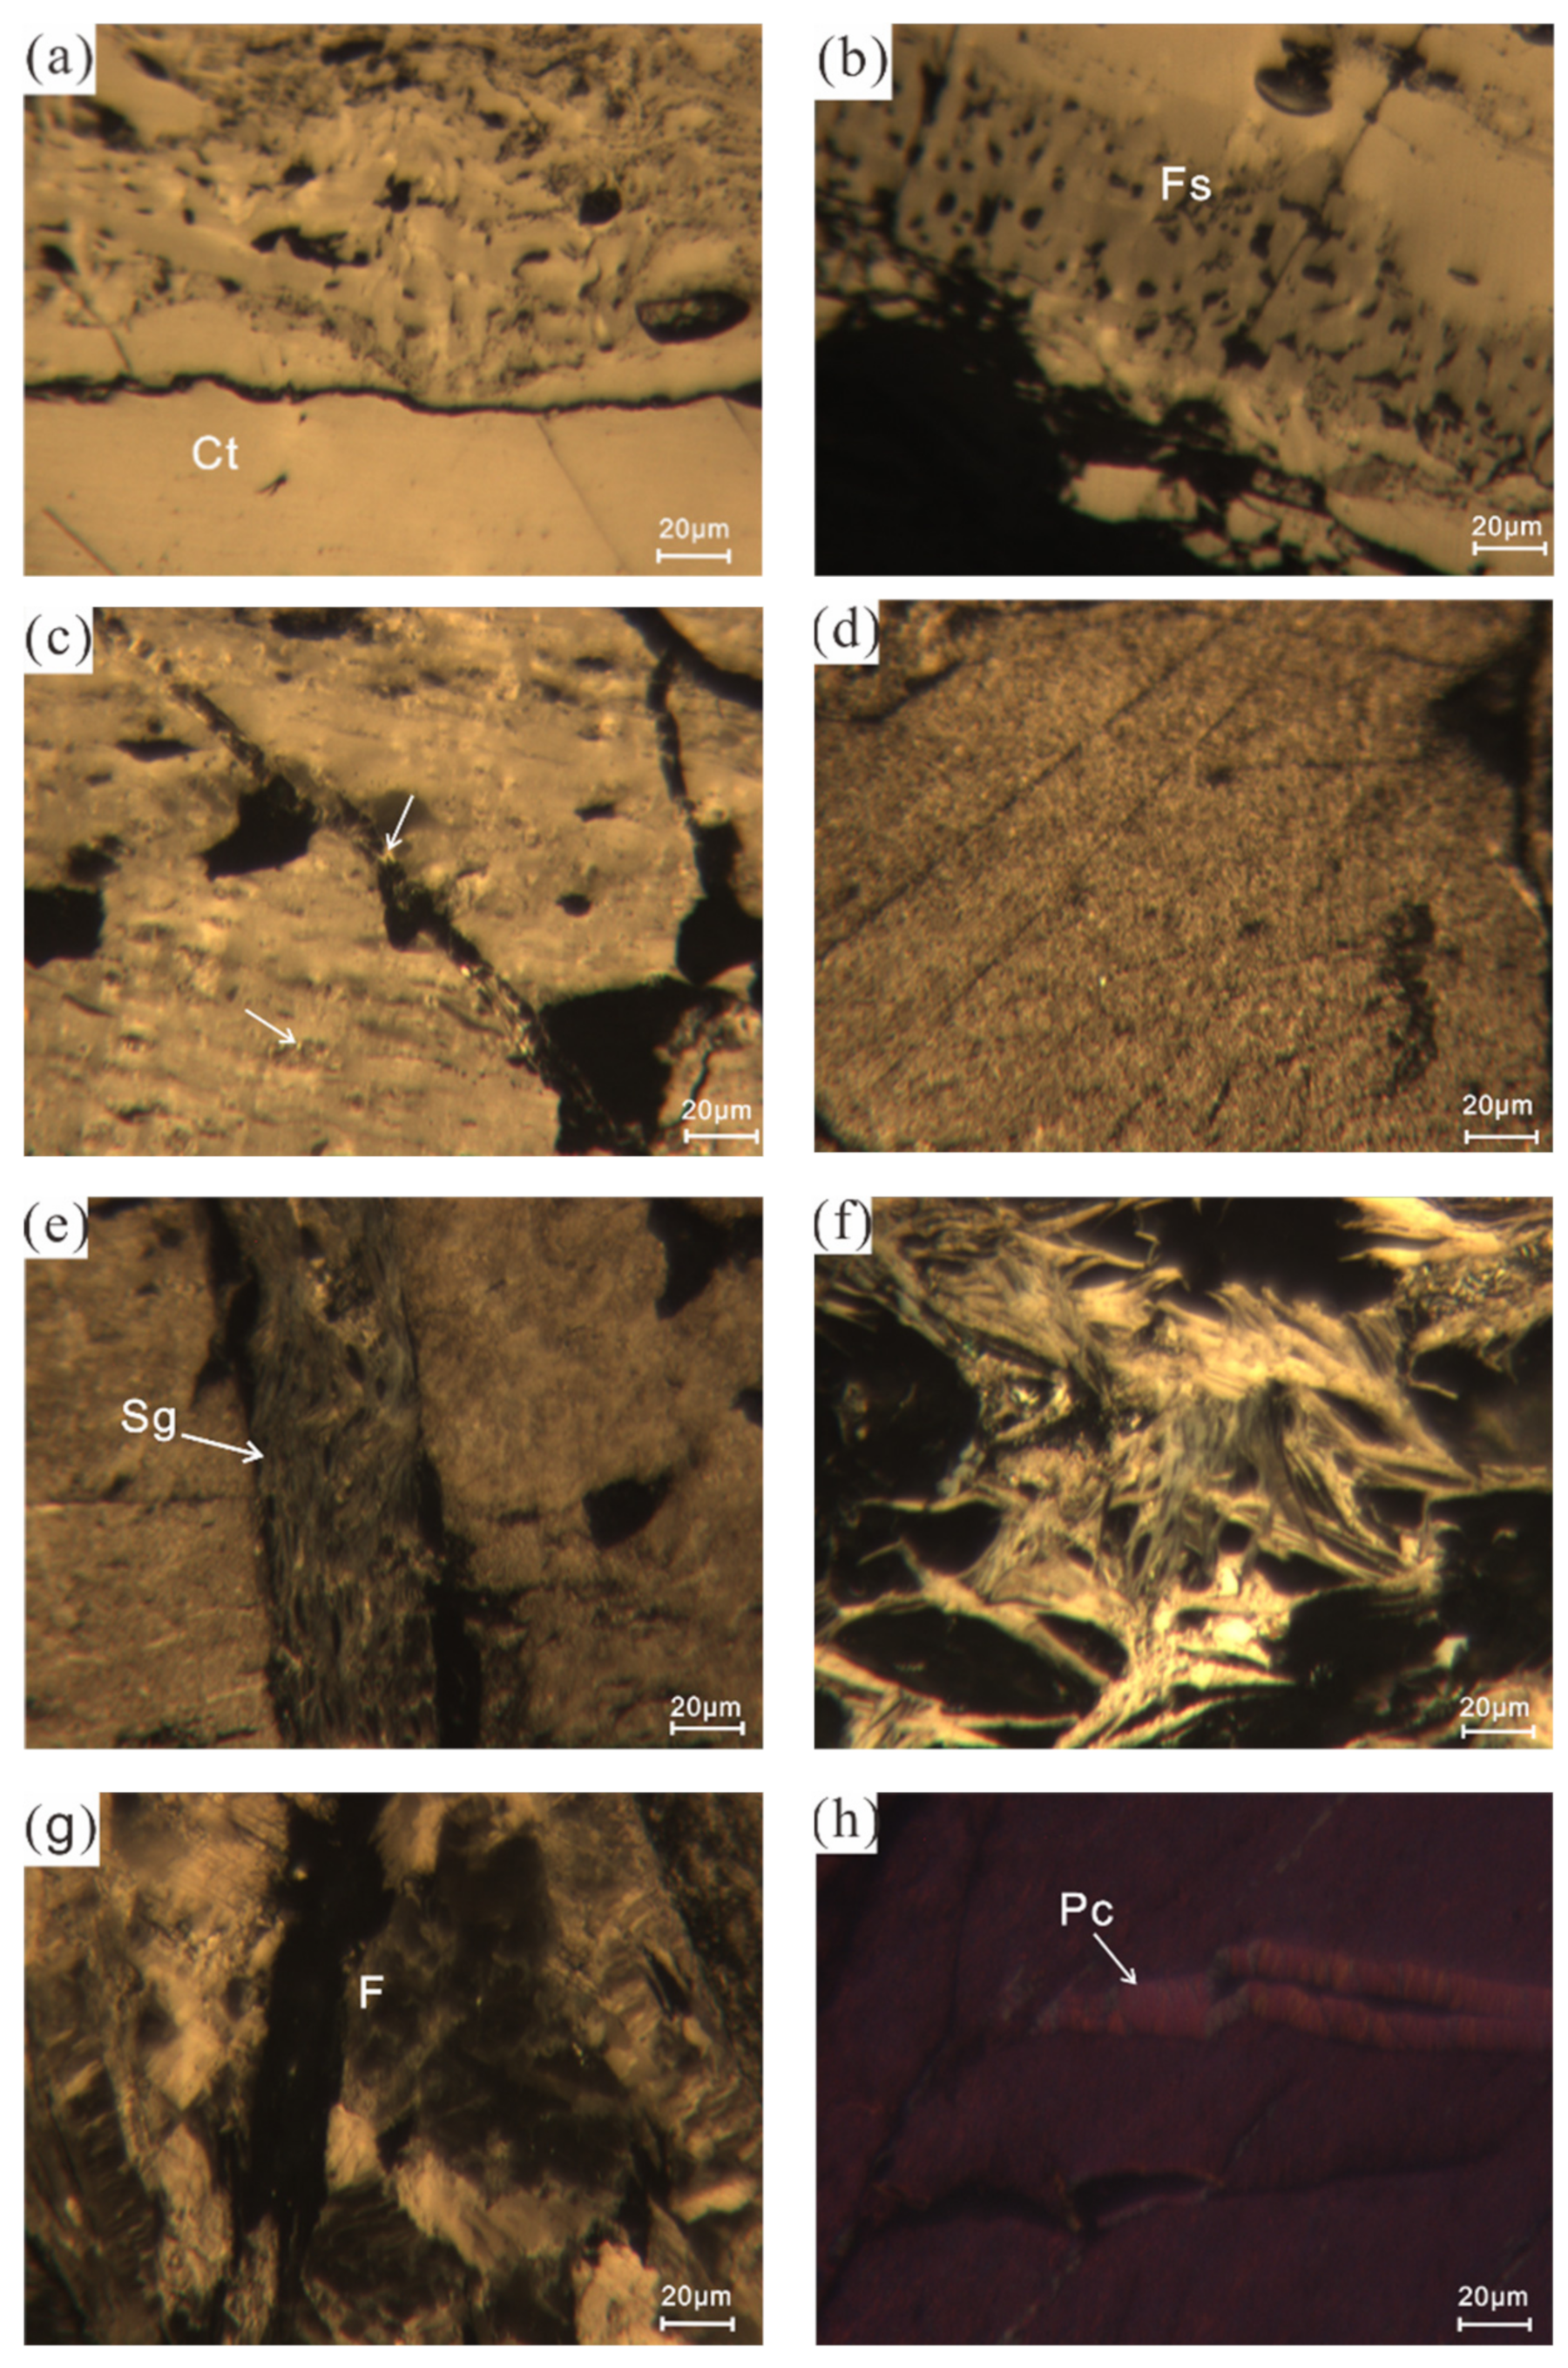
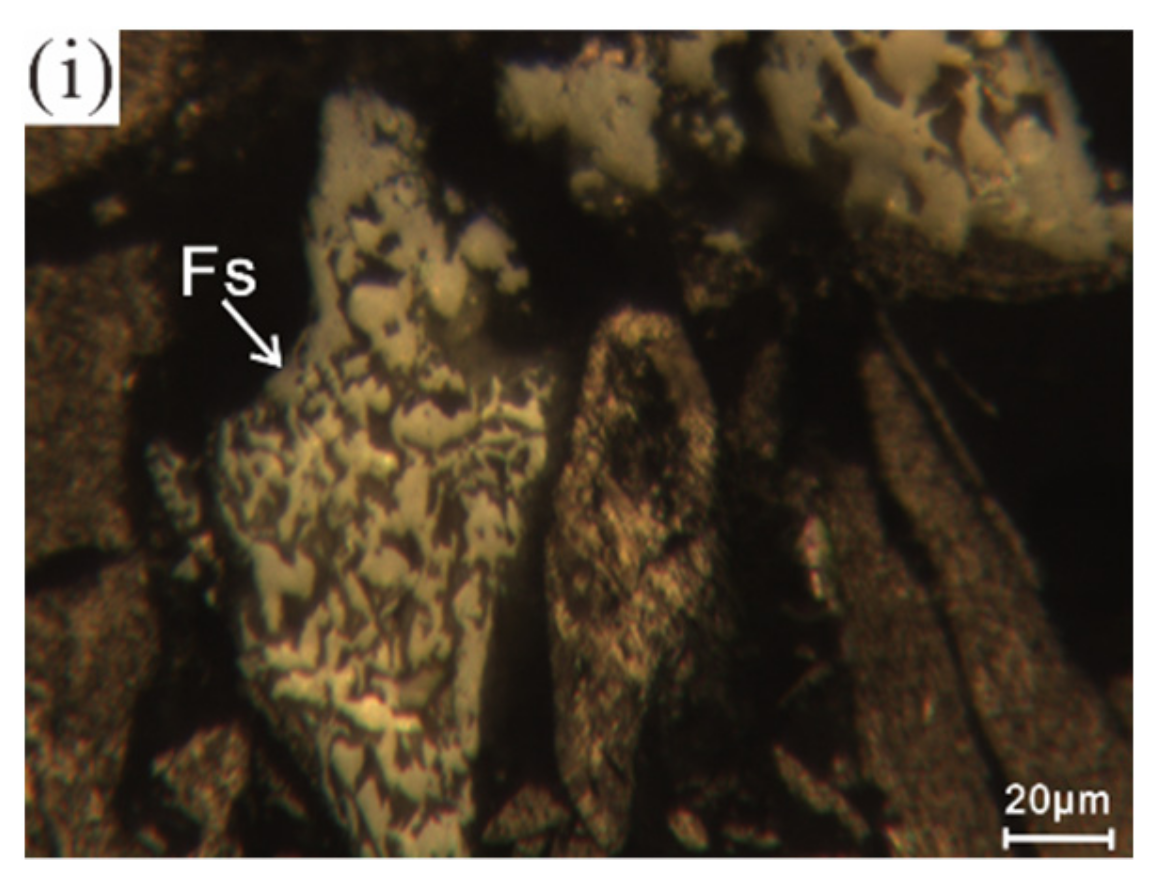
Coal macerals were preserved in sample B8-1, far from the intrusion, mainly as vitrinite (Figure 3a, collotelinite) and inertinite (Figure 3b, fusinite). Respective Rmax and Rmin values of 7.17% and 2.81% indicated that the sample was metamorphosed to meta-anthracite [11,25,52]. With increasing coal rank, it was difficult to differentiate vitrinite and inertinite since their reflectance tended to be similar. In high-rank samples, the strong optical anisotropy of vitrinite was used to distinguish it from inertinite [11,54]. Samples adjacent to the intrusion showed irregular pores on the surface, possibly the result of gas volatilization during the decomposition of aliphatic functional groups and alkane branched chains [54,55,56]. Granular particles were formed in pores and fractures, as shown in sample B7-1 (Figure 3c). Approaching the intrusion, coal maceral content decreased, but granular particle content increased (Table 3). Apart from granular particles, flow-type anisotropy was also found (Figure 3e,f), similar to the needle-like graphite described by Li et al. [11], which was characterized by strong anisotropy (Figure 3f, sample B4-1, Rmax = 7.21%, Rb = 6.35%). Flakes also exhibited high reflectance and strong anisotropy, as shown for sample F2-2 (Figure 3g, Rmax = 8.61%, Rb = 7.27%). They display undulatory extinction when rotating the microscope stage. The content of silk-like graphite and flakes steadily increased in samples approaching the intrusion (Table 3). In sample F1-1 closest to the intrusion, both the content and size of silk-like graphite and flakes increased (Table 3), but non-graphitized inertinite was also recognized (Figure 3i). From the optical characteristics, silk-like graphite and flakes developed a higher degree of crystallization than granular particles. Helminthoid, clustered, or ribbon-like pyrolytic carbons (Figure 3h) often coated the rims of fractures or pores. Pyrolytic carbons displayed multiple colors interlaced under light polarized with a retarder plate (Figure 3h) and their size increased toward the intrusion.
4.3. Raman Spectroscopy
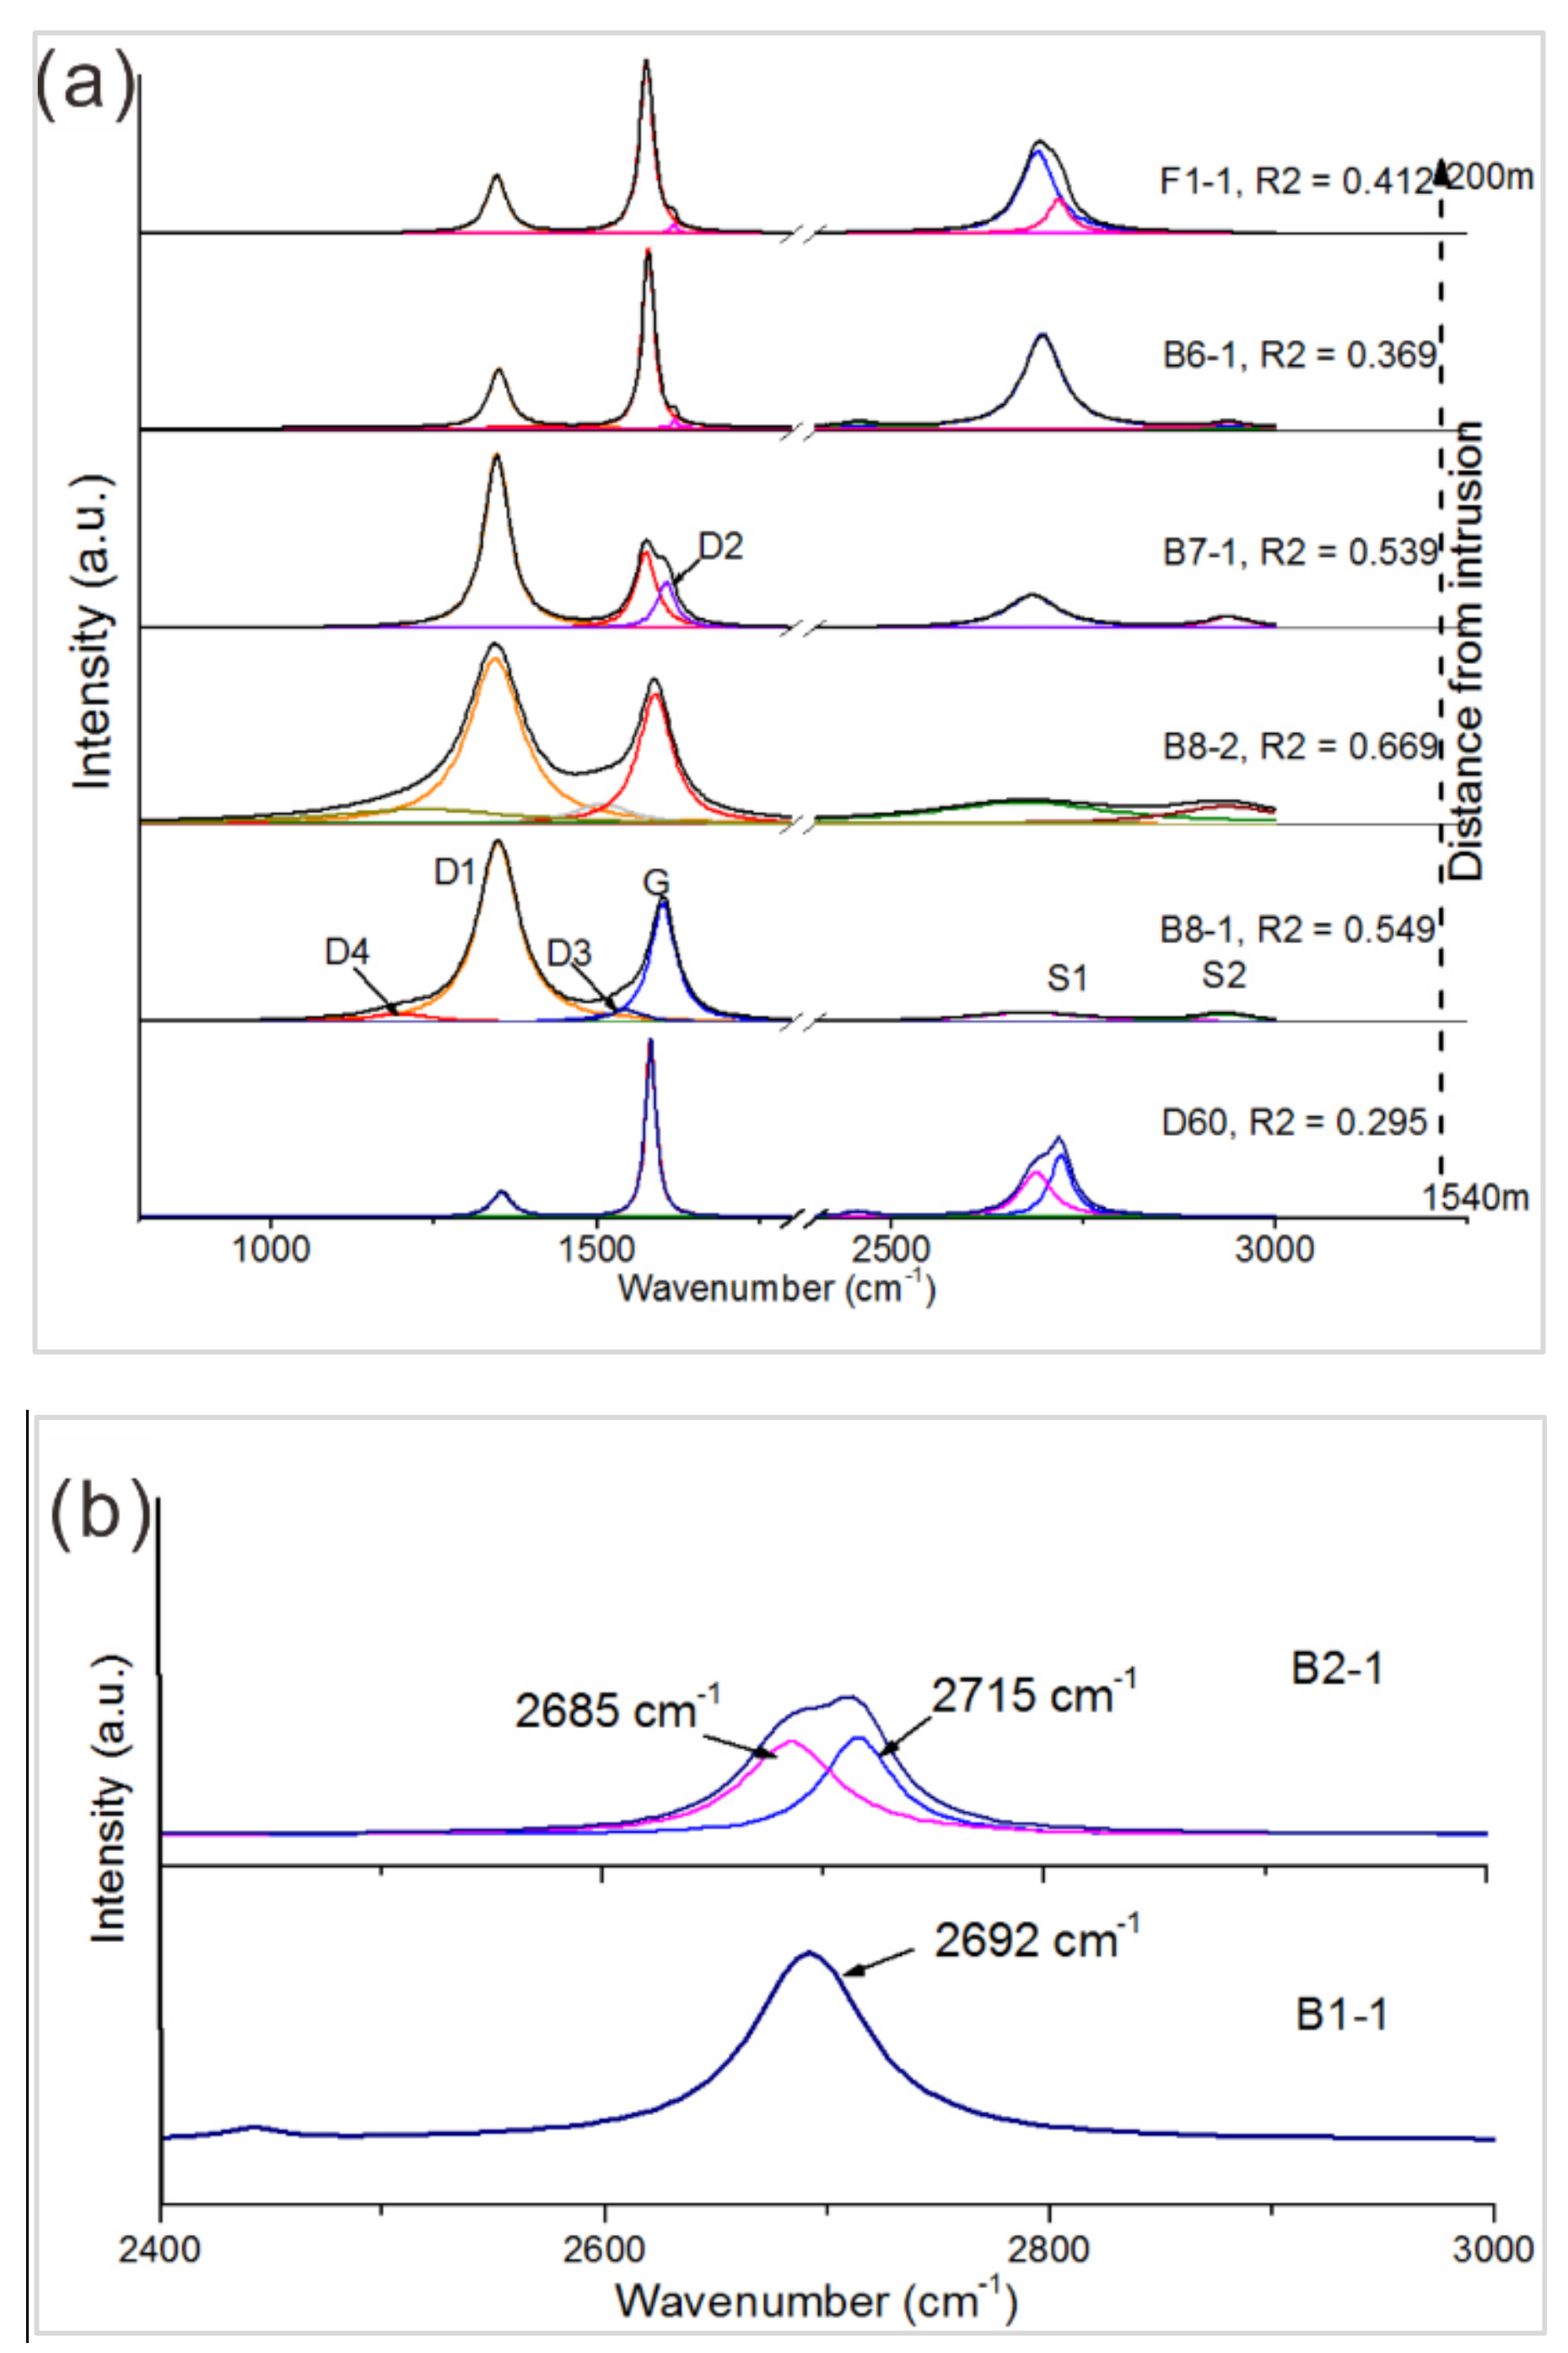
With decreasing distance from the intrusion, D3 and D4 bands gradually disappeared and the D1 band became lower relative to the G band. The D2 band suddenly appeared in sample B7-1 and then decreased moderately (Figure 4a). In the second-order region (2200–3400 cm−1), the 2D1 band height increased with decreasing distance from the intrusion and evolved from a single band to an asymmetric band fitted into two separate symmetric bands at ~2685 cm−1 and ~2715 cm−1, corresponding with a higher degree of stacking order along the c-axis (Figure 4a,b) [15,17,57,58].
The R2 values of samples (except sample D60) further than 800 m from the intrusion were >0.5; by contrast, R2 values of samples within 800 m of the intrusion were <0.5 (Supplementary Table S1). At around 800 m away from the intrusion, the R2 value decreased from 0.549 to 0.369, similar to the change observed in the interlayer spacing d002. The R2 values progressively decreased when approaching the intrusion; however, the R2 values of the two samples closest to the intrusion, F1-1 (R2 = 0.401) and B1-1 (R2 = 0.344), were not at the minimum, revealing that the group of samples nearest the intrusion were not the most ordered. Sample F2-3, located further away from the intrusion (330 m) than the first group of samples, showed the minimum R2 value of 0.243, indicating the highest degree of structural order among the samples. Moreover, R2 values were different at the same distance from the intrusion, as with sample F2-3 (R2 = 0.243) and sample B2-1 (R2 = 0.303).
The Raman spectrum of sample D60 was characterized by a low intensity D1 band and absent D2, D3, and D4 bands. A sharp, intense G band, an asymmetric 2D1 band, and a small R2 value (0.295) were observed for this sample (Figure 4a). The results suggest that sample D60 was highly organized with few structural defects, and a similar degree of structural ordering to sample B2-1 located about 330 m away from the intrusion.
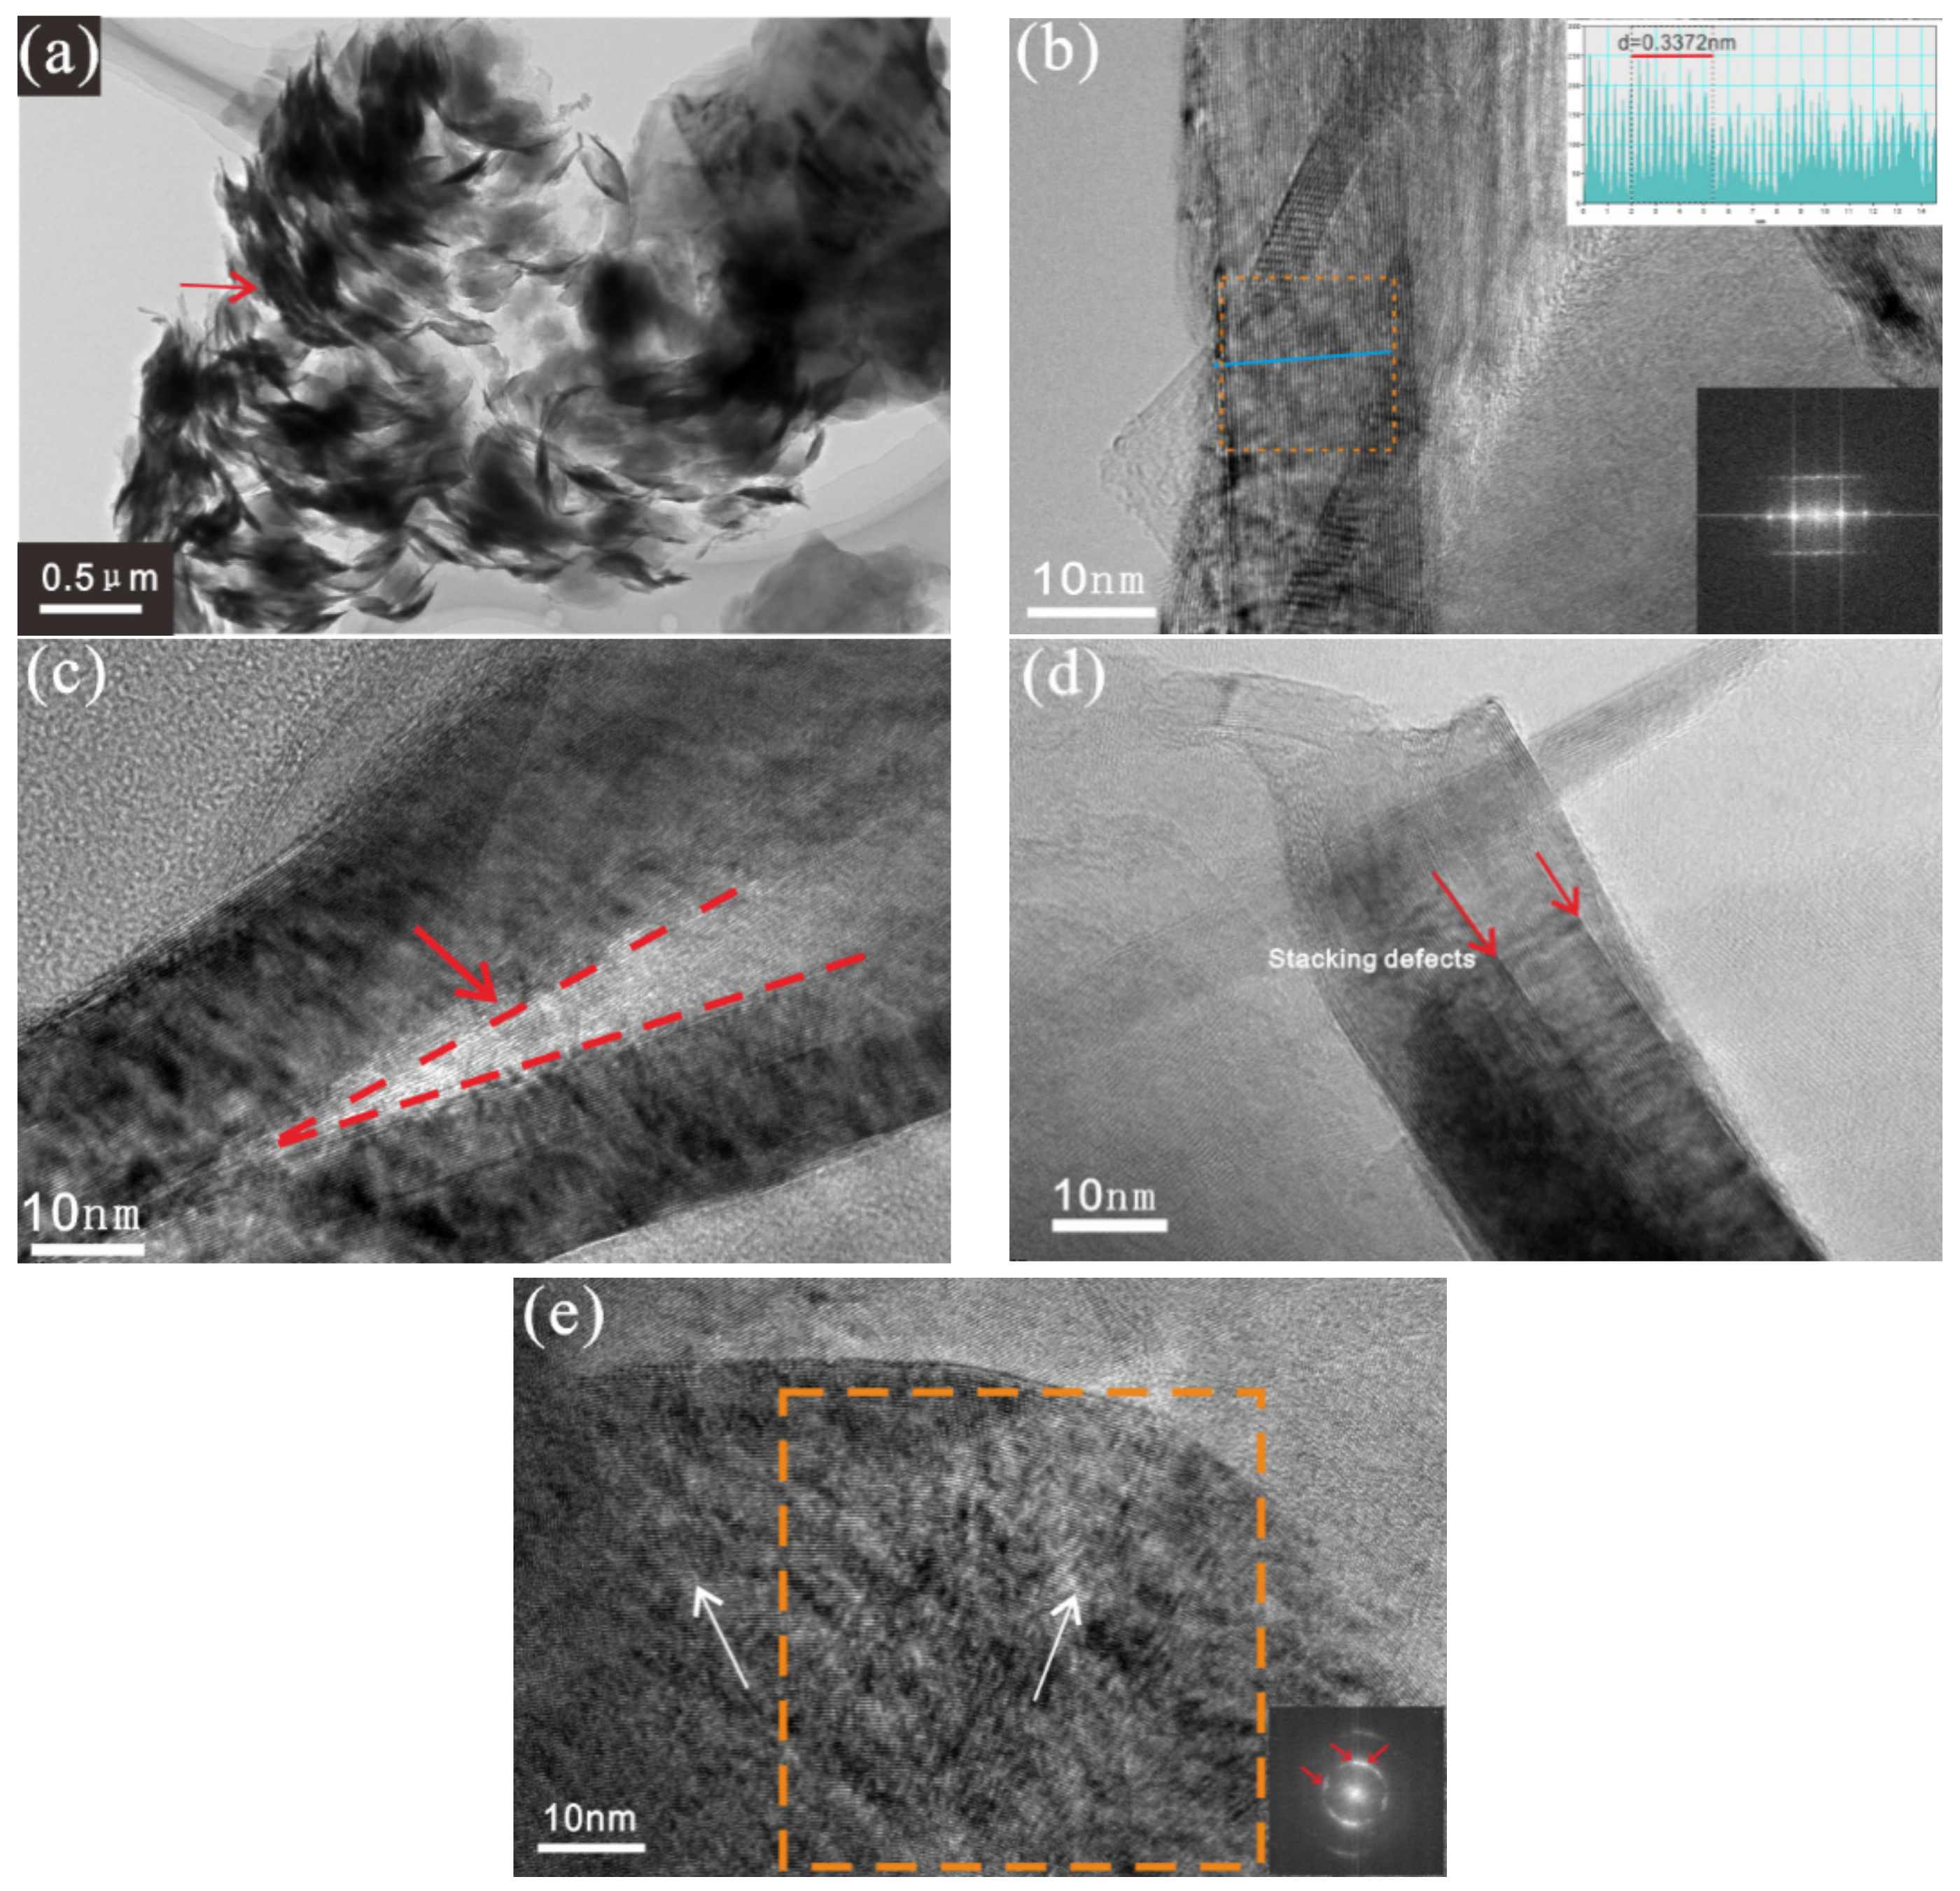
4.4. Nanostructural Characterization of CBG
Sample D60 showed thin flakes, both macroscopically and microscopically. Many particles (0.3 μm in length) were arranged along one direction like loose scales (Figure 5a), and long and straight carbon layers were also observed (Figure 5b). Long-range ordered aromatic layers extended several tens of nanometers in sample B1-1, and interlayer delamination and stacking defects were observed (Figure 5c,d). In sample F1-1, ordered carbon layers curved and displayed a spherical shape (Figure 5e).
5. Discussion
5.1. Evolution of Microstructures with Increasing Graphitization Degree
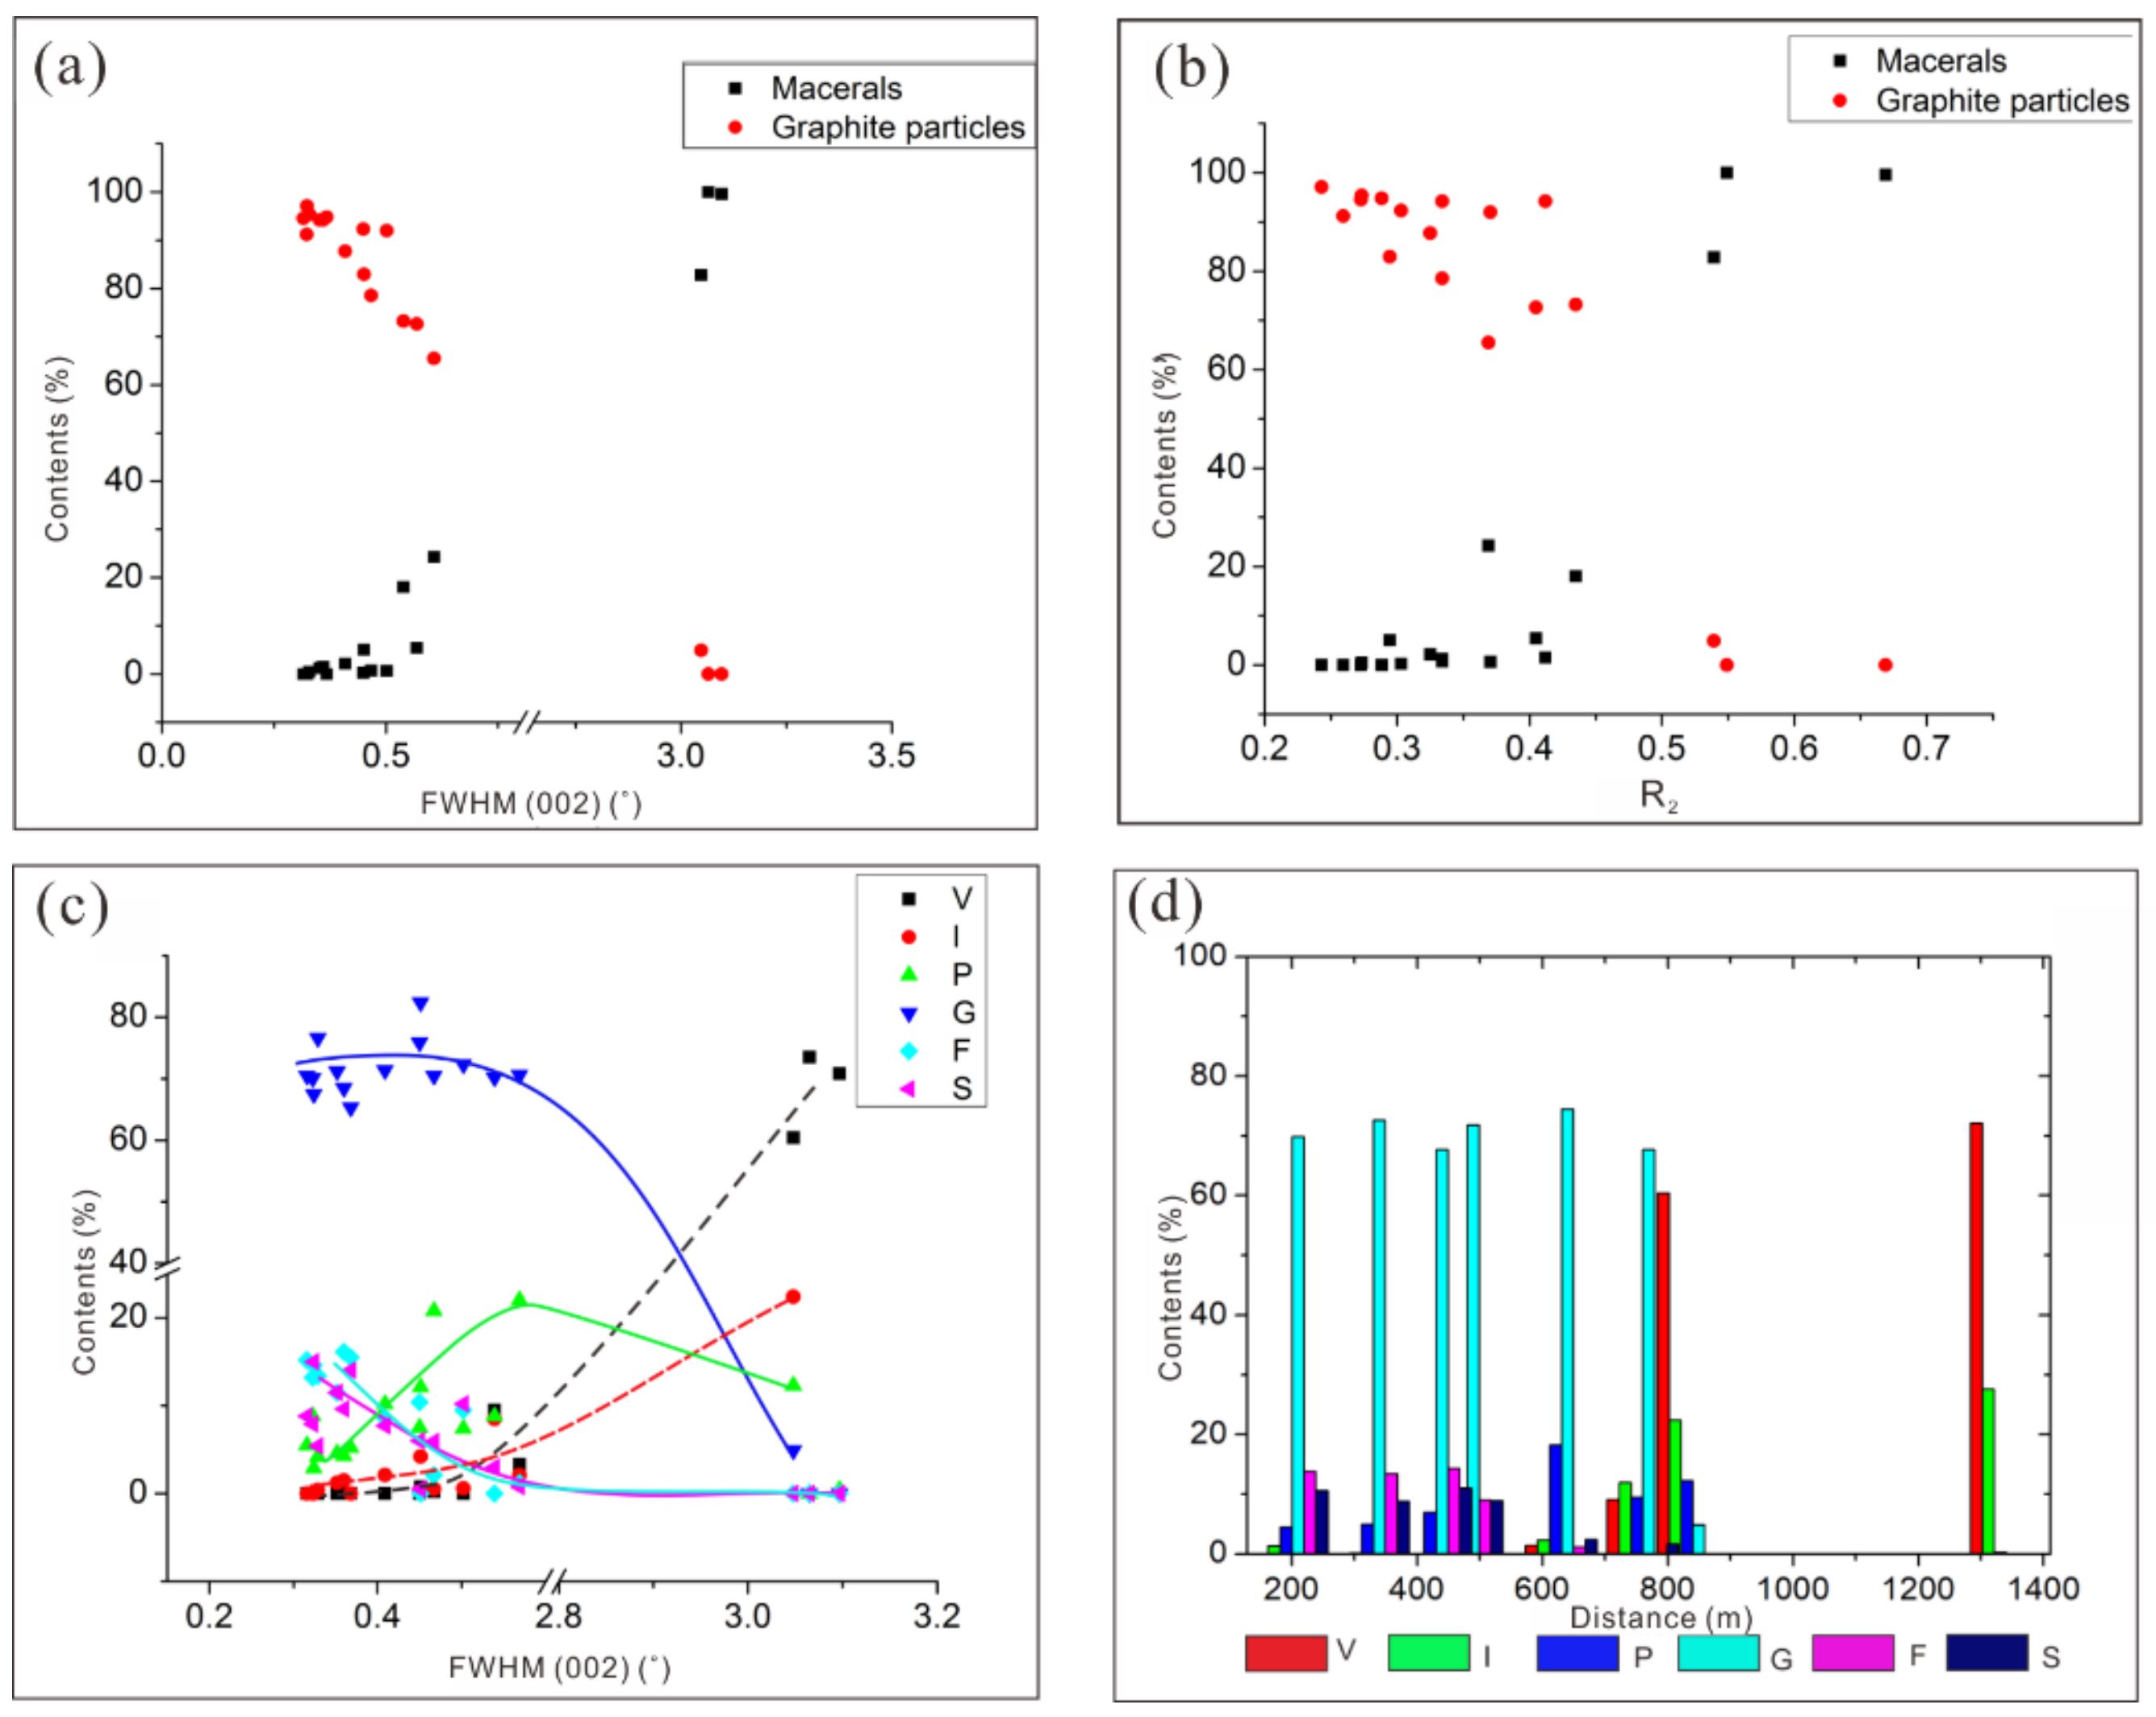
The graphitization rate of carbonaceous matter is determined by the strength of cross-links in the carbon structure and the orientation of macromolecules [22,27]. The graphitization degree depends on the microstructural content [11,18]. Coal macerals evolve at different rates because of different chemical compositions and molecular structures. Inertinite, with a higher O/C ratio and low anisotropy (poor orientation of macromolecules), is less graphitizable and only slowly graphitized. Vitrinite is characterized by a relatively low O/C ratio and strong anisotropy, revealing the presence of weak cross-links in aromatic rings that develop a high degree of parallelism in macromolecules that allow vitrinite to easily and quickly graphitize [25]. In the investigated CBG, inertinite dominated over vitrinite (Table 3). Vitrinite was not present in the highly graphitized sample F1-1, whereas remnant inertinite (fusinite) was recognized, coexisting with granular graphite particles (Figure 3i). Granular particles dominated in sample F5-2; in contrast, coal macerals were the main components in sample B8-1, where the interlayer spacing d002 indicated poor graphitization.
With decreasing FWHM (002) and R2, the content of coal macerals decreased and the content of graphite-like particles increased (Figure 6a,b). As FWHM (002) decreased, coal maceral content decreased, granular particle and pyrolytic carbon content increased, and granular particle content remained almost unchanged as the crystallization degree improved; however, pyrolytic carbon diminished. Flake and silk-like graphite content increased (Figure 6c). It is thought that different types of microstructures reflect different degrees of crystallization; flakes and silk-like graphite are highly crystallized, showing strong anisotropy, while granular particles and pyrolytic carbon is relatively poorly crystallized. Flakes and silk-like graphite probably originate from pyrolytic carbon [26,59,60].
Differences in graphitization rate between coal macerals and the degree of structural ordering resulted in the coexistence of coal macerals, pyrolytic carbons, and graphite-like particles [25,27]. Microstructure content varied with the distance to the intrusion (Figure 6d). When the distance was further than 800 m away from the intrusion, coal macerals predominated in microstructures, while when the distance was lower than 800 m, graphite-like particles and pyrolytic carbons were the majority, and coal macerals in the minority.
5.2. Different Graphitization Degree Caused by Deformation
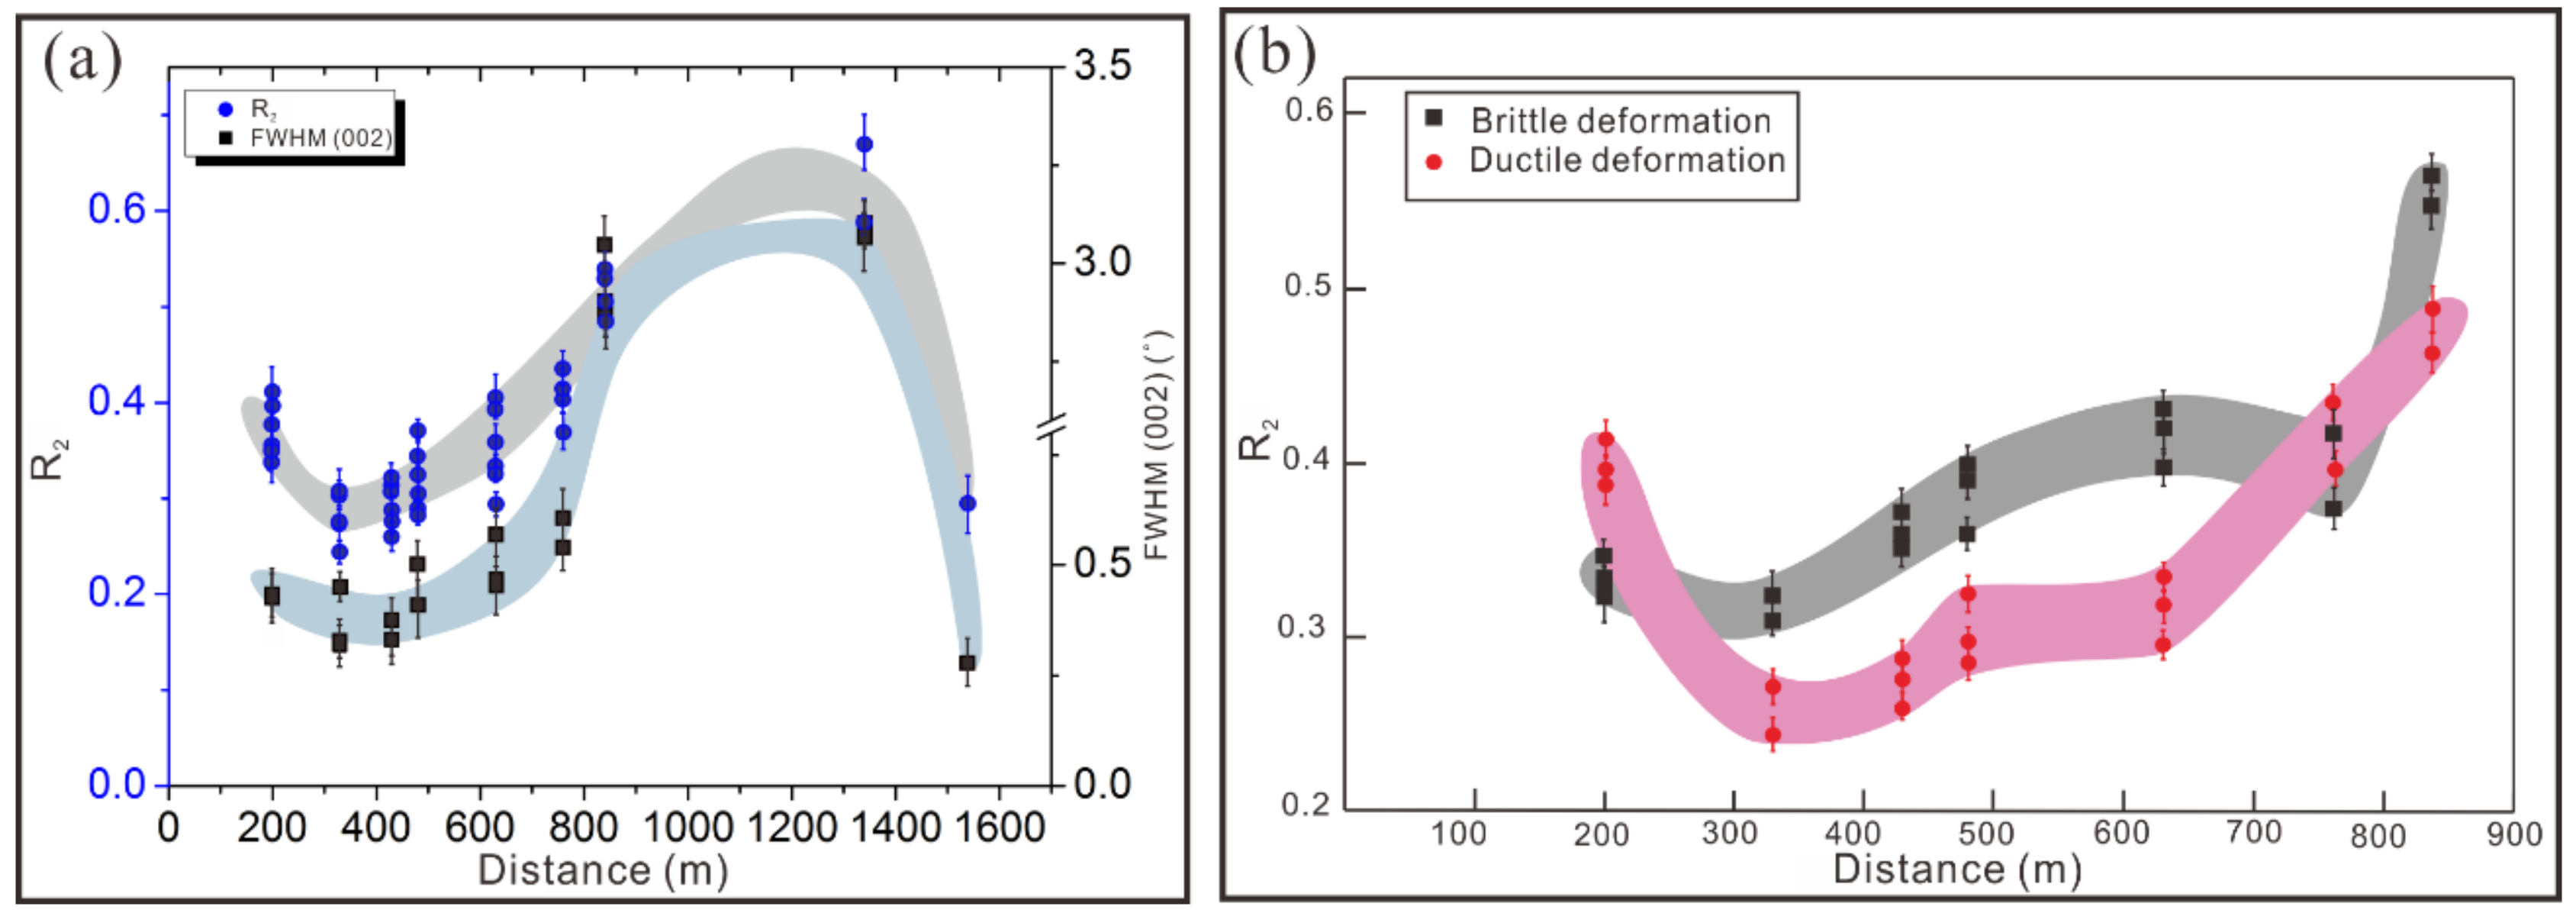
The metamorphic temperature was higher when the distance was closer to the intrusion and the graphitization degree was higher, as shown by the interlayer spacing d002 and R2. FWHM (002) and R2 showed nonlinear variations with distance from the intrusion (Figure 7a). At a distance of about 300–1400 m, the FWHM (002) and R2 revealed that the graphitization degree rose when nearing the intrusion. However, the FWHM (002) and R2 values of samples adjacent to the intrusion (<300 m) increased and the graphitization degree decreased. The well-graphitized sample D60, furthest from the intrusion, had low FWHM (002) and R2 values. Thus, the graphitization degree of coal did not change linearly with distance from the intrusion but showed a continuous trend.
Previous work has demonstrated that tectonic stress plays a vital role in graphitization of carbonaceous matter [30,31,34,35,36,58,59,60,61,62]. Due to thermodynamic conditions, coalification and graphitization are influenced by deformation, which leads to different rates and degrees of graphitization for coal [63,64,65,66,67,68,69,70,71]. Wilks et al. [31] proved that coal is not graphitized under coaxial deformation, but graphitization occurs under shear deformation. Tectonic stress not only results in coal deformation, but also affects coal macromolecules; a slow strain rate in ductile deformation may provide enough time for stress to promote the rearrangement of macromolecules and reduce the disorder degree [71].
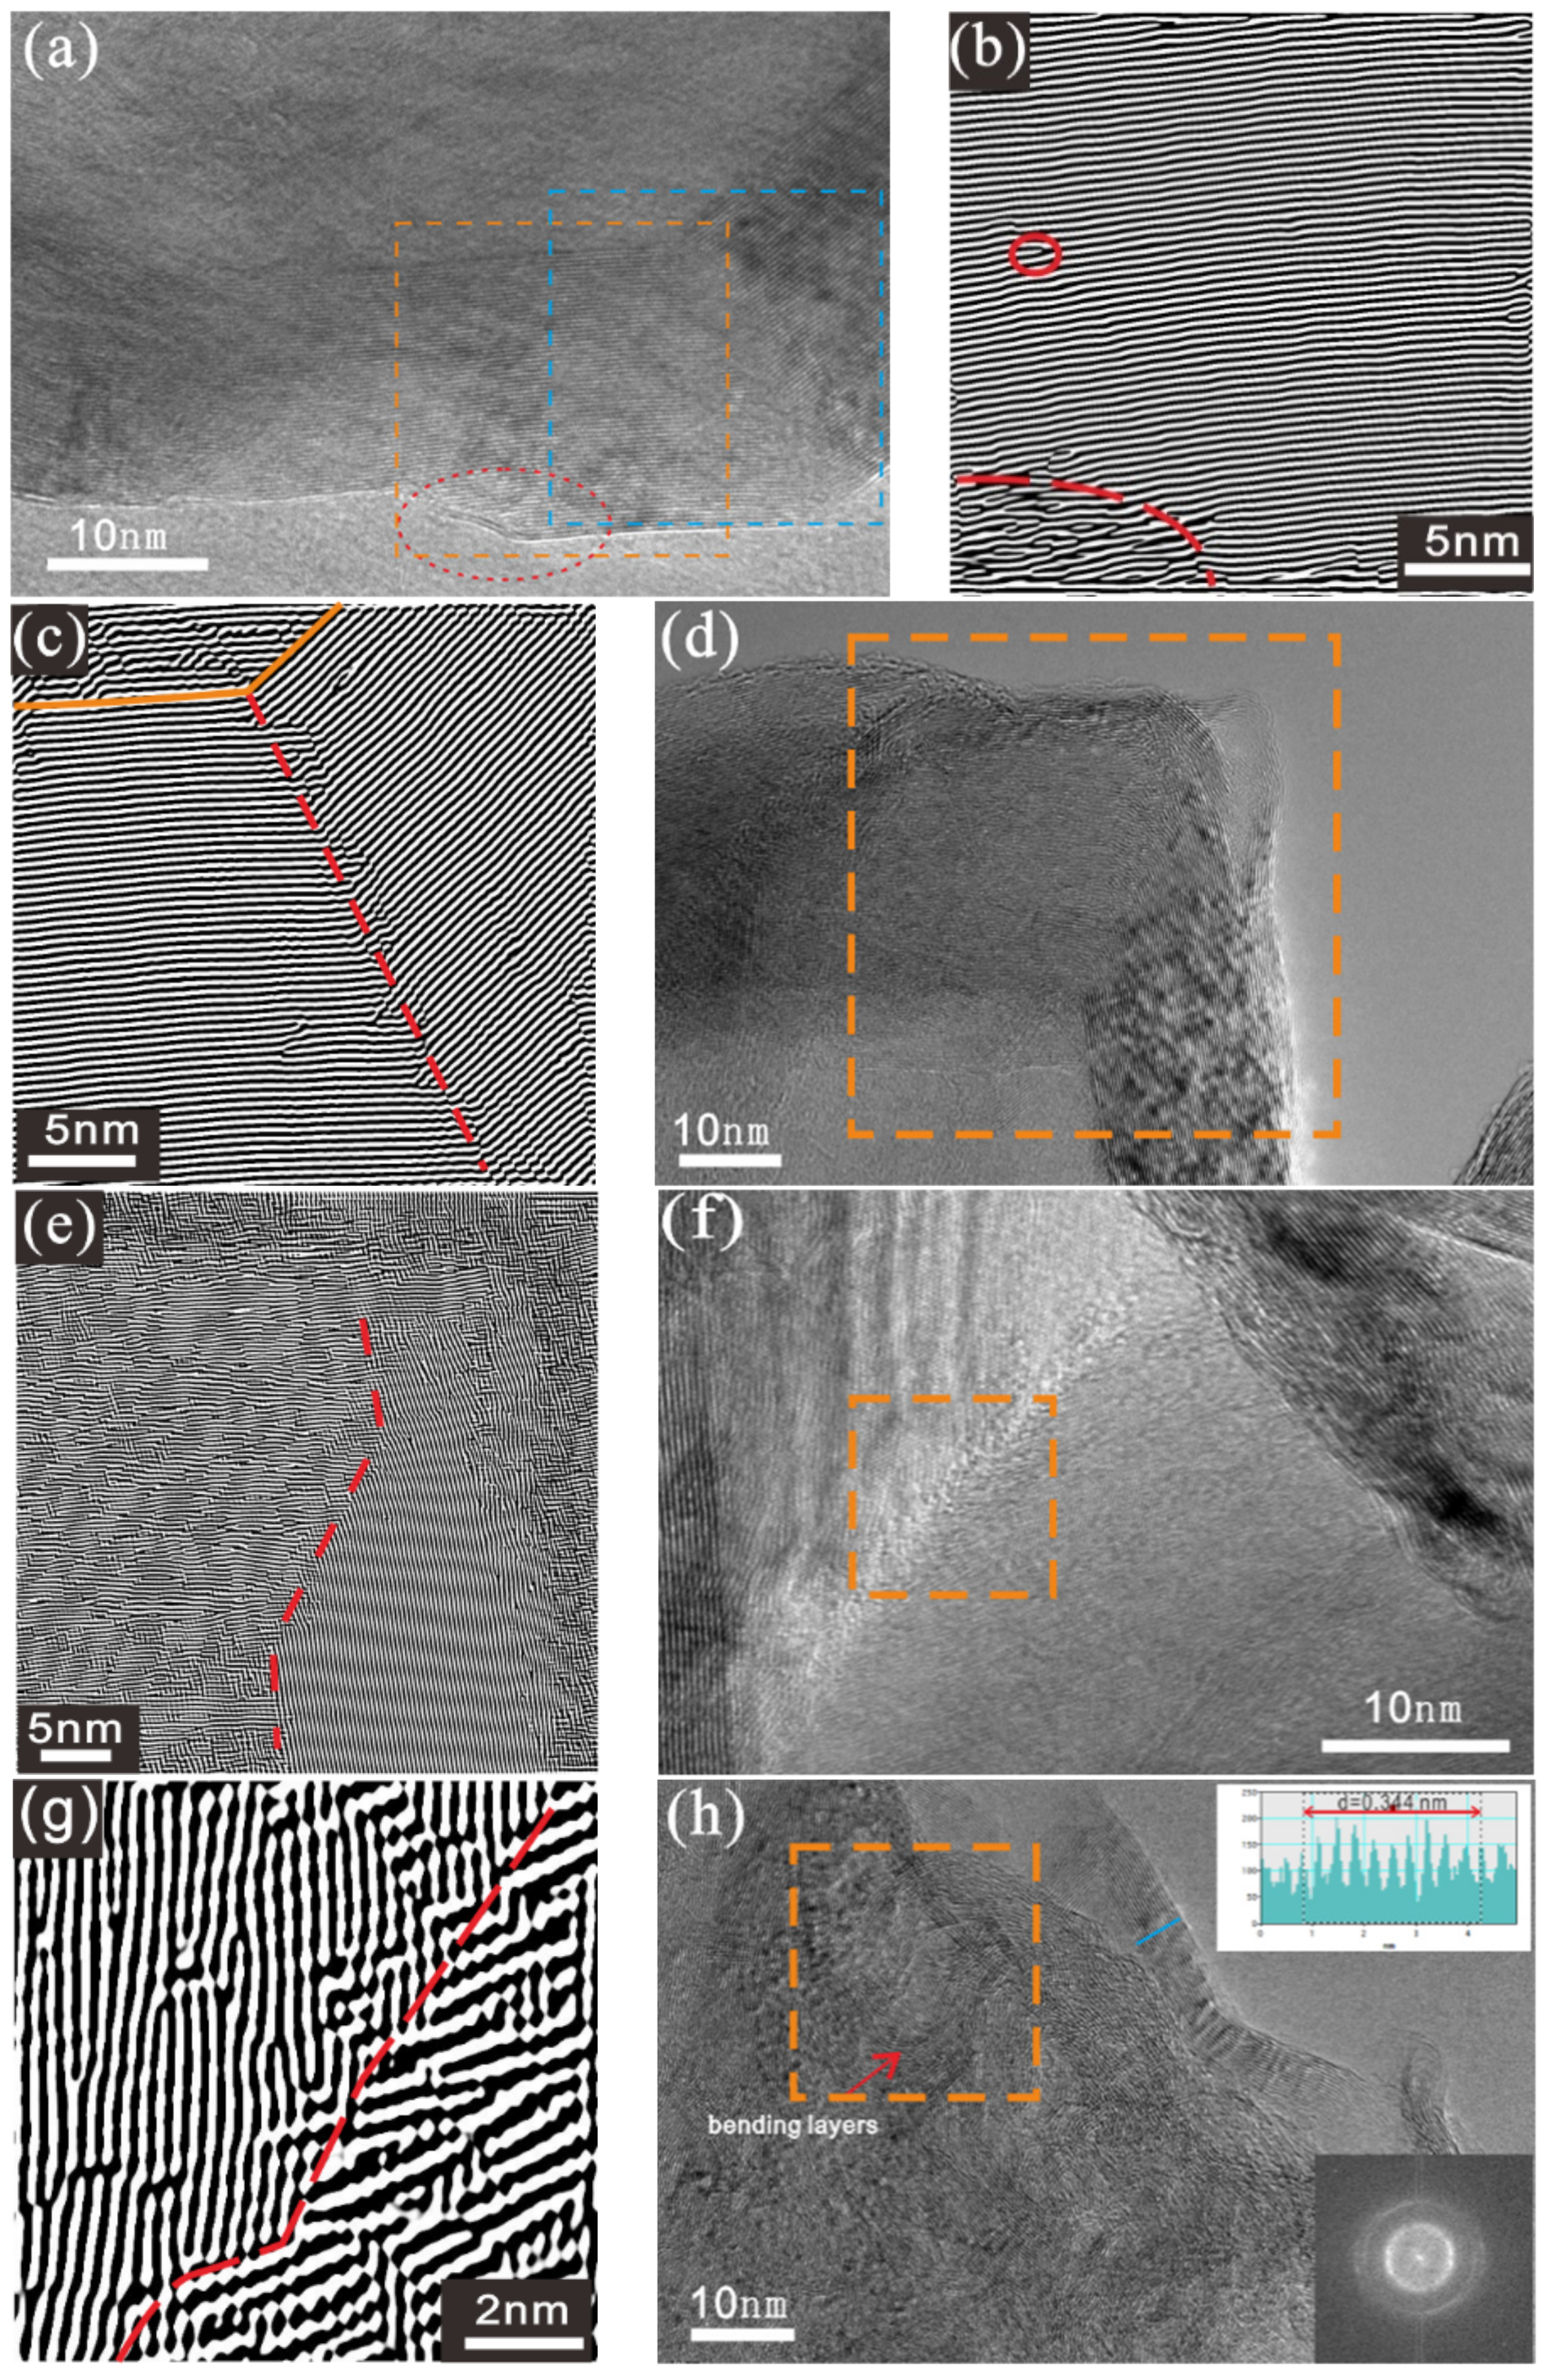
As revealed by the R2 values of different deformed samples occurring further than 300 m from the intrusion, ductile deformed samples were more ordered than brittle deformed samples, with the exception of samples at 840 m from the intrusion (Figure 7b). This may be related to the complex deformation environments at the hinge zone of the LS syncline. Samples at different distances from the intrusion developed similar graphitization degrees due to the effects of deformation; for example, sample F5-1 (630 m away from the intrusion) and sample B2-1 (330 m away from the intrusion) had similar R2 values. Moreover, X-ray diffraction and Raman analyses of sample D60, which was furthest from the intrusion and formed in a shear zone (Figure 1f), indicated that sample D60 developed a large crystallite size with few structural defects and had a similar graphitization degree to sample B2-1 (330 m from intrusion). The average lattice spacing obtained from the lattice intensity profile along the line was 0.3372 nm (Figure 5b), consistent with the result of the X-ray diffraction analysis. The FFT image of the ROI showed clear and symmetric diffraction spots against weak and diffuse rings, indicative of crystalline structure (Figure 5b). Despite sample D60 being less affected by the heat of intrusion (T < 400 °C), it was strongly deformed due to shear stress. Comparing with the poorly graphitized samples B8-1 and B82, the experimental results indicated that sample D60 had been highly graphitized. As a result, deformation led to graphitization of coal at a lower temperature. Graphitization may occur as a result of tectonic activities, such as seismogenic fault motion [72]. In nature, coals formed in the hinge zones of folds or ductile-shear zones tend to develop higher degrees of graphitization [67,72].
Samples B1-1 and F1-1 were closest to the intrusion; nevertheless, their R2 values were not the minimum. The second-order Raman spectra of samples B1-1 and B2-1 showed that sample B1-1 had a lower degree of stacking order along the c direction [66]. The length and height of carbon layers in samples B1-1 and F1-1 were shorter than those in samples B2-1 and F2-1, suggesting that the continuity of carbon layers was affected (Table 3) [65,73,74,75]. Brittle deformed sample B1-1 exhibited interlayer delamination and stacking defects (Figure 5c,d). Carbon layers slipped along the basal plane within graphite crystallites, resulting in a decrease in crystallinity and the generation of structural defects [75,76]. Owing to the dislocation that was normal to the (002) plane, arc bending of the stacking layers as a fan-shape was observed in sample F1-1 (Figure 5e). The FFT image of the ROI exhibited three groups of symmetric diffraction spots, which were indicative of carbon layers extending along three directions because of the bending layers (Figure 5e). The bending of carbon layers with different extending directions was probably responsible for the undulatory extinction of the flakes. In summary, different deformations, such as delamination in the stacking and bending of carbon layers or other deformations, occurred in the nanostructures.
5.3. Graphitization Induced by Deformation
Deformation has a marked effect not only on the amorphization of crystallite, but also on the ordering of the disordered structure [30,31,32,77]. Bustin et al. [31] proposed a model of graphitization under simple shear where BSUs gradually reorient and interconnect with each other to form larger carbon sheets with increasing shear strain. The pores experience flattening, polygonization, and coalescence to form three-dimensionally ordered graphite [47,78,79,80]. The model reflects the restriction of shear stress on the orientation of BSUs, namely that randomly oriented BSUs are reoriented uniformly along a preferred direction of shear stress. Deformation and crystallization could occur at the same time, as in the dynamic recrystallization of minerals induced by ductile deformation. In order to eliminate structural defects of minerals, there are two concurrent processes: one is the generation and accumulation of dislocations, and the other is the rearrangement and annihilation of lattice defects during deformation [35,81,82,83]. Regarding CBG, graphitization of coal is also an extinction process for structural defects [73,75,79]. Lattice deformation, dislocations [84], and bending caused by ductile deformation [66,67] are found in ductile deformed CBG. Hence, a possible graphitization mechanism is referred to as strain-induced graphitization. The essence of graphitization is the motion and reorganization of dislocations induced by ductile deformation in order to form a graphite structure with few defects.
The coalescence and polygonization of pores are caused by stress. The local stress concentration leads carbon layers to curve and randomly distributed dislocations to move and reorganize, forming dislocation walls correspondingly with the appearance of edges at the rim of bending layers, after which, the polygonized structure is formed. The HRTEM and IFFT images of sample D60 (Figure 8a,b) exhibited few dislocations inside the polygonized structure, while several incomplete carbon layers were observed outside, which can probably be explained by the motion of dislocations from inside to outside to remove the internal defects of the graphite structure. The effect of strain on the breaking and rotation of chemical bonds allows for the motion of dislocations [28,71,85]. The outer incomplete carbon layers were presumably responsible for the appearance of the D2 band in the Raman spectrum, which was related to the edge defect. A clear dislocation wall composed of regularly arranged defects is shown in Figure 8c. With the growth of crystallites, as well as the removal of structural defects and stiffness of carbon layers, R2 values steadily declined.
Graphitization can occur as a consequence of the motion of dislocation between two neighboring local molecular orientations (LMOs) that develop different degrees of structural order and orientation. In ductile deformed samples F4-1 and D60, the interface of two LMOs with different degrees of structural order and orientation formed as a grain boundary (Figure 8d,f), where both defects and stress were concentrated. Due to the difference in the structural defect density and strain energy of the two LMOs, the grain boundary moved toward the LMO with a high defect density, causing an irregular sinuous grain boundary, as shown in the IFFT image (Figure 8e,g). While grain boundaries progressively moved and modulate, neighboring LMOs connected each other along the same direction, forming a long-range ordered graphite structure. As a result, strain-induced graphitization mainly presented two aspects where, on one hand, it promoted preferred orientation and the rearrangement of BSUs, and on the other hand, it favored the motion and modulation of structural defects in order to produce a highly ordered graphite structure.
Owing to non-uniform stresses, local stress concentrations often result in the local development of the graphite structure and is perhaps the main reason for different graphitization degrees of graphite-like particles [18,83]. In sample B7-1, long and straight carbon layers were shown in the HRTEM image. The lattice intensity profile along the line indicated that the average lattice spacing was 0.344 nm, while La and Lc values were both larger than 10 nm (Figure 8h). However, randomly oriented and bending carbon layers were also found beside straight layers, which agreed well with an asymmetric (002) peak in the X-ray diffraction profile of sample B7-1 (Figure 2b), indicating the coexistence of a graphite structure and turbostratic structure [53]. At the microscale, coal macerals dominated in B7-1 with a few granular particles and pyrolytic carbons. Since the internal stress induces a local stress concentration, which breaks the cross-links between BSUs, a locally ordered structure is produced [86]. As the degree of structural ordering gradually increases, silk-like graphite and flakes will steadily generate and spread throughout the structure and increase crystallinity, which corresponds to the enhancement in graphitization degree of the whole sample.
In summary, local stress concentrations due to the non-uniform stress in ductile deformation led to preferred orientations of BSUs, as well as the motion, modulation, and reorganization of structural defects to form an ordered structure. As the graphite structure progressively expanded, graphitization degree was enhanced as a whole.
6. Conclusions
Coal macerals are graphitized at different rates, producing different graphite-like particles with various degrees of crystallization. Tectonic deformation affects the graphitization, which causes different graphitization degrees of coal and a discontinuous distribution of CBG. This indicates that coals are graphitized with different graphitization degrees at the same position or that CBG with a similar graphitization degree occurs in different locations, meaning that the distribution of CBG is spatially discontinuous.
Tectonic deformation has an effect on the amorphization of crystallites and also leads to the graphitization of coal at low temperatures. A possible graphitization mechanism is strain-induced graphitization, which is similar to lattice deformation and recrystallization in the ductile deformation of minerals. In this mechanism, the local stress concentration promotes the preferred orientations of local BSUs and the motion and rearrangement of structural defects, leading to the gradual expansion of locally ordered structure into the whole sample, producing CBG as a result.
Supplementary Materials
The following are available online at https://0-www-mdpi-com.brum.beds.ac.uk/2075-163X/9/10/617/s1. Table S1: Raman spectra parameters of different deformed samples away from the intrusion.
Author Contributions
Software, Y.P. and Z.D.; writing—original draft, L.W. and D.C.; supervision, D.C.; formal analysis, L.W.; data curation, Y.L.
Funding
This research was supported by the National Natural Science Foundation of China (No. 41772156).
Acknowledgments
Special thanks are given to Yingke Wu for the sample collection and Huimin Hou for petrographic analysis. We are also particularly grateful for the editors and two anonymous reviewers for providing useful suggestions and comments on the manuscript.
Conflicts of Interest
The authors declare no conflict of interest.
References
- Cui, N.; Sun, L.; Bagas, L.; Xiao, K.Y.; Xia, J.S. Geological characteristics and analysis of known and undiscovered graphite resources of China. Ore Geol. Rev. 2017, 91, 1119–1129. [Google Scholar] [CrossRef]
- Sun, L.; Xu, C.P.; Xiao, K.Y.; Zhu, Y.S.; Yan, L.Y. Geological characteristics, metallogenic regularities and the exploration of graphite deposits in China. China Geol. 2018, 3, 425–434. [Google Scholar] [CrossRef]
- Cao, D.Y.; Zhang, H.; Dong, Y.J.; Yang, C.W. Nanoscale Microscopic Features and Evolution Sequence of Coal-Based Graphite. J. Nanosci. Nanotechnol. 2017, 17, 6276–6283. [Google Scholar] [CrossRef]
- Wang, L.; Dong, Y.J.; Zhang, H.; Cao, D.Y. Factors affecting graphitization of coal and the experimental validation. J. Min. Sci. Technol. 2018, 3, 9–19. [Google Scholar]
- Beyssac, O.; Rumble, D. Graphitic carbon: A Ubiquitous, Diverse, and Useful Geomaterial. Elements 2014, 10, 415–420. [Google Scholar] [CrossRef]
- Seehra, M.S.; Pavlovic, A.S.; Babu, V.S.; Zondlo, J.W.; Stansberry, P.G.; Stiller, A.H. Measurements and control of anisotropy in ten coal-based graphites. Carbon 1994, 32, 431–435. [Google Scholar] [CrossRef]
- Seehra, M.S.; Pavlovic, A.S. X-Ray diffraction, thermal expansion, electrical conductivity, and optical microscopy studies of coal-based graphites. Carbon 1993, 31, 557–564. [Google Scholar] [CrossRef]
- González, D.; Montes-Moran, M.A.; García, A.B. Influence of inherent coal mineral matter on the structural characteristics of graphite materials prepared from anthracites. Energy Fuels 2005, 19, 263–269. [Google Scholar] [CrossRef]
- Rantitsch, G.; Grogger, W.; Teichert, C.; Ebner, F.; Hofer, C.; Maurer, E.M.; Schaffer, B.; Toth, M. Conversion of carbonaceous material to graphite within the greywacke zone of the eastern Alps. Int. J. Earth Sci. 2004, 93, 959–973. [Google Scholar] [CrossRef]
- Marques, M.; Suárez-Ruiz, I.; Flores, D.; Guedes, A.; Rodrigues, S. Correlation between optical, chemical and micro-structural parameters of high-rank coals and graphite. Int. J. Coal Geol. 2009, 77, 377–382. [Google Scholar] [CrossRef]
- Li, K.; Rimmer, S.M.; Liu, F. Geochemical and petrographic analysis of graphitized coals from Central Hunan. China. Int. J. Coal Geol. 2018, 195, 267–279. [Google Scholar] [CrossRef]
- Oberlin, A. Carbonization and graphitization. Carbon 1984, 22, 521–541. [Google Scholar] [CrossRef]
- Bonijoly, M.; Oberlin, M.; Oberlin, A. A possible mechanism for natural graphite formation. Int. J. Coal Geol. 1982, 1, 283–312. [Google Scholar] [CrossRef]
- Deurbergue, A.; Oberlin, A.; Oh, J.H.; Rouzaud, J.N. Graphitization of Korean anthracites as studied by transmission electron microscopy and X-ray diffraction. Int. J. Coal Geol. 1987, 8, 375–393. [Google Scholar] [CrossRef]
- Nyathi, M.S.; Clifford, C.B.; Schobert, H.H. Characterization of graphitic materials prepared from different rank Pennsylvania anthracites. Fuel 2013, 114, 244–250. [Google Scholar] [CrossRef]
- Buseck, P.R.; Beyssac, O. From organic matter to graphite: Graphitization. Elements 2014, 10, 421–426. [Google Scholar] [CrossRef]
- Rantitsch, G.; Lammerer, W.; Fisslthaler, E.; Mitsche, S.; Kaltenbock, H. On the discrimination of semi-graphite and graphite by Raman spectroscopy. Int. J. Coal Geol. 2016, 159, 48–56. [Google Scholar] [CrossRef]
- Rodrigues, S.; Suárez-Ruiz, I.; Marques, M.; Flores, D.; Camean, I.; Garcia, A.B. Development of graphite-like particles from the high temperature treatment of carbonized anthracites. Int. J. Coal Geol. 2011, 85, 219–226. [Google Scholar] [CrossRef]
- Rodrigues, S.; Marques, M.; Sua´rezRuiz, I.; Camean, I.; Flores, D.; Kwiecinska, B. Microstructural investigations of natural and synthetic graphites and semi-graphites. Int. J. Coal Geol. 2013, 111, 67–79. [Google Scholar] [CrossRef]
- Sua´rez-Ruiz, I.; Garcı´a, A.B. Optical parameters as a tool to study the microstructural evolution of carbonized anthracites during high-temperature treatment. Energy Fuels 2007, 21, 2935–2941. [Google Scholar] [CrossRef]
- Zheng, Z.; Zhang, J.; Huang, J. Observations of microstructure and reflectivity of coal graphites for two locations in China. Int. J. Coal Geol. 1996, 30, 277–284. [Google Scholar] [CrossRef]
- Oberlin, A. High-Resilution TEM Studies of Carbonization and Graphitization. In In Chemisty and Physics of Carbon; Thrower, P.A., Ed.; Marcel Dekker: New York, NY, USA, 1989; Volume 22, pp. 1–143. [Google Scholar]
- Landis, C.A. Graphitization of dispersed carbonaceous material in metamorphic rocks. Contrib. Mineral. Petrol. 1971, 30, 34–45. [Google Scholar] [CrossRef]
- Inagaki, M.; Kaburagi, Y.; Hishiyama, Y. Thermal Management Material: Graphite. Adv. Eng. Mater. 2014, 16, 494–506. [Google Scholar] [CrossRef]
- Diessel, C.F.K.; Brothers, R.N.; Black, P.M. Coalification and graphitization in high-pressure schists in New Caledonia. Contrib. Mineral. Petrol. 1978, 68, 63–78. [Google Scholar] [CrossRef]
- Diessel, C.F.K.; Offler, R. Change in physical properties of coalifiled and graphitised phytoclasts with grade of metamorphism. N. Jb. Mineral. Mh. 1975, 1, 11–26. [Google Scholar]
- Křibek, B.; Hrabal, J.; Landais, P.; HLADÍKOVÁ, J. The association of poorly ordered graphite, coke and bitumens in greenschist facies rocks of the poniklá group, lugicum, Czech Republic: the result of graphitization of various types of carbonaceous matter. J. Metamorph. Geol. 1994, 12, 11. [Google Scholar] [CrossRef]
- Han, Y.; Xu, R.; Hou, Q.; Wang, J.; Pan, J. Deformation Mechanisms and Macromolecular Structure Response of Anthracite under Different Stress. Energy Fuel 2016, 30, 975–983. [Google Scholar] [CrossRef]
- Song, Y.; Jiang, B.; Qu, M. Macromolecular evolution and structural defects in tectonically deformed coals. Fule 2019, 236, 1432–1445. [Google Scholar] [CrossRef]
- Wilks, K.R.; Mastalerz, M.; Bustin, R.M.; Ross, J.V. The role of shear strain in the graphitization of a high-volatile bituminous and an anthracitic coal. Int. J. Coal Geol. 1993, 22, 247–277. [Google Scholar] [CrossRef]
- Bustin, R.M.; Rouzaud, J.N.; Ross, J.V. Natural graphitization of anthracite: experimental considerations. Carbon 1995, 33, 679–691. [Google Scholar] [CrossRef]
- Ross, J.V.; Bustin, R.M. The role of strain energy in creep graphitization of anthracite. Nature 1990, 343, 58–60. [Google Scholar] [CrossRef]
- Buseck, P.R.; Huang, B.J. Conversion of carbonaceous material to graphite during metamorphism. Geochim. Cosmochim. Acta. 1985, 49, 2003–2016. [Google Scholar] [CrossRef]
- Kuo, L.W.; Huang, J.R.; Fang, J.N.; Si, J.L.; Li, H.B.; Song, S.R. Carbonaceous materials in the fault zone of the Longmenshan fault belt: 1. Signatures within the deep Wenchuan earthquake fault zone and their implications. Minerals 2018, 8, 385. [Google Scholar] [CrossRef]
- Kuo, L.W.; Huang, J.R.; Fang, J.N.; Si, J.L.; Song, S.R.; Li, H.B.; Yeh, E.C. Carbonaceous materials in the fault zone of the Longmenshan fault belt: 2. Charaterization of fault gouge from deep drilling and implications for fault maturity. Minerals 2018, 8, 393. [Google Scholar] [CrossRef]
- Si, J.L.; Li, H.B.; Kuo, L.W.; Huang, J.R.; Song, S.R.; Pei, J.L.; Wang, H.; Song, L.; Fang, J.N.; Sheu, H.S. Carbonaceous materials in the Longmenshan fault belt zone: 3. Records of seismic slip from the trench and implications for faulting mechanisms. Minerals 2018, 8, 457. [Google Scholar] [CrossRef]
- Poliak, E.I.; Jonas, J.J. A one-parameter approach to determining the critical conditions for the initiation of dynamic recrystallization. Acta Mater. 1996, 44, 127–136. [Google Scholar] [CrossRef]
- Sakai, T.; Belyakov, A.; Kaibyshev, R.; Miura., H.; Jonas, J.J. Dynamic and post-dynamic recrystallization under hot, cold and severe plastic deformation conditions. Prog. Mater. Sci. 2014, 60, 130–207. [Google Scholar] [CrossRef]
- Tullis, J.; Yund, R.A. Dynamic recrystallization of feldspar: a mechanism for ductile shear zone formation. Geology 1985, 13, 238–241. [Google Scholar] [CrossRef]
- Huang, J.Z.; Liu, Y.R.; Wu, G.Y.; Ma, T.Q.; Wang, X.H. Framework of Mesozoic tectonic evolution in southeastern Hunan and the Hunan-Guangdong-Jiangxi border area. Chin. Geol. 2005, 4, 33–46. [Google Scholar]
- Zhu, J.C.; Wang, R.C.; Zhang, P.H.; Xie, C.F.; Zhang, W.L.; Zhao, K.D.; Xie, L.; Yang, C.; Che, X.D.; Yu, A.P.; et al. Zircon U-Pb geochronological framework of Qitianling granite batholith, middle part of Nanling Range, South China. Sci. China Ser. D Earth Sci. 2009, 52, 1279–1294. [Google Scholar] [CrossRef]
- Li, C.; Wang, D.H.; Zhou, L.M.; Zhao, H.; Li, X.W.; Qu, W.J. Study on the Re-Os isotope in graphite of Lutang graphite deposit Hunan. Rock Miner. Anal. 2017, 36, 297–304. [Google Scholar]
- Shao, Z.F.; Che, Q.J. Geological characteristics of HEYE graphite deposit of Guiyang country. Hunan Geol. 1988, 7, 25–30. [Google Scholar]
- Ju, Y.W.; Lin, H.; Li, X.S.; Fan, J.J. Tectonic deformation and dynamic metamorphism of coal. Front. Earth Sci. 2009, 16, 158–166. [Google Scholar]
- Tagiri, M. A measurement of the graphitizing-degree by the X-ray powder diffractometer. J. Mineral. Petrol. Econ. Geol. 1981, 76, 345–352. [Google Scholar] [CrossRef]
- Vidano, R.; Fischbach, D.B. Cheminform abstract: new lines in the Raman spectra of carbons and graphite. Chem. Inf. 1978, 9, 9. [Google Scholar] [CrossRef]
- Beyssac, O.; Bruno, G.; Petitet, J.P.; Froigneux, E.; Moreau, M.; Rouzaud.Moreau, J.-N. On the characterization of disordered and heterogeneous carbonaceous materials by raman spectroscopy. Spectrochim. Acta Part A Mol. Biomol. Spectrosc. 2003, 59, 2267–2276. [Google Scholar] [CrossRef]
- Su, X.; Si, Q.; Song, J. Characteristics of coal Raman spectrum. J. China Coal Soc. 2016, 41, 1197–1202. [Google Scholar]
- Potgieter-Vermaak, S.; Maledi, N.; Wagner, N.; Heerden, J.H.; Grieken, R.V.; Potgieter, J.H. Raman spectroscopy for the analysis of coal: a review. J. Raman Spectrosc. 2015, 42, 123–129. [Google Scholar] [CrossRef]
- Sonibare, O.O.; Haeger, T.; Foley, S.F. Structural characterization of Nigerian coals by X-ray diffraction, Raman and FTIR spectroscopy. Energy 2010, 35, 5347–5353. [Google Scholar] [CrossRef]
- Quirico, E.; Rouzaud, J.N.; Bonal, L.; Montagnac, G. Maturation grade of coals as revealed by raman spectroscopy: progress and problems. Spectrochim. Acta Part A Mol. Biomol. Spectrosc. 2005, 61, 2368–2377. [Google Scholar] [CrossRef]
- Kwiecińska, B.; Petersen, H.I. Graphite, semi-graphite, natural coke, and natural char classification—ICCP system. Int. J. Coal Geol. 2004, 57, 99–116. [Google Scholar] [CrossRef]
- Okabe, K.; Shiraishi, S.; Oya., A. Mechanism of heterogeneous graphitization observed in phenolic resin-derived thin carbon fibers heated at 3000 °C. Carbon 2004, 42, 667–669. [Google Scholar] [CrossRef]
- Presswood, S.M.; Rimmer, S.M.; Anderson, K.B.; Filiberto, J. Geochemical and petrographic alteration of rapidly heated coals from the herrin (No. 6) coal seam, illinois basin. Int. J. Coal Geol. 2016, 165, 243–256. [Google Scholar] [CrossRef]
- Rimmer, S.M.; Crelling, J.C.; Yoksoulian, L.E. An occurrence of coked bitumen, Raton Formation, Purgatoire River Valley, Colorado, U.S.A. Int. J. Coal Geol. 2015, 141–142, 63–73. [Google Scholar] [CrossRef]
- Taylor, G.; Teichmüller, M.; Davis, A.; Diessel, G.F.K.; Littke, R.; Robert, P. Organic Petrology; Gebruder Borntraeger: Berlin, Germany, 1998; pp. 162–174. [Google Scholar]
- Pimenta, M.A.; Dresselhaus, G.; Dresselhaus, M.S.; Cancado, L.G.; Jorio, A.; Saito, R. Studying disorder in graphite-based systems by raman spectroscopy. Phys. Chem. Chem. Phys. 2007, 9, 1276–1290. [Google Scholar] [CrossRef] [PubMed]
- Angoni, K. Remarks on the structure of carbon materials on the basis of Raman spectra. Carbon 1993, 31, 537–547. [Google Scholar] [CrossRef]
- Okuyama-Kusunose, Y. Metamorphism of carbonaceous material in the tono contact aureole, Kitakami Mountains, Japan. J. Metamorph. Geol. 1987, 5, 121–139. [Google Scholar]
- Gonza´lez, D.; Montes-Mora´n, M.A.; Garcia, A.B. Graphite materials prepared from an anthracite: A structural characterization. Energy Fuels 2003, 17, 1324–1329. [Google Scholar]
- Pusz, S.; Borrego, A.G.; Alvarez, D.; Camean, I.D.; Cann, V.; Duber, S.; Kalkreuth, W.; Komorek, J.; Kus, J.; Kwiecińska, B.K.; et al. Applicationof reflectance parameters in the estimation of the structural order of coals and carbo-naceous materials. Precision and bias of measurements derived from the ICCP structural working group. Int. J. Coal Geol. 2014, 131, 147–161. [Google Scholar] [CrossRef]
- Stach, E.; Mackowsky, M.-H.; Teichmüller, M.; Taylor, G.H.; Chandra, D.; Teichmüller, R. Stach’s Textbook of Coal Petrology; Gebruder Borntraeger: Berlin, Germany, 1982. [Google Scholar]
- González, D.; Montes-Morán, M.A.; Young, R.J.; Garcia, A.B. Effect of temperature on the graphitization process of a semianthracite. Fuel Process. Technol. 2002, 79, 245–250. [Google Scholar] [CrossRef]
- Kribek, B.; Sykorova, I.; Machovic, V.; Laufek, F. Graphitization of organic matter and fluid-deposited graphite in Palaeoproterozoic (Birimian) black shales of the Kaya-Goren greenstone belt (Burkina Faso, West Africa). J. Metamorph. Geol. 2008, 26, 937–958. [Google Scholar] [CrossRef]
- Crespo, F.E.; Rodas, M. Influence of grinding on graphite crystallinity from experimental and natural data: implications for graphite thermometry and sample preparation. Mineral. Mag. 2006, 70, 697–707. [Google Scholar] [CrossRef] [Green Version]
- Inagaki, M.I. Natural graphite-experimental evidence for its formation and novel applications. Earth Sci. Front. 2005, 12, 171–181. [Google Scholar]
- Bustin, R.M. The effect of shearing on quality of some coals in the southeastern Canadian Cordillera. Can. Inst. Min. Metall. Pet. 1982, 75, 76–83. [Google Scholar]
- Pan, J.N.; Hou, Q.L.; Ju, Y.W.; Bai, H.L.; Zhao, Y.Q. Coalbed methane sorption related to coal deformation structures at different temperatures and pressures. Fuel 2012, 102, 760–765. [Google Scholar] [CrossRef]
- Pan, J.N.; Wang, S.; Ju, Y.W.; Hou, Q.L.; Niu, Q.H.; Wang, K.; Li, M.; Shi, X.H. Quantitative study of the macromolecular structures of tectonically deformed coal using high-resolution transmission electron microscopy. J. Nat. Gas Sci. Eng. 2015, 27, 1852–1862. [Google Scholar] [CrossRef]
- Qu, Z.H.; Jiang, B.; Wang, J.J.; Dou, X.Z.; Li, M. Evolution of Textures and Stress-Strain Environments of Tectonically-Deformed Coals. Geol. J. China Univ. 2012, 18, 453–459. [Google Scholar]
- Liu, H.W.; Jiang, B.; Liu, J.G.; Song, Y. The evolutionary characteristics and mechanisms of coal chemical structure in micro deformed domains under sub-high temperatures and high pressures. Fuel 2018, 222, 258–268. [Google Scholar] [CrossRef]
- Oohashi, K.; Hirose, T.; Shimamoto, T. Shear-induced graphitization of carbonaceous materials during seismic fault motion: experiments and possible implications for fault mechanics. J. Struct. Geol. 2011, 33, 1122–1134. [Google Scholar] [CrossRef]
- Babu, V.S.; Seehra, M.S. Modeling of disorder and x-ray diffraction in coal-based graphitic carbons. Carbon 1996, 34, 1259–1265. [Google Scholar] [CrossRef]
- Cancado, L.G.; Takai, K.; Enoki, T.; Endo, M.; Kim, Y.A.; Mizusaki, H.; Speziali, N.L.; Jorio, A.; Pimenta, M.A. Measuring the degree of stacking order in graphite by raman spectroscopy. Carbon 2008, 46, 272–275. [Google Scholar] [CrossRef]
- Nakamura, Y.; Oohashi, K.; Toyoshima, T.; Satisch-Kumar, M.; Akai, J. Strain-induced amorphization of graphite in fault zones of the Hidaka metamorphic belt, Hokkaido, Japan. J. Struct. Geology. 2015, 72, 142–161. [Google Scholar] [CrossRef]
- Lin, Q.Y.; Li, T.Q.; Liu, Z.J.; Song, Y.; He, L.L.; Hu, Z.J.; Guo, Q.G.; Ye, H.Q. High-resolution TEM observations of isolated rhombohedral crystallites in graphite blocks. Carbon 2012, 50, 2369–2371. [Google Scholar] [CrossRef]
- Collettini, C.; André, N.; Viti, C.; Marone, C. Fault zone fabric and fault weakness. Nature 2009, 462, 907–910. [Google Scholar] [CrossRef] [PubMed]
- Atria, J.V.; Rusinko, F.; Schobert, H.H. Structural ordering of Pennsylvania anthracites on heat treatment to 2000–2900 °C. Energy Fuels 2002, 16, 1343–1347. [Google Scholar] [CrossRef]
- Harris, P.J.F. New perspectives on the structure of graphitic carbons. Crit. Rev. Solid State Mater. Sci. 2005, 30, 235–253. [Google Scholar] [CrossRef]
- Oberlin, A.; Terriere, G. Graphitization studies of anthracites by high resolution electron microscopy. Carbon 1975, 13, 367–376. [Google Scholar] [CrossRef]
- Urai, J.L.; Means, W.D.; Lister, G.S. Dynamic recrystallization of minerals. Miner. Rock Deform. Lab. Stud. 1986, 36, 161–199. [Google Scholar]
- Wenk, H.R.; Tomé, C.N. Modeling dynamic recrystallization of olivine aggregates deformed in simple shear. J. Geophys. Res. Solid Earth 1999, 104, 25513–25527. [Google Scholar] [CrossRef]
- Cao, Y.; Mitchell, G.D.; Davis, A.; Wang, D. Deformation metamorphism of bituminous and anthracite coals from China. Int. J Coal Geol. 2000, 43, 227–242. [Google Scholar] [CrossRef]
- Sun, Y.; Alemany, L.B.; Billups, W.E.; Lu, J.; Yakobson, B.I. Structural dislocations in anthracite. J. Phys. Chem. Lett. 2011, 2, 2521–2524. [Google Scholar] [CrossRef]
- Xu, R.T.; Li, H.J.; Guo, C.C.; Hou, Q.L. The mechanisms of gas generation during coal de-formation: Preliminary observations. Fuel 2014, 117, 326–330. [Google Scholar] [CrossRef]
- Oberlin, A. Crystallite growth in graphitizing and non-graphitizing carbons. Proc. R. Soc. Lond. 1951, 209, 196–218. [Google Scholar]
Figure 1.
(a) Geological map of the research area and (b) location of the research area in China. Samples of the fourth group displayed different deformation characteristics at different tectonic locations: (c) brittle deformation and (d) ductile deformation, and (e,f) sample D60 exhibiting scaly flakes at the shear zone.

Figure 2.
(a) XRD profiles of representative samples with increasing distance from the intrusion. (b) Sample B7-1 had a (002) peak fitted into two separate peaks at 26.4° and 25.8°, signifying a crystalline structure and a turbostratic structure.
Figure 2.
(a) XRD profiles of representative samples with increasing distance from the intrusion. (b) Sample B7-1 had a (002) peak fitted into two separate peaks at 26.4° and 25.8°, signifying a crystalline structure and a turbostratic structure.

Figure 3.
Photomicrographs of different microstructures in coal-based graphite (CBG). Images were taken in oil immersion (50×), polarized light. (a) Sample B8-1, collotelinite (Ct); (b) sample B8-1, fusinite (Fs); (c) sample F7-1 showing granular particles on the border of fractures and pores; (d) sample F5-2 showing granular particles; (e) sample B8-2, silk-like graphite (Sg); (f) sample B4-1, silk-like graphite with strong anisotropy; (g) sample F2-2 showing flakes (F) with undulatory extinction and strong anisotropy; (h) sample B4-1, helminthoid pyrolytic carbon (Pc) seen using polarized light with a retarder plate; and (i) sample F1-1, fusinite (Fs).


Figure 4.
(a) Raman spectra of representative samples at different distances from the intrusion. (b) The second-region Raman spectra of samples F2-2 and B1-1, with sample F2-2 showing an asymmetric 2D1 band that was separated into two bands at 2685 cm−1 and 2715 cm−1, and sample B1-1 showing a symmetric and single 2D1 band.

Figure 5.
(a) Sample D60 showing scaly graphite particles. (b) Sample D60 showing straight carbon layers; the inset in the upper right corner shows the lattice intensity profile along the blue line, and the fast Fourier transform (FFT) image of the region of interest (ROI) is at the bottom right. (c) Sample B1-1 showing delamination of interlayers. (d) Sample B1-1 showing stacking defects. (e) Sample F1-1 showing bending layers due to the dislocation vertical to the basal plane (arrows point the dislocation wall); the inset at the bottom right shows the FFT image of the ROI.

Figure 6.
(a,b) Content of microstructures (vitrinite (V), inertinite (I), pyrolytic carbons (P), granular particles (G), flakes (F), silk-like graphite (S)) versus FWHM (002) (the full width at half maximum of the (002) peak) and Raman parameter R2. (c) Correlation of microstructures content with FWHM (002). (d) Microstructure content versus distance from the intrusion.

Figure 7.
(a) FWHM (002) and R2 values of CBG versus distance from the intrusion. (b) R2 values of different deformed CBG versus distance from the intrusion (see Supplementary Table S1 for Raman parameters of all samples).
Figure 7.
(a) FWHM (002) and R2 values of CBG versus distance from the intrusion. (b) R2 values of different deformed CBG versus distance from the intrusion (see Supplementary Table S1 for Raman parameters of all samples).

Figure 8.
(a) Sample D60, several incomplete carbon layers outside stiff layers. (b) The inverse fast Fourier transform (IFFT) image of the ROI (yellow dash line) in (a), showing few defects inside the graphite structure. (c) The IFFT image of the ROI (blue dash line) in (a), where arranged dislocations formed a dislocation wall (red dash line). (d) Sample F4-1 showing two local molecular orientations (LMOs) with different ordering and orientation. (e) The IFFT image of the ROI in (d). (f) Sample D60 showing two LMOs with different ordering and orientation. (g) The IFFT image of the ROI in (f), showing an irregular grain boundary. (h) Sample B7-1 showing locally ordered graphite structure and bending layers; the right upward inset is the lattice intensity profile along the blue line, the lower right corner inset show the blurred diffraction rings.


Table 1.
Proximate and ultimate analysis of samples
| D (m) | Samples | Proximate Analysis (%) | Ultimate Analysis (%) | H/C | Deformation Type | |||||||
|---|---|---|---|---|---|---|---|---|---|---|---|---|
| Mad | Ad | Vdaf | FCdaf | S | C | H | N | O | ||||
| 1340 | B8-1 | 8.22 | 14.67 | 3.14 | 96.86 | 0.25 | 96.74 | 0.48 | 0.13 | 2.41 | 0.06 | Brittle |
| B8-2 | 0.22 | 47.45 | 9.50 | 90.49 | 0.61 | 92.75 | 1.05 | 0.69 | 4.91 | 0.13 | Brittle | |
| 840 | B7-1 | 0.99 | 61.21 | 13.22 | 86.77 | 0.03 | 89.51 | 1.08 | 0.79 | 8.60 | 0.15 | Brittle |
| 760 | B6-1 | 1.9 | 51.04 | 6.74 | 93.26 | 0.20 | 96.96 | 1.37 | 0.16 | 1.29 | 0.17 | Brittle |
| F6-1 | 2.34 | 13.55 | 6.47 | 93.53 | 0.06 | 95.11 | 0.32 | 0.45 | 4.06 | 0.04 | Ductile | |
| 630 | B5-1 | 3.82 | 10.35 | 6.08 | 93.93 | 0.07 | 95.27 | 0.81 | 0.07 | 3.78 | 0.10 | Brittle |
| F5-1 | 3.68 | 16.69 | 5.36 | 94.63 | 0.07 | 96.76 | 0.19 | 0.12 | 2.84 | 0.02 | Ductile | |
| F5-2 | 2.24 | 39.95 | 6.95 | 93.04 | 0.20 | 95.35 | 0.58 | 0.17 | 3.68 | 0.07 | Ductile | |
| 480 | B4-1 | 7.56 | 24.99 | 4.43 | 95.57 | 0.15 | 97.69 | 0.35 | 0.11 | 1.72 | 0.04 | Brittle |
| F4-1 | 5.3 | 5.91 | 4.78 | 95.22 | 0.04 | 96.29 | 0.35 | 0.09 | 3.22 | 0.04 | Ductile | |
| 430 | F3-1 | 0.82 | 23.95 | 3.13 | 96.87 | 0.03 | 98.13 | 0.34 | 0.11 | 1.39 | 0.04 | Ductile |
| F3-2 | 3.64 | 11.77 | 2.68 | 97.33 | 0.01 | 99.38 | 0.48 | 0.07 | 0.06 | 0.06 | Ductile | |
| 330 | B2-1 | 0.58 | 14.38 | 4.03 | 95.97 | 0.01 | 96.71 | 0.09 | 0.36 | 2.83 | 0.01 | Brittle |
| F2-1 | 1.10 | 28.46 | 5.65 | 94.34 | 0.63 | 96.16 | 0.17 | 0.38 | 2.41 | 0.02 | Ductile | |
| F2-2 | 3.44 | 11.59 | 1.94 | 98.05 | 0.01 | 93.51 | 0.07 | 0.08 | 6.31 | 0.01 | Ductile | |
| F2-3 | 1.38 | 27.4 | 3.58 | 96.43 | 0.01 | 98.10 | 0.32 | 0.08 | 1.47 | 0.04 | Ductile | |
| 200 | B1-1 | 8.48 | 12.87 | 2.85 | 97.15 | 0.07 | 98.62 | 0.09 | 0.09 | 1.03 | 0.01 | Brittle |
| F1-1 | 5.71 | 11.07 | 3.82 | 96.18 | 0.05 | 97.81 | 0.17 | 0.09 | 1.89 | 0.02 | Ductile | |
D—distance from intrusion; M—moisture; A—ash yield; V—volatile matter; FC—fixed carbon; ad—air dry basis; d—dry basis; daf—dry ash-free basis.
Table 2.
XRD parameters and optical reflectance of samples
| Distance (m) | Samples | d002 (nm) | FWHM (°) | Lc (nm) | La (nm) | Rmax (%) | Rmin (%) | Rb (%) |
|---|---|---|---|---|---|---|---|---|
| 1540 | D60 | 0.3363 | 0.278 | 29.36 | 65.55 | / | / | / |
| 1340 | B8-1 | 0.3506 | 3.065 | 8.52 | 5.86 | 7.17 | 2.81 | 4.36 |
| B8-2 | 0.3522 | 3.097 | 2.63 | 6.65 | 6.23 | 2.49 | 3.74 | |
| 840 | B7-1 | 0.3410 | 3.048 | 2.68 | 6.10 | 7.11 | 1.43 | 5.69 |
| 760 | B6-1 | 0.3361 | 0.607 | 13.44 | 55.14 | 5.08 | 3.52 | 1.55 |
| F6-1 | 0.3360 | 0.539 | 15.14 | 27.01 | 5.32 | 2.45 | 2.87 | |
| 630 | B5-1 | 0.3363 | 0.569 | 14.34 | 32.57 | 4.92 | 1.95 | 2.97 |
| F5-1 | 0.3366 | 0.451 | 18.10 | 35.34 | 5.8 | 2.13 | 3.67 | |
| F5-2 | 0.3363 | 0.467 | 17.48 | 46.09 | 6.76 | 2.46 | 4.3 | |
| 480 | B4-1 | 0.3365 | 0.502 | 16.29 | 47.09 | 6.48 | 2.37 | 4.11 |
| F4-1 | 0.3363 | 0.409 | 19.95 | 39.96 | 7.26 | 3.82 | 3.44 | |
| 430 | F3-1 | 0.3358 | 0.323 | 25.26 | 55.13 | 6.99 | 1.52 | 5.47 |
| F3-2 | 0.3363 | 0.368 | 22.18 | 49.78 | 7.51 | 1.7 | 5.82 | |
| 330 | B2-1 | 0.3363 | 0.450 | 19.02 | 32.20 | 6.26 | 1.88 | 4.39 |
| F2-1 | 0.3358 | 0.329 | 24.81 | 51.85 | 5.85 | 1.76 | 4.09 | |
| F2-2 | 0.3358 | 0.316 | 25.83 | 62.65 | 7.34 | 1.49 | 5.85 | |
| F2-3 | 0.3361 | 0.324 | 25.19 | 40.89 | 4.44 | 2.36 | 2.08 | |
| 200 | B1-1 | 0.3360 | 0.352 | 23.19 | 40.52 | 6.88 | 1.25 | 5.63 |
| F1-1 | 0.3358 | 0.360 | 22.67 | 44.55 | 7.72 | 1.35 | 6.38 |
Table 3.
Content of different types of microstructures in CBG
| Distance (m) | Samples | Vitrinite (%) | Inertinite (%) | Pyrolytic Carbons (%) | Granular Particles (%) | Flakes (%) | Silk-Like Graphite (%) |
|---|---|---|---|---|---|---|---|
| 1340 | B8-1 | 74 | 26 | 0 | 0 | 0 | 0 |
| B8-2 | 71 | 29 | 0 | 0 | 0 | 0 | |
| 840 | B7-1 | 60 | 22 | 12 | 5 | 0 | 0 |
| 760 | B6-1 | 9 | 15 | 10 | 65 | 0 | 0 |
| F6-1 | 10 | 8 | 9 | 70 | 0 | 3 | |
| 630 | B5-1 | 3 | 2 | 22 | 71 | 1 | 1 |
| F5-1 | 1 | 4 | 12 | 82 | 0 | 1 | |
| F5-2 | 0 | 1 | 21 | 71 | 2 | 6 | |
| 480 | B4-1 | 0 | 1 | 7 | 72 | 10 | 10 |
| F4-1 | 0 | 1 | 10 | 71 | 10 | 8 | |
| 430 | F3-1 | 0 | 0 | 9 | 70 | 13 | 8 |
| F3-2 | 0 | 0 | 5 | 65 | 16 | 14 | |
| 330 | B2-1 | 0 | 0 | 8 | 76 | 10 | 6 |
| F2-1 | 0 | 0 | 4 | 77 | 13 | 5 | |
| F2-2 | 0 | 0 | 6 | 71 | 15 | 9 | |
| F2-3 | 0 | 0 | 3 | 68 | 14 | 15 | |
| 200 | B1-1 | 0 | 0 | 5 | 71 | 12 | 13 |
| F1-1 | 0 | 0 | 4 | 69 | 16 | 11 |
© 2019 by the authors. Licensee MDPI, Basel, Switzerland. This article is an open access article distributed under the terms and conditions of the Creative Commons Attribution (CC BY) license (http://creativecommons.org/licenses/by/4.0/).
Share and Cite
MDPI and ACS Style
Wang, L.; Cao, D.; Peng, Y.; Ding, Z.; Li, Y. Strain-Induced Graphitization Mechanism of Coal-Based Graphite from Lutang, Hunan Province, China. Minerals 2019, 9, 617. https://0-doi-org.brum.beds.ac.uk/10.3390/min9100617
AMA Style
Wang L, Cao D, Peng Y, Ding Z, Li Y. Strain-Induced Graphitization Mechanism of Coal-Based Graphite from Lutang, Hunan Province, China. Minerals. 2019; 9(10):617. https://0-doi-org.brum.beds.ac.uk/10.3390/min9100617
Chicago/Turabian StyleWang, Lu, Daiyong Cao, Yangwen Peng, Zhengyun Ding, and Yang Li. 2019. "Strain-Induced Graphitization Mechanism of Coal-Based Graphite from Lutang, Hunan Province, China" Minerals 9, no. 10: 617. https://0-doi-org.brum.beds.ac.uk/10.3390/min9100617
Note that from the first issue of 2016, this journal uses article numbers instead of page numbers. See further details here.