The Study of Crystal Structure on Grossular–Andradite Solid Solution


1
Key Laboratory of Orogenic Belts and Crustal Evolution, MOE, Peking University, Beijing 100871, China
2
School of Earth and Space Sciences, Peking University, Beijing 100871, China
3
College of Resources and Environment, Yangtze University, Wuhan 430074, China
4
China Automotive Battery Research Institute Co., Ltd., Beijing 100088, China
*
Authors to whom correspondence should be addressed.
Minerals 2019, 9(11), 691; https://0-doi-org.brum.beds.ac.uk/10.3390/min9110691
Submission received: 11 September 2019
/
Revised: 31 October 2019
/
Accepted: 5 November 2019
/
Published: 8 November 2019
(This article belongs to the Section Crystallography and Physical Chemistry of Minerals & Nanominerals)
Abstract
:The effects of Al3+–Fe3+ substitution on 10 synthesized garnet samples along the grossular–andradite binary solid solution were investigated using both powder and single-crystal X-ray diffraction. Results showed that cell volume increased with andradite content. Small negative excess volume was observed in the Al-rich samples. By measuring the bond length, polyhedral volume, octahedral distortion parameter (σ), and tetrahedral rotation angle (α), we determined that the distortion occurred on the dodecahedral site. The width of the diffraction peaks was obviously related to the composition of the solid solution. Full width at half maximum of diffraction peaks was used to calculate the microstrain, which may have a relationship with enthalpy of mixing.
1. Introduction
Garnet (X3Y2Si3O12) is a significant phase in the upper mantle and transition zone because it can be stable over a broad temperature and pressure range [1,2]. Natural garnets always exhibit extensive substitution and exist as complex solid solutions. Due to different ionic radii, substitution between cations changes the microstructure of garnets, which may further affect the relevant physical–chemical properties [3,4,5,6,7].
Previous studies on the mixing behavior of binary garnet solid solutions have mainly focused on the effects of divalent cation substitutions (Mg2+–Fe2+–Ca2+) [5,8,9,10,11,12,13]. It has been shown that the larger the size difference between the cations that mix on the X sites, the larger will be the deviation from the ideal mixing solid solution [13]. The excess volume of pyrope (Pyr, Mg3Al2Si3O12)–almandine (Alm, Fe3Al2Si3O12), almandine–grossular (Gro, Ca3Al2Si3O12), and pyrope–grossular solid solutions can reach 3.0, 4.3, and 7.5 Å3/cell, respectively. The nonlinear variation of thermal expansion, bulk modulus, and thermodynamic properties (e.g., H and S) for pyrope–grossular solid solution is considered to be related to the nonideal behavior in structure [5,14,15,16].
According to Boffa-Ballaran and Woodland (2006) [17] and McAloon and Hofmeister (1995) [18], unit-cell parameters have a roughly linear correlation with garnet composition in spite of the large radius difference between Fe3+ and Al3+ on the octahedral site. However, Heuss-Aβbichler and Fehr (1997) [19] observed a negative and a positive deviation from the ideal mixing cell volume at grossular-rich and andradite (And, Ca3Fe2Si3O12)-rich compositions, respectively. Therefore, more global observations of the mixing behavior of grossular–andradite solid solution should be carried out.
In this study, we investigated the grossular–andradite binary system to examine the effects of changing octahedral cations. We synthesized garnet solid solutions along the grossular–andradite binary system at 3 GPa and 1100–1200 °C and investigated the effects of Al3+–Fe3+ substitution on garnet structures using both powder X-ray diffraction (PXRD) and single-crystal XRD methods. The variation in cell volume and bond lengths of polyhedrons was measured. Excess volume and microstrain were calculated by unit-cell parameters and full width at half maximum (FWHM) of the diffraction peaks, respectively. The results show that excess volume may have a relationship with dodecahedral distortion.
2. Experimental Methods
The raw materials (analytical grade reagents SiO2, CaCO3, Fe2O3, and Al2O3) were dried at 450 °C in open air for 12 h. After that, these chemical compounds were mixed and pressed into pellets of grossular and andradite composition, respectively. These pellets were decarbonated at 1000 °C in high-T furnace. Then, the degassed pellets were crushed into fine powders and mixed at appropriate proportions, which were further used for high-P experiments to synthesize the Gro–And solid solutions (Table 1).
High-P syntheses were conducted at 3 GPa and 1100–1200 °C using the cubic press at the High-Pressure Laboratory of Peking University [20]. The new cell arrangement reported in He et al., (2014) [21] was used (BJC-11 [20]). In order to host our large Pt capsules (OD = 5 mm, ID = 4.75 mm, and L = 7 mm), which were arc-welded to contain the experimental precursors, the dimensions of the small parts inside the graphite heater were accordingly modified. In addition, all small parts made of h-BN were replaced by MgO, so the oxygen fugacity in this experimental assembly was significantly increased. As illustrated in Liu et al., (2012) [20], no pressure correction is necessary for this cell arrangement, and the accuracy of the experimental P measurements should be ±0.1 GPa. A 1 mm thick MgO disk was used to prevent the capsule being in direct contact with the thermocouple (a type C W5%Re–W26%Re thermocouple). The fluctuation of the nominal T readings of the thermocouple was always less than ±1 °C. Due to the large size of the Pt capsules, the real temperature exerted on the experimental sample varied from ~70 °C higher to ~50 °C lower than the nominal thermocouple reading [22].
The experimental products from LMD581, LMD584, and LMD589 were simply dug out of the Pt capsules without any attention paid to observe the presence/absence of gas. Small parts of the synthesized products were arbitrarily picked, mounted in epoxy, polished, and then examined with scanning electron microscopy (SEM). Subsequent electron microprobe analysis (EMPA) was employed for composition analysis. After completing all the above experiments, suitable crystals were carefully picked out for single-crystal XRD. The remaining samples were grinded into fine powders for PXRD analyses (Pt powder added as internal standard). In contrast, the experimental products from other synthesizing experiments were first sanded open with dry silicon carbide abrasive paper and checked to determine whether there was a gas phase by signs of bubbling (Table 2). The capsules were then cut longitudinally by a low-speed diamond saw at positions about 1 mm away from the capsule edge. These small portions of the samples were mounted in epoxy, polished, and prepared for SEM, EMPA, and single-crystal XRD. The large portions were grinded into fine powders for powder XRD analyses.
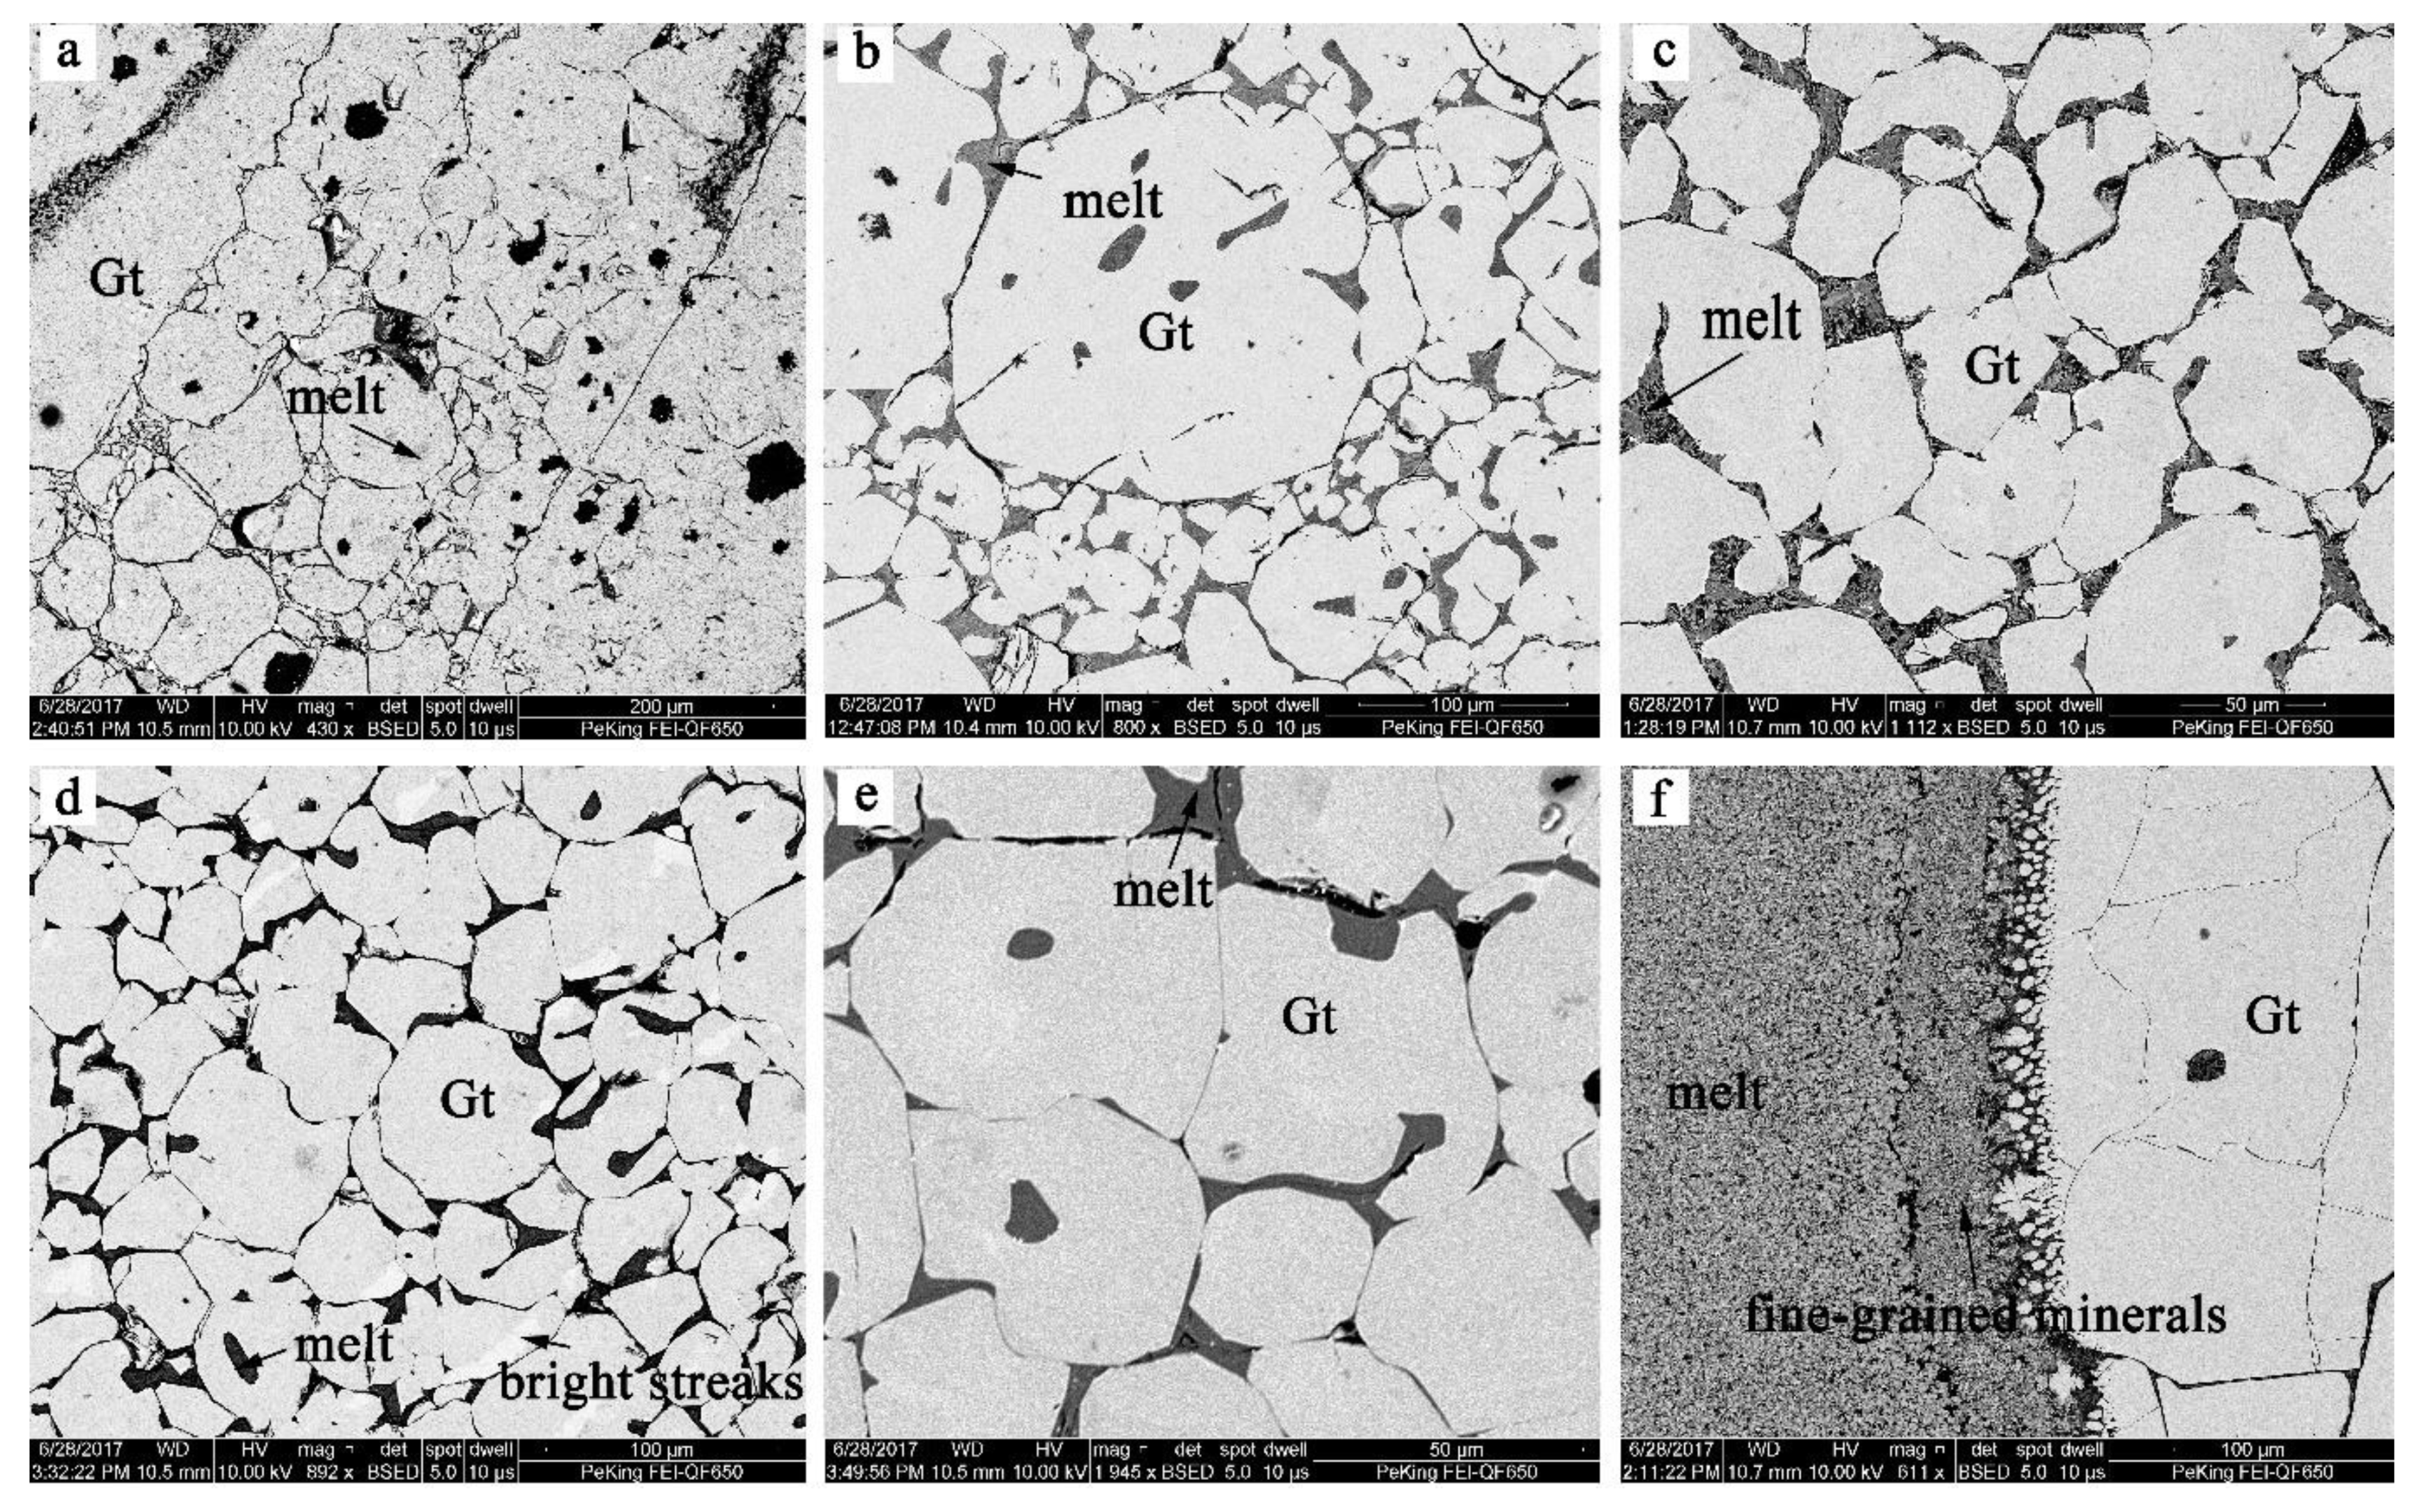
The appearance of the samples was checked using the scanning electron microscope (FEI Quanta 650 FEG) at the School of Earth and Space Sciences, Peking University. The working conditions were 10 kV (accelerating voltage) and 10 μs (dwell time), with other working parameters shown in Figure 1.
The compositional data were collected using the JEOL JXA-8230 electron probe microanalyzer at the School of Earth and Space Sciences, Peking University. The analytical conditions were 15 kV (accelerating voltage) and 10 nA (beam current). Beam diameter was 1–2 μm for garnet crystals and 5–20 μm for melt; in particular, a 200 μm diameter was used for large areas of melt in samples LMD586 and LMD625. Calibration was based on optimization to some standards provided by the SPI Corporation (USA), with diopside for Ca, jadeite for Si and Al, and hematite for Fe. Data correction was performed with the PRZ method. Ferric iron content was calculated by charge balance and setting the sum of oxygen ions to 12. To obtain an average composition, more than 10 analyses were performed on various grains from different locations in each sample.
Powder XRD patterns were collected at ambient temperature and pressure using an X’Pert Pro MPD diffractometer with an X’Celerator detector at the School of Earth and Space Sciences, Peking University. The measuring conditions of the X-ray powder diffraction were Cu Kα radiation, 40kV and 40 mA, 10–90° (2θ) scanning range, 0.017° step size, and 20 s per step. We analyzed the patterns using PeakFit v4.12 software. Diffraction peaks were fitted using Gauss + Lorentz peak shape function to obtain the positions and FWHM of the diffraction peaks. Peak positions were further used to refine the unit-cell parameters of each sample by UnitCell [23].
The single crystals were immersed in silicone oil, and suitable samples were picked out under an optical microscope for single-crystal X-ray diffraction analysis. Intensity data were collected on a Bruker Smart ApexIII Quazar microfocused diffractometer using Mo Kα radiation (λ = 0.71073 Å). The raw data were processed and corrected for the absorption effects using SAINT+ v8.38A and SADAB embedded in Bruker Apex3. The initial structures were set up based on garnet structure (space group Ia–3d) and refined by a full-matrix least-squares method using the SHELXT v2018.3 software included in the SHELXTL package. The heaviest atoms were first located unambiguously in the Fourier maps, and the O atoms were then found in the subsequent difference maps. All atoms were refined with anisotropic displacement parameters. The refinement results are listed in Table 3.
3. Results
3.1. Phase Compositions
As shown by the backscattered electron (BSE) images in Figure 1, two phases—garnet and melt—were observed. In most cases, the size of the garnet was between 20 and 100 μm; however, a larger size of about 100–500 μm was observed in sample LMD625, possibly due to a higher degree of melting (Figure 1f). The glass phase constituted around 1–10% of the experimental product and existed in the gaps between garnet crystals and along the cracks of garnet grains. A few bright-colored minerals between the garnet grains in the BSE images might have been a Ca-rich quench product formed from the melt, which was always less than 1%. However, in sample LMD625 with pure andradite starting composition, we observed about 30% melt by volume in the center of the capsule, which might have been caused by the lower melting point of andradite compared to grossular (Figure 1f). Fine mineral grains with poor crystallinity could be found between the melt and garnet crystals, formed during the quenching process.
As Fe can be lost to the Pt capsules [24], most samples had a higher grossular component compared to the target value according to EMPA analyses. Due to the lower andradite content, almost no Fe was observed in the garnet of sample LMD634, although our target Fe3+/(Al3+ + Fe3+) ratio was 0.1 (Table 4). Therefore, sample LMD634 was not considered in the following studies.
Garnet solid solutions were compositionally homogeneous according to EMPA analyses, with the standard deviation of Fe3+/(Al3+ + Fe3+) ratio ranging from 0 to 0.02. In sample LMD631, some bright streaks were observed on the garnet grains in BSE images scanned by SEM (Figure 1d). However, the light and dark areas had rather similar compositions, with Fe3+/(Al3+ + Fe3+) ratios of 0.54(2) and 0.53(2), respectively. In fact, the brightness difference could not be identified in the backscattered electron images using the EMPA. We did not distinguish the light and dark areas thereafter. The degree of Fe reduction is a key issue for the study of Gro–And solid solutions. The content of ferrous iron was estimated by charge balance. As demonstrated by Xu et al., (2017) [25], charge balance method has a high accuracy for garnets. Our calculations showed that, with the exception of low-Fe sample LMD584, the ratio of ferric to ferrous iron was always >95%.
3.2. Unit-Cell Parameters
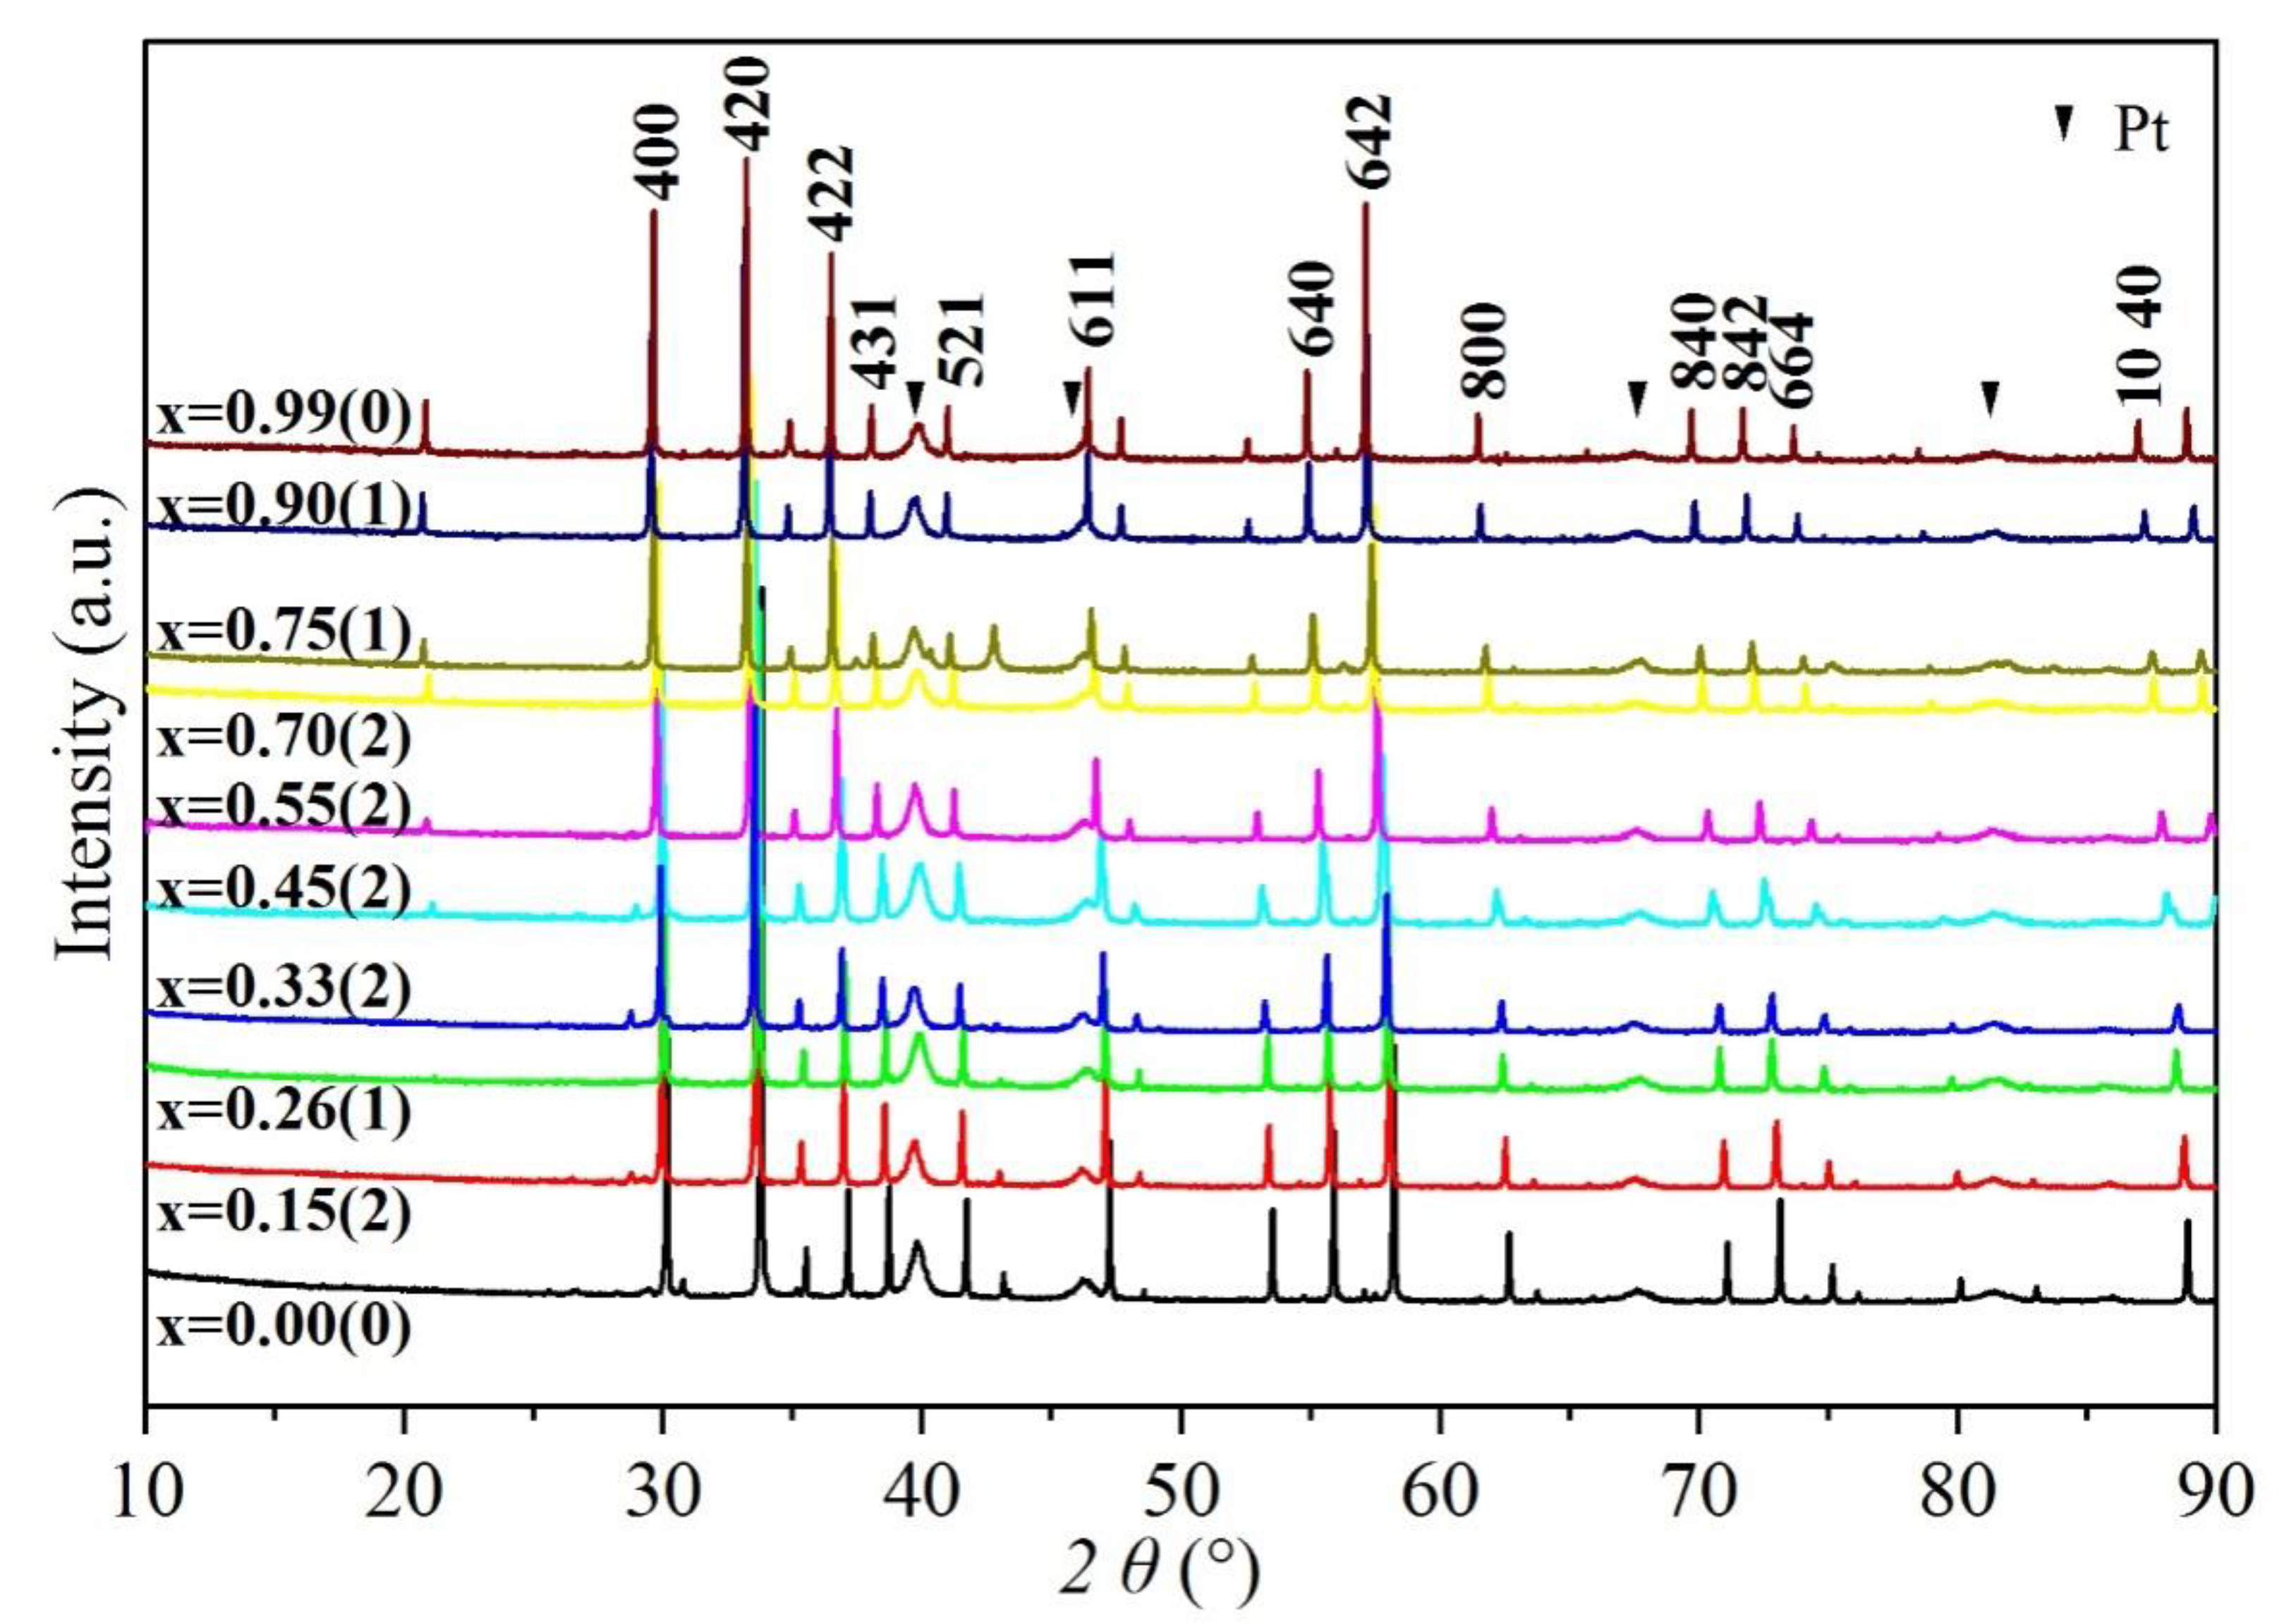
Powder XRD patterns of Gro–And garnet solid solutions were obtained at ambient condition. Kα2 peaks were eliminated during data processing by Jade 5.0 software. Due to narrow and sharp shapes, peaks of garnets could easily be identified and are marked with number of plane in Figure 2. The Pt powder was used as an internal standard to correct diffraction peaks in the XRD experiment. Four Pt peaks could be observed with Bragg angle of 10°–90° (marked by solid inverted triangles in Figure 2). Because of broad diffraction peaks, Pt correction was not used in this study to avoid fitting error. In addition, there were some peaks with low Bragg angles, which might be Ca-, Si-rich minerals (e.g., wollastonite) crystallized during melt quenching.
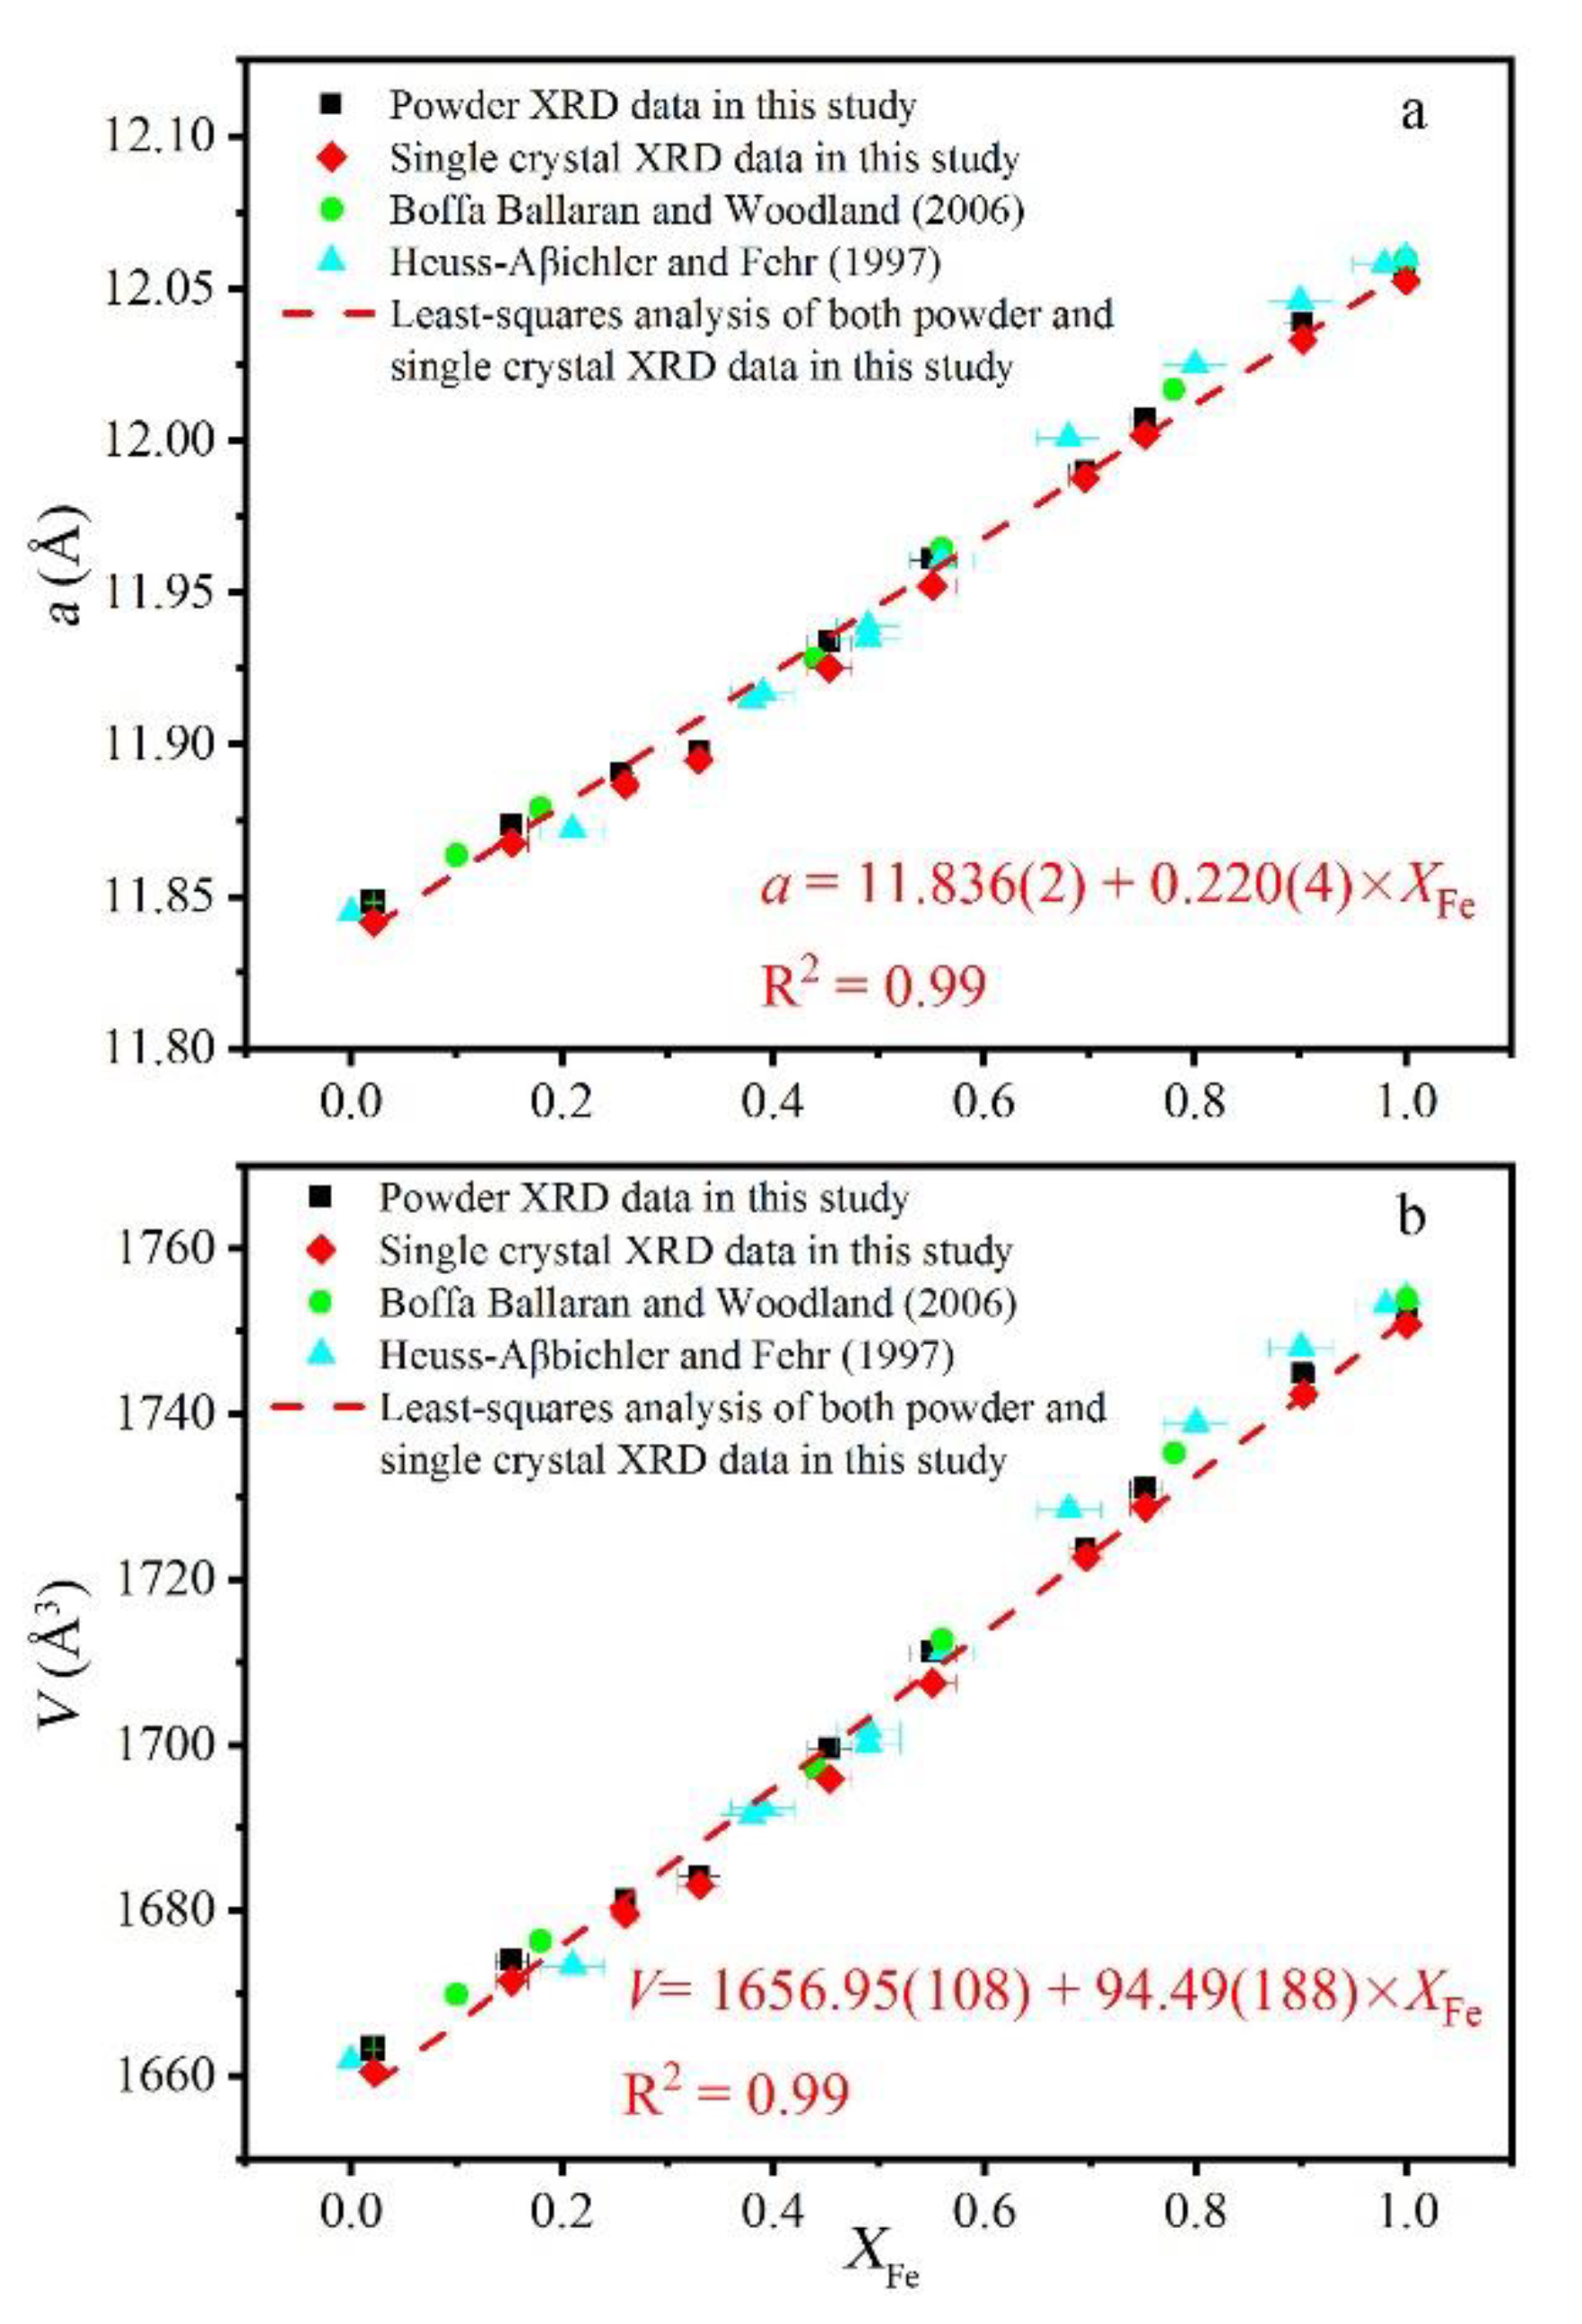
The unit-cell parameters and volumes of various samples using both powder and single-crystal XRD showed little difference (Table 5). The unit-cell parameters of grossular and andradite end-member garnets were 11.848(0) and 12.054(0) Å (PXRD) and 11.842(0) and 12.053(1) Å (single-crystal XRD), respectively, which are consistent with previous studies (Table 6). The least-squares method was used to fit both powder and single-crystal XRD data in this study: a = 11.836(2) + 0.220(4) × XFe (R2 = 0.99). The fitting results of four sets of data were as follows: a = 11.840(1) + 0.218(2) × XFe (R2 = 0.99) (Figure 3).
3.3. Excess Volume
Excess volume is the difference in the unit-cell volume between the real mixture and the ideal solid solution, which can also be used to evaluate structural distortion (Table 5). Figure 4 shows the relationship between excess volume and composition along Gro–And solid solution. Negative excess volume value was observed in Al-rich samples in all three studies, whereas a slight positive excess volume value was observed in andradite-rich samples in this study and in Boffa Ballaran and Woodland (2006) [17]. The apparently more positive value in andraditic garnet in Heuss-Aβbichler and Fehr (1997) [19] might have been caused by inhomogeneous composition [17].
A two-parameter Margules equation was used to model the excess volume values of garnets:
where X is the mole fraction of different garnet solutions, and W is the excess volume parameter. According to fitting results, WVgrossular = −3.47 ± 0.57 cm3/mol and WVandradite = 1.64 ± 0.60 cm3/mol were calculated for powder XRD data, and WVgrossular = −3.15 ± 0.42 cm3/mol and WVandradite = 0.87 ± 0.44 cm3/mol were calculated for single-crystal XRD data. Data from the previous two studies were also modeled, giving WVgrossular = −2.50 ± 0.53 cm3/mol and WVandradite = 1.01 ± 0.67 cm3/mol for Boffa Ballaran and Woodland (2006) [17] and WVgrossular = −5.65 ± 0.65 cm3/mol and WVandradite = 3.42 ± 0.65 cm3/mol for Heuss-Aβbichler and Fehr (1997) [19]. The results showed that data in both studies did not fit well with Margules equation. This might have been a result of Al3+–Fe3+ cation misfit, microstrain, or different degree of Al3+–Fe3+ occupation disorder [15].
V(X)excess = Xgrossular∙Xandradite (Xgrossular∙WVandradite + Xandradite∙WVgrossular)
3.4. Bond Length and Polyhedral Volume
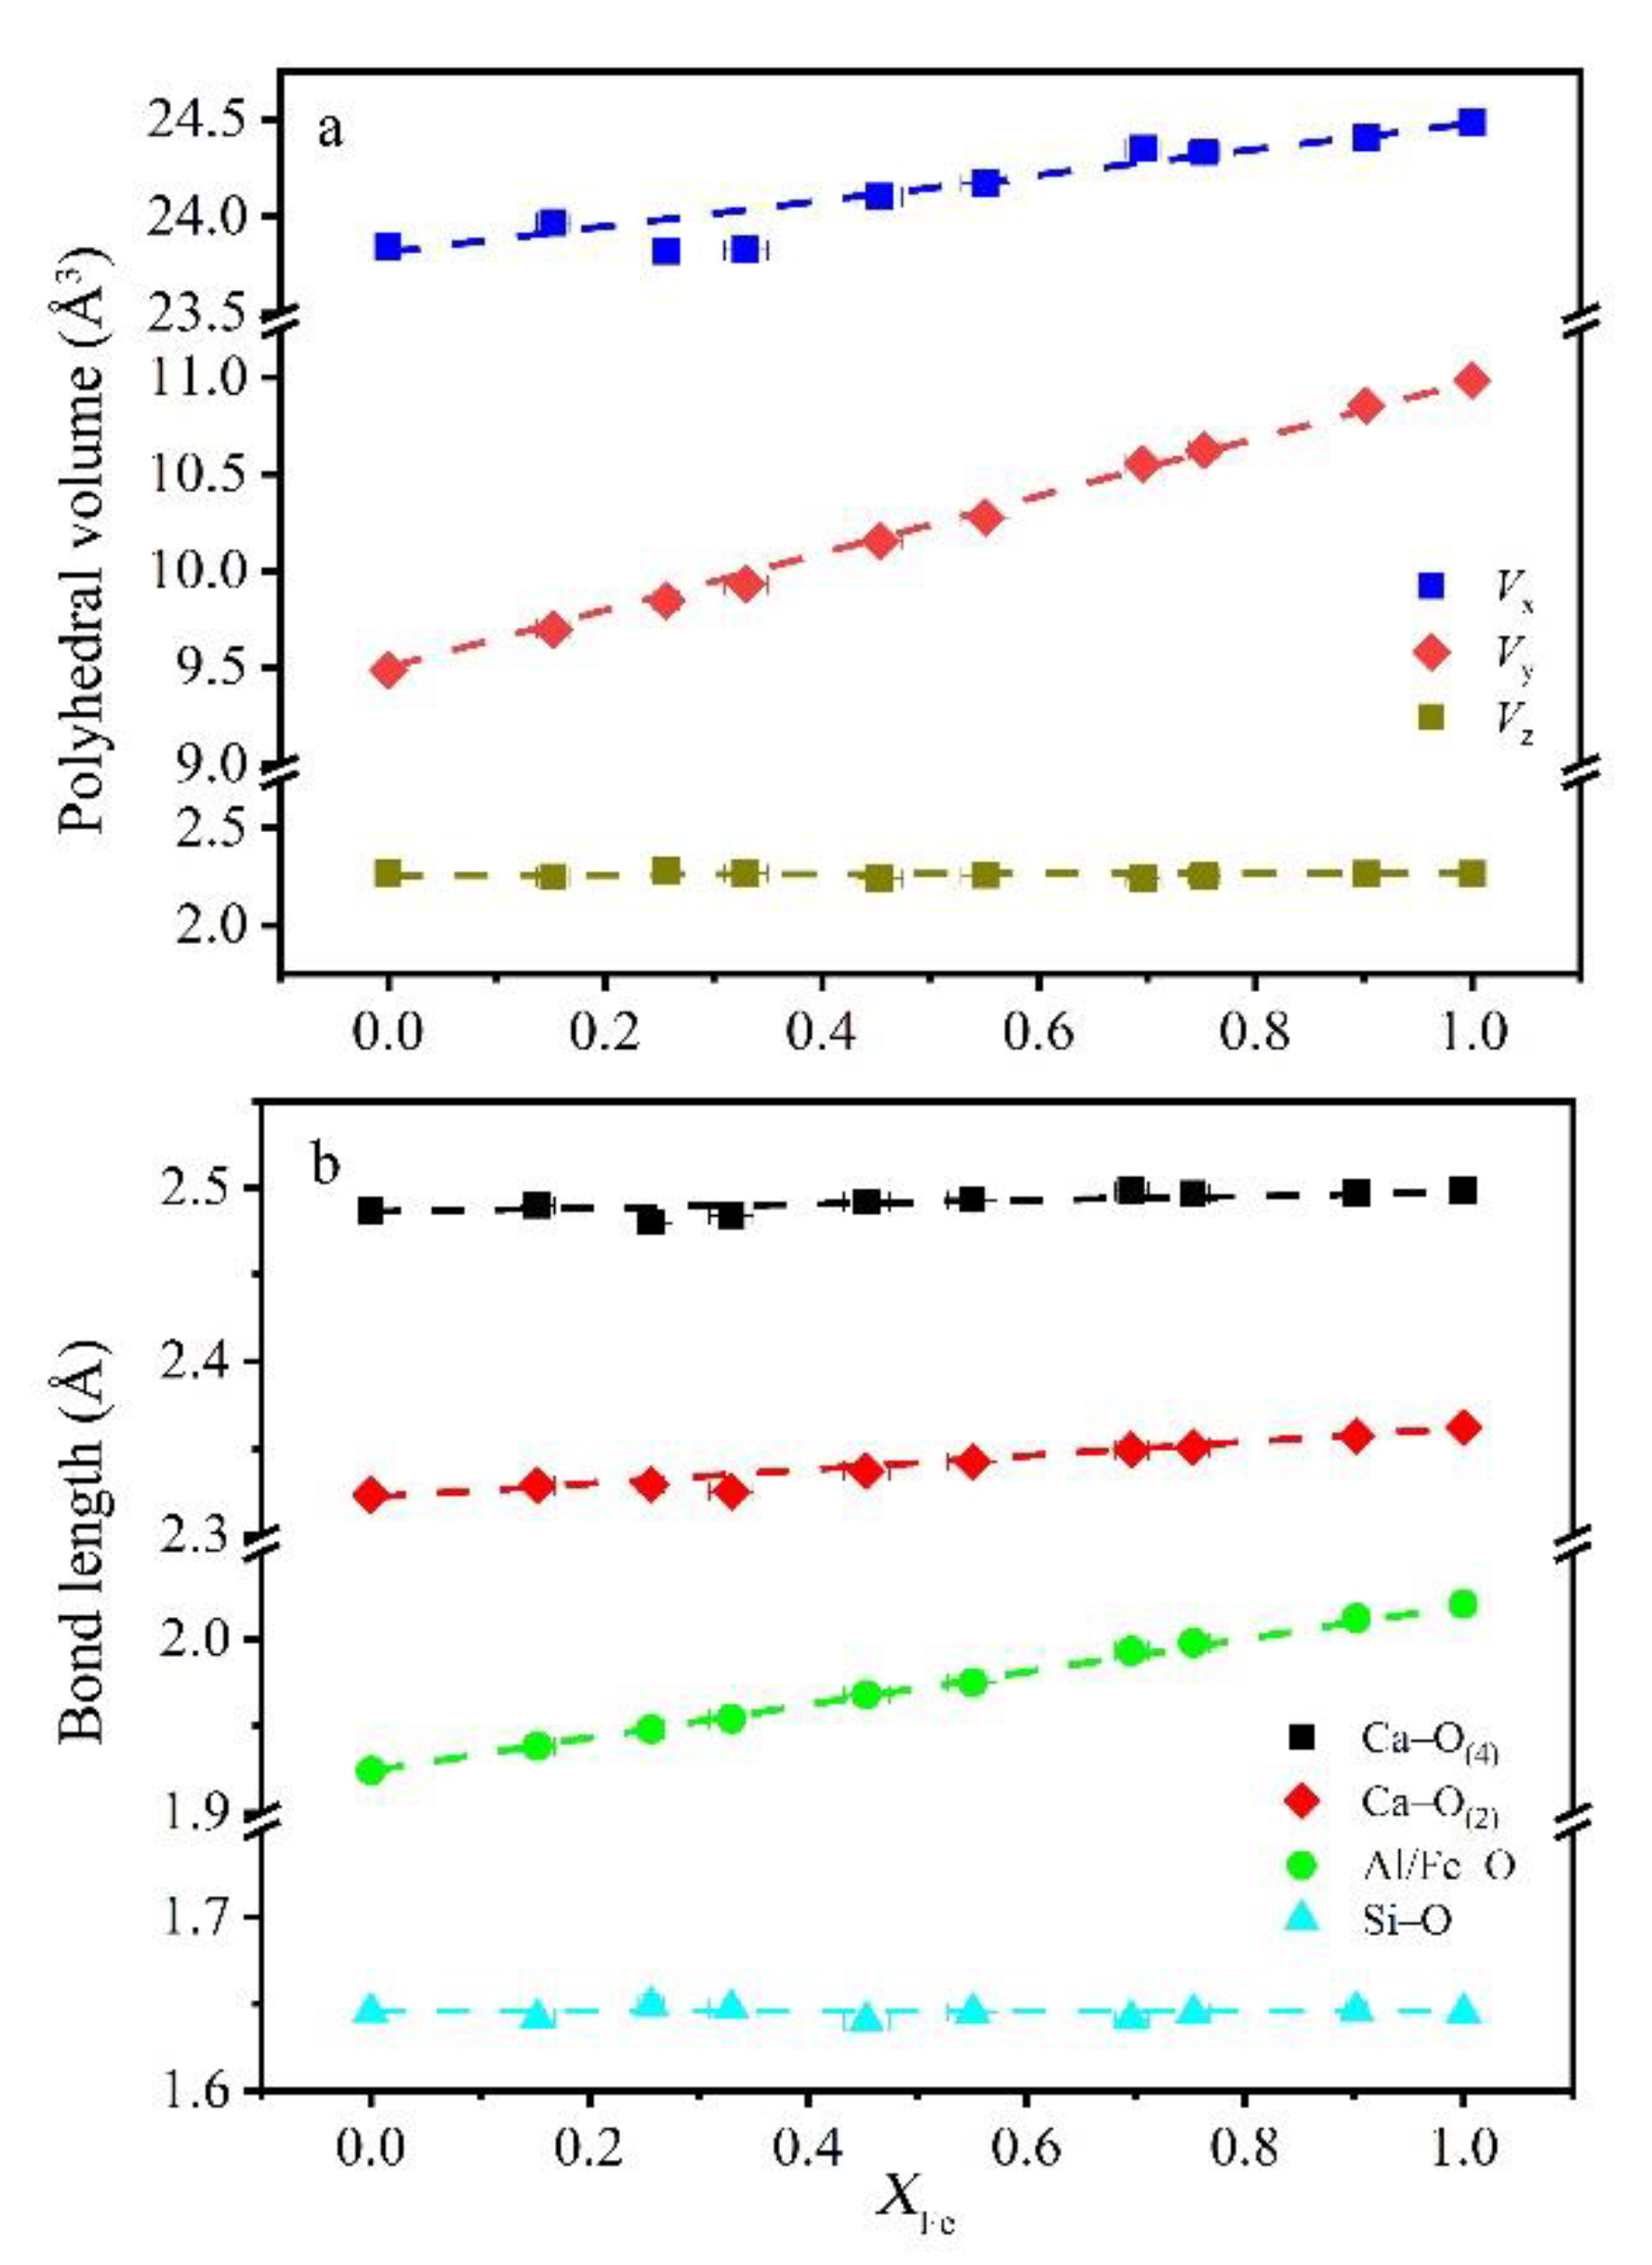
Bond lengths and polyhedral volumes were correlated with cation substitution (Figure 5). This is in agreement with previous studies showing cation substitutions on octahedron mainly affect the Y–O bond length, with the Z–O distance remaining constant [12,29,30]. From grossular to andradite, cation substitution occurred exclusively at the octahedral site, and the dodecahedron and tetrahedron sites were nearly occupied by Ca and Si. As shown in Figure 5a, volume change pattern turned from steep at the octahedron site through the dodecahedron site to almost flat at the tetrahedron site. Although cation substitution occurred in the octahedrons, significant negative deviation could be observed at the dodecahedron when the garnet had 30–40% And (sample with the 30–40% andradite component), which seemed to be attributed to excess volume.
Because of the larger radius of Fe3+ compared to Al3+, Al/Fe–O length linearly increased from 1.924 to 2.020 when andradite end-member content increased from 0% to 100%. Compared to octahedral bond length variation, the two inequivalent dodecahedral bond lengths—shorter Ca–O(2) and longer Ca–O(4)—slightly increased with andradite composition, with the former having a deeper slope. A negative deviation at 40% And was observed at both Ca–O(2) and Ca–O(4) bond lengths, corresponding to the volume change of dodecahedron. The Si–O bond lengths were constant within the analytical error (Figure 5).
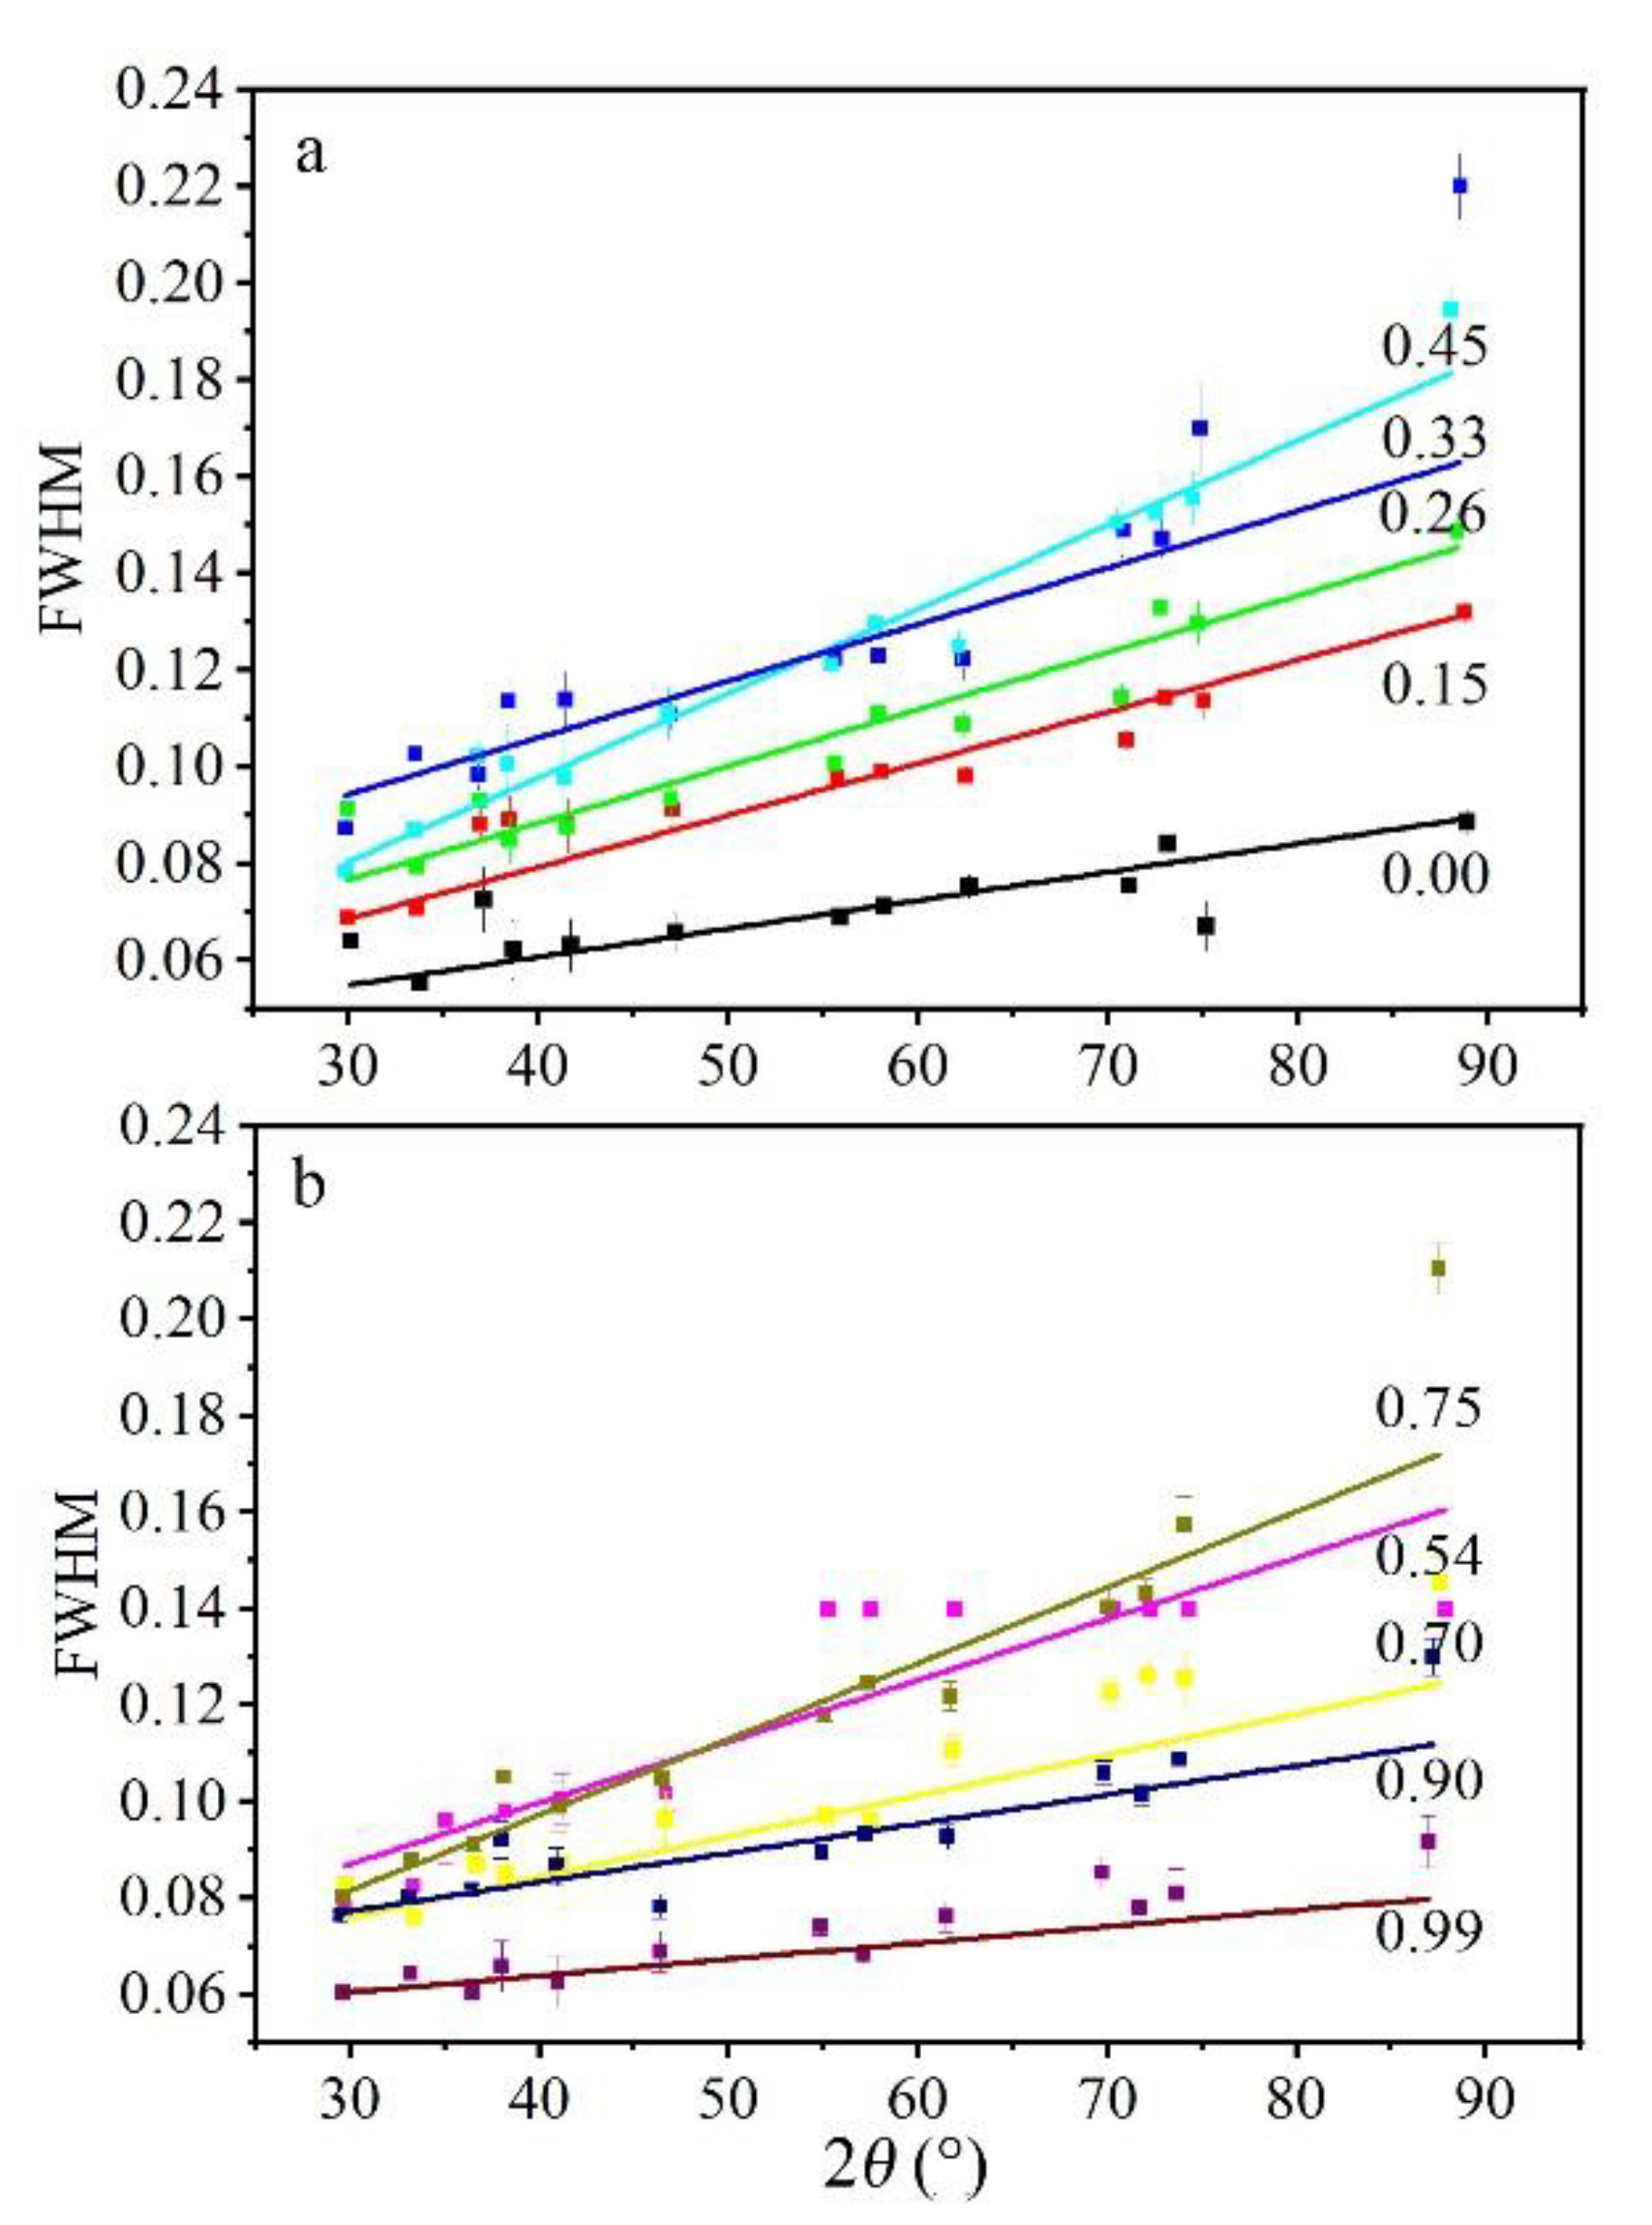
3.5. XRD Peak Broadening
Peak broadening of powder XRD can be expressed by FWHM. Generally, garnets with intermediate composition showed broader FWHM than pure end-members (Figure 6), which is in accordance with previous studies [15,31]. However, the garnet with 75% andradite was an exception, exhibiting the largest FWHM.
For samples with a certain composition, in general, XRD peaks became broader with 2θ. The peak broadening reflects the effect of instrument and sample [15]. For samples with pure end-member composition, the FWHM was narrow and represented the instrumental effect (grossular showed little peak broadening and had a small difference from LaB6 in Du et al., (2016) [15]). As a result, if we adopt the measured peak broadening (Bobs) of grossular as the instrumental broadening (Binst = Bgro), the real peak broadening of garnets (Breal) can be determined as follows:
Breal = Bobs − Binst ≈ Bobs − Bgro.
4. Discussion
4.1. Excess Volume and Distortion
When incorporating cations with different sizes in a certain site, the structure of the mineral has to adjust to larger or smaller unit-cell volume. As a result, excess volume can represent the size of the lattice distortion.
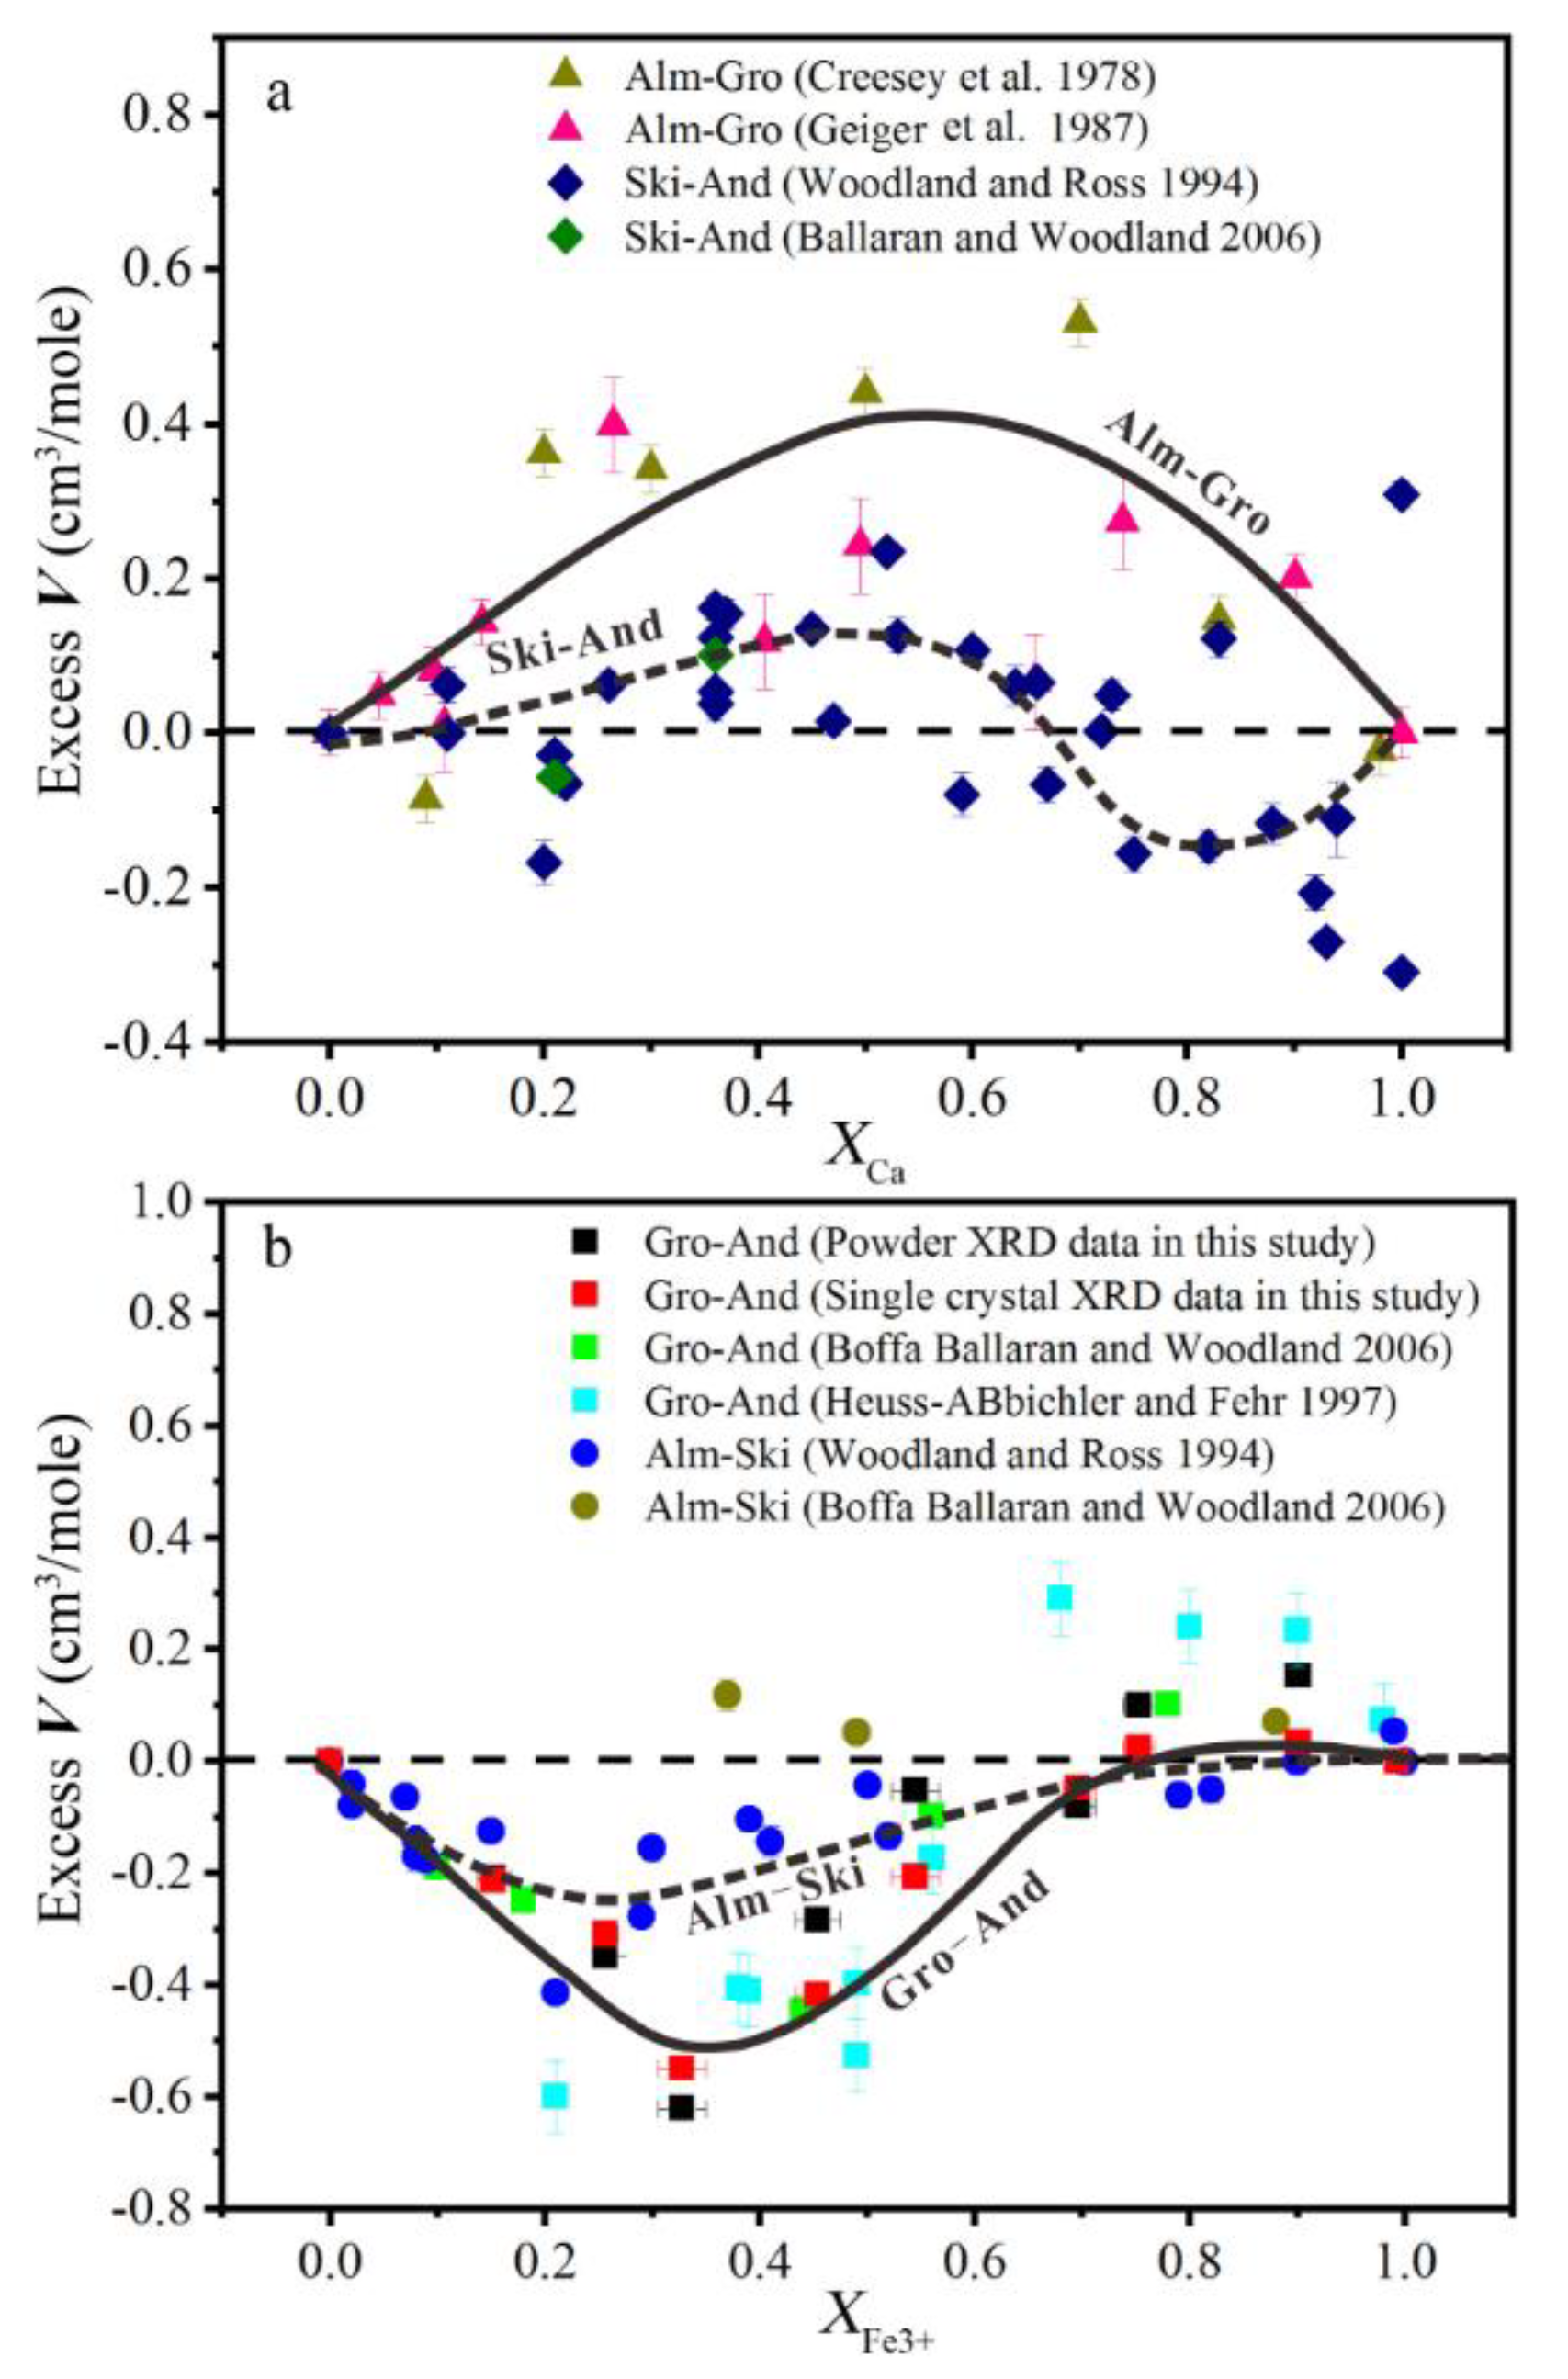
After comparing the excess volume in Pyr–Gro, Alm–Gro, and Pyr–Alm garnet solid solutions, Ungaretti et al., (1995) [13] proved that the radius difference of cations in the dodecahedron site will affect the distortion size. As shown in Figure 7a, at fixed octahedral cation, Alm–Gro garnet had higher excess volume than Ski (skiagite, Fe3Fe2Si3O12)–And garnet (data from [17,19,26,28,32]). Excess volume along the solid solution with Mg–Fe2+ exchanging on dodecahedron was also affected by the type of cation on the octahedron. Due to large radius difference between Al3+ and Fe3+ (△r = 0.11 Å [33]), excess volume also appeared for Gro–And and Alm–Gro solid solutions (Figure 7b). The results showed that an asymmetric negative excess volume toward the Al-bearing end-member was apparent in both solid solutions (Figure 7b).
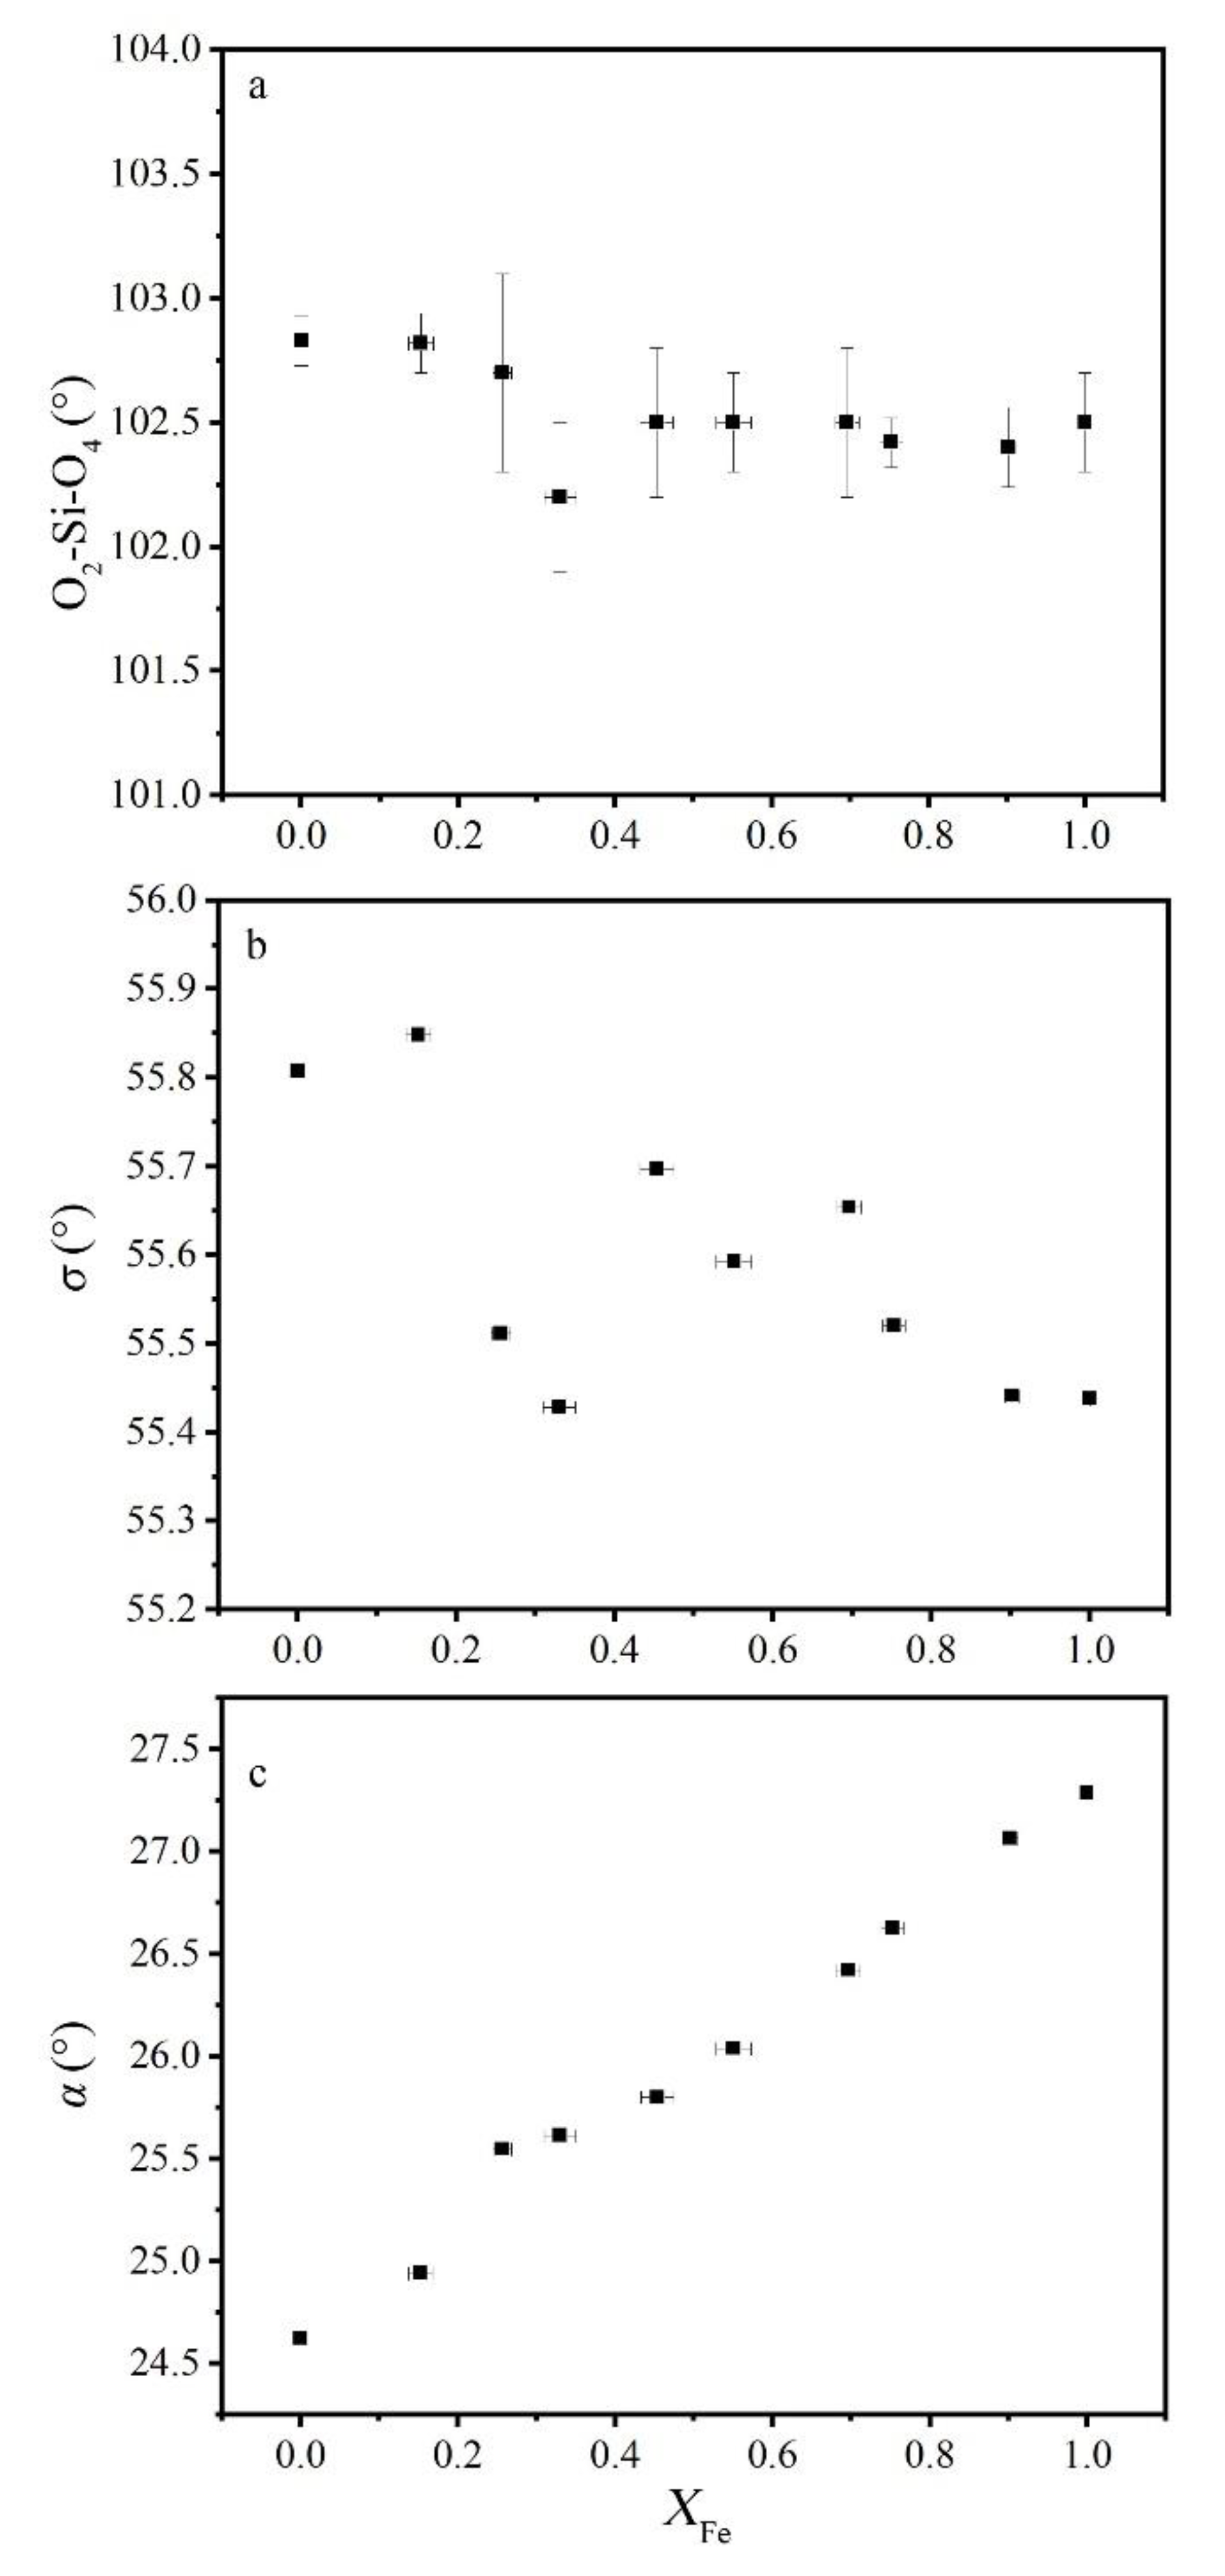
The excess volume along the Gro–And join reached the minimum value (−0.6 cm3/mol) at nearly 33% And, which might indicate maximum structural deformation. The volume of tetrahedron was almost constant in the calculated X, Y, and Z polyhedral volume (Figure 5a). This could also be proven by the fixed value of the Si–O bond length (Figure 5b) and the O2–Si–O4 angle (Figure 8a). When Al was completely substituted by Fe, the octahedron volume and Y–O length in Gro–And serials decreased from ~15.79% to ~4.99% (Figure 5a), whereas the bond length in Alm–Ski serials increased about 4.74% [28]. An approximately linear variation could be observed in the octahedron volume and the Y–O bond length, indicating that the octahedron had no obvious distortion (Figure 5). The main distortion seemed to occur in the dodecahedron, even though the volume only increased by 2.67%. Corresponding to excess volume, negative deviations of both polyhedral volume and X–O bond length were observed in Al-bearing samples. Similar to the Alm–Ski solid solution in Woodland and Ross (1994) [28], two inequivalent dodecahedral Ca–O bond had 0.48% and 1.68% growth rate for long and short bonds, respectively. This could be one of the reasons for the dodecahedral distortion.
Distortion of octahedron can be described by index σ (Figure 8b), which is the angle between the 3-axis and the Y–O bond [34]. When σ is equal to 54.75°, octahedron has the standard form. In Gro–And solid solution, σ slightly changed and became larger than 54.736°, which meant the octahedral site of garnet always had a flat shape and little structural distortion. Unexpectedly, Woodland and Ross (1994) [28] showed that σ changed from 53.34° to 55.42° on Ski–And solid solution, indicating greater influence of dodecahedral cation substitution. As the octahedron shared edges with neighboring dodecahedral sites, distortion was greater when cation substitutions occurred on neighboring dodecahedral sites than on the octahedral site itself. The opposite also seemed to be true for Gro–And solid solution, with the dodecahedral sites having more obvious distortion compared with octahedron in this study (Figure 5a).
For tetrahedron, two factors should be considered: (1) expansion or contraction along the 4-axis and (2) rotation around the 4-axis. Variation of O2–Si–O4 angle (Figure 8a) can be used to represent the degree of expansion or contraction distortion. Limited angle variation indicates this kind of distortion is low and can be ignored. Degree of rotation can be represented by the rotation of tetrahedron α [35], which is defined as the angle between the crystallographic a-axis and the polyhedral edge shared between the tetrahedra and dodecahedra. As shown in Figure 8c, α increased with increasing andradite content and had a negative deviation in Al-rich samples. The change in α might have been caused by Al–Fe substitution in the octahedral sites because the tetrahedra shared each corner with the octahedra. With the increase in Fe3+ content, the linked tetrahedra rotated to higher angles of α in an attempt to accommodate the larger octahedral cation into the network. In addition, the tetrahedra also shared edges with parts of the dodecahedra. Therefore, α has important structural implications on dodecahedra, such as inequivalent Ca–O(2)/Ca–O(4) bond increase [6,27,35,36,37], which can also cause distortions in the dodecahedral sites.
As structural distortion mainly occurred in the dodecahedral site for the Gro–And solid solution, the cation species substituted in dodecahedral site would affect the magnitude of the distortion (Figure 7b). Compared to Fe2+ with a smaller radius, dodecahedral site occupied by Ca2+ with a larger polyhedral volume and a longer X–O bond length seemed to be more easily distorted structurally.
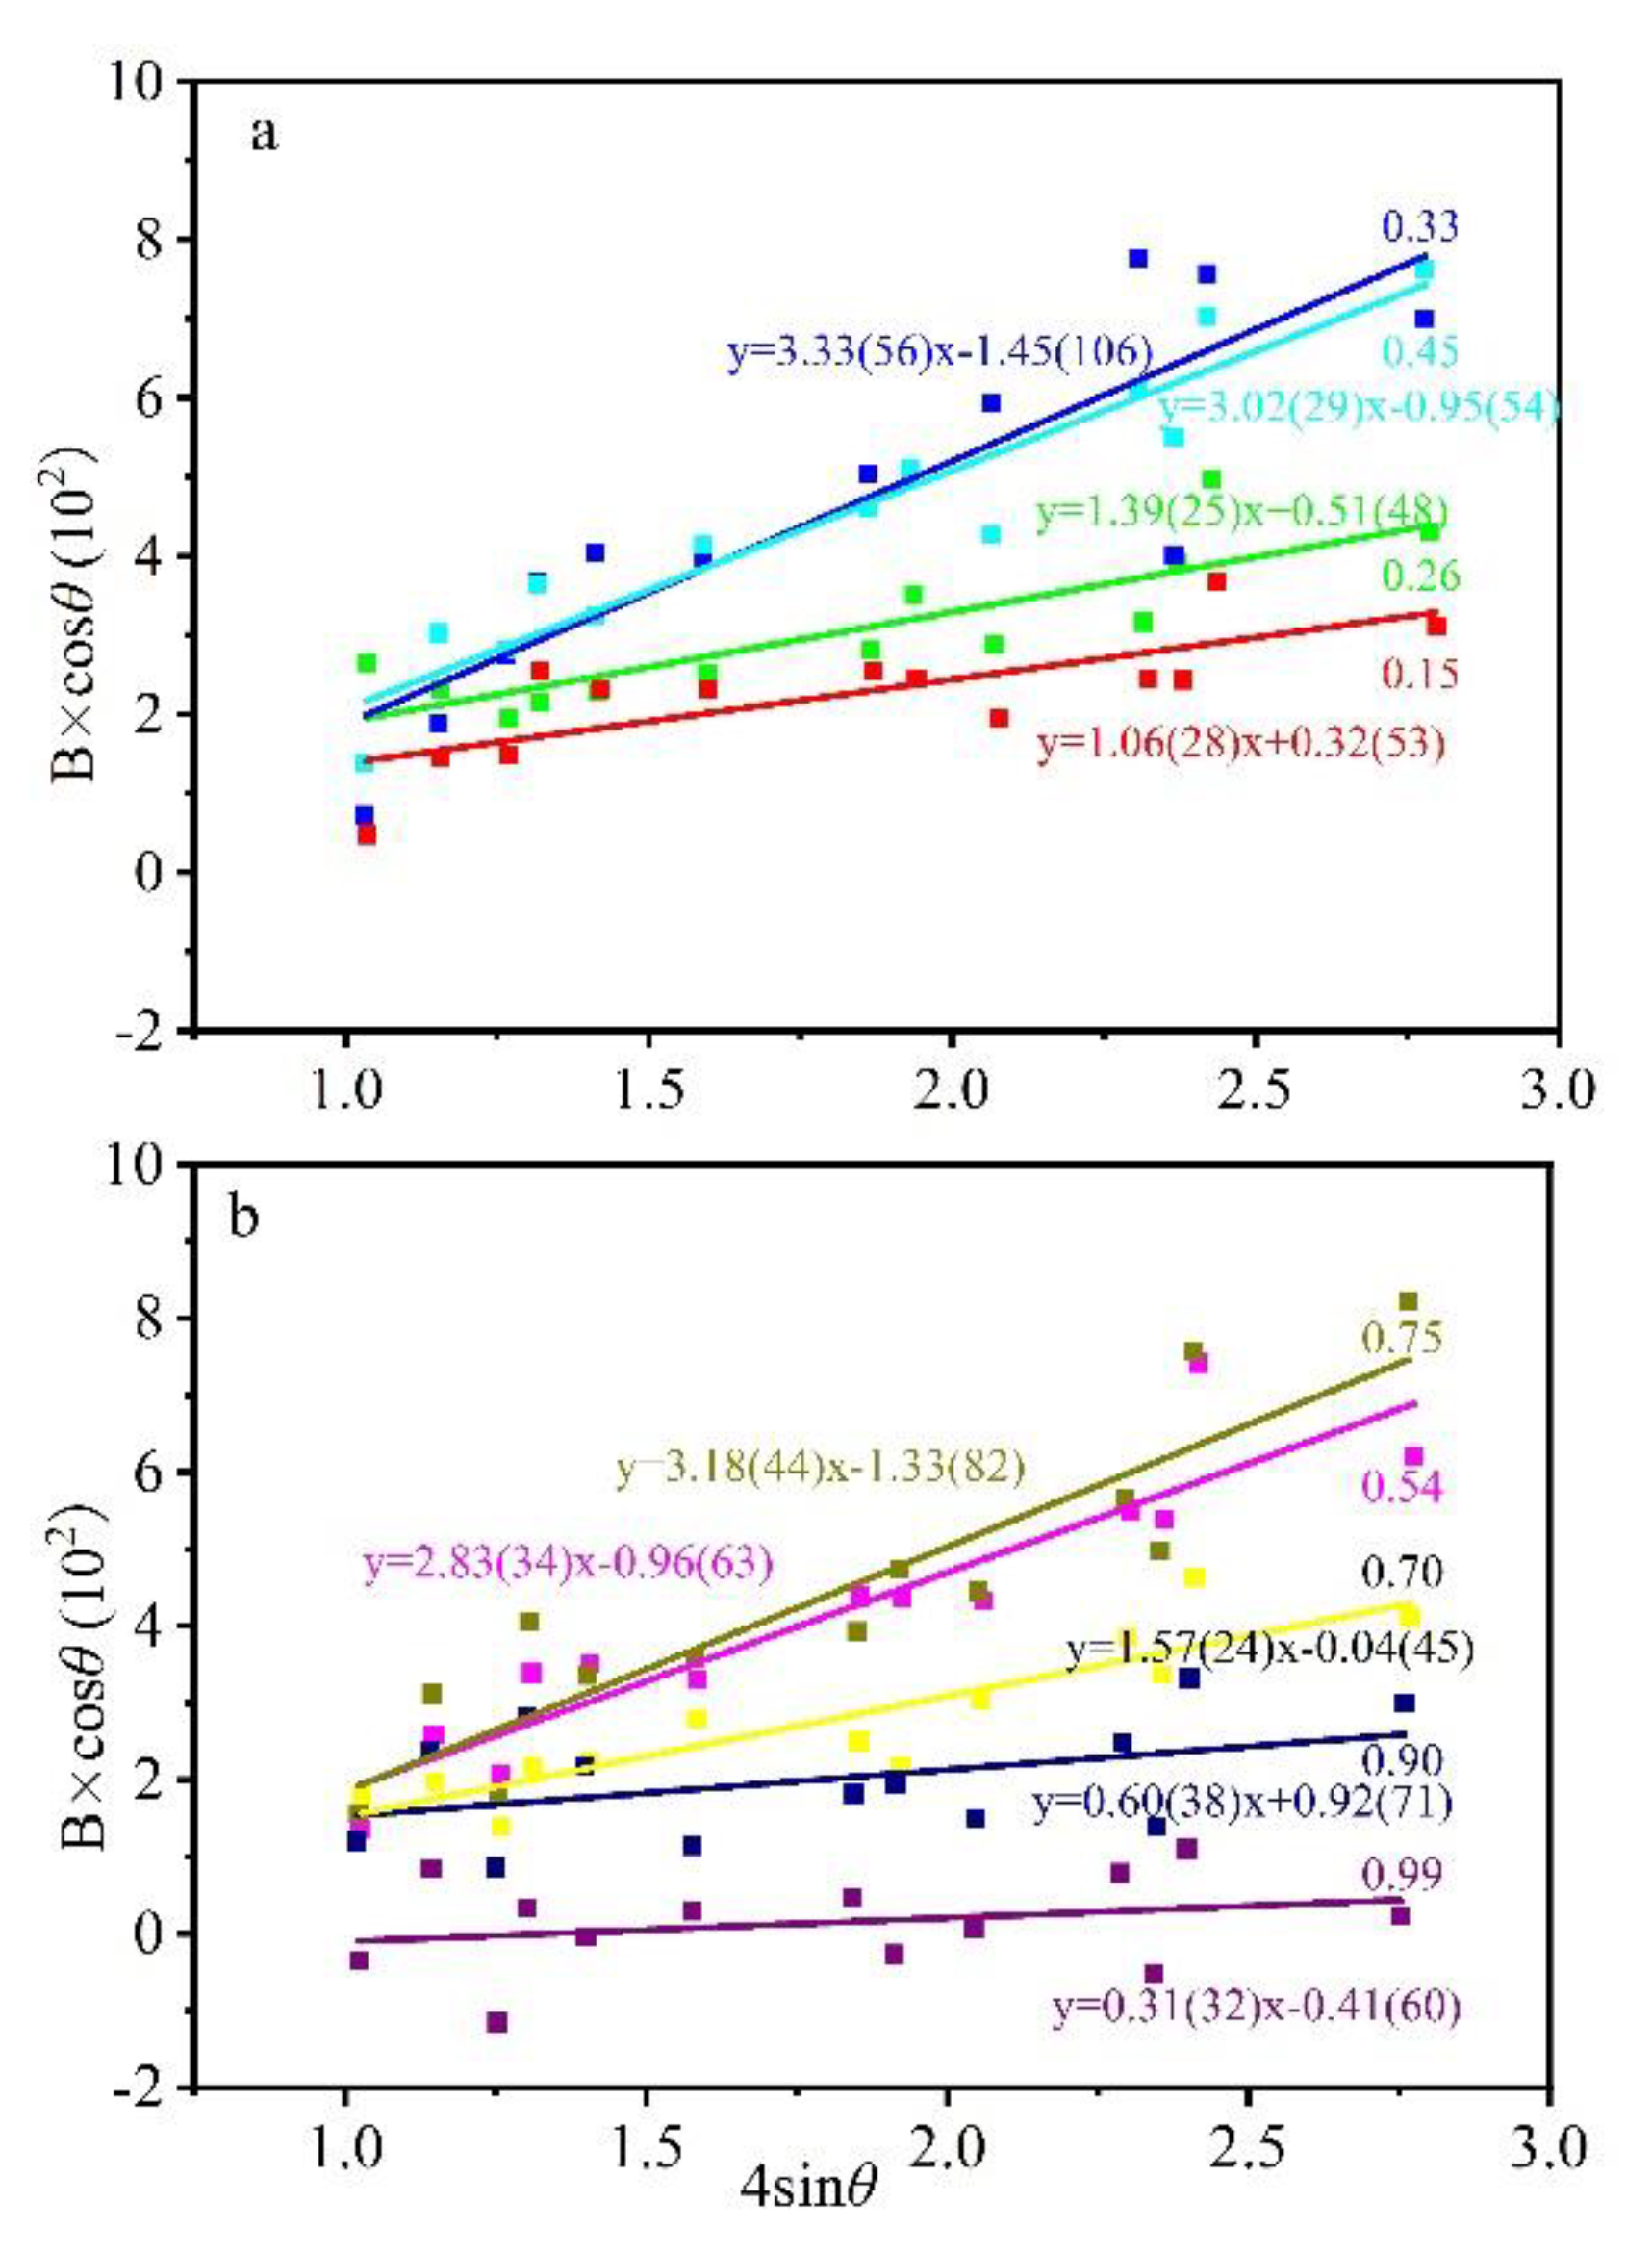
4.2. Microstrain
Williamson–Hall plot [38] establishes the relationship between peak broadening and microstrain and grain size:
where K = 0.94, L is related to crystal size, η is the microstrain factor, λ is the wavelength of the X-ray, and θ is the Bragg angle. The formula can be transformed into (Figure 9):
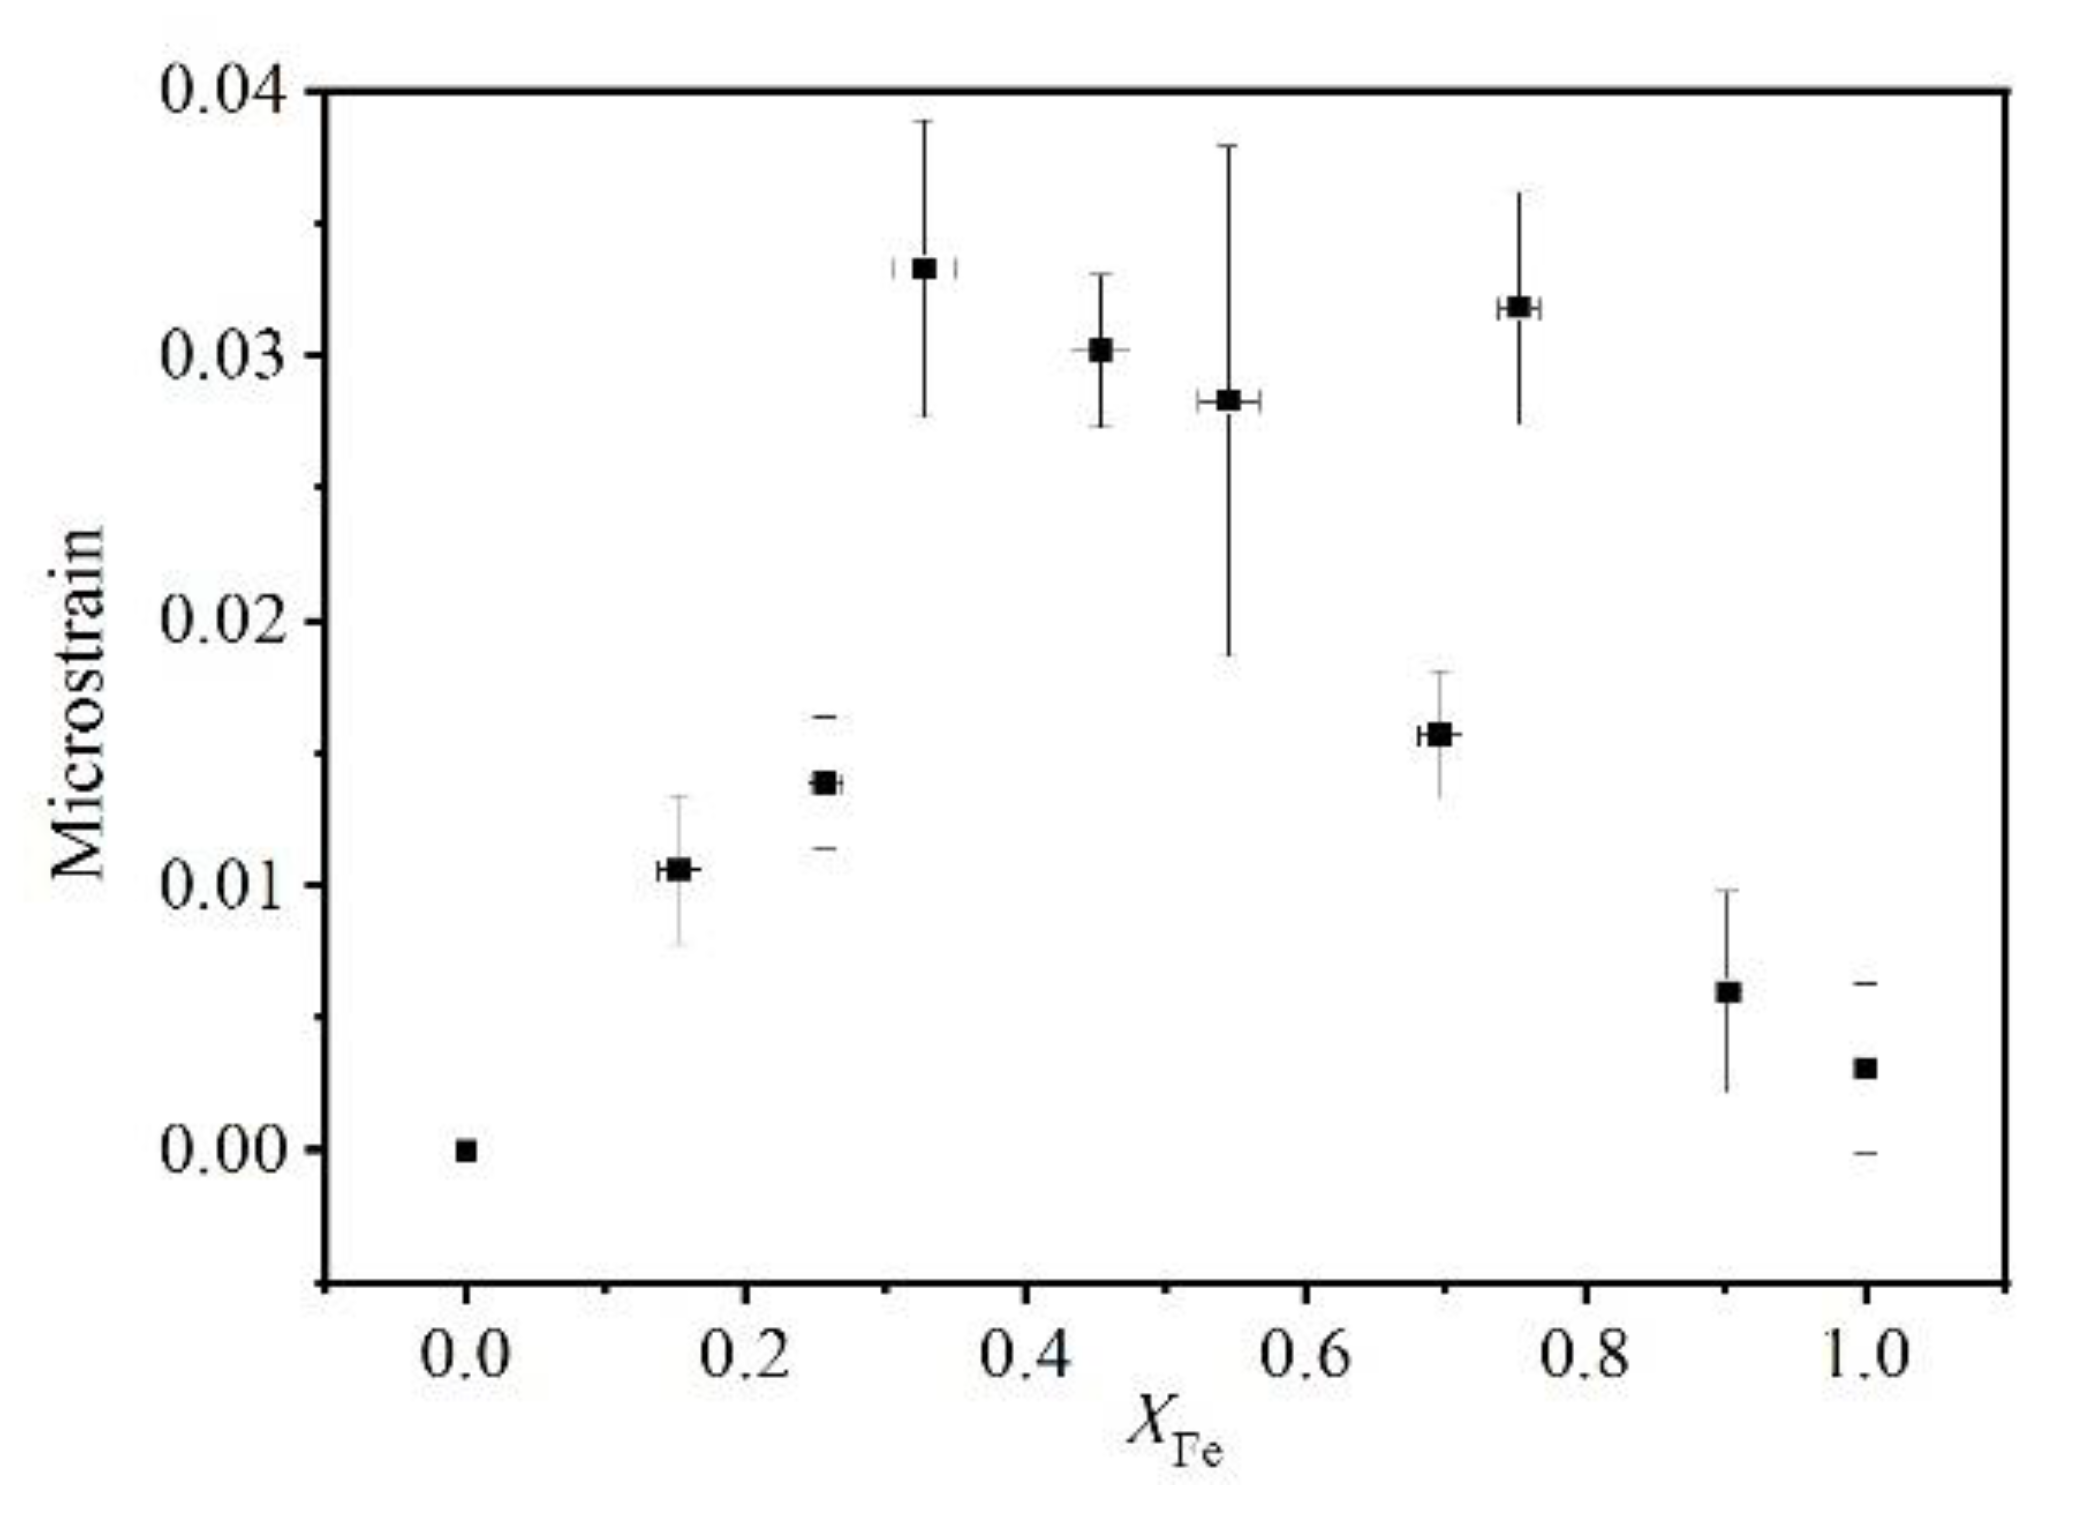
When the peak broadening was completely caused by the instrument, i.e., when the composition was purely grossular, the garnet showed little microstrain (Figure 10). The microstrain showed two maxima when the garnet had 33% and 75% andradite, respectively, and the value between the peaks was slightly lower. The double peak shape pattern was considered to be related to nonuniform lattice distortion (Figure 10), which was similar to the microstrain relationship for Pyr–Gro solid solution [15].
The size of the microstrain is related to defects [31]. Dapiaggi et al., (2005) [31] proposed that the microstrain in pyrope–grossular garnets may be related to excess enthalpies because elastic strain has an important contribution to mixing enthalpies [39]. However, Becker and Pollok (2002) [40] predicted nearly symmetric positive excess behavior of enthalpies in Gro–And solid solution. Due to complex contributions, such as elastic, electronic, and magnetic effects to thermodynamic properties, further research is necessary.
5. Conclusions
The analysis of XRD diffraction data along the grossular–andradite solid solution series showed that Al-rich samples had small negative excess volume. The dodecahedral volume and Ca–O bond length had a negative deviation at about 30–40% And, which seemed to be responsible for excess volume in the solid solution. The tight edge connection between the octahedral and dodecahedral sites as well as the nonlinear increase in the tetrahedral rotation angle α might be the reasons for dodecahedral distortion. Contrary to symmetric positive trend in excess enthalpies, microstrain calculated from powder X-ray diffraction data showed double peaks, which needs further investigation.
Author Contributions
Conceptualization, X.L.; experiments, Y.W. and X.B.; data processing, Y.W. and X.B.; writing—original draft preparation, Y.W. and X.B.; writing—review and editing, Y.W., X.B., D.D., and Q.S.; supervision, Q.S.; funding acquisition, Q.S. and X.L.
Funding
This research was funded by the Strategic Priority Research Program (B) of the Chinese Academy of Sciences, grant number XDB18000000, and by the National Natural Science Foundation of China, grant number 41773050.
Acknowledgments
We wish to thank Xiaoli Li for his help with EPMA analyses and Hejing Wang for powder XRD analyses.
Conflicts of Interest
The authors declare no conflict of interest.
References
- Irifune, T. An experimental investigation of the pyroxene-garnet transformation in a pyrolite composition and its bearing on the constitution of the mantle. Phys. Earth Planet. Inter. 1987, 45, 324–336. [Google Scholar] [CrossRef]
- Irifune, T.; Sekine, T.; Ringwood, A.E.; Hibberson, W.O. The eclogite–garnetite transformation at high-pressure and some geophysical implications. Earth Planet. Sci. Lett. 1986, 77, 245–256. [Google Scholar] [CrossRef]
- Conrad, P.G.; Zha, C.S.; Mao, H.K.; Hemley, R.J. The high-pressure, single-crystal elasticity of pyrope, grossular, and andradite. Am. Mineral. 1999, 84, 374–383. [Google Scholar] [CrossRef]
- Dachs, E.; Geiger, C.A. Thermodynamic behaviour of grossular-andradite, Ca3(Alx)2Si3O12, garnets: A calorimetric study. Eur. J. Mineral. 2019, 31, 443–451. [Google Scholar] [CrossRef]
- Du, W.; Clark, S.M.; Walker, D. Thermo-compression of pyrope–grossular garnet solid solutions: Non-linear compositional dependence. Am. Mineral. 2015, 100, 215–222. [Google Scholar] [CrossRef]
- Novak, G.A.; Gibbs, G.V. The crystal chemistry of the silicate garnets. Am. Mineral. 1971, 56, 791–825. [Google Scholar]
- Sun, C.G.; Liang, Y. The importance of crystal chemistry on REE partitioning between mantle minerals (garnet, clinopyroxene, orthopyroxene, and olivine) and basaltic melts. Chem. Geol. 2013, 358, 23–36. [Google Scholar] [CrossRef]
- Ganguly, J.; Cheng, W.J.; Oneill, H.S. Syntheses, volume, and structural changes of garnets in the pyrope–grossular join: Implications for stability and mixing properties. Am. Mineral. 1993, 78, 583–593. [Google Scholar]
- Geiger, C.A. A powder infrared spectroscopic investigation of garnet binaries in the system Mg3Al2Si3O12–Fe3Al2Si3O12–Mn3Al2Si3O12–Ca3Al2Si3O12. Eur. J. Mineral. 1998, 10, 407–422. [Google Scholar] [CrossRef]
- Geiger, C.A. Spectroscopic investigations relating to the structural, crystal-chemical and lattice-dynamic properties of (Fe2+, Mn2+, Mg, Ca)3Al2Si3O12 garnet: A review and analysis. In Spectroscopic Methods in Mineralogy; Beran, E.l.A., Libowitzky, E., Eds.; Eötvös University Press: Budapest, Hungary, 2004; Volume 6, pp. 589–645. [Google Scholar]
- Geiger, C.A.; Feenstra, A. Molar volumes of mixing of almandine–pyrope and almandine–spessartine garnets and the crystal chemistry and thermodynamic-mixing properties of the aluminosilicate garnets. Am. Mineral. 1997, 82, 571–581. [Google Scholar] [CrossRef]
- Merli, M.; Callegari, A.; Cannillo, E.; Caucia, F.; Leona, M.; Oberti, R.; Ungaretti, L. Crystal-chemical complexity in natural garnets: Structural constraints on chemical variability. Eur. J. Mineral. 1995, 7, 1239–1249. [Google Scholar] [CrossRef]
- Ungaretti, L.; Leona, M.; Merli, M.; Oberti, R. Non-ideal solid-solution in garnet: Crystal-structure evidence and modelling. Eur. J. Mineral. 1995, 7, 1299–1312. [Google Scholar] [CrossRef]
- Dachs, E.; Geiger, C.A. Heat capacities and entropies of mixing of pyrope–grossular (Mg3Al2Si3O12–Ca3Al2Si3O12) garnet solid solutions: A low-temperature calorimetric and a thermodynamic investigation. Am. Mineral. 2006, 91, 894–906. [Google Scholar] [CrossRef]
- Du, W.; Clark, S.M.; Walker, D. Excess mixing volume, microstrain, and stability of pyrope-grossular garnets. Am. Mineral. 2016, 101, 193–204. [Google Scholar] [CrossRef]
- Newton, R.C.; Charlu, T.V.; Kleppa, O.J. Thermochemistry of high pressure garnets and clinopyroxenes in the system CaO–MgO–Al2O3–SiO2. Geochim. Cosmochim. Acta 1977, 41, 369–377. [Google Scholar] [CrossRef]
- Boffa-Ballaran, T.; Woodland, A.B. Local structure of ferric iron-bearing garnets deduced by IR-spectroscopy. Chem. Geol. 2006, 225, 360–372. [Google Scholar] [CrossRef]
- McAloon, B.P.; Hofmeister, A.M. Single-crystal IR spectroscopy of grossular-andradite garnets. Am. Mineral. 1995, 80, 1145–1156. [Google Scholar] [CrossRef]
- Heuss-Aßbichler, S.; Fehr, K.T. Intercrystalline exchange of Al and Fe3+ between grossular–andradite and clinozoisite–epidote solid solutions. Neues Jahrb. für Mineral.–Abh. 1997, 172, 69–100. [Google Scholar]
- Liu, X.; Chen, J.L.; Tang, J.J.; He, Q.; Li, S.C.; Peng, F.; He, D.W.; Zhang, L.F.; Fei, Y.W. A large volume cubic press with a pressure-generating capability up to about 10 GPa. High Press. Res. 2012, 32, 239–254. [Google Scholar] [CrossRef]
- He, Q.; Tang, J.J.; Wang, F.; Liu, X. High Temperature Stable Assembly Designed for Cubic Press. Chin. J. High Press. Phys. 2014, 28, 145–151. [Google Scholar]
- Chen, T.; Wang, Y.C.; Bao, X.J.; Ma, Y.L.; Liu, L.P.; Liu, X. Heating Technique, Temperature Measurement, and Temperature Distribution in High Pressure Experiments on Large Volume Press. J. Earth Sci. Environ. 2018, 40, 428–448. [Google Scholar]
- Holland, T.J.B.; Redfern, S.A.T. Unit cell refinement from powder diffraction data: The use of regression diagnostics. Mineral. Mag. 1997, 61, 65–77. [Google Scholar] [CrossRef]
- Liu, X.; O’Neill, H.S.C. The effect of Cr2O3 on the partial melting of spinel lherzolite in the system CaO–MgO–Al2O3–SiO2–Cr2O3 at 1.1 GPa. J. Petrol. 2004, 45, 2261–2286. [Google Scholar] [CrossRef]
- Xu, C.; Kynicky, J.; Tao, R.B.; Liu, X.; Zhang, L.F.; Pohanka, M.; Song, W.L.; Fei, Y.W. Recovery of an oxidized majorite inclusion from Earth’s deep asthenosphere. Sci. Adv. 2017, 3, e1601589. [Google Scholar] [CrossRef]
- Geiger, C.A.; Newton, R.C.; Kleppa, O.J. Enthalpy of mixing of synthetic almandine–grossular and almandine–pyrope garnets from high temperature solution calorimetry. Geochim Cosmochim Acta 1987, 51, 1755–1763. [Google Scholar] [CrossRef]
- Armbruster, T.; Geiger, C.A. Andradite crystal chemistry, dynamic X-site disorder, and structural strain in silicate garnets. Eur. J. Mineral. 1993, 5, 59–71. [Google Scholar] [CrossRef]
- Woodland, A.B.; Ross II, C.R. A crystallographic and Mossbauer Spectroscopy Study of Fe32+Al2Si3O12–Fe32+Fe23+Si3O12 (Almandine–”Skiagite”) and Ca3Fe23+Si3O12–Fe32+Fe23+Si3O12 (Andradite–”Skiagite”) Garnet Solid Solutions. Phys. Chem. Miner. 1994, 21, 117–132. [Google Scholar] [CrossRef]
- Antao, S.M.; Klincker, A.M. Crystal structure of a birefringent andradite–grossular from Crowsnest Pass, Alberta, Canada. Powder Diffr. 2014, 29, 20–27. [Google Scholar] [CrossRef]
- Antao, S.M.; Salvador, J.J. Crystal chemistry of Birefringent Uvarovite Solid Solutions. Minerals 2019, 9, 395. [Google Scholar] [CrossRef]
- Dapiaggi, M.; Geiger, C.A.; Artioli, G. Microscopic strain in synthetic pyrope–grossular solid solutions determined by synchrotron X-ray powder diffraction at 5 K: The relationship to enthalpy of mixing behavior. Am. Mineral. 2005, 90, 506–509. [Google Scholar] [CrossRef]
- Cressey, G.; Schmid, R.; Wood, B.J. Thermodynamic properties of almandine–grossular garnet solid solutions. Contrib. Mineral. Petrol. 1978, 67, 397–404. [Google Scholar] [CrossRef]
- Shannon, R.D. Revised effective ionic radii and systematic studies of interatomic distances in halides and chalcogenides. Acta Crystallogr. 1976, 32, 751–767. [Google Scholar] [CrossRef]
- Euler, F.; Bruce, J.A. Oxygen coordinates of compounds with garnet structure. Acta Crystallogr. 1965, 19, 971–978. [Google Scholar] [CrossRef]
- Born, L.; Zemann, J. Abstandsberechnung und gitterenergetische Berechnungen an Granaten. Beitr Miner. Petrogr 1964, 10, 2–23. [Google Scholar]
- Armbruster, T.; Geiger, C.A.; Lager, G.A. Single-crystal X-ray structure study of synthetic pyrope almandine garnets at 100 and 293 K. Am. Mineral. 1992, 77, 512–521. [Google Scholar]
- Meagher, E.P. The crystal structures of pyrope and grossularite at elevated temperatures. Am. Mineral. 1975, 60, 218–228. [Google Scholar]
- Williamson, G.K.; Hall, W.H. X-ray broadening from filed aluminium and wolfram. Acta Metall. 1953, 1, 22–31. [Google Scholar] [CrossRef]
- Boffa-Ballaran, T.; Carpenter, M.A.; Geiger, C.A.; Koziol, A.M. Local structural heterogeneity in garnet solid solutions. Phys. Chem. Miner. 1999, 26, 554–569. [Google Scholar] [CrossRef]
- Becker, U.; Pollok, K. Molecular simulations of interfacial and thermodynamic mixing properties of grossular–andradite garnets. Phys. Chem. Miner. 2002, 29, 52–64. [Google Scholar] [CrossRef]
Figure 1.
Electron backscattered images showing the textures of the synthesized samples: (a) LMD611, (b) LMD618, (c) LMD622, (d) LMD631, (e) LMD613, and (f) LMD625. Garnet (Gt) and melts are shown in each figure. A little bit of unreacted starting material (less than 1%) was contained in large grains of garnet in sample LMD611.

Figure 2.
X-ray diffraction patterns of grossular–andradite solid solutions at ambient P–T condition. All the major peaks attributed to garnets are marked with hkl symbol (Miller indices). The Bragg peaks of Pt powder are denoted by solid triangles (Pt standard was not used in this study, see text). The number represents the mole fraction of andradite component (x = Fe3+/(Fe3+ + Al3+)).

Figure 3.
Effect of composition (x) on (a) unit-cell parameters and (b) unit-cell volume of grossular–andradite solid solution. The equations shown are fitted by least-squares analysis.
Figure 3.
Effect of composition (x) on (a) unit-cell parameters and (b) unit-cell volume of grossular–andradite solid solution. The equations shown are fitted by least-squares analysis.

Figure 4.
Excess volumes of mixing in grossular–andradite solid solution. A negative deviation was observed in Al-rich samples for all studies. The dashed line is fitted using single-crystal XRD data by two-parameter Margules equation.
Figure 4.
Excess volumes of mixing in grossular–andradite solid solution. A negative deviation was observed in Al-rich samples for all studies. The dashed line is fitted using single-crystal XRD data by two-parameter Margules equation.

Figure 5.
(a) Volume of polyhedra and (b) cation–oxygen distances at the X (dodecahedral), Y (octahedral), and Z (tetrahedral) sites as a function of composition. Ca–O(2) and Ca–O(4) are shorter and longer bond in dodecahedron, respectively. Negative deviations were observed in Al-rich samples depending on variations in dodecahedral volume and Ca–O bond length.

Figure 6.
The full width at half maximum (FWHM) values of X-ray diffraction peaks (used for unit-cell calculation) on garnets with different compositions. (a) grossular-rich samples, (b) andradite-rich samples. The number represents the mole fraction of andradite component. Garnet solid solutions with intermediate composition showed broader XRD peaks than end-members. For samples with a constant composition, XRD peak broadening increased with Bragg angle (lines with different colors only serve as labels and have no practical meaning).

Figure 7.
Excess volumes of mixing in (a) almandine–grossular and skiagite–andradite solid solutions and (b) grossular–andradite and almandine–skiagite solid solutions.
Figure 7.
Excess volumes of mixing in (a) almandine–grossular and skiagite–andradite solid solutions and (b) grossular–andradite and almandine–skiagite solid solutions.

Figure 8.
(a) Angle variance of O2–Si–O4 in tetrahedron, (b) the octahedral distortion parameter σ (Euler and Bruce (1965) [34]), and (c) the tetrahedral rotation parameter α (Born and Zemann (1964) [34]) as a function of composition for grossular–andradite solid solution.

Figure 9.
Williamson–Hall plot for XRD peak widening data of grossular–andradite solid solution. The number represents the mole fraction of andradite component. The slope of equation represents the microstrain factor (η). (a) grossular-rich samples; (b) andradite-rich samples.
Figure 9.
Williamson–Hall plot for XRD peak widening data of grossular–andradite solid solution. The number represents the mole fraction of andradite component. The slope of equation represents the microstrain factor (η). (a) grossular-rich samples; (b) andradite-rich samples.

Figure 10.
Microstrain inside garnet structure calculated from X-ray peak broadening along the pyrope–grossular join.
Figure 10.
Microstrain inside garnet structure calculated from X-ray peak broadening along the pyrope–grossular join.


Table 1.
Starting compositions used in this study.
| Target x a | Composition | SiO2 b | Al2O3 b | Fe2O3 b | CaO b |
|---|---|---|---|---|---|
| 0.0 | Gro c100And d0 | 40.02 | 22.64 | 0.00 | 37.35 |
| 0.1 | Gro90And10 | 39.51 | 20.11 | 3.50 | 36.88 |
| 0.2 | Gro80And20 | 39.02 | 17.66 | 6.91 | 36.42 |
| 0.3 | Gro70And30 | 38.53 | 15.26 | 10.24 | 35.97 |
| 0.4 | Gro60And40 | 38.06 | 12.92 | 13.49 | 35.53 |
| 0.5 | Gro50And50 | 37.61 | 10.64 | 16.66 | 35.10 |
| 0.6 | Gro40And60 | 37.16 | 8.41 | 19.75 | 34.68 |
| 0.7 | Gro30And70 | 36.72 | 6.23 | 22.77 | 34.27 |
| 0.8 | Gro20And80 | 36.29 | 4.11 | 25.72 | 33.88 |
| 0.9 | Gro10And90 | 35.88 | 2.03 | 28.61 | 33.49 |
| 1.0 | Gro0And100 | 35.47 | 0.00 | 31.42 | 33.11 |
ax = Fe3+/(Fe3+ + Al3+) (atomic ratio); b Content in wt %; c Gro stands for grossular Ca3Al2Si3O12; d And stands for andradite Ca3Fe2Si3O12.
Table 2.
Experimental conditions and results (all experiments were performed at 3 GPa).
| Run # | Xa | T (°C) | t (h) b | Phase Assemblage | Notes |
|---|---|---|---|---|---|
| LMD611 | 0.0 | 1200 | 24 | Gt + melt | Gt size ~20–100 μm; vol % of melt ~5% c |
| LMD634 | 0.1 | 1200 | 28 | Gt + melt + gas d | Gt size ~20–500 μm; vol % of melt ~20%; almost all Fe lost to the Pt capsule |
| LMD584 | 0.2 | 1200 | 24 | Gt + melt | Gt size ~30–50 μm; vol % of melt ~5% |
| LMD618 | 0.3 | 1200 | 24 | Gt + melt + gas | Gt size ~20–200 μm; vol % of melt ~5% |
| LMD589 | 0.4 | 1200 | 24 | Gt + melt | Gt size ~30–80 μm; vol % of melt ~5% |
| LMD622 | 0.5 | 1200 | 28 | Gt + melt + gas | Gt size ~20–50 μm; vol % of melt ~5% |
| LMD631 | 0.6 | 1200 | 28 | Gt + melt + gas | Gt size ~40–60 μm; vol % of melt ~5% |
| LMD613 | 0.7 | 1200 | 24 | Gt + melt + gas | Gt size ~ 50 μm; vol % of melt ~5% |
| LMD581 | 0.8 | 1200 | 24 | Gt + melt | Gt size ~50–100 μm; vol % of melt < 5% |
| LMD632 | 0.9 | 1100 | 28 | Gt + melt + gas | Gt size ~20–100 μm; vol % of melt ~5% |
| LMD625 | 1.0 | 1100 | 28 | Gt + melt | Gt size ~100–500 μm; vol % of melt ~30% |
a Target x, with x = Fe3+/(Fe3+ + Al3+); b Experimental duration in hours; c Melt volume contents in notes were estimated from electron backscattered images; d Gas was identified by the observation of bubbling from the Pt capsule when the capsule was sanded open with dry silicon carbide abrasive paper because water and oxygen are the main components of the gas. We did not check the presence of gas for samples LMD581, LMD584, and LMD589.
Table 3.
Atom fraction coordinate a and refinement results.
| Comp. b | Oxygen Atom Coordinate | Refinement Results | ||||
|---|---|---|---|---|---|---|
| x | y | z | R1 | wR2 | GooF | |
| 0.00 (0) c | 0.0384 (1) | 0.5453 (1) | 0.3487 (1) | 0.0267 | 0.0769 | 1.012 |
| 0.15 (2) | 0.0387 (2) | 0.5456 (2) | 0.3480 (1) | 0.0269 | 0.0780 | 1.001 |
| 0.26 (1) | 0.0383 (5) | 0.5465 (6) | 0.3475 (5) | 0.0682 | 0.1517 | 1.077 |
| 0.33 (2) | 0.0379 (4) | 0.5464 (4) | 0.3471 (4) | 0.0521 | 0.0937 | 1.059 |
| 0.45 (2) | 0.0390 (3) | 0.5467 (3) | 0.3466 (3) | 0.0377 | 0.0938 | 1.015 |
| 0.54 (2) | 0.0389 (3) | 0.5471 (3) | 0.3464 (3) | 0.0377 | 0.0657 | 1.014 |
| 0.70 (2) | 0.0394 (4) | 0.5475 (3) | 0.3456 (3) | 0.0423 | 0.1048 | 1.010 |
| 0.75 (1) | 0.0392 (1) | 0.5479 (1) | 0.3455 (1) | 0.0189 | 0.0541 | 1.045 |
| 0.90 (1) | 0.0393 (2) | 0.5485 (2) | 0.3449 (2) | 0.0274 | 0.0746 | 1.091 |
| 0.99 (0) | 0.0395 (3) | 0.5488 (2) | 0.3446 (2) | 0.0371 | 0.0940 | 1.006 |
a Coordinate of Ca was fixed as (1/8 0 1/4), Si was fixed as (3/8 0 1/4), Al/Fe was as fixed (0 0 0); b Comp. stands for composition (Fe3+/(Fe3+ + Al3+)); c Number in the parentheses represents standard deviation in the rightmost digit.
Table 4.
Compositions of garnet.
| Run # | LMD611 | LMD634 | LMD584 | LMD618 | LMD589 | LMD622 | LMD631 | LMD613 | LMD581 | LMD632 | LMD625 |
|---|---|---|---|---|---|---|---|---|---|---|---|
| Target x | 0 | 0.1 | 0.2 | 0.3 | 0.4 | 0.5 | 0.6 | 0.7 | 0.8 | 0.9 | 1.0 |
| EMPA # | 11 | 18 | 19 | 23 | 12 | 20 | 28 | 24 | 10 | 28 | 12 |
| Wt % | |||||||||||
| SiO2 | 39.92(15) a | 40.27(21) | 39.27(16) | 38.49(17) | 38.23(28) | 37.35(23) | 37.06(29) | 35.86(17) | 36.05(36) | 35.54(29) | 34.73(23) |
| Al2O3 | 22.49(20) | 22.23(22) | 18.88(51) | 16.49(28) | 14.77(48) | 12.11(52) | 9.69(52) | 6.48(36) | 5.12(34) | 2.01(20) | 0.15(2) |
| Fe2O3 b | 0.00(0) | 0.40(34) | 5.30(55) | 8.87(44) | 11.27(81) | 15.67(67) | 18.14(71) | 22.89(58) | 24.38(58) | 28.68(50) | 31.85(31) |
| FeO b | 0.00(0) | 0.32(27) | 0.65(40) | 0.46(36) | 0.90(45) | 0.24(25) | 0.70(36) | 0.05(9) | 1.02(44) | 0.66(47) | 0.00(0) |
| CaO | 37.76(22) | 37.30(36) | 36.07(35) | 35.53(26) | 34.92(33) | 34.67(26) | 33.98(23) | 33.63(25) | 32.80(39) | 32.61(28) | 32.62(14) |
| Total | 100.23(37) | 100.61(32) | 100.26(41) | 99.93(45) | 100.08(54) | 100.11(50) | 99.64(42) | 99.01(47) | 99.47(79) | 99.59(55) | 99.44(51) |
| Cations on the basis of 12 oxygen | |||||||||||
| Si | 2.99(1) | 3.01(1) | 3.00(2) | 2.99(1) | 2.99(1) | 2.96(1) | 2.99(2) | 2.96(2) | 2.99(2) | 2.99(2) | 2.96(1) |
| Al | 1.98(2) | 1.96(1) | 1.70(4) | 1.51(2) | 1.36(4) | 1.13(4) | 0.92(5) | 0.63(3) | 0.50(3) | 0.20(2) | 0.01(0) |
| Fe3+ | 0.00(0) | 0.03(2) | 0.31(3) | 0.52(3) | 0.66(5) | 0.94(5) | 1.10(5) | 1.45(4) | 1.52(4) | 1.82(3) | 2.07(2) |
| Fe2+ | 0.00(0) | 0.02(2) | 0.04(3) | 0.03(2) | 0.06(3) | 0.02(2) | 0.05(2) | 0.00(1) | 0.07(3) | 0.05(3) | 0.00(0) |
| Ca | 3.03(1) | 2.99(2) | 2.95(2) | 2.95(1) | 2.93(3) | 2.95(2) | 2.94(2) | 2.98(2) | 2.91(2) | 2.94(2) | 2.98(1) |
| Total | 8.00(0) | 8.00(1) | 8.00(1) | 8.00(1) | 8.00(0) | 8.00(1) | 8.00(0) | 8.02(2) | 8.00(0) | 8.00(0) | 8.02(1) |
| Fe3+/∑Fe | – | – | 0.88(7) | 0.95(4) | 0.92(4) | 0.98(2) | 0.96(2) | 1.00(0) | 0.96(2) | 0.98(2) | 1.00(0) |
| Observed x | 0.00(0) | 0.01(1) | 0.15(2) | 0.26(1) | 0.33(2) | 0.45(2) | 0.54(2) | 0.70(2) | 0.75(1) | 0.90(1) | 0.99(0) |
| X2+ | 3.03(1) | 3.01(1) | 2.99(1) | 2.98(1) | 2.99(1) | 2.96(1) | 2.98(2) | 2.98(1) | 2.98(2) | 2.99(2) | 2.98(1) |
| Y3+ | 1.98(2) | 1.98(2) | 2.00(3) | 2.03(3) | 2.02(2) | 2.07(3) | 2.02(3) | 2.08(4) | 2.02(3) | 2.02(3) | 2.08(2) |
| Z4+ | 2.99(1) | 3.01(1) | 3.00(2) | 2.99(1) | 2.99(1) | 2.96(1) | 2.99(2) | 2.96(2) | 2.99(2) | 2.99(2) | 2.96(1) |
| Si | 2.99(1) | 3.01(1) | 3.00(2) | 2.99(1) | 2.99(1) | 2.96(1) | 2.99(2) | 2.96(2) | 2.99(2) | 2.99(2) | 2.96(1) |
| Al | 1.98(2) | 1.96(1) | 1.70(4) | 1.51(2) | 1.36(4) | 1.13(4) | 0.92(5) | 0.63(3) | 0.50(3) | 0.20(2) | 0.01(0) |
| Fe3+ | 0.00(0) | 0.03(2) | 0.31(3) | 0.52(3) | 0.66(5) | 0.94(5) | 1.10(5) | 1.45(4) | 1.52(4) | 1.82(3) | 2.07(2) |
| Observed x | 0.00(0) | 0.01(1) | 0.15(2) | 0.26(1) | 0.33(2) | 0.45(2) | 0.54(2) | 0.70(2) | 0.75(1) | 0.90(1) | 0.99(0) |
| X2+ | 3.03(1) | 3.01(1) | 2.99(1) | 2.98(1) | 2.99(1) | 2.96(1) | 2.98(2) | 2.98(1) | 2.98(2) | 2.99(2) | 2.98(1) |
| Y3+ | 1.98(2) | 1.98(2) | 2.00(3) | 2.03(3) | 2.02(2) | 2.07(3) | 2.02(3) | 2.08(4) | 2.02(3) | 2.02(3) | 2.08(2) |
| Z4+ | 2.99(1) | 3.01(1) | 3.00(2) | 2.99(1) | 2.99(1) | 2.96(1) | 2.99(2) | 2.96(2) | 2.99(2) | 2.99(2) | 2.96(1) |
a Number in the parentheses represents standard deviation in the rightmost digit. b Fe2O3 and FeO are calculated using the charge balance method.
Table 5.
The unit-cell size, excess volume, and microstrain of grossular–andradite garnet solid solutions (3 GPa, 1200 °C).
Table 5.
The unit-cell size, excess volume, and microstrain of grossular–andradite garnet solid solutions (3 GPa, 1200 °C).
| Comp.X a | Powder XRD | Single-Crystal XRD | |||||||
|---|---|---|---|---|---|---|---|---|---|
| a (Å) | V (Å3) | Mol V | Excess V | Microstr | a (Å) | V (Å3) | Mol V | Excess V | |
| (cm3/mol) | (cm3/mol) | ain(10−2) | (cm3/mol) | (cm3/mol) | |||||
| 0.00(0)b | 11.8484(3) | 1663.31(11) | 125.16(1) | 0 | 0 | 11.8418(3) | 1660.55(11) | 124.96(1) | 0 |
| 0.15(2) | 11.8736(3) | 1673.97(11) | 125.97(1) | −0.209(1) | 1.06(28) | 11.8677(4) | 1671.47(11) | 125.78(1) | −0.213(1) |
| 0.26(1) | 11.8909(3) | 1681.30(11) | 126.52(1) | −0.348(1) | 1.39(25) | 11.8869(9) | 1681.30(11) | 126.52(1) | −0.308(1) |
| 0.33(2) | 11.8977(3) | 1684.17(11) | 126.73(1) | −0.620(1) | 3.33(56) | 11.8950(4) | 1683.04(11) | 126.65(1) | −0.549(1) |
| 0.45(2) | 11.9338(3) | 1699.55(11) | 128.08(1) | −0.283(1) | 3.02(29) | 11.9253(8) | 1695.93(11) | 127.62(1) | −0.417(1) |
| 0.54(2) | 11.9610(3) | 1711.19(12) | 129.04(1) | −0.053(1) | 2.83(34) | 11.9524(15) | 1702.52(12) | 128.49(1) | −0.206(1) |
| 0.70(2) | 11.9899(3) | 1723.64(12) | 129.70(1) | −0.080(1) | 1.57(24) | 11.9878(14) | 1722.73(12) | 129.64(1) | −0.047(1) |
| 0.75(1) | 12.0070(3) | 1731.02(12) | 130.26(1) | 0.100(1) | 3.18(44) | 12.0018(3) | 1728.78(12) | 130.09(1) | 0.024(1) |
| 0.90(1) | 12.0390(3) | 1744.89(12) | 131.30(1) | 0.153(1) | 0.60(38) | 12.0332(3) | 1742.38(12) | 131.11(1) | 0.034(1) |
| 0.99(0) | 12.0542(3) | 1751.50(12) | 131.80(1) | 0 | 0.31(32) | 12.0525(7) | 1750.78(12) | 131.75(1) | 0 |
a Comp. stands for composition, x = Fe3+/(Fe3+ + Al3+); b Number in the parentheses represents standard deviation in the rightmost digit.
Table 6.
Unit-cell parameter of quenched end-member grossular and andradite garnets from different studies.
Table 6.
Unit-cell parameter of quenched end-member grossular and andradite garnets from different studies.
| Comp a | T (°C) | P (GPa) | t (h) b | a (Å) | Reference |
|---|---|---|---|---|---|
| Gro c | 1200 | 3.0 | 24 | 11.8484(3) | This study, powder XRD |
| Gro | 1200 | 3.0 | 28 | 11.8418(3) | This study, single-crystal XRD |
| Gro | 1150 | 2.7 | 48 | 11.851(1) | Geiger et al., (1987) [26], powder XRD |
| Gro | 1350–1400 | 4.0–4.2 | 48 | 11.8515(2) | Ganguly et al., (1993) [8], powder XRD |
| Gro | 1400 | 6.0 | 0.5 | 11.850(2) | Du et al., (2016) [15], powder XRD |
| Andd | 1100 | 3.0 | 24 | 12.0542(3) | This study, powder XRD |
| And | 1100 | 3.0 | 28 | 12.0525(7) | This study, single-crystal XRD |
| And | 1200 | 2.0 | 12.063(1) | Armbruster and Geiger (1993) [27], single-crystal XRD | |
| And | 1100 | 1.2 | 91 | 12.0596(2) | Woodland and Ross (1994) [28], powder XRD |
a Comp. stands for composition; b Experimental duration in hours; c Gro stands for grossular Ca3Al2Si3O12.; d And stands for andradite Ca3Fe2Si3O12.
© 2019 by the authors. Licensee MDPI, Basel, Switzerland. This article is an open access article distributed under the terms and conditions of the Creative Commons Attribution (CC BY) license (http://creativecommons.org/licenses/by/4.0/).
Share and Cite
MDPI and ACS Style
Wang, Y.; Sun, Q.; Duan, D.; Bao, X.; Liu, X. The Study of Crystal Structure on Grossular–Andradite Solid Solution. Minerals 2019, 9, 691. https://0-doi-org.brum.beds.ac.uk/10.3390/min9110691
AMA Style
Wang Y, Sun Q, Duan D, Bao X, Liu X. The Study of Crystal Structure on Grossular–Andradite Solid Solution. Minerals. 2019; 9(11):691. https://0-doi-org.brum.beds.ac.uk/10.3390/min9110691
Chicago/Turabian StyleWang, Yichuan, Qiang Sun, Dengfei Duan, Xinjian Bao, and Xi Liu. 2019. "The Study of Crystal Structure on Grossular–Andradite Solid Solution" Minerals 9, no. 11: 691. https://0-doi-org.brum.beds.ac.uk/10.3390/min9110691
Note that from the first issue of 2016, this journal uses article numbers instead of page numbers. See further details here.