
Explosives Use in Decommissioning—Guide for Assessment of Risk (EDGAR): II Determination of Sound Exposure Levels for Open Water Blasts and Severance of Conductors and Piles from below the Seabed


Abstract
:
1. Introduction
1.1. Regulatory Context
1.2. Problem Definition
1.3. Receivers Potentially at Risk from Underwater Explosive Severance Noise
1.3.1. Marine Invertebrates
1.3.2. Fish
Hearing Loss
Injury
Particle Motion
1.3.3. Marine Mammals
Characterisation of Hearing Sensitivities
1.4. Innovation
1.5. Aims
2. Materials and Methods
2.1. Sound Pressure Level
2.2. Sound Exposure Level
2.3. Marine Mammal Auditory Weighting Functions
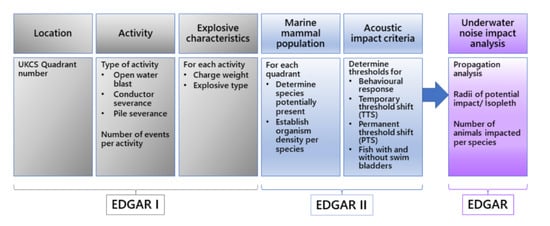
2.4. Using EDGAR to Calculate SEL and Determine Impact Radii
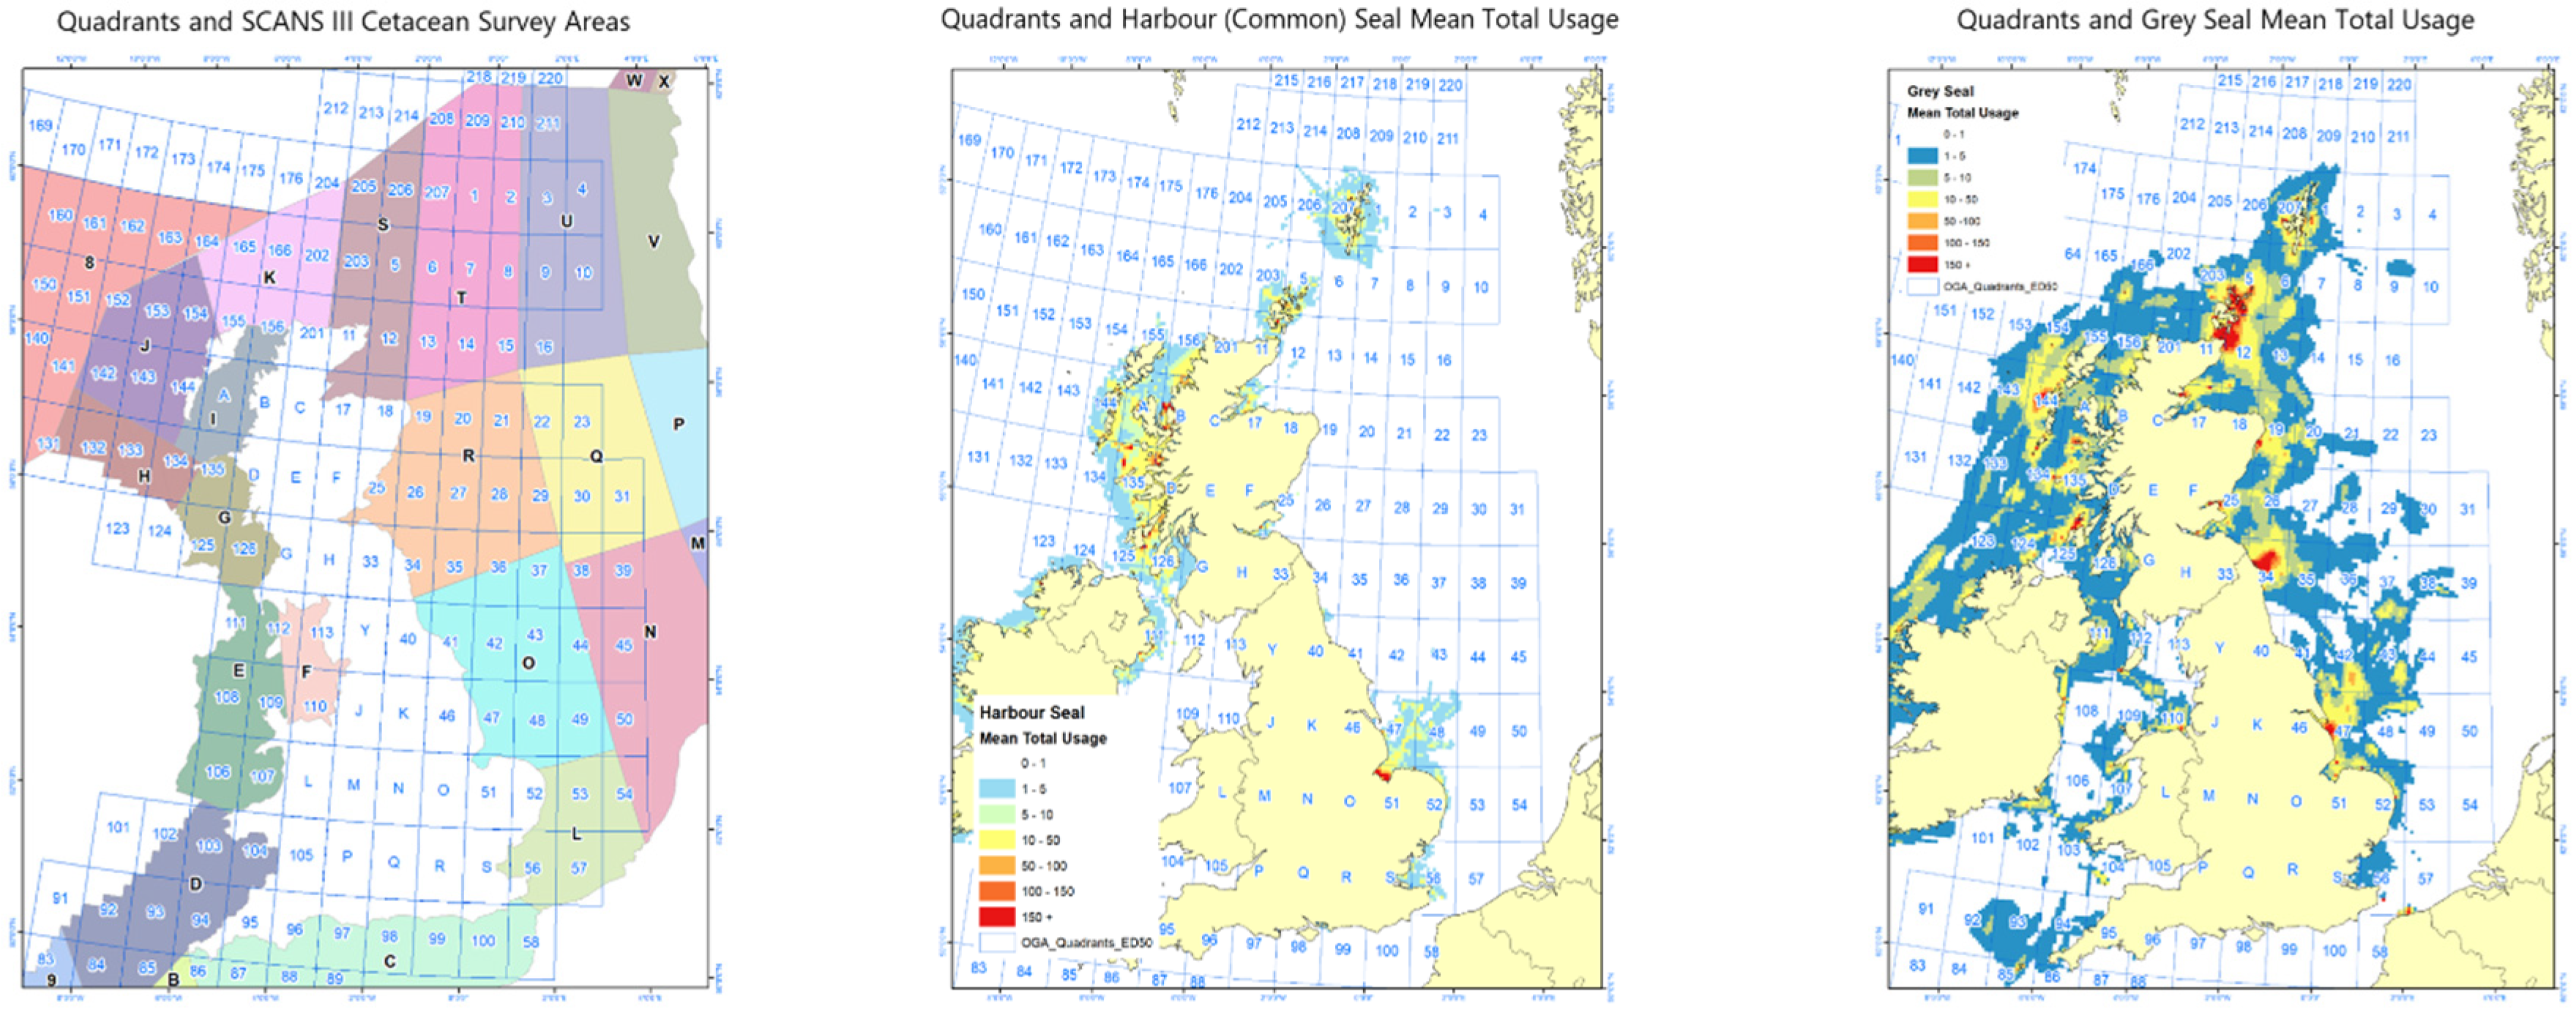
2.5. Marine Mammal Density Estimates
2.6. Sound Exposure Guidelines for Fish and Marine Mammals
2.6.1. Fish
2.6.2. Marine Mammals
2.7. Model Assumptions
2.7.1. Operational Assumptions
2.7.2. Oceanographical and Physical Assumptions
2.7.3. Biological Assumptions
2.8. Model Evaluation
2.8.1. Underwater Noise Data for Model Evaluation
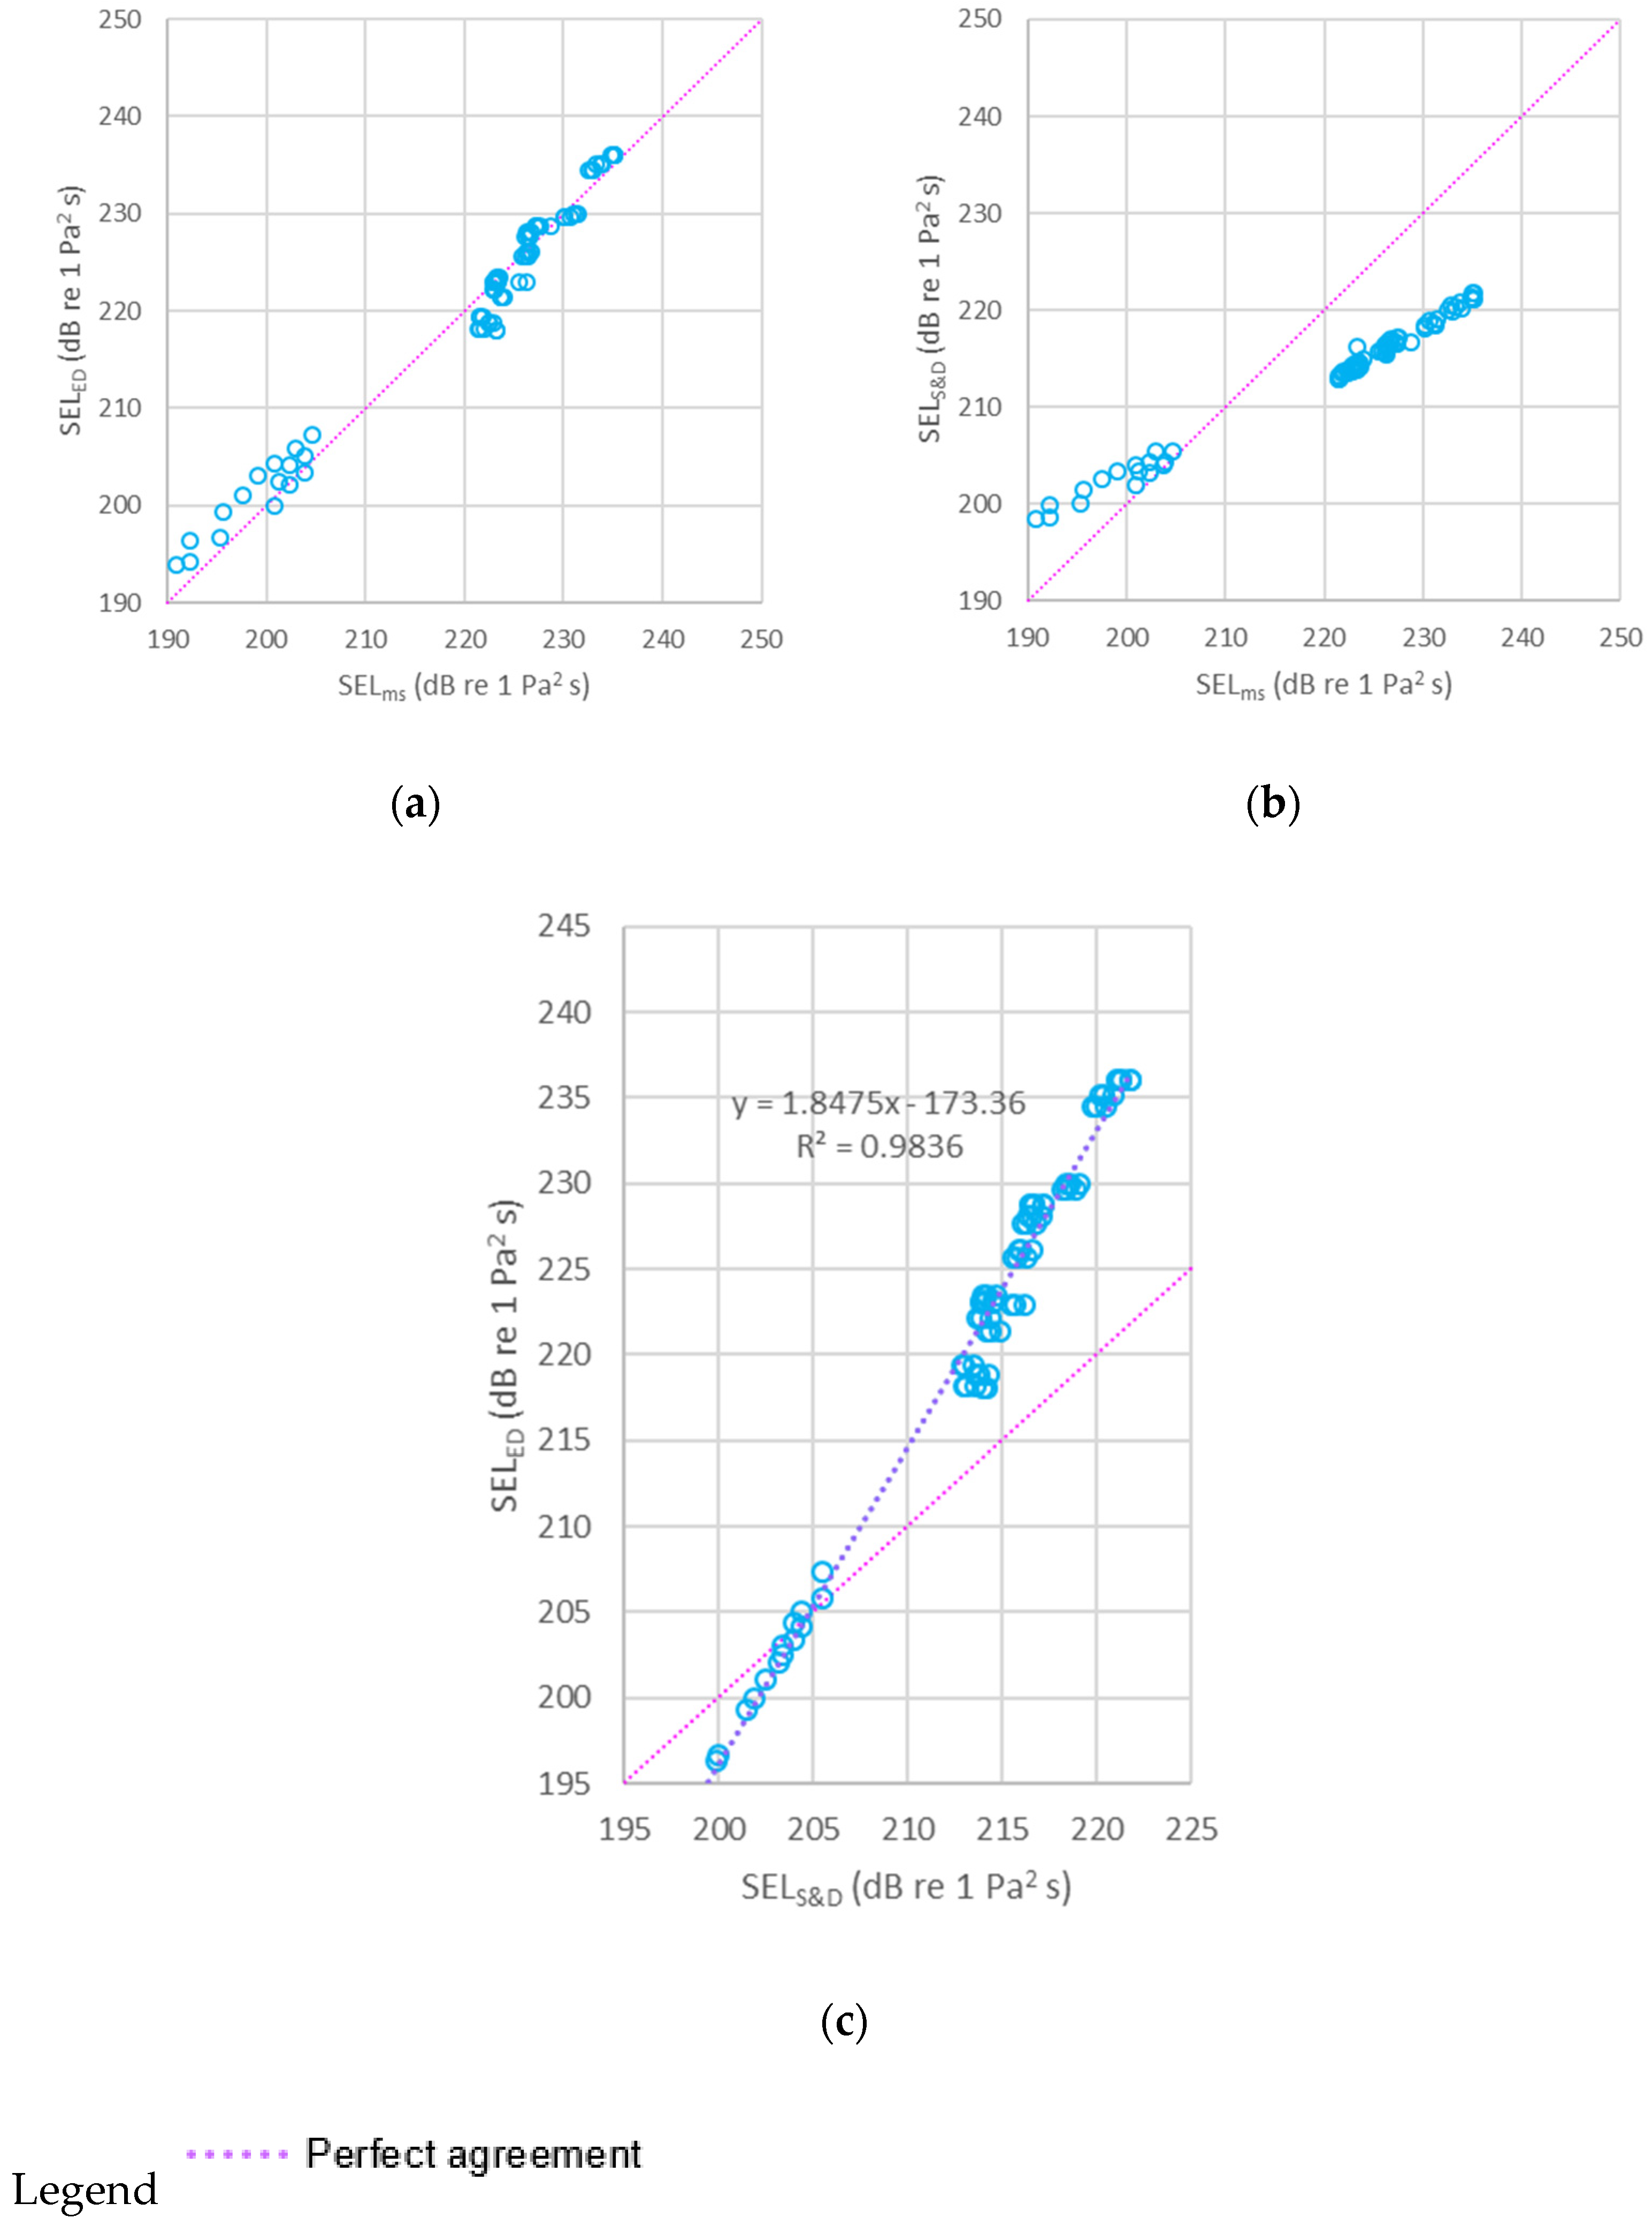
2.8.2. Underwater Noise Model Comparison
3. Results and Discussion
4. Conclusions
Funding
Data Availability Statement
Acknowledgments
Conflicts of Interest
Appendix A

| Project | Target | Charge Depth BML (ft) | Charge Weight (lb) | Outer Drive Pipe Diameter(in) | Wall Thickness (in) | Explosive Type |
|---|---|---|---|---|---|---|
| TAP-025: Potomac River zOW = 70′, zWH = 30′ [7] | Open water | 35 | 7 | NA | NA | TNT |
| Open water | 35 | 7 | NA | NA | C-4 | |
| Open water | 35 | 7 | NA | NA | NM | |
| Half-scale well casing (OW) | −12.5 | 7 | 15 | 5.5 | TNT | |
| Half-scale well casing (OW) | −12.5 | 7 | 15 | 5.5 | C-4 | |
| Half-scale well casing (OW) | −12.5 | 7 | 15 | 5.5 | NM | |
| Half-scale well casing (Mud) | 7.5 | 7 | 15 | 5.5 | TNT | |
| Half-scale well casing (Mud) | 7.5 | 7 | 15 | 5.5 | C-4 | |
| Half-scale well casing (Mud) | 7.5 | 7 | 15 | 5.5 | NM | |
| TAP-118: ExxonWest Delta Platform(WD30) z = 53′ [6] | Well Conductor #8 (WT) | 18 | 25 | 20 | ND | Comp. B |
| Well Conductor #14 (WT) | 18 | 25 | 20 | ND | Comp. B | |
| Well Conductor #12 | 20 | 50 | 20 | ND | Comp. B | |
| Well Conductor # 1 | 20 | 25 | 20 | ND | Comp. B | |
| Well Conductor #3 | 20 | 25 | 20 | ND | Comp. B | |
| Well Conductor #5 | 20 | 25 | 20 | ND | Comp. B | |
| North Jacket Leg/ main pile | 16 | 38 | 30 | 1 | Comp. B | |
| North Jacket Leg/ main pile | 16 | 38 | 30 | 1 | Comp. B | |
| North Jacket Leg/ main pile | 26 | 38 | 30 | 1 | Comp. B | |
| North Jacket Leg/ main pile | 16 | 38 | 30 | 1 | Comp. B | |
| North Jacket Leg/ main pile | 16 | 38 | 30 | 1 | Comp. B | |
| North Jacket Leg/ main pile | 8 | 38 | 30 | 1 | Comp. B | |
| South Jacket-6 leg/ main pile | 16 | 38 | 30 | 1 | Comp. B | |
| 2 North Skirt Piles (WT) | 26 | 38 | 30 | 1 | Comp. B | |
| 2 North Skirt Piles (WT) | 16 | 38 | 30 | 1 | Comp. B | |
| 2 South Skirt Piles (WT) | 16 | 38 | 30 | 1 | Comp. B | |
| 2 South Skirt Piles (WT) | 16 | 38 | 30 | 1 | Comp. B | |
| TAP 429: Huber z#97=15.1 m, z#120=11.4 m [24] | #97 Pile 1 | 15 | 50 | 30 | 1 | C-4 |
| #97 Pile 2 | 15 | 50 | 30 | 1 | C-4 | |
| #97 Pile 3 | 15 | 4.6 | 30 | 1 | RDX | |
| #120 Leg/ Pile 1 | 15 | 50 | 30 | 1 | C-4 | |
| #120 Leg/ Pile 2 | 15 | 50 | 30 | 1 | C-4 | |
| #120 Leg/ Pile 3 | 15 | 4.05 | 30 | 1 | RDX | |
| TAP 570: EC128 F-4 & EC32 Merit Platforms zF-4 = 14.6 m, zM = 11.8 m [1] | F-4 OW1 | −5 | 5 | NA | NA | Pentolite |
| F-4 OW2 | −5 | 5 | NA | NA | Pentolite | |
| F-4 Well Conductor F3 | 30 | 65 | 30 | 0.625 | Comp. B | |
| F-4 Pile A-1 | 15 | 50 | 30 | 0.625 | Comp. B | |
| F-4 Pile A-2 | 15 | 50 | 30 | 0.625 | Comp. B | |
| F-4 Pile A-3 | 20 | 50 | 30 | 0.625 | Comp. B | |
| F-4 Pile A-4 | 30 | 50 | 30 | 0.625 | Comp. B | |
| F-4 Pile A-5 | 20 | 50 | 30 | 0.625 | Comp. B | |
| F-4 Pile B-1 | 25 | 50 | 30 | 0.625 | Comp. B | |
| F-4 Pile B-2 | 25 | 50 | 30 | 0.625 | Comp. B | |
| F-4 Pile B-3 | 20 | 50 | 30 | 0.625 | Comp. B | |
| F-4 Pile B-4 | 30 | 50 | 30 | 0.625 | Comp. B | |
| F-4 Pile B-5 | 25 | 50 | 30 | 0.625 | Comp. B | |
| Merit Well Conductor 1 | 25 | 145 | 48 | 1.5 | Comp. B | |
| Merit Well Conductor 3 | 30 | 145 | 48 | 1.25 | Comp. B | |
| Merit Well Conductor 4 | 30 | 145 | 48 | 1.25 | Comp. B | |
| Merit Well Conductor 5 | 25 | 145 | 48 | 1.25 | Comp. B | |
| Merit Pile B-1 | 20 | 80 | 36 | 1 | Comp. B | |
| Merit Pile B-2 | 15 | 80 | 36 | 1 | Comp. B | |
| BOEM 2016-019: WD40A & WD40B Water depth: z = 92′ [17] | WD40A Well Conductor A-11 | 25 | 75 | 24 | 0.5 | Comp. B |
| WD40A Well Conductor A-4 | 25 | 100 | 24 | 0.5 | Comp. B | |
| WD40A Well Conductor A-9 | 25 | 100 | 24 | 0.5 | Comp. B | |
| WD40A Well Conductor A-2 | 25 | 100 | 24 | 0.5 | Comp. B | |
| WD40A Well Conductor A-7 | 25 | 100 | 24 | 0.5 | Comp. B | |
| WD40A Well Conductor A-8 | 15 | 75 | 24 | 0.5 | Comp. B | |
| WD40A Well Conductor A-1 | 15 | 100 | 28 | 0.5 | Comp. B | |
| WD40A Well Conductor A-3 | 15 | 75 | 24 | 0.5 | Comp. B | |
| WD40A Pile A-2 | 20 | 200 | 36 | 1.75 | Comp. B | |
| WD40A Pile A-1 | 20 | 200 | 36 | 1.75 | Comp. B | |
| WD40A Pile B-1 | 20 | 200 | 36 | 1.75 | Comp. B | |
| WD40A Pile C-1 | 20 | 200 | 36 | 1.75 | Comp. B | |
| WD40A Pile C-2 | 20 | 200 | 36 | 1.75 | Comp. B | |
| WD40A Pile B-2 | 20 | 200 | 36 | 1.75 | Comp. B | |
| WD40B Leg/ Pile A-1 | 20 | 200 | 36 | 2.25 | Comp. B | |
| WD40B Leg/ Pile B-1 | 20 | 200 | 36 | 2.25 | Comp. B | |
| WD40B Leg/ Pile C-1 | 20 | 200 | 36 | 2.25 | Comp. B | |
| WD40B Leg/ Pile C-2 | 20 | 200 | 36 | 2.25 | Comp. B | |
| WD40B Leg/ Pile B-2 | 20 | 200 | 36 | 2.25 | Comp. B |
References
- Proserv Offshore Gulf of Mexico Deep Water Decommissioning Study. In Review of the State of the Art for Removal of GOM US OCS Oil & Gas Facilities in Greater Than 400 Water Depth; Minerals Management Service, U.S. Department of the Interior: Washington, DC, USA, 2009; p. 350.
- Bureau of Safety and Environmental Enforcement. ICF Incorporated Decommissioning Methodology and Cost Evaluation; U.S. Department of the Interior Bureau of Safety and Environmental Enforcement: Sterling, VA, USA, 2015; p. 241.
- Dzwilewski, P.T.; Fenton, G. Shock Wave/Sound Propagation Modeling Results for Calculating Marine Protected Species Impact Zones During Explosive Removal of Offshore Structures; U.S. Department of the Interior, Minerals Management Service: New Orleans, LA, USA, 2003; p. 39.
- Goddard, R.P. The Sonar Simulation Toolset, Release 4.6: Science, Mathematics, and Algorithms; Defense Technical Information Center: Fort Belvoir, VA, USA, 2008.
- JNCC Guidelines for Minimising the Risk of Injury to Marine Mammals from Using Explosives; Joint Nature Conservation Committee: Aberdeen, UK, 2010.
- Chapman, N.R. Measurement of the Waveform Parameters of Shallow Explosive Charges. J. Acoust. Soc. Am. 1985, 78, 672–681. [Google Scholar] [CrossRef]
- Keevin, T.M.; Hempen, G.L. The Environmental Effects of Underwater Explosions with Methods to Mitigate Impacts; DTIC Document; US Army Corps of Engineers-St. Louis Field Office: Saint Louis, MO, USA, 1997.
- Southall, B.L.; Finneran, J.J.; Reichmuth, C.; Nachtigall, P.E.; Ketten, D.R.; Bowles, A.E.; Ellison, W.T.; Nowacek, D.P.; Tyack, P.L. Marine Mammal Noise Exposure Criteria: Updated Scientific Recommendations for Residual Hearing Effects. Aquat. Mamm. 2019, 45, 125–232. [Google Scholar] [CrossRef]
- Southall, B.L.; Bowles, A.E.; Ellison, W.T.; Finneran, J.J.; Gentry, R.L.; Greene, C.R.; Kastak, D.; Ketten, D.R.; Miller, J.H.; Nachtigall, P.E.; et al. Marine Mammal Noise Exposure Criteria: Initial Scientific Recommendations. Aquat. Mamm. 2007, 33, 411–414. [Google Scholar] [CrossRef]
- Richardson, W.J.; Greene, C.R., Jr.; Malme, C.I.; Thomson, D.H. Marine Mammals and Noise: A Sound Approach to Research and Management; Gulf Professional Publishing: Oxford, UK, 1995; ISBN 978-0-12-588441-9. [Google Scholar]
- Spiga, I.; Cheesman, S.; Hawkins, A.; Perez-Dominguez, R.; Roberts, L.; Hughes, D.; Elliott, M.; Nedwell, J.; Bentley, M. Understanding the Scale and Impacts of Anthropogenic Noise upon Fish and Invertebrates in the Marine Environment; SoundWaves Consortium Technical Review (ME 5205); Defra SoundWaves Technical Report, UK; 2012; Available online: https://research.ncl.ac.uk/soundwaves/links/pubblications/REVIEW%20new.pdf (accessed on 27 September 2021).
- Popper, A.N.; Hawkins, A.D. An Overview of Fish Bioacoustics and the Impacts of Anthropogenic Sounds on Fishes. J. Fish Biol. 2019. [Google Scholar] [CrossRef] [PubMed] [Green Version]
- Popper, A.N.; Hawkins, A.D.; Fay, R.R.; Mann, D.A.; Bartol, S.; Carlson, T.J.; Coombs, S.; Ellison, W.T.; Gentry, R.L.; Halvorsen, M.B.; et al. ASA S3/SC1.4 TR-2014 Sound Exposure Guidelines for Fishes and Sea Turtles: A Technical Report Prepared by ANSI-Accredited Standards Committee S3/SC1 and Registered with ANSI; Springer Briefs in Oceanography; ASA Press: Berlin/Heidelberg, Germany, 2014; Available online: https://0-link-springer-com.brum.beds.ac.uk/book/10.1007/978-3-319-06659-2 (accessed on 1 June 2021)ISBN 978-3-319-06658-5.
- Edmonds, N.J.; Firmin, C.J.; Goldsmith, D.; Faulkner, R.C.; Wood, D.T. A Review of Crustacean Sensitivity to High Amplitude Underwater Noise: Data Needs for Effective Risk Assessment in Relation to UK Commercial Species. Mar. Pollut. Bull. 2016, 108, 5–11. [Google Scholar] [CrossRef] [PubMed]
- Hawkins, A.D.; Popper, A.N. A Sound Approach to Assessing the Impact of Underwater Noise on Marine Fishes and Invertebrates. ICES J. Mar. Sci. 2017, 74, 635–651. [Google Scholar] [CrossRef]
- Morley, E.L.; Jones, G.; Radford, A.N. The Importance of Invertebrates When Considering the Impacts of Anthropogenic Noise. Proc. R. Soc. B Biol. Sci. 2014, 281, 20132683. [Google Scholar] [CrossRef] [Green Version]
- Roberts, L.; Laidre, M.E. Finding a Home in the Noise: Cross-Modal Impact of Anthropogenic Vibration on Animal Search Behaviour. Biology Open 2019, 8, bio041988. [Google Scholar] [CrossRef] [Green Version]
- Fitzgibbon, Q.P.; Day, R.D.; McCauley, R.D.; Simon, C.J.; Semmens, J.M. The Impact of Seismic Air Gun Exposure on the Haemolymph Physiology and Nutritional Condition of Spiny Lobster, Jasus Edwardsii. Mar. Pollut. Bull. 2017, 125, 146–156. [Google Scholar] [CrossRef]
- McCauley, R.D.; Day, R.D.; Swadling, K.M.; Fitzgibbon, Q.P.; Watson, R.A.; Semmens, J.M. Widely Used Marine Seismic Survey Air Gun Operations Negatively Impact Zooplankton. Nat. Ecol. Evol. 2017, 1, 0195. [Google Scholar] [CrossRef]
- Roberts, L.; Elliott, M. Good or Bad Vibrations? Impacts of Anthropogenic Vibration on the Marine Epibenthos. Sci. Total Environ. 2017, 595, 255–268. [Google Scholar] [CrossRef] [PubMed]
- Roberts, L.; Cheesman, S.; Elliott, M.; Breithaupt, T. Sensitivity of Pagurus Bernhardus (L.) to Substrate-Borne Vibration and Anthropogenic Noise. J. Exp. Mar. Biol. Ecol. 2016, 474, 185–194. [Google Scholar] [CrossRef]
- Roberts, L.; Cheesman, S.; Hawkins, A.D. Effects of Sound on the Behavior of Wild, Unrestrained Fish Schools. In Proceedings of The Effects of Noise on Aquatic Life II; Popper, A.N., Hawkins, A., Eds.; Springer: New York, NY, USA, 2016; pp. 917–924. [Google Scholar]
- National Research Council. Ocean Noise and Marine Mammals; The National Academies Press: Washington, DC, USA, 2003. [CrossRef]
- Fewtrell, J.L.; McCauley, R.D. Impact of Air Gun Noise on the Behaviour of Marine Fish and Squid. Mar. Pollut. Bull. 2012, 64, 984–993. [Google Scholar] [CrossRef] [PubMed]
- McCauley, R.D.; Fewtrell, J.; Popper, A.N. High Intensity Anthropogenic Sound Damages Fish Ears. J. Acoust. Soc. Am. 2003, 113, 638–642. [Google Scholar] [CrossRef] [PubMed] [Green Version]
- Yelverton, J.T. The Relationship between Fish Size and Their Response to Underwater Blast; Lovelace Foundation for Medical Education and Research: Albuquerque, NM, USA, 1975; p. 42. [Google Scholar]
- Goertner, J.F.; Wiley, M.L.; Young, G.A.; McDonald, W.W. Effects of Underwater Explosions on Fish without Swimbladders; Defense Technical Information Center: Fort Belvoir, VA, USA, 1994. [Google Scholar]
- Halvorsen, M.B.; Casper, B.M.; Matthews, F.; Carlson, T.J.; Popper, A.N. Effects of Exposure to Pile-Driving Sounds on the Lake Sturgeon, Nile Tilapia and Hogchoker. Proc. R. Soc. B Biol. Sci. 2012, 279, 4705–4714. [Google Scholar] [CrossRef]
- Stephenson, J.R.; Gingerich, A.J.; Brown, R.S.; Pflugrath, B.D.; Deng, Z.; Carlson, T.J.; Langeslay, M.J.; Ahmann, M.L.; Johnson, R.L.; Seaburg, A.G. Assessing Barotrauma in Neutrally and Negatively Buoyant Juvenile Salmonids Exposed to Simulated Hydro-Turbine Passage Using a Mobile Aquatic Barotrauma Laboratory. Fish. Res. 2010, 106, 271–278. [Google Scholar] [CrossRef]
- Goertner, J.F. Dynamical Model for Explosion Injury to Fish; Naval Surface Weapons Center, White Oak Laboratory: Silver Spring, MA, USA, 1978. [Google Scholar]
- Wright, D.G. A Discussion Paper on the Effects of Explosives on Fish and Marine Mammals in the Waters of the Northwest Territories; Fisheries and Oceans Canada: Winnipeg, MB, Canada, 1981.
- Wright, D.G.; Hopky, G.E. Guidelines for the Use of Explosives in or near Canadian Fisheries Waters; Fisheries and Oceans Canada: Ottawa, ON, Canada, 1998.
- Rogers, P.H.; Zeddies, D.G. Multipole Mechanisms for Directional Hearing in Fish. In Fish Bioacoustics: With 81 Illustrations; Webb, J.F., Fay, R.R., Popper, A.N., Eds.; Springer: New York, NY, USA, 2008; pp. 233–252. ISBN 978-0-387-73029-5. [Google Scholar]
- Schwaab, E.C. Silver Strand Training Complex. Environmental Impact Statement; US Department of the Navy: Monterey, CA, USA, 2011; p. 879.
- Dahl, P.H.; Keith Jenkins, A.; Casper, B.; Kotecki, S.E.; Bowman, V.; Boerger, C.; Dall’Osto, D.R.; Babina, M.A.; Popper, A.N. Physical Effects of Sound Exposure from Underwater Explosions on Pacific Sardines (Sardinops Sagax). J. Acoust. Soc. Am. 2020, 147, 2383–2395. [Google Scholar] [CrossRef]
- Continental Shelf Associates, Inc. Explosive Removal of Offshore Structures Information Synthesis Report; MMS 2003-070; U.S. Department of the Interior, Minerals Management Service: New Orleans, LA, USA, 2004; p. 181.
- Dos Santos, M.E.; Couchinho, M.N.; Rita Luís, A.; Gonçalves, E.J. Monitoring Underwater Explosions in the Habitat of Resident Bottlenose Dolphins. J. Acoust. Soc. Am. 2010, 128, 3805–3808. [Google Scholar] [CrossRef] [Green Version]
- Popper, A.N.; Hawkins, A.D. The Importance of Particle Motion to Fishes and Invertebrates. J. Acoust. Soc. Am. 2018, 143, 470–488. [Google Scholar] [CrossRef] [Green Version]
- Finneran, J.J.; Schlundt, C.E.; Carder, D.A.; Clark, J.A.; Young, J.A.; Gaspin, J.B.; Ridgway, S.H. Auditory and Behavioral Responses of Bottlenose Dolphins (Tursiops Truncatus) and a Beluga Whale (Delphinapterus Leucas) to Impulsive Sounds Resembling Distant Signatures of Underwater Explosions. J. Acoust. Soc. Am. 2000, 108, 417–431. [Google Scholar] [CrossRef] [Green Version]
- Yelverton, J.T.; Richmond, D.R.; Fletcher, E.R.; Jones, R.K. Safe Distances from Underwater Explosions for Mammals and Birds; Defense Technical Information Center: Fort Belvoir, VA, USA, 1973.
- Ketten, D. Sensory Systems of Aquatic Mammals; De Spil Publishers: Woerden, The Netherlands, 1995; pp. 391–408. ISBN 978-90-72743-05-3. [Google Scholar]
- National Marine Fisheries Service 2018 Revisions to: Technical Guidance for Assessing the Effects of Anthropogenic Sound on Marine Mammal Hearing (Version 2.0): Underwater Thresholds for Onset of Permanent and Temporary Threshold Shifts; United States Department of Commerce: Washington, DC, USA, 2018; p. 167.
- Sea Mammal Research Unit (SMRU); Marine Scotland. Estimated At-Sea Distribution of Grey and Harbour Seals-Updated Maps 2017; Marine Scotland Data: Edinburgh, UK, 2017. [CrossRef]
- Brand, A.M. Explosives Use in Decommissioning–Guide for Assessment of Risk (EDGAR): I Determination of Sound Pressure Levels for Open Water Blasts and Severance of Conductors and Piles from below the Seabed. Modelling 2021. submitted. [Google Scholar]
- Hastie, G.; Merchant, N.D.; Götz, T.; Russell, D.J.F.; Thompson, P.; Janik, V.M. Effects of Impulsive Noise on Marine Mammals: Investigating Range-Dependent Risk. Ecol. Appl. 2019, 29, e01906. [Google Scholar] [CrossRef] [Green Version]
- Robinson, S.P.; Lepper, P.A.; Hazlewood, R.A. Good Practice Guide for Underwater Noise Measurement; Good Practice Guide No. 133; National Measurement Office: Teddington, UK; Marine Scotland: Edinburgh, Scotland; The Crown Estate: London, UK, 2014; p. 97. ISSN 1368-6550. [Google Scholar]
- Madsen, P.T. Marine Mammals and Noise: Problems with Root Mean Square Sound Pressure Levels for Transients. J. Acoust. Soc. Am. 2005, 117, 3952–3957. [Google Scholar] [CrossRef]
- Sertlek, H.O.; Slabbekoorn, H.; Ten Cate, C.J.; Ainslie, M.A. Insights into the Calculation of Metrics for Transient Sounds in Shallow Water. Proc. Meet. Acoust. 2012, 17, 070076. [Google Scholar] [CrossRef] [Green Version]
- Blackstock, S.A.; Fayton, J.O.; Hulton, P.H.; Moll, T.E.; Jenkins, K.; Kotecki, S.; Henderson, E.; Bowman, V.; Rider, S.; Martin, C. Quantifying Acoustic Impacts on Marine Mammals and Sea Turtles: Methods and Analytical Approach for Phase III Training and Testing; Naval Undersea Warfare Center Division: Newport, RI, USA, 2018. [Google Scholar]
- Barkaszi, M.J.; Frankel, A.; Martin, J.S.; Poe, W. Pressure Wave and Acoustic Properties Generated by the Explosive Removal of Offshore Structures in the Gulf of Mexico; U.S. Department of the Interior, Bureau of Ocean Energy Management, Gulf of Mexico OCS Region: New Orleans, LA, USA, 2016; p. 69.
- Poe, W.T.; Adams, C.F.; Janda, R.; Kirklewski, D. Effect of Depth Below Mudline of Charge Placement During Explosive Removal of Offshore Structures (EROS). Minerals Management Service, U.S. Department of the Interior: Washington, DC, USA, 2009; p. 71. [Google Scholar]
- Connor, J.G. Underwater Blast Effects from Explosive Severance of Offshore Platform Legs and Well Conductors; Naval Surface Warfare Center: Silver Springs, MA, USA, 1990; p. 135. [Google Scholar]
- Heathcote, T.B. An Experimental Program to Determine the Environmental Impact of Explosive Removal of Oil Wellheads; Naval Surface Weapons Center: Silver Springs, MA, USA, 2021; p. 27. [Google Scholar]
- Swisdak, M.M. Explosion Effects and Properties. Part II. Explosion Effects in Water; Defense Technical Information Center: Fort Belvoir, VA, USA, 1978.
- Erbe, C.; Ainslie, M.A.; de Jong, C.A.F.; Racca, R.; Stocker, M. Summary Report Panel 1: The Need for Protocols and Standards in Research on Underwater Noise Impacts on Marine Life. In The Effects of Noise on Aquatic Life II; Popper, A.N., Hawkins, A., Eds.; Springer: New York, NY, USA, 2016; Volume 875, pp. 1265–1271. ISBN 978-1-4939-2980-1. [Google Scholar]
- Finneran, J.J.; Mulsow, J.; Schlundt, C.E. Using Reaction Time and Equal Latency Contours to Derive Auditory Weighting Functions in Sea Lions and Dolphins. In The Effects of Noise on Aquatic Life II; Popper, A.N., Hawkins, A., Eds.; Springer: New York, NY, USA, 2016; Volume 875, pp. 281–287. ISBN 978-1-4939-2980-1. [Google Scholar]
- OGA Oil and Gas Authority Open Data. OGA Quadrants ETRS89. Available online: https://data-ogauthority.opendata.arcgis.com/datasets/OGAUTHORITY::oga-quadrants-etrs89/about (accessed on 27 September 2021).
- Thomas, L.; Buckland, S.T.; Rexstad, E.A.; Laake, J.L.; Strindberg, S.; Hedley, S.L.; Bishop, J.R.B.; Marques, T.A.; Burnham, K.P. Distance Software: Design and Analysis of Distance Sampling Surveys for Estimating Population. Size. J. Appl. Ecol. 2010, 47, 5–14. [Google Scholar] [CrossRef] [Green Version]
- Hammond, P.; Lacey, C.; Gilles, A.; Viquerat, S.; Börjesson, P.; Herr, H.; Macleod, K.; Ridoux, V.; Santos, M.; Teilmann, J.; et al. Estimates of Cetacean Abundance in European Atlantic Waters in Summer 2016 from the SCANS-III Aerial and Shipboard Surveys; Sea Mammal Research Unit, University of St Andrews, UK 2017, 40. Available online: https://synergy.st-andrews.ac.uk/scans3/files/2017/04/SCANS-III-design-based-estimates-2017-04-28-final.pdf (accessed on 27 September 2021).
- Hawkins, A.D.; Johnson, C.; Popper, A.N. How to Set Sound Exposure Criteria for Fishes. J. Acoust. Soc. Am. 2020, 147, 1762–1777. [Google Scholar] [CrossRef] [Green Version]
- Popper, A.N.; Hawkins, A.D.; Thomsen, F. Taking the Animals’ Perspective Regarding Anthropogenic Underwater Sound. Trends Ecol. Evol. 2020, 35. [Google Scholar] [CrossRef]
- von Benda-Beckmann, A.M.; Aarts, G.; Sertlek, H.Ö.; Lucke, K.; Verboom, W.C.; Kastelein, R.A.; Ketten, D.R.; van Bemmelen, R.; Lam, F.-P.A.; Kirkwood, R.J.; et al. Assessing the Impact of Underwater Clearance of Unexploded Ordnance on Harbour Porpoises (Phocoena Phocoena) in the Southern North Sea. Aquat. Mamm. 2015, 41, 503–523. [Google Scholar] [CrossRef] [Green Version]
- Popper, A.N.; Hastings, M.C. The Effects of Anthropogenic Sources of Sound on Fishes. J. Fish Biol. 2009, 75, 455–489. [Google Scholar] [CrossRef] [PubMed]
- Matthews, M.N.R.; Zykov, M.; Deveau, T. Assessment of Underwater Noise for the Mary River Iron Mine: Construction and Operation of the Steensby Inlet Port Facility; LGL Ltd: King City, ON, Canada, 2010. [Google Scholar]
- Gedamke, J.; Gales, N.; Frydman, S. Assessing Risk of Baleen Whale Hearing Loss from Seismic Surveys: The Effect of Uncertainty and Individual Variation. J. Acoust. Soc. Am. 2011, 129, 496–506. [Google Scholar] [CrossRef] [PubMed]
- Soloway, A.G.; Dahl, P.H. Peak Sound Pressure and Sound Exposure Level from Underwater Explosions in Shallow Water. J. Acoust. Soc. Am. 2014, 136, EL218–EL223. [Google Scholar] [CrossRef] [PubMed] [Green Version]
- Cole, R.H. Underwater Explosions; Princeton University Press: Princeton, NJ, USA, 1948. [Google Scholar]
- Dekeling, R.P.A.; Tasker, M.L.; Van Der Graaf, A.J.; Ainslie, M.A.; Andersson, M.H.; André, M.; Borsani, J.F.; Brensing, K.; Castellote, M.; Cronin, D.; et al. Monitoring Guidance for Underwater Noise in European Seas-Part I: Executive Summary; Publications Office of the European Union: Luxembourg, 2014. [Google Scholar]


| Functional Hearing Group | Estimated Auditory Bandwidth | Species |
|---|---|---|
| Low-frequency cetaceans | 7 Hz–25 kHz | Minke whale (Balaenoptera acutorostrata) Long-finned pilot whale (Globicephala melas) Fin whale (Balaenoptera physalus) Sperm whale (Physeter macrocephalus) Cuvier’s beaked whale (Ziphius cavirostris), Gervais’ beaked whale (Mesoplodon europaeus), Sowerby’s beaked whale (Mesoplodon bidens), Northern Bottlenose whale (Hyperoodon ampullatus) |
| Mid-frequency cetaceans | 150 Hz–160 kHz | White-beaked dolphin (Lagenorhynchus albirostris) Atlantic white-sided dolphin (Lagenorhynchus acutus) Bottlenose dolphin (Tursiops truncates) Common dolphin (Delphinus delphis) Risso’s dolphin (Grampus griseus) Striped dolphin (Stenella coeruleoalba) |
| High-frequency cetaceans | 200 Hz–180 kHz | Harbour porpoise (Phocoena phocoena) |
| Pinnipeds in water | 75 Hz–100 kHz | Grey seal (Halichoerus grypus) Common seal (Phoca vitulina) |
| Noise Type | Acoustic Characteristics | Decommissioning Activities |
|---|---|---|
| Single pulse | Brief, broadband, atonal, transient, single discrete noise event; characterised by rapid rise to peak pressure (>3 dB difference between received level using impulsive vs. equivalent continuous time constant) | Single explosion: explosive cutting, one charge per well with a >24 h interval between explosions |
| Multiple pulse | Multiple discrete acoustic events within 24 h; (>3 dB difference between received level using impulsive vs. equivalent continuous time constant) | Serial explosions: explosive cutting, one charge per well with a <24 h interval between explosions |
| Non-pulse | Intermittent or continuous, single or multiple discrete acoustic events within 24 h; tonal or atonal and without rapid rise to peak pressure | Vessel activity, rock-placement, well Plug and Abandonment, underwater cutting by water jet, diamond wire or abrasive cutting |
| Auditory Weighting Function Parameters | Low-Frequency Cetaceans | Mid-Frequency Cetaceans | High-Frequency Cetaceans | Phocid Pinnipeds |
|---|---|---|---|---|
| a | 1 | 1.6 | 1.8 | 1 |
| b | 2 | 2 | 2 | 2 |
| f1 (kHz) | 0.2 | 8.8 | 12 | 1.9 |
| f2 (kHz) | 19 | 110 | 140 | 30 |
| C (dB) | 0.13 | 1.2 | 1.36 | 0.75 |
| Adjustment (dB) * | −0.06 | −29.11 | −37.55 | −5.90 |
| Type of Animal | Mortality and Potential Mortal Injury | Recoverable Injury | TTS |
|---|---|---|---|
| Category 1 Fish: no swim bladder (particle motion detection) | >219 dB SELcum or >213 dB SPLpk | >216 dB SELcum or >213 dB SPLpk | >>186 dB SELcum |
| Category 2 Fish: swim bladder is not involved in hearing (particle motion detection) | 210 dB SELcum or >207 dB SPLpk | 203 dB SELcum or >207 dB SPLpk | >>186 dB SELcum |
| Category 3 Fish: swim bladder is involved in hearing (primarily pressure detection) | 207 dB SELcum or >207 dB SPLpk | 203 dB SELcum or >207 dB SPLpk | 186 dB SELcum |
| Eggs and larvae | >210 dB SELcum or >207 dB SPLpk |
| Group | Behaviour SELweighted (dB re 1 μPa2 s) | TTS-Onset: SELweighted (dB re 1 μPa2 s) | TTS-Onset: SPLpk (dB re 1 μPa) | PTS-Onset: SELweighted (dB re 1 μPa2 s) | PTS-Onset: SPLpk (dB re 1 μPa) |
|---|---|---|---|---|---|
| Low-Frequency Cetaceans | 163 | 168 | 213 | 183 | 219 |
| Mid-Frequency Cetaceans | 165 | 170 | 224 | 185 | 230 |
| High-Frequency Cetaceans | 135 | 140 | 196 | 155 | 202 |
| Phocid Pinnipeds | 165 | 170 | 212 | 185 | 218 |
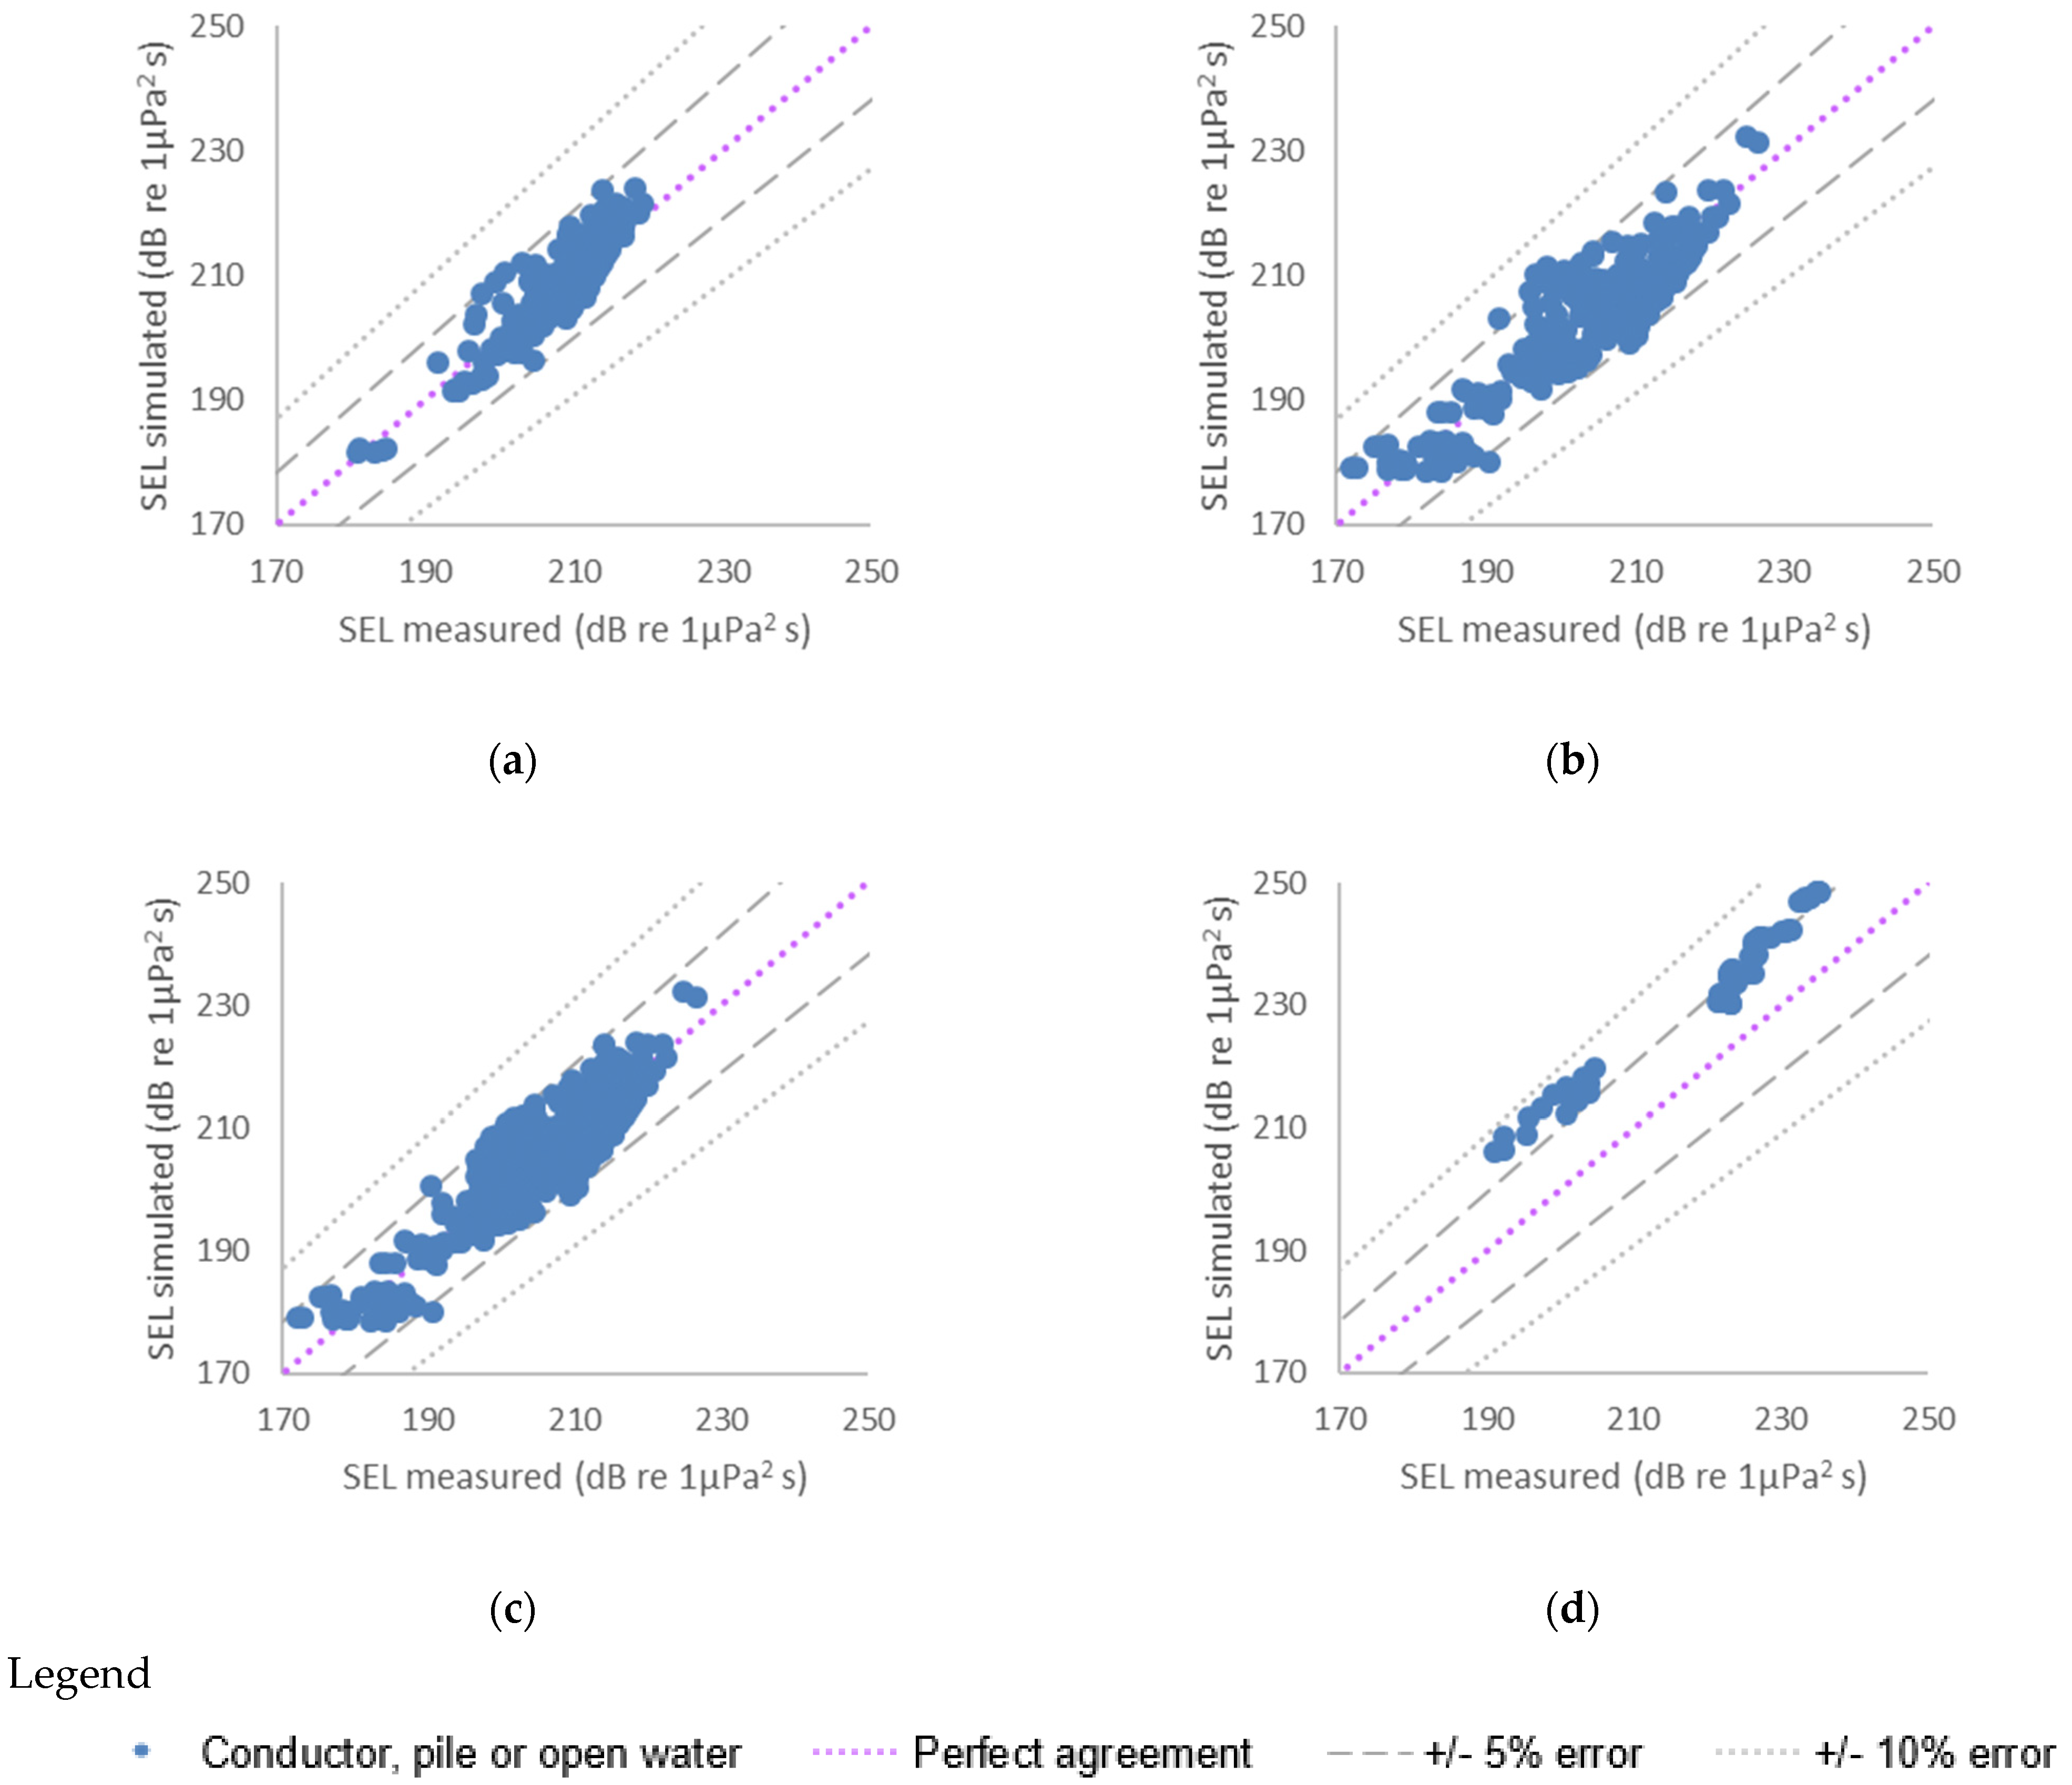
| Severance Type | r | Adj R2 | Lower Bound (=MAE) (dB re 1 µPa2 s) | RMSE (dB re 1 µPa2 s) | Upper Bound (= MAE) (dB re 1 µPa2 s) | RMSE (%) | Nash-Sutcliffe Efficiency Index, Ef | NRMSE | Bias (dB re 1 µPa2 s) | Relative Bias (%) | n |
|---|---|---|---|---|---|---|---|---|---|---|---|
| Conductor (BML) | 0.88 | 0.76 | 3.14 | 3.94 | 42.92 | 1.91 | 0.68 | 0.56 | 0.64 | 0.31 | 187 |
| Conductor & Pile | 0.91 | 0.83 | 3.60 | 4.41 | 78.69 | 2.17 | 0.82 | 0.42 | −0.15 | −0.07 | 478 |
| Pile | 0.90 | 0.81 | 1.41 | 5.30 | 24.52 | 2.64 | 0.81 | 0.43 | −0.11 | −0.05 | 303 |
| Open water | 0.99 | 0.97 | 12.31 | 12.48 | 110.76 | 5.64 | −0.10 | 1.05 | 12.31 | 5.56 | 81 |
| Open Water (adj) | 0.99 | 0.97 | 1.66 | 2.10 | 14.95 | 0.95 | 0.97 | 0.18 | 0.31 | 0.14 | 81 |
Publisher’s Note: MDPI stays neutral with regard to jurisdictional claims in published maps and institutional affiliations. |
© 2021 by the author. Licensee MDPI, Basel, Switzerland. This article is an open access article distributed under the terms and conditions of the Creative Commons Attribution (CC BY) license (https://creativecommons.org/licenses/by/4.0/).
Share and Cite
Brand, A.M. Explosives Use in Decommissioning—Guide for Assessment of Risk (EDGAR): II Determination of Sound Exposure Levels for Open Water Blasts and Severance of Conductors and Piles from below the Seabed. Modelling 2021, 2, 534-554. https://0-doi-org.brum.beds.ac.uk/10.3390/modelling2040028
Brand AM. Explosives Use in Decommissioning—Guide for Assessment of Risk (EDGAR): II Determination of Sound Exposure Levels for Open Water Blasts and Severance of Conductors and Piles from below the Seabed. Modelling. 2021; 2(4):534-554. https://0-doi-org.brum.beds.ac.uk/10.3390/modelling2040028
Chicago/Turabian StyleBrand, Alison M. 2021. "Explosives Use in Decommissioning—Guide for Assessment of Risk (EDGAR): II Determination of Sound Exposure Levels for Open Water Blasts and Severance of Conductors and Piles from below the Seabed" Modelling 2, no. 4: 534-554. https://0-doi-org.brum.beds.ac.uk/10.3390/modelling2040028